Embed Size (px)
Citation preview
Supplementary Online Content
The genetic architecture of age-related cognitive decline in African Americans
Authors: Towfique Raj, PhD1-5,15, Lori B. Chibnik, PhD1,3-5,Cristin McCabe, BA5, Andus Wong, PhD2, Joseph M. Replogle, BA1,5, Lei Yu PhD13, Sujuan Gao,
PhD14, Frederick W Unverzagt, PhD9 , Barbara Stranger, PhD6,7, Jill Murrell, PhD10, Lisa Barnes, PhD12,13, Hugh C. Hendrie, MB, ChB, DSc8,9, Tatiana Foroud,
PhD10, Anna Krichevsky, PhD2, David A. Bennett, MD12,13, Kathleen S. Hall, PhD9*, Denis A. Evans, MD11*, and Philip L. De Jager, MD, PhD1-5*
1
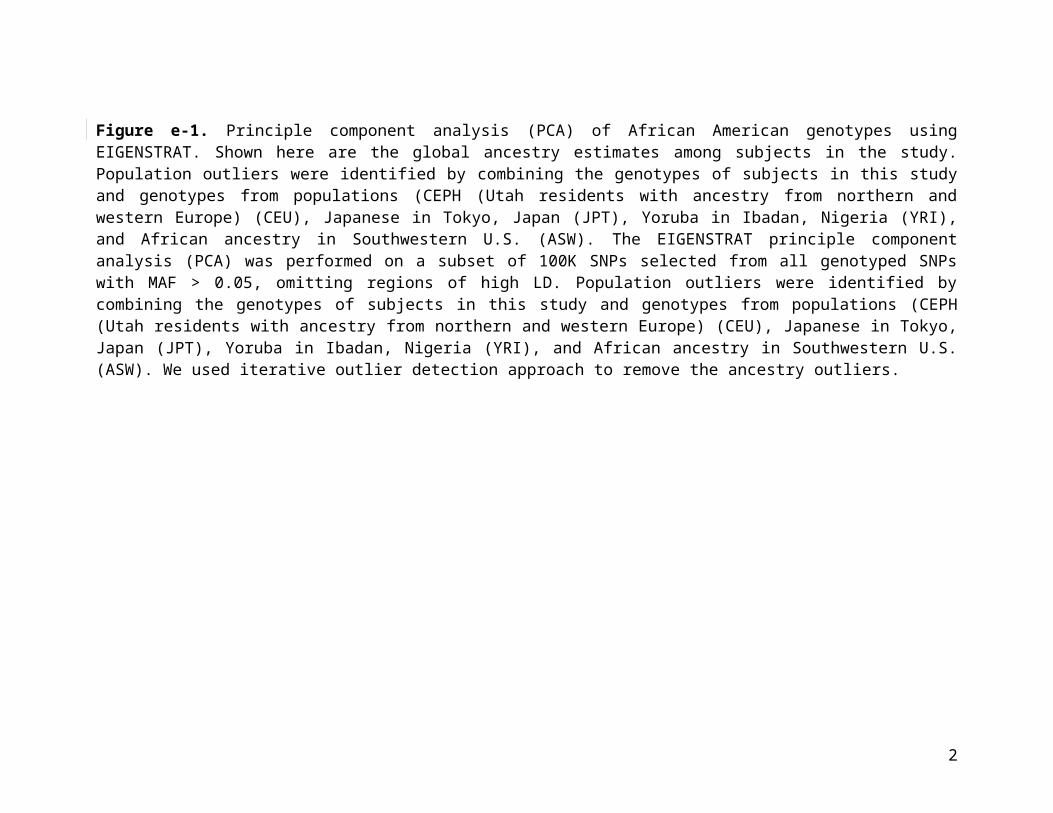
Figure e-1. Principle component analysis (PCA) of African American genotypes using EIGENSTRAT. Shown here are the global ancestry estimates among subjects in the study. Population outliers were identified by combining the genotypes of subjects in this study and genotypes from populations (CEPH (Utah residents with ancestry from northern and western Europe) (CEU), Japanese in Tokyo, Japan (JPT), Yoruba in Ibadan, Nigeria (YRI), and African ancestry in Southwestern U.S. (ASW). The EIGENSTRAT principle component analysis (PCA) was performed on a subset of 100K SNPs selected from all genotyped SNPs with MAF > 0.05, omitting regions of high LD. Population outliers were identified by combining the genotypes of subjects in this study and genotypes from populations (CEPH (Utah residents with ancestry from northern and western Europe) (CEU), Japanese in Tokyo, Japan (JPT), Yoruba in Ibadan, Nigeria (YRI), and African ancestry in Southwestern U.S. (ASW). We used iterative outlier detection approach to remove the ancestry outliers.
2
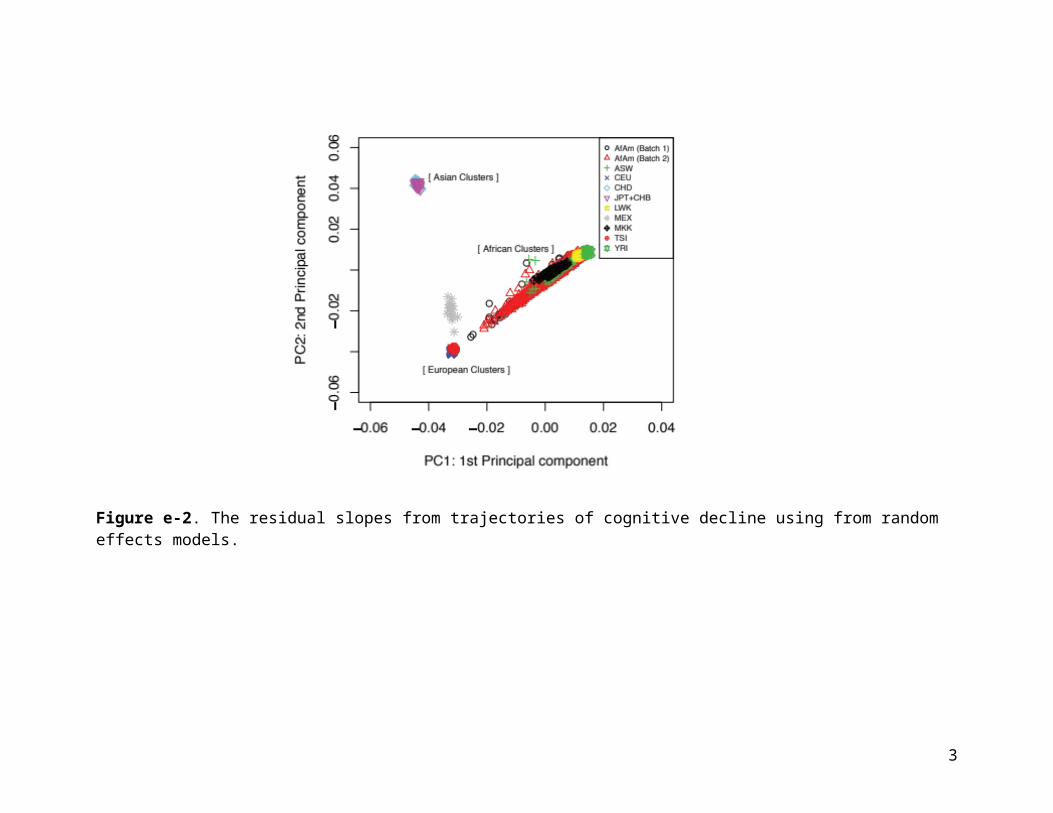
Figure e-2. The residual slopes from trajectories of cognitive decline using from random effects models.
3
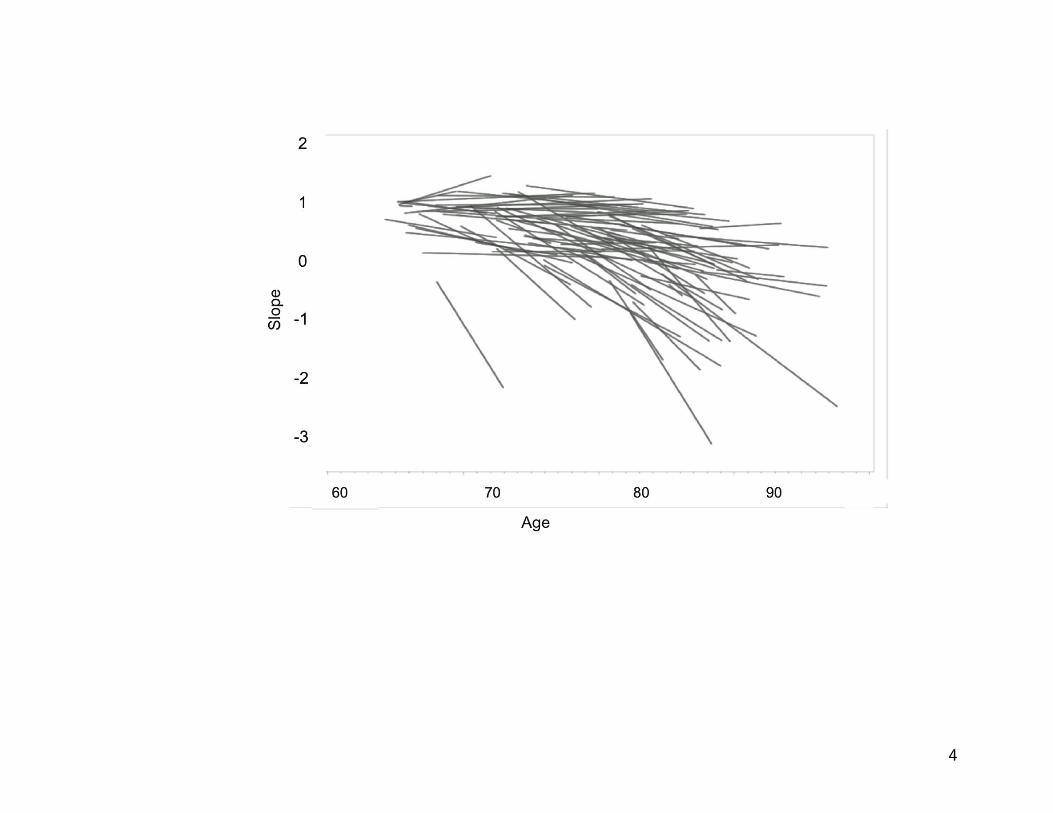
Figure e-3: Average proportion of European ancestry in 3,964 African Americans. The estimated average percentage of European ancestry in the AA subjects used in this analysis was 21.2 ± 12.3%.
4
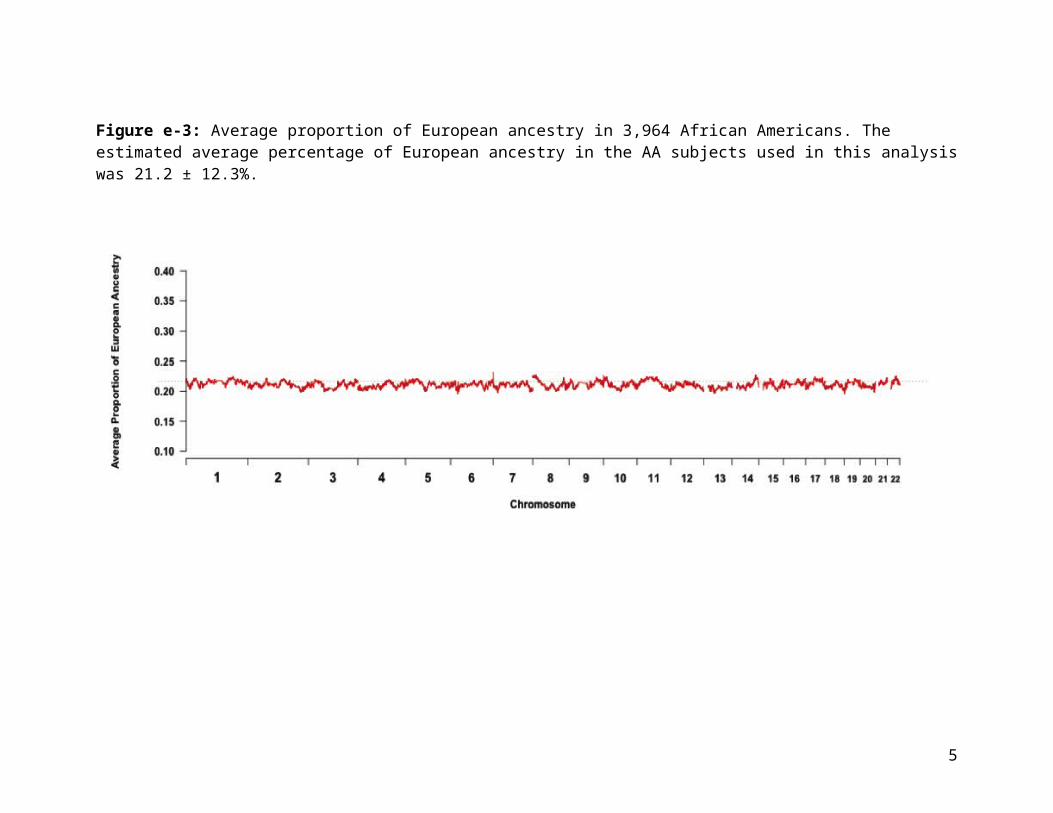
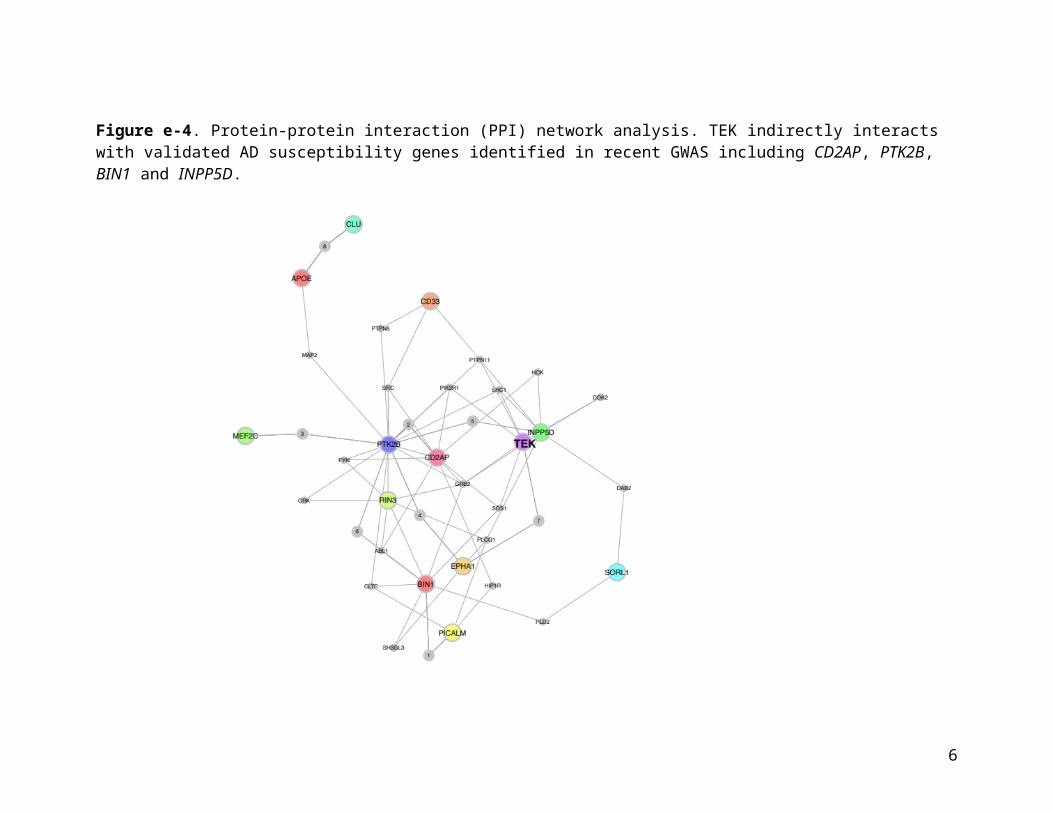
Figure e-4. Protein-protein interaction (PPI) network analysis. TEK indirectly interacts with validated AD susceptibility genes identified in recent GWAS including CD2AP, PTK2B, BIN1 and INPP5D.
5
Supplementary Tables
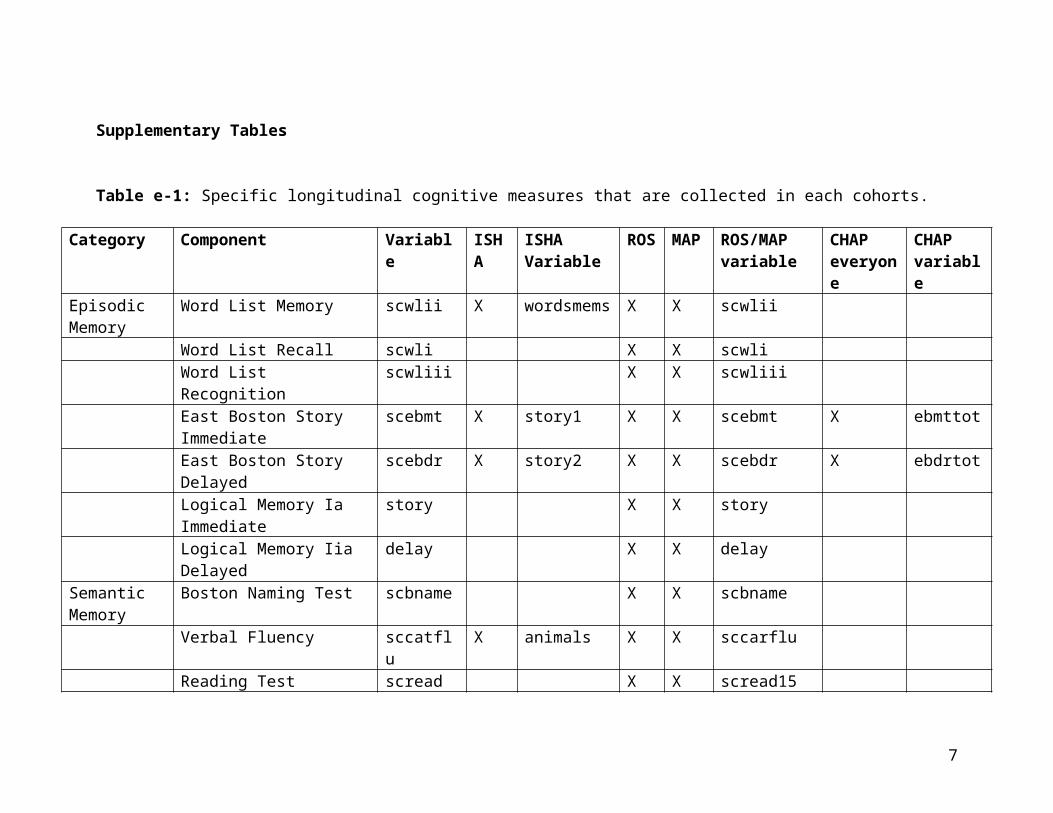
Table e-1: Specific longitudinal cognitive measures that are collected in each cohorts.
Category Component Variable ISHA ISHA Variable
ROS MAP ROS/MAP variable
CHAP everyone
CHAP variable
Episodic Memory
Word List Memory scwlii X wordsmems X X scwlii
Word List Recall scwli X X scwli Word List Recognition scwliii X X scwliii East Boston Story Immediate
scebmt X story1 X X scebmt X ebmttot
East Boston Story Delayed scebdr X story2 X X scebdr X ebdrtotLogical Memory Ia Immediate
story X X story
Logical Memory Iia Delayed delay X X delay Semantic Memory
Boston Naming Test scbname X X scbname
Verbal Fluency sccatflu X animals X X sccarflu Reading Test scread X X scread15
Working Memory
Digit Span Forward scdf X X scdf
Digit Span Backward scdb X X scdb Digit Ordering scdoperf X X scdoperf
Perceptual Speed
Symbol Digit Modalitites Test
scsdmt X X scsdmt X sdmtcor
Number Comparison scnccrtd X X scnccrt Visuospatial Judgment of Line sclopair X X sclopair
6
Ability OrientationStandard Progressive Matrices
scpmat X X scpmat
MMSE scmmse30 X X mmse X mmseCSID X cogscore
Complex Ideational Material
scidea X X
Standard Progressive Matrices Subset
scpmsub X X
Extended Range Vocabulary
scvocab X
Alpha Span Test scaspan X
7
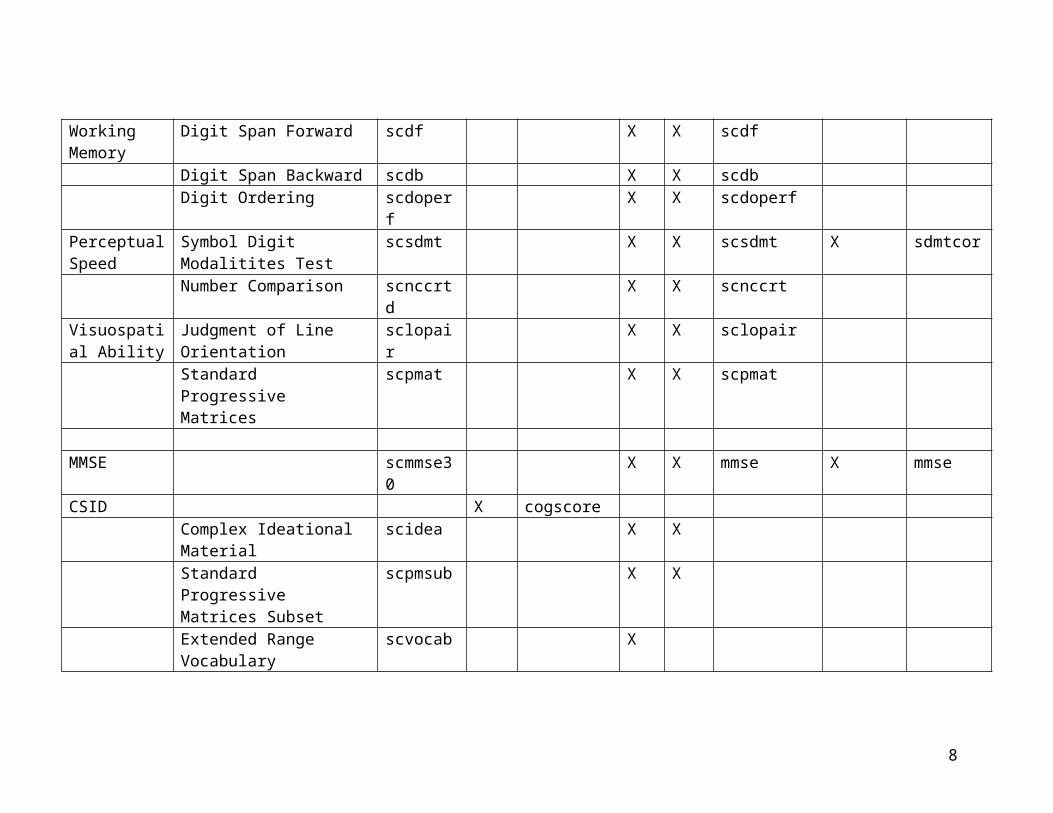
Table e-2. Demographic and clinical characteristics of cohorts in this study.
CHAP IIDP ROS/MAP MARSSample Size 2588 1178 85 113
Age at Enrollment 70.4 ± 5.0 75.5 ± 5.5 70.5 ± 7.6 76.9 ± 5.1Education (years) 11.9 ± 3.2 11.0 ± 2.9 15.4 ± 3.4 14.8 ± 4.1
% Female 63 66 84 61# Cognitive Tests 4, every 3 yrs 5, every 3 yrs 19, annually 17, annually
% European Ancestry 0.213 (±0.12) 0.210 (±0.13) 0.204 (±0.14) 0.19 (±0.12) CHAP: The Chicago Health and Aging Project; IIDP: Indianapolis-Ibadan Dementia Project; ROS: Religious Order Study; MAP: Memory and Aging Project; MARS Minority Aging Research Study.
8
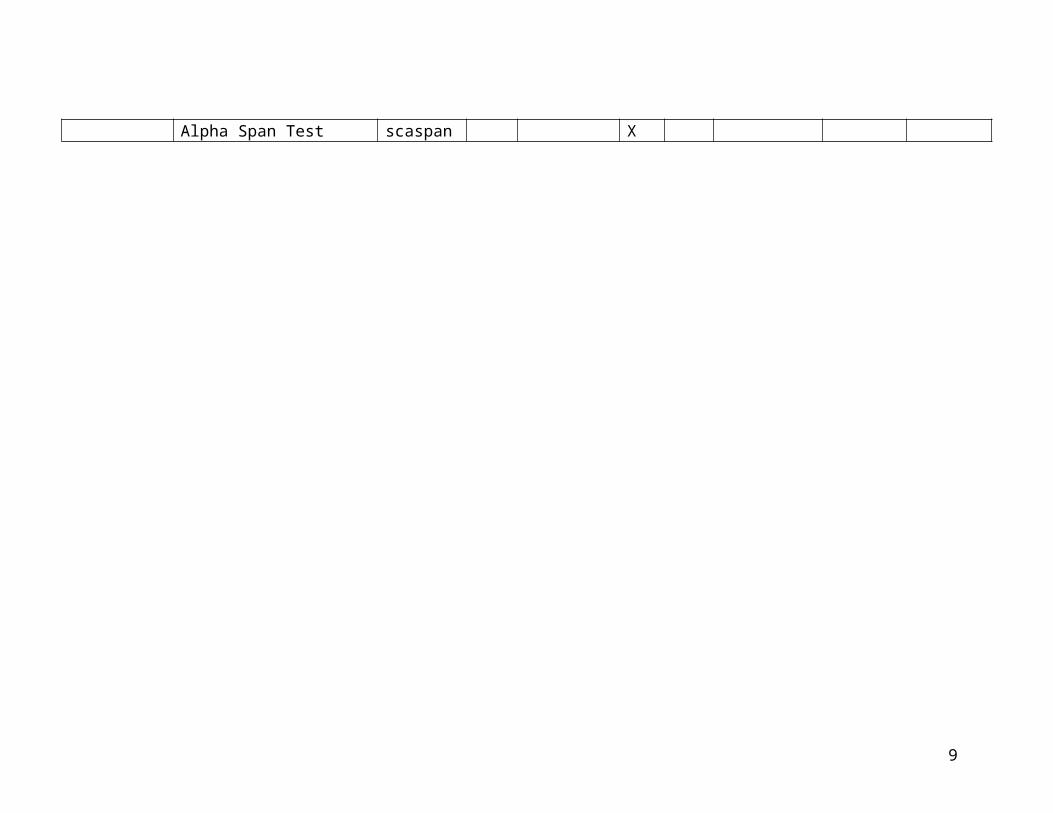
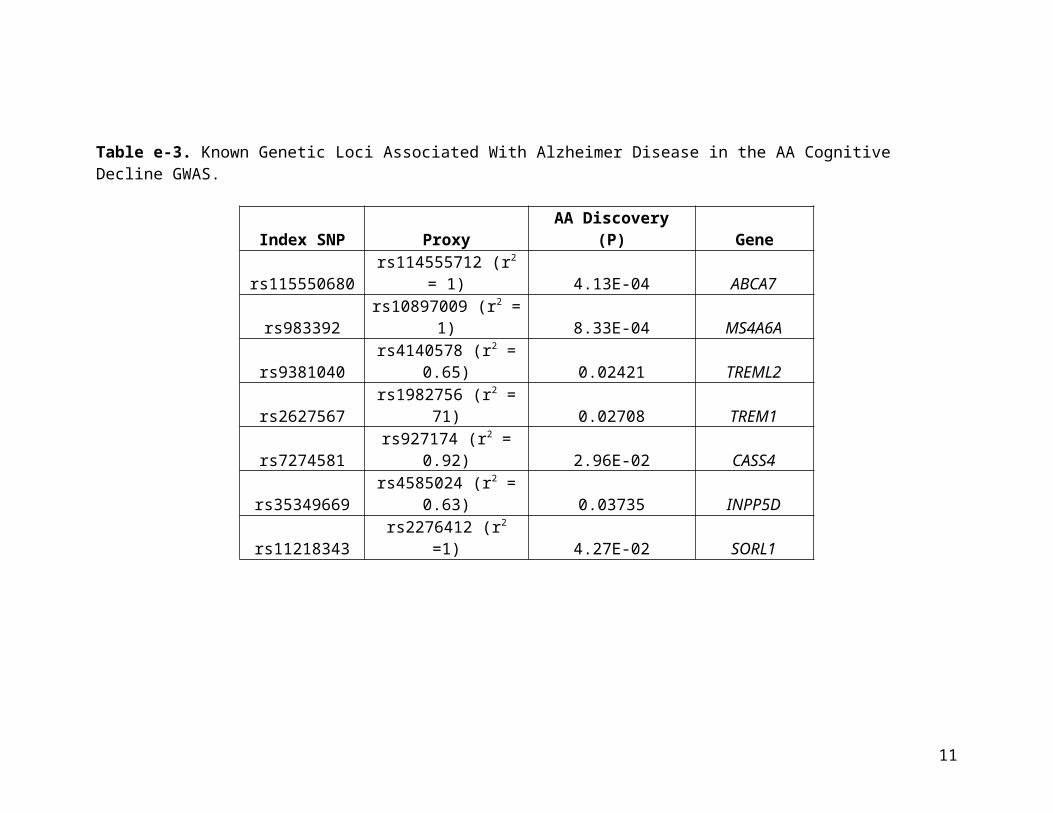
Table e-3. Known Genetic Loci Associated With Alzheimer Disease in the AA Cognitive Decline GWAS.
Index SNP Proxy AA Discovery (P) Geners115550680 rs114555712 (r2 = 1) 4.13E-04 ABCA7
rs983392 rs10897009 (r2 = 1) 8.33E-04 MS4A6Ars9381040 rs4140578 (r2 = 0.65) 0.02421 TREML2rs2627567 rs1982756 (r2 = 71) 0.02708 TREM1rs7274581 rs927174 (r2 = 0.92) 2.96E-02 CASS4rs35349669 rs4585024 (r2 = 0.63) 0.03735 INPP5Drs11218343 rs2276412 (r2 =1) 4.27E-02 SORL1
9
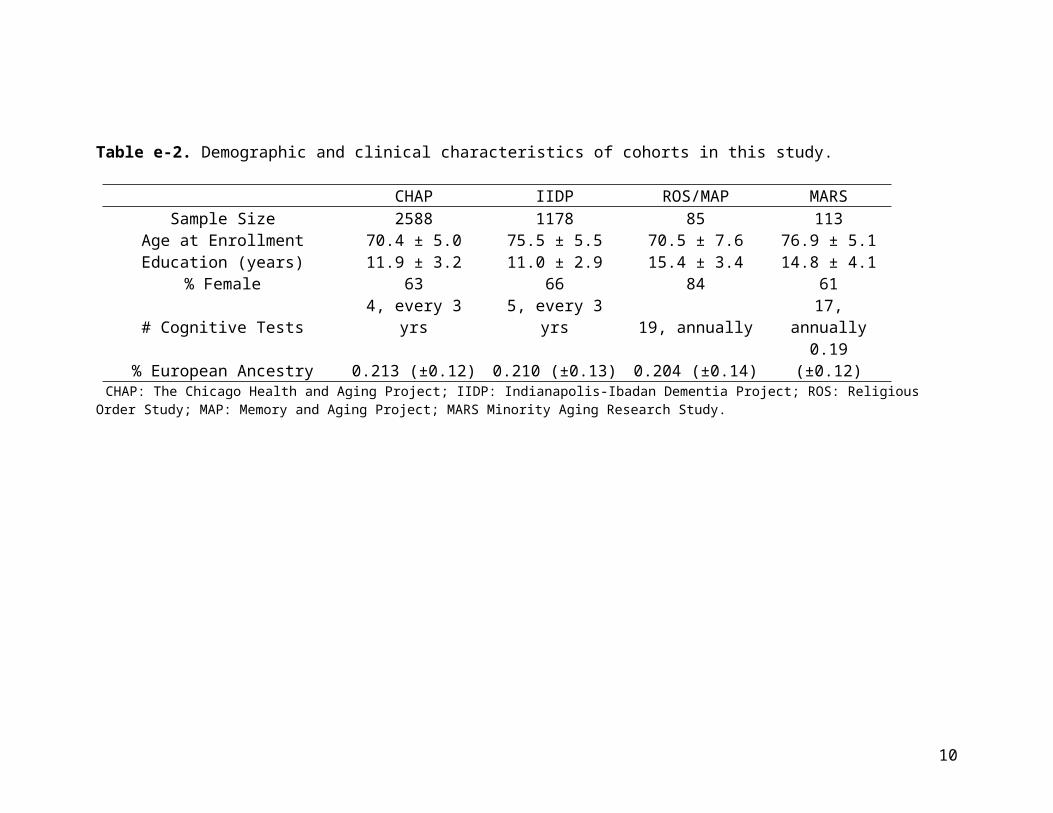
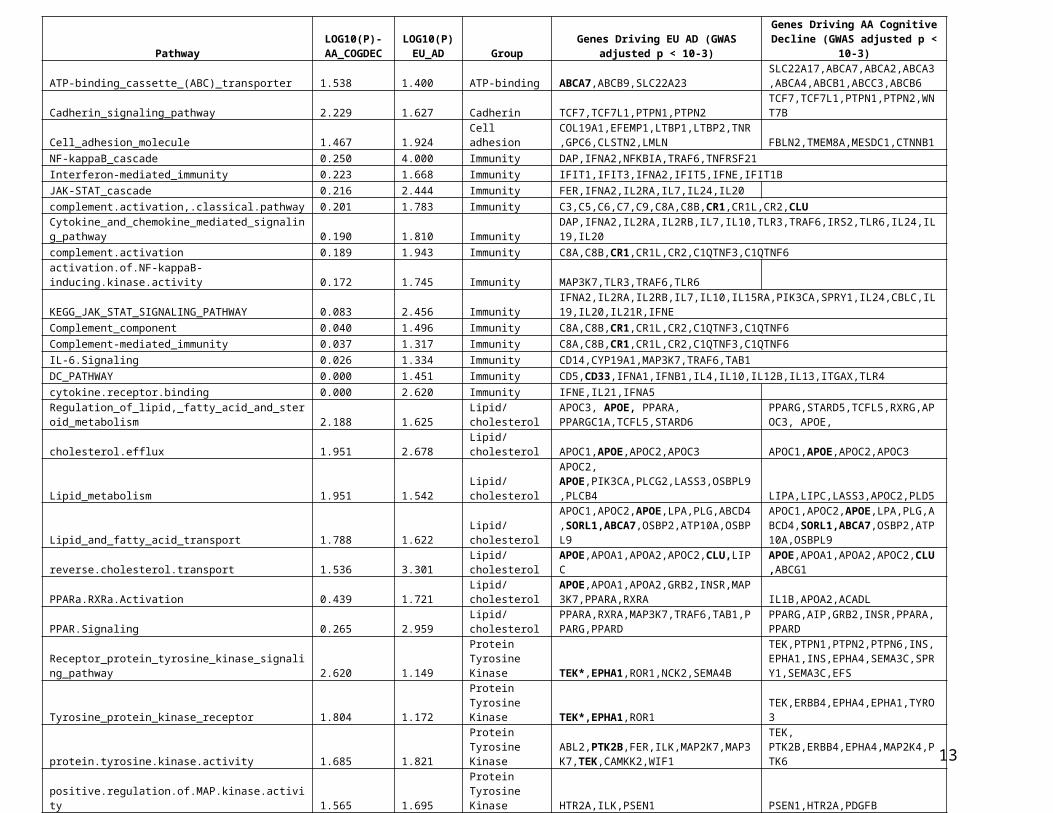
Table e-4: Pathway enrichment analysis of age-related cognitive decline and AD GWAS in subjects of European ancestry.
10
PathwayLOG10(P)-
AA_COGDECLOG10(P)
EU_AD GroupGenes Driving EU AD (GWAS adjusted p <
10-3)Genes Driving AA Cognitive Decline
(GWAS adjusted p < 10-3)
ATP-binding_cassette_(ABC)_transporter 1.538 1.400 ATP-binding ABCA7,ABCB9,SLC22A23SLC22A17,ABCA7,ABCA2,ABCA3,ABCA4,ABCB1,ABCC3,ABCB6
Cadherin_signaling_pathway 2.229 1.627 Cadherin TCF7,TCF7L1,PTPN1,PTPN2 TCF7,TCF7L1,PTPN1,PTPN2,WNT7B
Cell_adhesion_molecule 1.467 1.924 Cell adhesionCOL19A1,EFEMP1,LTBP1,LTBP2,TNR,GPC6,CLSTN2,LMLN FBLN2,TMEM8A,MESDC1,CTNNB1
NF-kappaB_cascade 0.250 4.000 Immunity DAP,IFNA2,NFKBIA,TRAF6,TNFRSF21Interferon-mediated_immunity 0.223 1.668 Immunity IFIT1,IFIT3,IFNA2,IFIT5,IFNE,IFIT1BJAK-STAT_cascade 0.216 2.444 Immunity FER,IFNA2,IL2RA,IL7,IL24,IL20complement.activation,.classical.pathway 0.201 1.783 Immunity C3,C5,C6,C7,C9,C8A,C8B,CR1,CR1L,CR2,CLUCytokine_and_chemokine_mediated_signaling_pathway 0.190 1.810 Immunity DAP,IFNA2,IL2RA,IL2RB,IL7,IL10,TLR3,TRAF6,IRS2,TLR6,IL24,IL19,IL20complement.activation 0.189 1.943 Immunity C8A,C8B,CR1,CR1L,CR2,C1QTNF3,C1QTNF6activation.of.NF-kappaB-inducing.kinase.activity 0.172 1.745 Immunity MAP3K7,TLR3,TRAF6,TLR6KEGG_JAK_STAT_SIGNALING_PATHWAY 0.083 2.456 Immunity IFNA2,IL2RA,IL2RB,IL7,IL10,IL15RA,PIK3CA,SPRY1,IL24,CBLC,IL19,IL20,IL21R,IFNEComplement_component 0.040 1.496 Immunity C8A,C8B,CR1,CR1L,CR2,C1QTNF3,C1QTNF6Complement-mediated_immunity 0.037 1.317 Immunity C8A,C8B,CR1,CR1L,CR2,C1QTNF3,C1QTNF6IL-6.Signaling 0.026 1.334 Immunity CD14,CYP19A1,MAP3K7,TRAF6,TAB1DC_PATHWAY 0.000 1.451 Immunity CD5,CD33,IFNA1,IFNB1,IL4,IL10,IL12B,IL13,ITGAX,TLR4cytokine.receptor.binding 0.000 2.620 Immunity IFNE,IL21,IFNA5
Regulation_of_lipid,_fatty_acid_and_steroid_metabolism 2.188 1.625 Lipid/cholesterolAPOC3, APOE, PPARA, PPARGC1A,TCFL5,STARD6
PPARG,STARD5,TCFL5,RXRG,APOC3, APOE,
cholesterol.efflux 1.951 2.678 Lipid/cholesterol APOC1,APOE,APOC2,APOC3 APOC1,APOE,APOC2,APOC3
Lipid_metabolism 1.951 1.542 Lipid/cholesterolAPOC2, APOE,PIK3CA,PLCG2,LASS3,OSBPL9,PLCB4 LIPA,LIPC,LASS3,APOC2,PLD5
Lipid_and_fatty_acid_transport 1.788 1.622 Lipid/cholesterol
APOC1,APOC2,APOE,LPA,PLG,ABCD4,SORL1,ABCA7,OSBP2,ATP10A,OSBPL9
APOC1,APOC2,APOE,LPA,PLG,ABCD4,SORL1,ABCA7,OSBP2,ATP10A,OSBPL9
reverse.cholesterol.transport 1.536 3.301 Lipid/cholesterol APOE,APOA1,APOA2,APOC2,CLU,LIPCAPOE,APOA1,APOA2,APOC2,CLU,ABCG1
PPARa.RXRa.Activation 0.439 1.721 Lipid/cholesterol
APOE,APOA1,APOA2,GRB2,INSR,MAP3K7,PPARA,RXRA IL1B,APOA2,ACADL
PPAR.Signaling 0.265 2.959 Lipid/cholesterolPPARA,RXRA,MAP3K7,TRAF6,TAB1,PPARG,PPARD PPARG,AIP,GRB2,INSR,PPARA,PPARD
Receptor_protein_tyrosine_kinase_signaling_pathway 2.620 1.149Protein Tyrosine Kinase TEK*,EPHA1,ROR1,NCK2,SEMA4B
TEK,PTPN1,PTPN2,PTPN6,INS,EPHA1,INS,EPHA4,SEMA3C,SPRY1,SEMA3C,EFS
Tyrosine_protein_kinase_receptor 1.804 1.172Protein Tyrosine Kinase TEK*,EPHA1,ROR1 TEK,ERBB4,EPHA4,EPHA1,TYRO3
protein.tyrosine.kinase.activity 1.685 1.821Protein Tyrosine Kinase
ABL2,PTK2B,FER,ILK,MAP2K7,MAP3K7,TEK,CAMKK2,WIF1
TEK, PTK2B,ERBB4,EPHA4,MAP2K4,PTK6
positive.regulation.of.MAP.kinase.activity 1.565 1.695Protein Tyrosine Kinase HTR2A,ILK,PSEN1 PSEN1,HTR2A,PDGFB
eMethods
Study subjects and cohorts
Chicago Health and Aging Project. The CHAP, started in 1993, is a biracial longitudinal
population based cohort, with 10,801 participants to date (63% African American, 37%
non-Hispanic European American). All participants are ages 65 or older at enrollment
and are sampled from four adjacent neighborhoods on south side of Chicago and
followed with cognitive exams every 3 years. More details may be found in prior
publications1,2.
Indianapolis-Ibadan Dementia Project. The Indianapolis-Ibadan Dementia Project3,
established in 1991, is a longitudinal, prospective population-based comparative
epidemiological study of the prevalence and incidence rates and risk factors for
Alzheimer's disease and other age associated dementias. The project compares samples of
community-dwelling elderly (age > 70 years) African Americans living in Indianapolis to
Yoruba living in Ibadan, Nigeria, employing the same research design, methods, and
investigators.
Religious Orders Study and Rush Memory and Aging Project. The ROS, started in 1994,
enrolls Catholic priests, nuns and brothers from more than 40 groups in 12 states. The
MAP, started in 1997, enrolls participants from retirement living communities,
subsidized housing, church groups and social service agencies throughout the Chicago
area. In both studies, participants were older and free of dementia at enrollment and
followed annually with clinical and cognitive exams. The studies have a large common
core of data designed to facilitate combination of data, and are maintained by a single
investigative team at the Rush Alzheimer’s Disease Center at Rush University Medical
Center in Chicago, IL. More detailed information on the ROS and MAP and studies can
be found in prior publications4.
Minority Aging Research Study. The Minority Aging Research Study5 (MARS), a
longitudinal study of risk factors for cognitive decline, began data collection in August
2004 and was re-funded in July 2010 to include an optional arm in which existing and
11
newly recruited participants may participate in brain donation. Similar to the ROS and
MAP studies, MARS enrolled self-identified African-American participants 65 years or
older, free of dementia at baseline and followed them annually with cognitive and
neurological exams.
Clinical and cognitive evaluation
The ROS study collects data annually on 19 cognitive tests, the MAP and MARS studies
collect data annually on 17 tests and the CHAP study collects data every three years on 4
cognitive tests. The four tests in CHAP and the 17 tests in MAP and MARS are a subset
of the 19 cognitive tests collected in ROS. The IIDP study collects data on 5 cognitive
tests every three years. For all studies, the number of tests performed remained
consistent throughout the time course of the study. An aggregate measure of global
cognition was created in each cohort independently as previously described6,7 by using
the mean and standard deviation from baseline (free of dementia) evaluation to convert
each test into a Z score. The global cognition aggregate measure is the mean of all Z
scores, with any individual missing more than half of the tests at any cycle being coded
as non-valid for that cycle. The Z-score is used to limit the floor and ceiling affect seen in
cognitive tests and an aggregate measure is used to limit the influence of outliers.
Statistical modeling of global Cognitive decline
Global cognitive decline is quantified as person-specific, adjusted residual slopes. These
slopes are created using linear mixed effect models with the global cognition aggregate
measure as the outcome and including terms for age at baseline enrollment, sex and years
of education as fixed effects7-9. Initial level of cognitive function (intercept) and rate of
change (slope) are included as random effects and assumed to follow a bivariate normal
distribution. The random and fixed effects are then used to estimate person-specific
trajectories of cognitive decline. The adjusted residual slopes can be interpreted as the
person-specific decline as compared to someone of the same age, sex and education level.
For the GWAS, these slopes are used as the dependent variable in a linear regression.
Genotype quality control and imputation
12
We applied rigorous subject and SNP quality control (QC) that includes: (1) genotype
success rate >95% (2) genotype-derived sex concordant with reported sex (3) excess
inter/intra-heterozygosity and (4) subject relatedness. SNP QC includes: (1) genotype
call rate (2) Hardy-Weinberg equilibrium p-value < 10-6 (2) (3) MAF > 0.01 and (4)
misshap test > 1×10⁻⁹.
We used the BEAGLE software (version: 3.3.2) to impute the ungenotyped markers
using reference haplotype panels from the 1000 Genomes Project (The 1000 Genomes
Project Consortium Phase I Integrated Release Version 3)10 that contain a total of 37.9
Million SNPs in 1,092 individuals with ancestry from West Africa, East Asia, and
Europe. For imputing genotypes from African-American subjects, we used a combined
haplotype reference panels consisting of CEU and Yoruba in Ibadan, Nigeria (YRI). We
excluded monomorphic or singleton SNPs or SNPs with deviation of HWE from each of
the reference panels. Imputed SNP genotypes with R2>0.80, minor allele frequency>0.01,
and Hardy-Weinberg equilibrium (p>0.001) were carried through the rest of the analysis.
A total of 13.9M SNPs were evaluated for association with the residual cognitive decline
slope.
Admixture analysis
To detect chromosomal segments of distinct ancestry in African Americans, we
employed the HAPMIX algorithm11. HAPMIX estimates the number of African and
European chromosomes in each AA individual at each SNP locus (MAF > 0.05), using
phased genotypes from the HapMap YRI and CEU populations were used as the
reference ancestral populations. Suggested input parameters for AA populations of 20%
European ancestry and 6 generations since admixture were used.
The quantitative admixture scan was performed using MIXCORE software12, which
associates local ancestry to the continuous phenotype – in this case the slope of cognitive
decline. The MIX test implemented in MIXSCORE was used to perform the case-control
admixture scan. The p-values were generated by using a χ2(1-d.f.) likelihood ratio test
13

(LRT) that compares the local ancestry in the cases to the average local ancestry across
the genome in the controls.
eReferences:
e1. Bienias JL, Beckett LA, Bennett DA, Wilson RS, Evans DA. Design of the Chicago Health and Aging Project (CHAP). Journal of Alzheimer's disease : JAD. Oct 2003;5(5):349-355.
e2. Evans DA, Bennett DA, Wilson RS, et al. Incidence of Alzheimer disease in a biracial urban community: relation to apolipoprotein E allele status. Archives of neurology. Feb 2003;60(2):185-189.
e3. Hendrie HC, Osuntokun BO, Hall KS, et al. Prevalence of Alzheimer's disease and dementia in two communities: Nigerian Africans and African Americans. The American journal of psychiatry. Oct 1995;152(10):1485-1492.
e4. Bennett DA, Schneider JA, Buchman AS, Barnes LL, Boyle PA, Wilson RS. Overview and findings from the rush Memory and Aging Project. Current Alzheimer research. Jul 2012;9(6):646-663.
e5. Barnes LL, Shah RC, Aggarwal NT, Bennett DA, Schneider JA. The Minority Aging Research Study: ongoing efforts to obtain brain donation in African Americans without dementia. Current Alzheimer research. Jul 2012;9(6):734-745.
e6. Bennett DA, Schneider JA, Buchman AS, Mendes de Leon C, Bienias JL, Wilson RS. The Rush Memory and Aging Project: study design and baseline characteristics of the study cohort. Neuroepidemiology. 2005;25(4):163-175.
e7. Wilson RS, Beckett LA, Barnes LL, et al. Individual differences in rates of change in cognitive abilities of older persons. Psychology and aging. Jun 2002;17(2):179-193.
e8. Wilson RS, Gilley DW, Bennett DA, Beckett LA, Evans DA. Person-specific paths of cognitive decline in Alzheimer's disease and their relation to age. Psychology and aging. Mar 2000;15(1):18-28.
e9. De Jager PL, Shulman JM, Chibnik LB, et al. A genome-wide scan for common variants affecting the rate of age-related cognitive decline. Neurobiology of aging. May 2012;33(5):1017 e1011-1015.
e10. Genomes Project C, Abecasis GR, Auton A, et al. An integrated map of genetic variation from 1,092 human genomes. Nature. Nov 1 2012;491(7422):56-65.
e11. Price AL, Tandon A, Patterson N, et al. Sensitive detection of chromosomal segments of distinct ancestry in admixed populations. PLoS genetics. Jun 2009;5(6):e1000519.
e12. Pasaniuc B, Zaitlen N, Lettre G, et al. Enhanced statistical tests for GWAS in admixed populations: assessment using African Americans from CARe and a Breast Cancer Consortium. PLoS genetics. Apr 2011;7(4):e1001371.
14