Embed Size (px)
Citation preview

i
An Analysis of Changing Food Consumption Pattern in India
A research paper prepared under the project Agricultural Outlook and Situation Analysis Reports
National Council of Applied Economic ResearchParisila Bhawan, 11, I.P Estate, New Delhi

ii

An Analysis of Changing Food Consumption Pattern in India
National Council of Applied Economic ResearchNew Delhi
iii

An Analysis of Changing Food Consumption Pattern in India
Introduction
Economic growth is typically accompanied by improvements in a country’s food supply, both quantitative and qualitative, and a gradual reduction in nutritional deficiencies. It also brings about changes in the production, processing, distribution and marketing of food. Diets evolve over time and are influenced by factors such as income, prices, individual preferences and beliefs, cultural traditions, as well as geographical, environmental, social and economic factors.
This paper examines the evolving food consumption pattern in India over the past two decades due to income induced diet diversification, impact of globalization, increasing urbanization and changing lifestyle of people. The trend in calorie, protein and fat intake in the Indian diet is analyzed and comparison is made of the trend in nutrient intake in India with that of China and the United States, which are at different growth stages. This will be helpful to draw some conclusion about the likely emerging food demand scenario for India in future. National Sample Survey Consumer Expenditure Survey results1 and the FAO Food Balance Sheet data2 are the major data sources of the study. As the average per capita food consumption is derived from all India data and not from state level data and from Monthly Per capita Consumer Expenditure (MPCE) groups, they may not correspond to actual per capita availability by various income groups. Furthermore, the FAO Food Balance data refer to “average food available for consumption”, which, for a number of reasons, is not equal to average food intake or average food consumption. Hence in this report the terms “food consumption” or “food intake” and “nutrient intake” using the FAO data should be treated as “food available for consumption”.
Consumers becoming choosy
India’s impressive economic growth over the past two decades and a more inclusive growth in recent years have resulted in per capita income steadily increasing in real terms as well as at market prices both in urban and rural areas.
Table1. Per Capita Income Growth during the Study Period
Avg. 1987-1992 Avg. 1993-1999 Avg. 2000-2004 Avg. 2005-2009At 2004-05 prices 2.9 4.6 3.9 7.1At Current prices 13.0 12.8 8.0 13.9
Consistent with the overall economic growth, the share of consumer spending on food has declined. According to some studies, the proportion of expenditure on food items over all income groups has declined by about 10 percentage points in the rural areas and by about 16
1 http://mospi.nic.in/Mospi_New/site/inner.aspx?status=3&menu_id=312 http://faostat3.fao.org/faostat-gateway/go/to/download/FB/*/E; http://www.fao.org/docrep/003/x9892e/x9892e01.htm
iv

percentage points in the urban areas between 1987-88 and 2009-103. However, the income-induced diet diversification has resulted in consumers moving away from inferior cereals such as jowar and bajra to superior grains such as wheat and rice (Figure I.A. and I.B) and more recently from cereals to high value food products such as milk, egg, meat, and fruits and vegetables – a natural corollary to the negative income elasticity for cereals in India and positive income elasticity for high quality food. The change is occurring both among rural and urban households. Other factors contributing to the change in the consumption pattern is the increasing urbanization. During the most recent decade globalisation has also played an important role in the transformation of food consumption patterns of Indian households. There has been a significant increase in imports of fresh fruits such as apple, dry fruits such as almonds and processed food products following removal of trade restrictions.
Figure I.A. Trend in Cereal Consumption – Rural (Kgs. /year)
1987-88 1993-94 1999-00 2004-05 2009-100
20
40
60
80
100
120
140
160
180
200
Rice Wheat C.Grains
Figure I.B. Trend in Cereal Consumption – Urban (Kgs. /year)
1987-88 1993-94 1999-00 2004-05 2009-100
20
40
60
80
100
120
140
160
Rice Wheat C.Grains
Source: Various Rounds of Consumer Expenditure Survey, NSS
3 http://www.iimahd.ernet.in/assets/snippets/workingpaperpdf/5337679172012-08-02.pdf
v

Consumption Trend by Commodities
Rice: Per capita rice consumption in rural households declined from about 83 kgs in 1987-88 to 80 kgs in 1999-2000 and more rapidly to 73 kgs in 2009-10. A similar trend was noticed in the urban households where per capita rice consumption declined from 64 kgs in 197-88 to 62 kgs in 1999-2000 and to 55 kgs in 2009-10.
Figure II. A. Trends in Per Capita Rice Consumption
1987-88 1993-94 1999-00 2004-05 2009-100.00
10.00
20.00
30.00
40.00
50.00
60.00
70.00
80.00
90.00
f(x) = − 2.46983333333336 x + 86.6631666666666R² = 0.912268662003026
f(x) = − 2.31166666666664 x + 67.0869999999999R² = 0.917827722973654
Kg./Y
ear
Wheat: The trend in wheat consumption shows a similar pattern as that of rice but at a less spectacular rate. Per capita consumption in rural households after remaining more or less unchanged at around 54 kgs/year during 198-98 to 1999-00 declined to slightly below 52 kgs in 2009-10. In urban households, the decline was more significant from around 54 kgs to around 50 kgs. The reason could be increased consumption of wheat products such as bread, biscuits, and noodles etc. which are not included in the NSS wheat consumption data.
vi

Figure II. B. Trends in Per Capita Wheat Consumption
1987-88 1993-94 1999-00 2004-05 2009-100.00
10.00
20.00
30.00
40.00
50.00
60.00
f(x) = − 0.717833333333289 x + 54.9324999999998R² = 0.555360561582638f(x) = − 0.82733333333335 x + 55.2366666666667R² = 0.510826336721203
Coarse grains: The decline in coarse grain consumption during the study period was more spectacular than in the case of wheat and rice, both in rural and urban households. With rising income, consumers have shifted from coarse grains, considered as inferior gains, to superior grains such as rice and wheat. Per capita consumption declined from around 38 kilograms in 1987-88 to 13 kgs in 2009-10 in rural households and from 19 kgs to 9 kgs in urban households. However, the decline in human consumption of coarse cereals has resulted in larger availability of feed gains to the poultry and livestock sector, which has registered a significant growth in recent years.
Figure II. C. Trends in Per Capita Coarse Grains Consumption
1987-88 1993-94 1999-00 2004-05 2009-100.00
5.00
10.00
15.00
20.00
25.00
30.00
35.00
40.00
f(x) = − 5.79133333333334 x + 41.0503333333333R² = 0.937612765464388
f(x) = − 2.11700000000001 x + 18.834R² = 0.748812821527506
Rural Linear (Rural) Urban Linear (Urban)
Kgs./
Year
vii

Pulses: Per capita pulse consumption after showing an upward trend during 1987-88 through 1999-2000 has shown a generally declining trend since then despite increasing consumer income as the price effect on demand has apparently outstripped the income effect. Limited availability of pulses in the global market has also limited consumption. Per capita consumption in urban households declined from 12 kgs in 1999-00 to 9.6 kgs in 2009-10 and from 10 kgs to 8 kgs in rural households.
Figure II. D. Trends in Per Capita Pulses Consumption
1987-88 1993-94 1999-00 2004-05 2009-100.00
2.00
4.00
6.00
8.00
10.00
12.00
14.00
Kgs.
/Yea
r
Edible oils: Edible oil consumption has shown a steady upward trend both in rural and urban households with per capita consumption increasing from 4 kgs to 7.7 kgs/year in rural areas and from 6.6 kgs to 10 kgs in urban households during 1987-88 to 2009-10.
Figure II. E. Trends in Per Capita Edible Oils Consumption
1987-88 1993-94 1999-00 2004-05 2009-100.00
2.00
4.00
6.00
8.00
10.00
12.00
f(x) = 0.878433333333333 x + 3.0003R² = 0.899932326050327
f(x) = 0.798133333333336 x + 5.63073333333333R² = 0.812518881034379
Rural Linear (Rural) Urban Linear (Urban)
viii

The composition of oils in the consumption basket has changed drastically over the past two decades with palm oil and soybean oil emerging as the major oils consumed due to lager imports because of lower international prices. Nevertheless, rapeseed/mustard oil continued to remain as the largest vegetable oil consumed in India.
Figure II. F. Changes in the Composition of Edible Oils in Consumption
Soyabean Oil9%
Groundnut Oil32%
Sunflower seed Oil5%
Rapeseed and Mustard Oil26%
Cottonseed Oil7%
Palm Oil5% Other Oils
16%
1987-93
Soyabean Oil17%
Groundnut Oil16%
Sunflower seed Oil6%
Rapeseed and Mustard Oil23%Cottonseed Oil
7%
Palm Oil19%
Other Oils12%
2005-09
Milk: A significant increase in per capita milk consumption has taken place during the analysis period, both in rural and urban areas in response to increasing per capita income. The per capita milk consumption in rural households increased from 39 kgs/year in 1987-88 to 50 kgs in 2009-10, an increase of 28 per cent, whereas in urban households per capita
ix

consumption increased from 52 kgs to 65 kgs during the same period, registering an increase of 25 percent. Domestic production kept pace with the increasing consumption.
Figure II. G. Trends in Per Capita Milk Consumption
1987-88 1993-94 1999-00 2004-05 2009-100.00
10.00
20.00
30.00
40.00
50.00
60.00
70.00
f(x) = 2.14620000000001 x + 39.5927666666666R² = 0.643296247843768
f(x) = 2.93946666666665 x + 51.3287333333333R² = 0.841002611880942
Kgs/
Year
Meat Poultry and Egg: Although consumption of mutton (goat and sheep meat) registered a declining trend during 1987-88 to 2009-10, more drastically in urban households than in rural households, the decline was more than offset by the increase in poultry meat consumption. Poultry meat consumption registered an exponential growth during this period, increasing from 240 grams to 1.5 kgs in rural households and 240 grams to 2.2 kgs in urban areas. The higher poultry meat consumption is attributed to larger supplies and its relatively lower prices vis-a-vis mutton. The poultry sector has registered a significant growth during the past decade due to introduction of improved breeding stocks, larger availability of feed stocks such as maize and soybean meal, and better marketing infrastructure. Per capita consumption of eggs also registered a significant growth over the past decades increasing from about 6 eggs per year in 1987-88 to 21 eggs in 2009-10 in rural households and from 17 eggs to 32 eggs during the corresponding period in urban households. Fish consumption has also registered a steady increase during the period.
x

Figure II. H. Trends in Per Capita Consumption of Meat, Egg and Fish
1987-88 1993-94 1999-00 2004-05 2009-100.00
0.20
0.40
0.60
0.80
1.00
1.20
1.40
1.60
1.80
f(x) = − 0.0474500000000001 x + 0.833416666666668R² = 0.393226473629785
f(x) = − 0.143566666666666 x + 1.6498R² = 0.702948303715665
Mutton
Rural Linear (Rural) Urban Linear (Urban)
Kgs./
Year
1987-88 1993-94 1999-00 2004-05 2009-100.00
0.50
1.00
1.50
2.00
2.50
f(x) = 0.123328530666681 exp( 0.4549194895511 x )R² = 0.910800800209719
f(x) = 0.133393782978163 exp( 0.54359030295006 x )R² = 0.987639459449015
Chicken
Rural Exponential (Rural) Urban Exponential (Urban)
Kgs,/
Year
xi

1987-88 1993-94 1999-00 2004-05 2009-100.00
5.00
10.00
15.00
20.00
25.00
30.00
35.00
f(x) = 3.39449999999997 x + 1.9588333333334R² = 0.863863363963244
f(x) = 3.30933333333334 x + 12.848R² = 0.708468992990392
Eggs
Rural Linear (Rural) Urban Linear (Urban) Linear (Urban)
Kgs./
Year
1987-88 1993-94 1999-00 2004-05 2009-100.00
0.50
1.00
1.50
2.00
2.50
3.00
3.50
f(x) = 0.290783333333332 x + 1.60965R² = 0.842244175759363f(x) = 0.172766666666666 x + 1.99776666666667R² = 0.791117388575011
Fish
Rural Linear (Rural) Urban Linear (Urban)
Kgs./
Year
Potato, Onion, and Banana: Per capita vegetable and fruit consumption in general has registered a significant growth in the past in response to increasing per capita income. Among vegetables, this study has focussed only on potato and onions, the major ones, and among fruits only on banana. Per capita onion consumption recorded a steady upward trend both in rural and urban area during the study period. In rural households per capita onion consumption almost doubled from 4.6 kgs to 9 kgs and in urban households from 6.1 kgs to 10.4 kgs. Being an essential ingredient in most non-vegetarian cooking, the increasing consumption of meat and poultry meat must have translated into increased onion consumption. The fluctuation production
xii

superimposed on a steady growth in consumption has resulted in onion prices fluctuating widely from year to year.
Potato per capita consumption has shown a generally upward trend, more significantly in rural households where it increased from about 14 kgs in 1987-88 to 20 kgs in 20199-10. In urban households the consumption grew at a lower rate from about 14 kgs to 16.6 kilograms during the same period. However the urban potato consumption is an under estimate as it has not taken into consideration the increasing non-home consumption of French fries served by mushrooming fast food chains and processed potato chips manufactured and marketed by large companies such as Pepsi.
Banana consumption, although fluctuating significantly from year-to-year, has shown a generally upward trend, increasing from about 26 bananas per year in 1987-88 to 47 bananas in 2009-10 in rural areas and from 62 to 81 in urban areas.
Figure II. H. Trends in Per Capita Consumption of Onion, Potato and Banana
1987-88 1993-94 1999-00 2004-05 2009-100.00
2.00
4.00
6.00
8.00
10.00
12.00
f(x) = 1.0001 x + 3.6208R² = 0.909243091365149
f(x) = 1.05606666666666 x + 4.99320000000002R² = 0.943516069568005
Onion
Rural Linear (Rural) Urban Linear (Urban)
Kgs./
Year
xiii

1987-88 1993-94 1999-00 2004-05 2009-100.00
5.00
10.00
15.00
20.00
25.00
f(x) = 1.2921 x + 13.2203R² = 0.582501466784577f(x) = 0.700799999999999 x + 12.5414R² = 0.483221476510067
Potato
Rural Linear (Rural) Urban Linear (Urban)
Kgs./
Year
1987-88 1993-94 1999-00 2004-05 2009-100.00
10.00
20.00
30.00
40.00
50.00
60.00
70.00
80.00
90.00
f(x) = 4.48949999999999 x + 18.1891666666667R² = 0.659413622099105
f(x) = 3.35800000000001 x + 51.6596666666666R² = 0.205043174917634
Banana
Rural Linear (Rural) Urban Linear (Urban)
Num
bers
/Yea
r
. Are Indians Eating Better Now?
It would be interesting to see how the change in the nature of food consumption pattern has affected the nutrient intake in the Indian diet as the process of diet transformation has far-reaching consequences for public health. While an increase in the consumption of milk, animal protein and fruits and vegetables could result in reduced incidence of malnutrition, an increased consumption of highly-calorific and fatty food could lead to increased incidence obesity and of diet-related diseases, like diabetes, coronary heart disease. The FAO Food Balance Sheet is used to analyze the trend in macro nutrient (calorie, protein, and fat) intake in India. The following chart shows the annual trend in all the three nutrients from which it appears that while calories and protein intake remained static or registered a modest growth, increase in fats consumption was more significant.
xiv

Figure II. I. Trends in Per Capita Consumption of Calories, Protein and Fats
19871988
19891990
19911992
19931994
19951996
19971998
19992000
20012002
20032004
20052006
20072008
20092050.0
2100.0
2150.0
2200.0
2250.0
2300.0
2350.0
2400.0
0.010.020.030.040.050.060.070.080.090.0100.0
Protein Gr / Day Linear (Protein Gr / Day) Fat Gr / DayLinear (Fat Gr / Day) Calorie KCal / Day Linear (Calorie KCal / Day)
K Ca
lorie
s/Da
y
Prot
ein/
Fat (
Gam
s/Da
y)
Calorie Intake Trend
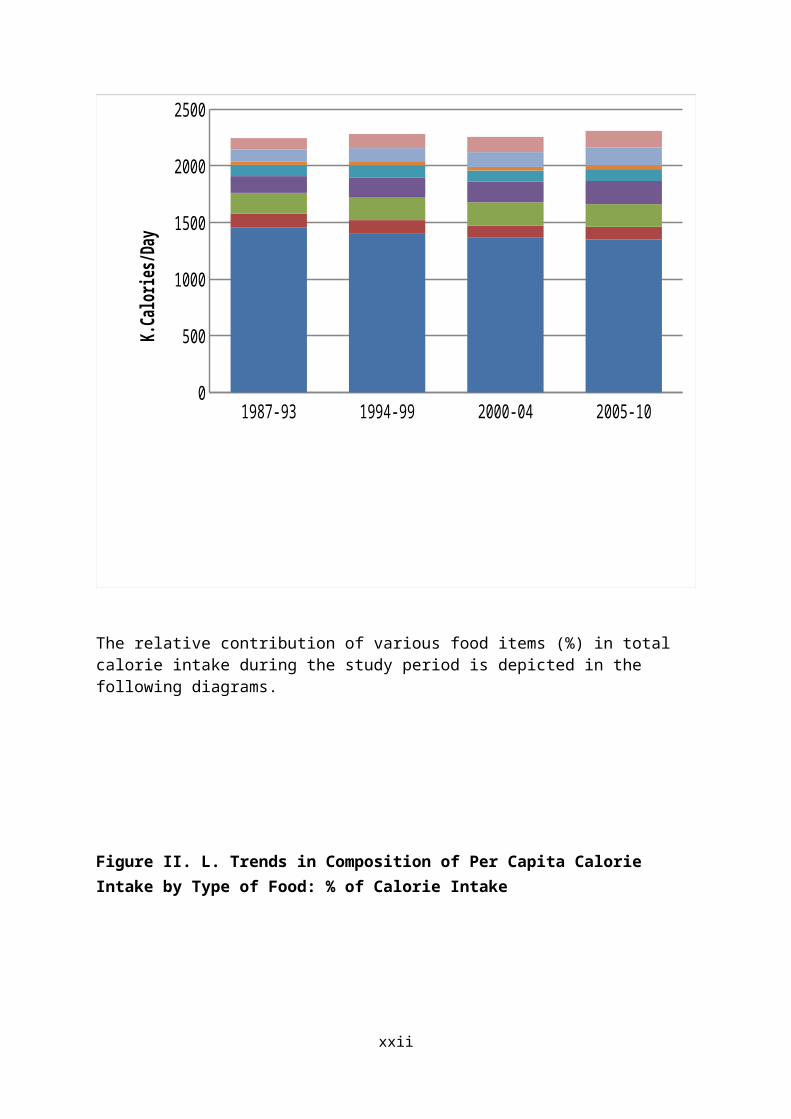
Despite the changing diet pattern in India over the years, the overall calorie intake has registered only a modest increase from an average 2250 K Calories during 1987-1993 to 2310 K Calories during 2005-2010. A decline in calorie intake from vegetable–based food, more importantly from cereal-based food, was more than offset by increased calorie intake from animal based food products.
Figure II. J. Trends in Composition of Calories: Animal and Vegetable Products
1987-93 1994-99 2000-04 2005-100
500
1000
1500
2000
2500
Kilo
Cal
orie
s?Da
y
xv

Calorie intake by type of food shows that the contribution of cereals and pulses combined has declined from 1580 K. calories during 1987-1993 to 1460 K .calories during 2005-2010, a decline of around 8 per cent. During the corresponding period calorie availability from fruits and vegetables increased by 43 per cent to 156 k. calories, from vegetable oils by 39 per cent to 204 k. Calories, from milk by 6 percent to 105 K. calories, from meat, egg and fish by 25 per cent to 35 k. calories, and sugar by 9 per cent to 200 k. calories.
Figure II. K. Trends in Composition of Per Capita Calorie Intake by Type of Food: K. calories/day
1987-93 1994-99 2000-04 2005-100
500
1000
1500
2000
2500
K.Calo
ries/D
ay
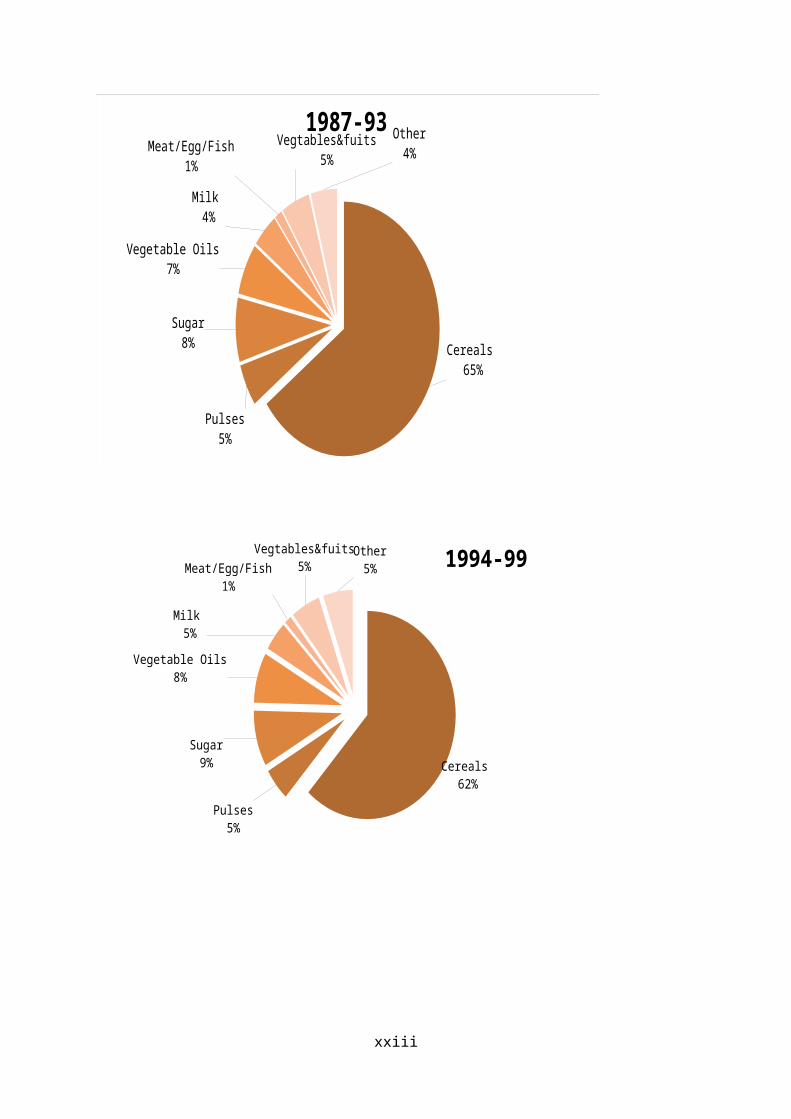
The relative contribution of various food items (%) in total calorie intake during the study period is depicted in the following diagrams.
xvi

Figure II. L. Trends in Composition of Per Capita Calorie Intake by Type of Food: % of Calorie Intake
Cereals 65%
Pulses5%
Sugar8%
Vegetable Oils7%
Milk 4%
Meat/Egg/Fish1%
Vegtables&fuits5%
Other4%
1987-93
Cereals 62%
Pulses5%
Sugar9%
Vegetable Oils8%
Milk 5%
Meat/Egg/Fish1%
Vegtables&fuits5%
Other5%
1994-99
xvii

Cereals 61%
Pulses5%
Sugar9%
Vegetable Oils8%
Milk 4%
Meat/Egg/Fish1%
Vegtables&fuits6%
Other6%
2000-04
Cereals 58%
Pulses5%
Sugar9%
Vegetable Oils9%
Milk 5%
Meat/Egg/Fish1%
Vegtables&fuits7%
Other6%
2005-10
Protein Intake Trend
Intake of protein, the most important body building nutrient, in the Indian diet has registered a marginal increase during the study period to around 56 grams per day. As in the case of calories, the decline in protein intake from vegetable sources was mostly offset by increase from animal sources.
xviii

Figure II. M. Trends in Per Capita Protein Intake by Animal and Vegetable Sources: Grams/day
1987-93 1994-99 2000-04 2005-100.0
10.0
20.0
30.0
40.0
50.0
60.0
TREND IN PROTEIN INTAKE - VEGETABLE VS. ANIMAL PRODUCTS
GR
AM
S/D
AY
Analyzing protein intake by food items, contribution from cereals and pulses declined by 7 percent each to 32 and 6.6 grams respectively whereas protein from milk, meat/fish/eggs, and fruits/vegetables increased by 24 percent, 26 per cent, and 29 percent respectively to 6.7, 3.9, and 3.1 per cent respectively.
Figure II. N. Trends in Per Capita Protein Intake by Type of Food: Grams/day
1987-93 1994-99 2000-04 2005-100.0
10.0
20.0
30.0
40.0
50.0
60.0PROTEIN INTAKE BY TYPE OF FOOD
GR
AM
S/D
AY
xix

The relative contribution of various food items (%) in total protein intake during the study period is shown in the following diagrams.
Figure II. O. Trends in the Composition of Protein Intake by Type of Food: % of Protein
Cereals 62.59%Pulses
12.96%
Sugar0.34%
Milk 9.85%
Meat/Egg/Fish5.63%
Vegtables&fuits4.30% Other
4.33%
1987-93
Cereals 60.07%
Pulses12.26%
Sugar0.33%
Milk 10.90%
Meat/Egg/Fish6.11%
Vegtables&fuits4.70%
Other5.63%
1994-99
xx

Cereals 59.44%
Pulses11.50%
Sugar0.18%
Milk 11.10%
Meat/Egg/Fish6.32%
Vegtables&fuits5.18%
Other6.28%
2000-04
Cereals 57.04%
Pulses11.83%
Sugar0.14%
Milk 11.97%
Meat/Egg/Fish6.91%
Vegtables&fuits5.59%
Other6.52%
2005-10
India lags Behind Major Countries in Food Nutrient Intake
In an effort to gauge where India stands in its food nutrient consumption level in the global context, an attempt is made to compare the food nutrient consumption pattern in India with that of China and the United States. Although these two countries are in different growth trajectories vis-a-vis India, the comparison would be helpful in knowing where India’s food requirement is headed in coming years if the high economic growth continues. The FAO Food Balance Sheet data is used for the analysis.
xxi
The following Charts depict the calorie, protein and fat consumption trends in India, China, and the United States. As can be observed, the current intake of calorie, protein and fat in India is significantly below that of China and the United States.
Figure II. P. Per Capita Nutrient Intake in India, China and US
1991
1992
1993
1994
1995
1996
1997
1998
1999
2000
2001
2002
2003
2004
2005
2006
2007
2008
2009
0
500
1000
1500
2000
2500
3000
3500
4000
4500Calorie Consumption Trend in India, China and the U.S.
India China USA
K.C
alor
ies?
Day
1991
1992
1993
1994
1995
1996
1997
1998
1999
2000
2001
2002
2003
2004
2005
2006
2007
2008
2009
0.0
20.0
40.0
60.0
80.0
100.0
120.0
140.0
Protein Consumption Trend in India, China and the U.S.
India China USA
Gra
ms?
Day
xxii
1991
1992
1993
1994
1995
1996
1997
1998
1999
2000
2001
2002
2003
2004
2005
2006
2007
2008
2009
0.0
20.0
40.0
60.0
80.0
100.0
120.0
140.0
160.0
180.0Fat Consumption Trend in India, China and the U.S
India China USA
Gra
ms/
Day
Calorie intake level in the United States appears to have stabilized at around 3,700 K. Calorie per day whereas in China, it is approaching this level. India’s calorie consumption currently is only about 63 per cent of the United States and 77 per cent of China.
India’s average daily protein intake has remained static over the past two decades at around 57 grams. Although the protein intake in China was close to that of India in early nineties, it has shown a steady upward trend reaching 94 grams in 2009, approaching the U.S. level of around 115 grams.
Per capita fat intake in India, although showing an upward trend reaching around 57 grams per day in recent years, lags significantly below the U.S. intake of around 115 grams and Chinese intake of 95 grams. While most of the fat intake in China and the U.S. is from animal sources, in India the fat intake is predominantly from protein sources.
Conclusion and Policy Implication
Indian government is striving to provide food security to all its citizens through various policies and programs. The recently enacted National Food Security Act is the most important one in this direction, which aims to give adequate quantities of cheap cereals (predominantly wheat and rice) to the most vulnerable segment of rural and urban population. Although this effort is laudable, food strategies must not merely be directed at ensuring just food security for all, but must also address providing adequate quantities nutritious, safe and good quality foods which could address the makeup of a healthy diet.
The present study shows that despite rapid economic growth during the past decades, India’s average per capita calorie and protein intake has grown only modestly, although the per capita fat consumption has registered a higher growth. Calorie and protein source in the
xxiii

Indian diet is diversifying with fruit/vegetable and animal-based food share increasing and cereal and pulses declining. The implication is that the implementation of the cereal-based National Food Security Act will have only a limited impact in achieving the goal of providing nutritional security to the vulnerable section of the population. There is need to include higher protein food such as pulses or protein-enriched cereals or cereal flours in the program. It is worth mentioning that at present India is exporting a major share of its high protein soybean meal while the country is facing a protein-deficiency. Technology to incorporate soybean products in the diet should be encouraged.
Despite large imports, the overall decline in per capita pulse consumption is also of concern. There is need to increase pulse production in the country as international availability of pulses is limited.
With the rising level of income, per capita fat consumption is growing rapidly and the share of vegetable oil in the overall calorie intake is increasing necessitating large imports. Unless domestic production increases the import requirement will continue to grow with rising per capita income.
India’s per capita calorie, protein, and fat consumption remains significantly below that of more developed countries such as China and the United States. The implication is that in coming years with rising per capita income and urbanization, India’s demand for various superior food products will continue to increase necessitating a possible change in the food production system and agricultural trade. The implications for the predominant small and marginal farmers could be serious, unless there are incentives and policies that allow them to shift from subsistence agriculture and become more integrated in the global food market4. Deliberations on the potential of the food and agriculture sector to meet the demands and challenges posed by this analysis and its implications for all components in the food chain would be useful.
4Prabhu Pingali and Yasmeen Khwaja - Globalisation of Indian Diets and the Transformation of Food Supply Systems( ftp://ftp.fao.org/docrep/fao/007/ae060e/ae060e00.pdf
xxiv

References
1. Prabhu Pingali and Yasmeen Khwaja - Globalisation of Indian Diets and the Transformation of Food Supply Systems. Food and Agriculture Organisation - www.fao.org
2. Food and Agriculture Organisation - www.fao.org3. Central Statistical Organisation - http://mospi.nic.in4. Directorate of Economics and Statistics - http://eands.dacnet.nic.in5. Department of Agriculture and Cooperation - www.agricoop.nic.in6. Commission for Agriculture Costs and Prices - http://cacp.dacnet.nic.in/7. Vijay Paul Sharma, Food Subsidy in India:Trends, Causes and Policy Reform
Options. W.P. No.2012-08-02, August, 2012, Indian Institute of Management, Ahmedabad. http://www.iimahd.ernet.in/assets/snippets/workingpaperpdf/5337679172012-08-02.pdf
xxv