Embed Size (px)
Citation preview

© January 2016 National Fire Protection Association
NFIRS Incident Types
Why aren’t they telling a clearer story?
January 2016 Karyl Kinsey, Austin Fire Department Marty Ahrens, NFPA

ABSTRACT
The U.S. Fire Administration’s (USFA’s) National Fire Incident Reporting System (NFIRS) collects more than 22 million incident reports from 23,000 fire departments in the United States on an annual basis. The purpose of this project was to evaluate issues related to data reliability for a key field in NFIRS, the incident type. Related studies were reviewed and a series of coding exercises testing reliability were conducted by coding narratives from samples of incidents provided by three urban fire departments and comparing the codes with incident types selected by reporting officers. Reliability was generally low at the detailed code level, but showed marked improvements when incident types were grouped into smaller numbers of categories. Both qualitative and quantitative analyses identified several challenges to data reliability, including the length and complexity of code lists and inconsistencies in documentation and coding guidance. Of particular note was the problem of fitting complex, multifaceted situations into a single code list that incorporates multiple attributes. The analysis also noted the lack of codes capturing community risk reduction efforts occurring in the course of emergency responses. Recommended improvements include developing and disseminating clearer coding guidance for common problems identified and making greater use of social science expertise when designing future versions of NFIRS. Of key importance is the need to understand better how firefighters categorize incidents at the operational level.
Acknowledgements
We are grateful to the firefighters around the country who prepare NFIRS reports, to the USFA for maintaining the system and trying to address the needs of their diverse constituents, and to state NFIRS program managers who maintain the system at the state level.
We thank the Columbus, Memphis and Austin Fire Departments for sharing their NFIRS data; the Austin Fire Department for use of its facilities and a partial match of Kinsey’s time; the NFPA for funding the project; and our advisory panel for their input, insight, and support.
Advisory Panel Members
Buddy Cantrell Memphis Fire Department Mathew Caserta Columbus Fire Department Gregg Cleveland LaCrosse, WI Fire Department Monica Colby Rapid City, SD Fire Department Derryl Dion Massachusetts Department of Fire Services Edee Edwards National Fire Protection Association Christopher Farrell National Fire Protection Association David Icove University of Tennessee at Knoxville Gayle Kelch United States Fire Administration Joseph Maruca West Barnstable Fire Department Lori Moore-Merrell International Association of Firefighters Phil Oakes NASFM Foundation / Narva and Associates Aimee Roundtree Texas State University For more information about the National Fire Protection Association, visit www.nfpa.org or call 617-770-3000. To learn more about the One-Stop Data Shop go to www.nfpa.org/osds or call 617-984-7451. Copies of this analysis are available from: National Fire Protection Association One-Stop Data Shop 1 Batterymarch Park Quincy, MA 02169-7471 www.nfpa.org E-mail: [email protected] Phone: 617-984-7451
NFPA No. USS24

NFIRS Incident Types, 1/16 i NFPA, Fire Analysis & Research Division, Quincy, MA
Executive Summary
NFIRS provides detailed information to help us understand the fire problem and describe the wide range of other fire department responses. The National Fire Incident Reporting System (NFIRS) is the source of much of what we know about the U.S. fire experience. Under the umbrella of the U.S. Fire Administration’s National Fire Data Center, NFIRS allows fire departments around the country to use a standard system to describe their responses. It provides valuable information about fire department responses of all types and fire causes and circumstances. Many say the system has grown too complex and unwieldy. Many concerns have been raised about data quality. There is clearly room and need for improvement.
Little work has been done assessing NFIRS data reliability, the consistency of coding similar incidents the same way. This study explores reliability issues for one data element in the NFIRS report, the three-digit incident type. Many of the general findings are likely applicable to other data elements in NFIRS. The larger goal was to suggest short- and long-term avenues for improvement.
Incident type is a key data element in NFIRS. Incident type is defined as “the actual situation that emergency personnel found on the scene when they arrived.” Not only does it describe the type of situation encountered, it also determines what data modules will be required, and consequently, what additional information will be collected. The authors coded samples of non-EMS, non-rescue incident narratives from three urban fire departments, comparing their choices of incident type with each other and with those chosen by reporting officers. Supporting NFIRS documentation, other studies related to NFIRS, and related social science literatures were also reviewed.
The number of incident type codes more than tripled from Version 4.1 to the current Version 5.0 of NFIRS. The number of incident type codes increased 240%, from 52 in Version 4.1 of NFIRS to 177 in NFIRS 5.0. This was due to both a decision to make NFIRS an “all incident” reporting system and the desire for more detailed breakdowns of prior code types. For example, the number of codes for hostile fires increased from nine generic categories to 41 across versions, an increase of 356%. The increase in incident types created new challenges to obtaining consistent classifications of incidents.
In practice, the size of the “working” coding scheme for non-EMS/rescue incidents appears much smaller than the full coding scheme. Excluding emergency medical services (EMS) and rescue calls, in all three cities about three-fourths of incidents were coded using just 15 (10%) of the 149 incident types codes studied. Nationally, 15 incident types accounted for 59% of these 149. The bottom 60% of codes (88-89 codes, depending on ties) accounted for only 2% of non-EMS, non-rescue incidents reported in the three study cities, and 6% nationally.
What is a fire? Incident type instructions do not include a clear definition of fire. The NFIRS Coding Questions Manual specifies “actual flame damage” as the key criterion for defining exposure fires, which are situations where fires cause other fires in nearby properties. The NFIRS 5.0 Complete Reference Guide (CRG), in contrast, makes no mention of flames as a criterion for classifying fire incident types in the 100 series.
The CRG also gives mixed messages on the timing dimension. The CRG states the incident type “is the actual situation that emergency personnel found on the scene when they arrived,” then on the

NFIRS Incident Types, 1/16 ii NFPA, Fire Analysis & Research Division, Quincy, MA
following page states the 100 Fire series “includes fire out on arrival.” It can be argued that a fire out on arrival from an operational perspective would not be construed as a fire situation.
In each city, about one-third of incidents that reported “investigate fire out on arrival” as an action taken were not classified as a fire in the incident type field. In the narratives studied, the coding boundary between fires and non-fires seemed especially ambiguous and inconsistently applied for incidents involving smoke, smoldering, or scorched materials. For example, incidents coded as confined cooking fires often describe smoke conditions without mentioning if flames were involved. Conversely, we found incidents coded in the 650 (smoke scares) and 740s (unintentional activations of fire protection equipment) series where fire extinguishers were deployed before fire department arrival, suggesting the earlier presence of flames.
To study this further, we examined the incident type codes for all incidents reporting code 87 ‘Investigate fire out on arrival’ in any of the “Actions Taken” fields. Across the three cities, around one-third of the “out on arrival” calls were not classified as fires, but as other kinds of incidents, including electrical hazards, smoke-related good intent calls, or false alarms.
Critical language is sometimes missing from the data dictionary. Long lists increase the amount of time and effort needed to find the most appropriate code. Traditionally, NFIRS has relied on the category labels on code lists to guide users to the proper code. In today’s world of text searches, that system is less effective. For example, incident type 118 ‘Trash or rubbish fire, contained’ is grouped with other codes under the category “Structure Fires,” but the NFIRS data dictionary lists the 118 code as ‘Trash or rubbish fire, contained’ without qualifying that it applies only to fires inside structures. The verbal specification that code 118 applies to a structure fires appears only in the CRG, a coding manual that is not easily searchable. Not surprisingly, code 118 appears to often be applied to outside trash fires that should be coded in the 150 series. NFPA analyses find more than one-third of the fires with this code were described as having occurred on outside or special properties.
Another example of mismatched language between the data dictionary and CRG instructions occurs for carbon monoxide incidents. According to the CRG, incident type code 424 is defined as ‘Carbon monoxide incident. Excludes incidents with nothing found (736 or 746).’ The data dictionary simply defines 424 as “carbon monoxide incident.” A number of other examples are cited in the report.
It can be hard to find the right code for common events. Burned food is a very common scenario. Our analysis found such incidents coded as building fires (111), confined cooking fires (113), excessive heat, overheat scorch burns with no ignition (251), unauthorized burning (561), smoke scare or odor of smoke (651, smoke from a barbecue or tar kettle (653), and as a trigger of fire protection systems, particularly those in the unintentional activation series (740s).
Vehicle crashes were also an issue. In one city, we were able to examine a sample of incidents in the 300 EMS/rescue series that did not involve any patient contact. For many collisions, no patients were encountered and units stayed on scene to clear debris, clean up spills, or see to traffic control, all actions that enhance safety and serve a prevention purpose. Many were coded as incident type 324 ‘Motor vehicle accident with no injuries,’ which is consistent with both the USFA rule to choose the first code that applies to the situation and the dispatched call type. While the 324 code is not inaccurate, it does not capture the risk management services fire crews routinely provide that protect both the public and emergency services personnel. The debris cleanup function was captured by incident type code 463 ‘Vehicle accident, general cleanup.’ The 463 code was also used for
NFIRS Incident Types, 1/16 iii NFPA, Fire Analysis & Research Division, Quincy, MA
references to “fluid” or “spill” cleanup, terms used more often in vehicle accident narratives than the more specific terms (oil vs. gasoline) listed in the 410 series codes for combustible/flammable spills and leaks.
Several other examples are documented in the report.
NFIRS false alarm codes are among the most challenging to apply. An Executive Fire Officer research report (Krueger, 2010) found much lower agreement in the coding of a false alarm incident than the comparison EMS and cooking fire incidents. Multiple false alarms codes were chosen, none of which was used by more than a third of firefighters coding the incident. An analysis of unwanted alarms in Rapid City, SD Fire Department (Colby, 2015) found similar inconsistencies with the false alarm codes. Much of the detail in false alarm codes focus on identifying the type of alarm system involved, but the codes omit medical monitoring systems.
In order to provide an accurate coding of the 23 false alarm codes at the three digit level, the reporting officer must obtain information regarding the type of equipment involved, the cause of the alarm, and in the case of malicious alarms, human motivation and the method by which the fire department was notified of the alarm. Although not included in the false alarm category, other incident types, such as smoke scares and calls cancelled enroute, are often false alarms as well, but not classified as such. Firefighters in one of the cities in this study seemed to be using ‘False alarm, false call, other’ as a generic code for situations where the fire department was not needed, regardless of whether a fire protection system had been activated.
Increased training and quality control are frequently recommended to improve data quality, but those alone cannot resolve problems involving poorly designed code lists. One research methods textbook notes that when similar events can be classified in two or more categories of the same field, “this gives rise to inter-coder disagreements that augmented training will not resolve” (Crano et al., 2014, p. 272). A risk exists that different jurisdictions may resolve ambiguities by developing their own coding rules. Although not a focus of this project, some of the patterns observed suggest of different local coding rules that may enhance the consistency of coding within departments, but decrease coding consistency across departments.
The key task NFIRS requires from fire personnel preparing reports is the categorization of events they have experienced into a structured data collection instrument. Before the details of an event can be recorded in the reporting system, they must be:
Perceived Categorized Stored in memory Retrieved from memory Matched to the categories available in the data collection instrument
Categorization actually begins when the call is first reported. Designing NFIRS categories using the language firefighters use on the scene would aid recall of incident details and improve the quality of the incident reports.
Even the authors, with years of NFIRS experience, frequently assigned different incident types to incident narratives coded. In our study, agreement between the authors and with the reporting

NFIRS Incident Types, 1/16 iv NFPA, Fire Analysis & Research Division, Quincy, MA
fire officer was higher at the most general (first digit) category level and much lower at the most detailed coding level (all three digits). In most cases, we could not conclusively identify whose code was most appropriate. Reporting officers have far more information about the incident than we could glean from the narrative, so their codes could be more valid due to situational details we did not know. On the other hand, our codes were based on a close reading of and frequent reference to CRG coding rules and would be less affected by local and individual variations in coding practices. In some cases, it was clear that a focus on different aspects of the same incident would result in different code choices.
While many of our recommendations are specific to NFIRS, they also apply to other data collection activities.
1. Incorporate techniques from social science measurement designed to improve data accuracy. Social science tells us that long lists of choices reduce accuracy, too many choices can lead to overload and decision paralysis, and that smaller numbers of broad categories are more effective. Future data collection systems should incorporate these and related findings.
2. Ensure that the underlying objective of the data element is clear and consistent. Measure one concept at a time; avoid double-barreled codes that combine more than one attribute into a single coding choice. Simplify code choices, which may involve starting with general questions and collecting more detail, when appropriate, with more specific questions depending on the answer chosen.
3. Ensure consistency between abbreviated definitions used in pull-down menus and coding manual definitions.
4. Clarify ambiguous incident type definitions. With input from the fire service, create new codes or provide clear guidance about how to code common scenarios that could fit multiple codes or don’t fit anywhere. Write code definitions in language that firefighters typically use. Avoid archaic or overly technical language.
5. Reduce the number of choices seen initially. 6. Consider reorganizing incident type codes in terms of operational categories of problems
encountered at the scene instead of analytic categories. 7. Group explosions with fires. 8. Increase the online accessibility of coding instructions and coding questions. Include the
ability to filter and do wildcard searches to find all the applicable codes relevant to a topic. 9. Thoroughly test any new coding scheme. This should include a review of narratives from a
variety of departments and analysis of data. Special attention should be paid to regional differences in terminology.
10. Numeric codes for non-specific “other” codes should end in nine instead of zero to ensure that specific code choices are seen before those with less specificity when sorted.
In summary, we found numerous issues with the incident type, just one of many data elements in NFIRS. All of the other data elements in NFIRS, especially those with long code lists, should be rigorously reviewed
Despite its imperfections, NFIRS remains the largest and most comprehensive fire incident database in the world. NFPA is frequently approached by researchers from other countries seeking NFIRS-based analyses to inform their own projects. Many of the difficulties in NFIRS resulted from attempts to satisfy diverse user requests and the desire to make analysis easier at the local level.

NFIRS Incident Types, 1/16 v NFPA, Fire Analysis & Research Division, Quincy, MA
We believe that NFIRS can and must be improved. It is reassuring that many findings from NFIRS analyses seem consistent with the lived experience of those in the field. But that is not enough, given the gulf between the information needed and the data available. This analysis was done with gratitude for all we have learned from NFIRS and in the hope to contribute to a stronger National Fire Incident Reporting System in the future.
NFIRS Incident Types, 1/16 vi NFPA, Fire Analysis & Research Division, Quincy, MA
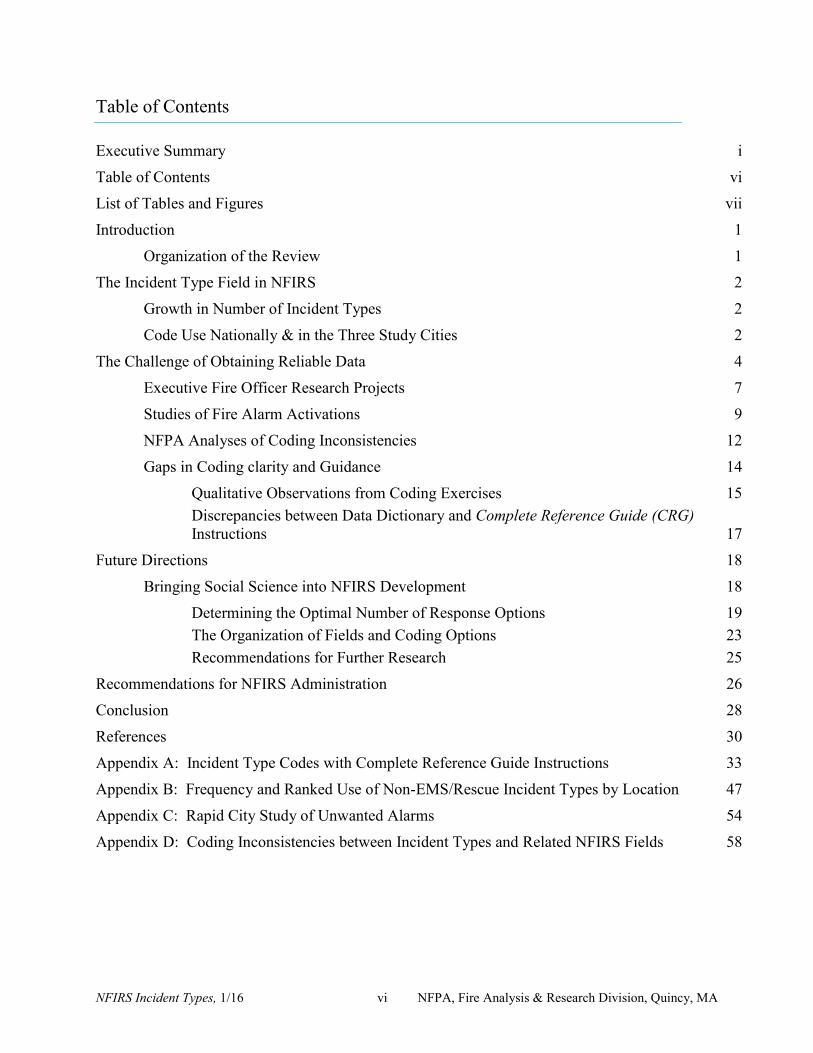
Table of Contents
Executive Summary i Table of Contents vi List of Tables and Figures vii Introduction 1 Organization of the Review 1 The Incident Type Field in NFIRS 2
Growth in Number of Incident Types 2 Code Use Nationally & in the Three Study Cities 2
The Challenge of Obtaining Reliable Data 4 Executive Fire Officer Research Projects 7 Studies of Fire Alarm Activations 9 NFPA Analyses of Coding Inconsistencies 12
Gaps in Coding clarity and Guidance 14 Qualitative Observations from Coding Exercises 15
Discrepancies between Data Dictionary and Complete Reference Guide (CRG) Instructions 17
Future Directions 18 Bringing Social Science into NFIRS Development 18
Determining the Optimal Number of Response Options 19 The Organization of Fields and Coding Options 23 Recommendations for Further Research 25
Recommendations for NFIRS Administration 26 Conclusion 28 References 30 Appendix A: Incident Type Codes with Complete Reference Guide Instructions 33 Appendix B: Frequency and Ranked Use of Non-EMS/Rescue Incident Types by Location 47 Appendix C: Rapid City Study of Unwanted Alarms 54 Appendix D: Coding Inconsistencies between Incident Types and Related NFIRS Fields 58
NFIRS Incident Types, 1/16 vii NFPA, Fire Analysis & Research Division, Quincy, MA
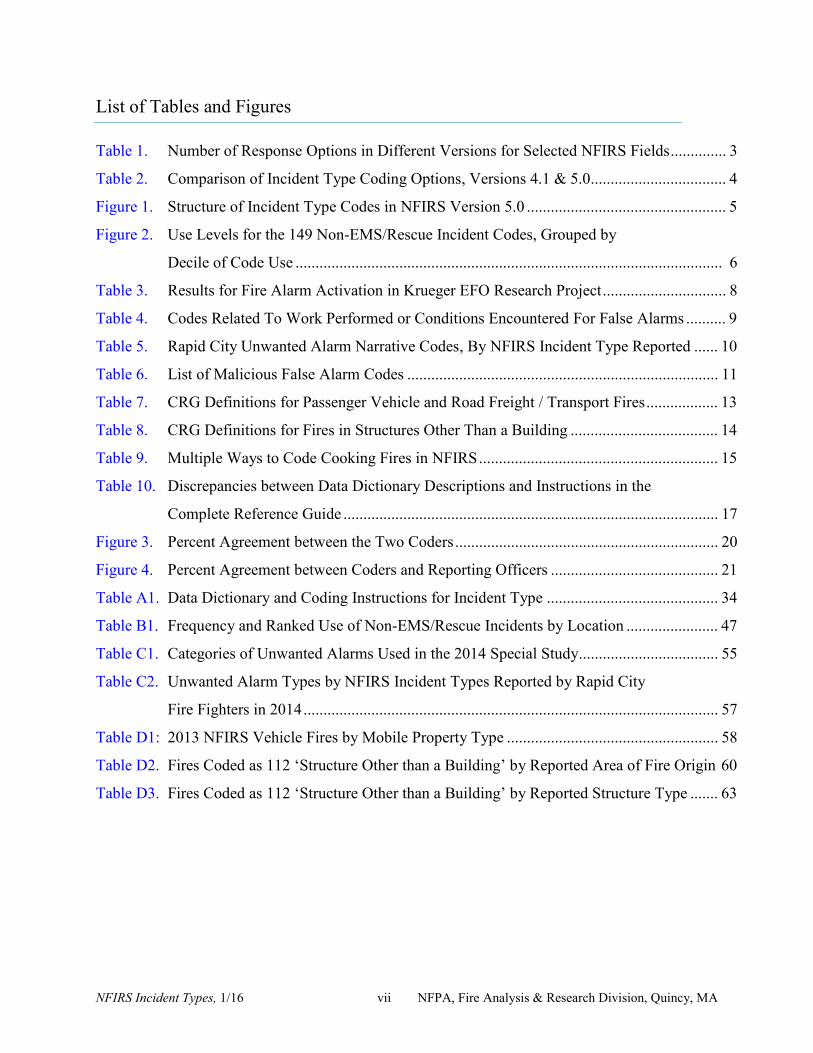
List of Tables and Figures
Table 1. Number of Response Options in Different Versions for Selected NFIRS Fields .............. 3
Table 2. Comparison of Incident Type Coding Options, Versions 4.1 & 5.0.................................. 4
Figure 1. Structure of Incident Type Codes in NFIRS Version 5.0 .................................................. 5
Figure 2. Use Levels for the 149 Non-EMS/Rescue Incident Codes, Grouped by
Decile of Code Use ........................................................................................................... 6
Table 3. Results for Fire Alarm Activation in Krueger EFO Research Project ............................... 8
Table 4. Codes Related To Work Performed or Conditions Encountered For False Alarms .......... 9
Table 5. Rapid City Unwanted Alarm Narrative Codes, By NFIRS Incident Type Reported ...... 10
Table 6. List of Malicious False Alarm Codes .............................................................................. 11
Table 7. CRG Definitions for Passenger Vehicle and Road Freight / Transport Fires .................. 13
Table 8. CRG Definitions for Fires in Structures Other Than a Building ..................................... 14
Table 9. Multiple Ways to Code Cooking Fires in NFIRS ............................................................ 15
Table 10. Discrepancies between Data Dictionary Descriptions and Instructions in the
Complete Reference Guide .............................................................................................. 17
Figure 3. Percent Agreement between the Two Coders .................................................................. 20
Figure 4. Percent Agreement between Coders and Reporting Officers .......................................... 21
Table A1. Data Dictionary and Coding Instructions for Incident Type ........................................... 34
Table B1. Frequency and Ranked Use of Non-EMS/Rescue Incidents by Location ....................... 47
Table C1. Categories of Unwanted Alarms Used in the 2014 Special Study................................... 55
Table C2. Unwanted Alarm Types by NFIRS Incident Types Reported by Rapid City
Fire Fighters in 2014 ........................................................................................................ 57
Table D1: 2013 NFIRS Vehicle Fires by Mobile Property Type ..................................................... 58
Table D2. Fires Coded as 112 ‘Structure Other than a Building’ by Reported Area of Fire Origin 60
Table D3. Fires Coded as 112 ‘Structure Other than a Building’ by Reported Structure Type ....... 63

NFIRS Incident Types, 1/16 1 NFPA, Fire Analysis & Research Division, Quincy, MA
NFIRS Incident Types: Why aren’t they telling a clearer story?
Introduction
The National Fire Incident Reporting System (NFIRS) is the national data collection repository describing incidents responded to by fire departments in the United States. NFIRS grew out of recommendations of the National Commission on Fire Prevention and Control’s 1973 seminal report, America Burning. NFIRS was developed to collect and analyze the types, causes, circumstances and trends associated with the nation’s fire problems. It was also intended to facilitate uniform state and local fire data reporting and analysis.
NFIRS has grown substantially since its creation in 1977. According to the United States Fire Administration (USFA, 2015), about 23,000 fire departments file 22 million reports annually, of which approximately 1 million are fire incidents. Fire incidents reported in NFIRS are estimated to comprise about 75% of all reported fires. NFIRS data, combined with data from fire department experience sample surveys conducted by the National Fire Protection Association (NFPA), constitute the foundational data for many studies of the fire problem in the US. Version 5.0 of NFIRS was expanded with the goal of better quantifying all fire department responses, not just fire responses.
Data quality is an issue. While NFIRS is critical to our understanding of today’s fire problem and the services provided by fire departments, there is a growing consensus among researchers and fire service leaders that aspects of NFIRS are unnecessarily complex and challenging in ways that undermine the quality of data and, ultimately, decisions based on that data (NFPA, 2014). In an effort to understand the contours of NFIRS data quality issues, this report focuses on a single field, the incident type, a field that is both important in its own right and shares structural features with other fields, including a large number of codes and subgroupings of codes by topic headings.
Organization of the review
This review begins with an analytic description of the incident type field in NFIRS 5.0. The analysis focuses on the structure of the field, how it has changed over time, the frequency of specific incident type code use nationally and in the cities contributing data to the study, the conceptual distinctiveness of code categories, and kinds of information reporting officers must attend to at the incident scene and use in order to choose the most appropriate incident type.
Research literature focusing on the reliability of NFIRS reporting is also discussed. Two applied research projects conducted by fire officers as part of the Executive Fire Officer (EFO) Program administered by the National Fire Academy are discussed. Another key resource was Conquering the Unknowns, a 2013 study conducted by public health researchers at Johns Hopkins for the National Association of State Fire Marshals (NASFM) Fire Research and Education Foundation. This study focused on the high number of “undetermined” and missing data in fields used to identify fire causes. Other studies include observations in NFPA analyses
NFIRS Incident Types, 1/16 2 NFPA, Fire Analysis & Research Division, Quincy, MA
of inconsistencies in code usage suggestive of miscodes, as well as field studies utilizing NFIRS narratives to find coding errors.
Research findings from cognitive psychology, survey methods, and decision research that have implications for the design of incident data collection systems are also included. This report does not attempt to provide a comprehensive review of the vast amounts of literature in these areas, but instead summarizes general findings that are well-established and relevant to data reliability. Techniques used by various social science disciplines in developing codes and forms that could be useful in developing and testing potential modifications to NFIRS are also discussed.
This report also incorporate results and observations arising from a series of coding exercises conducted by the authors that focused on coding incident types from NFIRS narratives obtained from three urban fire departments located in different regions of the country. 1 We originally envisioned this project as a study of ‘intra-rater reliability’ that would focus on the consistency between what reporting officers say in their narratives and the incident type reported in NFIRS. We quickly realized that, despite our years of experience with NFIRS, the essential first step of achieving ‘inter-rater reliability,’ agreement between ourselves on which codes apply to the differing situations described in narratives, was itself no easy matter. Observations from the coding exercises document the challenges to applying NFIRS coding categories in a way that yields consistent and reliable information.
The Incident Type Field in NFIRS Incident type may be the most important data element in NFIRS. The incident type field, required in every incident report, is an especially important field for fire research and analysis. It is one of the mostly widely used fields in NFIRS, forming the basis for estimates of the extent of the fire problem in the U.S. and utilized by many fire departments to monitor and report the number and types of emergency responses made in their communities. It is also a key gatekeeping field; the incident type chosen determines which modules of NFIRS must be completed in order to submit a valid report accepted at the national level.
Growth in the number of incident types
The number of incident type choices more than tripled from Version 4.1 to 5.0. A key feature of the incident type field is the growth over time in the number of incident type categories in the coding scheme. Table 1 compares the number of coding options in the previous and current versions for both the incident type field and several other key categorical fields. Between versions 4.1 and 5.0, the number of incident types grew from 52 to 177 codes. Two other fields that also saw significant growth were the actions taken fields and equipment 1 We requested one year of data for the 149 codes in the incident type field that fall outside the EMS/Rescue category (300 series). The data request to two departments was limited to non-EMS/Rescue incident to avoid inadvertent exposure to patient identifiers or protected health information that might appear in narratives. A subset of EMS/Rescue incidents with no patient contact was analyzed for one department where one of the investigators could pre-screen and edit out identifiers.

NFIRS Incident Types, 1/16 3 NFPA, Fire Analysis & Research Division, Quincy, MA
involved in ignitions. In contrast, other fields tended to remain level or even decrease in the number of coding options.
Table 1. Number of Response Options in Different Versions for Selected NFIRS Fields
Field Names: # of Coding Options
In Version 4.1 In Version 5.0 Version 4.1 Version 5.0 % Change Type of situation found Incident type 52 177 240% Type of action taken Action Taken 10 66 560%
Equipment involved in ignition Equipment involved in ignition 80 286 258%
Fixed property use * Property use 549 153 -72% Area of fire origin Area of fire origin 82 84 2% Form of material ignited / generating most smoke Item first ignited 71 78 10%
Form of heat of ignition ** Heat source 67 40 -40%
Ignition factor *** Factor contributing to ignition 57 54 -5%
FF activity at time of injury FF activity at time of injury 79 70 -11%
Mobile property type Mobile property type 63 57 -10% Primary apparent symptom Primary apparent symptom 73 57 -22% Type of material ignited/ generating most smoke
Type of material first ignited 75 56 -25%
* Many details formerly in property use were moved to the On-site materials field. ** Some of the codes were moved to the equipment power source field. *** A few codes were moved into the cause of ignition field. Source: Data dictionaries for NFIRS 4.1 and NFIRS 5.0. Table 2 focuses more closely on changes in the incident type field. Between versions 4.1 and 5.0, the number of coding choices increased substantially in all the major categories of incidents (usually referred to as ‘100 series,’ 200 series,’ etc.) based on the first digit of the 3-digit numeric codes). Appendix A contains a complete listing of the incident type codes from the NFIRS 5.0 data dictionary, along with additional coding instructions from the CRG.
One of the reasons for increasing the number of incident types was to make NFIRS an “all-incident” reporting system, allowing fire departments to better document the complete range of activities they perform. The number of coding options expanded about four-fold in the sections for fires, overpressure/rupture incidents, medical/rescue calls, and false alarms. The number of hazardous condition categories tripled, while the number of codes for service and good intent responses doubled. Most types of explosions, previously grouped with fires, were moved to the overpressure/rupture category.

NFIRS Incident Types, 1/16 4 NFPA, Fire Analysis & Research Division, Quincy, MA
Table 2: Comparison of Incident Type Coding Options in Versions 4.1 & 5.0 of NFIRS
Incident Type / Situation Found Codes Version 4.1 Version 5.0* % change Number of specific codes 52 177 240% By category: 1 - Fire 9 41 356% 2 - Overpressure / rupture 4 16 300% 3 - EMS / rescue 7 29 314% 4 - Hazardous conditions 9 27 200% 5 - Service calls 9 19 111% 6 - Good intent 7 14 100% 7 - False alarm 6 23 283% 8 - Weather / natural disaster 0 6 -- 9 - Special incident type, other 1 2 100% *To maintain comparability, Version 5.0 counts include required modules only (Base, Fire, Structure fire, Civilian casualty, Fire casualty)
NFIRS 5.0 also added the “confined structure fire” incident type codes 113-118 in an effort to simplify coding for common types of fire occurring in non-combustible containers that result in little damage, such as confined cooking fires, chimney or flue fires, fuel burner fires, and compactor or incinerator trash fires, as well as trash fires in or on structures that did not spread to other contents or the structure itself. For incident type 113-118, NFIRS 5.0 requires very little causal information or information about fire detection and suppression systems. Note that other structure fires may be coded with fire spread limited to the object of origin but not have one of the confined fire incident types. NFIRS 5.0 also required very limited information about the causes of outside trash or rubbish fires. Each of the nine general categories of incident types listed in Table 2 is further broken into more detailed subcategories. Figure 1 provides a more detailed display of the coding structure that includes all the subcategories. In the 3-digit numeric codes, the general category is designated by the first digit and the subcategory by the first two digits. Each general category has between one and nine subcategory groupings, resulting in a total of 58 separate subcategories in the entire incident type field.
Code Use Nationally and in the Three Study Cities
The intent of the increase in incident type codes in NFIRS 5.0 was to make more detailed information about specific kinds and types of incidents more easily retrievable via simple reports. However, increasing the number of codes within a single large field, as opposed to utilizing several separate fields to capture the same information, increases the cognitive complexity of the coding task for reporting officers and provides greater room for legitimate differences of opinion regarding which code provides the best description of an incident. The increased effort that long code lists require to search out the best answer may also motivate the taking of short-cuts that increase the speed of finishing reports.

NFIRS Incident Types, 1/16 5 NFPA, Fire Analysis & Research Division, Quincy, MA

NFIRS Incident Types, 1/16 6 NFPA, Fire Analysis & Research Division, Quincy, MA
Some incident types are used often; others very rarely. In the three study cities, and to a lesser degree at the national level, wide variations exist in how often different codes are being utilized to report emergency responses for non-EMS/Rescue incident types. Figure 2 summarizes an analysis where the 149 codes were sorted within each jurisdiction by their frequency of use, then grouped into ten roughly equal-sized groups (deciles) of about fifteen codes each. The percentages in the chart report each decile group’s share of the non-EMS/Rescue incidents in that jurisdiction.
For example, the first bar in Figure 2 shows that the top 15 codes in City A accounted for 77% of the incidents reports provided by that City. The percentages for City B (76%) and City C (79%) are similarly high. However, at the national level, the top 15 codes accounted for a lower share (59%) of the total call volume. On the other end of the spectrum, only 2 percent of all non-EMS/rescue incidents in the study cities, and 6% nationally, utilized any of the large number of codes (nearly 90) grouped into the bottom six deciles of code use. More detailed information on code usage can be found in Appendix B.
To summarize, for each jurisdiction, the size of the “working” coding scheme for non-EMS/rescue incidents appears much smaller than the full coding scheme. While the three urban departments show similar patterns in the relative frequencies of differential code use across deciles, the question remains whether they have the same or different specific codes in the higher deciles as other departments. This will be discussed in more detail later, but the flatter pattern of code usage at the national level points to at least some dissimilarity in the most frequently used codes across jurisdictions.
77%
15%
5% 2% 2%
76%
13%6% 3% 2%
79%
12%5% 3% 2%
59%
19%11%
5% 6%
1st decile(Top 15 codes)
2nd decile(15 codes)
3rd decile(15 codes)
4th decile(15-16 codes)
Bottom 60%(88-89 codes)P
erce
nt
shar
e o
f n
on
-EM
S/R
escu
e in
cid
ents
Decile rank of code use
City A City B City C National
Figure 2. Use Levels for the 149 Non-EMS/Rescue Incident Codes, Grouped by Decile of Code Use.
--A few codes are used often with many used rarely--
Notes: The exact number of codes in a few deciles varies slightly due to tied ranking.National and City A data cover 2013 incidents while City B and City C provided 2014 data.

NFIRS Incident Types, 1/16 7 NFPA, Fire Analysis & Research Division, Quincy, MA
The NASFM report (2013) points to differing characteristics of emergencies in rural, suburban, and urban communities as one potential source of variation in code use; various NFPA reports point to regional variations as well. It makes sense that different regions and departments working in areas with different population densities would experience varying mixes of emergency response demands.
In this study, we focus on a different source of potential variation, examining the NFIRS 5.0 coding scheme for possible ambiguities that could lead to different interpretations and coding decisions, both by individuals when coding incidents and by departments when training coders and conducting quality checks.
The Challenge of Obtaining Reliable Data NASFM study participants reported difficulty finding the “right code.” The NASFM study of fire cause coding reported “code confusion” to be a common concern reported by study participants during qualitative interviews and in an on-line survey. Study participants reported difficulty finding the “right” code, often resulting “in the same incident being reported differently depending on who in the department was inputting the codes, or in the reporter of data “making the fire fit the code,” rather than the other way around” (p. 78).
These observations highlight the challenge of obtaining reliable data. Reliability of measurement is a core concept underlying all forms of data collection and analysis. At its core, reliability focuses on the consistency and repeatability of measurement. Various conceptu-alizations and techniques for evaluating reliability exist, but in the context of NFIRS, reliability means that different reporting officers, when confronted with the same incident and exposed to the same set of facts, would choose the same codes when completing the NFIRS report.
In a widely-used text book on research methods, Crano, et al. (2014) identifies two core causes of poor reliability for categorical coding schemes. One is inadequate training of coders, which they note can be overcome with sufficient training and practice for even highly complex coding schemes (although the amount of resources that training would require should not be underestimated.). More difficult is the problem of non-discriminability among coding categories, that is, response options that are not mutually exclusive. Crano, et al. note that, when similar events can be classified in two or more categories of the same field, “this gives rise to inter-coder disagreements that augmented training will not resolve” (p. 272).
Executive Fire Officer research projects
Several research papers from the Executive Fire Officer Program focus on issues related to NFIRS coding accuracy, including training. In this report, we will describe two studies that focus specifically on interrater reliability. The studies do not calculate reliability coefficients in the way social scientists typically do, but instead focus on the degree of consensus among coders for individual incident scenarios.

NFIRS Incident Types, 1/16 8 NFPA, Fire Analysis & Research Division, Quincy, MA
Rappaport found that something other than the recommended incident type was chosen for two sample types of fires in 11% and 17% of surveys. Rappaport (2012) presented a simple confined cooking fire scenario in an online survey that had been posted on two fire service websites. The results were that 89% of the 155 respondents correctly answered code 113 ‘Cooking fire, confined to container.’ Other codes utilized were 111 ‘Building Fire’ (6%) or 531 ‘Smoke or odor removal’ (4%). Lower levels of consensus were found for a different scenario describing a fully-involved vehicle fire in an attached garage where someone died in the house; 17% coded it as 131 ‘Passenger vehicle fire’ and 83% chose 111 ‘Building fire.’
Krueger’s analysis showed less consistency in incident type choices for false alarms than for EMS or cooking fires. Krueger (2010) conducted perhaps the most thorough EFO study of NFIRS coding in a single department. He selected three actual incidents and compiled all the source data necessary to enter an NFIRS report, then asked the officers occupying the ranks required to file those types of reports to use the source data to enter full NFIRS reports into the department’s NFIRS software. The resulting reports were then downloaded and used to develop a comprehensive listing of reporting variations among officers for every NFIRS field.
Krueger’s data collection process yielded 112 EMS reports, 108 fire alarm reports, and 15 cooking fire reports. Fewer cooking fire reports were generated because the responsibility for preparing fire reports was assigned only to higher ranking officers. Regarding the incident type field, consistency was quite high (>90%) for both the EMS and cooking fire incidents.
In contrast, consensus was, exceptionally low for the fire alarm incident (see Table 3). Eleven different incident type codes were selected by the 108 officers coding the fire alarm case, and no single incident type received a majority of choices. Note that about half of the false alarm codes in the Krueger study were “other” codes ending in zero, which are generally discouraged by the USFA in favor of code choices providing more specific information.
Table 3. Results for Fire Alarm Activation in Krueger’s EFO Research Project
Code Description Number Percent 700 Other false alarm or false call 35 32% 745 Alarm system activation (no fire),
unintentional 28 26% 735 Alarm system activation due to malfunction 19 18% 730 Other system or detector malfunction 13 12% 740 Other unintentional transmission of alarm 6 6% Five other codes (321, 711, 733, 743, 100) 6 5% Left blank 1 1% Total 108 100% Source: Krueger, J. (2010), Appendix J, variable 16

NFIRS Incident Types, 1/16 9 NFPA, Fire Analysis & Research Division, Quincy, MA
Studies of fire alarm activations
The 23 codes devoted to false alarms (listed in Appendix A) are among the most cognitively complex codes in the incident type code list. In order to provide an accurate coding at the three digit level, the reporting officer must obtain information regarding the type of equipment involved, the cause of the alarm, and in the case of malicious alarms, human motivation and the method by which the fire department was notified of the alarm. It is unlikely that all these points of information would be readily available on arrival or would always be communicated to the fire department by the alarm company or property managers.
Forster noted that good intent calls and some service calls could also be false alarms. In an analysis of automatic commercial alarm calls by broad incident type for 2003-2007, Steve Forster of Tualatin Fire and Rescue found that 83% of the calls had a false alarm incident type, 12% were classified as good intent calls, and 3% were service calls. Only 1.5% of calls were considered emergencies with incident types indicating fires or explosions, overpressures, EMS or rescue calls, or hazardous conditions. (Forster, 2012)
“Cancelled enroute” incidents may often have started as a false alarm. While Forster’s study did not include specific call types, Table 4 lists several good intent and service codes that reflect the types of work performed or conditions encountered during false alarm responses. The 500 service series includes tasks such as evacuating water and removing smoke that fire units may perform at the scene of sprinkler or fire alarm activations. Units may investigate and determine specific causes of false alarms reflected in the 650 series of good intent codes. Alarm companies frequently call and cancel responding fire units before arrival. Those types of false alarms effectively become invisible in NFIRS, despite their true status as false alarms, because of the less informative 611 code ‘Dispatched and cancelled enroute.’
Table 4. Codes Related to Work Performed or Conditions Encountered for False Alarms
Series Name NFIRS Data Dictionary Text Service 520 Water problem, other Service 521 Water evacuation Service 531 Smoke or odor removal Good intent 611 Dispatched and canceled enroute Good intent 650 Steam, other gas mistaken for smoke, other Good intent 651 Smoke scare, odor of smoke Good intent 652 Steam, vapor, fog or dust thought to be smoke Good intent 653 Smoke from barbecue, tar kettle
Colby’s analysis of unwanted alarms included confined cooking fires in which no fire department assistance was required. Monica Colby (2015) performed an in-depth analysis of fire alarms in Rapid City, South Dakota, utilizing report narratives to develop and test an alternate coding scheme. Her analysis refocused the concept from “false” to “unwanted” alarms, adding to the mix cooking fires confined to container where no fire department assistance was actually needed.
NFIRS Incident Types, 1/16 10 NFPA, Fire Analysis & Research Division, Quincy, MA
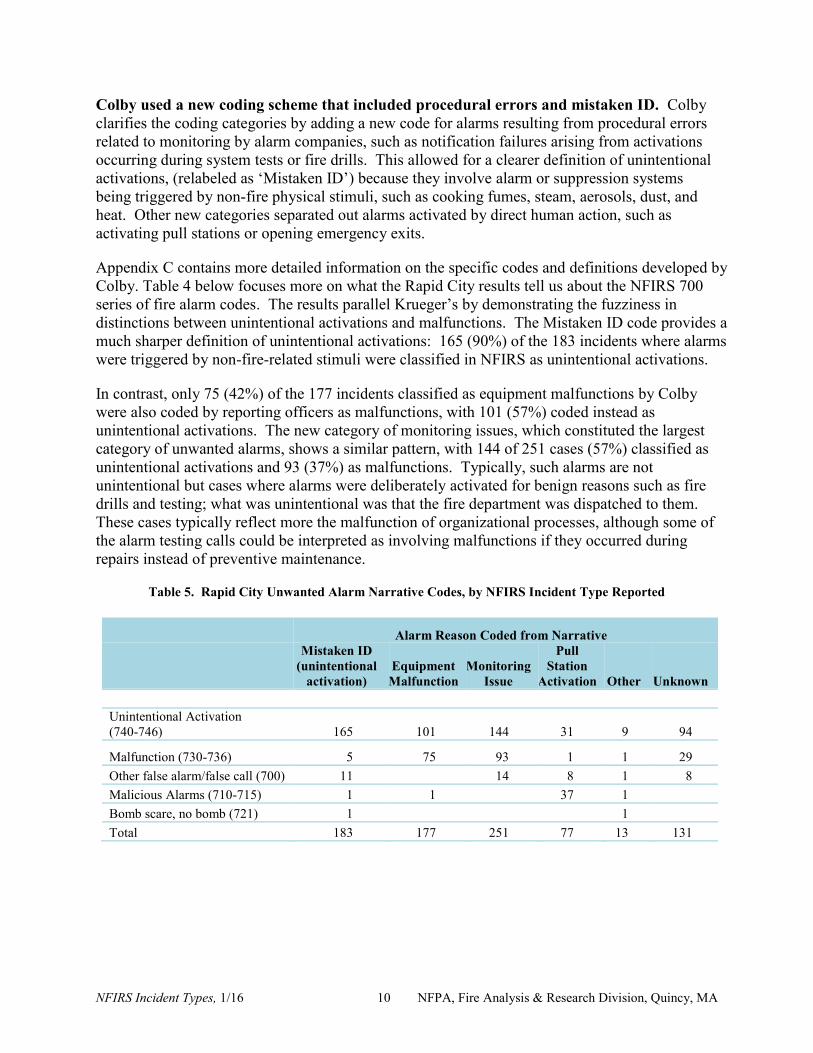
Colby used a new coding scheme that included procedural errors and mistaken ID. Colby clarifies the coding categories by adding a new code for alarms resulting from procedural errors related to monitoring by alarm companies, such as notification failures arising from activations occurring during system tests or fire drills. This allowed for a clearer definition of unintentional activations, (relabeled as ‘Mistaken ID’) because they involve alarm or suppression systems being triggered by non-fire physical stimuli, such as cooking fumes, steam, aerosols, dust, and heat. Other new categories separated out alarms activated by direct human action, such as activating pull stations or opening emergency exits.
Appendix C contains more detailed information on the specific codes and definitions developed by Colby. Table 4 below focuses more on what the Rapid City results tell us about the NFIRS 700 series of fire alarm codes. The results parallel Krueger’s by demonstrating the fuzziness in distinctions between unintentional activations and malfunctions. The Mistaken ID code provides a much sharper definition of unintentional activations: 165 (90%) of the 183 incidents where alarms were triggered by non-fire-related stimuli were classified in NFIRS as unintentional activations.
In contrast, only 75 (42%) of the 177 incidents classified as equipment malfunctions by Colby were also coded by reporting officers as malfunctions, with 101 (57%) coded instead as unintentional activations. The new category of monitoring issues, which constituted the largest category of unwanted alarms, shows a similar pattern, with 144 of 251 cases (57%) classified as unintentional activations and 93 (37%) as malfunctions. Typically, such alarms are not unintentional but cases where alarms were deliberately activated for benign reasons such as fire drills and testing; what was unintentional was that the fire department was dispatched to them. These cases typically reflect more the malfunction of organizational processes, although some of the alarm testing calls could be interpreted as involving malfunctions if they occurred during repairs instead of preventive maintenance.
Table 5. Rapid City Unwanted Alarm Narrative Codes, by NFIRS Incident Type Reported
Alarm Reason Coded from Narrative
Mistaken ID
(unintentional activation)
Equipment Malfunction
Monitoring Issue
Pull Station
Activation Other Unknown Unintentional Activation (740-746) 165 101 144 31 9 94
Malfunction (730-736) 5 75 93 1 1 29 Other false alarm/false call (700) 11 14 8 1 8 Malicious Alarms (710-715) 1 1 37 1 Bomb scare, no bomb (721) 1 1 Total 183 177 251 77 13 131
NFIRS Incident Types, 1/16 11 NFPA, Fire Analysis & Research Division, Quincy, MA
Authors of this report found other problems with the 700 series of codes noted in the course of project development.
“False alarm, false call, other” may be used when the fire department was not needed. In one of the three study departments, it appears that some firefighters are using code 700 ‘False alarm, false call, other’ for many types of incidents in which the fire service was not actually needed, even when the call could fit into a more precise category, such as a good intent call.
Medical alarms do not have a clear incident type. Buddy Cantrell of Memphis notes that
many of their false alarm calls are from medical monitoring systems, yet there is no code for this type of alarm system.
Are suspected bombs “bomb scares”? The CRG seemingly distinguishes between bomb scares (Code 721 ‘Bomb scare - no bomb’) and actual bomb incidents (Code 471 ‘Explosive, bomb removal’). However, CRG instructions for Code 471 state: “Includes disarming, rendering safe, & disposing of bombs or suspected devices. Excludes bomb scare (721)” (emphasis added). The terms ‘suspected device’ seems close to the concept of a bomb scare; its inclusion in the 721 instructions renders the distinction fuzzy.
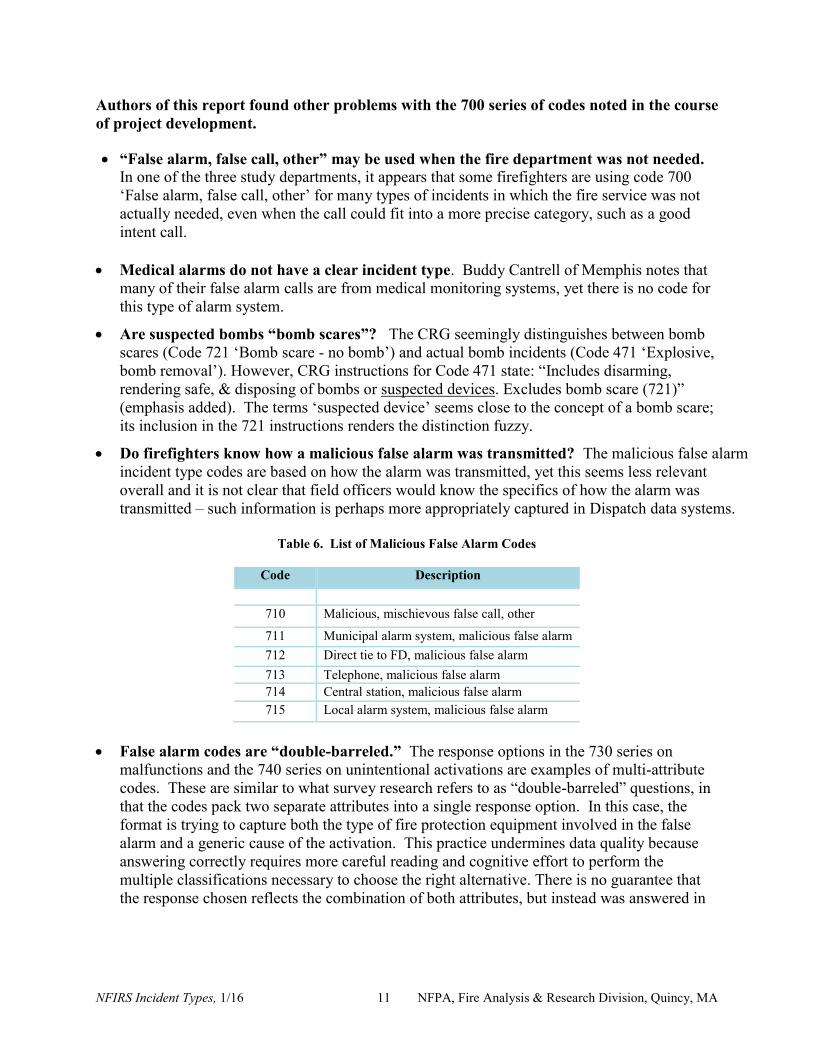
Do firefighters know how a malicious false alarm was transmitted? The malicious false alarm incident type codes are based on how the alarm was transmitted, yet this seems less relevant overall and it is not clear that field officers would know the specifics of how the alarm was transmitted – such information is perhaps more appropriately captured in Dispatch data systems.
Table 6. List of Malicious False Alarm Codes
Code Description
710 Malicious, mischievous false call, other
711 Municipal alarm system, malicious false alarm 712 Direct tie to FD, malicious false alarm 713 Telephone, malicious false alarm 714 Central station, malicious false alarm 715 Local alarm system, malicious false alarm
False alarm codes are “double-barreled.” The response options in the 730 series on
malfunctions and the 740 series on unintentional activations are examples of multi-attribute codes. These are similar to what survey research refers to as “double-barreled” questions, in that the codes pack two separate attributes into a single response option. In this case, the format is trying to capture both the type of fire protection equipment involved in the false alarm and a generic cause of the activation. This practice undermines data quality because answering correctly requires more careful reading and cognitive effort to perform the multiple classifications necessary to choose the right alternative. There is no guarantee that the response chosen reflects the combination of both attributes, but instead was answered in

NFIRS Incident Types, 1/16 12 NFPA, Fire Analysis & Research Division, Quincy, MA
terms of just one of the attributes. This is more likely when reports are being completed hastily or using a satisficing strategy.2
NFPA analyses of coding inconsistencies
It is generally better to measure one thing at a time. The last point about double-barreled questions applies more generally to every NFIRS field with long lists of coding options, because they often try to measure multiple attributes of the incident within a single field. In survey research as well as many other areas of research, the standard approach is to measure one thing at a time. In other words, it is better to measure each attribute of interest separately and then examine the combinations of attributes at the data analysis stage, rather than assume the persons filling out the form will perform all the cognitive steps necessary to report the desired combination of attributes.
Incident type 118-“Trash or rubbish fire, contained” should be used for structure fires, but appears to often be used for outside trash fires. One of the authors of this report, during various studies for the NFPA Fire Analysis and Research Division, has observed recurring coding inconsistencies between incident type codes and other NFIRS fields related to attributes embedded in the incident type code. For example, incident type Code 118 ‘Trash or rubbish fire, contained’ is intended to capture trash fires occurring inside structures, while the 150-155 series is intended to capture trash fires occurring outside of buildings. An NFPA review of 2013 NFIRS data (excluding mutual aid given) found evidence suggesting considerable miscoding of the structural component. More than one-third (37%) of incidents coded with 118 ‘Trash or rubbish fire, contained’ (in the structure fire category) had property use codes indicating they occurred outside or on special properties.
There are three likely factors contributing to the apparently high level of misclassification of outside trash fires as structure fires instead of being coded in the incident type 150-155 series.
The data dictionary lacks critical detail found in the CRG. The NFIRS data dictionary defines the 118 code as ‘Trash or rubbish fire, contained’ without qualifying that it applies only to fires inside structures. The code’s visual placement within the structure fire codes would not be apparent to reporting officers who use text search to find codes instead of drop-down menus. The verbal specification that code 118 applies to structure fires appears only in the NFIRS 5.0 CRG, a coding manual that is not easily searchable. When dropdown lists are present, it seems unlikely that many firefighters would seek additional information about something that appears so straightforward. In this case, the fault lies with the tool, not the firefighter.
Serial position effects are a well-established phenomenon in memory research. (Murdock, 1962). The ability to recall items on a list is better for items positioned at the
2 Satisficing is an alternate to optimizing approaches for making decisions. Optimization is a key assumption of rational choice models of decision-making, while the concept of satisficing originated in bounded rationality approaches that acknowledge limits in time, information, and cognitive resources necessary to achieve optimization (Simon, 1947). Satisficing often involves the use of cognitive heuristics or mental shortcuts, for example, choosing the first acceptable option encountered or the one that comes easiest to mind (Kahneman, 2011).

NFIRS Incident Types, 1/16 13 NFPA, Fire Analysis & Research Division, Quincy, MA
beginning and ends of lists, while recall accuracy is lower for items in the middle. In survey studies, primacy effects (remembering early items better) are more likely to occur for lists presented visually (Krosnick and Presser, 2010). Website studies also find serial position effects in clicking on links (Murphy, Hofacker, and Mizerski, 2006).3
Satisficing strategies result in a “good enough” code choice. Ideally, people filling out forms would try to fill them out as accurately as possible, but there is considerable evidence of ‘satisficing’ behavior where people take shortcuts to reduce the cognitive load and amount of time and effort needed to provide a full report. Survey research finds factors correlated with the use of satisficing strategies are task difficulty, ability, and motivation (Krosnick, 1991).
In addition to trash fires, other examples of data quality or definition issues have been found in NFPA analyses by comparing incident type code choices to data reported in related fields.
Pickup trucks may be coded as passenger vehicles, road freight vehicles, or other vehicle. When mobile property codes are compared to vehicle fire incident types, only 77% of fires involving vehicles described as “pickup trucks or hauling rigs” in the mobile property field are classified as passenger vehicle fires, which the CRG defines to include pickup trucks. The remaining fires are primarily coded as 130 ‘Vehicle fire, other’ (13%) and 132 ‘Road freight or transport vehicle’ (9%). A similar pattern occurs for another mobile property category, ‘12 Bus, school bus, trackless trolley.’ (See Table D1 in Appendix D for more details)
Table 7. CRG Definitions for Passenger Vehicle and Road Freight/Transport Fires
Incident Type Coding Instructions in Complete Reference Guide 131 Passenger vehicle fire Includes any motorized passenger vehicle, other than a motor home
(136) (e.g., pickup trucks, sport utility vehicles, buses). 132 Road freight or transport vehicle fire
Includes commercial freight hauling vehicles & contractor vans or trucks. Examples are moving trucks, plumber vans, & delivery trucks.
This pattern of coding appears to reflect overlapping uses of pickup trucks and buses as passenger vehicles and/or freight transports as well as the tendency to pick the more general code. While pickup trucks are listed as passenger vehicles in the CRG for the incident type field, they are grouped with freight road transports in the Mobile Property Type field. Selecting a vehicle type only by incident type would exclude a substantial portion of relevant incidents.
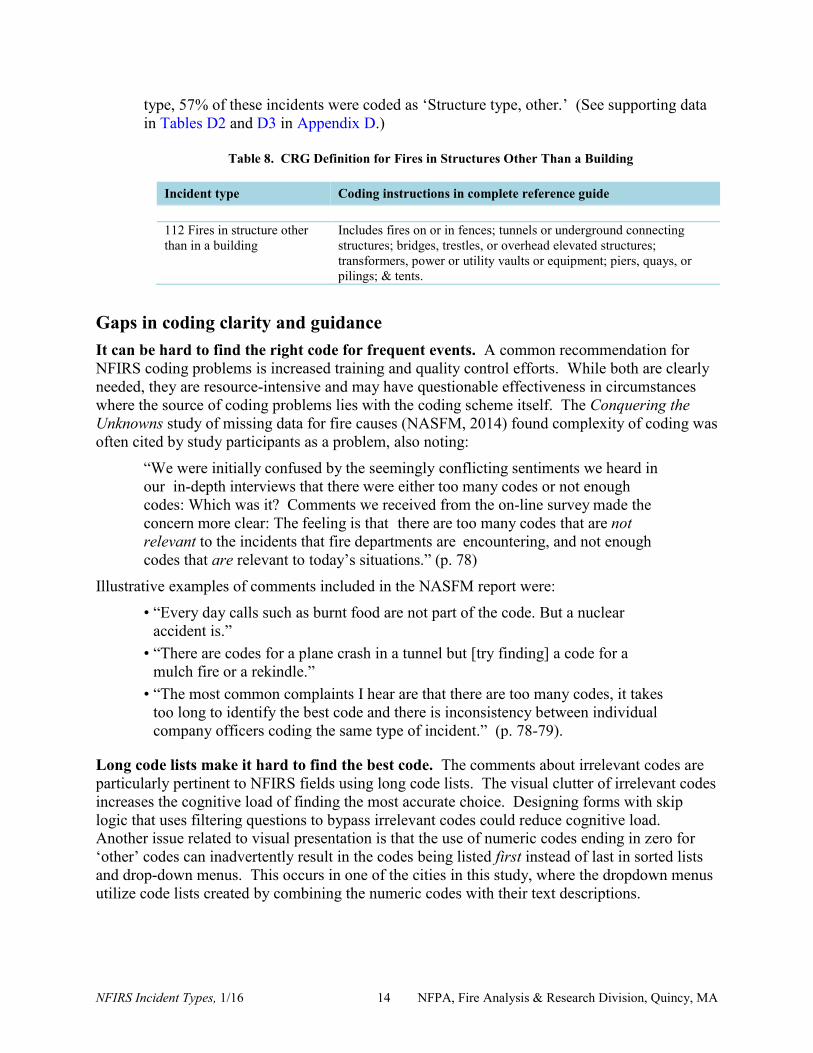
Cases of fires in structures other than a building often look like building fires. Many fires reported as incident type code 112 ‘Fires in structures other than a building’ have areas of origin that suggest the fire actually happened in a normal building. For structure
3 Computer –assisted and web-based survey research tools usually have the capability of randomizing order of presentation in order to reduce the biasing impact of serial position effects.
NFIRS Incident Types, 1/16 14 NFPA, Fire Analysis & Research Division, Quincy, MA
type, 57% of these incidents were coded as ‘Structure type, other.’ (See supporting data in Tables D2 and D3 in Appendix D.)
Table 8. CRG Definition for Fires in Structures Other Than a Building
Incident type Coding instructions in complete reference guide 112 Fires in structure other than in a building
Includes fires on or in fences; tunnels or underground connecting structures; bridges, trestles, or overhead elevated structures; transformers, power or utility vaults or equipment; piers, quays, or pilings; & tents.
Gaps in coding clarity and guidance It can be hard to find the right code for frequent events. A common recommendation for NFIRS coding problems is increased training and quality control efforts. While both are clearly needed, they are resource-intensive and may have questionable effectiveness in circumstances where the source of coding problems lies with the coding scheme itself. The Conquering the Unknowns study of missing data for fire causes (NASFM, 2014) found complexity of coding was often cited by study participants as a problem, also noting:
“We were initially confused by the seemingly conflicting sentiments we heard in our in-depth interviews that there were either too many codes or not enough codes: Which was it? Comments we received from the on-line survey made the concern more clear: The feeling is that there are too many codes that are not relevant to the incidents that fire departments are encountering, and not enough codes that are relevant to today’s situations.” (p. 78)
Illustrative examples of comments included in the NASFM report were: • “Every day calls such as burnt food are not part of the code. But a nuclear
accident is.” • “There are codes for a plane crash in a tunnel but [try finding] a code for a
mulch fire or a rekindle.” • “The most common complaints I hear are that there are too many codes, it takes
too long to identify the best code and there is inconsistency between individual company officers coding the same type of incident.” (p. 78-79).
Long code lists make it hard to find the best code. The comments about irrelevant codes are particularly pertinent to NFIRS fields using long code lists. The visual clutter of irrelevant codes increases the cognitive load of finding the most accurate choice. Designing forms with skip logic that uses filtering questions to bypass irrelevant codes could reduce cognitive load. Another issue related to visual presentation is that the use of numeric codes ending in zero for ‘other’ codes can inadvertently result in the codes being listed first instead of last in sorted lists and drop-down menus. This occurs in one of the cities in this study, where the dropdown menus utilize code lists created by combining the numeric codes with their text descriptions.

NFIRS Incident Types, 1/16 15 NFPA, Fire Analysis & Research Division, Quincy, MA
Qualitative observations from coding exercises
Burned food had many different incident types in reviewed narratives. The burned food comment in the NASFM report is especially compelling to the authors after reading a number of narratives related to this all-too-common situation. While both EFO papers found high consensus on how to code a cooking fire scenario, we observed burned food incidents being coded in multiple ways:
Table 9. Multiple ways to code cooking fires in NFIRS
Attribute Incident Type Code Associated with Attribute As a structure fire 111 Building fire
113 Cooking fire, confined to container As scorched material 251 Excessive heat, overheat scorch burns with no ignition As code enforcement 561 Unauthorized burning As a smoke producer 651 Smoke scare, odor of smoke
653 Smoke from barbecue or tar kettle As a trigger of fire protection systems
741 Sprinkler activation, no fire – unintentional 742 Extinguishing system activation 743 Smoke detector activation, no fire - unintentional 744 Detector activation, no fire – unintentional 4 745 Alarm system activation, no fire - unintentional 740 Unintentional transmission of alarm, other
When action taken was “fire out on arrival,” one-third of the three cities’ incidents were not coded as fires. It was not at all clear what criteria were being used to differentiate between fires and non-fire incidents involving smoking or scorched materials. For example, incidents coded as confined cooking fires often describe smoke conditions without mentioning if flames were involved. Conversely, we found incidents coded in the 650 and 740s series where fire extinguishers had been used before fire department arrival, suggesting these may be more appropriately coded in the 100 series of fires. To examine this further, we examined the incident type codes for all incidents reporting code 87 ‘Investigate fire out on arrival’ in any of the ‘Actions Taken’ fields. For all three cities, about one-third of the fires out on arrival were not classified as fires, but as other kinds of incidents such as electrical hazards, smoke-related good intent calls, or false alarms.
“Work avoidance” is frequently offered as an explanation for instances where fires are coded as non-fires or as confined fires, due to extra effort required completing additional fields in the Fire and Structure Fire modules. We cannot rule out that possibility, but note that fire is a volatile phenomenon and how it gets classified for operational purposes can differ substantially from definitions embedded in NFIRS coding categories. Narratives for incidents that we coded as fires but reporting officers coded as non-fires convey the impression of good-faith efforts to find a code describing the operational situation encountered. Some code choices focus on services 4 We think 744 is intended to refer to heat detectors, based on the otherwise parallel wording of the 730 and 740 series, but the CRG does not actually state this.

NFIRS Incident Types, 1/16 16 NFPA, Fire Analysis & Research Division, Quincy, MA
provided (smoke removal, dealing with fire alarms) while others reflect apparent fire causes, such as wires arcing, vehicle accidents, and flammable spills.
What is a fire? Incident type instructions do not include a clear definition of fires. An implicit definition is embedded at various points of the CRG and the Coding Questions manual that incorporate a physical dimension, a timing dimension, and a control dimension.
To be considered an exposure fire, flame damage must be present. The physicality of flames to defining fires comes across most clearly in the Coding Questions Manual, which points to flame damage as a requirement for filing an exposure fire report; adjacent properties receiving only heat damage, such as melted siding, are not considered an exposure.
The CRG Incident Type instructions make no mention of flames when describing fire incident types in the 100 series. This renders problematic the classification of incident involving burning food or other situations, like electrical hazards, that may generate smoke or scorch marks without obvious signs of flame.
The CRG gives mixed messages on the timing dimension. The CRG states the incident type “is the actual situation that emergency personnel found on the scene when they arrived,” then on the following page states that the 100 Fire series “includes fire out on arrival.” It can be argued that when a fire is already out, the situation found from an operational perspective can be construed not as a fire situation but as a good intent or service call.
Hostile vs. non-hostile fires are not explicitly defined. Control is invoked by the distinction between hostile and non-hostile fires referenced but not defined in the CRG. According to an insurance glossary, a hostile fire is one “that becomes uncontrollable or expands outside its intended boundaries” (IRMI, 2015). The term hostile does not appear in the 100 Fire series; it first appears in the CRG in code 653 ‘Smoke from a barbecue or kettle (no hostile fire),’ followed by a reference to “non-hostile smoke” in instructions for 743 ‘Smoke detector activation (no fire).’ The concept, but not the term, “non-hostile fire” is embedded in codes for unauthorized burns (561), authorized controlled burns (631) and prescribed fires (632).
Clearer instructions for coding fire-related incidents can help clarify ambiguities and reduce misinterpretations. For the next version of NFIRS, a more comprehensive picture of the fire experience could be developed by separating the measurement of whether a fire had occurred at all from questions of what physical state it was in upon arrival (active flame, smoldering, partially extinguished, or completely extinguished) and whether it had ever been uncontrolled or unsupervised.
The concept of potential fire risk is worth considering for incorporating into a future version of NFIRS. A number of narratives described situations where fire crews identified and mitigated conditions that could have potentially generated future fires. One of the authors has in other circumstances read a substantial number of narratives involving confined cooking fires where firefighters forced entry and found occupants sound asleep or intoxicated, conditions strongly associated with fatal fires. These may not be classified as serious incidents in NFIRS, yet clearly involve high risk of escalation that could result in serious injury or death due to the vulnerability of those present.
NFIRS Incident Types, 1/16 17 NFPA, Fire Analysis & Research Division, Quincy, MA
Discrepancies between data dictionary and CRG instructions.
Primary source documents are cumbersome. The two primary source documents for researching coding rules are the CRG and the Coding Questions Manual (CQM) available for download at the USFA website. Both documents have tables of contents and indexes, but are cumbersome for quick look-ups of individual codes. In the course of this project, we have found it useful to create spreadsheet versions of the codes and instructions that can be filtered to narrower groups of codes. One of us has also constructed a spreadsheet of CRG categorical fields to use as a source data file for a business intelligence system that allows quicker navigation and wildcard searches of NFIRS fields.
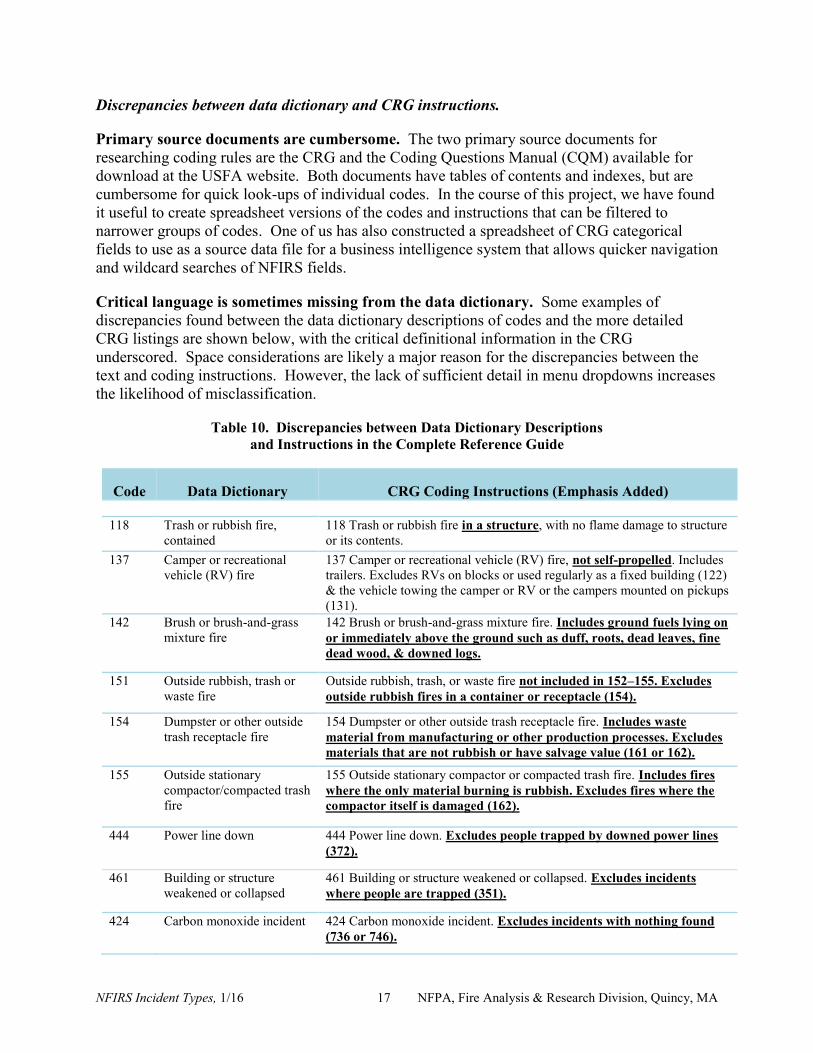
Critical language is sometimes missing from the data dictionary. Some examples of discrepancies found between the data dictionary descriptions of codes and the more detailed CRG listings are shown below, with the critical definitional information in the CRG underscored. Space considerations are likely a major reason for the discrepancies between the text and coding instructions. However, the lack of sufficient detail in menu dropdowns increases the likelihood of misclassification.
Table 10. Discrepancies between Data Dictionary Descriptions and Instructions in the Complete Reference Guide
Code Data Dictionary CRG Coding Instructions (Emphasis Added) 118 Trash or rubbish fire,
contained 118 Trash or rubbish fire in a structure, with no flame damage to structure or its contents.
137 Camper or recreational vehicle (RV) fire
137 Camper or recreational vehicle (RV) fire, not self-propelled. Includes trailers. Excludes RVs on blocks or used regularly as a fixed building (122) & the vehicle towing the camper or RV or the campers mounted on pickups (131).
142 Brush or brush-and-grass mixture fire
142 Brush or brush-and-grass mixture fire. Includes ground fuels lying on or immediately above the ground such as duff, roots, dead leaves, fine dead wood, & downed logs.
151 Outside rubbish, trash or waste fire
Outside rubbish, trash, or waste fire not included in 152–155. Excludes outside rubbish fires in a container or receptacle (154).
154 Dumpster or other outside trash receptacle fire
154 Dumpster or other outside trash receptacle fire. Includes waste material from manufacturing or other production processes. Excludes materials that are not rubbish or have salvage value (161 or 162).
155 Outside stationary compactor/compacted trash fire
155 Outside stationary compactor or compacted trash fire. Includes fires where the only material burning is rubbish. Excludes fires where the compactor itself is damaged (162).
444 Power line down 444 Power line down. Excludes people trapped by downed power lines (372).
461 Building or structure weakened or collapsed
461 Building or structure weakened or collapsed. Excludes incidents where people are trapped (351).
424 Carbon monoxide incident 424 Carbon monoxide incident. Excludes incidents with nothing found (736 or 746).
NFIRS Incident Types, 1/16 18 NFPA, Fire Analysis & Research Division, Quincy, MA
Future Directions The NASFM report identified five key problems and associated recommendations to improve fire cause reporting in NFIRS. Two focus on steps to address organizational barriers and litigation fears that inhibit the reporting of fire causes. The remaining three focused on efforts to improve data quality: educating frontline firefighters about the importance of data collection; encouraging fire departments to develop effective quality control policies and procedures; and redesigning NFIRS to be more user-friendly and to decrease the complexity of reporting. Recommendations for redesigning NFIRS included:
Fewer codes using broader categories combined with optional narrative text fields for details Options for reporting via smart phones and tablets Examples of model reports for different types of incidents Optional interview-style data entry that walks fire personnel through the reporting process Rigorous testing for validity, reliability, and usability.
NFPA’s workshop on Today and Tomorrow’s Fire Data built on NASFM report. In 2014, the NFPA’s Fire Analysis and Research Division, in cooperation with the National Institute of Standards and Technology, sponsored and facilitated a workshop attended by roughly 55 fire researchers and representatives of major fire organizations experienced in the collection and use of fire data. The workshop report Today and Tomorrow’s Fire Data (NFPA, 2014), endorsed the implementation of the strategies identified in the NASFM report and advocated the development of a strategy for long-term maintenance and future updates of NFIRS, envisioning reporting systems that are both adaptable to changing data needs while retaining a core set of data fields for benchmarking.
Bringing social science into NFIRS development
Knowledge from other disciplines should be used to develop future systems. As the fire service moves toward the next version of NFIRS and other data collection efforts, it would be useful to incorporate the insights of social and cognitive scientists when developing new coding schemes. Other areas of official statistics, including epidemiology and criminology, have benefited substantially from the participation of professionals, both inside and outside government, with expertise in social science measurement when developing and testing new codes and forms. This type of expertise apparently was not utilized during the development of NFIRS 5.0 or its predecessors. Instead, the efforts made to satisfy diverse constituents with little background in measurement theory and practice resulted in a system that was more cumbersome and difficult to administer.
For the remainder of this review, we’ve drawn upon general findings from various fields of study and observations from this project to address two general questions:
What is the optimal number of response options for individual fields? How should fields and coding options be grouped?
Determining the optimal number of response options for individual fields
A wide variety of research points to a negative impact of long lists of response options for data accuracy. These include findings from cognitive research, decision research, and research

NFIRS Incident Types, 1/16 19 NFPA, Fire Analysis & Research Division, Quincy, MA
on survey methods, reflecting both the cognitive difficulty of processing longs lists and motivational consequences.
Memory is limited. Miller (1956) described a wide range of studies indicating that working memory has a limited capacity for handling multiple categories. Across studies, the average capacity was seven categories, plus or minus two. Later research indicates the number may be even lower (Cowan, 2001).
Small to intermediate numbers of categories are more effective. Research in survey methodology finds that measurement scales of intermediate length (5 to 7 points) are more reliable (Krosnick & Fabrigar, 1997; Krosnick & Presser, 2010). Crano et al. (2014) also note smaller numbers of categories enhance interrater reliability for categorical fields.
Too many choices can lead to no decision. Research on choice overload in consumer shopping and participation in workplace 401(k) retirement plans finds that having large numbers of options to choose from reduces the likelihood of making any choice at all (Iyengar and Lepper, 2000; Iyengar et al., 2004). This finding is certainly pertinent to the common usage of “undetermined” and “other” code choices in NFIRS.
Reliability improves when choices are grouped by broader categories. Studies of medical diagnostic coding, which typically involve much longer code lists than NFIRS, generally find low levels of interrater reliability. However, they also find that reliability improves when the detailed codes are aggregated into larger, more broadly defined categories (Strausberg, et al. 2008; Wockenfuss, et al., 2009).
As part of this study, we explored different ways of assessing coding consistency of NFIRS incident types. In two of the study cities, both of the project investigators independently coded incident type based on three pieces of information: the narrative, the actions taken codes, and property use. Somewhat different case selection processes were used in each city, but the general process was to randomly select roughly equal numbers of cases from general categories of incidents based on the first digit of the incident type reported to NFIRS. The NFIRS incident type code itself was excluded from the coding spreadsheets and the selected cases were scrambled into a random order to prevent inadvertent guessing of the NFIRS incident type based on location in the file.
Author agreement on incident type decreased as code detail increased. Figure 3 presents the percent agreement between the two coders obtained at three levels of coding. The first, and lowest, bar for each city reports the percent of cases at the most detailed level of coding, the 3-digit level – in other words, it reports coding agreement based on the existing coding scheme of all 149 potential codes for non-EMS/rescue incidents. The second bar shows the percent agreement at the sub-category level, based on the first two digits coded, where in effect the coding scheme has been collapsed into 49 potential codes, while the final bar shows the percent agreement between coders at the general category level with 9 potential codes available.
The results in Figure 3 show similar patterns of coder agreement in both cities. The lowest level of coding agreement occurred at the most detailed coding level. Grouping incidents by the first two digits resulted in a 7-9% increase in coder agreement. Narrowing the comparison to the nine

NFIRS Incident Types, 1/16 20 NFPA, Fire Analysis & Research Division, Quincy, MA
general categories results in percent increases greater than 20% over the detailed three-digit codes.5
How well did our coding of narratives correspond with the NFIRS incident types recorded by reporting officers? Figure 4 reports the results of two approaches for making the comparisons. In the first city, the coders discussed coding disagreements and developed a consensus code for each incident. It was apparent by the time the second city was coded that the use of consensus codes could overshadow instances where one coder agreed with the officer and the other did not. For that city, the analysis focused on comparing the percentages for cases where both coders agreed with the reporting officer with those where at least one coder agreed with the officer.
Data suggest that a branching tree structure would be more effective than a long list. Figure 4 shows a similar pattern as Figure 3 of greater agreement levels when codes are grouped into broader categories. Agreement is consistently lower at the 3-digit level where more incident type choices are available for coding. Movement to the subcategory level of 49 potential codes shows greater agreement between reporting officers and coders, and reduction of the number of
5 Percent agreements can overestimate true reliability due to the possibility of coders agreeing by chance alone. Cohen’s Kappa reliability was also calculated, with results that closely parallel the patterns for percent agreement. For 3-digit codes, the reliability estimate was .65 for the first city and .55 for the second. For 2-digit subcategories the results were .74 and .67 for the two cities and the 1-digit general results were .86 and .79, respectively. Kappa was calculated using SPSS, Version 20.
63%
53%
70%64%
84%77%
1st city coded(131 cases)
2nd city coded(70 cases)
3-digit codes 2-digit subcategory 1-digit general category
Figure 3. Percent Agreement Between Two Coders --Higher when codes were grouped into broader categories--
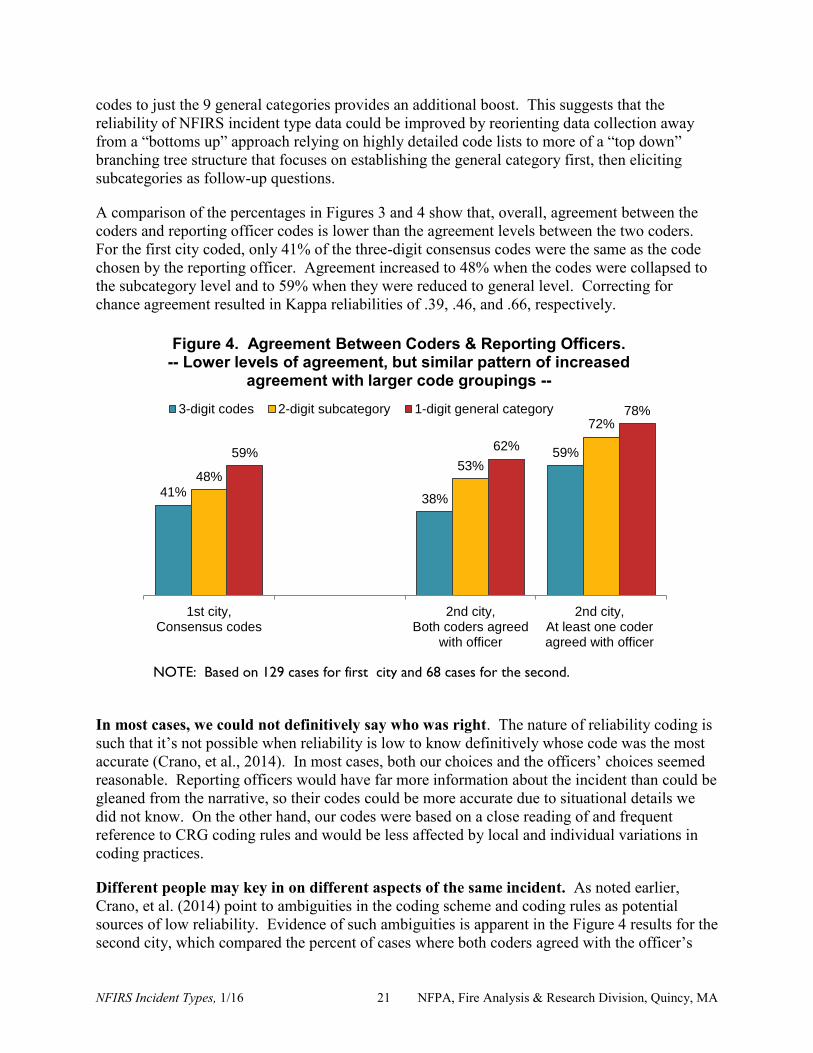
NFIRS Incident Types, 1/16 21 NFPA, Fire Analysis & Research Division, Quincy, MA
codes to just the 9 general categories provides an additional boost. This suggests that the reliability of NFIRS incident type data could be improved by reorienting data collection away from a “bottoms up” approach relying on highly detailed code lists to more of a “top down” branching tree structure that focuses on establishing the general category first, then eliciting subcategories as follow-up questions.
A comparison of the percentages in Figures 3 and 4 show that, overall, agreement between the coders and reporting officer codes is lower than the agreement levels between the two coders. For the first city coded, only 41% of the three-digit consensus codes were the same as the code chosen by the reporting officer. Agreement increased to 48% when the codes were collapsed to the subcategory level and to 59% when they were reduced to general level. Correcting for chance agreement resulted in Kappa reliabilities of .39, .46, and .66, respectively.
In most cases, we could not definitively say who was right. The nature of reliability coding is such that it’s not possible when reliability is low to know definitively whose code was the most accurate (Crano, et al., 2014). In most cases, both our choices and the officers’ choices seemed reasonable. Reporting officers would have far more information about the incident than could be gleaned from the narrative, so their codes could be more accurate due to situational details we did not know. On the other hand, our codes were based on a close reading of and frequent reference to CRG coding rules and would be less affected by local and individual variations in coding practices.
Different people may key in on different aspects of the same incident. As noted earlier, Crano, et al. (2014) point to ambiguities in the coding scheme and coding rules as potential sources of low reliability. Evidence of such ambiguities is apparent in the Figure 4 results for the second city, which compared the percent of cases where both coders agreed with the officer’s
41%38%
59%
48%53%
72%
59%62%
78%
1st city,Consensus codes
2nd city,Both coders agreed
with officer
2nd city,At least one coderagreed with officer
3-digit codes 2-digit subcategory 1-digit general category
Figure 4. Agreement Between Coders & Reporting Officers. -- Lower levels of agreement, but similar pattern of increased
agreement with larger code groupings --
NOTE: Based on 129 cases for first city and 68 cases for the second.
NFIRS Incident Types, 1/16 22 NFPA, Fire Analysis & Research Division, Quincy, MA
code to those where at least one coder agreed. Even though both coders are looking at exactly the same source material, in roughly one-fifth of cases, one coder appears to have keyed on to the same features of the incident as the reporting officer did, while the other coder attended to other features. The observed percentage gap is 21% at the 3-digit level, 19% at the 2-digit subcategory level, and 16% percentage points at the 1-digit general category level.
Further triangulation of coding gaps may be useful in future studies for pinpointing key areas of ambiguity in the coding scheme that need to be addressed. It is beyond the scope of the current project to do so, but we did run into individual cases that illustrated the multiple perspectives that could be applied in classifying incident types. One question that arose several times during our coding was how to classify incidents where the fire crews at the scene were identifying and managing risks not captured in the incident type field. Below is the narrative that first started this line of thinking in both authors as each was separately coding the first round of narratives.
Engine #X arrived at a one story residence with a woman standing outside the structure with her 16 month old child. She stated that she smelled a burning smell in her kitchen, and that she had smelled it while doing laundry in the attached laundry room. Engine #X investigated and found no odor. Engine #X used a thermal imaging camera to check the walls, outlets, and appliances in both the kitchen and laundry room for heat with nothing found. Engine #X then noticed a lot of lint buildup in the dryer. We cleaned the lint out of the dryer's lint trap, and from the exit point outside of the house. Engine #X found the hose from the dryer to the wall was too long and crimped, causing a large amount of lint to build up inside, so Engine #X cut the hose to the proper length and fastened it back in place appropriately. Before leaving, Engine #X recommended the occupant run the dryer on cool to clear out any excess lint dislodged while cleaning
This incident was also one showing a low level of agreement among coders. One of the authors coded the narrative as 651 ‘Smoke scare, odor of smoke, not steam,’ focusing primarily on burning smell reported by the occupant. The other author chose code 251 ‘Excessive heat, overheat scorch burns with no ignition,’ focusing on the risk posed by lint becoming overheated in a dryer. The reporting officer coded the incident as 553 ‘Public Service,’ focusing on the fire prevention service provided to the occupant. The differing weights assigned by coders to physical conditions, assessed risk, and work performed point to different aspects of incident types that bear closer examination in the development of the next NFIRS.
The best code for vehicle crashes is unclear. The prevention issue stretches beyond the fire hazard example described above. In one city, we were able to examine a sample of incidents in the 300 EMS/rescue series that did not involve any patient contact. A common coding issue was observed for vehicle collisions. For many collisions, no patients were encountered and units stayed on scene to clear debris, clean up spills, or see to traffic control, all actions that enhance safety and serve a prevention purpose. Many ended up with an incident type code of 324 ‘Motor vehicle accident with no injuries,’ which is both consistent with the USFA coding rule to choose the first code that applies to the situation and with the dispatched call type.
While the 324 code is not inaccurate, it does not capture the risk management services fire crews routinely provide at vehicle collisions that protect both the public and emergency services personnel. The debris cleanup function was captured by code 463 ‘Vehicle accident, general cleanup.’ The 463 code was also used for references to “fluid” or “spill” cleanup, terms used more often in vehicle accident narratives than the more specific terms (oil vs. gasoline) listed in the 410 series codes for combustible/flammable spills and leaks.

NFIRS Incident Types, 1/16 23 NFPA, Fire Analysis & Research Division, Quincy, MA
We did not find any clear coding choice for traffic control services. Two candidates discussed were 460 ‘Other accident, potential accident’ and 551 ‘Assist police or other governmental agency.’ Given the large number of traffic-incidents responded to by fire departments, and the risks they pose for further harm, an incident type specific to traffic control may be an appropriate addition.
The organization of fields and coding options.
The key task NFIRS requires from fire personnel preparing reports is the categorization of events they have experienced into a structured data collection instrument. The events categorized range from relatively straightforward incidents easily handled by one crew to complex incidents involving multiple subevents, the involvement of large numbers of emergency respondents, the allocation of tasks to different crews or person, and a variety of potential impacts on various members of the public.
Before the details of an event can be recorded in the reporting system, they must be: Perceived Categorized Stored in memory Retrieved from memory Matched to the categories available in the data collection instrument
Categorization actually begins when the call is reported. Note that categorization is listed as the second step in the sequence above, not the last one. Firefighters have already done a considerable degree of categorization before ever starting the NFIRS report. Indeed, the first step of categorization for emergency responses begins in dispatch centers, where call takers work on classifying the problem so that the most appropriate types and amounts of resources will be allocated. This initial classifying is relayed to responding units, who then further refine the classification upon arrival and throughout the call.
One of the foundational facts of cognitive psychology is the limited capacity of working memory, the brain’s interface between sensory input and long-term memory. A key way that our brains get around this limit is to recode, or “chunk,” incoming stimuli into larger categories of information, drawing upon categories and patterns already stored in memory (Miller, 1956; Baddeley, 1994). While our perceptions of the world around us may seem to have a photographic quality, a long line of studies in physiological and cognitive psychology finds the brain plays an active role in organizing the “blooming, buzzing confusion” of incoming stimuli into a seemingly orderly framework (James, 1890; Harnad, 1987; Rosch, 1978).
Fire commanders tend to use the Recognition-Primed Decision model. Gary Klein’s study of fire commanders describes the centrality of pattern recognition and categorization to emergency scene decision-making. Klein and colleagues started their study expecting that fire commanders would typically make decisions utilizing an abbreviated version of the classical rational decision model, which is to generate alternative options, evaluate their costs and benefits, and choose the one that optimizes outcomes. Klein quickly learned that was not the way fire commanders make decisions, resulting in the development of what is now known in decision research as the

NFIRS Incident Types, 1/16 24 NFPA, Fire Analysis & Research Division, Quincy, MA
Recognition – Primed Decision (RPD) model of rapid decision-making (Klein, Calderwood, & Clinton-Cirocco, 2010).
RPD uses pattern recognition more than consideration of alternate options. The RPD model applies to situations requiring decisions to be made rapidly. Instead of generating alternate options, fire commanders recognize patterns in environmental cues that match mental prototypes for different kinds of incidents already stored in memory (e.g., the typical vehicle crash). Prototypes have associated actions and scripts (mental models) that become the starting point for developing action plans. If there’s some variation between the current situation and the mental prototype, they may run mental simulations modifying action plans until they find one that looks like it will work (Klein, 1999).
Categories using language firefighters use on the scene are more likely to be used. One implication of the RPD model is that a data collection structure that uses the same types of categories that firefighters typically use in initial size-ups and later operational decisions will make it easier to retrieve incident details from memory, thereby enhancing the accuracy of reports. The phenomenon of “encoding specificity” studied in memory research also points in this direction, in that the accuracy of information retrieved from memory is greater in the presence of contextual cues similar to those present when the memory was first encoded (Tulving and Thomson, 1973).
Categories may vary depending on setting. A key requirement for evaluating the potential usefulness of the RPD model for improving incident reporting is the need to evaluate the extent to which distinct categories of incidents are indeed shared across different types of fire departments, as well as categories that may be more limited to specific subgroups of fire departments, such as those located in urban, suburban, or rural settings. The greater the similarity of category structures across jurisdictions, the easier it will be to construct a more intuitive coding scheme at the national level.
An initial, albeit crude, look at the code usage patterns nationally and in the three urban departments participating in this study suggests there is likely substantial overlap. This was done by ranking the incident type codes within each jurisdiction by their frequency of use and then examining the correlation of each department’s ranking of code usage with the rankings of code use at the national level and by the other departments.
The resulting correlations were all positive and significant, ranging from .62 to .92, indicating overlaps in how often different codes were being used in each of the urban fire departments studied with how often they are used at the national level. The correlation was lower for one city, both with national data and with the other two cities. The lower correlations appeared to reflect the far lower usage within that department of generic “other” codes ending in zero. Less than 1% of NFIRS reports from that particular city used “other” codes, while the percentages at the national level and for the other two cities ranged from 21% to 24%.

NFIRS Incident Types, 1/16 25 NFPA, Fire Analysis & Research Division, Quincy, MA
Recommendations for further research
More sophisticated research is both feasible and necessary to adequately prepare for developing the next version of NFIRS. One priority would be to mine existing NFIRS data, both to identify problematic codes and to identify the primary categories firefighters use in practice. Possible research projects include:
Cluster analyses examining the relationships between actions taken and incident type classifications. Klein suggests that fire commanders categorize fires in terms of the type of work performed (Klein, 1999, p. 296, Note 5). Examining the conjunctions between actions taken and incident types coding could prove a useful route to identifying operational prototypes and associated mental models.
Utilize text mining techniques to identify the key categories reporting officers use to describe incidents. The old-fashioned method of hand-coding cases utilized in this study greatly limited the number of cases that could be examined. A more productive approach would be to utilize an iterative process between hand-coding and machine coding to “train” software to apply coding rules to rapidly classify large amounts of text data with reasonable accuracy. Examples of text mining with fire service data include a study of firefighter near-miss narratives by Taylor, et al. (2014) and the classification of Polish fire service narratives by Mironczuk (2014).
Apply standard cognitive techniques utilized by survey researchers and web designers to identify fire service category structures and design data entry forms. A description of several available techniques can be found in a report describing the development of an aviation safety survey (NAOMS Reference Report, 2007, p. 20-22). The techniques used included:
Autobiographical recall. Experienced pilots were asked to describe safety events they had experienced during their careers. The order in which events were recalled provided information on how safety events were stored in memory; the stories can also provide material for developing hypothetical safety events for use with other techniques.
Card sorting exercises. Other pilots were given cards describing 96 hypothetical safety events and asked to group them by how similar or related they seemed to be. The groupings provide information on how events are organized in memory and the extent to which categories are shared.
Recall tasks. Another group of pilots read hypothetical safety events and were then asked to recall as many as possible. The order of recall reveals how events are organized in memory.
Confirmation experiments. Potential cues to incorporate into the survey instrument were identified from prior results. The recall task was administered again to separate groups of pilots, with each group exposed to a different set of cues, to find out which ones produced the most accurate recall.
Use survey experiments to test alternate versions of new fields and forms. As new NFIRS fields are developed, they can be compared to the current or alternate proposed
NFIRS Incident Types, 1/16 26 NFPA, Fire Analysis & Research Division, Quincy, MA
versions by means of survey experiments. In a survey experiment, alternate survey forms are randomly assigned to survey participants to test the impact of different ways of asking questions on results. Applied to NFIRS, this would involve presenting survey participants with identical information on test incidents and asking them to classify the incidents using different versions of forms.
Recommendations for NFIRS Administration
Our recommendations are drawn from analyses of the organization and text of NFIRS codes and instructions, review of pertinent studies and research areas, and early rounds of coding incident types from three cities. They are aimed specifically at increasing the consistency or reliability of the NFIRS incident type codes used by the nation’s firefighters, and more generally, providing guidance that can be used with data elements and data systems.
1. Ensure that the underlying objective of the data element is clear and consistent. Simplify code choices, which may involve starting with general questions and collecting more detail, when appropriate, with more specific questions depending on the answer chosen. Measure one concept at a time; avoid double-barreled codes that combine more than one attribute into a single coding choice. (This would have to wait for a major upgrade.) Although the CRG defines incident type as “the actual situation that emergency personnel found on the scene when they arrived,” the current incident type codes incorporate multiple and shifting types of information necessary in order to classify the incident correctly, for example:
a. The physical hazards found, such as fires, carbon monoxide, hazardous materials b. Item affected, for example, structure type, mobile property type, vegetation c. Causes, like malfunctions, leaks, malicious behavior d. Nature of services provided (EMS, some hazard and some service calls),
including prevention activities. In some cases, such as public service assistance (550s) the recipient of the service is a key factor
e. Equipment involved (False alarm codes that focus on types of alarms and extinguishing systems)
f. The type of work performed (water evacuation, smoke removal, debris cleanup)
2. Ensure consistency between abbreviated definitions used in pull-down menus and coding manual definitions. This could be done with the existing system at relatively minimal cost.
3. Clarify ambiguous incident type definitions. With input from the fire service, create new codes or provide clear guidance about how to code common scenarios that could fit multiple codes or don’t fit anywhere. Guidance could be provided for the existing system at relatively minimal cost for scenarios like the following.
NFIRS Incident Types, 1/16 27 NFPA, Fire Analysis & Research Division, Quincy, MA
a. Burned food can be coded as a confined fire, excessive heat, smoke or odor removal, smoke scare, or a false alarm (unintentional activation). Note that fire alarm activation may be a useful warning to the occupant and the system may have been operating correctly even when the fire department was not needed.
b. Cancelled upon arrival. This is a particular issue for EMS, false alarms, and service call codes in which the incident type is based upon what they did.
c. The various roles fire departments may play at vehicle crashes,
i. Incident type 324- Motor vehicle accident with no injuries (considered an EMS incident, despite the lack of patients)
ii. Incident type 463- Vehicle accident, general cleanup. CRG states “Includes incidents where FD is dispatched after the accident to clear away debris. Excludes extrication from vehicle (352) and flammable liquid spills (411 or 413).” Many of our cases coded were not dispatched to clean debris, but took it on because medical care was either not needed or was being provided by other organizations.
iii. There is no obvious incident code choice when the fire department’s main contribution is scene safety or traffic control.
d. Calls that evolve, such as an odor of smoke that is no longer present that resulted in an informal inspection of the property and identification or removal of hazard, such as a clogged dryer hose. Some of the calls coded as good intent (nothing found) actually involve the provision of risk abatement.
Write code definitions in language that firefighters typically use. Avoid archaic or overly technical language.
4. Reduce the number of choices seen initially. This would probably have to wait for a major upgrade.
5. Consider reorganizing incident type codes in terms of operational categories of problems encountered at the scene.
a. Consider a tree hierarchy, where a field first captures the general category of call (fire, medical, hazard), with each category having its own set of follow-up questions that are most appropriate for the particular problem addressed. For example:
i. In response to a fire alarm call, for example, a firefighter would see choices of structure fire, other fire, false alarm, smoke or odor removal, smoke scare, etc.
ii. A CO detector call would show choices of incidents with elevated CO present, false alarm, or no CO found, but possibility of hazard could not be eliminated.

NFIRS Incident Types, 1/16 28 NFPA, Fire Analysis & Research Division, Quincy, MA
b. Include the possibility of coding more than one problem. Forcing multi-faceted incidents into just one “incident type” obscures more than it reveals.
6. Codes for “other” should end in nine instead of zero so they come at the end of numerically sorted lists. This will ensure that specific code choices are seen before those with less specificity.
7. Group explosions with fires. The current structure does not allow the collection of causal data for explosions, which are clearly within fire departments’ mandate. It also increases the risk of undercounts of injuries and fatalities from flash fires that are brief in nature and susceptible to miscoding as explosions or as medical emergencies. At present, an outside gas or vapor combustion explosion (“without sustained fire” noted in CRG (163) is in the special outside fire category, overlapping the criteria of “Explosion, no fire” found in the 240 series.
8. Increase the online accessibility of CRG coding instructions and coding questions. Include the ability to filter and do wildcard searches to find all the applicable codes relevant to a topic. Ideally, reporting officers should be able to enter a term, for example “transformers,” that returns all the related coding options in NFIRS. Similarly, allow the ability to search for fire causes to find the coding options that ensure that fire cause will be captured in official statistics.
9. Thoroughly test any new coding scheme. This should include a review of narratives from a variety of departments and analysis of data. Special attention should be paid to regional differences in terminology.
Conclusion The NFIRS incident type drives the rest of the data collection for each NFIRS report. While some codes are quite clear, we have identified a number of areas for improvement in the short and long term. Making these improvements will make it easier for firefighters to provide good quality data. However, even the smallest change costs money. Funding remains a major challenge.
We found numerous issues with the incident type, just one of many data elements in NFIRS. All of the other data elements in NFIRS, especially those with long code lists, should be rigorously reviewed. Many of the measurement issues raised based on findings from social science research would apply to other NFIRS fields as well.
While we have pointed out many shortcomings, the authors respect and support the ambitious undertaking in NFIRS to document not simply the number, types, and damage from fires, but also their causes, the performance of fire protection systems, and the wide range of community hazards mitigated and other services provided by fire departments to the communities they serve. We are not aware of any other data collection system that attempts to do so much.
NFIRS Incident Types, 1/16 29 NFPA, Fire Analysis & Research Division, Quincy, MA
Despite its imperfections, NFIRS remains the largest and most comprehensive fire incident database in the world. NFPA is frequently approached by researchers from other countries seeking NFIRS-based analyses to inform their own projects. Many of the difficulties in NFIRS resulted from attempts to satisfy diverse user requests and the desire to make analysis easier at the local level.
We believe that NFIRS can and must be improved. It is reassuring that many findings from NFIRS analyses seem consistent with the lived experience of those in the field. But that is not enough, given the gulf between the information needed and the data available. This analysis was done with gratitude for all we have learned from NFIRS and in the hope to contribute to a stronger National Fire Incident Reporting System in the future.

NFIRS Incident Types, 1/16 30 NFPA, Fire Analysis & Research Division, Quincy, MA
References Baddeley, A. (1994). The magic number seven: Still magic after all these years? Psychological
Review, 104(2): 353-356.
Colby, M. (2015). Unwanted Alarm Analysis of Rapid City Fire Department 2014. October 2015 draft report.
Cowan, N. (2001). The magical number 4 in short-term memory: A reconsideration of mental storage capacity. Behavioral and Brain Sciences, 24, 1, 87-114.
Crano, W.D. Brewer, M. B., and Lac, A. (2014). Principles and methods of social research, 3rd edition. New York: Routledge. ISBN-10: 0415638569
Deese, J. and Kaufman, R.A. (1957). Serial effects in recall of unorganized and sequentially organized verbal material, Journal of Experimental Psychology, 54(3):180-7
Forster, Steve (2012). Automatic Commercial Alarms, 2007-2011. Tualatin, Oregon: Tualatin Valley Fire and Rescue. Manuscript.
International Risk Management Institute (IMRI). https://www.irmi.com/online/insurance-glossary/terms/h/hostile-fire.aspx. Accessed 12/20/2015.
Iyengar, S.S., Huberman, G., Jiang, W., 2004. How much choice is too much? Determinants of individual contributions in 401K retirement plans. In: Mitchell, O.S., Utkus, S. (Eds.), Pension Design and Structure: New Lessons from Behavioral Finance. Oxford University Press, Oxford, pp. 83–95.
Iyengar, S.S. & Lepper, M.R. (2000). When choice is demotivating: Can one desire too much of a good thing? Journal of Personality and Social Psychology, 79 (6): 995-1006.
Kahneman, D. (2011). Thinking fast and slow. New York, NY: Farrar, Straus, & Giroux.
Harnad, S. (1987). Psychophysical and cognitive aspects of categorical perception: A critical overview. Chapter 1 of Harnad, S. (ed.), Categorical Perception: The Groundwork of Cognition. New York: Cambridge University Press.
James, William (1890). Chapter XIII: Discrimination and Comparison. In The Principles of Psychology. New York: Henry Holt and Company. Available online at http://psychclassics.yorku.ca/James/Principles/prin13.htm
Klein, G., Calderwood, R., & Clinton-Cirocco, A. (2010). Rapid decision-making on the fire ground: The original study plus a postscript. Journal of Cognitive Engineering and Decision Making 4 (3): 186-209.
Klein, G. (1999). Sources of power: How people make decisions. Cambridge, MA: MIT Press.

NFIRS Incident Types, 1/16 31 NFPA, Fire Analysis & Research Division, Quincy, MA
Krosnick, J.A. (1991). Response strategies for coping with the cognitive demands of attitude measures in surveys. Applied Cognitive Psychology, 5: 213-236. http://onlinelibrary.wiley.com/doi/10.1002/acp.2350050305/abstract
Krosnick, J.A. & Fabrigar, L.R. (1997). Designing rating scales for effective measurement in surveys. In L. Lyberg, P. Biemer, M. Collins, E. de Leeuw, C. Dippo, N. Schwarz, & D. Trewin (Eds.), Survey Measurement and Process Quality. New York: John Wiley, pp. 141-164. https://pprg.stanford.edu/wp-content/uploads/1997-Designing-rating-scales-for-effective-measurement-in-surveys.pdf
Krosnick, J. & Presser, S. (2010). Question and questionnaire design. In J. D. Wright & P. V. Marsden (Eds.), Handbook of Survey Research (Second Edition). West Yorkshire, England: Emerald Group, pp. 263 – 313. https://pprg.stanford.edu/wp-content/uploads/2010-Handbook-of-Survey-Research.pdf
Krueger, J.L. (2010). Garbage In? Evaluating the consistency of the data input into the MTFPD NFIRS compliant database. Emmitsburg, MD: National Fire Academy. http://www.usfa.fema.gov/pdf/efop/efo45082.pdf)
Landis, J.R. and Koch G.G. (1977). The measurement of observer agreement for categorical data. Biometrics 33: 159-174.
Miller, G.A. (1956). The magical number seven, plus or minus two: Some limits on our capacity for processing information. Psychological review 63 (2): 81-97.
Mironczuk, M. (2014). Detecting and extracting semantic topics from Polish fire service reports. Applied Mathematics and Information Sciences, 8(6): 2705-2715.
Murdock, B. (1962). Serial position effect of free recall. Journal of Experimental Psychology, 64(2): 482 – 488. Doi: 10.1037/h0045106.
Murphy, J., Hofacker, C. & Mizerski, R. (2006). Primacy and recency effects in clicking behavior. Journal of Computer-Mediated Communication, 11: 522-534. http://onlinelibrary.wiley.com/doi/10.1111/j.1083-6101.2006.00025.x/epdf
National Association of State Fire Marshals (NASFM) Fire Research and Education Foundation (2014). Conquering the Unknowns: Research and recommendations on the chronic problem of undetermined and missing data in the causal factors sections of the National Fire Incident Reporting System. http://www.nfic.org/docs/NASFMFoundationFinalReportConqueringtheUnknowns.pdf
National Aviation Operations Monitoring Service (NAOMS) (2007). NAOMS Reference Report: Concepts, Methods, and Development Roadmap. Prepared by Battelle Memorial Institute for NASA Ames Research Center. http://www.nasa.gov/pdf/207238main_NAOMS%20Reference%20Report_508.pdf
National Fire Protection Association (2014). Today and tomorrow’s fire data: Workshop report. Quincy, MA: Fire Analysis and Research Division, National Fire Protection Association.
NFIRS Incident Types, 1/16 32 NFPA, Fire Analysis & Research Division, Quincy, MA
http://www.nfpa.org/research/reports-and-statistics/workshop-reports/today-and-tomorrows-fire-data
Rappaport, R.B. (2012). Evaluation of the accuracy of the Redondo Beach Fire Department NFIRS reporting. Emmitsburg, MD: National Fire Academy. https://www.usfa.fema.gov/pdf/efop/efo46904.pdf
Rosch, E, (1978). Principles of categorization. In Rosch, E. and Lloyd B., Cognition and Categorization. Hillsdale, NJ: Lawrence Erlbaum, pp. 27-48. http://commonweb.unifr.ch/artsdean/pub/gestens/f/as/files/4610/9778_083247.pdf
Simon, Herbert A. (1947). Administrative Behavior: a Study of Decision-Making Processes in Administrative Organization (1st Ed.). New York: Macmillan. OCLC 356505
Stausberg, J., Lehmann, N, Kaczmarek, D. & Stein, M. (2009). Reliability of diagnostic coding with ICD-10. International Journal of Medical Informatics, 77: 50-57.
Taylor, J.A., Lacovara, A.V. Smith, G.S., Pandian, R., & Lehto M. (2014). Near-miss narratives from the fire service: A Bayesian analysis. Accident Analysis and Prevention, 62: 119-129.
Tulving, Endel & Thomson, D. (1973). Encoding specificity and retrieval processes in episodic memory. Psychological Review, 80(5): 352-373. Doi: 10.1037/h0020071
United States Fire Administration (2015). National Fire Incident Reporting System 5.0 Complete Reference Guide. Emmitsburg, MD: Federal Emergency Management Agency. https://www.usfa.fema.gov/data/nfirs/support/documentation.html
United States Fire Administration (2015). About the National Fire Incident Reporting System. . Emmitsburg, MD: Federal Emergency Management Agency. https://www.usfa.fema.gov/data/nfirs/about/index.html , retrieved 12/20/2015.
Wockenfuss, R., Frese, T., Herrmann, K., Claussnitzer, M., & Sandholzer, H. (2009). Three- and four-digit ICD-10 is not a reliable classification system in primary care. Scandinavian Journal of Primary Health Care, 27(3), 131–136. http://doi.org/10.1080/02813430903072215
Appendix A: Incident Type Codes with Instructions from The NFIRS Complete Reference Guide (CRG)
NFIRS Incident Types, 1/16 33 NFPA, Fire Analysis & Research Division, Quincy, MA
From the CRG
Incident Type
Incident Type was known as Type of Situation Found in NFIRS 4.1. Definition This is the actual situation that emergency personnel found on the scene when they arrived. These codes include the entire spectrum of fire department activities from fires to EMS to public service.
The type of incident reported here is not always the same as the incident type initially dispatched.
Purpose This critical information identifies the various types of incidents to which the fire department responds and allows the fire department to document the full range of incidents it handles. This information can be used to analyze the frequency of different types of incidents, provide insight on fire and other incident problems, and identify training needs.
This element determines which modules will subsequently be completed. Entry Enter the three-digit code and a written description that best describes the type of incident. This entry is generally the type of incident found when emergency personnel arrived at the scene, but if a more serious condition developed after the fire department arrival on the scene, then that incident type should be reported. The codes are organized in a series:
Series Heading
100 Fire 200 Overpressure Rupture, Explosion, Overheat (No Fire) 300 Rescue and Emergency Medical Service (EMS) Incidents 400 Hazardous Condition (No Fire) 500 Service Call 600 Good Intent Call 700 False Alarm and False Call 800 Severe Weather and Natural Disaster 900 Special Incident Type

Appendix A: Incident Type Codes with Instructions from The NFIRS Complete Reference Guide (CRG)
NFIRS Incident Types, 1/16 34 NFPA, Fire Analysis & Research Division, Quincy, MA
For incidents involving fire and hazardous materials or fire and EMS, use the fire codes.
Always use the lowest numbered series that applies to the incident. You will have an opportunity to describe multiple actions taken later in the report.
For vehicle fires on a structure, use the mobile property fire codes (130–138) unless the
structure became involved.
For fires in buildings that are confined to noncombustible containers, use codes 113–118 of the structure fire codes when there is no flame damage beyond the noncombustible container.
Example Fire in food on the stove that was confined to the pot (113).
C Incident Type
1 1 3 Food on the stove Incident Type
Table A1. Data Dictionary and Coding Instructions for Incident Type
Code #
NFIRS Data Dictionary Text
Incident Types with Further Instructions in the Complete Reference Guide Sub-Group Title
Fire. Includes fires out on arrival and gas
vapor explosions (with extremely rapid combustion)
100 Fire, other 100 Other fire type 10 Fire, other 111 Building fire 111 Building fire. Excludes the confined fires
in codes (113–118). 11 Structure fire
112 Fires in structure other than in a building
112 Fires in structures other than in a building. Includes fires on or in fences; tunnels or underground connecting structures; bridges, trestles, or overhead elevated structures; transformers, power or utility vaults or equipment; piers, quays, or pilings; & tents.
11 Structure fire
113 Cooking fire, confined to container
113 Cooking fire involving the contents of a cooking vessel without fire extension beyond the vessel.
11 Structure fire
114 Chimney or flue fire, confined to chimney or flue
114 Chimney or flue fire originating in & confined to a chimney or flue. Excludes fires that extend beyond the chimney (111 or 112)
11 Structure fire

Appendix A: Incident Type Codes with Instructions from The NFIRS Complete Reference Guide (CRG)
NFIRS Incident Types, 1/16 35 NFPA, Fire Analysis & Research Division, Quincy, MA
Table A1. Data Dictionary and Coding Instructions for Incident Type
Code #
NFIRS Data Dictionary Text
Incident Types with Further Instructions in the Complete Reference Guide Sub-Group Title
115 Incinerator overload or malfunction, fire confined
115 Incinerator overload or malfunction, but flames cause no damage outside the incinerator.
11 Structure fire
116 Fuel burner/boiler malfunction, fire confined
116 Fuel burner/boiler, delayed ignition or malfunction, where flames cause no damage outside the fire box.
11 Structure fire
117 Commercial Compactor fire, confined to rubbish
117 Commercial compactor fire, confined to contents of compactor. Excludes home trash compactors.
11 Structure fire
118 Trash or rubbish fire, contained
118 Trash or rubbish fire in a structure, with no flame damage to structure or its contents.
11 Structure fire
120 Fire in mobile prop. used as a fixed structure, other
120 Other fire in mobile property used as a fixed structure
12 Fire in mobile property used as a fixed structure
121 Fire in mobile home used as fixed residence
121 Fire in mobile home used as a fixed residence. Includes mobile homes when not in transit & used as a structure for residential purposes; & manufactured homes built on a permanent chassis.
12 Fire in mobile property used as a fixed structure
122 Fire in motor home, camper, recreational vehicle
122 Fire in a motor home, camper, or recreational vehicle when used as a structure. Includes motor homes when not in transit & used as a structure for residential purposes.
12 Fire in mobile property used as a fixed structure
123 Fire in portable building, fixed location
123 Fire in a portable building, when used at a fixed location. Includes portable buildings used for commerce, industry, or education & trailers used for commercial purposes.
12 Fire in mobile property used as a fixed structure
130 Mobile property (vehicle) fire, other
130 Other mobile property (vehicle) fire 13 Mobile property (vehicle) fire
131 Passenger vehicle fire 131 Passenger vehicle fire. Includes any motorized passenger vehicle, other than a motor home (136) (e.g., pickup trucks, sport utility vehicles, buses).
13 Mobile property (vehicle) fire
132 Road freight or transport vehicle fire
132 Road freight or transport vehicle fire. Includes commercial freight hauling vehicles & contractor vans or trucks. Examples are moving trucks, plumber vans, & delivery trucks.
13 Mobile property (vehicle) fire
133 Rail vehicle fire 133 Rail vehicle fire. Includes all rail cars, including intermodal containers & passenger cars that are mounted on a rail car.
13 Mobile property (vehicle) fire
134 Water vehicle fire 134 Water vehicle fire. Includes boats, barges, hovercraft, & all other vehicles designed for navigation on water.
13 Mobile property (vehicle) fire
135 Aircraft fire 135 Aircraft fire. Includes fires originating in or on an aircraft, regardless of use.
13 Mobile property (vehicle) fire

Appendix A: Incident Type Codes with Instructions from The NFIRS Complete Reference Guide (CRG)
NFIRS Incident Types, 1/16 36 NFPA, Fire Analysis & Research Division, Quincy, MA
Table A1. Data Dictionary and Coding Instructions for Incident Type
Code #
NFIRS Data Dictionary Text
Incident Types with Further Instructions in the Complete Reference Guide Sub-Group Title
136 Self-propelled motor home or recreational vehicle
136 Self-propelled motor home or recreational vehicle. Includes only self-propelled motor homes or recreational vehicles when being used in a transport mode. Excludes those used for normal residential use (122).
13 Mobile property (vehicle) fire
137 Camper or recreational vehicle (RV) fire
137 Camper or recreational vehicle (RV) fire, not self-propelled. Includes trailers. Excludes RVs on blocks or used regularly as a fixed building (122) & the vehicle towing the camper or RV or the campers mounted on pickups (131).
13 Mobile property (vehicle) fire
138 Off-road vehicle or heavy equipment fire
138 Off-road vehicle or heavy equipment fire. Includes dirt bikes, specialty off-road vehicles, earth-moving equipment (bulldozers), & farm equipment.
13 Mobile property (vehicle) fire
140 Natural vegetation fire, other
140 Other natural vegetation fire 14 Natural vegetation fire
141 Forest, woods or wildland fire
141 Forest, woods, or wildland fire. Includes fires involving vegetative fuels, other than prescribed fire burns (632) that occur in an area in which development is essentially nonexistent, except for roads, railroads, power lines & the like. Also includes forests managed for lumber production & fires involving elevated fuels such as tree branches & crowns. Excludes areas in cultivation for agricultural purposes such as tree farms or crops (17x series).
14 Natural vegetation fire
142 Brush or brush-and-grass mixture fire
142 Brush or brush-and-grass mixture fire. Includes ground fuels lying on or immediately above the ground such as duff, roots, dead leaves, fine dead wood, & downed logs.
14 Natural vegetation fire
143 Grass fire 143 Grass fire. Includes fire confined to area characterized by grass ground cover, with little or no involvement of other ground fuels; otherwise, see 142.
14 Natural vegetation fire
150 Outside rubbish fire, other
150 Other outside rubbish fire 15 Outside rubbish fire
151 Outside rubbish, trash or waste fire
151 Outside rubbish, trash, or waste fire not included in 152–155. Excludes outside rubbish fires in a container or receptacle (154).
15 Outside rubbish fire
152 Garbage dump or sanitary landfill fire
152 Garbage dump or sanitary landfill fire 15 Outside rubbish fire
153 Construction or demolition landfill fire
153 Construction or demolition landfill fire 15 Outside rubbish fire
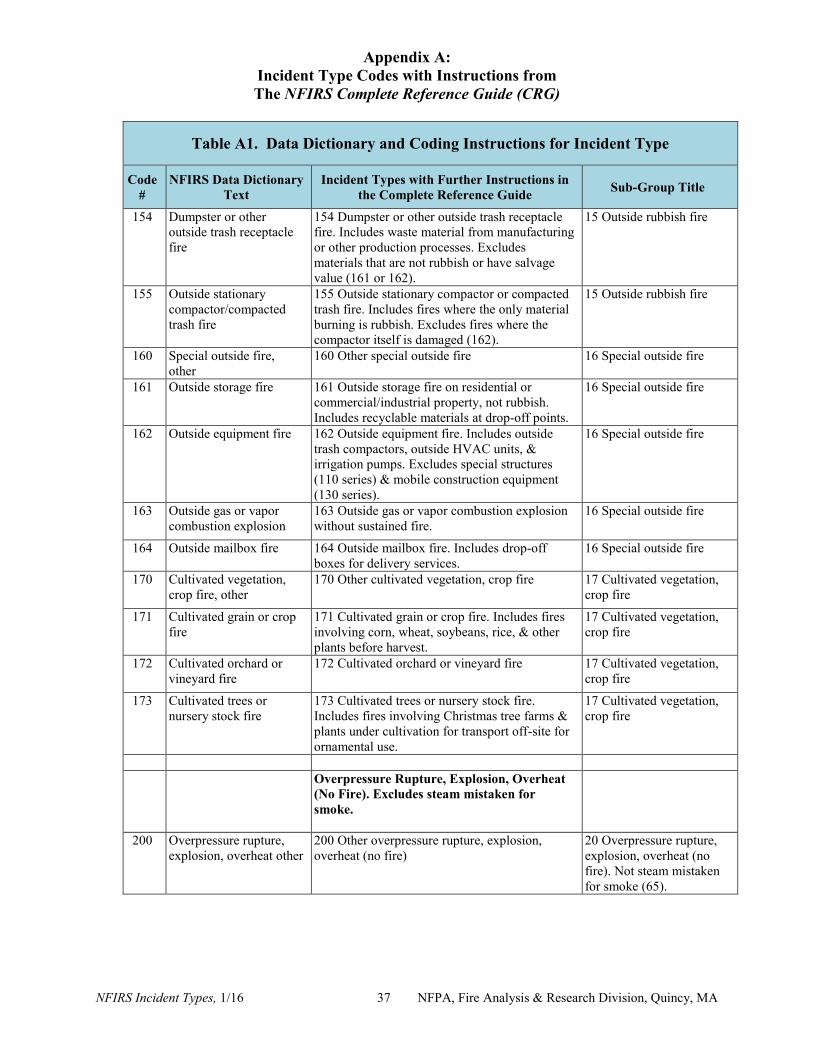
Appendix A: Incident Type Codes with Instructions from The NFIRS Complete Reference Guide (CRG)
NFIRS Incident Types, 1/16 37 NFPA, Fire Analysis & Research Division, Quincy, MA
Table A1. Data Dictionary and Coding Instructions for Incident Type
Code #
NFIRS Data Dictionary Text
Incident Types with Further Instructions in the Complete Reference Guide Sub-Group Title
154 Dumpster or other outside trash receptacle fire
154 Dumpster or other outside trash receptacle fire. Includes waste material from manufacturing or other production processes. Excludes materials that are not rubbish or have salvage value (161 or 162).
15 Outside rubbish fire
155 Outside stationary compactor/compacted trash fire
155 Outside stationary compactor or compacted trash fire. Includes fires where the only material burning is rubbish. Excludes fires where the compactor itself is damaged (162).
15 Outside rubbish fire
160 Special outside fire, other
160 Other special outside fire 16 Special outside fire
161 Outside storage fire 161 Outside storage fire on residential or commercial/industrial property, not rubbish. Includes recyclable materials at drop-off points.
16 Special outside fire
162 Outside equipment fire 162 Outside equipment fire. Includes outside trash compactors, outside HVAC units, & irrigation pumps. Excludes special structures (110 series) & mobile construction equipment (130 series).
16 Special outside fire
163 Outside gas or vapor combustion explosion
163 Outside gas or vapor combustion explosion without sustained fire.
16 Special outside fire
164 Outside mailbox fire 164 Outside mailbox fire. Includes drop-off boxes for delivery services.
16 Special outside fire
170 Cultivated vegetation, crop fire, other
170 Other cultivated vegetation, crop fire 17 Cultivated vegetation, crop fire
171 Cultivated grain or crop fire
171 Cultivated grain or crop fire. Includes fires involving corn, wheat, soybeans, rice, & other plants before harvest.
17 Cultivated vegetation, crop fire
172 Cultivated orchard or vineyard fire
172 Cultivated orchard or vineyard fire 17 Cultivated vegetation, crop fire
173 Cultivated trees or nursery stock fire
173 Cultivated trees or nursery stock fire. Includes fires involving Christmas tree farms & plants under cultivation for transport off-site for ornamental use.
17 Cultivated vegetation, crop fire
Overpressure Rupture, Explosion, Overheat
(No Fire). Excludes steam mistaken for smoke.
200 Overpressure rupture, explosion, overheat other
200 Other overpressure rupture, explosion, overheat (no fire)
20 Overpressure rupture, explosion, overheat (no fire). Not steam mistaken for smoke (65).

Appendix A: Incident Type Codes with Instructions from The NFIRS Complete Reference Guide (CRG)
NFIRS Incident Types, 1/16 38 NFPA, Fire Analysis & Research Division, Quincy, MA
Table A1. Data Dictionary and Coding Instructions for Incident Type
Code #
NFIRS Data Dictionary Text
Incident Types with Further Instructions in the Complete Reference Guide Sub-Group Title
210 Overpressure rupture from steam, other
210 Other overpressure rupture from steam 20 Overpressure rupture, explosion, overheat (no fire). Not steam mistaken for smoke (65).
211 Overpressure rupture of steam pipe or pipeline
211 Overpressure rupture of steam pipe or pipeline
20 Overpressure rupture, explosion, overheat (no fire). Not steam mistaken for smoke (65).
212 Overpressure rupture of steam boiler
212 Overpressure rupture of steam boiler 20 Overpressure rupture, explosion, overheat (no fire). Not steam mistaken for smoke (65).
213 Steam rupture of pressure or process vessel
213 Overpressure rupture of pressure or process vessel from steam.
20 Overpressure rupture, explosion, overheat (no fire). Not steam mistaken for smoke (65).
220 Overpressure rupture from air or gas, other
220 Other overpressure rupture from air or gas 20 Overpressure rupture, explosion, overheat (no fire). Not steam mistaken for smoke (65).
221 Overpressure rupture of air or gas pipe/pipeline
221 Overpressure rupture of air or gas pipe or pipeline
20 Overpressure rupture, explosion, overheat (no fire). Not steam mistaken for smoke (65).
222 Overpressure rupture of boiler from air or gas
222 Overpressure rupture of boiler from air or gas. Excludes steam-related overpressure ruptures.
20 Overpressure rupture, explosion, overheat (no fire). Not steam mistaken for smoke (65).
223 Air or gas rupture of pressure or process vessel
223 Overpressure rupture of pressure or process vessel from air or gas, not steam.
20 Overpressure rupture, explosion, overheat (no fire). Not steam mistaken for smoke (65).
231 Chemical reaction rupture of process vessel
231 Overpressure rupture of pressure or process vessel from a chemical reaction.
23 Overpressure rupture, chemical reaction - no fire
240 Explosion (no fire), other 240 Other explosion (no fire) 24 Explosion (no fire)
241 Munitions or bomb explosion (no fire)
241 Munitions or bomb explosion (no fire). Includes explosions involving military ordnance, dynamite, nitroglycerin, plastic explosives, propellants, & similar agents with a UN classification 1.1 or 1.3. Includes primary & secondary high explosives.
24 Explosion (no fire)
242 Blasting agent explosion (no fire)
242 Blasting agent explosion (no fire). Includes ammonium nitrate & fuel oil (ANFO) mixtures & explosives with a UN Classification 1.5 (also known as blasting agents).
24 Explosion (no fire)

Appendix A: Incident Type Codes with Instructions from The NFIRS Complete Reference Guide (CRG)
NFIRS Incident Types, 1/16 39 NFPA, Fire Analysis & Research Division, Quincy, MA
Table A1. Data Dictionary and Coding Instructions for Incident Type
Code #
NFIRS Data Dictionary Text
Incident Types with Further Instructions in the Complete Reference Guide Sub-Group Title
243 Fireworks explosion (no fire)
243 Fireworks explosion (no fire). Includes all classes of fireworks.
24 Explosion (no fire)
244 Dust explosion (no fire) 244 Dust explosion (no fire) 24 Explosion (no fire)
251 Excessive heat, scorch burns with no ignition
251 Excessive heat, overheat scorch burns with no ignition. Excludes lightning strikes with no ensuing fire (814).
25 Excessive heat, scorch burns with no ignition
Rescue and Emergency Medical Service
Incident
300 Rescue, EMS incident, other
300 Other rescue, EMS incident 30 Other rescue, emergency medical (EMS) call
311 Medical assist, assist EMS crew
311 Medical assist. Includes incidents where medical assistance is provided to another group/agency that has primary EMS responsibility. (Example, assisting EMS with moving a heavy patient.)
31 Medical assist
320 Emergency medical service incident, other
320 Other emergency medical service incident 32 Emergency medical service (EMS) incident
321 EMS call, excluding vehicle accident with injury
321 EMS call. Includes calls when the patient refuses treatment. Excludes vehicle accident with injury (322) & pedestrian struck (323).
32 Emergency medical service (EMS) incident
322 Motor vehicle accident with injuries
322 Motor vehicle accident with injuries. Includes collision with other vehicle, fixed objects, or loss of control resulting in leaving the roadway.
32 Emergency medical service (EMS) incident
323 Motor vehicle/pedestrian accident (MV Ped)
323 Motor vehicle/pedestrian accident (MV Ped). Includes any motor vehicle accident involving a pedestrian injury.
32 Emergency medical service (EMS) incident
324 Motor vehicle accident with no injuries.
324 Motor vehicle accident with no injuries 32 Emergency medical service (EMS) incident
331 Lock-in (if lock out , use 511 )
331 Lock-in. Includes opening locked vehicles & gaining entry to locked areas for access by caretakers or rescuers, such as a child locked in a bathroom. Excludes lock-outs (511).
33 Lock-in
340 Search for lost person, other
340 Other search for lost person 34 Search for lost person
341 Search for person on land
341 Search for person on land. Includes lost hikers & children, even where there is an incidental search of local bodies of water, such as a creek or river.
34 Search for lost person

Appendix A: Incident Type Codes with Instructions from The NFIRS Complete Reference Guide (CRG)
NFIRS Incident Types, 1/16 40 NFPA, Fire Analysis & Research Division, Quincy, MA
Table A1. Data Dictionary and Coding Instructions for Incident Type
Code #
NFIRS Data Dictionary Text
Incident Types with Further Instructions in the Complete Reference Guide Sub-Group Title
342 Search for person in water
342 Search for person in water. Includes shoreline searches incidental to a reported drowning call.
34 Search for lost person
343 Search for person underground
343 Search for person underground. Includes caves, mines, tunnels, & the like.
34 Search for lost person
350 Extrication, rescue, other 350 Other extrication, rescue 35 Extrication, rescue
351 Extrication of victim(s) from building/structure
351 Extrication of victim(s) from building or structure, such as a building collapse. Excludes high-angle rescue (356).
35 Extrication, rescue
352 Extrication of victim(s) from vehicle
352 Extrication of victim(s) from vehicle. Includes rescues from vehicles hanging off a bridge or cliff.
35 Extrication, rescue
353 Removal of victim(s) from stalled elevator
353 Removal of victim(s) from stalled elevator 35 Extrication, rescue
354 Trench/below-grade rescue
354 Trench/below grade rescue 35 Extrication, rescue
355 Confined space rescue 355 Confined space rescue. Includes rescues from the interiors of tanks, including areas with potential for hazardous atmospheres such as silos, wells, & tunnels.
35 Extrication, rescue
356 High-angle rescue 356 High-angle rescue. Includes rope rescue & rescues off of structures.
35 Extrication, rescue
357 Extrication of victim(s) from machinery
357 Extrication of victim(s) from machinery. Includes extrication from farm or industrial equipment.
35 Extrication, rescue
360 Water & ice-related rescue, other
360 Other water & ice related rescue 36 Water or ice-related rescue
361 Swimming/recreational water areas rescue
361 Swimming/Recreational water areas rescue. Includes pools & ponds. Excludes ice rescue (362).
36 Water or ice-related rescue
362 Ice rescue 362 Ice rescue. Includes only cases where victim is stranded on ice or has fallen through ice.
36 Water or ice-related rescue
363 Swift water rescue 363 Swift-water rescue. Includes flash flood conditions.
36 Water or ice-related rescue
364 Surf rescue 364 Surf rescue 36 Water or ice-related rescue
365 Watercraft rescue 365 Watercraft rescue. Excludes rescues near the shore & in swimming/recreational areas (361). Includes people falling overboard at a significant distance from land.
36 Water or ice-related rescue
370 Electrical rescue, other 370 Other electrical rescue 37 Electrical rescue 371 Electrocution or
potential electrocution 371 Electrocution or potential electrocution. Excludes people trapped by power lines (372).
37 Electrical rescue
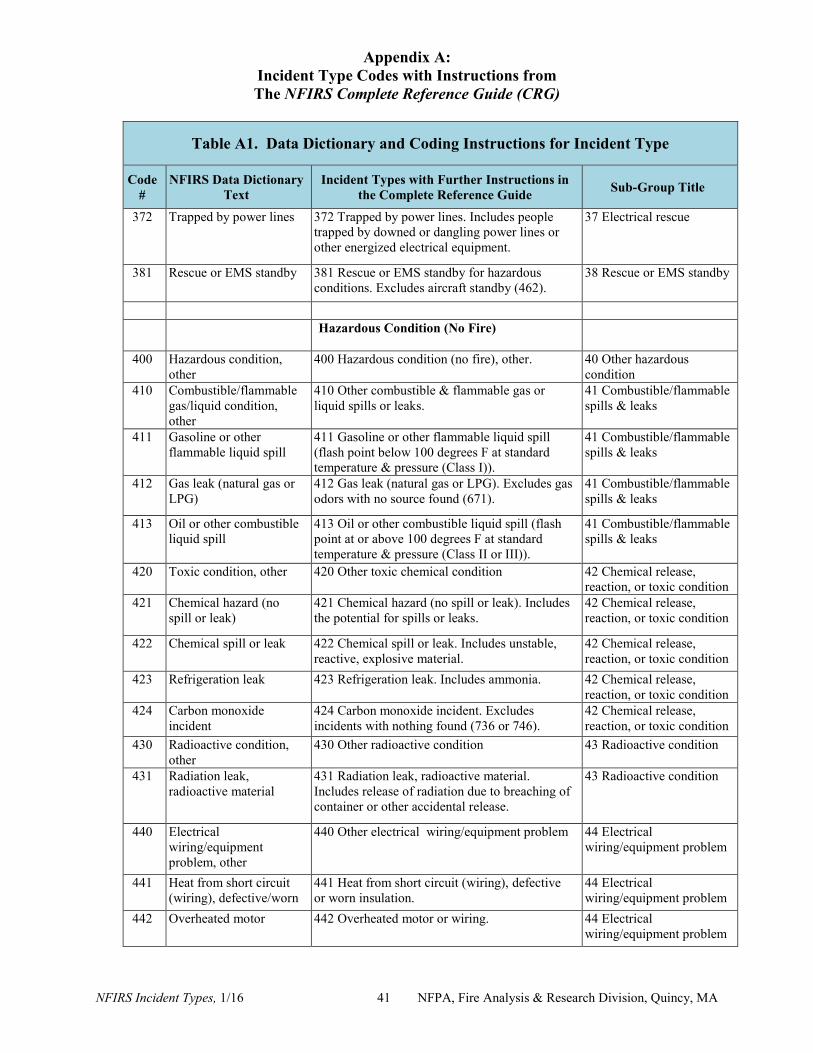
Appendix A: Incident Type Codes with Instructions from The NFIRS Complete Reference Guide (CRG)
NFIRS Incident Types, 1/16 41 NFPA, Fire Analysis & Research Division, Quincy, MA
Table A1. Data Dictionary and Coding Instructions for Incident Type
Code #
NFIRS Data Dictionary Text
Incident Types with Further Instructions in the Complete Reference Guide Sub-Group Title
372 Trapped by power lines 372 Trapped by power lines. Includes people trapped by downed or dangling power lines or other energized electrical equipment.
37 Electrical rescue
381 Rescue or EMS standby 381 Rescue or EMS standby for hazardous conditions. Excludes aircraft standby (462).
38 Rescue or EMS standby
Hazardous Condition (No Fire)
400 Hazardous condition, other
400 Hazardous condition (no fire), other. 40 Other hazardous condition
410 Combustible/flammable gas/liquid condition, other
410 Other combustible & flammable gas or liquid spills or leaks.
41 Combustible/flammable spills & leaks
411 Gasoline or other flammable liquid spill
411 Gasoline or other flammable liquid spill (flash point below 100 degrees F at standard temperature & pressure (Class I)).
41 Combustible/flammable spills & leaks
412 Gas leak (natural gas or LPG)
412 Gas leak (natural gas or LPG). Excludes gas odors with no source found (671).
41 Combustible/flammable spills & leaks
413 Oil or other combustible liquid spill
413 Oil or other combustible liquid spill (flash point at or above 100 degrees F at standard temperature & pressure (Class II or III)).
41 Combustible/flammable spills & leaks
420 Toxic condition, other 420 Other toxic chemical condition 42 Chemical release, reaction, or toxic condition
421 Chemical hazard (no spill or leak)
421 Chemical hazard (no spill or leak). Includes the potential for spills or leaks.
42 Chemical release, reaction, or toxic condition
422 Chemical spill or leak 422 Chemical spill or leak. Includes unstable, reactive, explosive material.
42 Chemical release, reaction, or toxic condition
423 Refrigeration leak 423 Refrigeration leak. Includes ammonia. 42 Chemical release, reaction, or toxic condition
424 Carbon monoxide incident
424 Carbon monoxide incident. Excludes incidents with nothing found (736 or 746).
42 Chemical release, reaction, or toxic condition
430 Radioactive condition, other
430 Other radioactive condition 43 Radioactive condition
431 Radiation leak, radioactive material
431 Radiation leak, radioactive material. Includes release of radiation due to breaching of container or other accidental release.
43 Radioactive condition
440 Electrical wiring/equipment problem, other
440 Other electrical wiring/equipment problem 44 Electrical wiring/equipment problem
441 Heat from short circuit (wiring), defective/worn
441 Heat from short circuit (wiring), defective or worn insulation.
44 Electrical wiring/equipment problem
442 Overheated motor 442 Overheated motor or wiring. 44 Electrical wiring/equipment problem

Appendix A: Incident Type Codes with Instructions from The NFIRS Complete Reference Guide (CRG)
NFIRS Incident Types, 1/16 42 NFPA, Fire Analysis & Research Division, Quincy, MA
Table A1. Data Dictionary and Coding Instructions for Incident Type
Code #
NFIRS Data Dictionary Text
Incident Types with Further Instructions in the Complete Reference Guide Sub-Group Title
443 Breakdown of light ballast
443 Breakdown of light ballast 44 Electrical wiring/equipment problem
444 Power line down 444 Power line down. Excludes people trapped by downed power lines (372).
44 Electrical wiring/equipment problem
445 Arcing, shorted electrical equipment
445 Arcing, shorted electrical equipment 44 Electrical wiring/equipment problem
451 Biological hazard, confirmed or suspected
451 Biological hazard, confirmed or suspected 45 Biological hazard
460 Accident, potential accident, other
460 Other accident, potential accident 46 Accident, potential accident
461 Building or structure weakened or collapsed
461 Building or structure weakened or collapsed. Excludes incidents where people are trapped (351).
46 Accident, potential accident
462 Aircraft standby 462 Aircraft standby. Includes routine standby for takeoff & landing as well as emergency alerts at airports.
46 Accident, potential accident
463 Vehicle accident, general cleanup
463 Vehicle accident, general cleanup. Includes incidents where FD is dispatched after the accident to clear away debris. Excludes extrication from vehicle (352) & flammable liquid spills (411 or 413).
46 Accident, potential accident
471 Explosive, bomb removal (for bomb scare, use 721)
471 Explosive, bomb removal. Includes disarming, rendering safe, & disposing of bombs or suspected devices. Excludes bomb scare (721).
47 Explosive, bomb removal
480 Attempted burning, illegal action, other
480 Other attempted burning, illegal action 48 Attempted burning, illegal action
481 Attempt to burn 481 Attempt to burn. Includes situations in which incendiary devices fail to function.
48 Attempted burning, illegal action
482 Threat to burn 482 Threat to burn. Includes verbal threats & persons threatening to set themselves on fire. Excludes an attempted burning (481).
48 Attempted burning, illegal action
Service Call
500 Service Call, other 500 Other service call 50 Other service call 510 Person in distress, other 510 Other person in distress 51 Person in distress
511 Lock-out 511 Lock-out. Includes efforts to remove keys from locked vehicles. Excludes lock-ins (331).
51 Person in distress
512 Ring or jewelry removal 512 Ring or jewelry removal, without transport to hospital. Excludes persons injured (321).
51 Person in distress
520 Water problem, other 520 Other water problem 52 Water problem

Appendix A: Incident Type Codes with Instructions from The NFIRS Complete Reference Guide (CRG)
NFIRS Incident Types, 1/16 43 NFPA, Fire Analysis & Research Division, Quincy, MA
Table A1. Data Dictionary and Coding Instructions for Incident Type
Code #
NFIRS Data Dictionary Text
Incident Types with Further Instructions in the Complete Reference Guide Sub-Group Title
521 Water evacuation 521 Water (not people) evacuation. Includes the removal of water from basements. Excludes water rescues (360 series).
52 Water problem
522 Water or steam leak 522 Water or steam leak. Includes open hydrant. Excludes overpressure ruptures (211).
52 Water problem
531 Smoke or odor removal 531 Smoke or odor removal. Excludes the removal of any hazardous materials.
53 Smoke, odor problem
540 Animal problem, other 540 Other animal problem or rescue 54 Animal problem or rescue
541 Animal problem 541 Animal problem. Includes persons trapped by an animal or an animal on the loose.
54 Animal problem or rescue
542 Animal rescue 542 Animal rescue 54 Animal problem or rescue
550 Public service assistance, other
550 Other public service assistance 55 Public service assistance
551 Assist police or other governmental agency
551 Assist police or other governmental agency. Includes forcible entry & the provision of lighting.
55 Public service assistance
552 Police matter 552 Police matter. Includes incidents where FD is called to a scene that should be handled by the police.
55 Public service assistance
553 Public service 553 Public service. Excludes service to governmental agencies (551 or 552).
55 Public service assistance
554 Assist invalid 554 Assist invalid. Includes incidents where the invalid calls the FD for routine help, such as assisting a person in returning to bed or chair, with no transport or medical treatment given.
55 Public service assistance
555 Defective elevator, no occupants
555 Defective elevator, no occupants 55 Public service assistance
561 Unauthorized burning 561 Unauthorized burning. Includes fires that are under control & not endangering property.
56 Unauthorized burning
571 Cover assignment, standby, move-up
571 Cover assignment, assist other fire agency such as standby at a fire station or move-up.
57 Cover assignment, standby at fire station, move
Good Intent Call
600 Good intent call, other 600 Other good intent call (KAK, includes dispatch errors)
60 Good intent call, other
611 Dispatched & canceled enroute
611 Dispatched & canceled enroute. Incident cleared or canceled prior to arrival of the responding unit. If a unit arrives on the scene, fill out the applicable code.
61 Dispatched & canceled enroute

Appendix A: Incident Type Codes with Instructions from The NFIRS Complete Reference Guide (CRG)
NFIRS Incident Types, 1/16 44 NFPA, Fire Analysis & Research Division, Quincy, MA
Table A1. Data Dictionary and Coding Instructions for Incident Type
Code #
NFIRS Data Dictionary Text
Incident Types with Further Instructions in the Complete Reference Guide Sub-Group Title
621 Wrong location 621 Wrong location. Excludes malicious false alarms (710 series).
62 Wrong location, no emergency found
622 No incident found on arrival at dispatch address
622 No incident found on arrival at dispatch address
62 Wrong location, no emergency found
631 Authorized controlled burning
631 Authorized controlled burning. Includes fires that are agricultural in nature & managed by the property owner. Excludes unauthorized controlled burning (561) & prescribed fires (632).
63 Controlled burning
632 Prescribed fire 632 Prescribed fire. Includes fires ignited by management actions to meet specific objectives & have a written, approved prescribed fire plan prior to ignition. Excludes authorized controlled burning (631).
63 Controlled burning
641 Vicinity alarm (incident in other location)
641 Vicinity alarm (incident in other location). For use only when an erroneous report is received for a legitimate incident. Includes separate locations reported for an actual fire & multiple boxes pulled for one fire.
64 Vicinity alarm
650 Steam, other gas mistaken for smoke, other
650 Other steam gas mistaken for smoke 65 Steam, other gas mistaken for smoke
651 Smoke scare, odor of smoke
651 Smoke scare, odor of smoke, not steam (652). Excludes gas scares or odors of gas (671).
65 Steam, other gas mistaken for smoke
652 Steam, vapor, fog or dust thought to be smoke
652 Steam, vapor, fog or dust thought to be smoke
65 Steam, other gas mistaken for smoke
653 Smoke from barbecue, tar kettle
653 Smoke from barbecue or tar kettle (no hostile fire).
65 Steam, other gas mistaken for smoke
661 EMS call, party transported by non-fire agency
661 EMS call where injured party has been transported by a non-fire service agency or left the scene prior to arrival.
66 EMS call where party has been transported
671 HazMat release investigation w/no HazMat
671 Hazardous material release investigation with no hazardous condition found. Includes odor of gas with no leak/gas found.
67 Hazmat release investigation w/ no hazmat
672 Biological hazard investigation, none found
672 Biological hazard investigation with no hazardous condition found.
67 Hazmat release investigation w/ no hazmat
False Alarm and False Alarm Call
700 False alarm or false call, other
700 Other false alarm or false call 70 False alarm & false call, other
710 Malicious, mischievous false call, other
710 Other malicious, mischievous false alarm 71 Malicious, mischievous false alarm

Appendix A: Incident Type Codes with Instructions from The NFIRS Complete Reference Guide (CRG)
NFIRS Incident Types, 1/16 45 NFPA, Fire Analysis & Research Division, Quincy, MA
Table A1. Data Dictionary and Coding Instructions for Incident Type
Code #
NFIRS Data Dictionary Text
Incident Types with Further Instructions in the Complete Reference Guide Sub-Group Title
711 Municipal alarm system, malicious false alarm
711 Municipal alarm system, malicious false alarm. Includes alarms transmitted on street fire alarm boxes.
71 Malicious, mischievous false alarm
712 Direct tie to FD, malicious false alarm
712 Direct tie to fire department, malicious false alarm. Includes malicious alarms transmitted via fire alarm system directly tied to the fire department, not via dialed telephone.
71 Malicious, mischievous false alarm
713 Telephone, malicious false alarm
713 Telephone, malicious false alarm. Includes false alarms transmitted via the public telephone network using the local emergency reporting number of the fire department or another emergency service agency.
71 Malicious, mischievous false alarm
714 Central station, malicious false alarm
714 Central station, malicious false alarm. Includes malicious false alarms via a central-station-monitored fire alarm system.
71 Malicious, mischievous false alarm
715 Local alarm system, malicious false alarm
715 Local alarm system, malicious false alarm. Includes malicious false alarms reported via telephone or other means as a result of activation of a local fire alarm system.
71 Malicious, mischievous false alarm
721 Bomb scare - no bomb 721 Bomb scare (no bomb) 72 Bomb scare 730 System malfunction,
other 730 Other system or detector malfunction 73 System or detector
malfunction 731 Sprinkler activation due
to malfunction 731 Sprinkler activated due to the failure or malfunction of the sprinkler system. Includes any failure of sprinkler equipment that leads to sprinkler activation with no fire present. Excludes unintentional operation caused by damage to the sprinkler system (740 series).
73 System or detector malfunction
732 Extinguishing system activation due to malfunction
732 Extinguishing system activation due to malfunction
73 System or detector malfunction
733 Smoke detector activation due to malfunction
733 Smoke detector activation due to malfunction
73 System or detector malfunction
734 Heat detector activation due to malfunction
734 Heat detector activation due to malfunction 73 System or detector malfunction
735 Alarm system sounded due to malfunction
735 Alarm system activation due to malfunction. 73 System or detector malfunction
736 CO detector activation due to malfunction
736 Carbon monoxide detector activation due to malfunction.
73 System or detector malfunction
740 Unintentional transmission of alarm, other
740 Other unintentional transmission of alarm 74 Unintentional system/detector operation-no fire
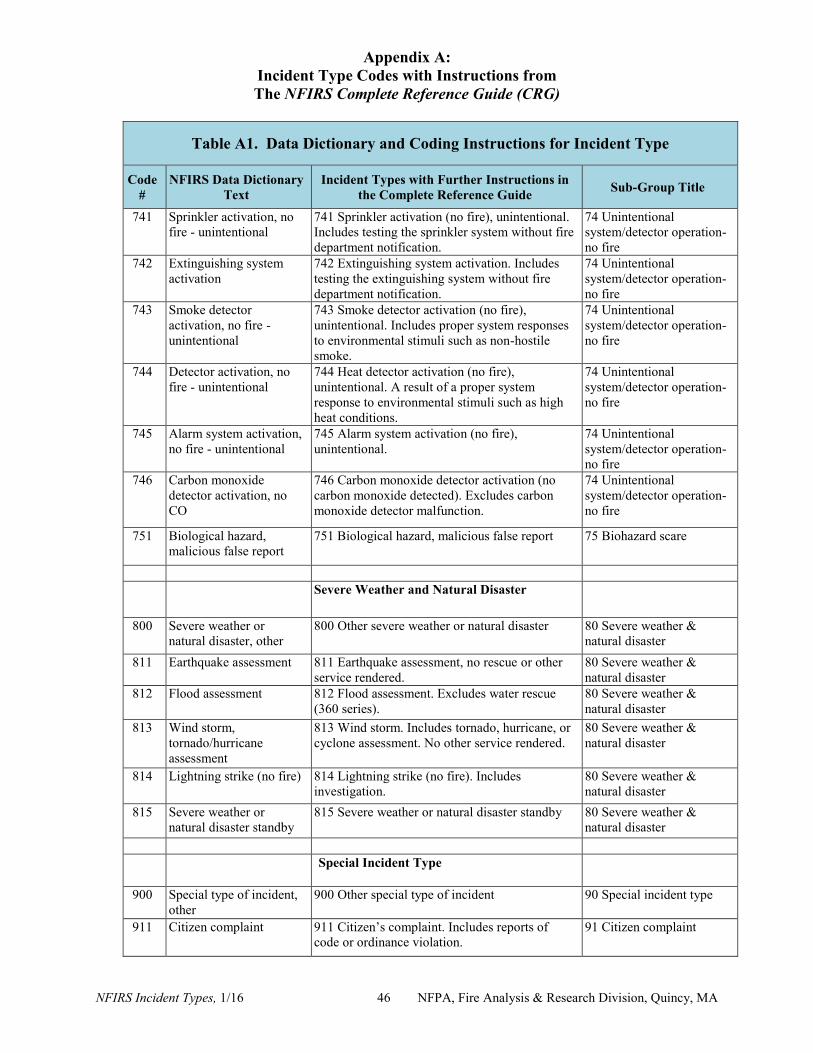
Appendix A: Incident Type Codes with Instructions from The NFIRS Complete Reference Guide (CRG)
NFIRS Incident Types, 1/16 46 NFPA, Fire Analysis & Research Division, Quincy, MA
Table A1. Data Dictionary and Coding Instructions for Incident Type
Code #
NFIRS Data Dictionary Text
Incident Types with Further Instructions in the Complete Reference Guide Sub-Group Title
741 Sprinkler activation, no fire - unintentional
741 Sprinkler activation (no fire), unintentional. Includes testing the sprinkler system without fire department notification.
74 Unintentional system/detector operation-no fire
742 Extinguishing system activation
742 Extinguishing system activation. Includes testing the extinguishing system without fire department notification.
74 Unintentional system/detector operation-no fire
743 Smoke detector activation, no fire - unintentional
743 Smoke detector activation (no fire), unintentional. Includes proper system responses to environmental stimuli such as non-hostile smoke.
74 Unintentional system/detector operation-no fire
744 Detector activation, no fire - unintentional
744 Heat detector activation (no fire), unintentional. A result of a proper system response to environmental stimuli such as high heat conditions.
74 Unintentional system/detector operation-no fire
745 Alarm system activation, no fire - unintentional
745 Alarm system activation (no fire), unintentional.
74 Unintentional system/detector operation-no fire
746 Carbon monoxide detector activation, no CO
746 Carbon monoxide detector activation (no carbon monoxide detected). Excludes carbon monoxide detector malfunction.
74 Unintentional system/detector operation-no fire
751 Biological hazard, malicious false report
751 Biological hazard, malicious false report 75 Biohazard scare
Severe Weather and Natural Disaster
800 Severe weather or natural disaster, other
800 Other severe weather or natural disaster 80 Severe weather & natural disaster
811 Earthquake assessment 811 Earthquake assessment, no rescue or other service rendered.
80 Severe weather & natural disaster
812 Flood assessment 812 Flood assessment. Excludes water rescue (360 series).
80 Severe weather & natural disaster
813 Wind storm, tornado/hurricane assessment
813 Wind storm. Includes tornado, hurricane, or cyclone assessment. No other service rendered.
80 Severe weather & natural disaster
814 Lightning strike (no fire) 814 Lightning strike (no fire). Includes investigation.
80 Severe weather & natural disaster
815 Severe weather or natural disaster standby
815 Severe weather or natural disaster standby 80 Severe weather & natural disaster
Special Incident Type
900 Special type of incident, other
900 Other special type of incident 90 Special incident type
911 Citizen complaint 911 Citizen’s complaint. Includes reports of code or ordinance violation.
91 Citizen complaint
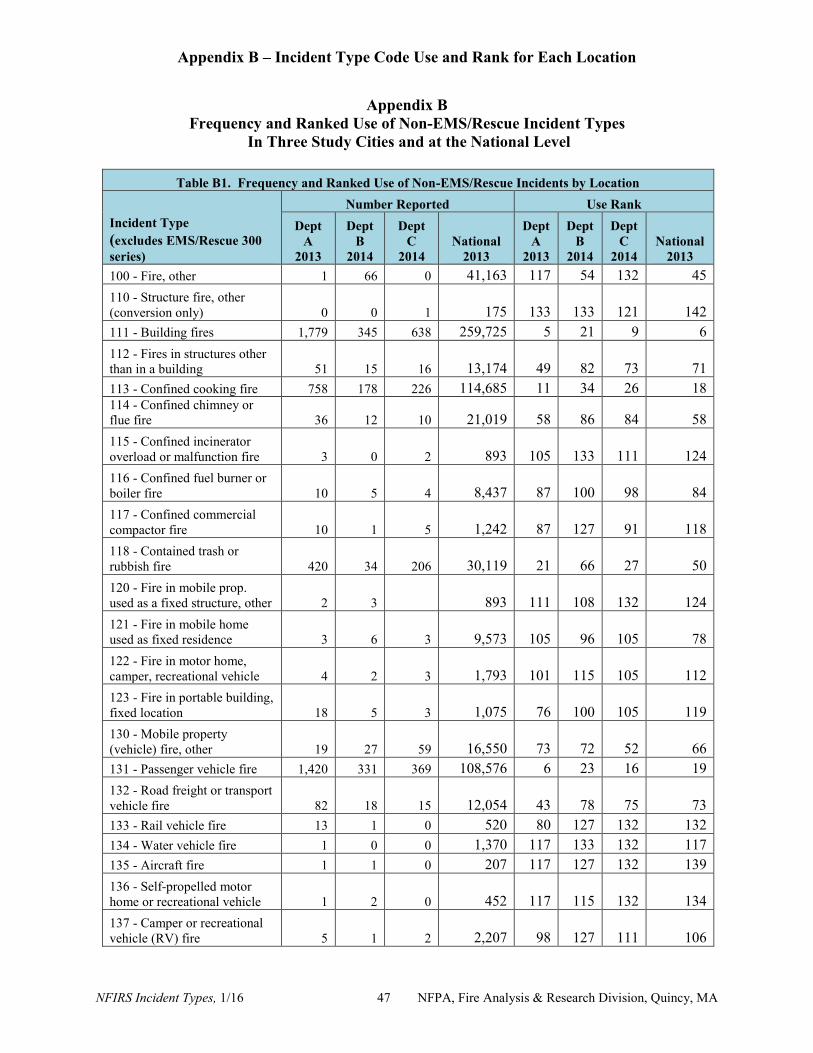
Appendix B – Incident Type Code Use and Rank for Each Location
NFIRS Incident Types, 1/16 47 NFPA, Fire Analysis & Research Division, Quincy, MA
Appendix B Frequency and Ranked Use of Non-EMS/Rescue Incident Types
In Three Study Cities and at the National Level
Table B1. Frequency and Ranked Use of Non-EMS/Rescue Incidents by Location
Incident Type (excludes EMS/Rescue 300 series)
Number Reported Use Rank Dept
A 2013
Dept B
2014
Dept C
2014 National
2013
Dept A
2013
Dept B
2014
Dept C
2014 National
2013 100 - Fire, other 1 66 0 41,163 117 54 132 45 110 - Structure fire, other (conversion only) 0 0 1 175 133 133 121 142 111 - Building fires 1,779 345 638 259,725 5 21 9 6 112 - Fires in structures other than in a building 51 15 16 13,174 49 82 73 71 113 - Confined cooking fire 758 178 226 114,685 11 34 26 18 114 - Confined chimney or flue fire 36 12 10 21,019 58 86 84 58 115 - Confined incinerator overload or malfunction fire 3 0 2 893 105 133 111 124 116 - Confined fuel burner or boiler fire 10 5 4 8,437 87 100 98 84 117 - Confined commercial compactor fire 10 1 5 1,242 87 127 91 118 118 - Contained trash or rubbish fire 420 34 206 30,119 21 66 27 50 120 - Fire in mobile prop. used as a fixed structure, other 2 3 893 111 108 132 124 121 - Fire in mobile home used as fixed residence 3 6 3 9,573 105 96 105 78 122 - Fire in motor home, camper, recreational vehicle 4 2 3 1,793 101 115 105 112 123 - Fire in portable building, fixed location 18 5 3 1,075 76 100 105 119 130 - Mobile property (vehicle) fire, other 19 27 59 16,550 73 72 52 66 131 - Passenger vehicle fire 1,420 331 369 108,576 6 23 16 19 132 - Road freight or transport vehicle fire 82 18 15 12,054 43 78 75 73 133 - Rail vehicle fire 13 1 0 520 80 127 132 132 134 - Water vehicle fire 1 0 0 1,370 117 133 132 117 135 - Aircraft fire 1 1 0 207 117 127 132 139 136 - Self-propelled motor home or recreational vehicle 1 2 0 452 117 115 132 134 137 - Camper or recreational vehicle (RV) fire 5 1 2 2,207 98 127 111 106
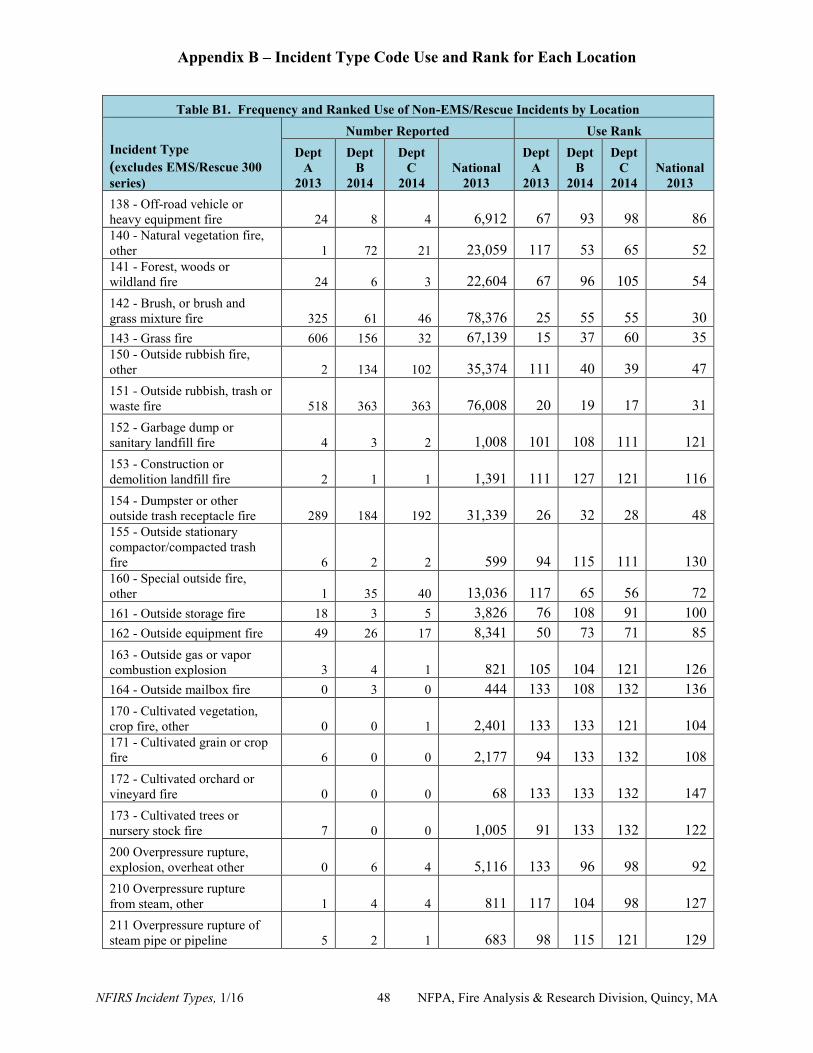
Appendix B – Incident Type Code Use and Rank for Each Location
NFIRS Incident Types, 1/16 48 NFPA, Fire Analysis & Research Division, Quincy, MA
Table B1. Frequency and Ranked Use of Non-EMS/Rescue Incidents by Location
Incident Type (excludes EMS/Rescue 300 series)
Number Reported Use Rank Dept
A 2013
Dept B
2014
Dept C
2014 National
2013
Dept A
2013
Dept B
2014
Dept C
2014 National
2013 138 - Off-road vehicle or heavy equipment fire 24 8 4 6,912 67 93 98 86 140 - Natural vegetation fire, other 1 72 21 23,059 117 53 65 52 141 - Forest, woods or wildland fire 24 6 3 22,604 67 96 105 54 142 - Brush, or brush and grass mixture fire 325 61 46 78,376 25 55 55 30 143 - Grass fire 606 156 32 67,139 15 37 60 35 150 - Outside rubbish fire, other 2 134 102 35,374 111 40 39 47 151 - Outside rubbish, trash or waste fire 518 363 363 76,008 20 19 17 31 152 - Garbage dump or sanitary landfill fire 4 3 2 1,008 101 108 111 121 153 - Construction or demolition landfill fire 2 1 1 1,391 111 127 121 116 154 - Dumpster or other outside trash receptacle fire 289 184 192 31,339 26 32 28 48 155 - Outside stationary compactor/compacted trash fire 6 2 2 599 94 115 111 130 160 - Special outside fire, other 1 35 40 13,036 117 65 56 72 161 - Outside storage fire 18 3 5 3,826 76 108 91 100 162 - Outside equipment fire 49 26 17 8,341 50 73 71 85 163 - Outside gas or vapor combustion explosion 3 4 1 821 105 104 121 126 164 - Outside mailbox fire 0 3 0 444 133 108 132 136 170 - Cultivated vegetation, crop fire, other 0 0 1 2,401 133 133 121 104 171 - Cultivated grain or crop fire 6 0 0 2,177 94 133 132 108 172 - Cultivated orchard or vineyard fire 0 0 0 68 133 133 132 147 173 - Cultivated trees or nursery stock fire 7 0 0 1,005 91 133 132 122 200 Overpressure rupture, explosion, overheat other 0 6 4 5,116 133 96 98 92 210 Overpressure rupture from steam, other 1 4 4 811 117 104 98 127 211 Overpressure rupture of steam pipe or pipeline 5 2 1 683 98 115 121 129

Appendix B – Incident Type Code Use and Rank for Each Location
NFIRS Incident Types, 1/16 49 NFPA, Fire Analysis & Research Division, Quincy, MA
Table B1. Frequency and Ranked Use of Non-EMS/Rescue Incidents by Location
Incident Type (excludes EMS/Rescue 300 series)
Number Reported Use Rank Dept
A 2013
Dept B
2014
Dept C
2014 National
2013
Dept A
2013
Dept B
2014
Dept C
2014 National
2013 212 Overpressure rupture of steam boiler 1 0 0 457 117 133 132 133 213 Steam rupture of pressure or process vessel 7 1 0 195 91 127 132 140 220 Overpressure rupture from air or gas, other 1 3 2 973 117 108 111 123 221 Overpressure rupture of air or gas pipe/pipeline 13 3 5 1,894 80 108 91 110 222 Overpressure rupture of boiler from air or gas 1 0 173 117 133 132 143 223 Air or gas rupture of pressure or process vessel 25 2 2 568 66 115 111 131 231 Chemical reaction rupture of process vessel 11 0 2 445 85 133 111 135 240 Explosion (no fire), other 1 2 1 1,761 117 115 121 113 241 Munitions or bomb explosion (no fire) 2 0 0 255 111 133 132 138 242 Blasting agent explosion (no fire) 1 0 0 182 117 133 132 141 243 Fireworks explosion (no fire) 10 0 2 1,509 87 133 111 115 244 Dust explosion (no fire) 0 0 1 95 133 133 121 146 251 Excessive heat, scorch burns with no ignition 13 156 82 21,152 80 37 45 57 400 Hazardous condition, other 1 278 79 53,456 117 25 46 41 410 Combustible/flammable gas/liquid condition, other 3 46 21 8,810 105 60 65 83 411 Gasoline or other flammable liquid spill 146 210 73 41,269 35 29 48 44 412 Gas leak (natural gas or LPG) 394 767 535 159,894 22 9 12 13 413 Oil or other combustible liquid spill 23 229 23 19,365 69 28 64 61 420 Toxic condition, other 0 11 5 2,309 133 88 91 105 421 Chemical hazard (no spill or leak) 38 17 7 4,609 57 80 88 95 422 Chemical spill or leak 28 41 8 9,140 65 63 86 79 423 Refrigeration leak 3 4 4 1,044 105 104 98 120 424 Carbon monoxide incident 54 123 351 65,292 48 43 19 37
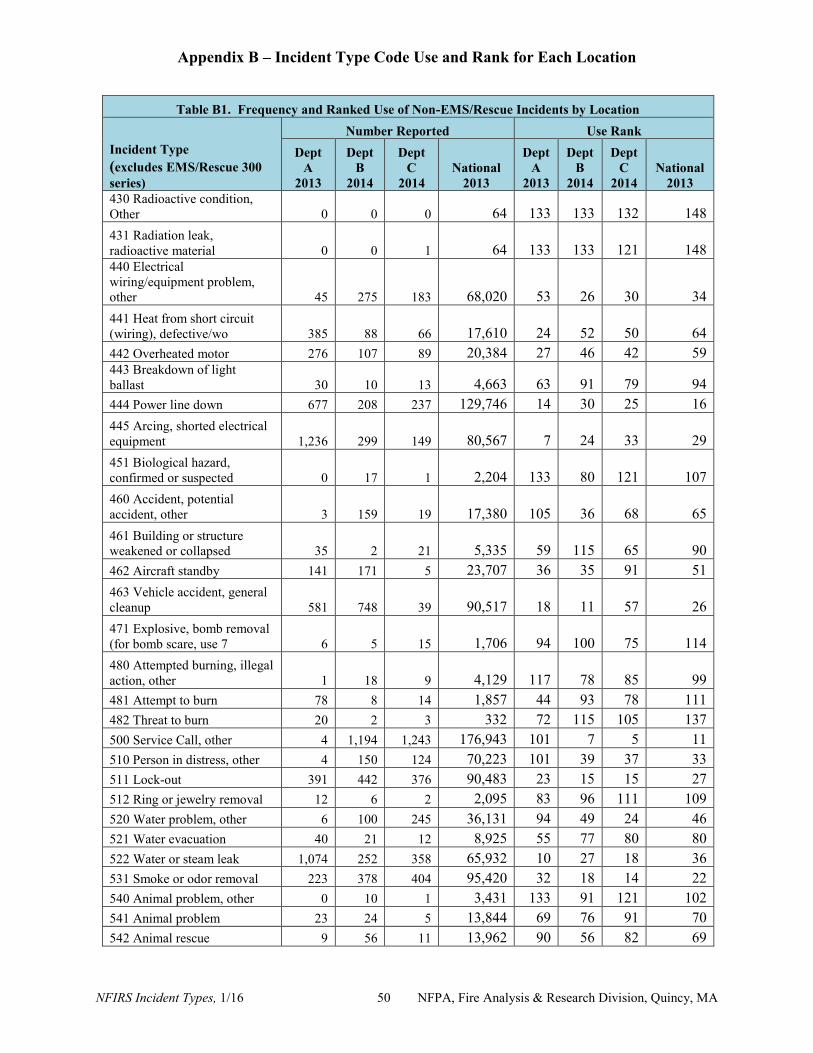
Appendix B – Incident Type Code Use and Rank for Each Location
NFIRS Incident Types, 1/16 50 NFPA, Fire Analysis & Research Division, Quincy, MA
Table B1. Frequency and Ranked Use of Non-EMS/Rescue Incidents by Location
Incident Type (excludes EMS/Rescue 300 series)
Number Reported Use Rank Dept
A 2013
Dept B
2014
Dept C
2014 National
2013
Dept A
2013
Dept B
2014
Dept C
2014 National
2013 430 Radioactive condition, Other 0 0 0 64 133 133 132 148 431 Radiation leak, radioactive material 0 0 1 64 133 133 121 148 440 Electrical wiring/equipment problem, other 45 275 183 68,020 53 26 30 34 441 Heat from short circuit (wiring), defective/wo 385 88 66 17,610 24 52 50 64 442 Overheated motor 276 107 89 20,384 27 46 42 59 443 Breakdown of light ballast 30 10 13 4,663 63 91 79 94 444 Power line down 677 208 237 129,746 14 30 25 16 445 Arcing, shorted electrical equipment 1,236 299 149 80,567 7 24 33 29 451 Biological hazard, confirmed or suspected 0 17 1 2,204 133 80 121 107 460 Accident, potential accident, other 3 159 19 17,380 105 36 68 65 461 Building or structure weakened or collapsed 35 2 21 5,335 59 115 65 90 462 Aircraft standby 141 171 5 23,707 36 35 91 51 463 Vehicle accident, general cleanup 581 748 39 90,517 18 11 57 26 471 Explosive, bomb removal (for bomb scare, use 7 6 5 15 1,706 94 100 75 114 480 Attempted burning, illegal action, other 1 18 9 4,129 117 78 85 99 481 Attempt to burn 78 8 14 1,857 44 93 78 111 482 Threat to burn 20 2 3 332 72 115 105 137 500 Service Call, other 4 1,194 1,243 176,943 101 7 5 11 510 Person in distress, other 4 150 124 70,223 101 39 37 33 511 Lock-out 391 442 376 90,483 23 15 15 27 512 Ring or jewelry removal 12 6 2 2,095 83 96 111 109 520 Water problem, other 6 100 245 36,131 94 49 24 46 521 Water evacuation 40 21 12 8,925 55 77 80 80 522 Water or steam leak 1,074 252 358 65,932 10 27 18 36 531 Smoke or odor removal 223 378 404 95,420 32 18 14 22 540 Animal problem, other 0 10 1 3,431 133 91 121 102 541 Animal problem 23 24 5 13,844 69 76 91 70 542 Animal rescue 9 56 11 13,962 90 56 82 69
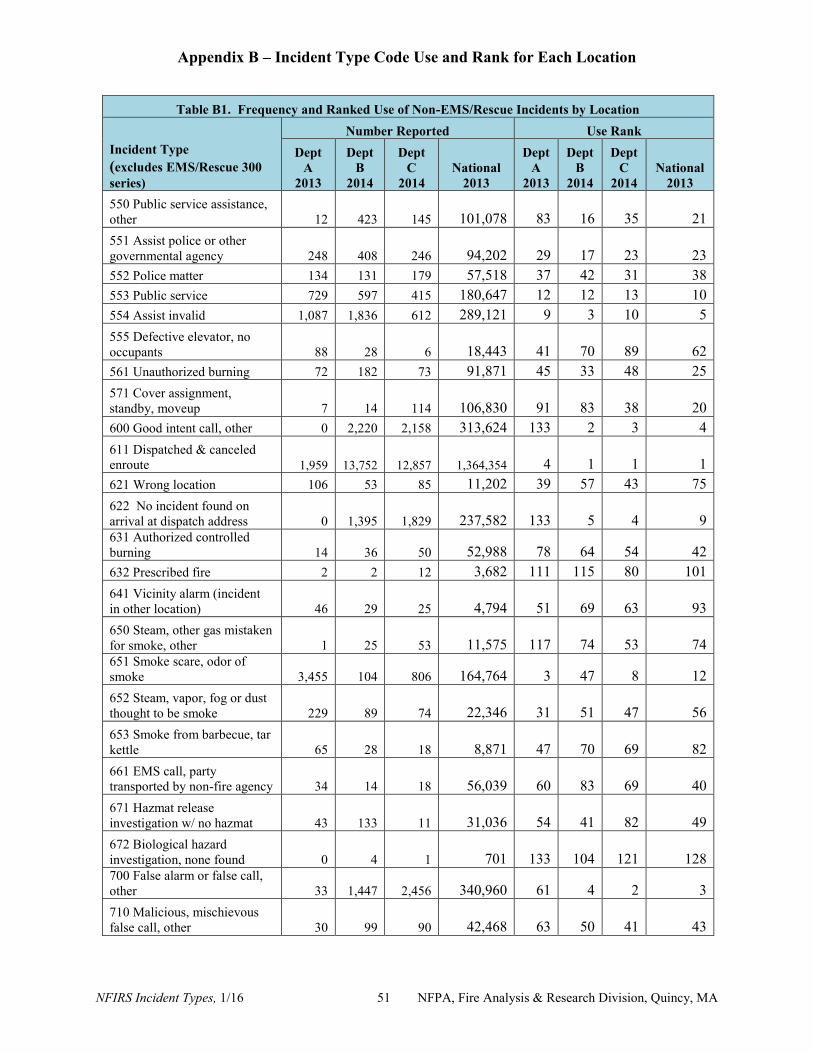
Appendix B – Incident Type Code Use and Rank for Each Location
NFIRS Incident Types, 1/16 51 NFPA, Fire Analysis & Research Division, Quincy, MA
Table B1. Frequency and Ranked Use of Non-EMS/Rescue Incidents by Location
Incident Type (excludes EMS/Rescue 300 series)
Number Reported Use Rank Dept
A 2013
Dept B
2014
Dept C
2014 National
2013
Dept A
2013
Dept B
2014
Dept C
2014 National
2013 550 Public service assistance, other 12 423 145 101,078 83 16 35 21 551 Assist police or other governmental agency 248 408 246 94,202 29 17 23 23 552 Police matter 134 131 179 57,518 37 42 31 38 553 Public service 729 597 415 180,647 12 12 13 10 554 Assist invalid 1,087 1,836 612 289,121 9 3 10 5 555 Defective elevator, no occupants 88 28 6 18,443 41 70 89 62 561 Unauthorized burning 72 182 73 91,871 45 33 48 25 571 Cover assignment, standby, moveup 7 14 114 106,830 91 83 38 20 600 Good intent call, other 0 2,220 2,158 313,624 133 2 3 4 611 Dispatched & canceled enroute 1,959 13,752 12,857 1,364,354 4 1 1 1 621 Wrong location 106 53 85 11,202 39 57 43 75 622 No incident found on arrival at dispatch address 0 1,395 1,829 237,582 133 5 4 9 631 Authorized controlled burning 14 36 50 52,988 78 64 54 42 632 Prescribed fire 2 2 12 3,682 111 115 80 101 641 Vicinity alarm (incident in other location) 46 29 25 4,794 51 69 63 93 650 Steam, other gas mistaken for smoke, other 1 25 53 11,575 117 74 53 74 651 Smoke scare, odor of smoke 3,455 104 806 164,764 3 47 8 12 652 Steam, vapor, fog or dust thought to be smoke 229 89 74 22,346 31 51 47 56 653 Smoke from barbecue, tar kettle 65 28 18 8,871 47 70 69 82 661 EMS call, party transported by non-fire agency 34 14 18 56,039 60 83 69 40 671 Hazmat release investigation w/ no hazmat 43 133 11 31,036 54 41 82 49 672 Biological hazard investigation, none found 0 4 1 701 133 104 121 128 700 False alarm or false call, other 33 1,447 2,456 340,960 61 4 2 3 710 Malicious, mischievous false call, other 30 99 90 42,468 63 50 41 43
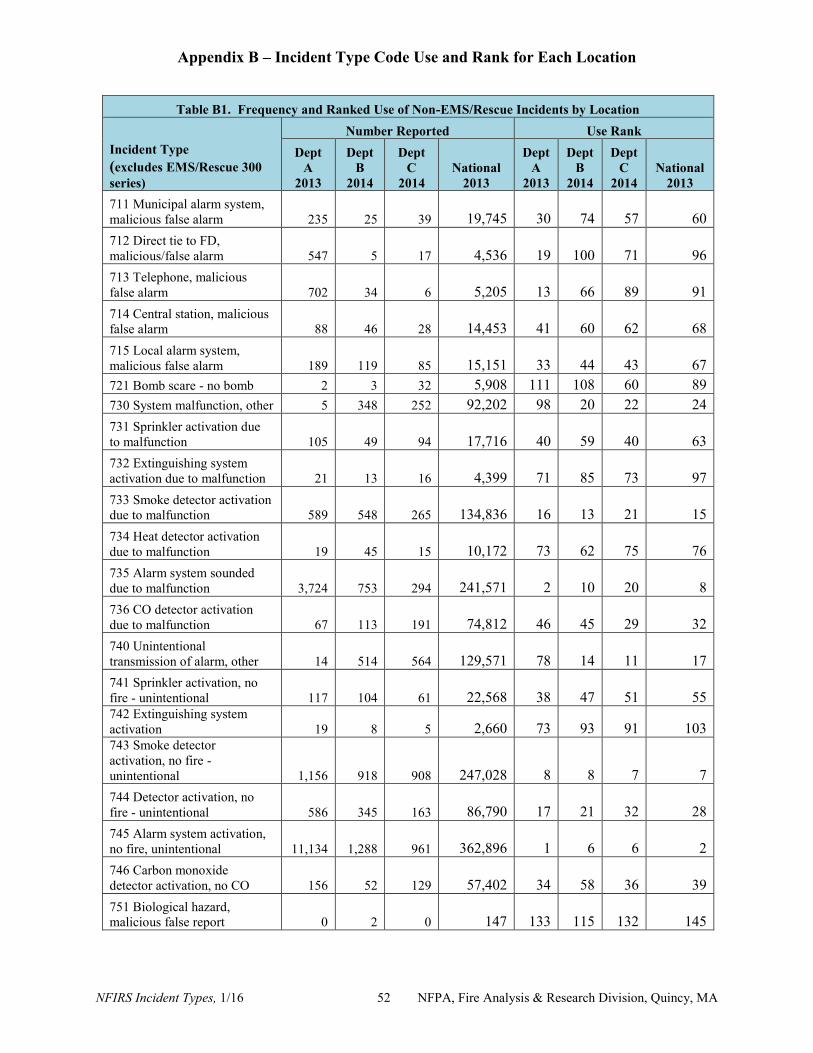
Appendix B – Incident Type Code Use and Rank for Each Location
NFIRS Incident Types, 1/16 52 NFPA, Fire Analysis & Research Division, Quincy, MA
Table B1. Frequency and Ranked Use of Non-EMS/Rescue Incidents by Location
Incident Type (excludes EMS/Rescue 300 series)
Number Reported Use Rank Dept
A 2013
Dept B
2014
Dept C
2014 National
2013
Dept A
2013
Dept B
2014
Dept C
2014 National
2013 711 Municipal alarm system, malicious false alarm 235 25 39 19,745 30 74 57 60 712 Direct tie to FD, malicious/false alarm 547 5 17 4,536 19 100 71 96 713 Telephone, malicious false alarm 702 34 6 5,205 13 66 89 91 714 Central station, malicious false alarm 88 46 28 14,453 41 60 62 68 715 Local alarm system, malicious false alarm 189 119 85 15,151 33 44 43 67 721 Bomb scare - no bomb 2 3 32 5,908 111 108 60 89 730 System malfunction, other 5 348 252 92,202 98 20 22 24 731 Sprinkler activation due to malfunction 105 49 94 17,716 40 59 40 63 732 Extinguishing system activation due to malfunction 21 13 16 4,399 71 85 73 97 733 Smoke detector activation due to malfunction 589 548 265 134,836 16 13 21 15 734 Heat detector activation due to malfunction 19 45 15 10,172 73 62 75 76 735 Alarm system sounded due to malfunction 3,724 753 294 241,571 2 10 20 8 736 CO detector activation due to malfunction 67 113 191 74,812 46 45 29 32 740 Unintentional transmission of alarm, other 14 514 564 129,571 78 14 11 17 741 Sprinkler activation, no fire - unintentional 117 104 61 22,568 38 47 51 55 742 Extinguishing system activation 19 8 5 2,660 73 93 91 103 743 Smoke detector activation, no fire - unintentional 1,156 918 908 247,028 8 8 7 7 744 Detector activation, no fire - unintentional 586 345 163 86,790 17 21 32 28 745 Alarm system activation, no fire, unintentional 11,134 1,288 961 362,896 1 6 6 2 746 Carbon monoxide detector activation, no CO 156 52 129 57,402 34 58 36 39 751 Biological hazard, malicious false report 0 2 0 147 133 115 132 145

Appendix B – Incident Type Code Use and Rank for Each Location
NFIRS Incident Types, 1/16 53 NFPA, Fire Analysis & Research Division, Quincy, MA
Table B1. Frequency and Ranked Use of Non-EMS/Rescue Incidents by Location
Incident Type (excludes EMS/Rescue 300 series)
Number Reported Use Rank Dept
A 2013
Dept B
2014
Dept C
2014 National
2013
Dept A
2013
Dept B
2014
Dept C
2014 National
2013 800 Severe weather or natural disaster, other 0 2 8 9,620 133 115 86 77 811 Earthquake assessment 0 0 0 171 133 133 132 144 812 Flood assessment 46 11 3 6,428 51 88 105 87 813 Wind storm, tornado/hurricane assessment 11 11 4 8,903 85 88 98 81 814 Lightning strike (no fire) 39 12 4 6,058 56 86 98 88 815 Severe weather or natural disaster standby 33 2 2 4,182 61 115 111 98 900 Special type of incident, other 1 33 148 146,616 117 68 34 14 911 Citizen complaint 257 186 36 22,907 28 31 59 53 Total incidents with any incident type coded 40,860 37,407 33,914 7,830,310 Number of records with no incident type code 86 455 4 385 Total incident records 40,946 37,862 33,918 7,830,695
Note: The U.S. Fire Administration’s National Fire Data Center provided the frequencies of incident types in the national database.

Appendix C – Rapid City Unwanted Alarm Study
NFIRS Incident Types, 1/16 54 NFPA, Fire Analysis & Research Division, Quincy, MA
Appendix C Study of Unwanted Alarms in Rapid City, SD
Monica Colby developed a new coding scheme for unwanted alarms in Rapid City, South Dakota based and applied it using narratives from 2014 NFIRS reports with Incident Type codes in the 700 series of false alarms, plus confined cooking fires (Incident type 113) where fire department assistance was not required. She then cross-referenced her codes with the NFIRS codes used by Rapid City Fire Department.
Table C1 lists the 41 specific codes used in the Rapid City study, obtained from an October 2015 draft report, Unwanted Alarm Analysis of Rapid City Fire Department 2014.
Table C1: Categories of Unwanted Alarms Used in the 2014 Special Study
Unwanted Alarm Type Explanation Cleared - CO alarm with probable cause but no problem upon arrival
When a CO detector alarmed, there probably was CO in the structure, but none was detected upon arrival - scene turned over to utilities
Cleared - other probable alarm but cleared upon arrival
We arrive and the panel is clear but an alarm did go off and probably for a good reason.
Emergency Exit - unintentional When someone accidentally opens, or partially opens, an alarmed emergency exit
Emergency Exit - unknown Unknown intent or cause of activation Emergency Exit - malicious Someone opens an alarmed emergency exit with the intent
to disrupt and knowing there is not a problem Emergency Exit - good intent Someone believes they need to use the alarmed exit Malfunction - Detector is damaged by contact or removed
Someone has struck or removed a detector and the system sends a full alarm rather than a trouble or supervisory
Malfunction - Detector is damaged by water
Water has leaked into the detector or wiring. Not set off by steam in the air but rather when water has caused damage to the system
Malfunction - Detector is dirty or oversensitive
Appears that the detector needs to be cleaned or reset. It should not have activated for the amount of particulate.
Malfunction - Detector due to ADA compliant setting/placement/full alarm
When the ADA apartment alarm activates because an alarm is required too near the cooking area or when ADA unit alarms are tied to the entire system but other units are independent loops
Malfunction - Detector malfunction/break, other (not monitoring)
Any other situation when the detector was damaged or not functioning properly
Malfunction - Sprinkler direct contact break (head, line, etc.)
When a sprinkler system is broken, generally due to someone running into it with machinery
Malfunction - Sprinkler pipe freeze
Sprinkler pipes froze and broke and are now leaking
Malfunction - Sprinkler/water line, other
When the sprinkler line has another problem that is not a freeze or direct contact break.
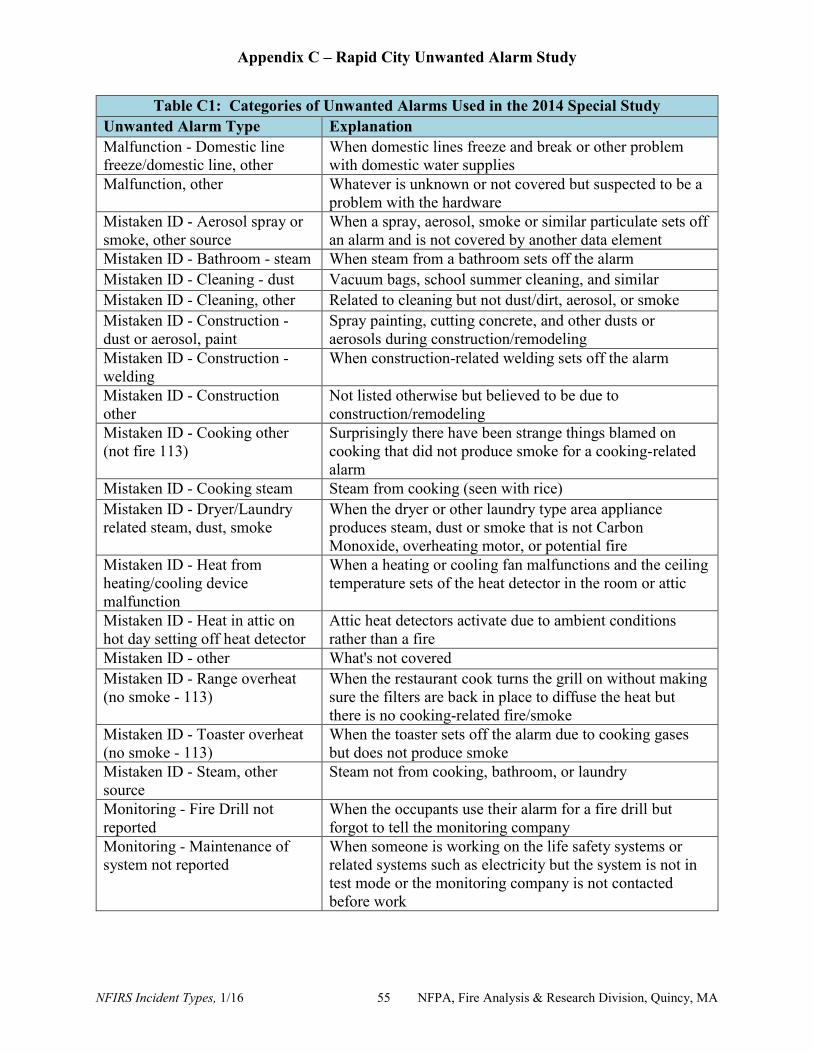
Appendix C – Rapid City Unwanted Alarm Study
NFIRS Incident Types, 1/16 55 NFPA, Fire Analysis & Research Division, Quincy, MA
Table C1: Categories of Unwanted Alarms Used in the 2014 Special Study Unwanted Alarm Type Explanation Malfunction - Domestic line freeze/domestic line, other
When domestic lines freeze and break or other problem with domestic water supplies
Malfunction, other Whatever is unknown or not covered but suspected to be a problem with the hardware
Mistaken ID - Aerosol spray or smoke, other source
When a spray, aerosol, smoke or similar particulate sets off an alarm and is not covered by another data element
Mistaken ID - Bathroom - steam When steam from a bathroom sets off the alarm Mistaken ID - Cleaning - dust Vacuum bags, school summer cleaning, and similar Mistaken ID - Cleaning, other Related to cleaning but not dust/dirt, aerosol, or smoke Mistaken ID - Construction - dust or aerosol, paint
Spray painting, cutting concrete, and other dusts or aerosols during construction/remodeling
Mistaken ID - Construction - welding
When construction-related welding sets off the alarm
Mistaken ID - Construction other
Not listed otherwise but believed to be due to construction/remodeling
Mistaken ID - Cooking other (not fire 113)
Surprisingly there have been strange things blamed on cooking that did not produce smoke for a cooking-related alarm
Mistaken ID - Cooking steam Steam from cooking (seen with rice) Mistaken ID - Dryer/Laundry related steam, dust, smoke
When the dryer or other laundry type area appliance produces steam, dust or smoke that is not Carbon Monoxide, overheating motor, or potential fire
Mistaken ID - Heat from heating/cooling device malfunction
When a heating or cooling fan malfunctions and the ceiling temperature sets of the heat detector in the room or attic
Mistaken ID - Heat in attic on hot day setting off heat detector
Attic heat detectors activate due to ambient conditions rather than a fire
Mistaken ID - other What's not covered Mistaken ID - Range overheat (no smoke - 113)
When the restaurant cook turns the grill on without making sure the filters are back in place to diffuse the heat but there is no cooking-related fire/smoke
Mistaken ID - Toaster overheat (no smoke - 113)
When the toaster sets off the alarm due to cooking gases but does not produce smoke
Mistaken ID - Steam, other source
Steam not from cooking, bathroom, or laundry
Monitoring - Fire Drill not reported
When the occupants use their alarm for a fire drill but forgot to tell the monitoring company
Monitoring - Maintenance of system not reported
When someone is working on the life safety systems or related systems such as electricity but the system is not in test mode or the monitoring company is not contacted before work
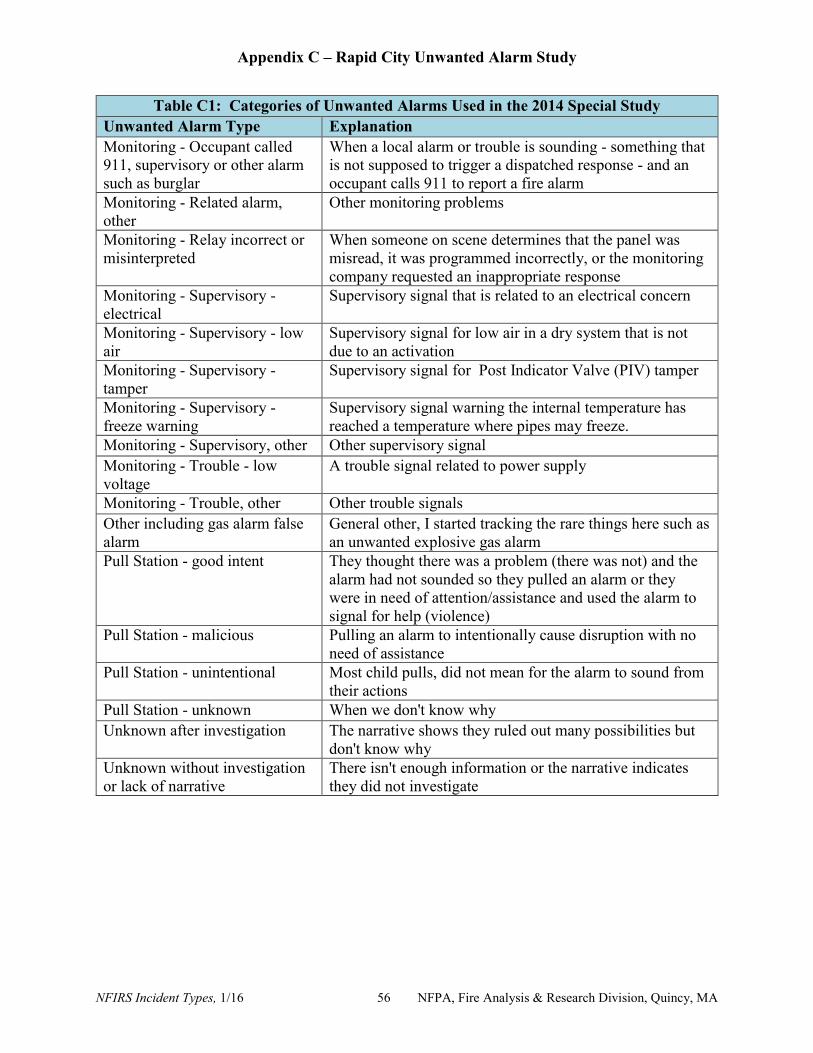
Appendix C – Rapid City Unwanted Alarm Study
NFIRS Incident Types, 1/16 56 NFPA, Fire Analysis & Research Division, Quincy, MA
Table C1: Categories of Unwanted Alarms Used in the 2014 Special Study Unwanted Alarm Type Explanation Monitoring - Occupant called 911, supervisory or other alarm such as burglar
When a local alarm or trouble is sounding - something that is not supposed to trigger a dispatched response - and an occupant calls 911 to report a fire alarm
Monitoring - Related alarm, other
Other monitoring problems
Monitoring - Relay incorrect or misinterpreted
When someone on scene determines that the panel was misread, it was programmed incorrectly, or the monitoring company requested an inappropriate response
Monitoring - Supervisory - electrical
Supervisory signal that is related to an electrical concern
Monitoring - Supervisory - low air
Supervisory signal for low air in a dry system that is not due to an activation
Monitoring - Supervisory - tamper
Supervisory signal for Post Indicator Valve (PIV) tamper
Monitoring - Supervisory - freeze warning
Supervisory signal warning the internal temperature has reached a temperature where pipes may freeze.
Monitoring - Supervisory, other Other supervisory signal Monitoring - Trouble - low voltage
A trouble signal related to power supply
Monitoring - Trouble, other Other trouble signals Other including gas alarm false alarm
General other, I started tracking the rare things here such as an unwanted explosive gas alarm
Pull Station - good intent They thought there was a problem (there was not) and the alarm had not sounded so they pulled an alarm or they were in need of attention/assistance and used the alarm to signal for help (violence)
Pull Station - malicious Pulling an alarm to intentionally cause disruption with no need of assistance
Pull Station - unintentional Most child pulls, did not mean for the alarm to sound from their actions
Pull Station - unknown When we don't know why Unknown after investigation The narrative shows they ruled out many possibilities but
don't know why Unknown without investigation or lack of narrative
There isn't enough information or the narrative indicates they did not investigate
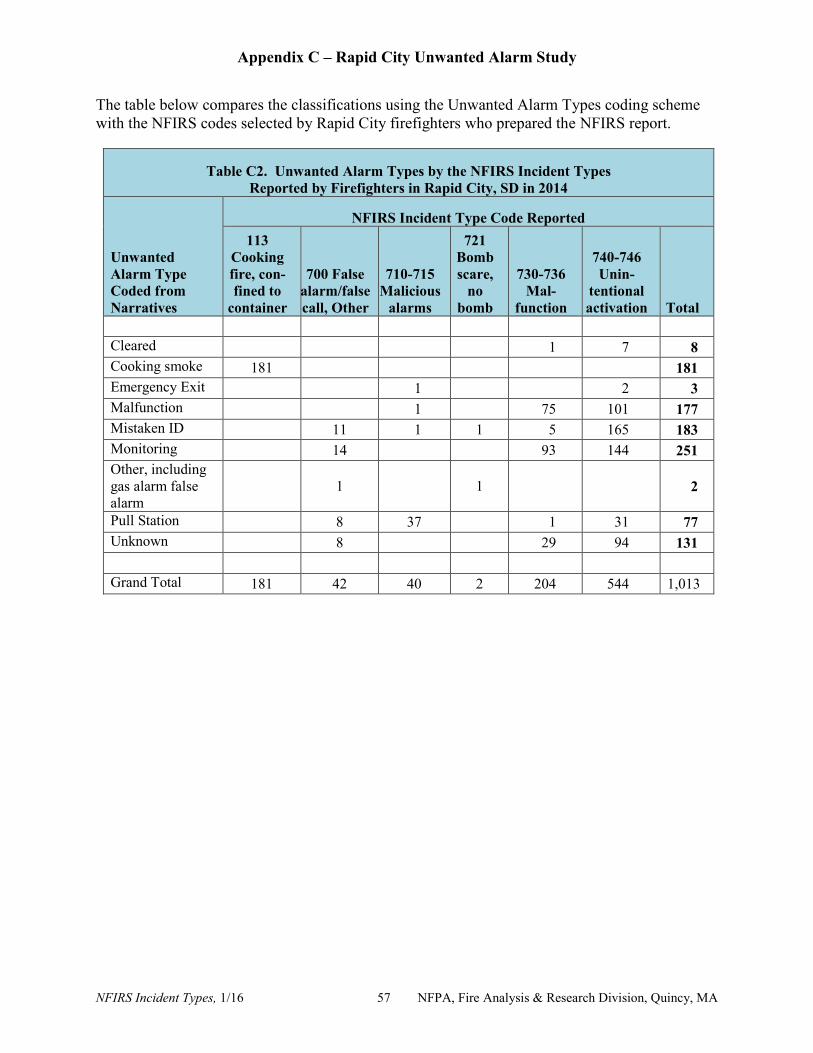
Appendix C – Rapid City Unwanted Alarm Study
NFIRS Incident Types, 1/16 57 NFPA, Fire Analysis & Research Division, Quincy, MA
The table below compares the classifications using the Unwanted Alarm Types coding scheme with the NFIRS codes selected by Rapid City firefighters who prepared the NFIRS report.
Table C2. Unwanted Alarm Types by the NFIRS Incident Types Reported by Firefighters in Rapid City, SD in 2014
Unwanted Alarm Type Coded from Narratives
NFIRS Incident Type Code Reported 113
Cooking fire, con-fined to
container
700 False alarm/false call, Other
710-715 Malicious
alarms
721 Bomb scare,
no bomb
730-736 Mal-
function
740-746 Unin-
tentional activation Total
Cleared 1 7 8 Cooking smoke 181 181 Emergency Exit 1 2 3 Malfunction 1 75 101 177 Mistaken ID 11 1 1 5 165 183 Monitoring 14 93 144 251 Other, including gas alarm false alarm
1 1 2
Pull Station 8 37 1 31 77 Unknown 8 29 94 131 Grand Total 181 42 40 2 204 544 1,013

Appendix D – Coding Inconsistencies between Incident Type & Related Fields
NFIRS Incident Types, 1/16 58 NFPA, Fire Analysis & Research Division, Quincy, MA
Appendix D Coding Inconsistencies between Incident Types and Data from other NFIRS Fields
Observed during NFPA Analyses
This appendix describes inconsistencies between incident types and other related data fields observed at the national level during the course of preparing various NFPA studies. The tables below utilize 2013 data, but the inconsistencies have been noted in other years as well.
Vehicle fires
Table D1 cross-tabulates vehicle fires by the type of mobile property type recorded elsewhere on the form. The rows with bolded text are those mobile property types where the coding choices appear to reflect inconsistencies in the coding structure related to passenger vehicles, road transport, and mass transit.
Table D1: 2013 NFIRS Vehicle Fires by Mobile Property Type
Mobile Property Type
Vehicle Fire Incident Types Coded (Percentages are by row)
131 Passenger
vehicle
132 Road freight or transport
vehicle
130 Mobile
property (vehicle
fire), Other
133-138 (all other
vehicle fire codes,
including Rail)
Number of
incidents (No Entered Value) 71% 8% 13% 8% 8,572 00 - Mobile property, other 16% 5% 65% 14% 1,991 10 - Passenger road vehicle, other 85% 0% 14% 0% 22,007 11 - Passenger car. 92% 0% 8% 0% 77,565 12 - Bus, school bus, trackless trolley 67% 17% 14% 1% 1,077 13 - Off-road recreational vehicle 16% 0% 15% 69% 821 14 - Motor home, camper, bookmobile. 8% 1% 6% 85% 1,385 15 - Trailer - travel, designed to be towed 6% 17% 29% 47% 858 16 - Trailer - camping, collapsible 5% 2% 4% 90% 109 17 - Mobile home 7% 1% 14% 77% 71 18 - Motorcycle, trail bike 49% 0% 43% 8% 1,083 20 - Freight road transport vehicle, other 6% 85% 8% 1% 2,814 21 - General use truck, dump truck, fire apparatus 30% 49% 16% 4% 2,333 22 - Pickup truck or hauling rig 77% 9% 13% 1% 2,253 23 - Trailer - semi, designed for freight 3% 92% 4% 1% 3,832 24 - Tank truck - nonflammable cargo 6% 79% 8% 7% 179 25 - Tank truck - flammable or combustible liquid 5% 84% 7% 3% 223 26 - Tank truck - compressed gas or LP-gas 12% 81% 4% 4% 26 27 - Garbage, waste, refuse truck 7% 64% 22% 7% 1,020 30 - Rail transport vehicle, other 4% 12% 3% 81% 67 31 - Diner car, passenger car - rail 50% 7% 14% 30% 44 32 - Box, freight, or hopper car - rail 8% 37% 6% 50% 109 33 - Tank car - rail 0% 14% 0% 86% 7 34 - Container or piggyback car - rail 6% 44% 0% 50% 18
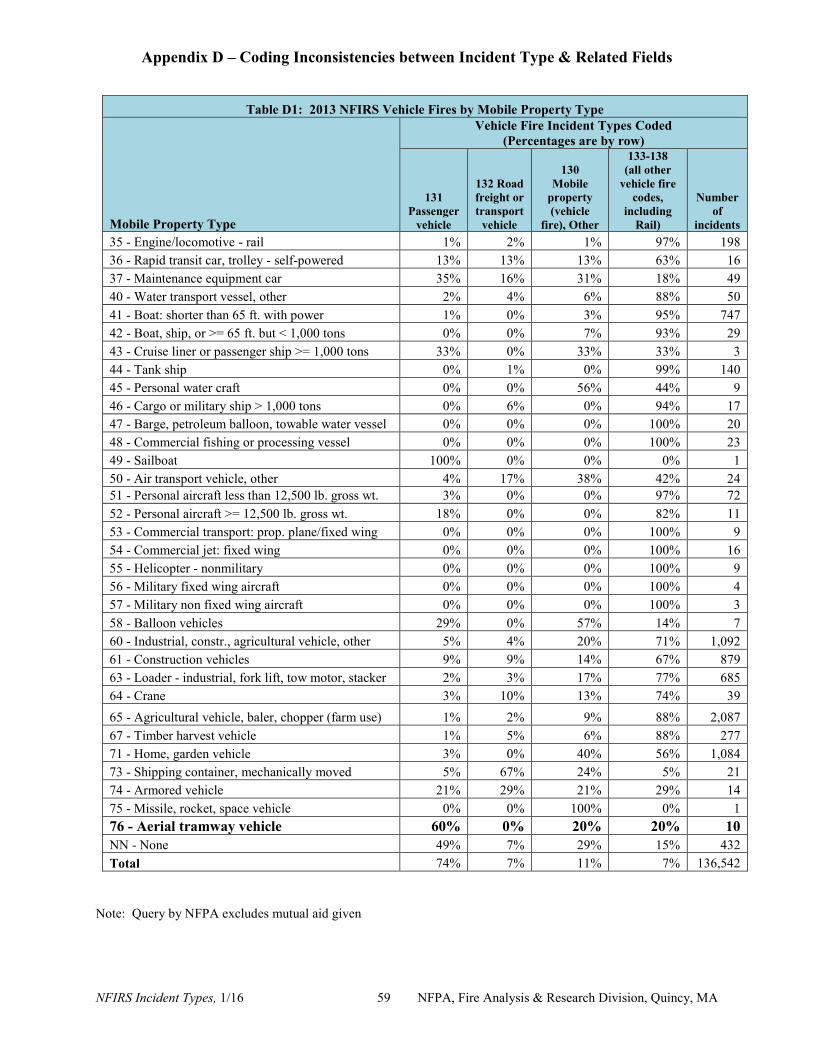
Appendix D – Coding Inconsistencies between Incident Type & Related Fields
NFIRS Incident Types, 1/16 59 NFPA, Fire Analysis & Research Division, Quincy, MA
Table D1: 2013 NFIRS Vehicle Fires by Mobile Property Type
Mobile Property Type
Vehicle Fire Incident Types Coded (Percentages are by row)
131 Passenger
vehicle
132 Road freight or transport
vehicle
130 Mobile
property (vehicle
fire), Other
133-138 (all other
vehicle fire codes,
including Rail)
Number of
incidents 35 - Engine/locomotive - rail 1% 2% 1% 97% 198 36 - Rapid transit car, trolley - self-powered 13% 13% 13% 63% 16 37 - Maintenance equipment car 35% 16% 31% 18% 49 40 - Water transport vessel, other 2% 4% 6% 88% 50 41 - Boat: shorter than 65 ft. with power 1% 0% 3% 95% 747 42 - Boat, ship, or >= 65 ft. but < 1,000 tons 0% 0% 7% 93% 29 43 - Cruise liner or passenger ship >= 1,000 tons 33% 0% 33% 33% 3 44 - Tank ship 0% 1% 0% 99% 140 45 - Personal water craft 0% 0% 56% 44% 9 46 - Cargo or military ship > 1,000 tons 0% 6% 0% 94% 17 47 - Barge, petroleum balloon, towable water vessel 0% 0% 0% 100% 20 48 - Commercial fishing or processing vessel 0% 0% 0% 100% 23 49 - Sailboat 100% 0% 0% 0% 1 50 - Air transport vehicle, other 4% 17% 38% 42% 24 51 - Personal aircraft less than 12,500 lb. gross wt. 3% 0% 0% 97% 72 52 - Personal aircraft >= 12,500 lb. gross wt. 18% 0% 0% 82% 11 53 - Commercial transport: prop. plane/fixed wing 0% 0% 0% 100% 9 54 - Commercial jet: fixed wing 0% 0% 0% 100% 16 55 - Helicopter - nonmilitary 0% 0% 0% 100% 9 56 - Military fixed wing aircraft 0% 0% 0% 100% 4 57 - Military non fixed wing aircraft 0% 0% 0% 100% 3 58 - Balloon vehicles 29% 0% 57% 14% 7 60 - Industrial, constr., agricultural vehicle, other 5% 4% 20% 71% 1,092 61 - Construction vehicles 9% 9% 14% 67% 879 63 - Loader - industrial, fork lift, tow motor, stacker 2% 3% 17% 77% 685 64 - Crane 3% 10% 13% 74% 39 65 - Agricultural vehicle, baler, chopper (farm use) 1% 2% 9% 88% 2,087 67 - Timber harvest vehicle 1% 5% 6% 88% 277 71 - Home, garden vehicle 3% 0% 40% 56% 1,084 73 - Shipping container, mechanically moved 5% 67% 24% 5% 21 74 - Armored vehicle 21% 29% 21% 29% 14 75 - Missile, rocket, space vehicle 0% 0% 100% 0% 1 76 - Aerial tramway vehicle 60% 0% 20% 20% 10 NN - None 49% 7% 29% 15% 432 Total 74% 7% 11% 7% 136,542
Note: Query by NFPA excludes mutual aid given
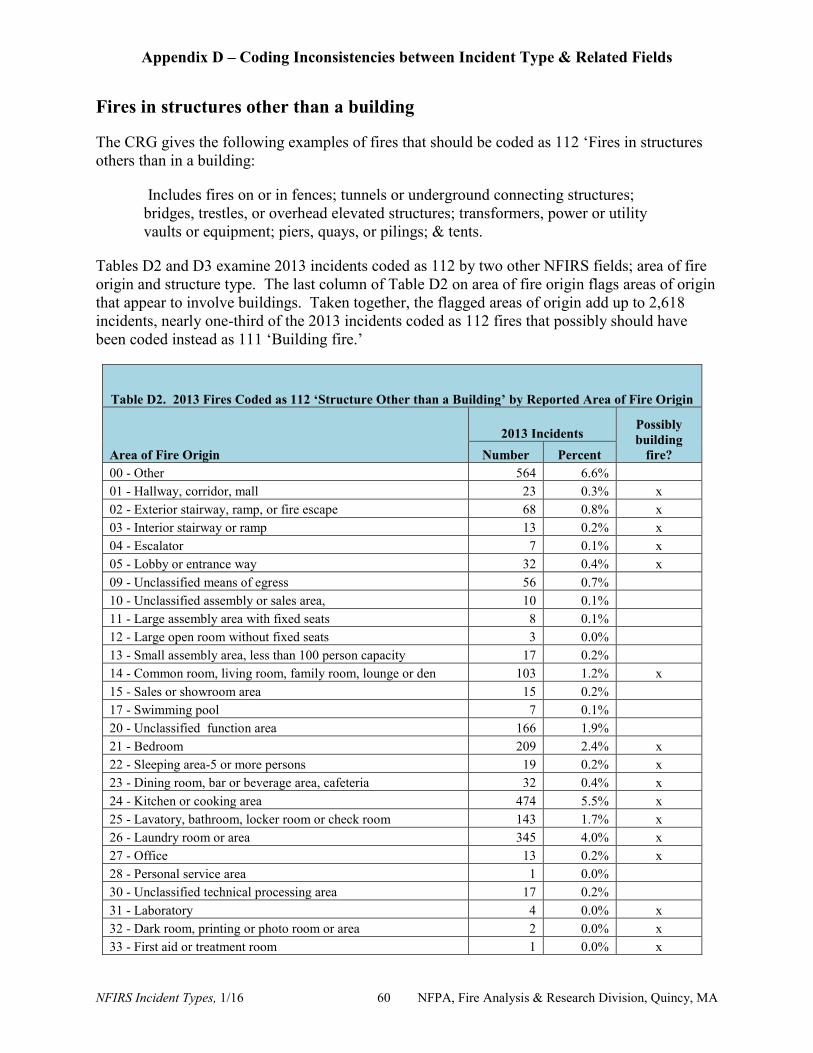
Appendix D – Coding Inconsistencies between Incident Type & Related Fields
NFIRS Incident Types, 1/16 60 NFPA, Fire Analysis & Research Division, Quincy, MA
Fires in structures other than a building
The CRG gives the following examples of fires that should be coded as 112 ‘Fires in structures others than in a building:
Includes fires on or in fences; tunnels or underground connecting structures; bridges, trestles, or overhead elevated structures; transformers, power or utility vaults or equipment; piers, quays, or pilings; & tents.
Tables D2 and D3 examine 2013 incidents coded as 112 by two other NFIRS fields; area of fire origin and structure type. The last column of Table D2 on area of fire origin flags areas of origin that appear to involve buildings. Taken together, the flagged areas of origin add up to 2,618 incidents, nearly one-third of the 2013 incidents coded as 112 fires that possibly should have been coded instead as 111 ‘Building fire.’
Table D2. 2013 Fires Coded as 112 ‘Structure Other than a Building’ by Reported Area of Fire Origin
Area of Fire Origin 2013 Incidents
Possibly building
fire? Number Percent 00 - Other 564 6.6% 01 - Hallway, corridor, mall 23 0.3% x 02 - Exterior stairway, ramp, or fire escape 68 0.8% x 03 - Interior stairway or ramp 13 0.2% x 04 - Escalator 7 0.1% x 05 - Lobby or entrance way 32 0.4% x 09 - Unclassified means of egress 56 0.7% 10 - Unclassified assembly or sales area, 10 0.1% 11 - Large assembly area with fixed seats 8 0.1% 12 - Large open room without fixed seats 3 0.0% 13 - Small assembly area, less than 100 person capacity 17 0.2% 14 - Common room, living room, family room, lounge or den 103 1.2% x 15 - Sales or showroom area 15 0.2% 17 - Swimming pool 7 0.1% 20 - Unclassified function area 166 1.9% 21 - Bedroom 209 2.4% x 22 - Sleeping area-5 or more persons 19 0.2% x 23 - Dining room, bar or beverage area, cafeteria 32 0.4% x 24 - Kitchen or cooking area 474 5.5% x 25 - Lavatory, bathroom, locker room or check room 143 1.7% x 26 - Laundry room or area 345 4.0% x 27 - Office 13 0.2% x 28 - Personal service area 1 0.0% 30 - Unclassified technical processing area 17 0.2% 31 - Laboratory 4 0.0% x 32 - Dark room, printing or photo room or area 2 0.0% x 33 - First aid or treatment room 1 0.0% x
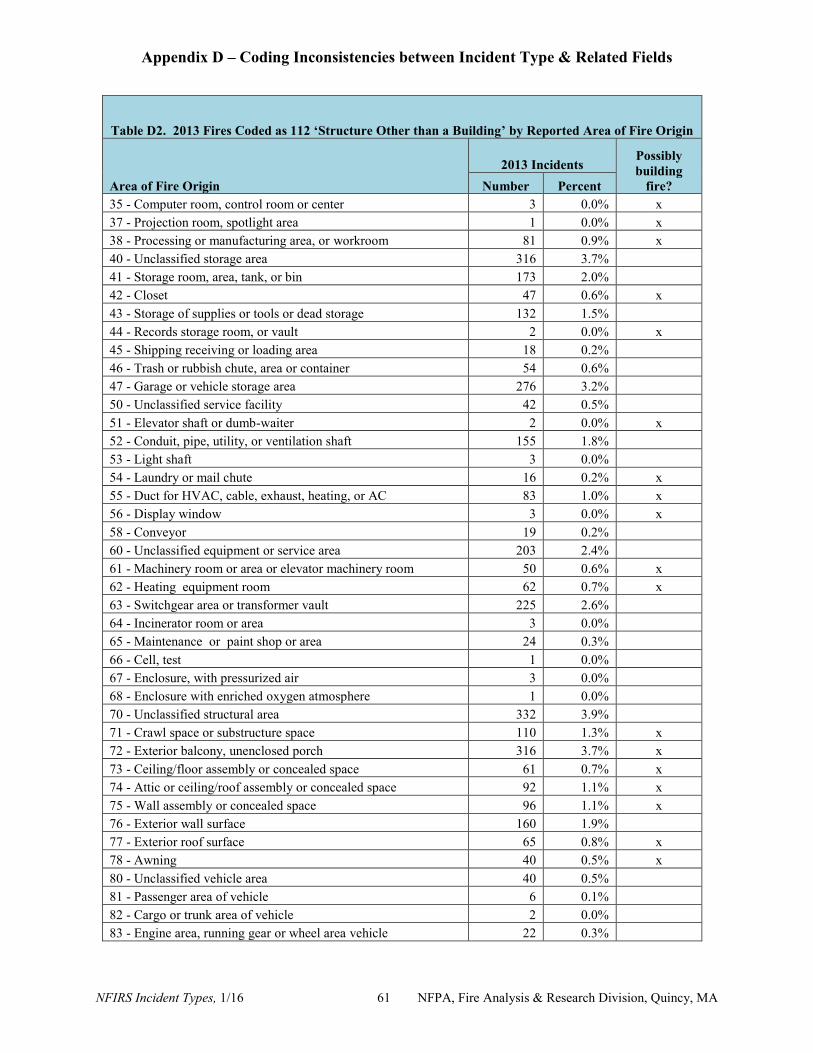
Appendix D – Coding Inconsistencies between Incident Type & Related Fields
NFIRS Incident Types, 1/16 61 NFPA, Fire Analysis & Research Division, Quincy, MA
Table D2. 2013 Fires Coded as 112 ‘Structure Other than a Building’ by Reported Area of Fire Origin
Area of Fire Origin 2013 Incidents
Possibly building
fire? Number Percent 35 - Computer room, control room or center 3 0.0% x 37 - Projection room, spotlight area 1 0.0% x 38 - Processing or manufacturing area, or workroom 81 0.9% x 40 - Unclassified storage area 316 3.7% 41 - Storage room, area, tank, or bin 173 2.0% 42 - Closet 47 0.6% x 43 - Storage of supplies or tools or dead storage 132 1.5% 44 - Records storage room, or vault 2 0.0% x 45 - Shipping receiving or loading area 18 0.2% 46 - Trash or rubbish chute, area or container 54 0.6% 47 - Garage or vehicle storage area 276 3.2% 50 - Unclassified service facility 42 0.5% 51 - Elevator shaft or dumb-waiter 2 0.0% x 52 - Conduit, pipe, utility, or ventilation shaft 155 1.8% 53 - Light shaft 3 0.0% 54 - Laundry or mail chute 16 0.2% x 55 - Duct for HVAC, cable, exhaust, heating, or AC 83 1.0% x 56 - Display window 3 0.0% x 58 - Conveyor 19 0.2% 60 - Unclassified equipment or service area 203 2.4% 61 - Machinery room or area or elevator machinery room 50 0.6% x 62 - Heating equipment room 62 0.7% x 63 - Switchgear area or transformer vault 225 2.6% 64 - Incinerator room or area 3 0.0% 65 - Maintenance or paint shop or area 24 0.3% 66 - Cell, test 1 0.0% 67 - Enclosure, with pressurized air 3 0.0% 68 - Enclosure with enriched oxygen atmosphere 1 0.0% 70 - Unclassified structural area 332 3.9% 71 - Crawl space or substructure space 110 1.3% x 72 - Exterior balcony, unenclosed porch 316 3.7% x 73 - Ceiling/floor assembly or concealed space 61 0.7% x 74 - Attic or ceiling/roof assembly or concealed space 92 1.1% x 75 - Wall assembly or concealed space 96 1.1% x 76 - Exterior wall surface 160 1.9% 77 - Exterior roof surface 65 0.8% x 78 - Awning 40 0.5% x 80 - Unclassified vehicle area 40 0.5% 81 - Passenger area of vehicle 6 0.1% 82 - Cargo or trunk area of vehicle 2 0.0% 83 - Engine area, running gear or wheel area vehicle 22 0.3%

Appendix D – Coding Inconsistencies between Incident Type & Related Fields
NFIRS Incident Types, 1/16 62 NFPA, Fire Analysis & Research Division, Quincy, MA
Table D2. 2013 Fires Coded as 112 ‘Structure Other than a Building’ by Reported Area of Fire Origin
Area of Fire Origin 2013 Incidents
Possibly building
fire? Number Percent 84 - Fuel tank or fuel line of vehicle 5 0.1% 86 - Exterior surface of vehicle 78 0.9% 90 - Unclassified outside area 770 9.0% 91 - On or near railroad right of way 46 0.5% 92 - On or near highway, public way or street 122 1.4% 93 - Courtyard, terrace or patio 250 2.9% 94 - Lawn, field or open area 193 2.3% 95 - Wildland area or woods 25 0.3% 96 - Construction or renovation area 27 0.3% 97 - Multiple areas of origin 22 0.3% 98 - Vacant structural area 74 0.9% UU - Undetermined 1,240 14.5% Total 8,544 100.0%
Note: Query by NFPA excludes mutual aid given
Table D3 shows a high level of usage of the nonspecific ‘Structure type, other’ category in the Structure Type field of the structure fire rather than provide a more specific description. More than half (57%) of NFIRS reports coded as involving 112 fires in non-building structures chose the generic other alternative. This is an extremely high use of an ‘other code’. It suggests the possibility that some officers may be reserving use of the 111 ‘Building fire’ code to fires where the structure of the building itself burns, as opposed small fires involving building contents only.
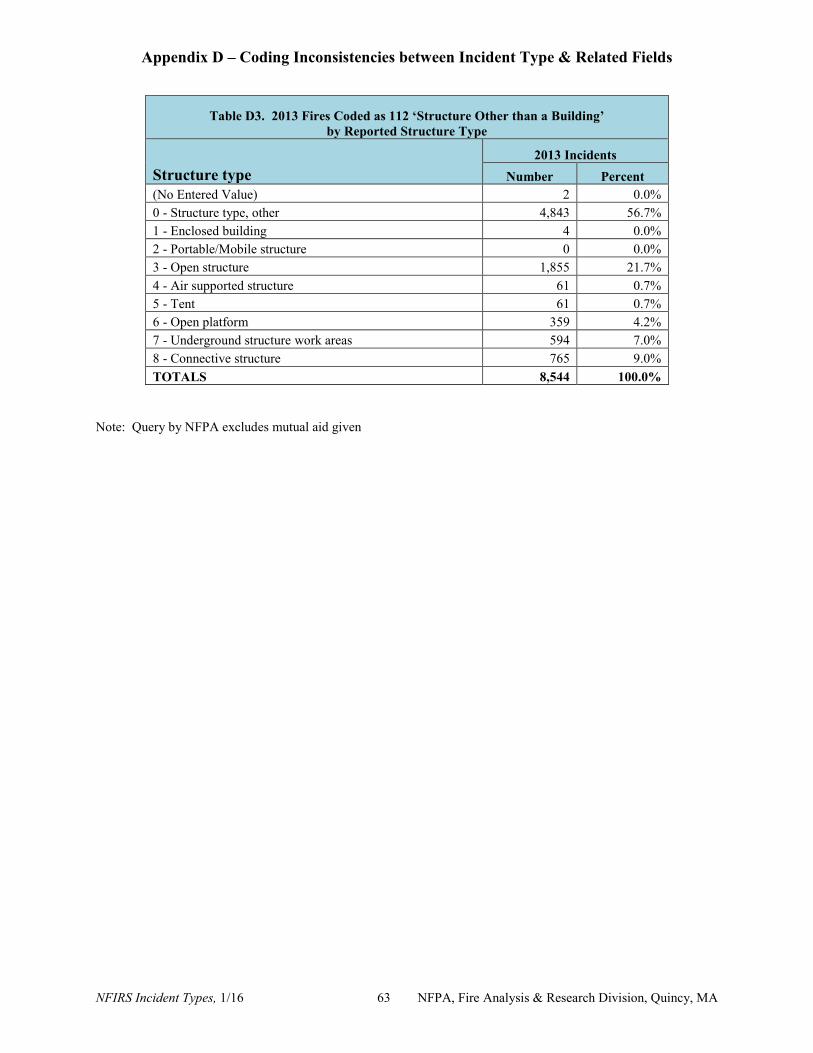
Appendix D – Coding Inconsistencies between Incident Type & Related Fields
NFIRS Incident Types, 1/16 63 NFPA, Fire Analysis & Research Division, Quincy, MA
Table D3. 2013 Fires Coded as 112 ‘Structure Other than a Building’ by Reported Structure Type
Structure type 2013 Incidents
Number Percent (No Entered Value) 2 0.0% 0 - Structure type, other 4,843 56.7% 1 - Enclosed building 4 0.0% 2 - Portable/Mobile structure 0 0.0% 3 - Open structure 1,855 21.7% 4 - Air supported structure 61 0.7% 5 - Tent 61 0.7% 6 - Open platform 359 4.2% 7 - Underground structure work areas 594 7.0% 8 - Connective structure 765 9.0% TOTALS 8,544 100.0%
Note: Query by NFPA excludes mutual aid given