Embed Size (px)
Citation preview
7/23/2019 NFA Final Report (1) (1)
http://slidepdf.com/reader/full/nfa-final-report-1-1 1/118
National Forest and Tree Resources Assessment 2005-2007
Bangladesh
Funding throughMinistry of Environment and Forest (MoEF), Bangladesh Food and Agriculture Organization of the United Nations (FAO)
Implementing AgenciesBangladesh Forest Department, MoEF
Bangladesh Space Research and Remote Sensing Organization,Ministry of Defence
Advisory and Technical supervisionFAO Forest Resources Development Service (FOMR)
EditingDan.Altrell, Mohamed.Saket, Leif Lyckebäck, Marco Piazza
Photo creditsDan Altrell
7/23/2019 NFA Final Report (1) (1)
http://slidepdf.com/reader/full/nfa-final-report-1-1 2/118
National Forest and Tree Resources Assessment 2005 – 2007, Bangladesh
2
TABLE OF CONTENTS
1. Introduction......................................................................................................................................12
1.1. General ...................................................................................................................................12
1.2. TAPP & FAO Support .............................................................................................................12
2. Background .....................................................................................................................................14
2.1. General History and Geography of Bangladesh.....................................................................14 2.1.1. Historical context............................................................................................................14
2.1.2. Geographical context .....................................................................................................14
2.2. Expressed need for the NFA ..................................................................................................15
2.3. FAO support to the NFA .........................................................................................................15 2.4. Existing information on forests and ToF.................................................................................16
2.4.1. The Sundarbans.............................................................................................................16
2.4.2. Sylhet Forests ................................................................................................................17
2.4.3. Forestal Forestry Engineering Inventory in Chittagong .................................................17
2.4.4. Village Forest Inventory .................................................................................................17
2.4.5. Forestry Master Plan......................................................................................................18 3. Objectives of the study ....................................................................................................................18
4. Resources for the implementation of the NFA ................................................................................19
4.1. General ...................................................................................................................................19 4.2. Analysis of the Remote Sensing Data....................................................................................20
4.3. Setup of NFAU........................................................................................................................20
4.4. Study Tour ..............................................................................................................................21 5. Field Survey Preparations...............................................................................................................22
6. Organisation and Management of NFA activities............................................................................23
7. Methodology....................................................................................................................................24
7.1. Sampling design .....................................................................................................................24
7.2. Tract, Plot and Subplot design ...............................................................................................24
7.3. Classification system ..............................................................................................................26 7.4. Variables.................................................................................................................................27
7.5. Training of field crews.............................................................................................................27
7.6. Field Data Collection – Measurements, Observations and Interviews...................................28
7.7. Data entry, processing and analysis.......................................................................................29 7.7.1. Data entry.......................................................................................................................29 7.7.2. Data processing .............................................................................................................29
7.7.3. Data analysis..................................................................................................................29
7.8. Remote sensing......................................................................................................................30
8. NFA Data base application..............................................................................................................31
8.1. Tables .....................................................................................................................................31
8.1.1. Code tables ....................................................................................................................31 8.1.2. Data tables .....................................................................................................................31
8.1.3. Relation database ..........................................................................................................32
8.2. Forms......................................................................................................................................33
8.3. Queries ...................................................................................................................................34
9. Results.............................................................................................................................................35
9.1. Area ........................................................................................................................................35 9.1.1. The area of Bangladesh by Land Use Classes .............................................................36
9.1.2. Forest area divided into natural and plantation forest....................................................38
9.1.3. Forest area by Forest Types..........................................................................................38
9.1.4. The area of Bangladesh by Tree Cover Classes...........................................................39
9.1.5. Forest area by Tree Cover Classes...............................................................................39 9.1.6. Cultivated land area by Tree Cover Classes .................................................................40
9.1.7. Village area by Tree Cover Classes ..............................................................................41
9.1.8. Built-up areas by Tree Cover Classes ...........................................................................41
9.1.9. Inland water by Tree Cover Classes..............................................................................42
9.1.10. Forest types area by Tree Cover Classes .....................................................................43
9.1.11. Bangladesh total area by classes of protection level.....................................................43 9.1.12. Forest types by classes of protection level....................................................................44
9.1.13. The area of Bangladesh by type of ownership ..............................................................45 9.1.14. The area of state owned and individually owned land by major National LUC .............46
7/23/2019 NFA Final Report (1) (1)
http://slidepdf.com/reader/full/nfa-final-report-1-1 3/118
National Forest and Tree Resources Assessment 2005 – 2007, Bangladesh
3
9.1.15. The area of Bangladesh by Global Ecological Zones (GEZ).........................................47
9.1.16. The area of Bangladesh by Environmental problems....................................................51
9.1.17. Environmental problems in the different forest types.....................................................52
9.1.18. Expected change in tree cover by major National LUC.................................................52
9.1.19. Expected future trees in the different forest types .........................................................53 9.1.20. Forest area – management agreements and management plans.................................53
9.1.21. Forest area – stand origin ..............................................................................................54 9.1.22. Forest area – stand structure.........................................................................................54
9.1.23. Forest area – shrub coverage........................................................................................55
9.1.24. Forest area – degree of disturbance..............................................................................56
9.1.25. Forest area – fire occurrence.........................................................................................57 9.1.26. Forest area – timber exploitation ...................................................................................57
9.1.27. Forest area – silviculture................................................................................................58
9.1.28. Forest area – technology for tree exploitation ...............................................................60
9.2. Volume....................................................................................................................................61
9.2.1. Tree volumes by major National Land Use Class..........................................................62
9.2.2. The total gross and commercial volume for the major National LUCs ..........................62
9.2.3. The total gross and commercial volume for the different forest types...........................63
9.2.4. The gross and commercial volume per hectare for the different forest types ...............64
9.2.5. The total gross volume of Bamboo in the major National LUCs....................................64 9.2.6. Tree volumes for the most common tree species..........................................................64
9.2.7. Volume proportions of the total gross volume by tree species in “Forest” ....................65 9.2.8. Volume proportions of the total gross volume by tree species in “Cultivated land”.......66
9.2.9. Volume proportions of the total gross volume by tree species in “Villages” ..................66
9.2.10. Volume proportions of the total gross volume by tree species in “Built up areas”.........67
9.2.11. Volume proportions of the total gross volume by tree species in “Inland water” ...........68
9.2.12. Tree volumes per Global-ecological zones (GEZs)....................................................... 68
9.2.13. Volume and stems per hectare by Dbh-class................................................................69 9.2.14. Gross volume and stems per hectare per Dbh-class for the major National Land
Use Classes .....................................................................................................................69
9.2.15. Gross volume and stems per hectare per Dbh-class for the different forest types .......70
9.2.16. Volume by stem quality class by major LUC .................................................................71
9.2.17. Gross volume by stem quality class per forest type ......................................................72 9.2.18. Commercial volume for the most important timber species for the major National
Land Use Classes in Bangladesh ....................................................................................72
9.2.19. Commercial volume per Dbh-class for the most important timber species for thetotal area of Bangladesh................................................................................................75
9.2.20. Commercial volume per stem quality class for the most important timber speciesfor the total area of Bangladesh .......................................................................................76
9.2.21. Gross volume in Major LUCs by health class ................................................................76
9.2.22. Gross volume in major LUCs by Health affecting agents ..............................................77
9.2.23. Gross volume in each forest type by health class .........................................................78
9.2.24. Gross volume in major forest types by Health affecting agents ....................................79
9.2.25. Number of stumps per hectare by Diameter class and stump age per majorNational LUC ....................................................................................................................80
9.3. Biodiversity and regeneration .................................................................................................83 9.3.1. Biodiversity.....................................................................................................................83
9.3.2. Biodiversity index for the major National LUC ...............................................................83
9.3.3. Regeneration..................................................................................................................83
9.3.4. Number of stems per hectare of Dbh 1-10 cm (regeneration) in the different foresttypes .................................................................................................................................84
9.4. Social and economical............................................................................................................85
9.4.1. Estimated population for tracts with high forest content and for tracts without (orlow) forest content ............................................................................................................85
9.4.2. Number of years since populated for tracts with high forest content and for tractswithout (or low) forest content ..........................................................................................85
9.4.3. Trend of population for tracts with high forest content and for tracts without (or low)forest content....................................................................................................................86
9.4.4. Main activity of the permanent population for tracts with high forest content and fortracts without (or low) forest content ................................................................................87
7/23/2019 NFA Final Report (1) (1)
http://slidepdf.com/reader/full/nfa-final-report-1-1 4/118
National Forest and Tree Resources Assessment 2005 – 2007, Bangladesh
4
9.4.5. Products and services - general ....................................................................................87
9.4.6. The area where each of product/service is used, in three classes of importance –for the total area of Bangladesh .......................................................................................88
9.4.7. Products and services - conflicts ...................................................................................89
9.4.8. Products and services – demand and supply................................................................90 9.4.9. Products and services – important species ...................................................................92
9.4.10. Products and services – users of forestry products/services ........................................93 9.4.11. Products and services – User rights to forestry products / services..............................95
9.4.12. Products and services – organizational level and gender balance................................96
9.4.13. Products and services – Gender balance among harvesters/users of forestryproducts/services..............................................................................................................98
9.4.14. Products and services – end-use.................................................................................100
9.4.15. Products and services – frequency of harvesting/usage .............................................101
9.4.16. Products and services – trend of harvesting/usage.....................................................103
9.5. Biomass and carbon .............................................................................................................105
9.5.1. The total biomass and the biomass per hectare for the total area of Bangladeshand for the major National LUC......................................................................................106
9.5.2. The total (aboveground) carbon and the (aboveground) carbon per hectare for thetotal area of Bangladesh and for the major National LUCs............................................106
10. Comparison of NFA-results earlier national statistics ...............................................................107 10.1. Area comparisons ............................................................................................................107
10.2. Volume comparisons........................................................................................................109 10.2.1. Comparison Of Village Forest Inventory: Gross Tree Volume With Nfa Gross Volume 109
11. Conclusions...............................................................................................................................112
12. Recommendations ....................................................................................................................113
12.1. Future monitoring .............................................................................................................113
12.2. Additional information needs............................................................................................113
12.3. Actions for resources development..................................................................................114 12.4. International reporting ......................................................................................................114
12.5. Capacity building ..............................................................................................................115
13. Bibliography and reference literature........................................................................................116
LIST OF FIGURES FIGURE 1: LOCATION MAP OF BANGLADESH ........................................................... ................................................. 14 FIGURE 2: TRACT, PLOT AND SUBPLOT DESIGN........................................................ ................................................. 25 FIGURE 3: ILLUSTRATION OF THE RELATIONSHIP BETWEEN DIFFERENT DATA TABLES ............................................. 32 FIGURE 4: LOCATION OF DATABASE FILES..................................................... ........................................................... 32 FIGURE 5: DATABASE WINDOW IN THE NFA APPLICATION DATABASE (“NFI-<COUNTRY> V.X.X.MDB”)
SHOWING SOME OF THE CODE TABLES IN THE DATABASE (BEGINNING WITH “C-“) AND SOME OF THE
LINKED DATA TABLES (WITH AN ARROW SYMBOL NEXT TO THE TABLE SYMBOL)............................................ 33 FIGURE 6: DATABASE WINDOW IN THE NFA APPLICATION DATABASE (“ NFI-<COUNTRY> V . X . X . MDB”)
SHOWING SOME OF THE FORMS THAT ARE EMPLOYED IN THE DATABASE APPLICATION. .................................. 34 FIGURE 7: DATABASE WINDOW IN THE NFA APPLICATION DATABASE (“ NFI-<COUNTRY> V . X . X . MDB”)
SHOWING THE QUERIES IN THE DATABASE APPLICATION. ................................................................................ 34 FIGURE 8: TOTAL AREA OF BANGLADESH DIVIDED INTO MAJOR NATIONAL LUCS .................................................. 36 FIGURE 9: PROPORTION OF PLANTATION AND NATURAL FOREST OVER TOTAL FOREST AREA ................................. 38 FIGURE 10: FOREST AREA BY FOREST TYPES ........................................................... ................................................. 38 FIGURE 11: TOTAL AREA OF BANGLADESH BY TREE COVER CLASSES .................................................. .................... 39 FIGURE 12: FOREST AREA BY TREE COVER CLASSES.......................................................... ....................................... 40 FIGURE 13: CULTIVATED LAND AREA BY TREE COVER CLASSES........................................................... .................... 40 FIGURE 14: VILLAGE AREA BY TREE COVER CLASSES (%).......................................................... .............................. 41 FIGURE 15: BUILT-UP AREA BY TREE COVER CLASSES....................................................... ....................................... 42 FIGURE 16: INLAND WATER AREA BY TREE COVER CLASSES ...................................................... .............................. 42 FIGURE 17: FOREST TYPES AREA BY TREE COVER CLASSES (%) ............................................................................... 43 FIGURE 18: MAJOR LUCS BY CLASSES OF PROTECTION LEVEL (%)................................... ....................................... 44 FIGURE 19: FOREST TYPES BY CLASSES OF PROTECTION LEVEL (%)..................................................... .................... 45 FIGURE 20: MAJOR NATIONAL LUCS BY OWNERSHIP CLASS (%)............................................... .............................. 46 FIGURE 21: STATE OWNED LAND BY MAJOR NATIONAL LUC (1000 HA) .................................................................. 46
7/23/2019 NFA Final Report (1) (1)
http://slidepdf.com/reader/full/nfa-final-report-1-1 5/118
National Forest and Tree Resources Assessment 2005 – 2007, Bangladesh
5
FIGURE 22: INDIVIDUALLY OWNED LAND BY MAJOR NATIONAL LUC (1000 HA) ..................................................... 47 FIGURE 23: GLOBAL ECOLOGICAL DOMAINS (FAO 2001)......................................................... .............................. 47 FIGURE 24: GLOBAL ECOLOGICAL ZONES (FAO 2001)..................................................... ....................................... 48 FIGURE 25: GLOBAL ECOLOGICAL ZONES OF BANGLADESH (INCLUDING NFA TRACTS) ......................................... 49 FIGURE 26: AREA PROPORTIONS OF GLOBAL ECOLOGICAL ZONES IN BANGLADESH ............................................... 50 FIGURE 27: DISTRIBUTION OF MAJOR LAND USES IN THE TROPICAL RAINFOREST ZONE........................................... 50
FIGURE 28: DISTRIBUTION OF MAJOR LAND USES IN THE TROPICAL MOIST FOREST ZONE ....................................... 50 FIGURE 29: EXPECTED CHANGE IN TREE COVER BY MAJOR NATIONAL LUC (1000 HA) ........................................... 52 FIGURE 30: EXPECTED CHANGE IN TREE COVER BY FOREST TYPE (1000 HA)..................... ....................................... 53 FIGURE 31: FOREST TYPES BY CLASSES OF STAND STRUCTURE (1000 HA) ............................................................... 55 FIGURE 32: FOREST TYPES BY CLASSES OF SHRUB COVERAGE (1000 HA)................ ................................................. 56 FIGURE 33: FOREST TYPES BY DEGREE OF DISTURBANCE (1000 HA) ........................................................................ 57 FIGURE 34: AVERAGE GROSS AND COMMERCIAL VOLUME PER HECTARE FOR MAJOR NATIONAL LUCS .................. 62 FIGURE 35: PERCENTAGE OF TOTAL GROSS VOLUME BY MAJOR NATIONAL LUC .................................................... 63 FIGURE 36: PERCENTAGE OF TOTAL COMMERCIAL VOLUME BY MAJOR NATIONAL LUC......................................... 63 FIGURE 37: TOTAL GROSS VOLUME BY FOREST TYPE (%)........................................ ................................................. 63 FIGURE 38: TOTAL COMMERCIAL VOLUME BY FOREST TYPE (%) ............................................................................. 63 FIGURE 39: AVERAGE GROSS AND COMMERCIAL VOLUME PER HECTARE BY FOREST TYPE ...................................... 64 FIGURE 40: PERCENTAGE OF TOTAL GROSS VOLUME PER SPECIES........................................................ .................... 65
FIGURE 41: PERCENTAGE OF TOTAL GROSS VOLUME IN “FOREST” PER SPECIES ....................................................... 65 FIGURE 42: PERCENTAGE OF TOTAL GROSS VOLUME IN “CULTIVATED LAND” PER SPECIES ..................................... 66 FIGURE 43: PERCENTAGE OF TOTAL GROSS VOLUME IN “VILLAGES” PER SPECIES ................................................... 67 FIGURE 44: PERCENTAGE OF TOTAL GROSS VOLUME IN “BUILT UP AREAS” PER SPECIES ......................................... 67 FIGURE 45: PERCENTAGE OF TOTAL GROSS VOLUME IN “INLAND WATER” PER SPECIES ........................................... 68 FIGURE 46: GROSS VOLUME PER HECTARE FOR THE GEO-ECOLOGICAL ZONES BY MAJOR NATIONAL LUC............. 68 FIGURE 47: GROSS VOLUME PER HECTARE BY DBH CLASS OVER TOTAL AREA OF BANGLADESH ............................. 69 FIGURE 48: STEMS PER HECTARE BY DBH CLASS OVER TOTAL AREA OF BANGLADESH............................................ 69 FIGURE 49: GROSS VOLUME PER HECTARE BY DBH CLASS IN MAJOR LAND USE CLASSES (M
3) ................................. 70
FIGURE 50: STEMS PER HECTARE BY DBH CLASS IN MAJOR LAND USE CLASSES ....................................................... 70 FIGURE 51: GROSS TREE VOLUME PER HECTARE BY DIAMETER CLASS IN DIFFERENT FOREST TYPES ....................... 71 FIGURE 52: STEMS PER HECTARE BY DIAMETER CLASS IN DIFFERENT FOREST TYPES ............................................... 71 FIGURE 53: GROSS VOLUME PER HECTARE IN MAJOR LUCS BY HEALTH CLASS ....................................................... 77
FIGURE 54: PROPORTION OF GROSS VOLUME IN MAJOR LUCS BY HEALTH AFFECTING AGENTS (%)........................ 78 FIGURE 55: GROSS VOLUME PER HECTARE IN FOREST TYPES BY HEALTH CLASS ...................................................... 79 FIGURE 56: PROPORTION OF GROSS VOLUME IN FOREST TYPES BY HEALTH AFFECTING AGENTS ............................. 80 FIGURE 57: TOTAL NUMBER OF STUMPS / HA IN BANGLADESH ................................................... .............................. 81 FIGURE 58: TOTAL NUMBER OF STUMPS / HA IN FOREST.................................................... ....................................... 81 FIGURE 59: TOTAL NUMBER OF STUMPS / HA IN CULTIVATED LAND ..................................................... .................... 82 FIGURE 60: TOTAL NUMBER OF STUMPS / HA IN VILLAGES ......................................................... .............................. 82 FIGURE 61: NUMBER OF REGENERATION STEMS (DBH < 10 CM) PER HECTARE FOR DIFFERENT FOREST TYPES......... 84 FIGURE 62: ESTIMATED POPULATION PER KM
2 FOR AREAS WITH HIGH (>25%) AND LOW (<25%) FOREST
CONTENT ...................................................... ............................................................ ....................................... 85 FIGURE 63: NUMBER OF YEARS SINCE POPULATED BY AREA WITH HIGH AND LOW FOREST CONTENT ...................... 86 FIGURE 64: TREND OF POPULATION BY AREAS WITH HIGH AND LOW FOREST CONTENT ........................................... 86 FIGURE 65: MAIN ACTIVITY OF PERMANENT POPULATION BY AREAS WITH HIGH AND LOW FOREST CONTENT ......... 87
FIGURE 66: IMPORTANCE (LOW / MEDIUM / HIGH) OF FORESTRY PRODUCTS / SERVICES THAT ARE HARVESTED / USEDIN BANGLADESH, PRESENTED AS AREA IN WHICH THE THEY ARE HARVESTED / USED........................................ 88
FIGURE 67: PROPORTION OF FOREST AREA WITH USER CONFLICTS BY PRODUCT TYPE ............................................ 89 FIGURE 68: PROPORTION OF CULTIVATED LAND AREA WITH USER CONFLICTS BY PRODUCT TYPE ........................... 89 FIGURE 69: PROPORTION OF VILLAGE AREA WITH USER CONFLICTS BY PRODUCT TYPE ........................................... 90 FIGURE 70: SUPPLY / DEMAND BALANCE FOR PRODUCTS AND SERVICES IN “FOREST” AREA ................................... 90 FIGURE 71: SUPPLY / DEMAND BALANCE FOR PRODUCTS AND SERVICES IN “CULTIVATED LAND” AREA ................. 91 FIGURE 72: SUPPLY / DEMAND BALANCE FOR PRODUCTS AND SERVICES IN “VILLAGE” AREA................................. 91 FIGURE 73: USERS OF MOST IMPORTANT PRODUCTS AND SERVICES IN “FOREST” AREA ........................................... 93 FIGURE 74: USERS OF MOST IMPORTANT PRODUCTS AND SERVICES IN “CULTIVATED LAND” AREA ......................... 94 FIGURE 75: USERS OF MOST IMPORTANT PRODUCTS AND SERVICES IN “INLAND WATER” AREA............................... 94 FIGURE 76: USER RIGHT FOR THE MOST IMPORTANT PRODUCTS / SERVICES IN “FOREST” AREA............................... 95 FIGURE 77: USER RIGHT FOR THE MOST IMPORTANT PRODUCTS / SERVICES IN “CULTIVATED LAND” AREA ............. 95
FIGURE 78: USER RIGHT FOR THE MOST IMPORTANT PRODUCTS / SERVICES IN “VILLAGE” AREA............................. 96 FIGURE 79: ORGANIZATION LEVEL FOR THE MOST IMPORTANT PRODUCTS / SERVICES IN “FOREST” AREA ................ 96
7/23/2019 NFA Final Report (1) (1)
http://slidepdf.com/reader/full/nfa-final-report-1-1 6/118
National Forest and Tree Resources Assessment 2005 – 2007, Bangladesh
6
FIGURE 80: ORGANIZATION LEVEL FOR THE MOST IMPORTANT PRODUCTS / SERVICES IN “CULTIVATED LAND”
AREA .................................................. ............................................................ ................................................. 97 FIGURE 81: ORGANIZATION LEVEL FOR THE MOST IMPORTANT PRODUCTS / SERVICES IN “VILLAGE” AREA .............. 97 FIGURE 82: GENDER BALANCE AMONG HARVESTERS / USERS OF PRODUCTS / SERVICES IN “FOREST” AREA.............. 98 FIGURE 82: GENDER BALANCE AMONG HARVESTERS / USERS OF PRODUCTS / SERVICES IN “CULTIVATED AREA” ..... 98 FIGURE 82: GENDER BALANCE AMONG HARVESTERS / USERS OF PRODUCTS / SERVICES IN “VILLAGES” ................... 99
FIGURE 82: END USE OF MOST IMPORTANT PRODUCTS / SERVICES IN “FOREST” AREA ........................................... 100 FIGURE 83: ORGANIZATION LEVEL FOR THE MOST IMPORTANT PRODUCTS / SERVICES IN “CULTIVATED LAND”
AREA .................................................. ............................................................ ............................................... 100 FIGURE 84: ORGANIZATION LEVEL FOR THE MOST IMPORTANT PRODUCTS / SERVICES IN “VILLAGE” AREA ............ 101 FIGURE 85: FREQUENCY OF HARVEST / USE OF MOST IMPORTANT PRODUCTS AND SERVICES IN “FOREST” AREA ... 101 FIGURE 86: FREQUENCY OF HARVEST / USE OF MOST IMPORTANT PRODUCTS AND SERVICES IN “CULTIVATED
LAND” AREA ........................................................... ........................................................... ............................ 102 FIGURE 87: FREQUENCY OF HARVEST / USE OF MOST IMPORTANT PRODUCTS AND SERVICES IN “VILLAGE” AREA. 102 FIGURE 88: TREND OF HARVEST / USAGE OF THE MOST COMMON / IMPORTANT PRODUCTS / SERVICES IN THE
“FOREST” AREA...................................................... ........................................................... ............................ 103 FIGURE 89: TREND OF HARVEST / USAGE OF THE MOST COMMON / IMPORTANT PRODUCTS / SERVICES IN THE
“CULTIVATED LAND” AREA........................................................ ........................................................... ........ 103 FIGURE 90: TREND OF HARVEST / USAGE OF THE MOST COMMON / IMPORTANT PRODUCTS / SERVICES IN THE
“VILLAGE” AREA.................................................... ........................................................... ............................ 104 FIGURE 91 : VOLUME PER HECTARE IN VFI 1981 AND AVERAGE VOLUME PER HECTARE IN GROUPED “OTHER
LAND & INLAND WATER” AS PER NFA 2005-2006, PRESENTED BY VFI 1981 STRATA................................. 111 FIGURE 92 : VOLUME PER HECTARE IN VFI 1981 AND AVERAGE VOLUME PER HECTARE IN “VILLAGES” AS PER
NFA 2005-2006, PRESENTED BY VFI 1981 STRATA .......................................................... ............................ 111
LIST OF TABLES TABLE 1: THE TOTAL COST BREAK UP OF THE NFA ACTIVITIES ........................................................... .................... 12 TABLE 2 : MEMBERS OF NFAU OF FD .......................................................... ........................................................... 21 TABLE 3 : LIST OF OTHER MEMBERS OF FD CLOSELY INVOLVED WITH THE NFA ACTIVITIES ................................ 21 TABLE 4 : ZONE AND REGION WISE NUMBERS OF TRACTS USED IN NFA SURVEY.................................................... 22 TABLE 5 : CONSTITUTION OF EACH NFA SURVEY TEAM ........................................................... .............................. 23
TABLE 6 : NATIONAL LAND USE CLASSIFICATION SYSTEM AND NATIONAL / INTERNATIONAL GROUPING................. 26 TABLE 7 : LAND USE AND FOREST TYPE LEGEND FOR LAND USE MAPPING .................................................. .......... 30 TABLE 8: AREA OF MAJOR NATIONAL LUCS (1000 HA)............ ........................................................... .................... 36 TABLE 9: TOTAL AREA OF BANGLADESH BY NATIONAL LAND USE CLASSES .......................................................... 36 TABLE 10: FOREST AREA BY FOREST TYPES (1000 HA).................................. ........................................................... 38 TABLE 11: TOTAL AREA OF BANGLADESH BY TREE COVER CLASSES (1000 HA)................ ....................................... 39 TABLE 12: FOREST AREA BY TREE COVER CLASSES........................................................... ....................................... 39 TABLE 13: CULTIVATED LAND AREA BY TREE COVER CLASSES (1000 HA) ............................................................... 40 TABLE 14: VILLAGE AREA BY TREE COVER CLASSES (1000 HA) ........................................................... .................... 41 TABLE 15: BUILT-UP AREA BY TREE COVER CLASSES (1000 HA) .......................................................... .................... 41 TABLE 16: INLAND WATER AREA BY TREE COVER CLASSES (1000 HA).......... ........................................................... 42 TABLE 17: FOREST TYPES AREA BY TREE COVER CLASSES (1000 HA)................................................... .................... 43 TABLE 18: MAJOR LUCS BY CLASSES OF PROTECTION LEVEL (1000 HA)....................................................... .......... 43 TABLE 19: FOREST TYPES BY CLASSES OF PROTECTION LEVEL (1000 HA) ................................................................ 44 TABLE 20: MAJOR NATIONAL LUCS BY OWNERSHIP CLASS (1000 HA)................... ................................................. 45 TABLE 21: GLOBAL ECOLOGICAL ZONES (FAO 2001).............. ........................................................... .................... 48 TABLE 22: TOTAL AREA OF BANGLADESH AND MAJOR LUCS BY GEZ CLASSES (1000 HA)..................................... 48 TABLE 23: ENVIRONMENTAL PROBLEMS IN MAJOR NATIONAL LUCS (%) ............................................................... 51 TABLE 24: ENVIRONMENTAL PROBLEMS IN DIFFERENT FOREST TYPES (%) ............................................................. 52 TABLE 25: FOREST AREA BY TYPE OF MANAGEMENT AND BY FOREST TYPES (1000 HA).......................................... 53 TABLE 26: FOREST AREA BY FOREST TYPE AND STAND ORIGIN (1000 HA) ............................................................... 54 TABLE 27: FOREST AND FOREST TYPE BY CLASSES OF STAND STRUCTURE (1000 HA) .............................................. 54 TABLE 28: FOREST AND FOREST TYPES BY CLASSES OF SHRUB COVERAGE (1000 HA).............................................. 55 TABLE 29: FOREST AND FOREST TYPES BY DEGREE OF DISTURBANCE (1000 HA) ..................................................... 56 TABLE 30: FOREST AND FOREST TYPES BY CLASSES OF FIRE OCCURRENCE (1000 HA) ............................................. 57 TABLE 31: TIMBER EXPLOITATION AREA BY FOREST TYPES (1000 HA) .................................................................... 58 TABLE 32: AREA BY FOREST TYPES AND TYPE OF TIMBER EXPLOITATION TECHNIQUE (1000 HA) ............................ 58 TABLE 33: AREA WITH SILVICULTURE PRACTICES BY FOREST TYPES (1000 HA)....................................................... 59
7/23/2019 NFA Final Report (1) (1)
http://slidepdf.com/reader/full/nfa-final-report-1-1 7/118
National Forest and Tree Resources Assessment 2005 – 2007, Bangladesh
7
TABLE 34: AREA BY FOREST TYPES AND TYPE OF SILVICULTURE (1000 HA) ............................................................ 60 TABLE 35: AREA BY FOREST TYPE AND TYPE OF TECHNOLOGY USED (1000 HA) ...................................................... 60 TABLE 36: TOTAL GROSS AND COMMERCIAL VALUE FOR MAJOR NATIONAL LUCS (MILLION M
3) ........................... 62 TABLE 37: TOTAL GROSS AND COMMERCIAL VOLUME BY FOREST TYPE (MILLION M3) ............................................ 63 TABLE 38: BAMBOO CULM VOLUME ('000 M
3) IN MAJOR LAND USE CLASS ........................................................... 64 TABLE 39: GROSS VOLUME (1000 M
3) BY STEM QUALITY CLASS AND MAJOR NATIONAL LUC................................ 71
TABLE 40: GROSS VOLUME (1000 M
3
) BY STEM QUALITY CLASS AND FOREST TYPE................................................ 72 TABLE 41, 42 AND 43: COMMERCIAL VOLUME OF THE 25 MOST IMPORTANT SPECIES IN THE LUC FOREST,
CULTIVATED LAND AND VILLAGES ...................................................... ........................................................... 73 TABLE 44 AND 45: COMMERCIAL VOLUME OF THE 25 MOST IMPORTANT SPECIES IN THE LUC BUILT UP AREAS
AND INLAND WATER ......................................................... ........................................................... .................... 74 TABLE 46: COMMERCIAL VOLUME PER DIAMETER CLASS IN BANGLADESH (1000 M
3) ............................................. 75 TABLE 47: COMMERCIAL VOLUME PER STEM QUALITY CLASS IN BANGLADESH (1000 M
3) ...................................... 76
TABLE 48: GROSS VOLUME IN MAJOR LUCS BY HEALTH CLASS (1000 M3) .............................................................. 76
TABLE 49: GROSS VOLUME (1000 M3) IN MAJOR LUCS BY HEALTH AFFECTING AGENT .......................................... 77
TABLE 50: GROSS VOLUME (1000 M3) IN FOREST TYPES BY HEALTH CLASS................................................... .......... 78
TABLE 51: GROSS VOLUME (1000 M3) IN FOREST TYPES BY HEALTH AFFECTING AGENT .......................................... 79
TABLE 52: TOTAL NUMBER OF STUMPS (1000) IN MAJOR LAND USE CLASS, BY DBH............................................ 80 TABLE 53: DIVERSITY INDEX AND EQUITABILITY ................................................... ................................................. 83
TABLE 54: NUMBER OF REGENERATION STEMS,(DBH <10 CM) PER HECTARE OF THE MOST IMPORTANT SPECIESIN MAJOR NATIONAL LUC “FOREST” ................................................... ........................................................... 84
TABLE 55 : AREA IN WHICH FORESTRY PRODUCTS AND SERVICES ARE HARVESTED / USED (1000 HA) ....................... 87 TABLE 56: THE MOST IMPORTANT TREE SPECIES FOR PRODUCTS AND SERVICES IN "FOREST" (TREE COUNT IN
THE NFA).... ........................................................... ........................................................... .............................. 92 TABLE 57: THE MOST IMPORTANT TREE SPECIES FOR PRODUCTS AND SERVICES IN "CULTIVATED LAND" (TREE
COUNT IN THE NFA)......................................................... ........................................................... .................... 92 TABLE 58: THE MOST IMPORTANT TREE SPECIES FOR PRODUCTS AND SERVICES IN "VILLAGES" (TREE COUNT IN
THE NFA).... ........................................................... ........................................................... .............................. 93 TABLE 59: TOTAL BIOMASS AND BIOMASS PER HECTARE IN THE MAJOR LAND USE CLASSES ................................. 106 TABLE 60: TOTAL CARBON AND CARBON PER HECTARE IN THE MAJOR LAND USE CLASSES ................................... 106 TABLE 61 : COMPARISON OF NFA FINDINGS WITH BBS 2004 REPORTED DATA ON AREAS ................................... 107 TABLE 62 : LAND USE CLASSES, WITH CORRESPONDING ALPHANUMERIC AND NUMERIC CODES, FOR WHICH
GROSS VOLUME INCLUDING TREES WITH DBH ≥20CM WAS CALCULATED ....................................................... 109 TABLE 63 : COMPARISON OF GROSS VOLUME AS PER VFI 1981 WITH AVERAGE GROSS VOLUME IN GROUPED
“OTHER LAND & INLAND WATER” AS PER NFA 2005-2006 ....................................................... .................. 110 TABLE 64 : COMPARISON OF VOLUME PER HECTARE IN VFI 1981 WITH VOLUME PER HECTARE IN SR0, SR1
AND SR2 OF NFA 2005-2006..................................................... ........................................................... ........ 110
LIST OF ANNEXES ANNEX I LAND USE CLASSIFICATION - DEFINITIONS ....................................................... ..................................... 119 ANNEX II FIELD FORMS.................................................. ........................................................... ............................ 123 ANNEX III NFA VARIABLES AND RELATED ATTRIBUTES .......................................................... ............................ 132 ANNEX IV GEOGRAPHIC COORDINATES (LATITUDE / LONGITUDE) OF NFA SAMPLE UNITS (TRACT SW
CORNER, PLOT STARTING POINT, TRACT CENTRE) ........................................................... ............................ 135 ANNEX V GETTING STARTED WITH THE NFA DATABASE .......................................................... ............................ 141 ANNEX VI GUIDELINES FOR NFA DATA PROCESSING ..................................................... ..................................... 152 ANNEX VII FAO STATISTICAL GUIDE LINES ......................................................... ............................................... 169 ANNEX VIII LIST OF ALL TREE SPECIES MEASURED DURING THE FIELD INVENTORY ............................................. 174 ANNEX IX LAND USE / FOREST TYPE MAP ........................................................... ............................................... 179 ANNEX X LANDSAT TM IMAGERIES USED FOR THE REMOTE SENSING SURVEY................................................... 183 ANNEX XI RESULTS WITH DESCRIPTIVE STATISTICS......................................................... ..................................... 185 ANNEX XII NFA FIELD MANUAL....................................................... ........................................................... ........ 196 ANNEX XIII RESULTS FOR INTERNATIONAL REPORTING (FRA 2010).................... ............................................... 280
7/23/2019 NFA Final Report (1) (1)
http://slidepdf.com/reader/full/nfa-final-report-1-1 8/118
National Forest and Tree Resources Assessment 2005 – 2007, Bangladesh
8
List of AcronymsAbbreviations Details
ACF Assistant Conservator of ForestsADB Asian Development BankAGB Above Ground BiomassBBS Bangladesh Bureau of Statistics
BEF Biomass Expansion FactorBFRI Bangladesh Forest Research InstituteBUA Built Up AreaCBD Convention of Biological DiversityCCF Chief Conservator of ForestsCF Conservator of ForestsCft Cubic Feet
CHT Chittagong Hill TractsCu M Cubic MeterDBH Diameter Breast Height
DCCF Deputy Chief Conservator of ForestsDCF Deputy Conservator of ForestsDFO Divisional Forest Officer
FAO Food and Agriculture Organization of United NationsFB Bamboo ForestFD Forest DepartmentFF Form FactorFH Hill ForestFM Mangrove ForestFo Forest
FOMR Forest Resources Development Service, FAO RomeFRA Forest Resources Assessment program of FAO
FRMP Forest Resource Management ProjectFSa Sal ForestGEZ Global Ecological ZonesGI Galvanized Iron
GIS Geographic Information SystemGLU Global Land Use classGOB Government of BangladeshGPS Global Positioning SystemHa HectareIC International ConsultantIW Inland Water
LTU Lead Technical Unit at FAO (=FOMR)LU Land UseMIS Management Information System
MOEF Ministry of Environment and Forest
NFANational Forest Assessment / FAO’s support programme for national forestassessments
NFAU National Forest Assessment UnitNIC National Information System ConsultantNPC National Project CoordinatorNPD National Project Director
NWFP-AP Non Wood Forest Product – Animal ProductsNWFP-PP Non Wood Forest Product – Plant Products
ODA Overseas Development AdministrationOL Other Land
OWL Other Wooded LandPL Long Rotation PlantationPM Mangrove PlantationPR Rubber PlantationPS Short Rotation Plantation
RIMS Resource Information Management SystemSLU Swedish Agricultural University

7/23/2019 NFA Final Report (1) (1)
http://slidepdf.com/reader/full/nfa-final-report-1-1 9/118
National Forest and Tree Resources Assessment 2005 – 2007, Bangladesh
9
Abbreviations DetailsSOB Survey of Bangladesh
SPARRSO Space Research and Remote Sensing OrganizationTAPP Technical Assistance Project ProposalTCDC Technical Cooperation between Developing CountriesTOC Table of Contents
TOF Trees Outside ForestTOR Terms of ReferenceUNCED United Nations Conference on Environment and Development
VOB Volume Over BarkWD Wood Density
7/23/2019 NFA Final Report (1) (1)
http://slidepdf.com/reader/full/nfa-final-report-1-1 10/118
National Forest and Tree Resources Assessment 2005 – 2007, Bangladesh
10
Executive Summary
The National Forest and Tree Resources Assessment 2005-2007 is the first of its kind inBangladesh. The initiative for the assessment originated from the signing of the Rioconvention in 1992, which states that “timely, reliable and accurate information on forestsand forest ecosystems is essential for public understanding and informed decision- making” . In Bangladesh, a broad knowledge on the forest and tree resources is neededfor redefining the policy and strategy of Bangladesh Forest Department as well as fordeveloping a comprehensive National Forestry Action Plan (NFAP) which is considered ahigh priority after the work on the current inventory was concluded.
Bangladesh Forest Department (BFD), lead institution and responsible for theimplementation of this first national forest and tree resources assessment (NFA), carriedout the field data collection during 2005 - 2006 while the Bangladesh Space Researchand Remote Sensing Organization (SPARRSO), responsible for the remote sensingsurvey, employed Landsat TM data from 2005 for mapping the land uses and foresttypes. The overall technical supervision of the NFA implementation has been provided by
FAO Forestry department in Rome (FOMR), who also provided technical assistance tothe GoB to strengthen the capacities of BFD in the area of planning and implementingNFAs, including methodology development, sampling design, harmonization of land useclassifications, mapping, field survey, data management and reporting.
The long-term objective of NFA is to promote sustainable management of the forests andtree resources in Bangladesh founded on policy that integrates and balances relevantenvironmental and social aspects of forestry. Sustainable management aims atenhancing the social, economic and environmental functions of forests and trees on thebasis of better knowledge and at improving the contribution of these resources in thenational economy. Furthermore, the NFA should be used for the development of forestpolicies, forestry programs, over all forest management, sustainable development,
conservation of the resources, and may be used by various institutions also from othersectors to develop integrated national policies. The direct objectives are to develop andstrengthen the national capacities to collect, compile process and disseminate reliableand up-to-date information on forestry to national policy makers as well as to internationalorganisations.
The NFA process initiated with a series of consultations with a broad representation ofnational stakeholders to deliberate the national information requests and how the NFAcould answer to these needs and, at the same time, be harmonised with internationalreporting systems. The inventory covered a wide range of biophysical and socio-economic variables with emphasis on the management and use of the resources andwas conducted through a systematic sampling with sampling units laid at a regular
interval of 10 minute longitude and 15 minute latitude. Each sampling unit is designatedas a “Tract” measuring one square kilometre and a total of 296 Tracts have beeninventoried. The NFA data have been entered into an Access Data Base application andthe findings from the analyses of these data are the main input to this report.
The NFA findings are mainly presented by major National Land Use Class (LUC):“Forest”, “Cultivated land”, “Villages”, “Built up areas” and “Inland water”. Findingsrelated to “Forest” are also presented by forest type: “Hill forest“, “Mangrove forest“,“Mixed Broad-leaved/Bamboo forest“, “Sal forest“, “Long rotation plantations“, “Shortrotation plantations“ and “Mangrove plantations“. The NFA findings comprise statistics onAreas, Wood volumes, Biodiversity & Regeneration, Social and Economic aspects,
Biomass and Carbon. The land use area statistics were generated using a combinationof findings from the remote sensing survey and the field survey, following a harmonisedland use/forest type classification system.
7/23/2019 NFA Final Report (1) (1)
http://slidepdf.com/reader/full/nfa-final-report-1-1 11/118
National Forest and Tree Resources Assessment 2005 – 2007, Bangladesh
11
It is suggested that the NFA be carried out on a continuous basis to enable maintenanceand development of competences with limited annual needs of resources. The NFA cycleshould be around five years to optimise the ratio of information value/cost, and a mix ofboth permanent and temporary plots is recommended. The value of the NFA data willincrease with every NFA cycle in order to capture information on trends. To ensure the
continuity of the NFA it is important that it be institutionalised to maintain and strengthenthe capacities of the NFA team, maintain the NFA database and the network ofpermanent sample plots.
The NFA findings help identify priority areas and will be of great use for the developmentof the forestry sector (national forest programme) and to evaluate forestrypolicy/strategies in order to ensure a coherent legislation. The NFA is part of a continualprocess and not the end product in itself.
7/23/2019 NFA Final Report (1) (1)
http://slidepdf.com/reader/full/nfa-final-report-1-1 12/118
National Forest and Tree Resources Assessment 2005 – 2007, Bangladesh
12
1. Introduction
1.1. General
The United Nations Conference on Environment and Development (UNCED) was held atRio de Janeiro, Brazil in 1992. Government of Bangladesh signed this Rio convention in1992 and ratified the convention on May 03, 1994. The Rio convention explicitly has aprovision stating that ‘timely, reliable and accurate information on forests and forestecosystems is essential for public understanding and informed decision-making’ shouldbe made available by the participating countries. As a signatory of CBD the Governmentof Bangladesh has the obligation to accomplish the required. Though the state ownedforest areas, especially the ‘Reserved Forests’, have been inventoried from time to time,inventory of ‘Forest Ecosystems’ outside the Government owned forest have hardly beendone. To secure information of all the possible land uses of the country as a whole withespecial emphasis on “Forest Land Use”, an inventory like that of National ForestAssessment (NFA) has been identified by FAO to be a better one.
The present NFA has adopted a set of globally harmonized terms and definitions toprovide information. These may be used for the development of forest policies, forestryprograms, over all forest management, sustainable development, conservation of theresources, etc. The definition of forest used by the Government of Bangladesh is not thesame as the global definition of forest used by the NFA.
Since inception of FAO in 1948, it has been reporting on the worldwide status and trendsof forest resources, their management aspects and uses. All countries are reflected in theprocess. The required data are collected and collated to prepare such report. The datamay or may not be based on systematic inventory however. FAO, in an attempt to
enhance the reliability of such data, launched this program of support to NFAs includingthe support to the present NFA of Bangladesh.
1.2. TAPP & FAO Support
Under this context a Technical Assistance Project Proposal (TAPP) was submitted inApril 2004 by FD and in November 2004 it was endorsed by the Government ofBangladesh (GoB), (TAPP of MOEF, November 30, 2004.). The total cost estimate of theproject was 27.054 million Taka (59 Taka = 1 US$), out of which FAO-contribution was20.768 million taka (equivalent to 352 thousand US dollar). The GOB contribution was2.773 million Taka in cash and 3.513 million Taka in kind. The project was designated as“Strengthening Capacity to Generate Quality Information on Forest Resources”, and
initial planning activities started in July 2004. Several training activities were held fromJune 2005 to March 2006. Field data collection was carried out between November 2005and May 2006 and the processing and analysis of collected field data was conductedduring 2006 and the first half of 2007. Mapping activities undertaken by SPARRSOstarted in June 2006 and were completed in August 2007.
Table 1: The total cost break up of the NFA activities
FD Contribution in Kind 59,542 US$FD Contribution in Cash 47,000 US$FAO Contribution 352,000 US$Total 458,542 US$
7/23/2019 NFA Final Report (1) (1)
http://slidepdf.com/reader/full/nfa-final-report-1-1 13/118
National Forest and Tree Resources Assessment 2005 – 2007, Bangladesh
13
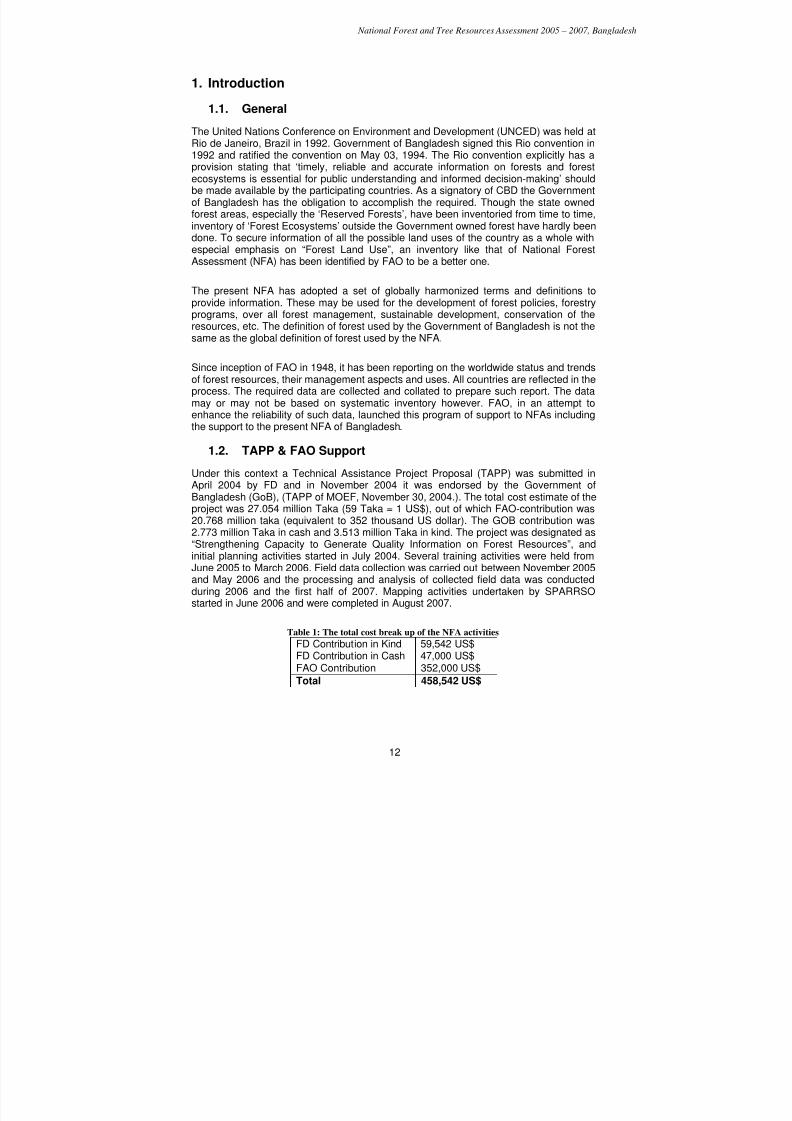
The long-term objective and approach is to build the national capacity, so that thenational NFA program in Bangladesh continues in future with little or no externaltechnical support, to generate the desired information. The core consideration of thisprogram is to contribute towards the sustainable management of forests and trees,including those outside the areas designated as forest, by providing decision makers andstakeholders with the best possible and most relevant information. At the same time it is
expected that this sort of inventory will generate the required data base that may be ofgood use at local, national and international levels. This NFA survey is thus a part ofFAO’s pilot program wherein Bangladesh has also been included.
Photo 1: Local food market in Dhaka, where also non-wood forestry products are put up for sale
7/23/2019 NFA Final Report (1) (1)
http://slidepdf.com/reader/full/nfa-final-report-1-1 14/118
National Forest and Tree Resources Assessment 2005 – 2007, Bangladesh
14
2. Background
2.1. General History and Geography of Bangladesh
2.1.1. Historical context
Bangladesh came into existence only in 1971. This tract of land was under British rulefrom 1757 till August 14, 1947. This tract emerged as a wing of Pakistan, in 1947 as anindependent country for the Muslims, and was designated as East Pakistan. It wasliberated as Bangladesh in 1971 as an independent sovereign country. Forestmanagement was however, initiated in Bangladesh during the British rule. The Britishcrown for the first time promulgated Act VII in 1865 in connection with the Forests andForestry and established a rule of law in this sector. This was the first forestry related‘Act’ for this part of the world, the greater India which included the existing territory ofBangladesh. Many forest tracts were declared as “Reserved Forests” under this ‘ForestAct’ and were placed under the control of Forest Department for management.
2.1.2. Geographical context
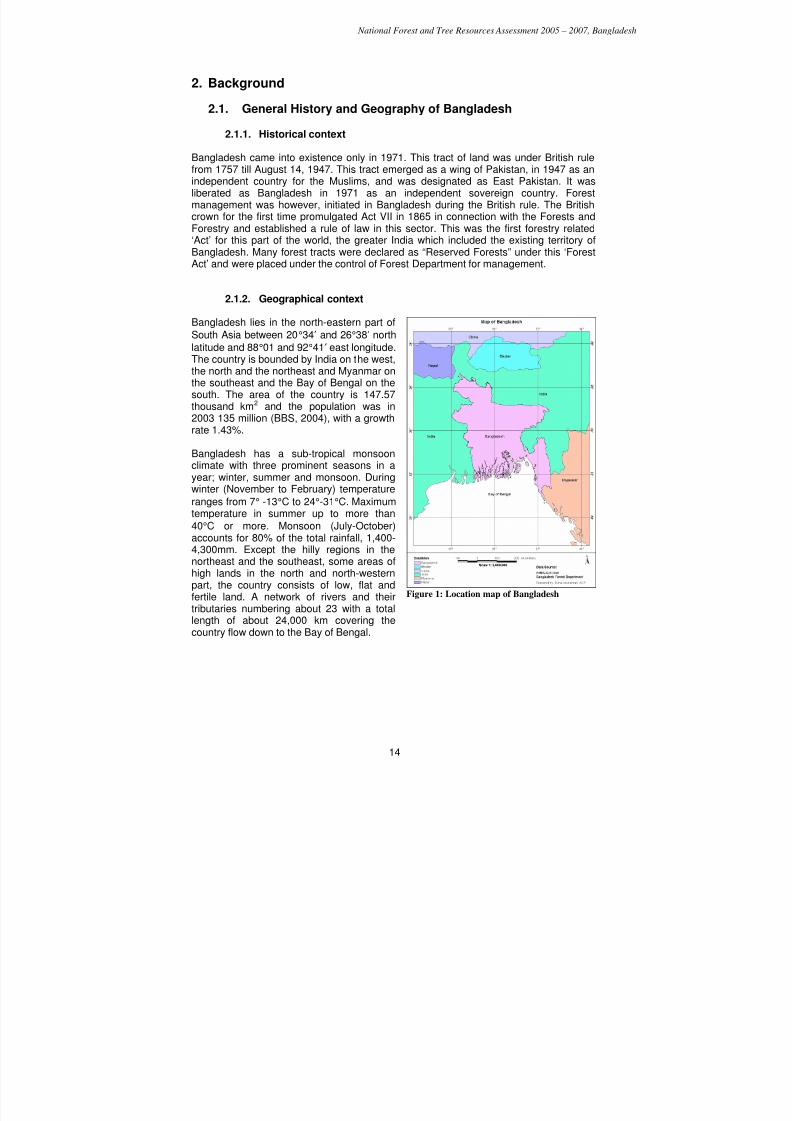
Bangladesh lies in the north-eastern part ofSouth Asia between 20°34′ and 26°38′ northlatitude and 88°01 and 92°41′ east longitude.The country is bounded by India on the west,the north and the northeast and Myanmar onthe southeast and the Bay of Bengal on thesouth. The area of the country is 147.57thousand km2 and the population was in
2003 135 million (BBS, 2004), with a growthrate 1.43%.
Bangladesh has a sub-tropical monsoonclimate with three prominent seasons in ayear; winter, summer and monsoon. Duringwinter (November to February) temperatureranges from 7° -13°C to 24°-31°C. Maximumtemperature in summer up to more than40°C or more. Monsoon (July-October)accounts for 80% of the total rainfall, 1,400-
4,300mm. Except the hilly regions in thenortheast and the southeast, some areas ofhigh lands in the north and north-westernpart, the country consists of low, flat andfertile land. A network of rivers and theirtributaries numbering about 23 with a totallength of about 24,000 km covering thecountry flow down to the Bay of Bengal.
Figure 1: Location map of Bangladesh
7/23/2019 NFA Final Report (1) (1)
http://slidepdf.com/reader/full/nfa-final-report-1-1 15/118
National Forest and Tree Resources Assessment 2005 – 2007, Bangladesh
15
2.2. Expressed need for the NFA
During the last decades a rapidly increasing population in Bangladesh with increaseddemand for resources and livelihoods, leading to a badly degraded environmental andnatural resource base under serious treat from causing factors such as agriculturalexpansion, overexploitation of forest and tree resources, urban sprawl, overgrazing,
quarrying etc.
Timely, easily available and accurate information on forest and tree resources and theirutilization is a precondition for sustainable management of these resources based on anenvironmentally, socially and economically balanced forest policy.
The Government of Bangladesh (GoB) therefore requested the technical assistance ofFAO under the Technical Cooperation Programme to assist the Bangladesh ForestDepartment to develop capacities to assess the country’s forest and tree resources andto monitor trends and changes, to describe their nature and localities and to advise onadequate measures.
A broad knowledge on the forest and tree resources is critically needed for redefining thepolicy and strategy of the Forest Department as well as for developing a comprehensiveNational Forestry Action Plan (NFAP). The Government considers the formulation of itsNFAP as a high priority after the work on the current inventory is concluded.
2.3. FAO support to the NFA
FAO has through the technical Cooperation Program (TCP) financed FAO technicalassistance to the GoB. FAO LTU have had the overall technical supervision of projectimplementation and provided technical assistance to the GoB through national capacity
building in the following main areas:
• Forest and tree inventory methodology development including sampling design,classification system harmonization and variables.
• Forest and land use mapping.• Field survey• Data processing, information system development and reporting• Information management
The capacity building has been carried out through workshops, training events, on-the- job guidance, and through communication and feed-back.
The FAO representation of Bangladesh has as FAO project budget holder providedadministrative assistance throughout the implementation of the various phases of theproject. All Steering Committee Meetings were held at the FAO Representation
Till the launching of this NFA program, no inventory was carried out at a time all over thewhole country with the same methodological approach to capture data on all the variousland use patterns. The NFA approach is basically tagged with the land use aspects, withspecial emphasis to collect information on forests and tree resources, their uses andusers, irrespective of its ownership, public or private. Thus for the foresters inBangladesh this is a new approach.
7/23/2019 NFA Final Report (1) (1)
http://slidepdf.com/reader/full/nfa-final-report-1-1 16/118
National Forest and Tree Resources Assessment 2005 – 2007, Bangladesh
16
2.4. Existing information on forests and ToF
Most of the existing Sundarbans was notified and declared as “Reserved Forest” during1875-76. The existing ‘Reserved Forests’ in the greater district of Sylhet were declaredas such under a similar Act, “Assam Forest Regulation” during the British Rule. Till 1914there was neither any forest policy nor any Reserved Forest in this area of Sylhet. The
policy of reservation of the Forest Area was first formulated on the basis of the notedated May 10, 1914 of Mr. G.C. Sankey an I.C.S. officer of the than British Governmentof India (Choudhury 1986). All most all of the existing “Reserved Forests” in the greaterdistrict of Sylhet were declared as such under Assam Forest Regulations. The forests ofChittagong and Chittagong Hill Tracts were declared 'Reserved Forests' in early 20th century during the British rule. Forest management followed such process of reservation.
Detailed inventories of various forests (notified forest land, mostly as ‘Reserved Forests’)under the control of the FD, Government of Bangladesh were under taken at varioustimes especially for the preparation of Forest Management Plans. Since the major foresttracts are located in Sundarbans, Chittagong & Chittagong Hill Tracts, Sylhet. Dhaka-Tangail-Mymensingh, etc. forest inventories were under taken in these locations atdifferent times.
2.4.1. The Sundarbans
The legal boundary of Sundarban forest (Bangladesh portion) covers an area of 577,000hectares, out of which 401,600 hectares is land and the remaining 175,600 hectares iswater bodies, as creeks, canals, rivers, etc. (Hossain & Acharya, 1994). F. Trafford wrotethe first management plan for Sundarbans for the period 1912-13 to 1931-32. It is notknown exactly how he carried out the inventory. The second management plan forSundarbans was written by Mr. S. J. Curtis. It is learnt that he conducted the inventoryand prepared the map by physical survey. His maps and inventory were milestones on
this issue and were found to corroborate very closely with the high-tech inventoriesconducted at later ages. Curtis’ plan came into operation in April 1931. Forestal Forestryand Engineering International Limited of Vancouver, Canada carried out the first detailedinventory of Sundarbans in 1960. The second detailed inventory of Sundarban was doneby Overseas Development Administration (ODA) of U.K. during 1980 to 85. The reportwas published in 1985. The Forestal and ODA inventories of the Sundarbans usedblocks. Forestal divided the forest into 8 blocks which were also used by the ODA. Thelast inventory of Sundarbans was carried out in 1996 by FD, Government of Bangladesh.Of all the inventories so far carried out in Sundarbans, the three inventories namely thatof Forestal, ODA and FRMP seem to be quite comprehensive.
7/23/2019 NFA Final Report (1) (1)
http://slidepdf.com/reader/full/nfa-final-report-1-1 17/118
National Forest and Tree Resources Assessment 2005 – 2007, Bangladesh
17
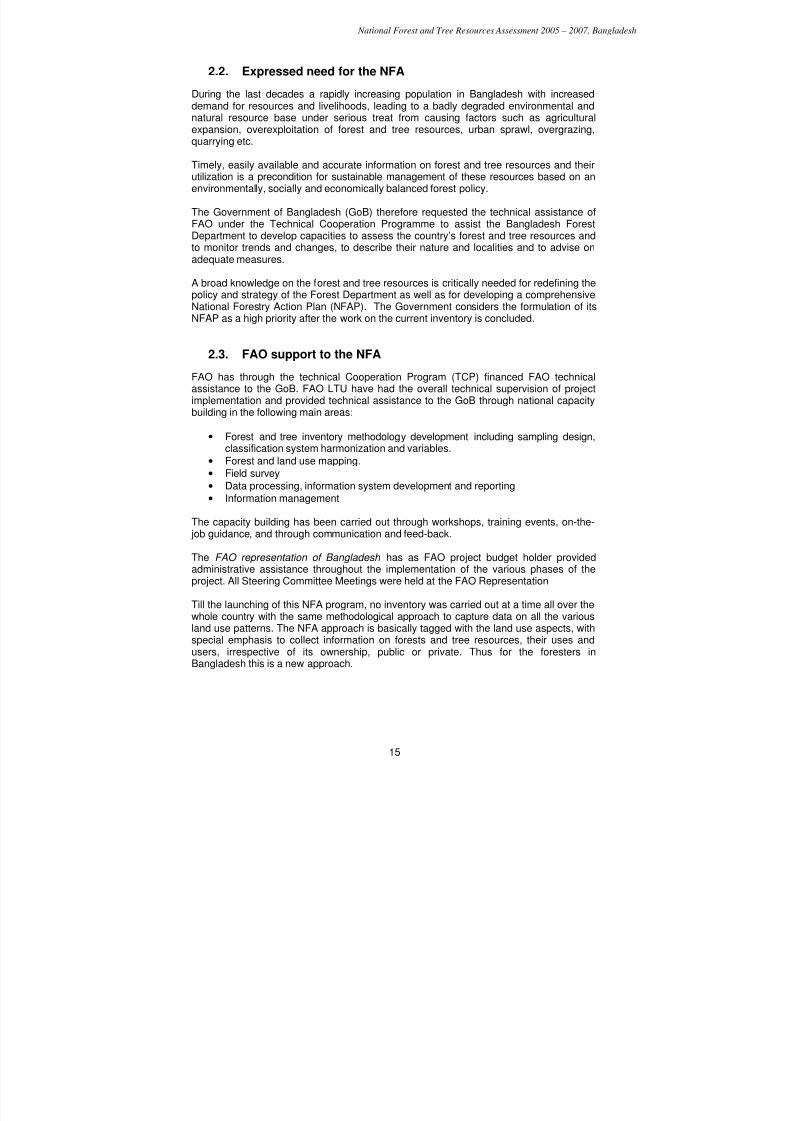
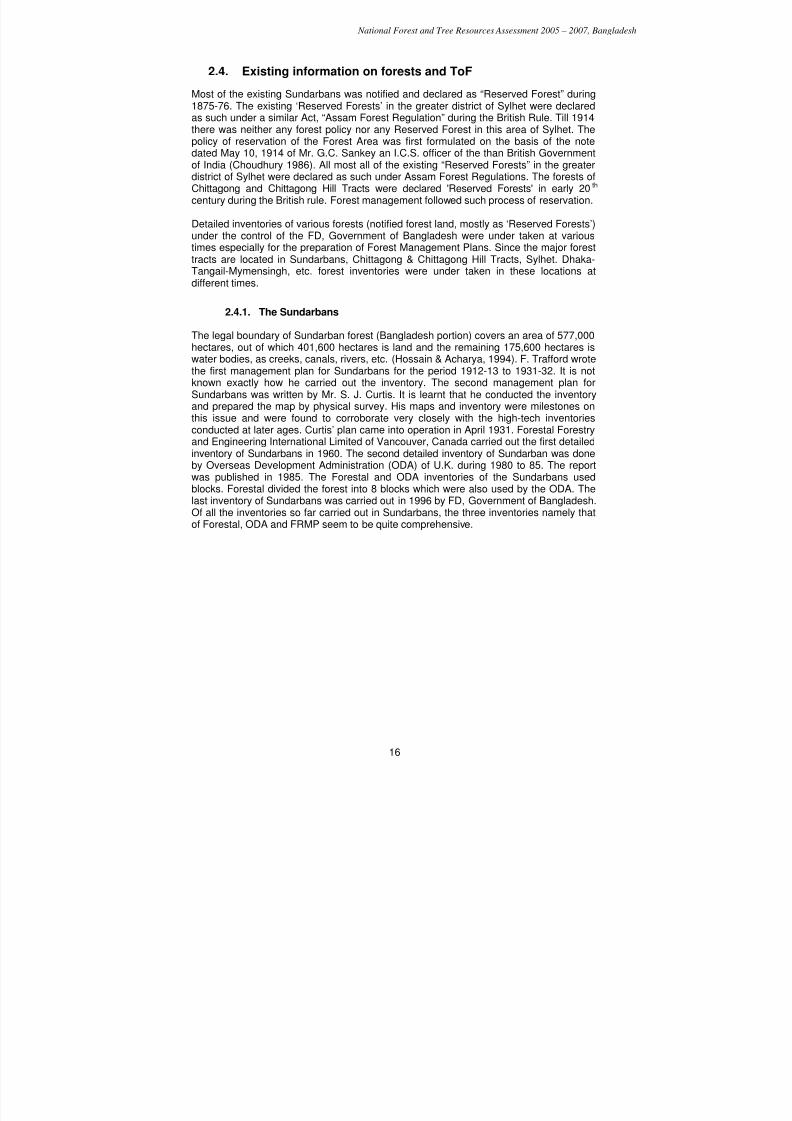
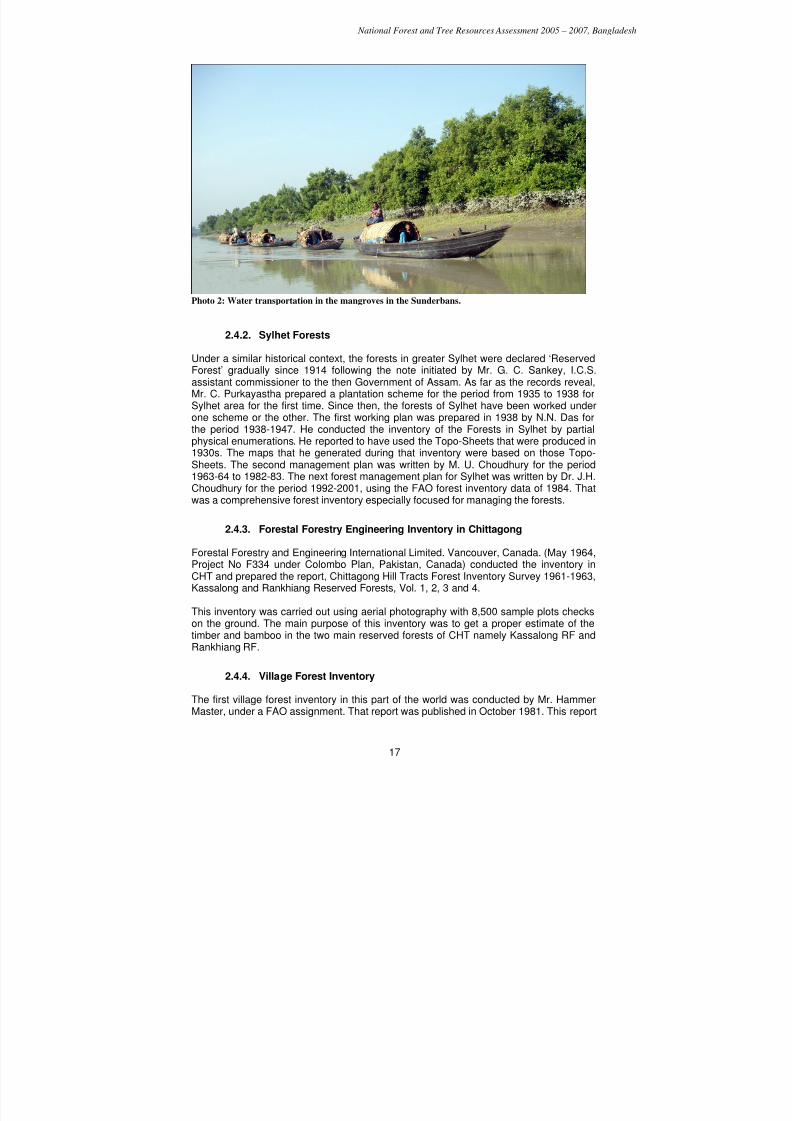
Photo 2: Water transportation in the mangroves in the Sunderbans.
2.4.2. Sylhet Forests
Under a similar historical context, the forests in greater Sylhet were declared ‘ReservedForest’ gradually since 1914 following the note initiated by Mr. G. C. Sankey, I.C.S.assistant commissioner to the then Government of Assam. As far as the records reveal,Mr. C. Purkayastha prepared a plantation scheme for the period from 1935 to 1938 forSylhet area for the first time. Since then, the forests of Sylhet have been worked under
one scheme or the other. The first working plan was prepared in 1938 by N.N. Das forthe period 1938-1947. He conducted the inventory of the Forests in Sylhet by partialphysical enumerations. He reported to have used the Topo-Sheets that were produced in1930s. The maps that he generated during that inventory were based on those Topo-Sheets. The second management plan was written by M. U. Choudhury for the period1963-64 to 1982-83. The next forest management plan for Sylhet was written by Dr. J.H.Choudhury for the period 1992-2001, using the FAO forest inventory data of 1984. Thatwas a comprehensive forest inventory especially focused for managing the forests.
2.4.3. Forestal Forestry Engineering Inventory in Chittagong
Forestal Forestry and Engineering International Limited. Vancouver, Canada. (May 1964,Project No F334 under Colombo Plan, Pakistan, Canada) conducted the inventory inCHT and prepared the report, Chittagong Hill Tracts Forest Inventory Survey 1961-1963,Kassalong and Rankhiang Reserved Forests, Vol. 1, 2, 3 and 4.
This inventory was carried out using aerial photography with 8,500 sample plots checkson the ground. The main purpose of this inventory was to get a proper estimate of thetimber and bamboo in the two main reserved forests of CHT namely Kassalong RF andRankhiang RF.
2.4.4. Village Forest Inventory
The first village forest inventory in this part of the world was conducted by Mr. HammerMaster, under a FAO assignment. That report was published in October 1981. This report
7/23/2019 NFA Final Report (1) (1)
http://slidepdf.com/reader/full/nfa-final-report-1-1 18/118
National Forest and Tree Resources Assessment 2005 – 2007, Bangladesh
18
reflected the timber volumes in the village area of Bangladesh and is based on samplesurvey.
2.4.5. Forestry Master Plan
Asian Development Bank (ADB) assisted the Government of Bangladesh to prepare a“Forestry master Plan” during 1991-93 for the period 1993-2013. FAO (UNDP), SandwellInc and Reid Collins Ltd. extended some support to this activity. The 20-year planprovides the framework to optimize the forestry sector’s contribution in stabilizingenvironmental conditions and assisting economic and social development.
3. Objectives of the study
The TAPP (Project Document) has identified two sets of objectives as DevelopmentObjectives and Immediate Objectives.
The development objective or the long term objective is as under :
The project aims at promoting sustainable management of the forests andtrees resources in Bangladesh founded on policy that integrates and balancerelevant environmental and social aspects of forestry. Sustainablemanagement aims at enhancing the social, economic and environmentalfunctions of forests and trees on the basis of better knowledge and atimproving the contribution of these resources in the national economy.
The purpose of the TAPP is to enhance the capacity of BFD and contribute to achieve
the development objectives through implementation of activities of the following specificobjectives:• Assist the Forest Department (FD) of the Ministry of Environment
and Forest (MOEF) in developing and strengthening its capacity tocollect, compile, process and disseminate reliable and up-to-dateinformation on forestry, to policy makers.
• Assist the FD to plan ands carry out national forest and treeresources inventory, develop up-to-date and sound base-lineinformation and set up a long term resources monitoring system.The inventory will cover a large array of biophysical and socio-economic variables with emphasis on the management and use of
the resources.• Assist the FD in evaluating the findings, defining the sector priorities
and outlining the national forest program.
• Advice and assist the Government to establish a long termmonitoring of the national forest resources, take the necessarymeasures to maintain and support the National Forest AssessmentUnit (NFAU), enable it to carry out continuous resourceassessments in future and convert the project into a permanentprogram for long tern monitoring and support to decision making.
7/23/2019 NFA Final Report (1) (1)
http://slidepdf.com/reader/full/nfa-final-report-1-1 19/118
National Forest and Tree Resources Assessment 2005 – 2007, Bangladesh
19
4. Resources for the implementation of the NFA
4.1. General
This NFA was initiated with a number of consultation workshops and discussionmeetings; wherein departmental as well as expatriate experts participated. The design ofthe methodology aims at harmonizing the reporting systems between countries, whilesatisfying the national information needs. The designing of the project outline, formulationof its implementation procedures, reformulation and development of the field manuals,finalization of the field forms, orientation and training of the FD personnel, etc. were theinitial tasks to start the project. A remote sensing component for mapping was includedby involving the Space Research and Remote Sensing Organization (SPARRSO) Dhaka,Bangladesh.
The project was designed for implementation in three phases as follows.
Phase I: Preparation, Training and Mapping
Phase II: Field Survey and Remote Sensing analysis
Phase III: Data Processing, Analysis and Reporting
With these ground work the Inception Workshop of this project was organized by the FDduring April 02 to 04, 2005 at Dhaka. The Inception workshop was facilitated by an NFAexpert from FAO. In addition to that many experts and scientists from the followingorganizations attended and actively participated in that ‘Inception Workshop’ :
1. Ministry of Environment and Forests (MoEF), Government of Bangladesh.
2. Ministry of Planning, Government of Bangladesh.
3. Internal Monitoring and Evaluation Division (IMED), Government of Bangladesh.
4. Directorate of Environment (DoE), Government of Bangladesh.5. Export Promotion Bureau, Government of Bangladesh.
6. Local Government Engineering Directorate (LGED)
7. Bangladesh Forest Research Institute (BFRI)
8. Space Research and Remote Sensing Organization (SPARRSO)
9. Bangladesh Bureau of Statistics (BBS), Government of Bangladesh.
10. Bangladesh National Herbarium, Government of Bangladesh.
11. Bangladesh Shongbad Shongstha (BSS) (The Press)
12. Bangladesh Agricultural Research Council (BARC)
13. Representative from Khulna University, Khulna.
14. Representative from Chittagong University, Chittagong.15. Representative from Shajalal University, Sylhet.
16. Forest Department, Government of Bangladesh.
17. FAO Dhaka Bangladesh
7/23/2019 NFA Final Report (1) (1)
http://slidepdf.com/reader/full/nfa-final-report-1-1 20/118
National Forest and Tree Resources Assessment 2005 – 2007, Bangladesh
20
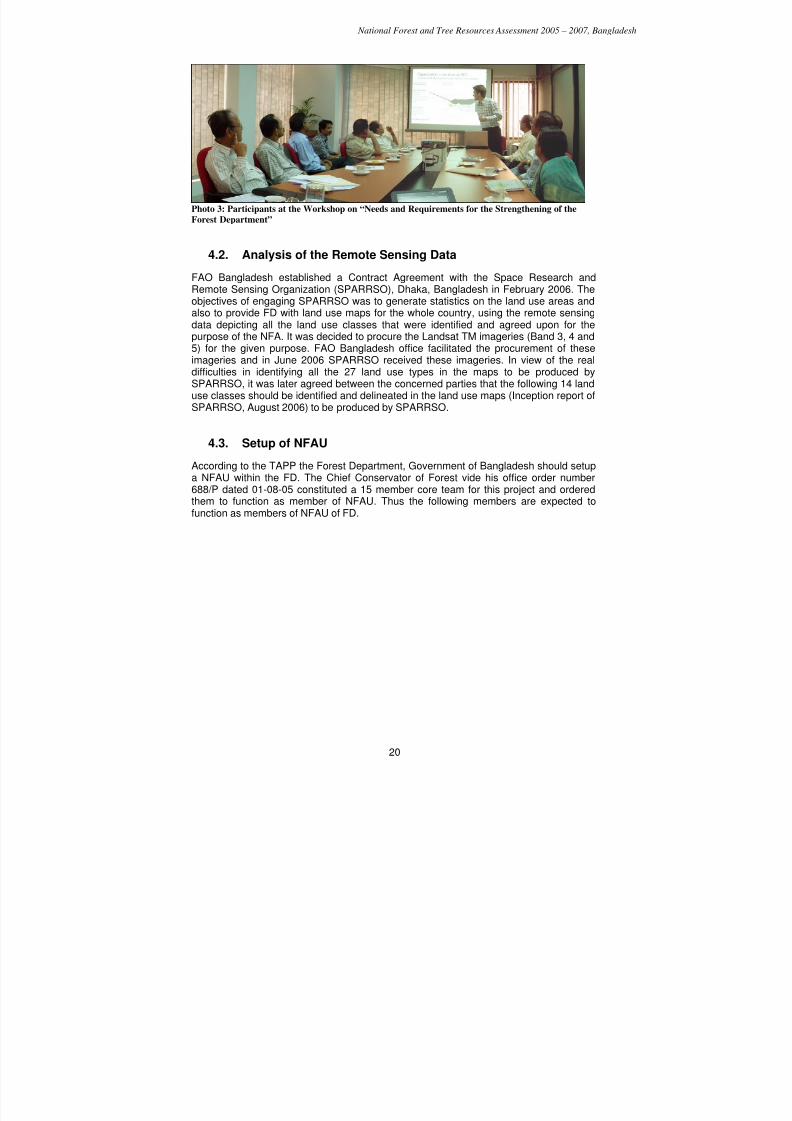
Photo 3: Participants at the Workshop on “Needs and Requirements for the Strengthening of the
Forest Department”
4.2. Analysis of the Remote Sensing Data
FAO Bangladesh established a Contract Agreement with the Space Research andRemote Sensing Organization (SPARRSO), Dhaka, Bangladesh in February 2006. Theobjectives of engaging SPARRSO was to generate statistics on the land use areas andalso to provide FD with land use maps for the whole country, using the remote sensingdata depicting all the land use classes that were identified and agreed upon for thepurpose of the NFA. It was decided to procure the Landsat TM imageries (Band 3, 4 and5) for the given purpose. FAO Bangladesh office facilitated the procurement of theseimageries and in June 2006 SPARRSO received these imageries. In view of the realdifficulties in identifying all the 27 land use types in the maps to be produced bySPARRSO, it was later agreed between the concerned parties that the following 14 landuse classes should be identified and delineated in the land use maps (Inception report ofSPARRSO, August 2006) to be produced by SPARRSO.
4.3. Setup of NFAU
According to the TAPP the Forest Department, Government of Bangladesh should setupa NFAU within the FD. The Chief Conservator of Forest vide his office order number688/P dated 01-08-05 constituted a 15 member core team for this project and orderedthem to function as member of NFAU. Thus the following members are expected tofunction as members of NFAU of FD.
7/23/2019 NFA Final Report (1) (1)
http://slidepdf.com/reader/full/nfa-final-report-1-1 21/118
National Forest and Tree Resources Assessment 2005 – 2007, Bangladesh
21
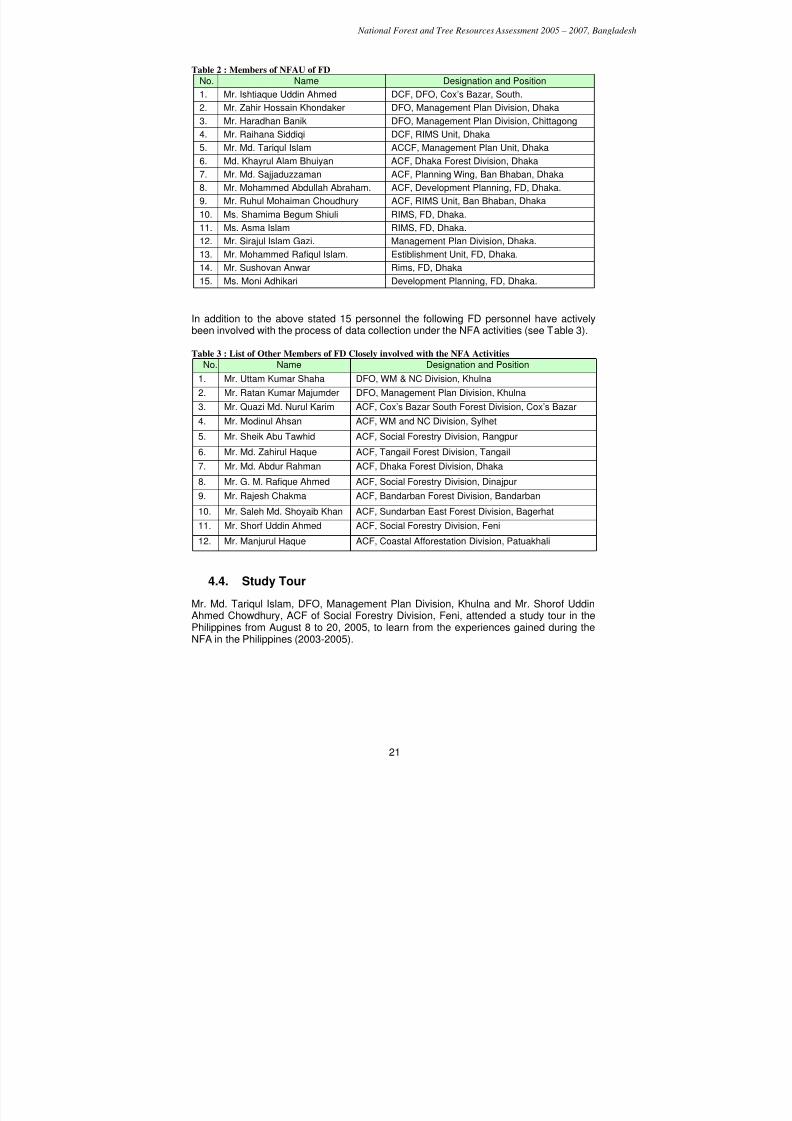
Table 2 : Members of NFAU of FD
No. Name Designation and Position
1. Mr. Ishtiaque Uddin Ahmed DCF, DFO, Cox’s Bazar, South.
2. Mr. Zahir Hossain Khondaker DFO, Management Plan Division, Dhaka
3. Mr. Haradhan Banik DFO, Management Plan Division, Chittagong
4. Mr. Raihana Siddiqi DCF, RIMS Unit, Dhaka5. Mr. Md. Tariqul Islam ACCF, Management Plan Unit, Dhaka
6. Md. Khayrul Alam Bhuiyan ACF, Dhaka Forest Division, Dhaka
7. Mr. Md. Sajjaduzzaman ACF, Planning Wing, Ban Bhaban, Dhaka
8. Mr. Mohammed Abdullah Abraham. ACF, Development Planning, FD, Dhaka.
9. Mr. Ruhul Mohaiman Choudhury ACF, RIMS Unit, Ban Bhaban, Dhaka
10. Ms. Shamima Begum Shiuli RIMS, FD, Dhaka.
11. Ms. Asma Islam RIMS, FD, Dhaka.
12. Mr. Sirajul Islam Gazi. Management Plan Division, Dhaka.
13. Mr. Mohammed Rafiqul Islam. Estiblishment Unit, FD, Dhaka.
14. Mr. Sushovan Anwar Rims, FD, Dhaka
15. Ms. Moni Adhikari Development Planning, FD, Dhaka.
In addition to the above stated 15 personnel the following FD personnel have activelybeen involved with the process of data collection under the NFA activities (see Table 3).
Table 3 : List of Other Members of FD Closely involved with the NFA Activities
No. Name Designation and Position
1. Mr. Uttam Kumar Shaha DFO, WM & NC Division, Khulna
2. Mr. Ratan Kumar Majumder DFO, Management Plan Division, Khulna
3. Mr. Quazi Md. Nurul Karim ACF, Cox’s Bazar South Forest Division, Cox’s Bazar
4. Mr. Modinul Ahsan ACF, WM and NC Division, Sylhet
5. Mr. Sheik Abu Tawhid ACF, Social Forestry Division, Rangpur
6. Mr. Md. Zahirul Haque ACF, Tangail Forest Division, Tangail
7. Mr. Md. Abdur Rahman ACF, Dhaka Forest Division, Dhaka
8. Mr. G. M. Rafique Ahmed ACF, Social Forestry Division, Dinajpur
9. Mr. Rajesh Chakma ACF, Bandarban Forest Division, Bandarban
10. Mr. Saleh Md. Shoyaib Khan ACF, Sundarban East Forest Division, Bagerhat
11. Mr. Shorf Uddin Ahmed ACF, Social Forestry Division, Feni
12. Mr. Manjurul Haque ACF, Coastal Afforestation Division, Patuakhali
4.4. Study Tour
Mr. Md. Tariqul Islam, DFO, Management Plan Division, Khulna and Mr. Shorof UddinAhmed Chowdhury, ACF of Social Forestry Division, Feni, attended a study tour in thePhilippines from August 8 to 20, 2005, to learn from the experiences gained during theNFA in the Philippines (2003-2005).
7/23/2019 NFA Final Report (1) (1)
http://slidepdf.com/reader/full/nfa-final-report-1-1 22/118
National Forest and Tree Resources Assessment 2005 – 2007, Bangladesh
22
5. Field Survey Preparations
Survey of Bangladesh under the Ministry of Defense is the designated Governmentauthority for Maps and Mapping. This organization produces topographic maps of
1:250,000 and 1:50,000 scale. The national territory of the country has been mapped in267 numbers of Topo-Sheets at the scale of 1:50,000. In absence of Nation-Wide GISdata layered based maps for the whole of the country, Top-Sheets of 1:50,000 scalemaps produced by the Survey of Bangladesh were used for this given work. The “Lat-Long” of the sample tracts were read form these Topo-Sheets. These Topo-Sheets wereused for locating the tracts as well. These Topo-Sheets had the locations of the Thanas(/Upazilla, the lowest unit of Government administrative units) as well as the road networks. These features facilitated the physical location of the tracts during the field work.The sighting of the ‘Lat-Long’ Grid on these Topo-Sheets, along with all the otherrelevant physical features, facilitated with the use of hand held GPS and reading of thestored Lat-Long data from the GPS were used to reach and identify the desired location(especially the starting points of Tracts and Plots).
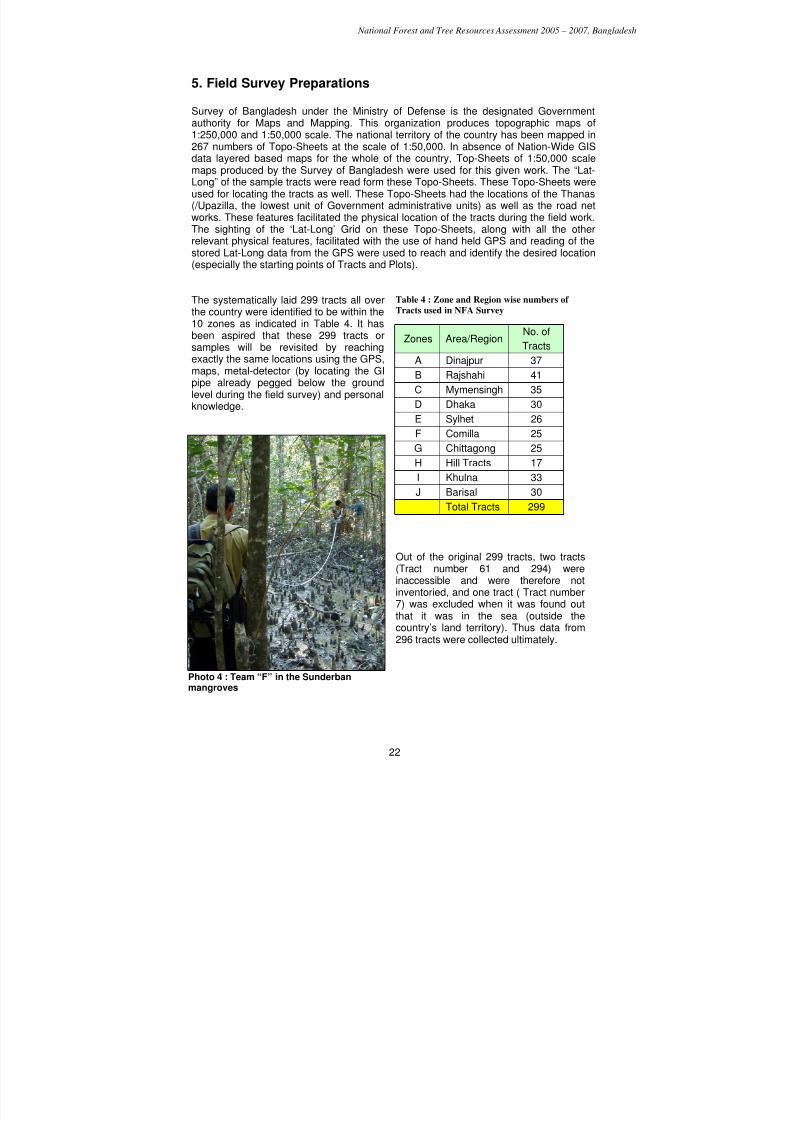
The systematically laid 299 tracts all overthe country were identified to be within the10 zones as indicated in Table 4. It hasbeen aspired that these 299 tracts orsamples will be revisited by reachingexactly the same locations using the GPS,maps, metal-detector (by locating the GIpipe already pegged below the groundlevel during the field survey) and personalknowledge.
Photo 4 : Team “F” in the Sunderbanmangroves
Table 4 : Zone and Region wise numbers of
Tracts used in NFA Survey
Out of the original 299 tracts, two tracts(Tract number 61 and 294) wereinaccessible and were therefore notinventoried, and one tract ( Tract number7) was excluded when it was found outthat it was in the sea (outside thecountry’s land territory). Thus data from296 tracts were collected ultimately.
Zones Area/RegionNo. of
Tracts
A Dinajpur 37
B Rajshahi 41
C Mymensingh 35
D Dhaka 30
E Sylhet 26
F Comilla 25
G Chittagong 25
H Hill Tracts 17
I Khulna 33
J Barisal 30
Total Tracts 299
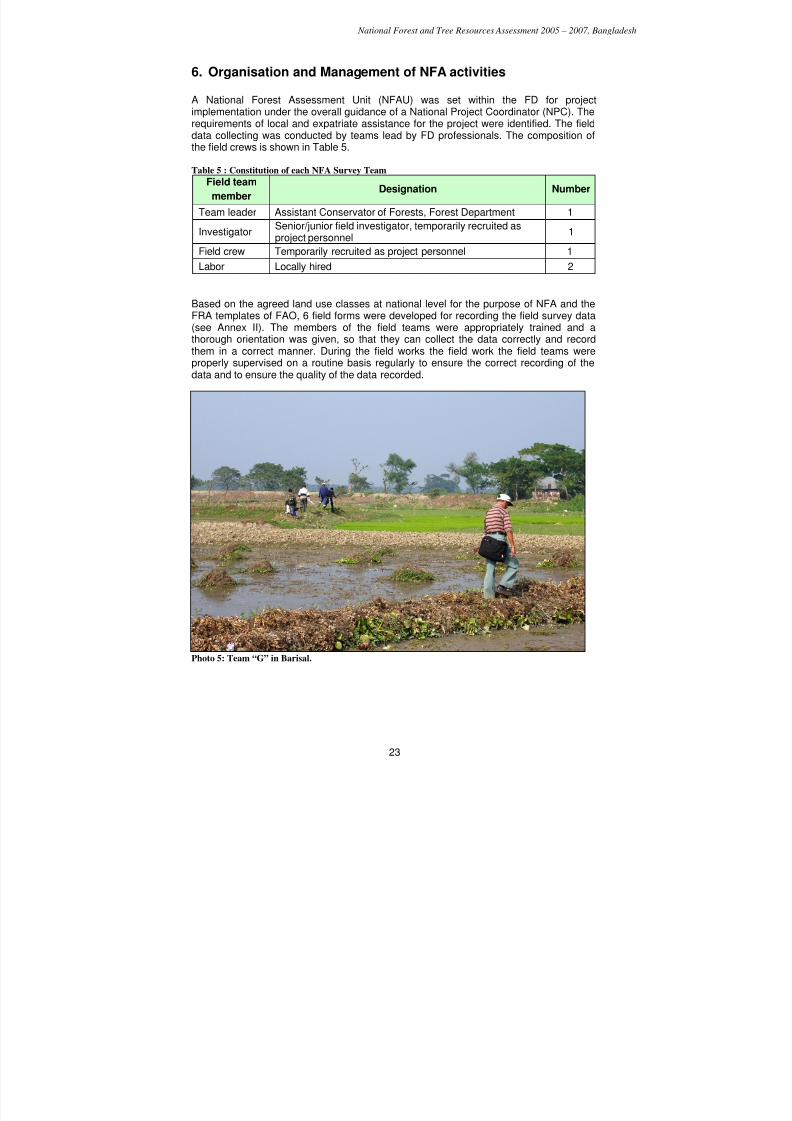
7/23/2019 NFA Final Report (1) (1)
http://slidepdf.com/reader/full/nfa-final-report-1-1 23/118
National Forest and Tree Resources Assessment 2005 – 2007, Bangladesh
23
6. Organisation and Management of NFA activities
A National Forest Assessment Unit (NFAU) was set within the FD for projectimplementation under the overall guidance of a National Project Coordinator (NPC). Therequirements of local and expatriate assistance for the project were identified. The field
data collecting was conducted by teams lead by FD professionals. The composition ofthe field crews is shown in Table 5.
Table 5 : Constitution of each NFA Survey Team
Field team
memberDesignation Number
Team leader Assistant Conservator of Forests, Forest Department 1
InvestigatorSenior/junior field investigator, temporarily recruited asproject personnel
1
Field crew Temporarily recruited as project personnel 1
Labor Locally hired 2
Based on the agreed land use classes at national level for the purpose of NFA and theFRA templates of FAO, 6 field forms were developed for recording the field survey data(see Annex II). The members of the field teams were appropriately trained and athorough orientation was given, so that they can collect the data correctly and recordthem in a correct manner. During the field works the field work the field teams wereproperly supervised on a routine basis regularly to ensure the correct recording of thedata and to ensure the quality of the data recorded.
Photo 5: Team “G” in Barisal.
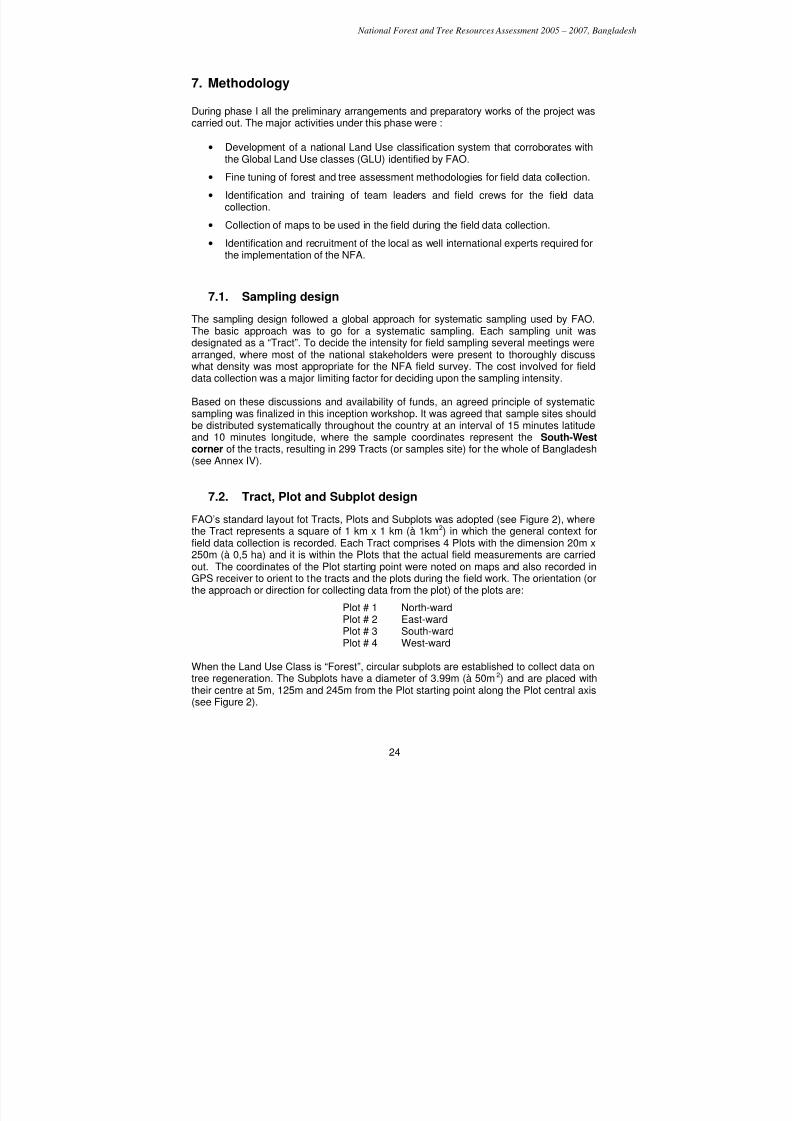
7/23/2019 NFA Final Report (1) (1)
http://slidepdf.com/reader/full/nfa-final-report-1-1 24/118
National Forest and Tree Resources Assessment 2005 – 2007, Bangladesh
24
7. Methodology
During phase I all the preliminary arrangements and preparatory works of the project wascarried out. The major activities under this phase were :
• Development of a national Land Use classification system that corroborates withthe Global Land Use classes (GLU) identified by FAO.
• Fine tuning of forest and tree assessment methodologies for field data collection.
• Identification and training of team leaders and field crews for the field datacollection.
• Collection of maps to be used in the field during the field data collection.
• Identification and recruitment of the local as well international experts required forthe implementation of the NFA.
7.1. Sampling design
The sampling design followed a global approach for systematic sampling used by FAO.The basic approach was to go for a systematic sampling. Each sampling unit wasdesignated as a “Tract”. To decide the intensity for field sampling several meetings werearranged, where most of the national stakeholders were present to thoroughly discusswhat density was most appropriate for the NFA field survey. The cost involved for fielddata collection was a major limiting factor for deciding upon the sampling intensity.
Based on these discussions and availability of funds, an agreed principle of systematic
sampling was finalized in this inception workshop. It was agreed that sample sites shouldbe distributed systematically throughout the country at an interval of 15 minutes latitudeand 10 minutes longitude, where the sample coordinates represent the South-Westcorner of the tracts, resulting in 299 Tracts (or samples site) for the whole of Bangladesh(see Annex IV).
7.2. Tract, Plot and Subplot design
FAO’s standard layout fot Tracts, Plots and Subplots was adopted (see Figure 2), wherethe Tract represents a square of 1 km x 1 km (à 1km2) in which the general context forfield data collection is recorded. Each Tract comprises 4 Plots with the dimension 20m x
250m (à 0,5 ha) and it is within the Plots that the actual field measurements are carriedout. The coordinates of the Plot starting point were noted on maps and also recorded inGPS receiver to orient to the tracts and the plots during the field work. The orientation (orthe approach or direction for collecting data from the plot) of the plots are:
Plot # 1 North-wardPlot # 2 East-wardPlot # 3 South-wardPlot # 4 West-ward
When the Land Use Class is “Forest”, circular subplots are established to collect data ontree regeneration. The Subplots have a diameter of 3.99m (à 50m2) and are placed with
their centre at 5m, 125m and 245m from the Plot starting point along the Plot central axis(see Figure 2).
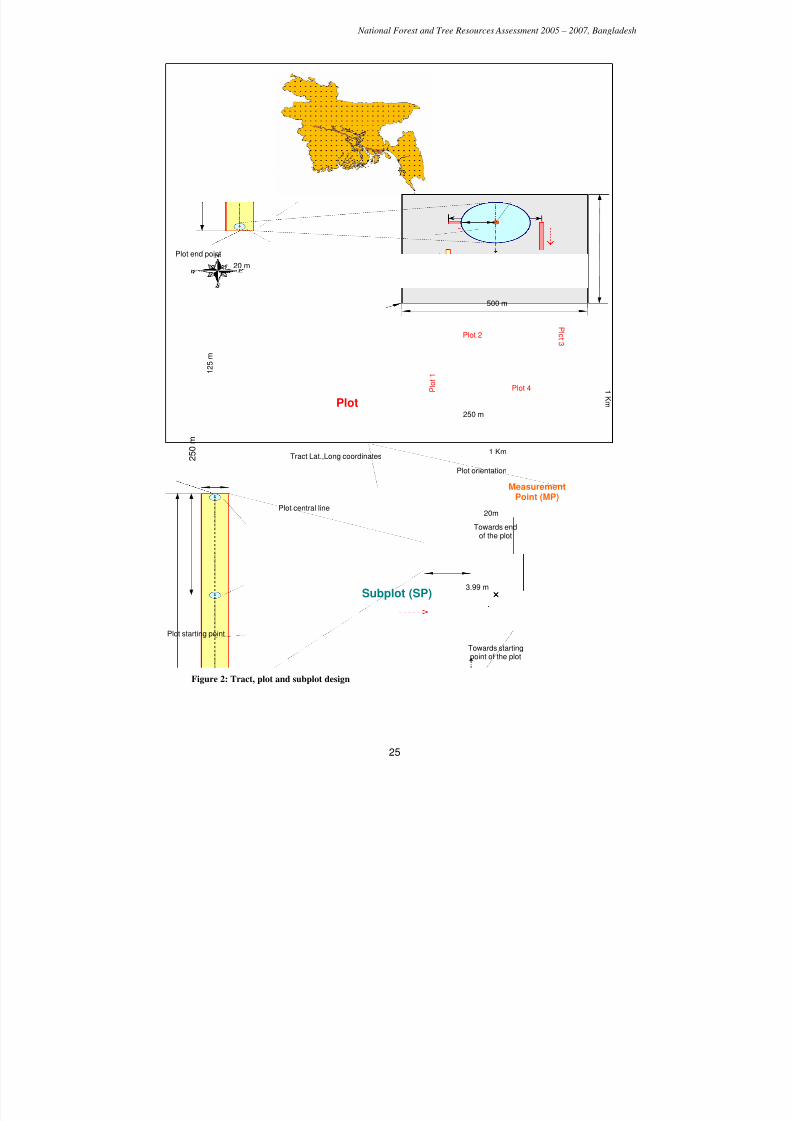
7/23/2019 NFA Final Report (1) (1)
http://slidepdf.com/reader/full/nfa-final-report-1-1 25/118
National Forest and Tree Resources Assessment 2005 – 2007, Bangladesh
25
Figure 2: Tract, plot and subplot design
Subplot (SP)
Towards startingpoint of the plot
P l o t 1
P l o t 3
Plot 4
250 m
500 m
1 Km
1 K m
Plot 2
Tract
Tract Lat.,Long coordinates
Plot central line
×××× .
20m
Towards endof the plot
3.99 m
1 2 5 m
Plot
2 5 0 m
20 m
Plot starting point
Plot orientation
Plot end point
MeasurementPoint (MP)
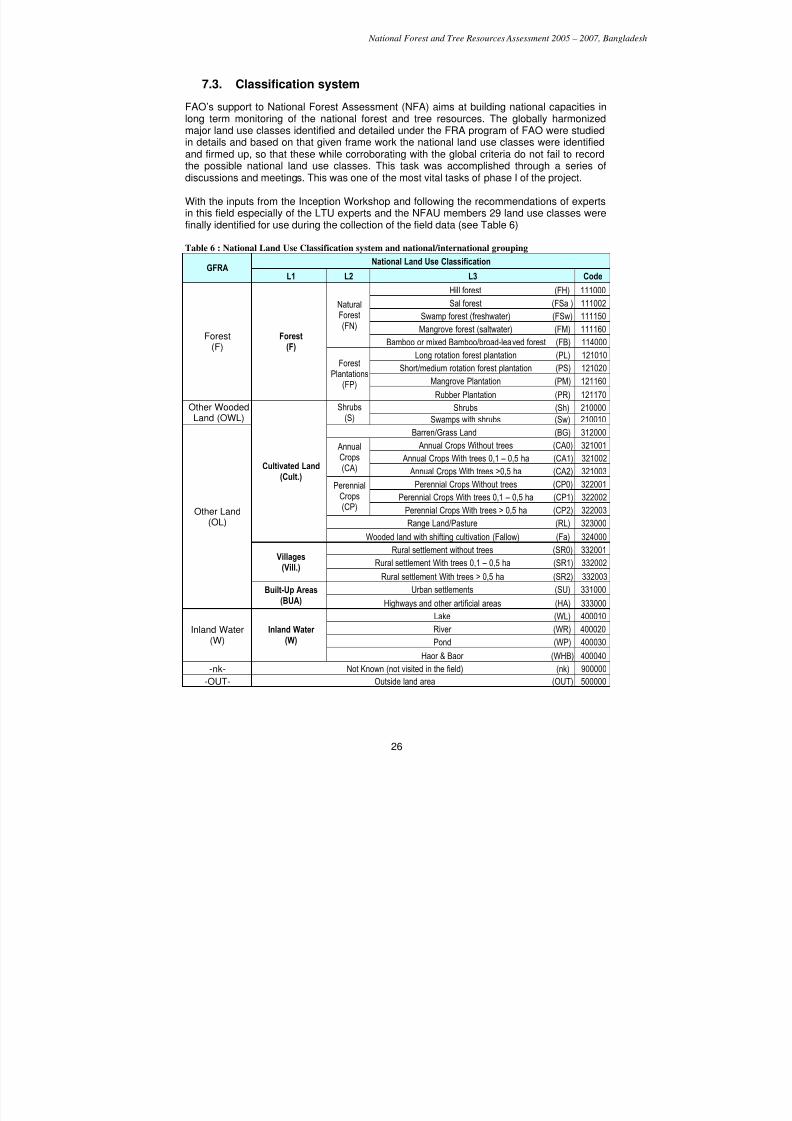
7/23/2019 NFA Final Report (1) (1)
http://slidepdf.com/reader/full/nfa-final-report-1-1 26/118
National Forest and Tree Resources Assessment 2005 – 2007, Bangladesh
26
7.3. Classification system
FAO’s support to National Forest Assessment (NFA) aims at building national capacities inlong term monitoring of the national forest and tree resources. The globally harmonizedmajor land use classes identified and detailed under the FRA program of FAO were studiedin details and based on that given frame work the national land use classes were identifiedand firmed up, so that these while corroborating with the global criteria do not fail to recordthe possible national land use classes. This task was accomplished through a series ofdiscussions and meetings. This was one of the most vital tasks of phase I of the project.
With the inputs from the Inception Workshop and following the recommendations of expertsin this field especially of the LTU experts and the NFAU members 29 land use classes werefinally identified for use during the collection of the field data (see Table 6)
Table 6 : National Land Use Classification system and national/international grouping
National Land Use ClassificationGFRA
L1 L2 L3 CodeHill forest (FH) 111000
Sal forest (FSa ) 111002
Swamp forest (freshwater) (FSw) 111150
Mangrove forest (saltwater) (FM) 111160
NaturalForest(FN)
Bamboo or mixed Bamboo/broad-leaved forest (FB) 114000
Long rotation forest plantation (PL) 121010
Short/medium rotation forest plantation (PS) 121020
Mangrove Plantation (PM) 121160
Forest(F)
Forest(F)
ForestPlantations
(FP)Rubber Plantation (PR) 121170
Shrubs (Sh) 210000Other Wooded
Land (OWL)
Shrubs
(S) Swamps with shrubs (Sw) 210010
Barren/Grass Land (BG) 312000
Annual Crops Without trees (CA0) 321001
Annual Crops With trees 0,1 – 0,5 ha (CA1) 321002
AnnualCrops(CA) Annual Crops With trees >0,5 ha (CA2) 321003
Perennial Crops Without trees (CP0) 322001
Perennial Crops With trees 0,1 – 0,5 ha (CP1) 322002
PerennialCrops(CP) Perennial Crops With trees > 0,5 ha (CP2) 322003
Range Land/Pasture (RL) 323000
Cultivated Land(Cult.)
Wooded land with shifting cultivation (Fallow) (Fa) 324000
Rural settlement without trees (SR0) 332001Rural settlement With trees 0,1 – 0,5 ha (SR1) 332002
Villages(Vill.)
Rural settlement With trees > 0,5 ha (SR2) 332003
Urban settlements (SU) 331000
Other Land(OL)
Built-Up Areas(BUA) Highways and other artificial areas (HA) 333000
Lake (WL) 400010
River (WR) 400020
Pond (WP) 400030
Inland Water(W)
Inland Water(W)
Haor & Baor (WHB) 400040
-nk- Not Known (not visited in the field) (nk) 900000
-OUT- Outside land area (OUT) 500000
7/23/2019 NFA Final Report (1) (1)
http://slidepdf.com/reader/full/nfa-final-report-1-1 27/118
National Forest and Tree Resources Assessment 2005 – 2007, Bangladesh
27
7.4. Variables
The FAO developed NFA approach comprises the collection of data on the multiple functionsof forests and trees, covering their Socio economic, Environmental as well as Productivefunctions, and the field data collection is therefore associated with a wide range of variablesand different methods for data collections.
Please refer to List of Variables and related attributes in Annex III and the Field manual inAnnex XII for a detailed description of the variables and their options covered in the field datacollection.
7.5. Training of field crews
The NFAU team members as well as the Field Team members were trained at severaloccasions to strengthen their capacities and to ensure quality and proper collection and
analysis of NFA data. The following training workshops were held for this purpose:
• From June 13 to 20, 2005:Training workshop was held for 14 FD officials including NFAU team onNFA Design on LU class definition.
• From October 4 to 11, 2005:Field Training of the NFAU team members and of the Field Crews wereconducted by SLU expatriates and project consultants on familiarizationof field equipments to be used during field survey and data collection.
• From October 23 to 27, 2005:
Further Field training of the Team Leaders of the field survey teams andSenior/Junior Field Investigators were held.
• From November 29, 2005 to December 9, 2005:The technical back stopping personnel from FAO-FOMR installed the‘NFA-Bangladesh v.1.0 database’ and trained the concerned FDpersonnel on data encoding.
• From February 28, 2006 to March 16, 2006:The FAO-FOMR team installed the NFA-Bangladesh v.1.2e data basesystem and trained the concerned personnel form the FD, Government ofBangladesh.
• From March 5 to 15, 2006:The FAO-FOMR team appraised the national consultants about the dataprocessing. At the same time the same team trained the FD personnel ondata processing.
7/23/2019 NFA Final Report (1) (1)
http://slidepdf.com/reader/full/nfa-final-report-1-1 28/118
National Forest and Tree Resources Assessment 2005 – 2007, Bangladesh
28
7.6. Field Data Collection – Measurements, Observations and
Interviews
The field data collection was started from the 2nd week of November 2005 by 10 teams in the
predefined 10 inventory zone all over the country. The field work ended on May 15, 2006,except the data from tract 5. For some of the unavoidable law and order problem the datafrom tract 5 could not be collected in time. However, the data from tract 5 was gathered andsent to Dhaka by the end of August 2006. These have been entered into the data base infirst week of October 2006.
It was expected that both the analysis results of the field inventory data and remote sensinganalysis shall be used hand in hand for the compilation and preparation of the report. Thoughfield survey, initiated in November 2005 was completed by May 2006, the classification of theremote sensing data could not be started until the arrival of the imageries in June 2006.During December 2005 to July 2006 data encoding of the sample tract was done by FD. Thiswork was constantly supervised by NFISC and TCDC, while the technical back stopping wasprovided by FOMR, FAO, Rome. A total of 296 Tract reports were finally encoded by usingthe application (NFA Bangladesh v.1.2g) and database (NFA-Data_Bangladesh). Theencoded sample tract data were examined and validated by TCDC, National Consultant(Analysis) and NFISC based on MS Access queries and MS Excel. Analysis of the findingsfrom field inventory is done in line with the report layout provided by the FOMR, FAO alongwith the national requirements.
The field survey teams identified the plot-starting points with GPS receivers and placed agalvanized metal pole as a permanent marker at each starting point. Three referencefeatures at suitable locations were noted with respect to the starting point for future locationof the plot-starting point. Within the 250 meter long and 20 meter wide Plots, the field teams
measured and registered related attributes for all trees≥
10cm Dbh, all stumps≥
10cm Dsh andall bamboo culms/clumps. The land uses (see Table 6) in the Plots were identified anddelineated with their dimensions and attributes related to these land uses were notedaccordingly.
Data on the status of forests and trees were measured by the field teams using forestinventory equipment, such as; diameter tape, altimeter, GPS receiver, compass, laser rangefinder, etc., while some variables can not be measured the field teams made adequateobservations to determine the status, and interviews with key informants and user groupswere conducted to assess information related to forest and tree resources management,uses and users.
Focus group discussions (FGDs) were conducted to collect information with respect to theproducts and services that the people generally harvest, collect and obtain form these land-use classes were recorded during the survey. During the focus group discussions the localkey informants were interviewed to collect the required data especially with respect to the‘products and services’. All data collected from the tracts are entered and recorded in six fieldforms. The forms that were used for the purpose are given in Annex II.
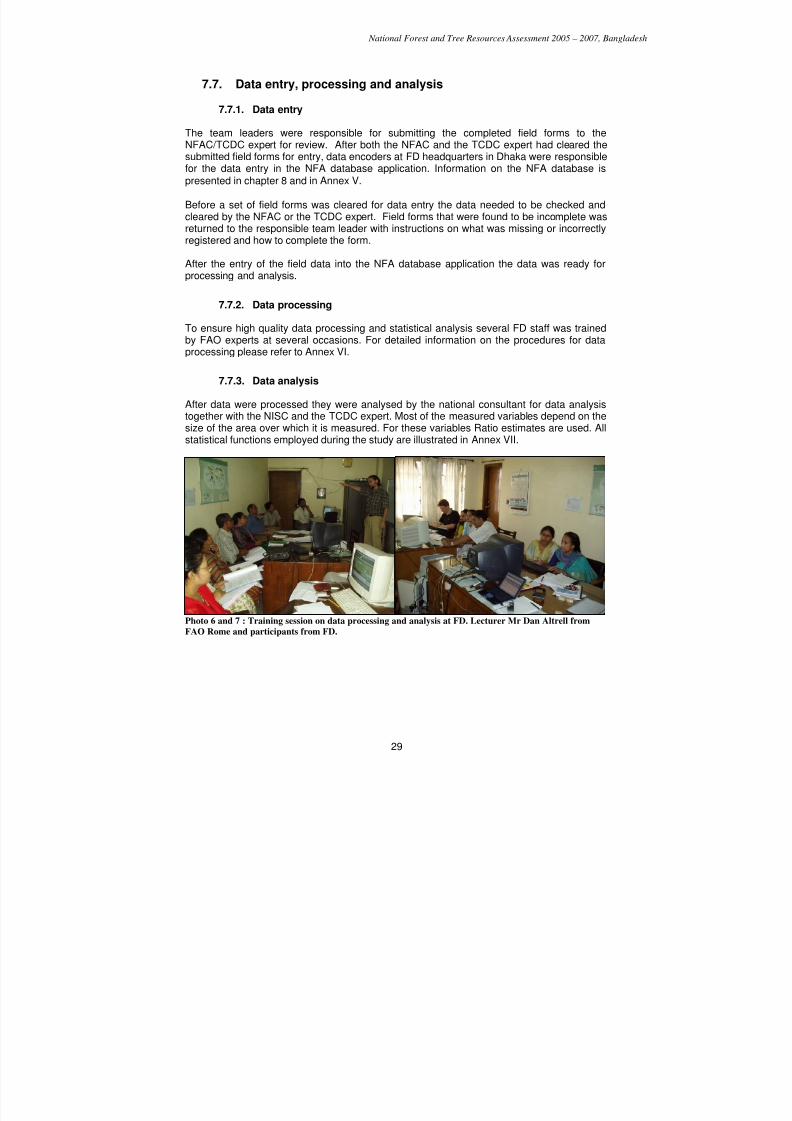
7/23/2019 NFA Final Report (1) (1)
http://slidepdf.com/reader/full/nfa-final-report-1-1 29/118
National Forest and Tree Resources Assessment 2005 – 2007, Bangladesh
29
7.7. Data entry, processing and analysis
7.7.1. Data entry
The team leaders were responsible for submitting the completed field forms to theNFAC/TCDC expert for review. After both the NFAC and the TCDC expert had cleared thesubmitted field forms for entry, data encoders at FD headquarters in Dhaka were responsiblefor the data entry in the NFA database application. Information on the NFA database ispresented in chapter 8 and in Annex V.
Before a set of field forms was cleared for data entry the data needed to be checked andcleared by the NFAC or the TCDC expert. Field forms that were found to be incomplete wasreturned to the responsible team leader with instructions on what was missing or incorrectlyregistered and how to complete the form.
After the entry of the field data into the NFA database application the data was ready for
processing and analysis.
7.7.2. Data processing
To ensure high quality data processing and statistical analysis several FD staff was trainedby FAO experts at several occasions. For detailed information on the procedures for dataprocessing please refer to Annex VI.
7.7.3. Data analysis
After data were processed they were analysed by the national consultant for data analysis
together with the NISC and the TCDC expert. Most of the measured variables depend on thesize of the area over which it is measured. For these variables Ratio estimates are used. Allstatistical functions employed during the study are illustrated in Annex VII.
Photo 6 and 7 : Training session on data processing and analysis at FD. Lecturer Mr Dan Altrell from
FAO Rome and participants from FD.
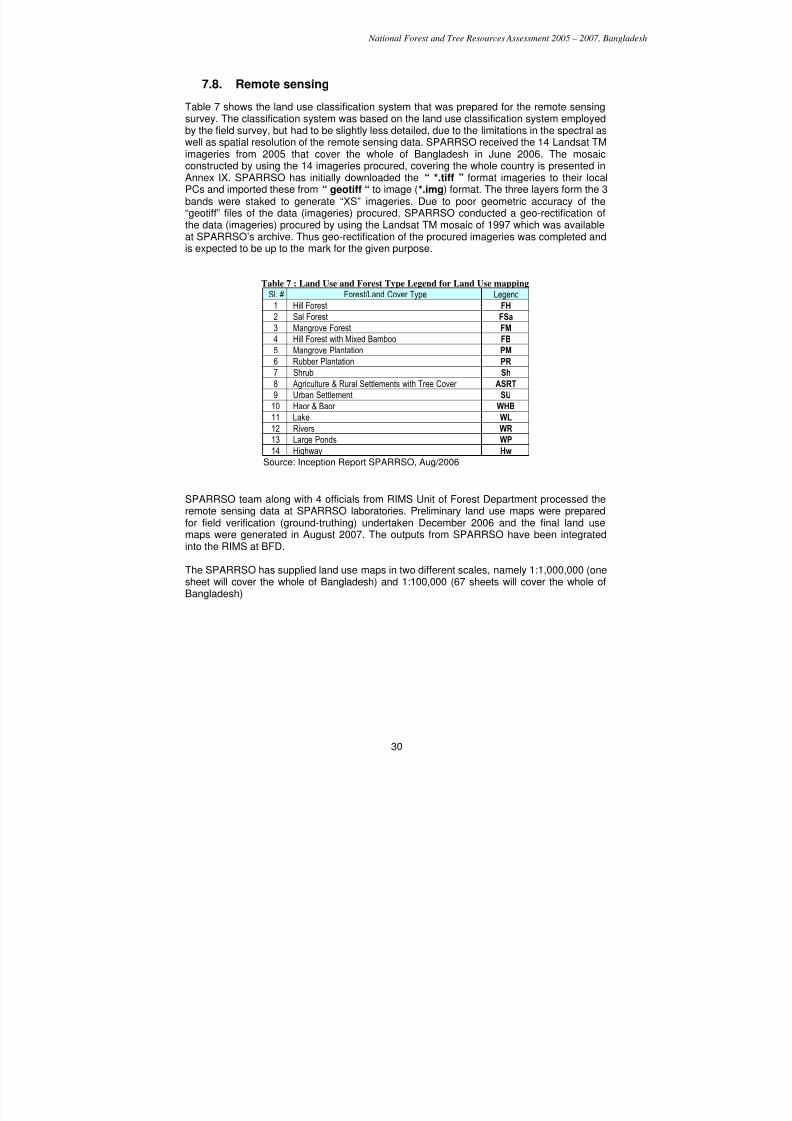
7/23/2019 NFA Final Report (1) (1)
http://slidepdf.com/reader/full/nfa-final-report-1-1 30/118
National Forest and Tree Resources Assessment 2005 – 2007, Bangladesh
30
7.8. Remote sensing
Table 7 shows the land use classification system that was prepared for the remote sensingsurvey. The classification system was based on the land use classification system employedby the field survey, but had to be slightly less detailed, due to the limitations in the spectral aswell as spatial resolution of the remote sensing data. SPARRSO received the 14 Landsat TMimageries from 2005 that cover the whole of Bangladesh in June 2006. The mosaicconstructed by using the 14 imageries procured, covering the whole country is presented inAnnex IX. SPARRSO has initially downloaded the “ *.tiff ” format imageries to their localPCs and imported these from “ geotiff “ to image (*.img) format. The three layers form the 3bands were staked to generate “XS” imageries. Due to poor geometric accuracy of the“geotiff” files of the data (imageries) procured, SPARRSO conducted a geo-rectification ofthe data (imageries) procured by using the Landsat TM mosaic of 1997 which was availableat SPARRSO’s archive. Thus geo-rectification of the procured imageries was completed andis expected to be up to the mark for the given purpose.
Table 7 : Land Use and Forest Type Legend for Land Use mapping
Sl. # Forest/Land Cover Type Legend
1 Hill Forest FH
2 Sal Forest FSa
3 Mangrove Forest FM
4 Hill Forest with Mixed Bamboo FB
5 Mangrove Plantation PM
6 Rubber Plantation PR
7 Shrub Sh
8 Agriculture & Rural Settlements with Tree Cover ASRT
9 Urban Settlement SU
10 Haor & Baor WHB
11 Lake WL12 Rivers WR
13 Large Ponds WP
14 Highway Hw
Source: Inception Report SPARRSO, Aug/2006
SPARRSO team along with 4 officials from RIMS Unit of Forest Department processed theremote sensing data at SPARRSO laboratories. Preliminary land use maps were preparedfor field verification (ground-truthing) undertaken December 2006 and the final land usemaps were generated in August 2007. The outputs from SPARRSO have been integratedinto the RIMS at BFD.
The SPARRSO has supplied land use maps in two different scales, namely 1:1,000,000 (onesheet will cover the whole of Bangladesh) and 1:100,000 (67 sheets will cover the whole ofBangladesh)
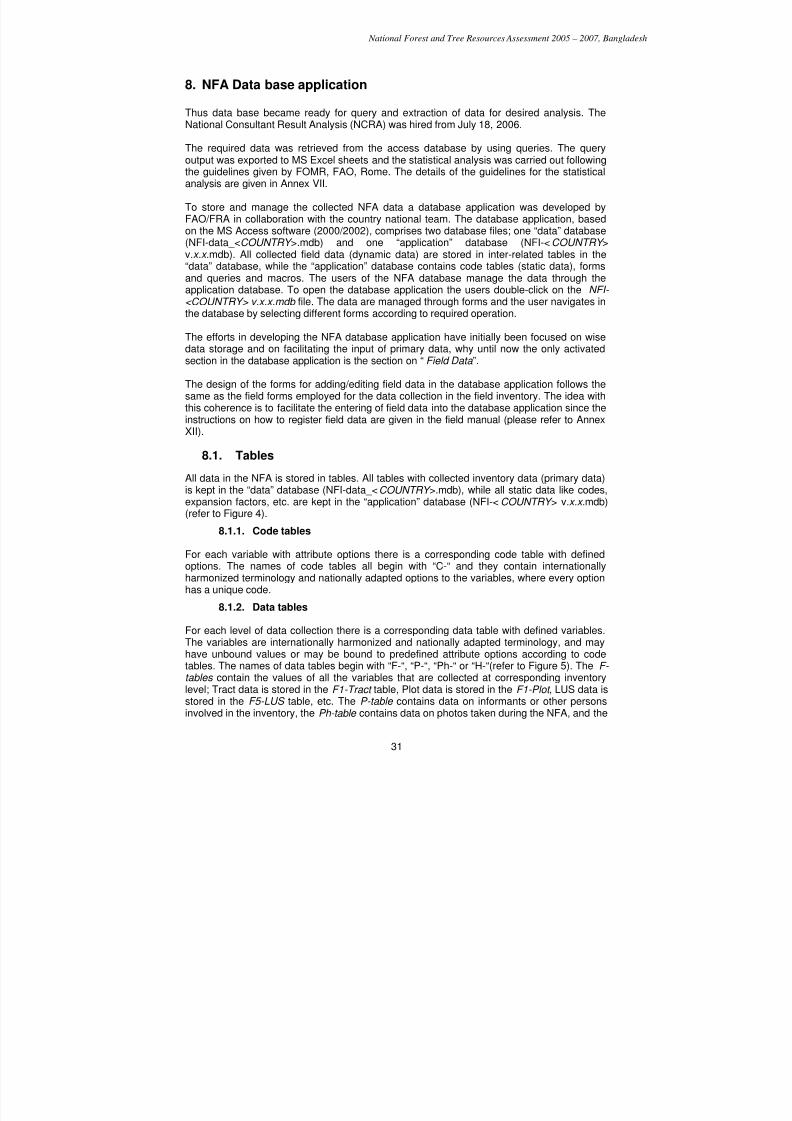
7/23/2019 NFA Final Report (1) (1)
http://slidepdf.com/reader/full/nfa-final-report-1-1 31/118
National Forest and Tree Resources Assessment 2005 – 2007, Bangladesh
31
8. NFA Data base application
Thus data base became ready for query and extraction of data for desired analysis. TheNational Consultant Result Analysis (NCRA) was hired from July 18, 2006.
The required data was retrieved from the access database by using queries. The queryoutput was exported to MS Excel sheets and the statistical analysis was carried out followingthe guidelines given by FOMR, FAO, Rome. The details of the guidelines for the statisticalanalysis are given in Annex VII.
To store and manage the collected NFA data a database application was developed byFAO/FRA in collaboration with the country national team. The database application, basedon the MS Access software (2000/2002), comprises two database files; one “data” database(NFI-data_<COUNTRY >.mdb) and one “application” database (NFI-<COUNTRY >v.x.x .mdb). All collected field data (dynamic data) are stored in inter-related tables in the“data” database, while the “application” database contains code tables (static data), forms
and queries and macros. The users of the NFA database manage the data through theapplication database. To open the database application the users double-click on the NFI- <COUNTRY> v.x.x.mdb file. The data are managed through forms and the user navigates inthe database by selecting different forms according to required operation.
The efforts in developing the NFA database application have initially been focused on wisedata storage and on facilitating the input of primary data, why until now the only activatedsection in the database application is the section on “Field Data ”.
The design of the forms for adding/editing field data in the database application follows thesame as the field forms employed for the data collection in the field inventory. The idea withthis coherence is to facilitate the entering of field data into the database application since theinstructions on how to register field data are given in the field manual (please refer to AnnexXII).
8.1. Tables
All data in the NFA is stored in tables. All tables with collected inventory data (primary data)is kept in the “data” database (NFI-data_<COUNTRY >.mdb), while all static data like codes,expansion factors, etc. are kept in the “application” database (NFI-<COUNTRY > v.x.x .mdb)(refer to Figure 4).
8.1.1. Code tables
For each variable with attribute options there is a corresponding code table with definedoptions. The names of code tables all begin with “C-“ and they contain internationallyharmonized terminology and nationally adapted options to the variables, where every optionhas a unique code.
8.1.2. Data tables
For each level of data collection there is a corresponding data table with defined variables.The variables are internationally harmonized and nationally adapted terminology, and mayhave unbound values or may be bound to predefined attribute options according to codetables. The names of data tables begin with “F-“, “P-“, “Ph-“ or “H-“(refer to Figure 5). The F- tables contain the values of all the variables that are collected at corresponding inventory
level; Tract data is stored in the F1-Tract table, Plot data is stored in the F1-Plot , LUS data isstored in the F5-LUS table, etc. The P-table contains data on informants or other personsinvolved in the inventory, the Ph-table contains data on photos taken during the NFA, and the
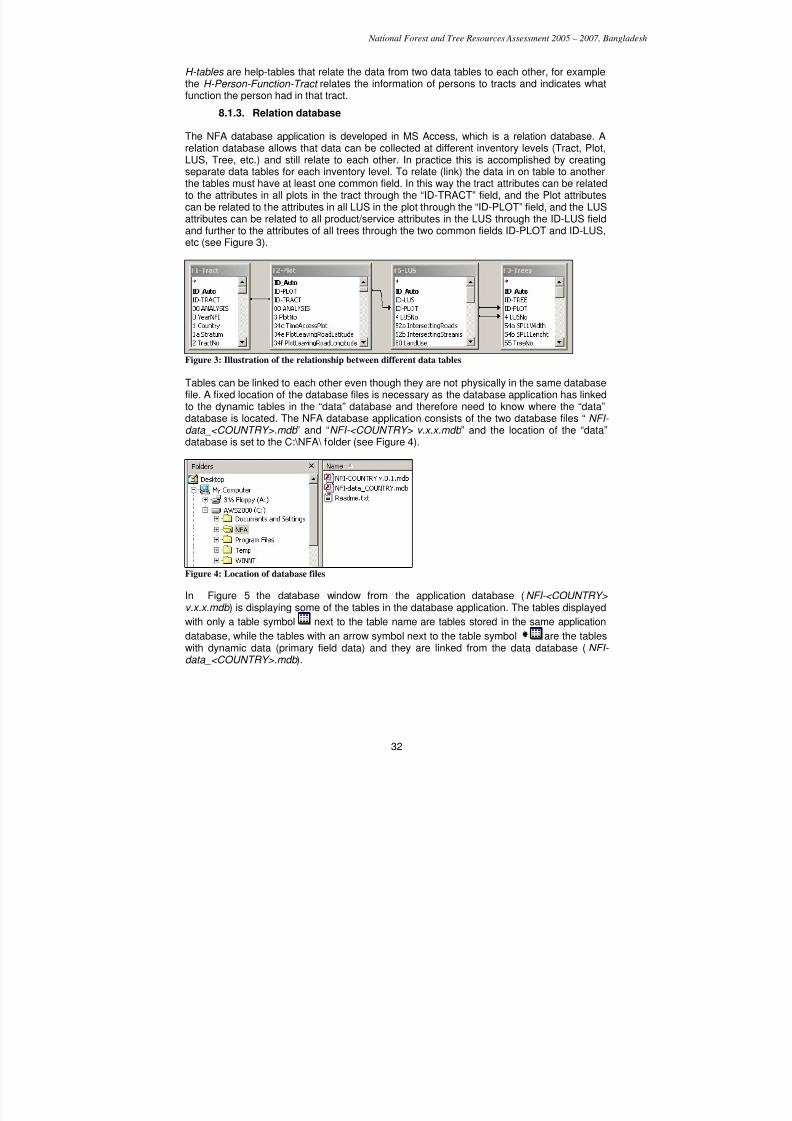
7/23/2019 NFA Final Report (1) (1)
http://slidepdf.com/reader/full/nfa-final-report-1-1 32/118
National Forest and Tree Resources Assessment 2005 – 2007, Bangladesh
32
H-tables are help-tables that relate the data from two data tables to each other, for examplethe H-Person-Function-Tract relates the information of persons to tracts and indicates whatfunction the person had in that tract.
8.1.3. Relation database
The NFA database application is developed in MS Access, which is a relation database. Arelation database allows that data can be collected at different inventory levels (Tract, Plot,LUS, Tree, etc.) and still relate to each other. In practice this is accomplished by creatingseparate data tables for each inventory level. To relate (link) the data in on table to anotherthe tables must have at least one common field. In this way the tract attributes can be relatedto the attributes in all plots in the tract through the “ID-TRACT” field, and the Plot attributescan be related to the attributes in all LUS in the plot through the “ID-PLOT” field, and the LUSattributes can be related to all product/service attributes in the LUS through the ID-LUS fieldand further to the attributes of all trees through the two common fields ID-PLOT and ID-LUS,etc (see Figure 3).
Figure 3: Illustration of the relationship between different data tables
Tables can be linked to each other even though they are not physically in the same databasefile. A fixed location of the database files is necessary as the database application has linkedto the dynamic tables in the “data” database and therefore need to know where the “data”
database is located. The NFA database application consists of the two database files “ NFI- data_<COUNTRY>.mdb ” and “NFI-<COUNTRY> v.x.x.mdb ” and the location of the “data”database is set to the C:\NFA\ folder (see Figure 4).
Figure 4: Location of database files
In Figure 5 the database window from the application database (NFI-<COUNTRY>v.x.x.mdb ) is displaying some of the tables in the database application. The tables displayed
with only a table symbol next to the table name are tables stored in the same application
database, while the tables with an arrow symbol next to the table symbol are the tableswith dynamic data (primary field data) and they are linked from the data database (NFI- data_<COUNTRY>.mdb ).
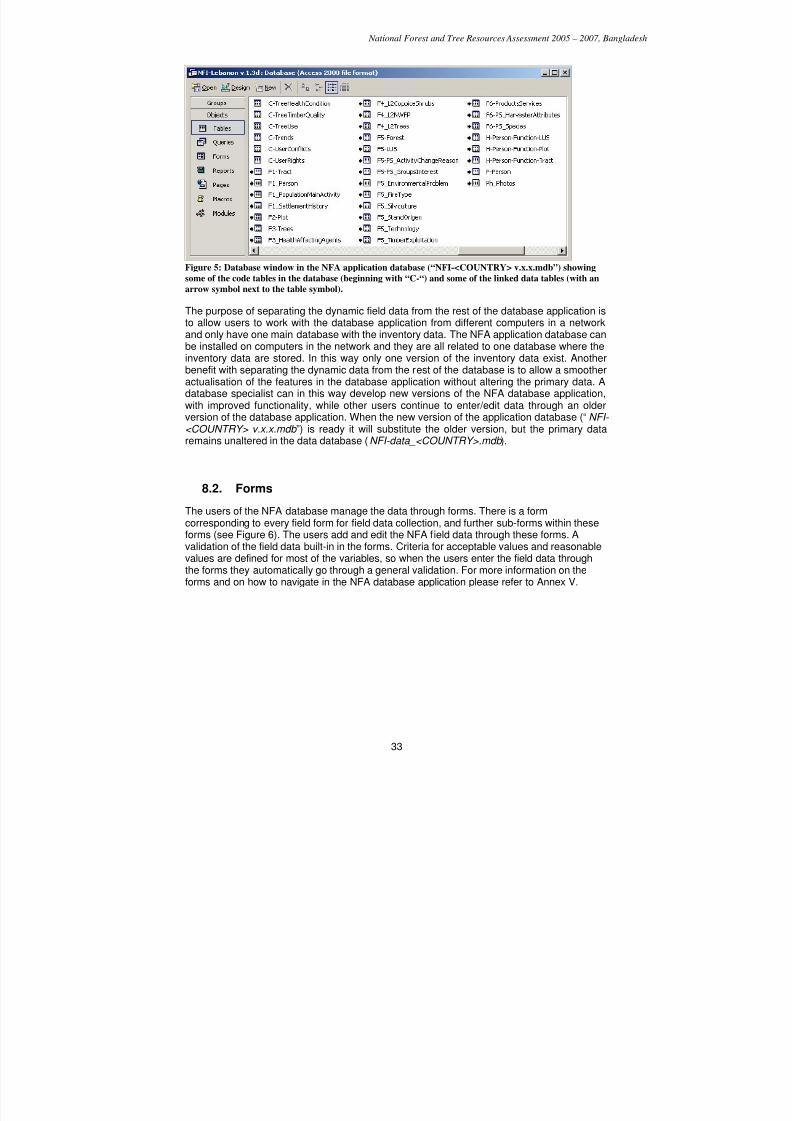
7/23/2019 NFA Final Report (1) (1)
http://slidepdf.com/reader/full/nfa-final-report-1-1 33/118
National Forest and Tree Resources Assessment 2005 – 2007, Bangladesh
33
Figure 5: Database window in the NFA application database (“NFI-<COUNTRY> v.x.x.mdb”) showing
some of the code tables in the database (beginning with “C-“) and some of the linked data tables (with anarrow symbol next to the table symbol).
The purpose of separating the dynamic field data from the rest of the database application isto allow users to work with the database application from different computers in a networkand only have one main database with the inventory data. The NFA application database canbe installed on computers in the network and they are all related to one database where theinventory data are stored. In this way only one version of the inventory data exist. Anotherbenefit with separating the dynamic data from the rest of the database is to allow a smootheractualisation of the features in the database application without altering the primary data. Adatabase specialist can in this way develop new versions of the NFA database application,with improved functionality, while other users continue to enter/edit data through an older
version of the database application. When the new version of the application database (“NFI- <COUNTRY> v.x.x.mdb ”) is ready it will substitute the older version, but the primary dataremains unaltered in the data database (NFI-data_<COUNTRY>.mdb ).
8.2. Forms
The users of the NFA database manage the data through forms. There is a formcorresponding to every field form for field data collection, and further sub-forms within theseforms (see Figure 6). The users add and edit the NFA field data through these forms. Avalidation of the field data built-in in the forms. Criteria for acceptable values and reasonablevalues are defined for most of the variables, so when the users enter the field data throughthe forms they automatically go through a general validation. For more information on theforms and on how to navigate in the NFA database application please refer to Annex V.
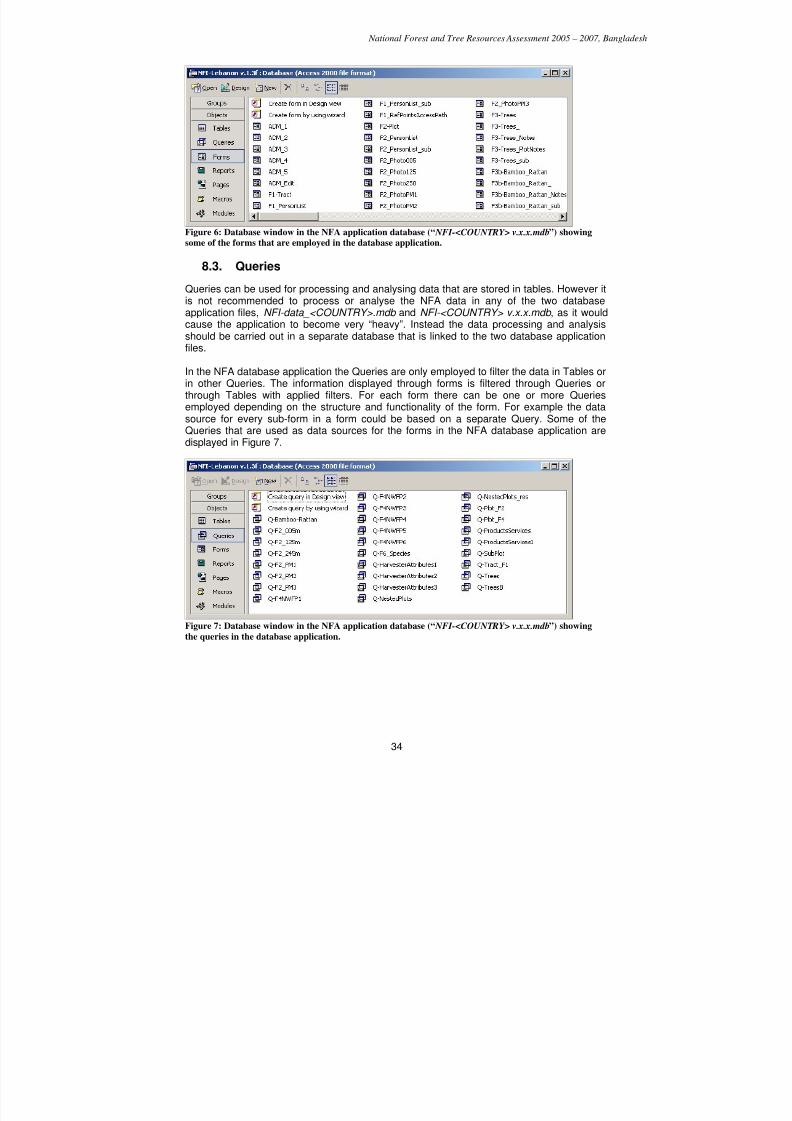
7/23/2019 NFA Final Report (1) (1)
http://slidepdf.com/reader/full/nfa-final-report-1-1 34/118
National Forest and Tree Resources Assessment 2005 – 2007, Bangladesh
34
Figure 6: Database window in the NFA application database (“ NFI-<COUNTRY> v.x.x.mdb”) showing
some of the forms that are employed in the database application.
8.3. Queries
Queries can be used for processing and analysing data that are stored in tables. However itis not recommended to process or analyse the NFA data in any of the two databaseapplication files, NFI-data_<COUNTRY>.mdb and NFI-<COUNTRY> v.x.x.mdb , as it wouldcause the application to become very “heavy”. Instead the data processing and analysisshould be carried out in a separate database that is linked to the two database applicationfiles.
In the NFA database application the Queries are only employed to filter the data in Tables orin other Queries. The information displayed through forms is filtered through Queries orthrough Tables with applied filters. For each form there can be one or more Queriesemployed depending on the structure and functionality of the form. For example the data
source for every sub-form in a form could be based on a separate Query. Some of theQueries that are used as data sources for the forms in the NFA database application aredisplayed in Figure 7.
Figure 7: Database window in the NFA application database (“ NFI-<COUNTRY> v.x.x.mdb”) showing
the queries in the database application.
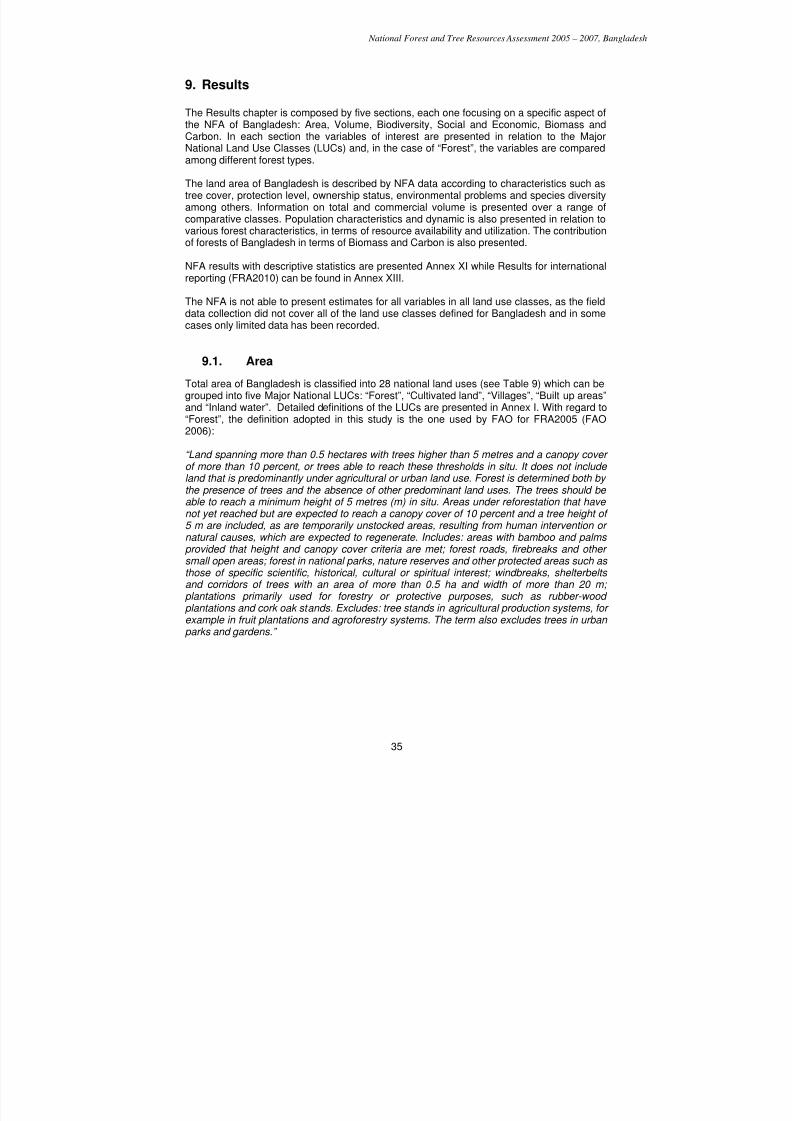
7/23/2019 NFA Final Report (1) (1)
http://slidepdf.com/reader/full/nfa-final-report-1-1 35/118
National Forest and Tree Resources Assessment 2005 – 2007, Bangladesh
35
9. Results
The Results chapter is composed by five sections, each one focusing on a specific aspect ofthe NFA of Bangladesh: Area, Volume, Biodiversity, Social and Economic, Biomass and
Carbon. In each section the variables of interest are presented in relation to the MajorNational Land Use Classes (LUCs) and, in the case of “Forest”, the variables are comparedamong different forest types.
The land area of Bangladesh is described by NFA data according to characteristics such astree cover, protection level, ownership status, environmental problems and species diversityamong others. Information on total and commercial volume is presented over a range ofcomparative classes. Population characteristics and dynamic is also presented in relation tovarious forest characteristics, in terms of resource availability and utilization. The contributionof forests of Bangladesh in terms of Biomass and Carbon is also presented.
NFA results with descriptive statistics are presented Annex XI while Results for international
reporting (FRA2010) can be found in Annex XIII.
The NFA is not able to present estimates for all variables in all land use classes, as the fielddata collection did not cover all of the land use classes defined for Bangladesh and in somecases only limited data has been recorded.
9.1. Area
Total area of Bangladesh is classified into 28 national land uses (see Table 9) which can begrouped into five Major National LUCs: “Forest”, “Cultivated land”, “Villages”, “Built up areas”and “Inland water”. Detailed definitions of the LUCs are presented in Annex I. With regard to
“Forest”, the definition adopted in this study is the one used by FAO for FRA2005 (FAO2006):
“Land spanning more than 0.5 hectares with trees higher than 5 metres and a canopy coverof more than 10 percent, or trees able to reach these thresholds in situ. It does not includeland that is predominantly under agricultural or urban land use. Forest is determined both bythe presence of trees and the absence of other predominant land uses. The trees should beable to reach a minimum height of 5 metres (m) in situ. Areas under reforestation that havenot yet reached but are expected to reach a canopy cover of 10 percent and a tree height of5 m are included, as are temporarily unstocked areas, resulting from human intervention ornatural causes, which are expected to regenerate. Includes: areas with bamboo and palms
provided that height and canopy cover criteria are met; forest roads, firebreaks and othersmall open areas; forest in national parks, nature reserves and other protected areas such asthose of specific scientific, historical, cultural or spiritual interest; windbreaks, shelterbeltsand corridors of trees with an area of more than 0.5 ha and width of more than 20 m;plantations primarily used for forestry or protective purposes, such as rubber-woodplantations and cork oak stands. Excludes: tree stands in agricultural production systems, forexample in fruit plantations and agroforestry systems. The term also excludes trees in urbanparks and gardens.”
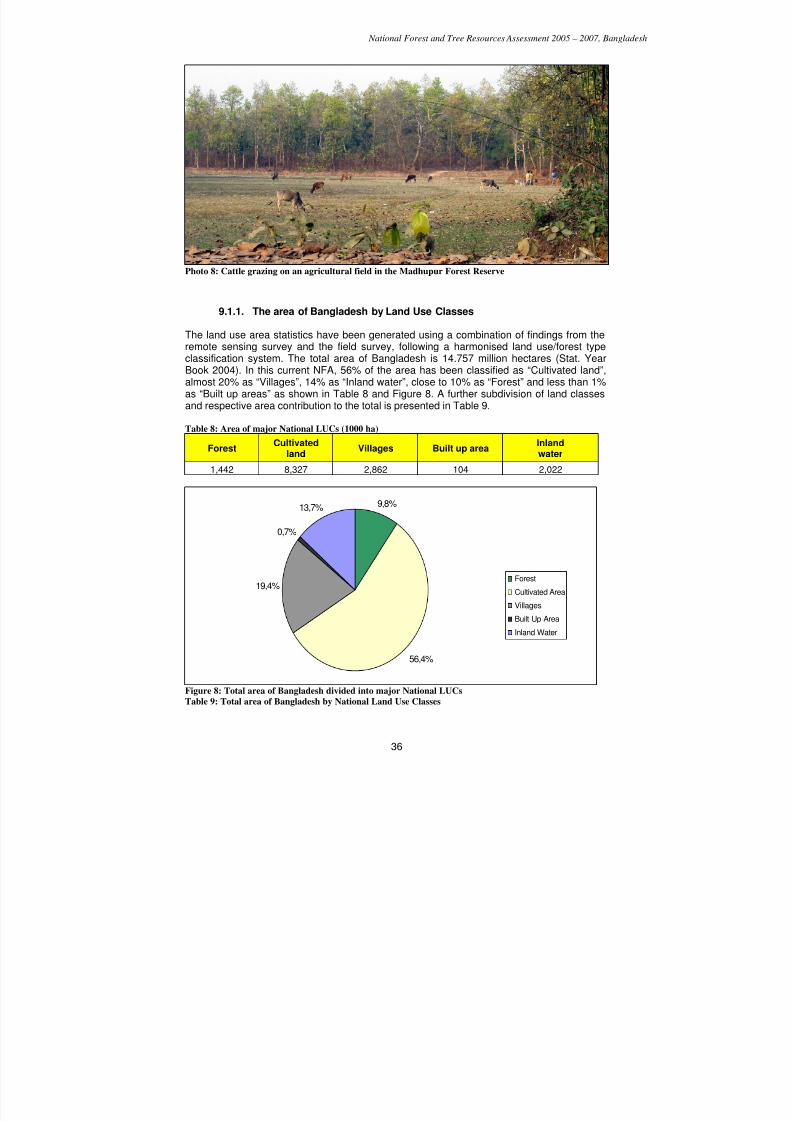
7/23/2019 NFA Final Report (1) (1)
http://slidepdf.com/reader/full/nfa-final-report-1-1 36/118
National Forest and Tree Resources Assessment 2005 – 2007, Bangladesh
36
Photo 8: Cattle grazing on an agricultural field in the Madhupur Forest Reserve
9.1.1. The area of Bangladesh by Land Use Classes
The land use area statistics have been generated using a combination of findings from theremote sensing survey and the field survey, following a harmonised land use/forest typeclassification system. The total area of Bangladesh is 14.757 million hectares (Stat. YearBook 2004). In this current NFA, 56% of the area has been classified as “Cultivated land”,almost 20% as “Villages”, 14% as “Inland water”, close to 10% as “Forest” and less than 1%as “Built up areas” as shown in Table 8 and Figure 8. A further subdivision of land classesand respective area contribution to the total is presented in Table 9.
Table 8: Area of major National LUCs (1000 ha)
ForestCultivated
landVillages Built up area
Inlandwater
1,442 8,327 2,862 104 2,022
9,8%
56,4%
19,4%
0,7%
13,7%
Forest
Cultivated Area
Villages
Built Up Area
Inland Water
Figure 8: Total area of Bangladesh divided into major National LUCsTable 9: Total area of Bangladesh by National Land Use Classes
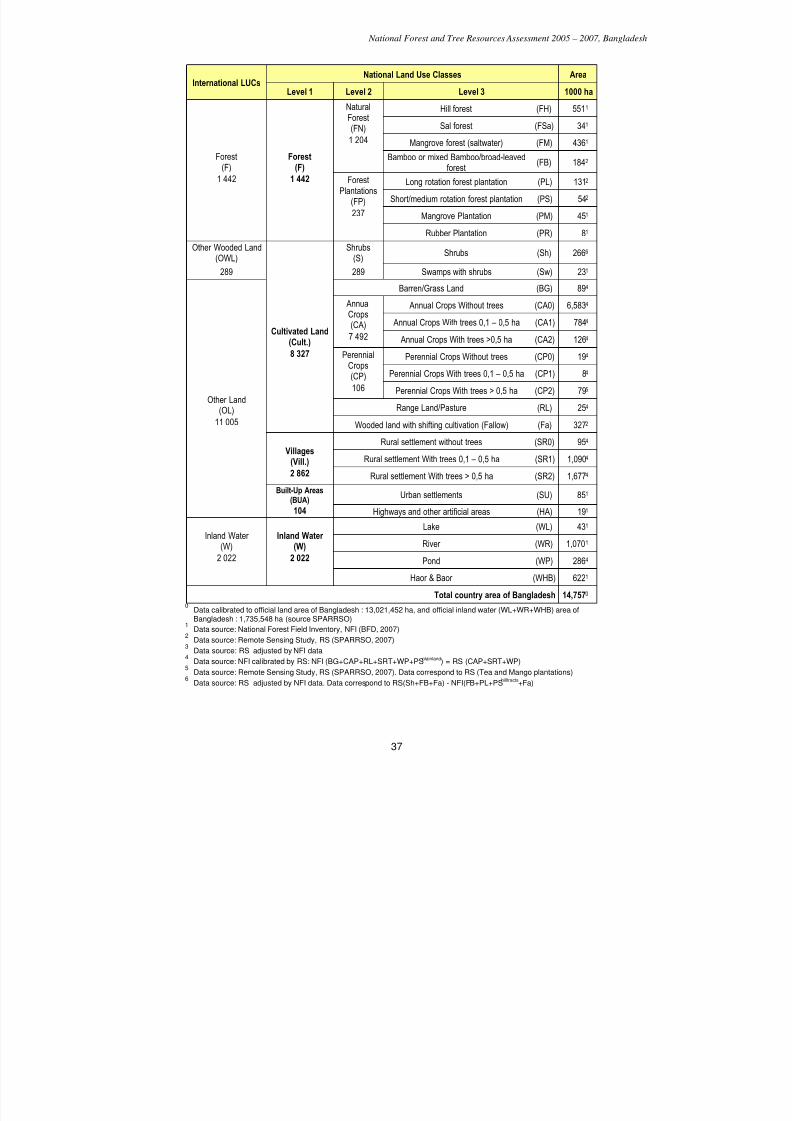
7/23/2019 NFA Final Report (1) (1)
http://slidepdf.com/reader/full/nfa-final-report-1-1 37/118
National Forest and Tree Resources Assessment 2005 – 2007, Bangladesh
37
National Land Use Classes AreaInternational LUCs
Level 1 Level 2 Level 3 1000 ha
Hill forest (FH) 5511 NaturalForest(FN) Sal forest (FSa) 341
Mangrove forest (saltwater) (FM) 4361
Forest(F)
Forest(F)
1 204
Bamboo or mixed Bamboo/broad-leavedforest
(FB) 1842
Long rotation forest plantation (PL) 1312 ForestPlantations
(FP) Short/medium rotation forest plantation (PS) 542
Mangrove Plantation (PM) 451
1 442 1 442
237
Rubber Plantation (PR) 81
Other Wooded Land(OWL)
Shrubs(S)
Shrubs (Sh) 2666
289 289 Swamps with shrubs (Sw) 231
Barren/Grass Land (BG) 894
Annual Crops Without trees (CA0) 6,5834 AnnualCrops(CA) Annual Crops With trees 0,1 – 0,5 ha (CA1) 7844
Cultivated Land(Cult.)
7 492 Annual Crops With trees >0,5 ha (CA2) 1264
Perennial Crops Without trees (CP0) 194 PerennialCrops(CP) Perennial Crops With trees 0,1 – 0,5 ha (CP1) 84
106 Perennial Crops With trees > 0,5 ha (CP2) 795 Other Land
(OL) Range Land/Pasture (RL) 254
8 327
Wooded land with shifting cultivation (Fallow) (Fa) 3272
Rural settlement without trees (SR0) 954 Villages
(Vill.) Rural settlement With trees 0,1 – 0,5 ha (SR1) 1,0904
2 862 Rural settlement With trees > 0,5 ha (SR2) 1,6774
Built-Up Areas(BUA)
Urban settlements (SU) 851
11 005
104 Highways and other artificial areas (HA) 191
Lake (WL) 431 Inland Water
(W)Inland Water
(W) River (WR) 1,0701
Pond (WP) 2864 2 022 2 022
Haor & Baor (WHB) 6221
Total country area of Bangladesh 14,7570 0 Data calibrated to official land area of Bangladesh : 13,021,452 ha, and official inland water (WL+WR+WHB) area of
Bangladesh : 1,735,548 ha (source SPARRSO)1 Data source: National Forest Field Inventory, NFI (BFD, 2007)
2 Data source: Remote Sensing Study, RS (SPARRSO, 2007) 3 Data source: RS adjusted by NFI data
4 Data source: NFI calibrated by RS: NFI (BG+CAP+RL+SRT+WP+PSplainland) = RS (CAP+SRT+WP)
5 Data source: Remote Sensing Study, RS (SPARRSO, 2007). Data correspond to RS (Tea and Mango plantations)6 Data source: RS adjusted by NFI data. Data correspond to RS(Sh+FB+Fa) - NFI(FB+PL+PShilltracts+Fa)
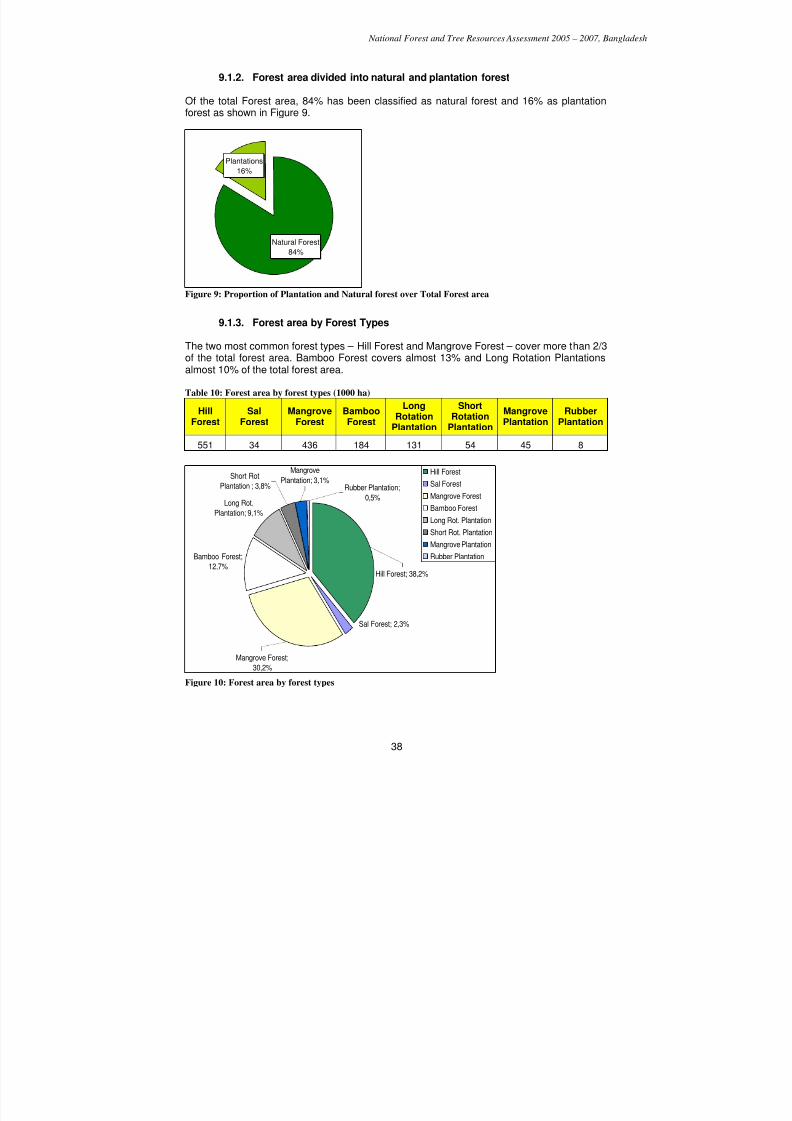
7/23/2019 NFA Final Report (1) (1)
http://slidepdf.com/reader/full/nfa-final-report-1-1 38/118
National Forest and Tree Resources Assessment 2005 – 2007, Bangladesh
38
9.1.2. Forest area divided into natural and plantation forest
Of the total Forest area, 84% has been classified as natural forest and 16% as plantationforest as shown in Figure 9.
Plantations
16%
Natural Forest
84%
Figure 9: Proportion of Plantation and Natural forest over Total Forest area
9.1.3. Forest area by Forest Types
The two most common forest types – Hill Forest and Mangrove Forest – cover more than 2/3of the total forest area. Bamboo Forest covers almost 13% and Long Rotation Plantationsalmost 10% of the total forest area.
Table 10: Forest area by forest types (1000 ha)
HillForest SalForest MangroveForest BambooForest
Long
RotationPlantation
Short
RotationPlantation
MangrovePlantation RubberPlantation
551 34 436 184 131 54 45 8
Bamboo Forest;12,7%
Long Rot.
Plantation; 9,1%
Sal Forest; 2,3%
Mangrove Forest;
30,2%
Hill Forest; 38,2%
Short Rot.
Plantation ; 3,8% Rubber Plantation;
0,5%
Mangrove
Plantation; 3,1%Hill Forest
Sal Forest
Mangrove Forest
Bamboo Forest
Long Rot. Plantation
Short Rot. Plantation
Mangrove Plantation
Rubber Plantation
Figure 10: Forest area by forest types
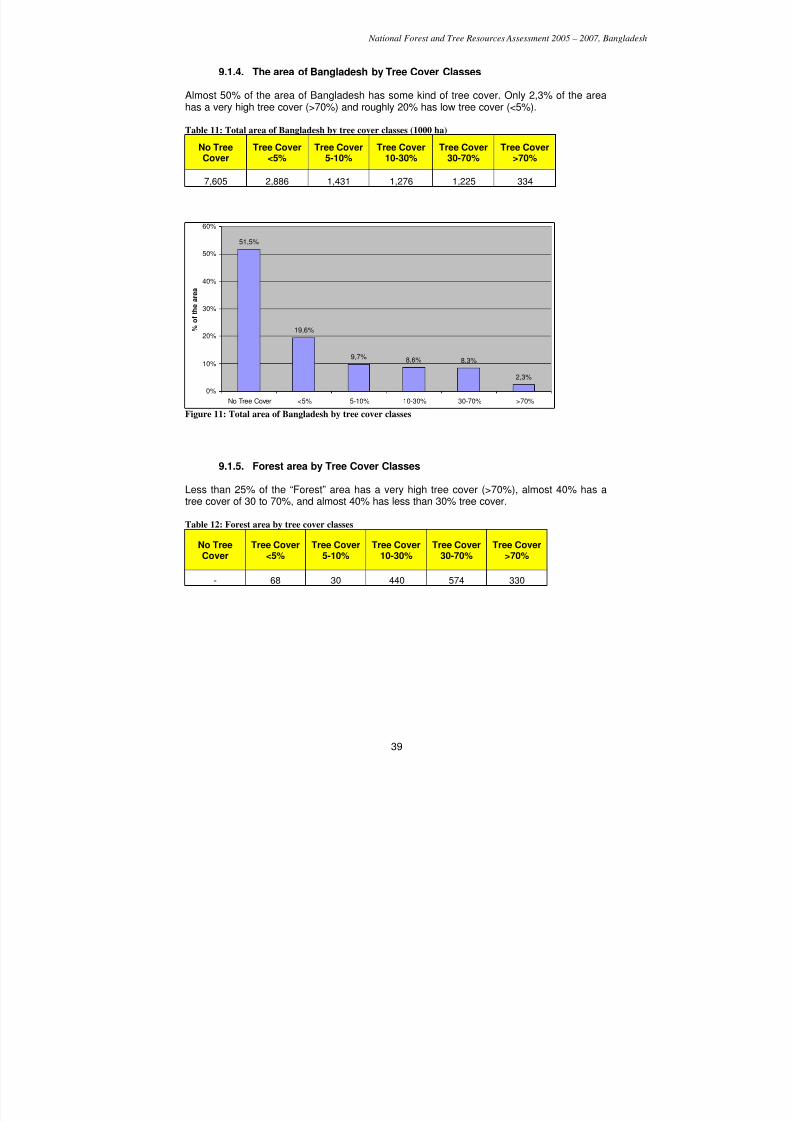
7/23/2019 NFA Final Report (1) (1)
http://slidepdf.com/reader/full/nfa-final-report-1-1 39/118
National Forest and Tree Resources Assessment 2005 – 2007, Bangladesh
39
9.1.4. The area of Bangladesh by Tree Cover Classes
Almost 50% of the area of Bangladesh has some kind of tree cover. Only 2,3% of the areahas a very high tree cover (>70%) and roughly 20% has low tree cover (<5%).
Table 11: Total area of Bangladesh by tree cover classes (1000 ha)
No TreeCover
Tree Cover<5%
Tree Cover5-10%
Tree Cover10-30%
Tree Cover30-70%
Tree Cover>70%
7,605 2,886 1,431 1,276 1,225 334
51,5%
19,6%
9,7% 8,6% 8,3%
2,3%
0%
10%
20%
30%
40%
50%
60%
No Tree Cover <5% 5-10% 10-30% 30-70% >70%
% o f t h e a r e a
Figure 11: Total area of Bangladesh by tree cover classes
9.1.5. Forest area by Tree Cover Classes
Less than 25% of the “Forest” area has a very high tree cover (>70%), almost 40% has atree cover of 30 to 70%, and almost 40% has less than 30% tree cover.
Table 12: Forest area by tree cover classes
No Tree
Cover
Tree Cover
<5%
Tree Cover
5-10%
Tree Cover
10-30%
Tree Cover
30-70%
Tree Cover
>70%
- 68 30 440 574 330
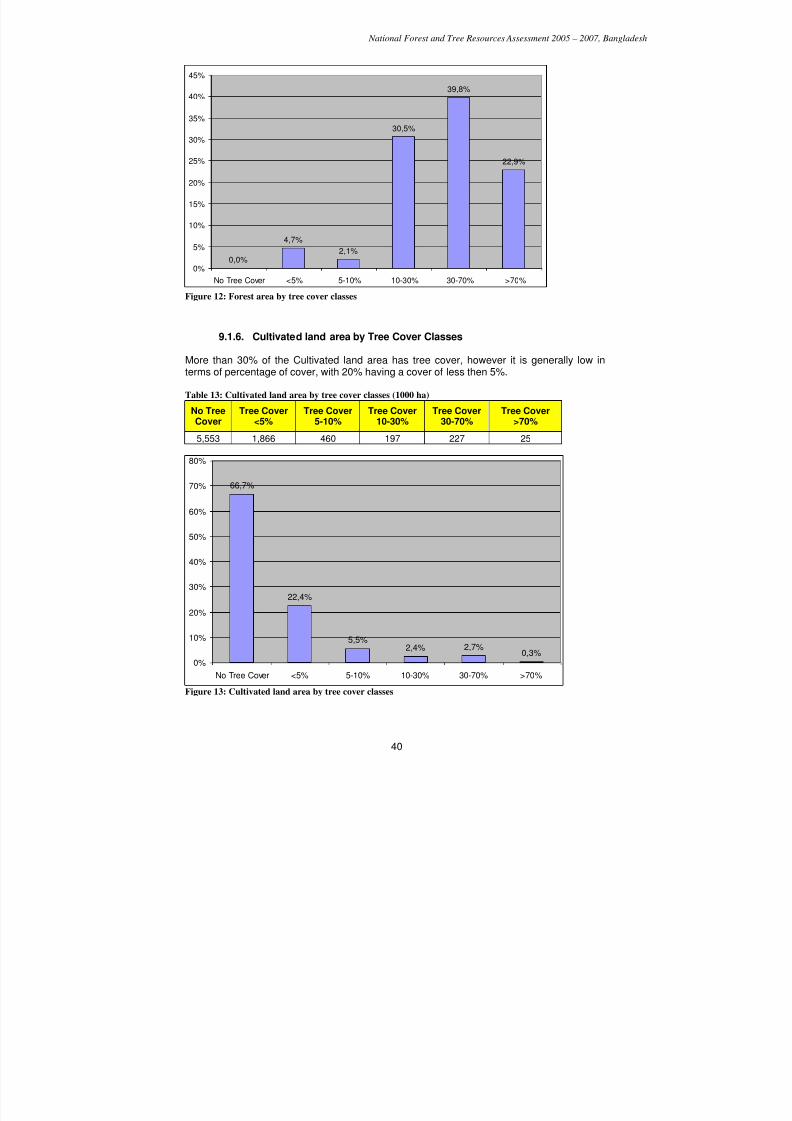
7/23/2019 NFA Final Report (1) (1)
http://slidepdf.com/reader/full/nfa-final-report-1-1 40/118
National Forest and Tree Resources Assessment 2005 – 2007, Bangladesh
40
0,0%
4,7%
2,1%
30,5%
39,8%
22,9%
0%
5%
10%
15%
20%
25%
30%
35%
40%
45%
No Tree Cover <5% 5-10% 10-30% 30-70% >70% Figure 12: Forest area by tree cover classes
9.1.6. Cultivated land area by Tree Cover Classes
More than 30% of the Cultivated land area has tree cover, however it is generally low interms of percentage of cover, with 20% having a cover of less then 5%.
Table 13: Cultivated land area by tree cover classes (1000 ha)
No TreeCover Tree Cover<5% Tree Cover5-10% Tree Cover10-30% Tree Cover30-70% Tree Cover>70%
5,553 1,866 460 197 227 25
66,7%
22,4%
5,5%2,4% 2,7%
0,3%0%
10%
20%
30%
40%
50%
60%
70%
80%
No Tree Cover <5% 5-10% 10-30% 30-70% >70%
Figure 13: Cultivated land area by tree cover classes
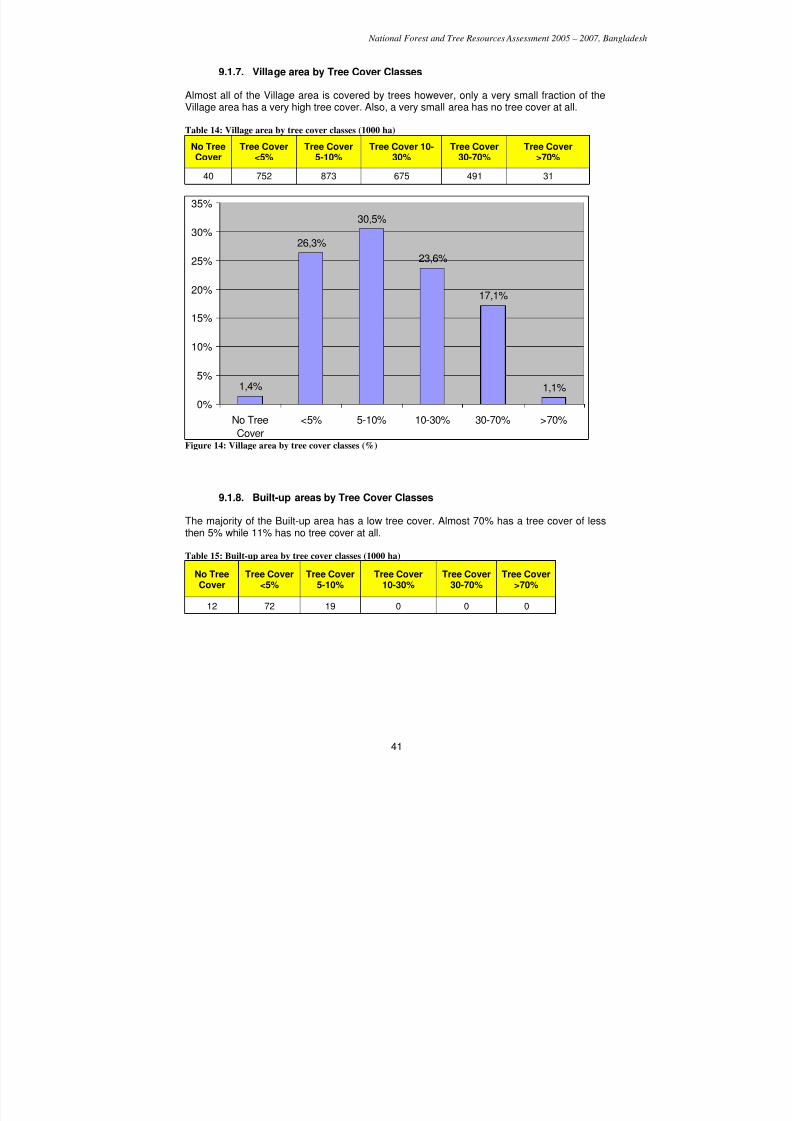
7/23/2019 NFA Final Report (1) (1)
http://slidepdf.com/reader/full/nfa-final-report-1-1 41/118
National Forest and Tree Resources Assessment 2005 – 2007, Bangladesh
41
9.1.7. Village area by Tree Cover Classes
Almost all of the Village area is covered by trees however, only a very small fraction of theVillage area has a very high tree cover. Also, a very small area has no tree cover at all.
Table 14: Village area by tree cover classes (1000 ha)
No TreeCover
Tree Cover<5%
Tree Cover5-10%
Tree Cover 10-30%
Tree Cover30-70%
Tree Cover>70%
40 752 873 675 491 31
1,4%
26,3%
30,5%
23,6%
17,1%
1,1%
0%
5%
10%
15%
20%
25%
30%
35%
No TreeCover
<5% 5-10% 10-30% 30-70% >70%
Figure 14: Village area by tree cover classes (%)
9.1.8. Built-up areas by Tree Cover Classes
The majority of the Built-up area has a low tree cover. Almost 70% has a tree cover of lessthen 5% while 11% has no tree cover at all.
Table 15: Built-up area by tree cover classes (1000 ha)
No TreeCover
Tree Cover<5%
Tree Cover5-10%
Tree Cover10-30%
Tree Cover30-70%
Tree Cover>70%
12 72 19 0 0 0
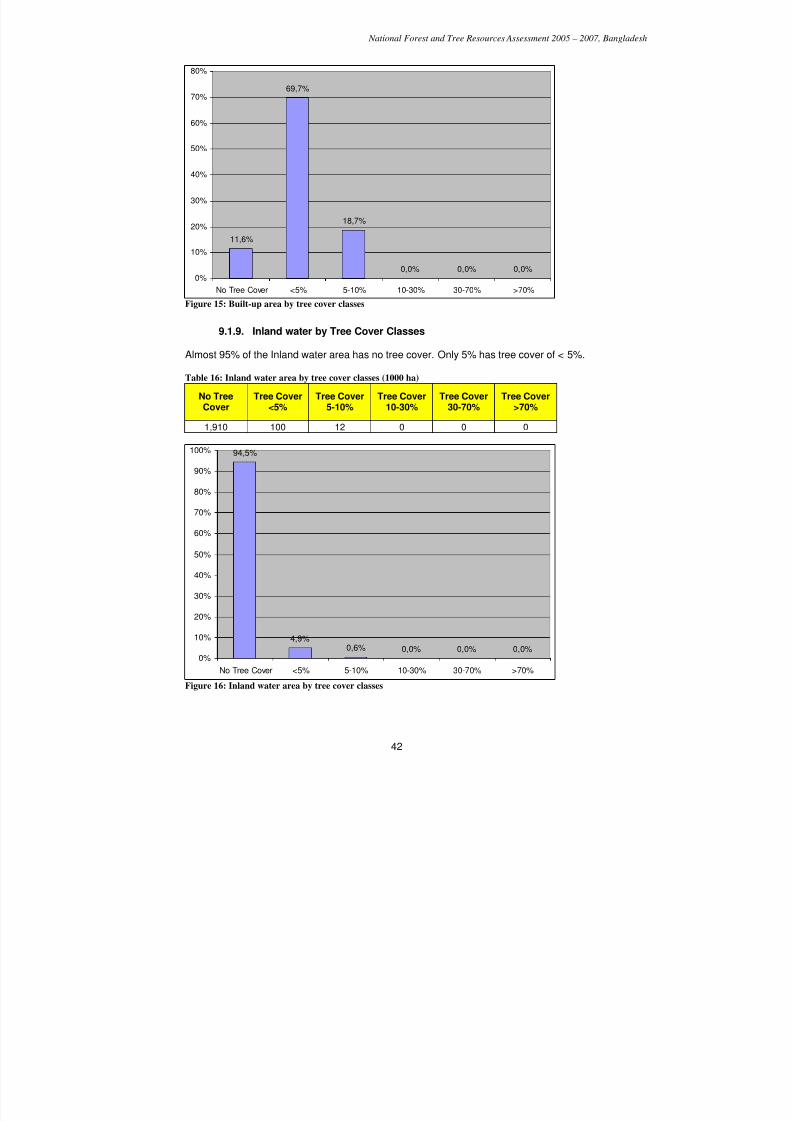
7/23/2019 NFA Final Report (1) (1)
http://slidepdf.com/reader/full/nfa-final-report-1-1 42/118
National Forest and Tree Resources Assessment 2005 – 2007, Bangladesh
42
11,6%
69,7%
18,7%
0,0% 0,0% 0,0%
0%
10%
20%
30%
40%
50%
60%
70%
80%
No Tree Cover <5% 5-10% 10-30% 30-70% >70%
Figure 15: Built-up area by tree cover classes
9.1.9. Inland water by Tree Cover Classes
Almost 95% of the Inland water area has no tree cover. Only 5% has tree cover of < 5%.
Table 16: Inland water area by tree cover classes (1000 ha)
No TreeCover
Tree Cover<5%
Tree Cover5-10%
Tree Cover10-30%
Tree Cover30-70%
Tree Cover>70%
1,910 100 12 0 0 0
94,5%
4,9%0,6% 0,0% 0,0% 0,0%
0%
10%
20%
30%
40%
50%
60%
70%
80%
90%
100%
No Tree Cover <5% 5-10% 10-30% 30-70% >70%
Figure 16: Inland water area by tree cover classes
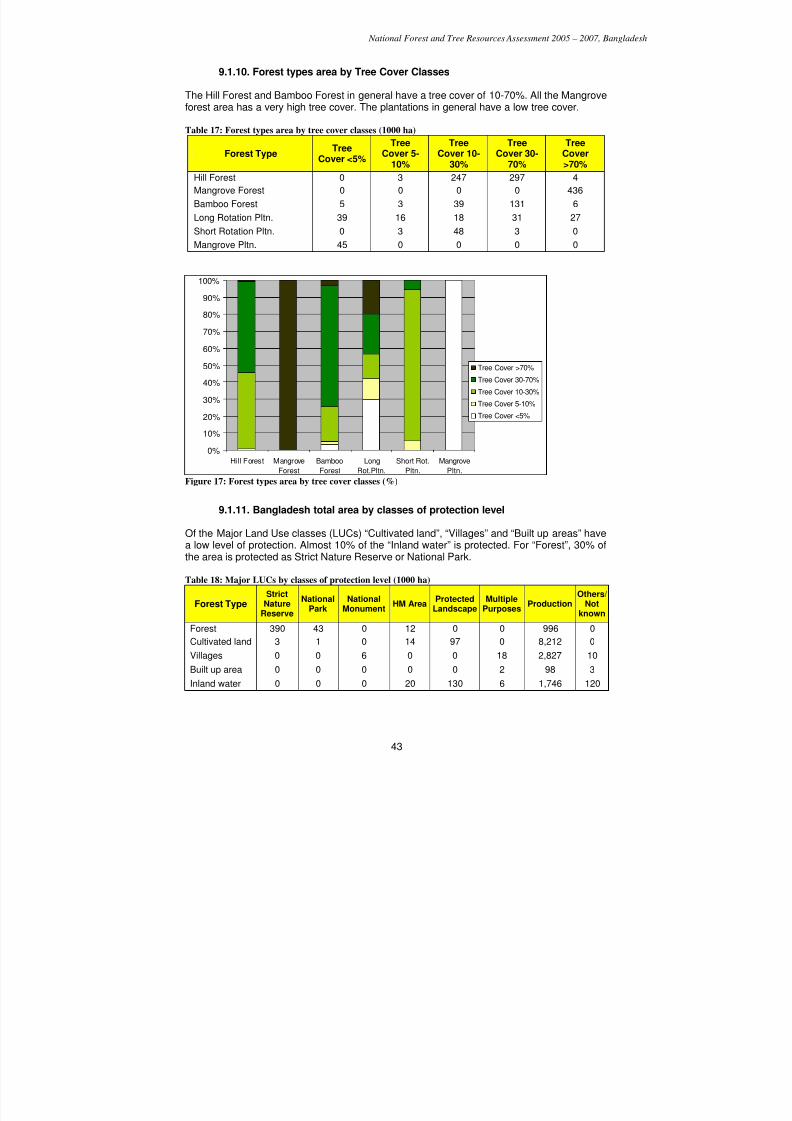
7/23/2019 NFA Final Report (1) (1)
http://slidepdf.com/reader/full/nfa-final-report-1-1 43/118
National Forest and Tree Resources Assessment 2005 – 2007, Bangladesh
43
9.1.10. Forest types area by Tree Cover Classes
The Hill Forest and Bamboo Forest in general have a tree cover of 10-70%. All the Mangroveforest area has a very high tree cover. The plantations in general have a low tree cover.
Table 17: Forest types area by tree cover classes (1000 ha)
Forest TypeTree
Cover <5%
TreeCover 5-
10%
TreeCover 10-
30%
TreeCover 30-
70%
TreeCover>70%
Hill Forest 0 3 247 297 4
Mangrove Forest 0 0 0 0 436
Bamboo Forest 5 3 39 131 6
Long Rotation Pltn. 39 16 18 31 27
Short Rotation Pltn. 0 3 48 3 0
Mangrove Pltn. 45 0 0 0 0
0%
10%
20%
30%
40%
50%
60%
70%
80%
90%
100%
Hill Forest Mangrove
Forest
Bamboo
Forest
Long
Rot.Pltn.
Short Rot.
Pltn.
Mangrove
Pltn.
Tree Cover >70%
Tree Cover 30-70%
Tree Cover 10-30%
Tree Cover 5-10%
Tree Cover <5%
Figure 17: Forest types area by tree cover classes (%)
9.1.11. Bangladesh total area by classes of protection level
Of the Major Land Use classes (LUCs) “Cultivated land”, “Villages” and “Built up areas” havea low level of protection. Almost 10% of the “Inland water” is protected. For “Forest”, 30% of
the area is protected as Strict Nature Reserve or National Park.
Table 18: Major LUCs by classes of protection level (1000 ha)
Forest Type
StrictNature
Reserve
NationalPark
NationalMonument
HM AreaProtected
LandscapeMultiple
PurposesProduction
Others/Not
known
Forest 390 43 0 12 0 0 996 0
Cultivated land 3 1 0 14 97 0 8,212 0
Villages 0 0 6 0 0 18 2,827 10
Built up area 0 0 0 0 0 2 98 3
Inland water 0 0 0 20 130 6 1,746 120
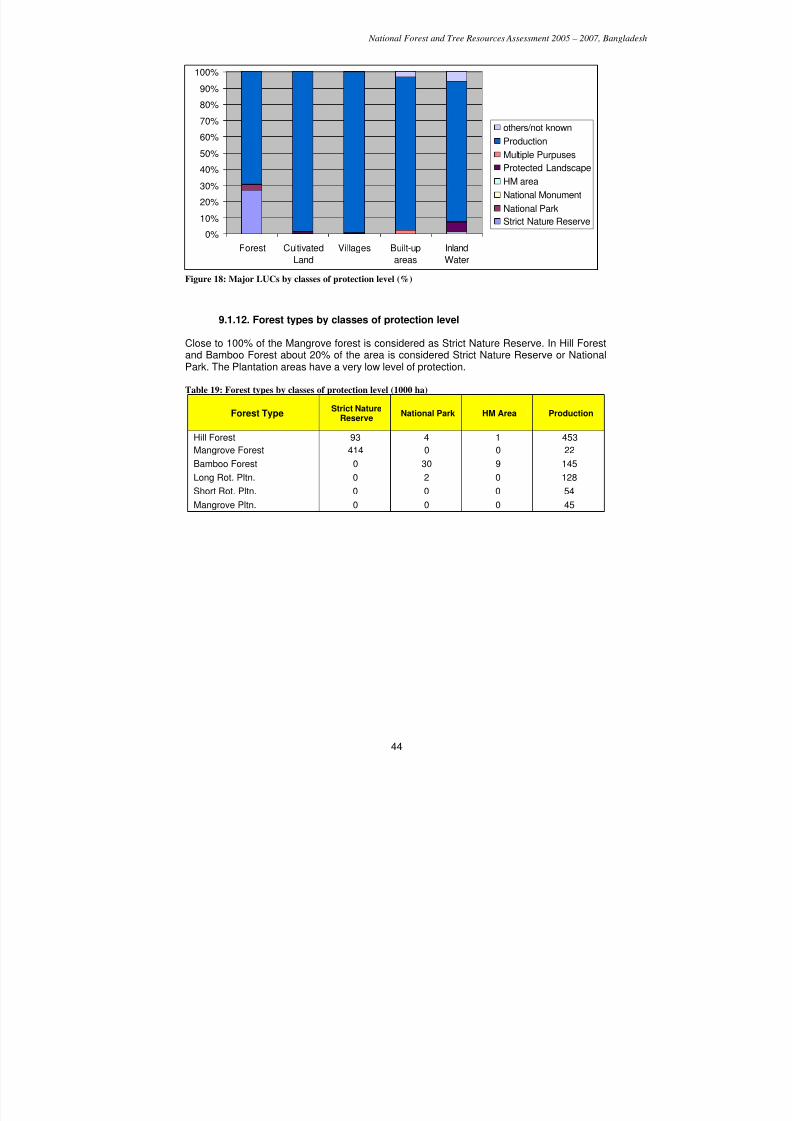
7/23/2019 NFA Final Report (1) (1)
http://slidepdf.com/reader/full/nfa-final-report-1-1 44/118
National Forest and Tree Resources Assessment 2005 – 2007, Bangladesh
44
0%
10%
20%
30%
40%
50%60%
70%
80%
90%
100%
Forest Cultivated
Land
Villages Built-up
areas
Inland
Water
others/not known
Production
Multiple Purpuses
Protected Landscape
HM area
National Monument
National Park
Strict Nature Reserve
Figure 18: Major LUCs by classes of protection level (%)
9.1.12. Forest types by classes of protection level
Close to 100% of the Mangrove forest is considered as Strict Nature Reserve. In Hill Forestand Bamboo Forest about 20% of the area is considered Strict Nature Reserve or NationalPark. The Plantation areas have a very low level of protection.
Table 19: Forest types by classes of protection level (1000 ha)
Forest Type
Strict Nature
Reserve National Park HM Area Production
Hill Forest 93 4 1 453
Mangrove Forest 414 0 0 22
Bamboo Forest 0 30 9 145
Long Rot. Pltn. 0 2 0 128
Short Rot. Pltn. 0 0 0 54
Mangrove Pltn. 0 0 0 45
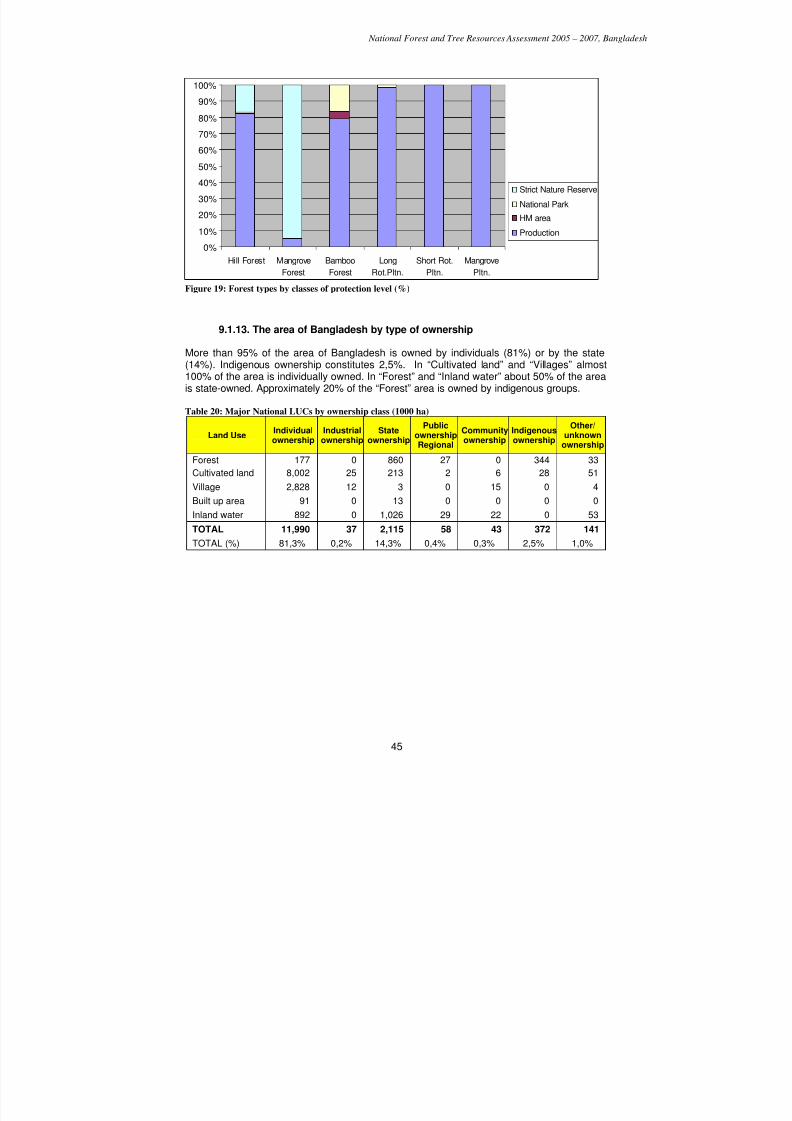
7/23/2019 NFA Final Report (1) (1)
http://slidepdf.com/reader/full/nfa-final-report-1-1 45/118
National Forest and Tree Resources Assessment 2005 – 2007, Bangladesh
45
0%
10%
20%
30%
40%
50%
60%70%
80%
90%
100%
Hill Forest Mangrove
Forest
Bamboo
Forest
Long
Rot.Pltn.
Short Rot.
Pltn.
Mangrove
Pltn.
Strict Nature Reserve
National Park
HM area
Production
Figure 19: Forest types by classes of protection level (%)
9.1.13. The area of Bangladesh by type of ownership
More than 95% of the area of Bangladesh is owned by individuals (81%) or by the state(14%). Indigenous ownership constitutes 2,5%. In “Cultivated land” and “Villages” almost100% of the area is individually owned. In “Forest” and “Inland water” about 50% of the areais state-owned. Approximately 20% of the “Forest” area is owned by indigenous groups.
Table 20: Major National LUCs by ownership class (1000 ha)
Land UseIndividualownership
Industrialownership
Stateownership
PublicownershipRegional
Communityownership
Indigenousownership
Other/unknown
ownership
Forest 177 0 860 27 0 344 33
Cultivated land 8,002 25 213 2 6 28 51
Village 2,828 12 3 0 15 0 4
Built up area 91 0 13 0 0 0 0
Inland water 892 0 1,026 29 22 0 53
TOTAL 11,990 37 2,115 58 43 372 141
TOTAL (%) 81,3% 0,2% 14,3% 0,4% 0,3% 2,5% 1,0%
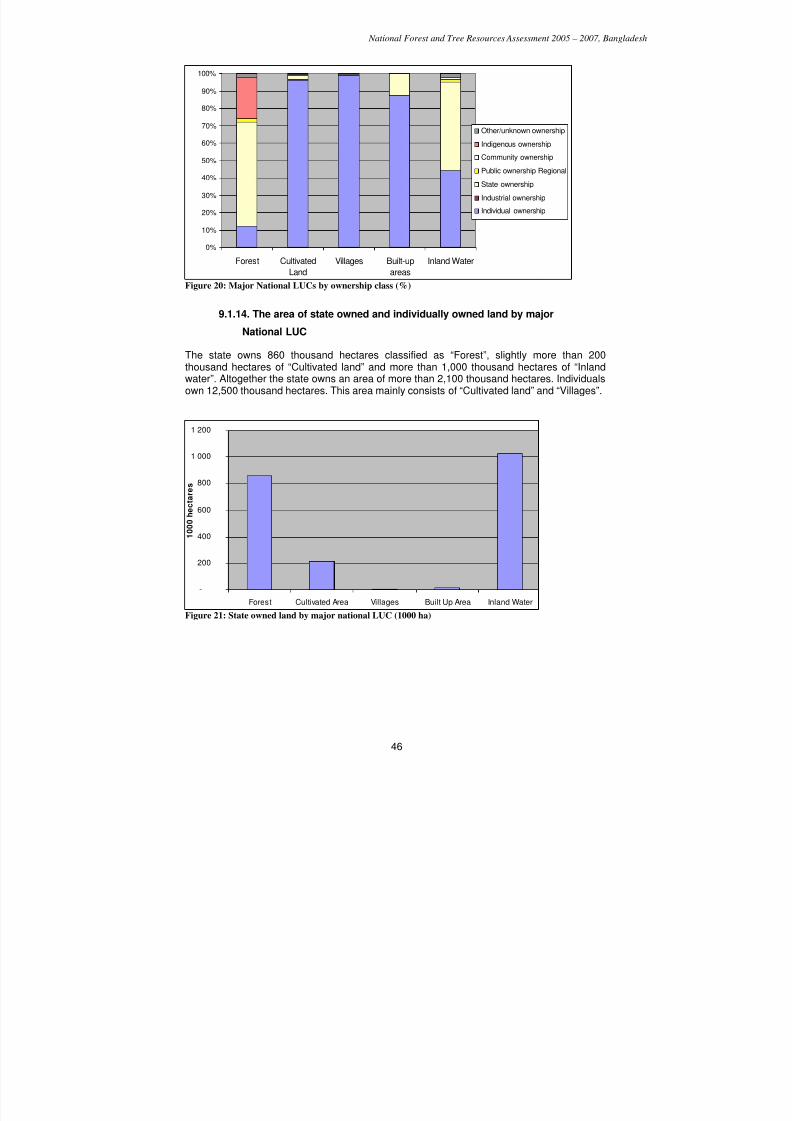
7/23/2019 NFA Final Report (1) (1)
http://slidepdf.com/reader/full/nfa-final-report-1-1 46/118
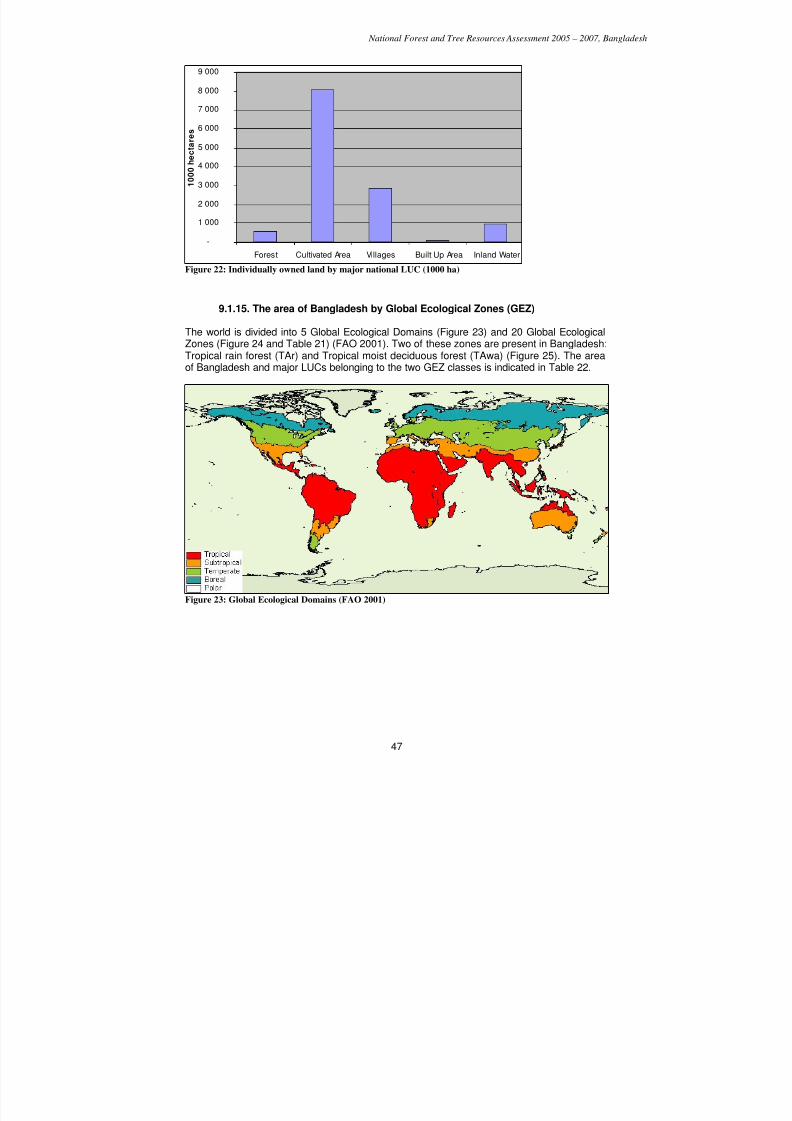
7/23/2019 NFA Final Report (1) (1)
http://slidepdf.com/reader/full/nfa-final-report-1-1 47/118
National Forest and Tree Resources Assessment 2005 – 2007, Bangladesh
47
-
1 000
2 000
3 000
4 000
5 000
6 000
7 000
8 000
9 000
Forest Cultivated Area Villages Built Up Area Inland Water
1 0 0 0 h e c t a r e
s
Figure 22: Individually owned land by major national LUC (1000 ha)
9.1.15. The area of Bangladesh by Global Ecological Zones (GEZ)
The world is divided into 5 Global Ecological Domains (Figure 23) and 20 Global EcologicalZones (Figure 24 and Table 21) (FAO 2001). Two of these zones are present in Bangladesh:Tropical rain forest (TAr) and Tropical moist deciduous forest (TAwa) (Figure 25). The areaof Bangladesh and major LUCs belonging to the two GEZ classes is indicated in Table 22.
Figure 23: Global Ecological Domains (FAO 2001)
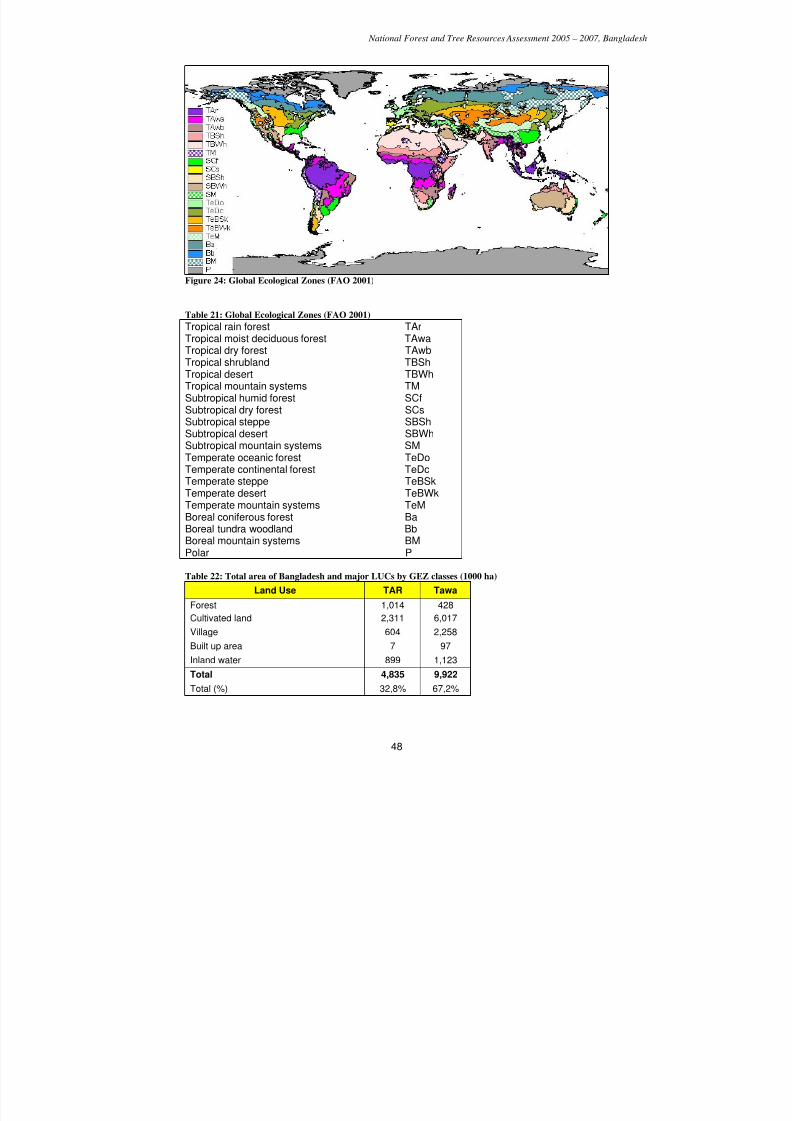
7/23/2019 NFA Final Report (1) (1)
http://slidepdf.com/reader/full/nfa-final-report-1-1 48/118
National Forest and Tree Resources Assessment 2005 – 2007, Bangladesh
48
Figure 24: Global Ecological Zones (FAO 2001)
Table 21: Global Ecological Zones (FAO 2001)
Tropical rain forest TArTropical moist deciduous forest TAwaTropical dry forest TAwbTropical shrubland TBShTropical desert TBWhTropical mountain systems TMSubtropical humid forest SCfSubtropical dry forest SCsSubtropical steppe SBShSubtropical desert SBWhSubtropical mountain systems SMTemperate oceanic forest TeDoTemperate continental forest TeDcTemperate steppe TeBSkTemperate desert TeBWkTemperate mountain systems TeMBoreal coniferous forest BaBoreal tundra woodland BbBoreal mountain systems BM
Polar P
Table 22: Total area of Bangladesh and major LUCs by GEZ classes (1000 ha)
Land Use TAR Tawa
Forest 1,014 428
Cultivated land 2,311 6,017
Village 604 2,258
Built up area 7 97
Inland water 899 1,123
Total 4,835 9,922
Total (%) 32,8% 67,2%
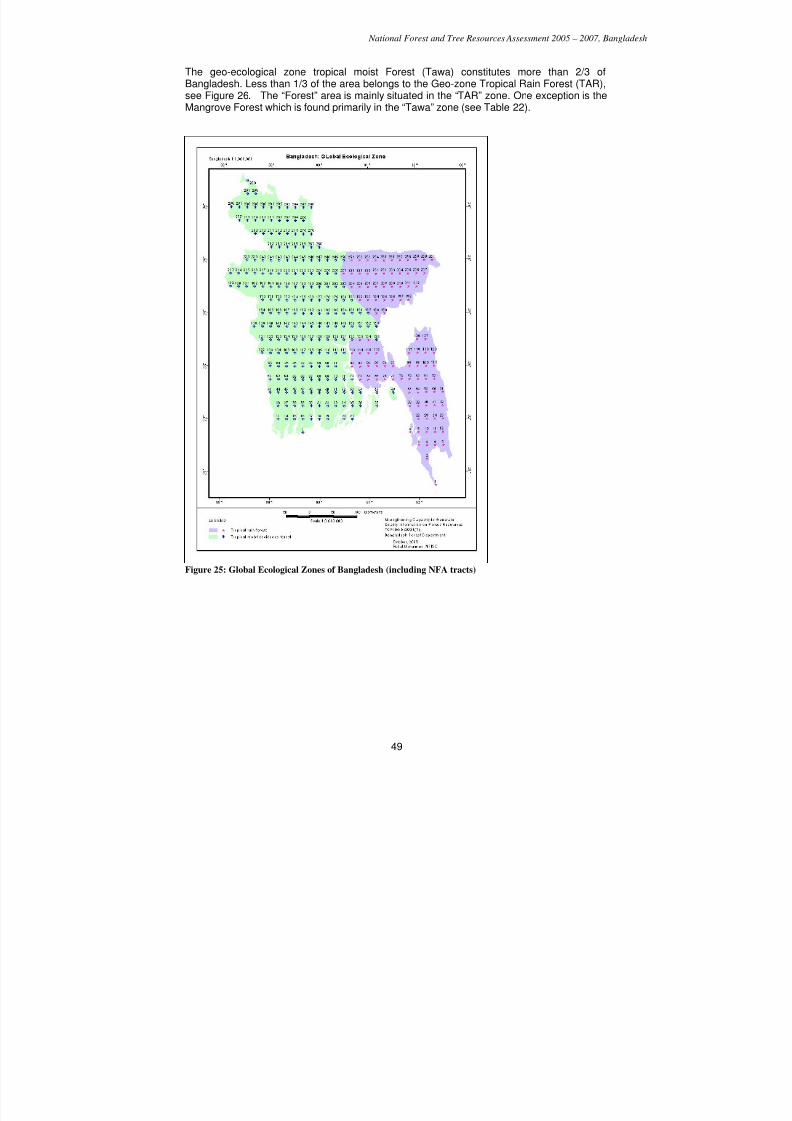
7/23/2019 NFA Final Report (1) (1)
http://slidepdf.com/reader/full/nfa-final-report-1-1 49/118
National Forest and Tree Resources Assessment 2005 – 2007, Bangladesh
49
The geo-ecological zone tropical moist Forest (Tawa) constitutes more than 2/3 ofBangladesh. Less than 1/3 of the area belongs to the Geo-zone Tropical Rain Forest (TAR),see Figure 26. The “Forest” area is mainly situated in the “TAR” zone. One exception is theMangrove Forest which is found primarily in the “Tawa” zone (see Table 22).
Figure 25: Global Ecological Zones of Bangladesh (including NFA tracts)
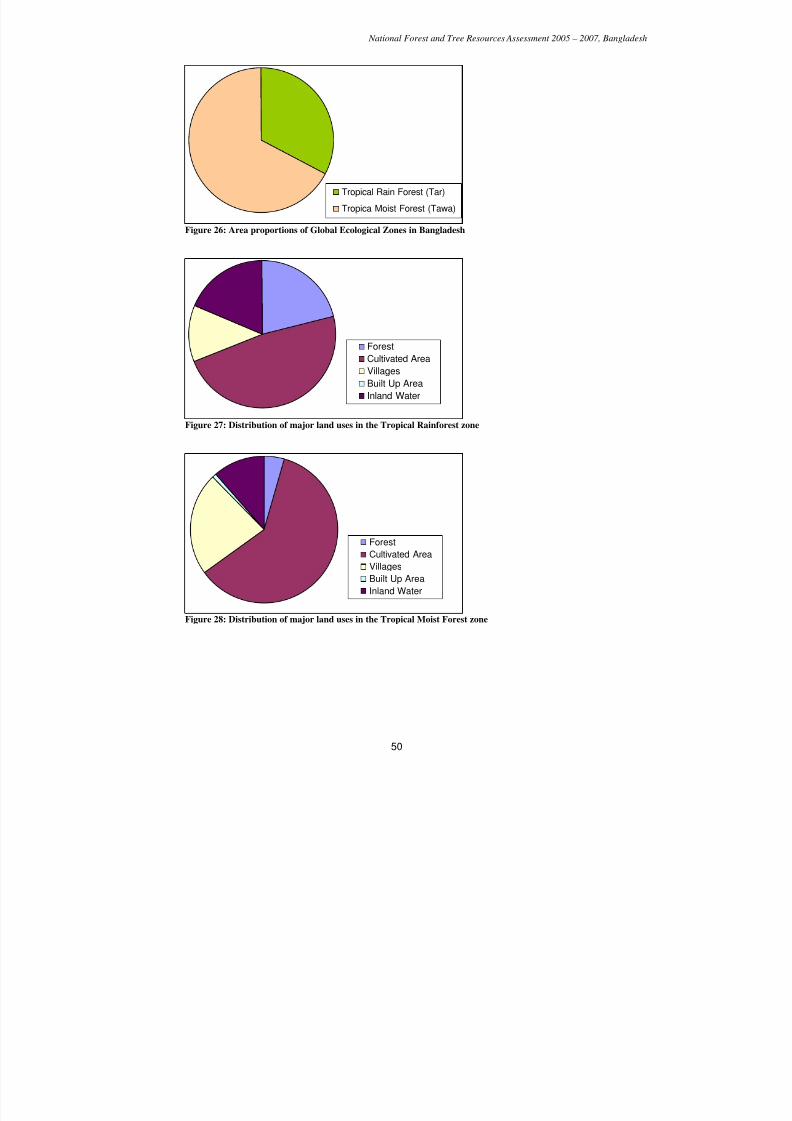
7/23/2019 NFA Final Report (1) (1)
http://slidepdf.com/reader/full/nfa-final-report-1-1 50/118
National Forest and Tree Resources Assessment 2005 – 2007, Bangladesh
50
Tropical Rain Forest (Tar)
Tropica Moist Forest (Tawa)
Figure 26: Area proportions of Global Ecological Zones in Bangladesh
Forest
Cultivated Area
Villages
Built Up Area
Inland Water
Figure 27: Distribution of major land uses in the Tropical Rainforest zone
Forest
Cultivated AreaVillages
Built Up Area
Inland Water
Figure 28: Distribution of major land uses in the Tropical Moist Forest zone
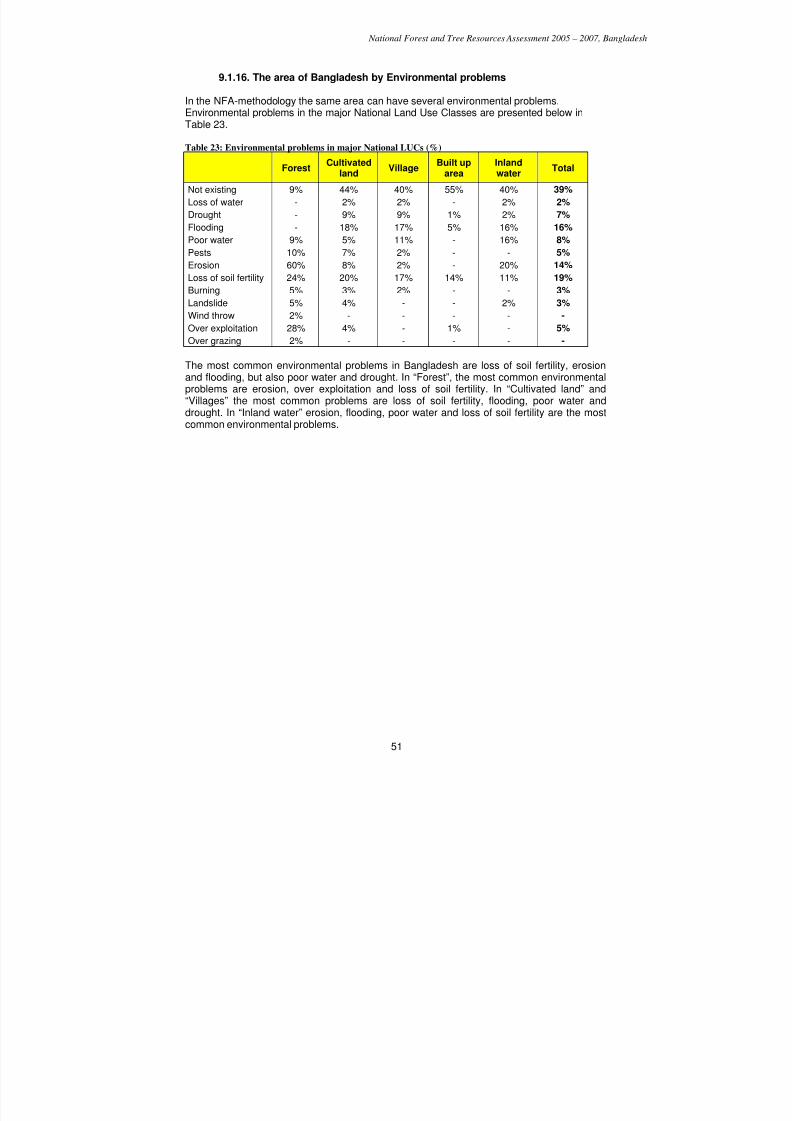
7/23/2019 NFA Final Report (1) (1)
http://slidepdf.com/reader/full/nfa-final-report-1-1 51/118
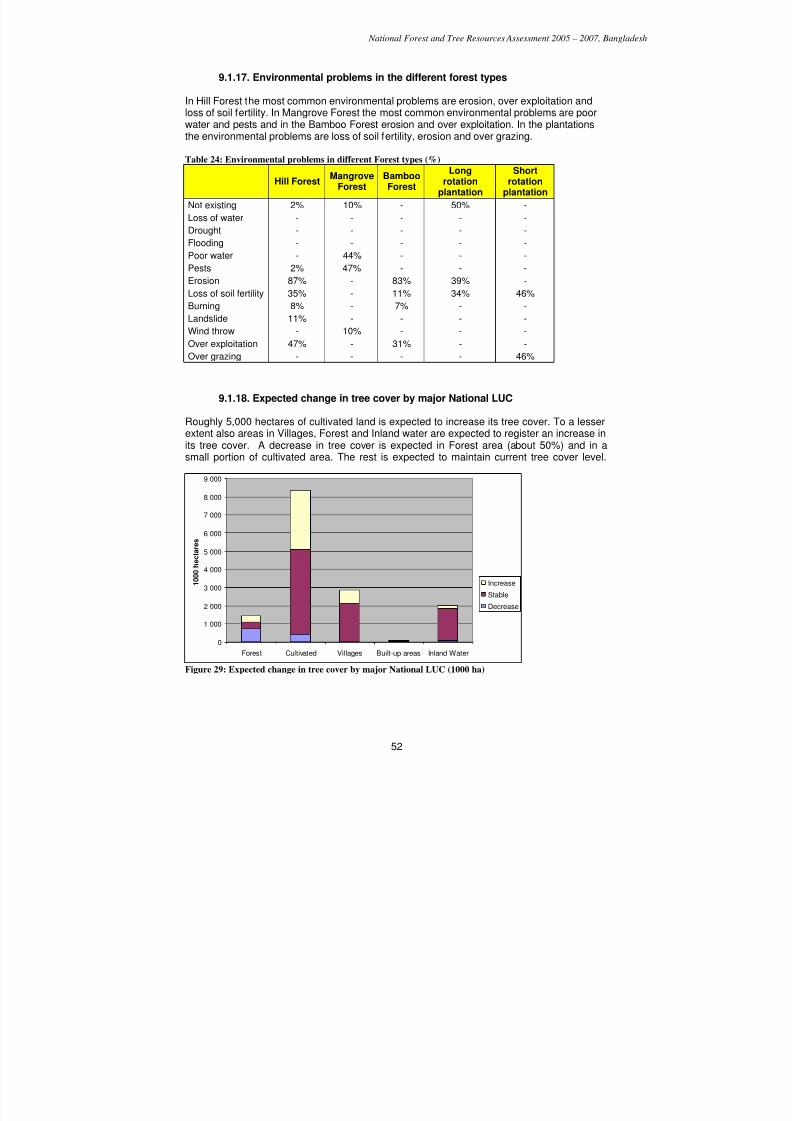
7/23/2019 NFA Final Report (1) (1)
http://slidepdf.com/reader/full/nfa-final-report-1-1 52/118
National Forest and Tree Resources Assessment 2005 – 2007, Bangladesh
52
9.1.17. Environmental problems in the different forest types
In Hill Forest the most common environmental problems are erosion, over exploitation andloss of soil fertility. In Mangrove Forest the most common environmental problems are poorwater and pests and in the Bamboo Forest erosion and over exploitation. In the plantations
the environmental problems are loss of soil fertility, erosion and over grazing.
Table 24: Environmental problems in different Forest types (%)
Hill ForestMangrove
ForestBambooForest
Longrotation
plantation
Shortrotation
plantation
Not existing 2% 10% - 50% -
Loss of water - - - - -
Drought - - - - -
Flooding - - - - -
Poor water - 44% - - -
Pests 2% 47% - - -
Erosion 87% - 83% 39% -
Loss of soil fertility 35% - 11% 34% 46%
Burning 8% - 7% - -
Landslide 11% - - - -
Wind throw - 10% - - -
Over exploitation 47% - 31% - -
Over grazing - - - - 46%
9.1.18. Expected change in tree cover by major National LUC
Roughly 5,000 hectares of cultivated land is expected to increase its tree cover. To a lesserextent also areas in Villages, Forest and Inland water are expected to register an increase inits tree cover. A decrease in tree cover is expected in Forest area (about 50%) and in asmall portion of cultivated area. The rest is expected to maintain current tree cover level.
0
1 000
2 000
3 000
4 000
5 000
6 000
7 000
8 000
9 000
Forest Cultivated Villages Built-up areas Inland Water
1 0 0 0 h e c t a r e s
Increase
Stable
Decrease
Figure 29: Expected change in tree cover by major National LUC (1000 ha)
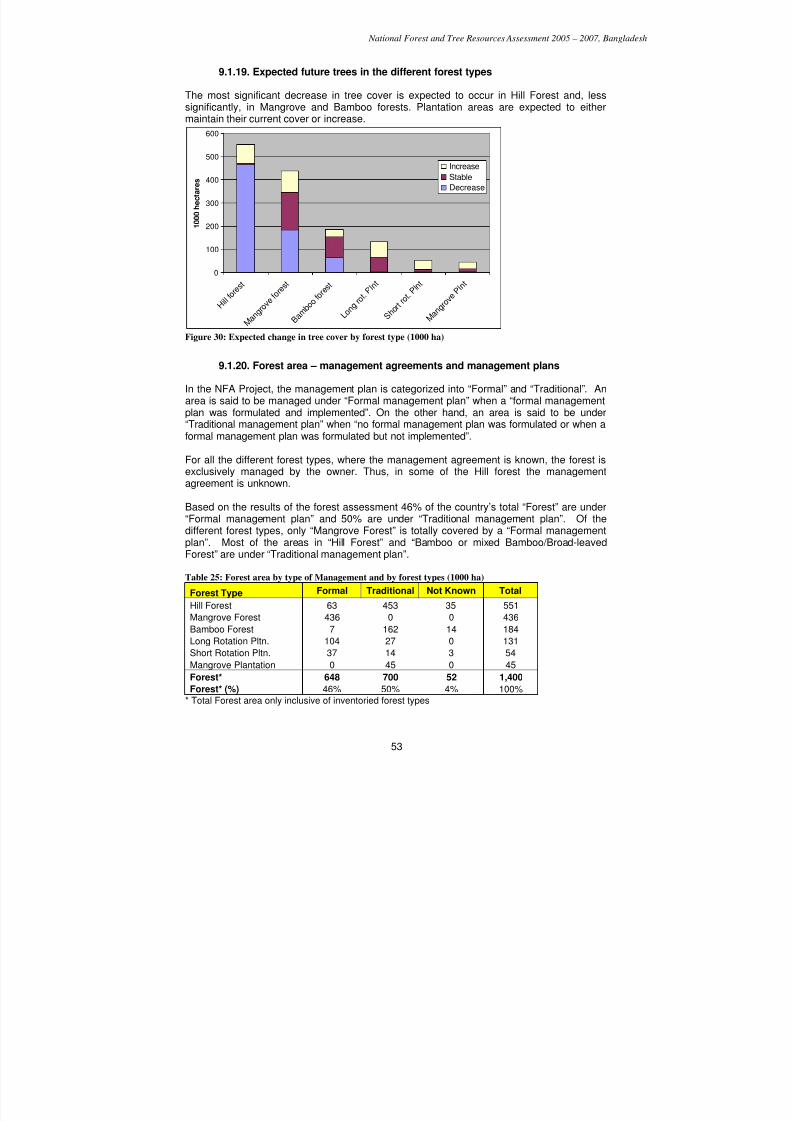
7/23/2019 NFA Final Report (1) (1)
http://slidepdf.com/reader/full/nfa-final-report-1-1 53/118
National Forest and Tree Resources Assessment 2005 – 2007, Bangladesh
53
9.1.19. Expected future trees in the different forest types
The most significant decrease in tree cover is expected to occur in Hill Forest and, lesssignificantly, in Mangrove and Bamboo forests. Plantation areas are expected to eithermaintain their current cover or increase.
0
100
200
300
400
500
600
H i l l f o r e
s t
M a n g r o v e f o r e
s t
B a m b o o
f o r e s t
L o n g
r o t . P
l n t
S h o r t
r o t . P
l n t
M a n g r o v e P l n t
1 0 0 0 h e c t a r e s
Increase
Stable
Decrease
Figure 30: Expected change in tree cover by forest type (1000 ha)
9.1.20. Forest area – management agreements and management plans
In the NFA Project, the management plan is categorized into “Formal” and “Traditional”. Anarea is said to be managed under “Formal management plan” when a “formal management
plan was formulated and implemented”. On the other hand, an area is said to be under“Traditional management plan” when “no formal management plan was formulated or when aformal management plan was formulated but not implemented”.
For all the different forest types, where the management agreement is known, the forest isexclusively managed by the owner. Thus, in some of the Hill forest the managementagreement is unknown.
Based on the results of the forest assessment 46% of the country’s total “Forest” are under“Formal management plan” and 50% are under “Traditional management plan”. Of thedifferent forest types, only “Mangrove Forest” is totally covered by a “Formal managementplan”. Most of the areas in “Hill Forest” and “Bamboo or mixed Bamboo/Broad-leaved
Forest” are under “Traditional management plan”.
Table 25: Forest area by type of Management and by forest types (1000 ha)
Forest Type Formal Traditional Not Known Total
Hill Forest 63 453 35 551
Mangrove Forest 436 0 0 436
Bamboo Forest 7 162 14 184
Long Rotation Pltn. 104 27 0 131
Short Rotation Pltn. 37 14 3 54
Mangrove Plantation 0 45 0 45
Forest* 648 700 52 1,400
Forest* (%) 46% 50% 4% 100%* Total Forest area only inclusive of inventoried forest types
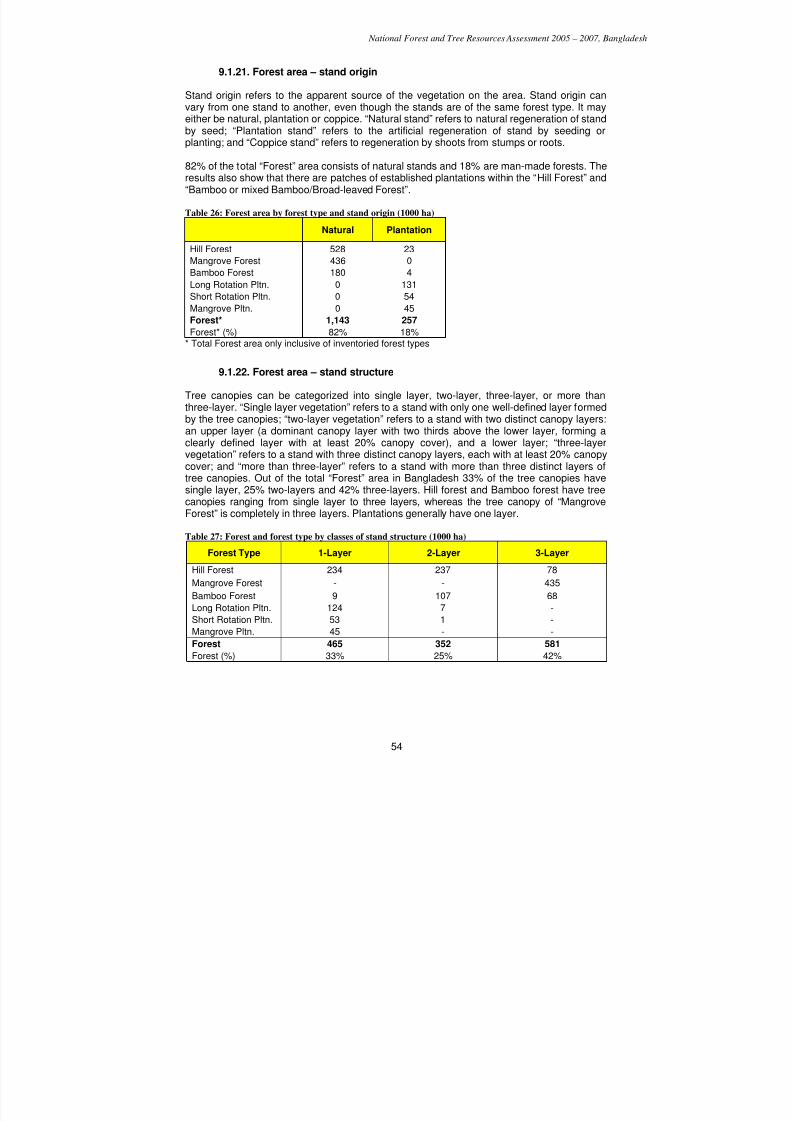
7/23/2019 NFA Final Report (1) (1)
http://slidepdf.com/reader/full/nfa-final-report-1-1 54/118
National Forest and Tree Resources Assessment 2005 – 2007, Bangladesh
54
9.1.21. Forest area – stand origin
Stand origin refers to the apparent source of the vegetation on the area. Stand origin canvary from one stand to another, even though the stands are of the same forest type. It mayeither be natural, plantation or coppice. “Natural stand” refers to natural regeneration of standby seed; “Plantation stand” refers to the artificial regeneration of stand by seeding orplanting; and “Coppice stand” refers to regeneration by shoots from stumps or roots.
82% of the total “Forest” area consists of natural stands and 18% are man-made forests. Theresults also show that there are patches of established plantations within the “Hill Forest” and“Bamboo or mixed Bamboo/Broad-leaved Forest”.
Table 26: Forest area by forest type and stand origin (1000 ha)
Natural Plantation
Hill Forest 528 23
Mangrove Forest 436 0
Bamboo Forest 180 4Long Rotation Pltn. 0 131
Short Rotation Pltn. 0 54
Mangrove Pltn. 0 45
Forest* 1,143 257
Forest* (%) 82% 18%* Total Forest area only inclusive of inventoried forest types
9.1.22. Forest area – stand structure
Tree canopies can be categorized into single layer, two-layer, three-layer, or more thanthree-layer. “Single layer vegetation” refers to a stand with only one well-defined layer formed
by the tree canopies; “two-layer vegetation” refers to a stand with two distinct canopy layers:an upper layer (a dominant canopy layer with two thirds above the lower layer, forming aclearly defined layer with at least 20% canopy cover), and a lower layer; “three-layervegetation” refers to a stand with three distinct canopy layers, each with at least 20% canopycover; and “more than three-layer” refers to a stand with more than three distinct layers oftree canopies. Out of the total “Forest” area in Bangladesh 33% of the tree canopies havesingle layer, 25% two-layers and 42% three-layers. Hill forest and Bamboo forest have treecanopies ranging from single layer to three layers, whereas the tree canopy of “MangroveForest” is completely in three layers. Plantations generally have one layer.
Table 27: Forest and forest type by classes of stand structure (1000 ha)
Forest Type 1-Layer 2-Layer 3-Layer
Hill Forest 234 237 78
Mangrove Forest - - 435
Bamboo Forest 9 107 68
Long Rotation Pltn. 124 7 -
Short Rotation Pltn. 53 1 -
Mangrove Pltn. 45 - -
Forest 465 352 581
Forest (%) 33% 25% 42%
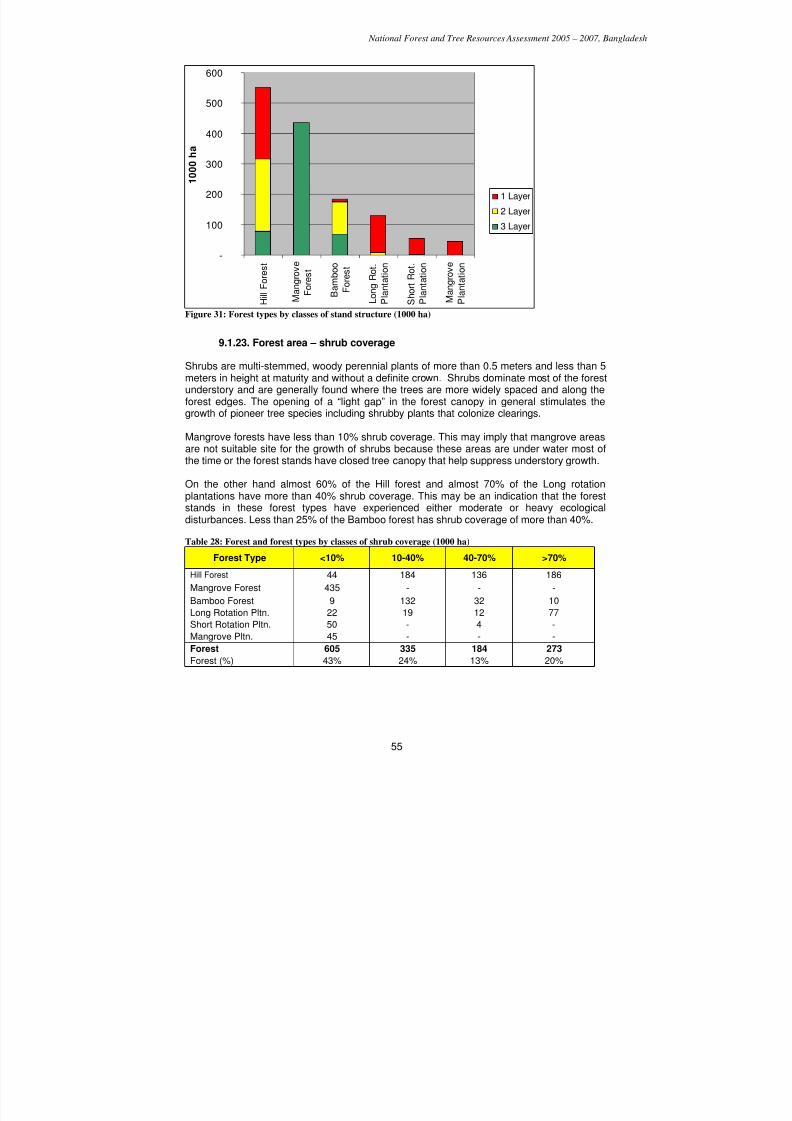
7/23/2019 NFA Final Report (1) (1)
http://slidepdf.com/reader/full/nfa-final-report-1-1 55/118
National Forest and Tree Resources Assessment 2005 – 2007, Bangladesh
55
-
100
200
300
400
500
600
H i l l F o r e s t
M a n g r o v e
F o r e s t
B a m b
o o
F o r e
s t
L o n g R
o t .
P l a n t a t
i o n
S h o r t R
o t .
P l a n t a t
i o n
M a n g r o v e
P l a n t a t
i o n
1 0 0 0 h a
1 Layer
2 Layer
3 Layer
Figure 31: Forest types by classes of stand structure (1000 ha)
9.1.23. Forest area – shrub coverage
Shrubs are multi-stemmed, woody perennial plants of more than 0.5 meters and less than 5meters in height at maturity and without a definite crown. Shrubs dominate most of the forestunderstory and are generally found where the trees are more widely spaced and along theforest edges. The opening of a “light gap” in the forest canopy in general stimulates the
growth of pioneer tree species including shrubby plants that colonize clearings.
Mangrove forests have less than 10% shrub coverage. This may imply that mangrove areasare not suitable site for the growth of shrubs because these areas are under water most ofthe time or the forest stands have closed tree canopy that help suppress understory growth.
On the other hand almost 60% of the Hill forest and almost 70% of the Long rotationplantations have more than 40% shrub coverage. This may be an indication that the foreststands in these forest types have experienced either moderate or heavy ecologicaldisturbances. Less than 25% of the Bamboo forest has shrub coverage of more than 40%.
Table 28: Forest and forest types by classes of shrub coverage (1000 ha)
Forest Type <10% 10-40% 40-70% >70%
Hill Forest 44 184 136 186
Mangrove Forest 435 - - -
Bamboo Forest 9 132 32 10
Long Rotation Pltn. 22 19 12 77
Short Rotation Pltn. 50 - 4 -
Mangrove Pltn. 45 - - -
Forest 605 335 184 273
Forest (%) 43% 24% 13% 20%
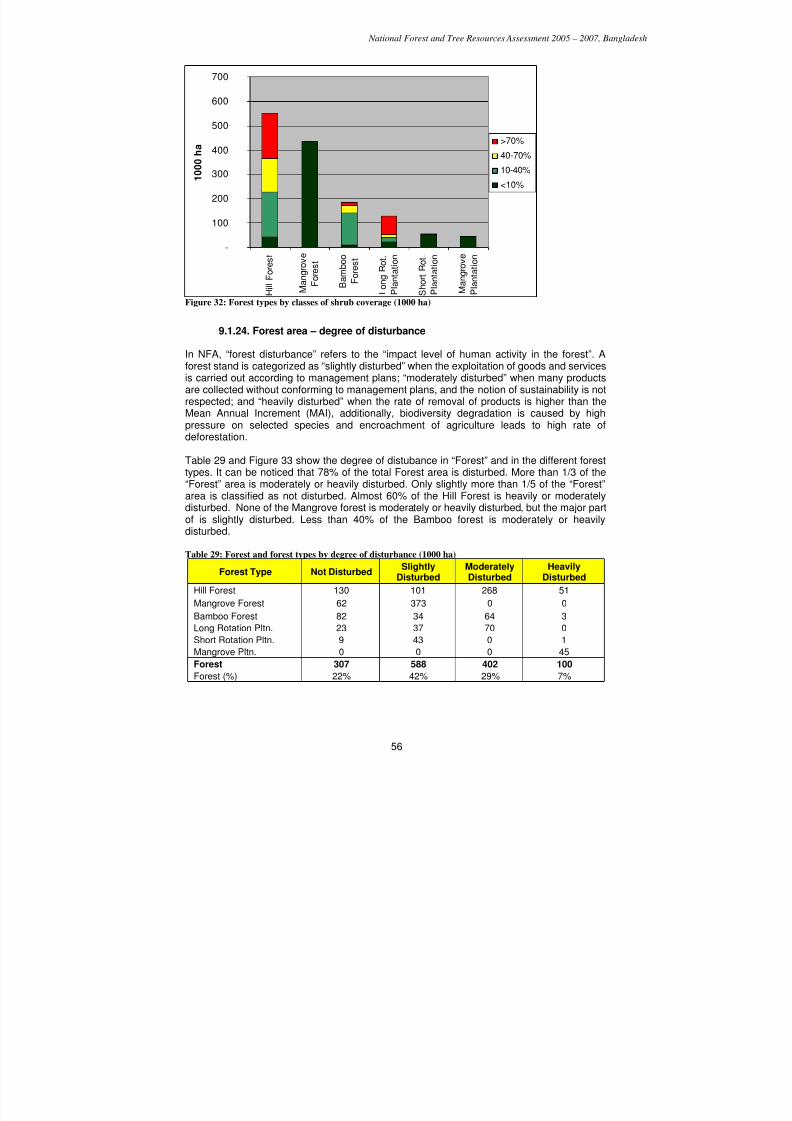
7/23/2019 NFA Final Report (1) (1)
http://slidepdf.com/reader/full/nfa-final-report-1-1 56/118
National Forest and Tree Resources Assessment 2005 – 2007, Bangladesh
56
-
100
200
300
400
500
600
700
H i l l F
o r e s t
M a n g r o v e
F o r e s t
B a m b o o
F o
r e s t
L o n g
R o t .
P l a n t a t i o n
S h o r t R o t .
P l a n t a t i o n
M a n g r o v e
P l a n t a t i o n
1 0 0 0 h a >70%
40-70%
10-40%
<10%
Figure 32: Forest types by classes of shrub coverage (1000 ha)
9.1.24. Forest area – degree of disturbance
In NFA, “forest disturbance” refers to the “impact level of human activity in the forest”. Aforest stand is categorized as “slightly disturbed” when the exploitation of goods and servicesis carried out according to management plans; “moderately disturbed” when many productsare collected without conforming to management plans, and the notion of sustainability is notrespected; and “heavily disturbed” when the rate of removal of products is higher than the
Mean Annual Increment (MAI), additionally, biodiversity degradation is caused by highpressure on selected species and encroachment of agriculture leads to high rate ofdeforestation.
Table 29 and Figure 33 show the degree of distubance in “Forest” and in the different foresttypes. It can be noticed that 78% of the total Forest area is disturbed. More than 1/3 of the“Forest” area is moderately or heavily disturbed. Only slightly more than 1/5 of the “Forest”area is classified as not disturbed. Almost 60% of the Hill Forest is heavily or moderatelydisturbed. None of the Mangrove forest is moderately or heavily disturbed, but the major partof is slightly disturbed. Less than 40% of the Bamboo forest is moderately or heavilydisturbed.
Table 29: Forest and forest types by degree of disturbance (1000 ha)
Forest Type Not DisturbedSlightly
DisturbedModeratelyDisturbed
HeavilyDisturbed
Hill Forest 130 101 268 51
Mangrove Forest 62 373 0 0
Bamboo Forest 82 34 64 3
Long Rotation Pltn. 23 37 70 0
Short Rotation Pltn. 9 43 0 1
Mangrove Pltn. 0 0 0 45
Forest 307 588 402 100
Forest (%) 22% 42% 29% 7%
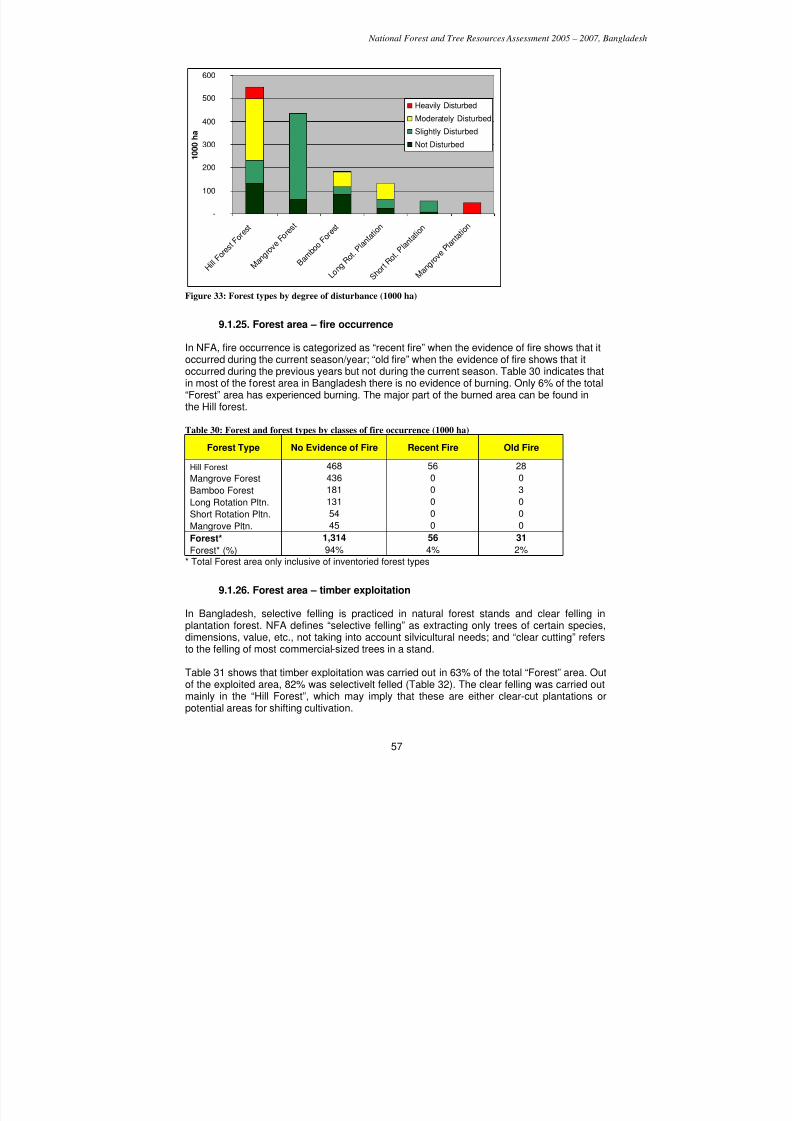
7/23/2019 NFA Final Report (1) (1)
http://slidepdf.com/reader/full/nfa-final-report-1-1 57/118
National Forest and Tree Resources Assessment 2005 – 2007, Bangladesh
57
-
100
200
300
400
500
600
H i l l F
o r e s t F o r e s t
M a n g r o v e F o r e s t
B a m b o o
F o r e s t
L o n g R
o t . P l a n t a t i o n
S h o r t R
o t . P l a n t a t i o n
M a n g r o
v e P l a n t a t i o n
1 0 0 0 h
a
Heavily Disturbed
Moderately Disturbed
Slightly Disturbed
Not Disturbed
Figure 33: Forest types by degree of disturbance (1000 ha)
9.1.25. Forest area – fire occurrence
In NFA, fire occurrence is categorized as “recent fire” when the evidence of fire shows that itoccurred during the current season/year; “old fire” when the evidence of fire shows that itoccurred during the previous years but not during the current season. Table 30 indicates thatin most of the forest area in Bangladesh there is no evidence of burning. Only 6% of the total“Forest” area has experienced burning. The major part of the burned area can be found inthe Hill forest.
Table 30: Forest and forest types by classes of fire occurrence (1000 ha)
Forest Type No Evidence of Fire Recent Fire Old Fire
Hill Forest 468 56 28
Mangrove Forest 436 0 0
Bamboo Forest 181 0 3
Long Rotation Pltn. 131 0 0
Short Rotation Pltn. 54 0 0
Mangrove Pltn. 45 0 0
Forest* 1,314 56 31
Forest* (%) 94% 4% 2%* Total Forest area only inclusive of inventoried forest types
9.1.26. Forest area – timber exploitation
In Bangladesh, selective felling is practiced in natural forest stands and clear felling inplantation forest. NFA defines “selective felling” as extracting only trees of certain species,dimensions, value, etc., not taking into account silvicultural needs; and “clear cutting” refersto the felling of most commercial-sized trees in a stand.
Table 31 shows that timber exploitation was carried out in 63% of the total “Forest” area. Outof the exploited area, 82% was selectivelt felled (Table 32). The clear felling was carried out
mainly in the “Hill Forest”, which may imply that these are either clear-cut plantations orpotential areas for shifting cultivation.
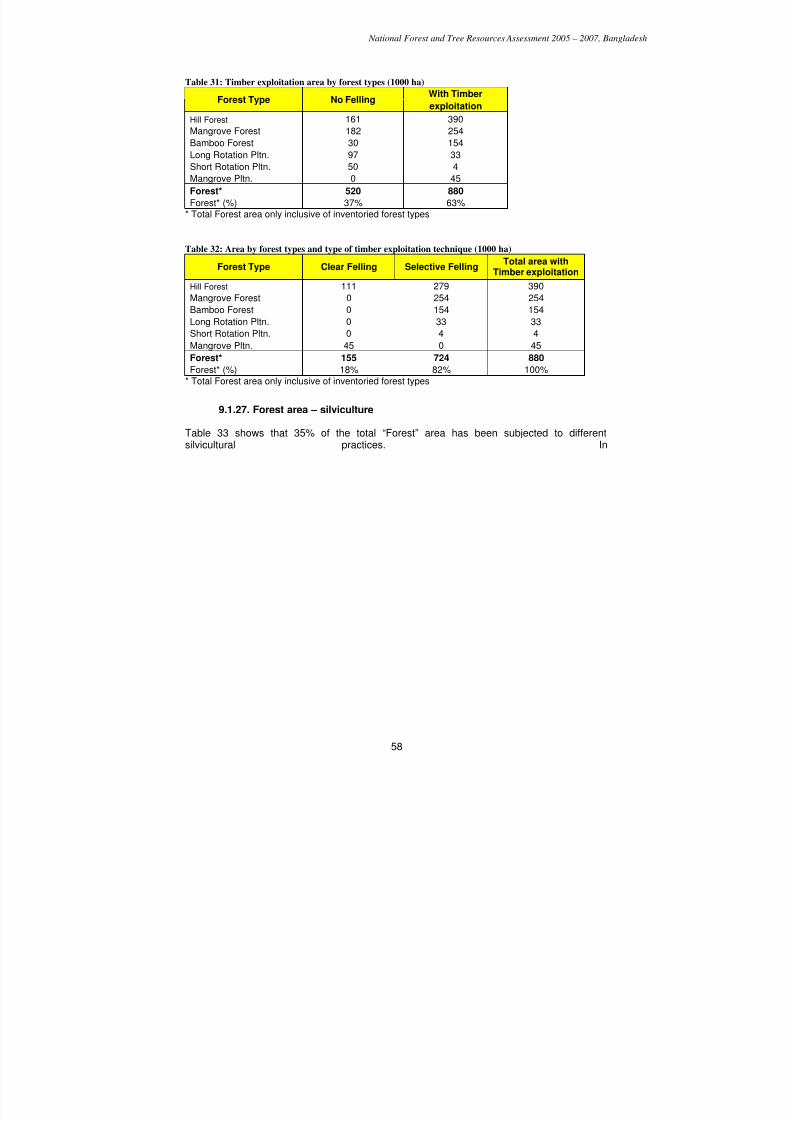
7/23/2019 NFA Final Report (1) (1)
http://slidepdf.com/reader/full/nfa-final-report-1-1 58/118
National Forest and Tree Resources Assessment 2005 – 2007, Bangladesh
58
Table 31: Timber exploitation area by forest types (1000 ha)
With TimberForest Type No Felling
exploitation
Hill Forest 161 390
Mangrove Forest 182 254
Bamboo Forest 30 154
Long Rotation Pltn. 97 33
Short Rotation Pltn. 50 4
Mangrove Pltn. 0 45
Forest* 520 880
Forest* (%) 37% 63%* Total Forest area only inclusive of inventoried forest types
Table 32: Area by forest types and type of timber exploitation technique (1000 ha)
Forest Type Clear Felling Selective FellingTotal area with
Timber exploitationHill Forest 111 279 390
Mangrove Forest 0 254 254
Bamboo Forest 0 154 154
Long Rotation Pltn. 0 33 33
Short Rotation Pltn. 0 4 4
Mangrove Pltn. 45 0 45
Forest* 155 724 880
Forest* (%) 18% 82% 100%* Total Forest area only inclusive of inventoried forest types
9.1.27. Forest area – silviculture
Table 33 shows that 35% of the total “Forest” area has been subjected to differentsilvicultural practices. In
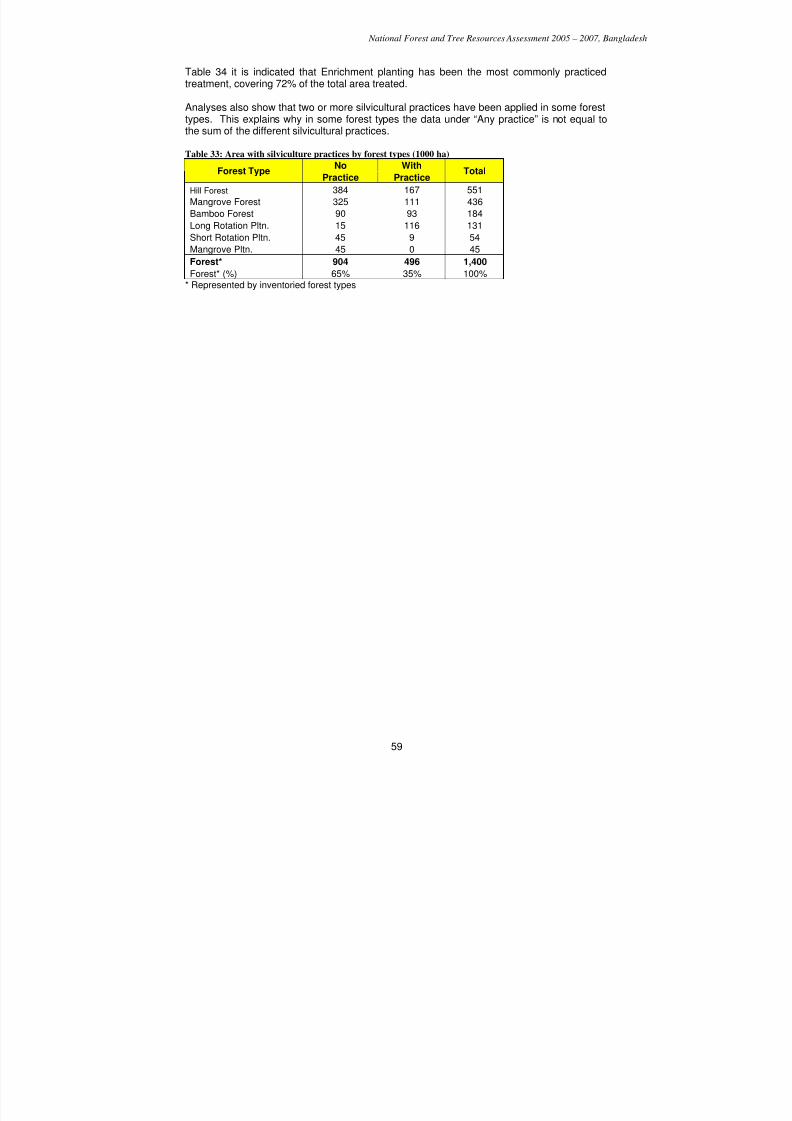
7/23/2019 NFA Final Report (1) (1)
http://slidepdf.com/reader/full/nfa-final-report-1-1 59/118
National Forest and Tree Resources Assessment 2005 – 2007, Bangladesh
59
Table 34 it is indicated that Enrichment planting has been the most commonly practicedtreatment, covering 72% of the total area treated.
Analyses also show that two or more silvicultural practices have been applied in some foresttypes. This explains why in some forest types the data under “Any practice” is not equal tothe sum of the different silvicultural practices.
Table 33: Area with silviculture practices by forest types (1000 ha)
No WithForest Type
Practice PracticeTotal
Hill Forest 384 167 551
Mangrove Forest 325 111 436
Bamboo Forest 90 93 184
Long Rotation Pltn. 15 116 131
Short Rotation Pltn. 45 9 54
Mangrove Pltn. 45 0 45
Forest* 904 496 1,400
Forest* (%) 65% 35% 100%* Represented by inventoried forest types
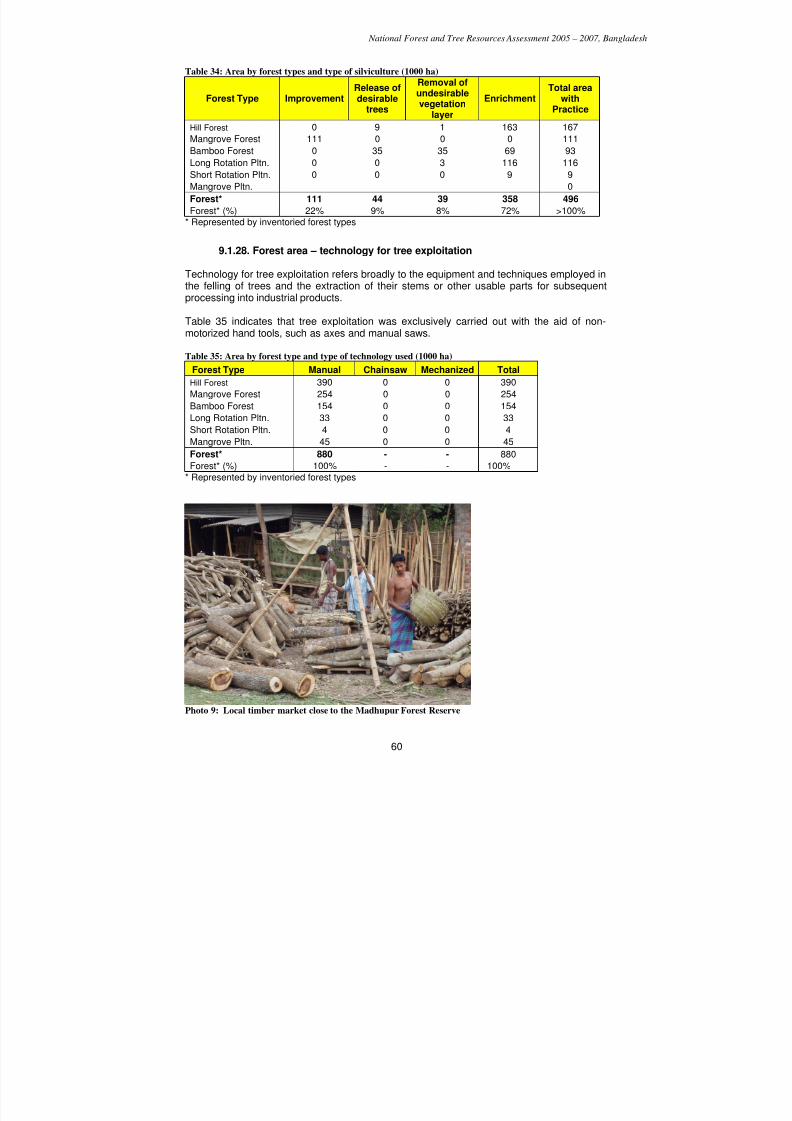
7/23/2019 NFA Final Report (1) (1)
http://slidepdf.com/reader/full/nfa-final-report-1-1 60/118
National Forest and Tree Resources Assessment 2005 – 2007, Bangladesh
60
Table 34: Area by forest types and type of silviculture (1000 ha)
Forest Type ImprovementRelease ofdesirable
trees
Removal ofundesirablevegetation
layer
EnrichmentTotal area
withPractice
Hill Forest 0 9 1 163 167
Mangrove Forest 111 0 0 0 111Bamboo Forest 0 35 35 69 93
Long Rotation Pltn. 0 0 3 116 116
Short Rotation Pltn. 0 0 0 9 9
Mangrove Pltn. 0
Forest* 111 44 39 358 496
Forest* (%) 22% 9% 8% 72% >100%* Represented by inventoried forest types
9.1.28. Forest area – technology for tree exploitation
Technology for tree exploitation refers broadly to the equipment and techniques employed inthe felling of trees and the extraction of their stems or other usable parts for subsequentprocessing into industrial products.
Table 35 indicates that tree exploitation was exclusively carried out with the aid of non-motorized hand tools, such as axes and manual saws.
Table 35: Area by forest type and type of technology used (1000 ha)
Forest Type Manual Chainsaw Mechanized Total
Hill Forest 390 0 0 390
Mangrove Forest 254 0 0 254
Bamboo Forest 154 0 0 154
Long Rotation Pltn. 33 0 0 33Short Rotation Pltn. 4 0 0 4
Mangrove Pltn. 45 0 0 45
Forest* 880 - - 880
Forest* (%) 100% - - 100%* Represented by inventoried forest types
Photo 9: Local timber market close to the Madhupur Forest Reserve
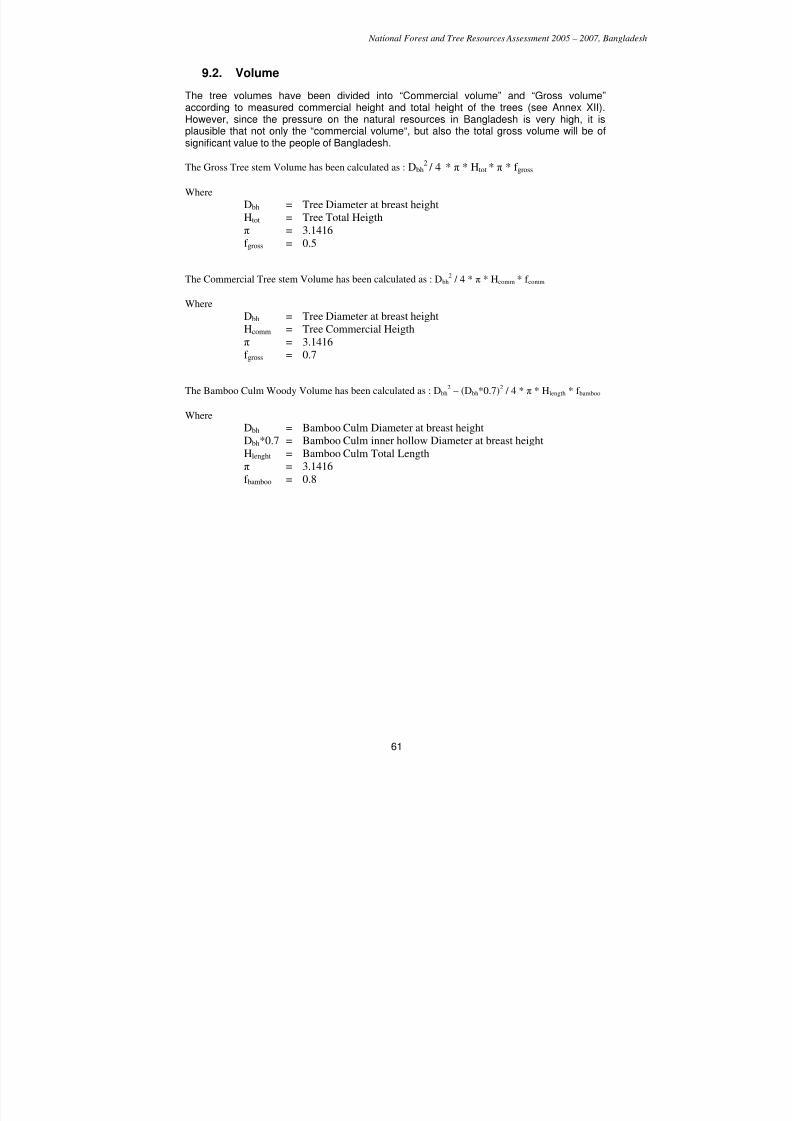
7/23/2019 NFA Final Report (1) (1)
http://slidepdf.com/reader/full/nfa-final-report-1-1 61/118
National Forest and Tree Resources Assessment 2005 – 2007, Bangladesh
61
9.2. Volume
The tree volumes have been divided into “Commercial volume” and “Gross volume”according to measured commercial height and total height of the trees (see Annex XII).However, since the pressure on the natural resources in Bangladesh is very high, it isplausible that not only the “commercial volume“, but also the total gross volume will be ofsignificant value to the people of Bangladesh.
The Gross Tree stem Volume has been calculated as : Dbh2 / 4 * π * Htot * π * f gross
Where
Dbh = Tree Diameter at breast height Htot = Tree Total Heigth
π = 3.1416
f gross = 0.5
The Commercial Tree stem Volume has been calculated as : Dbh2 / 4 * π * Hcomm * f comm
Where
Dbh = Tree Diameter at breast height Hcomm = Tree Commercial Heigth
π = 3.1416
f gross = 0.7
The Bamboo Culm Woody Volume has been calculated as : Dbh2 – (Dbh*0.7)
2 / 4 * π * Hlength * f bamboo
WhereDbh = Bamboo Culm Diameter at breast height
Dbh*0.7 = Bamboo Culm inner hollow Diameter at breast height
Hlenght = Bamboo Culm Total Length
π = 3.1416
f bamboo = 0.8
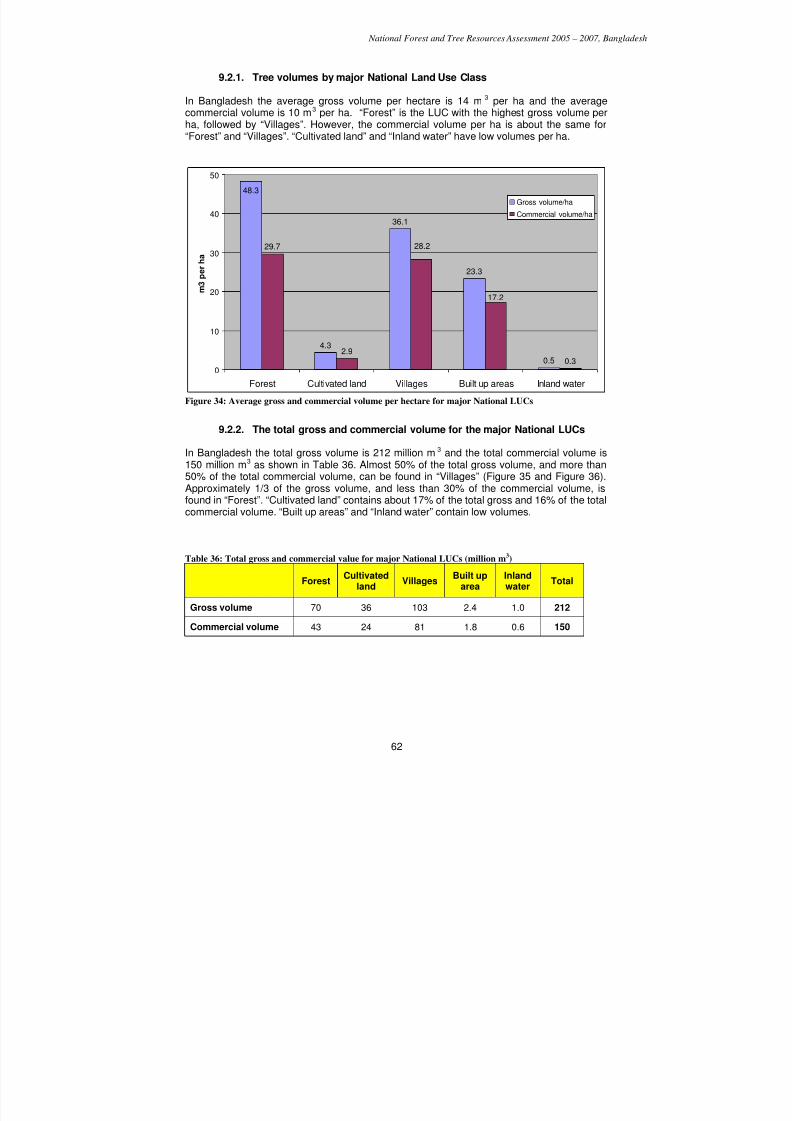
7/23/2019 NFA Final Report (1) (1)
http://slidepdf.com/reader/full/nfa-final-report-1-1 62/118
National Forest and Tree Resources Assessment 2005 – 2007, Bangladesh
62
9.2.1. Tree volumes by major National Land Use Class
In Bangladesh the average gross volume per hectare is 14 m 3 per ha and the averagecommercial volume is 10 m3 per ha. “Forest” is the LUC with the highest gross volume perha, followed by “Villages”. However, the commercial volume per ha is about the same for
“Forest” and “Villages”. “Cultivated land” and “Inland water” have low volumes per ha.
4.3
36.1
23.3
0.5
29.7
2.9
0.3
48.3
17.2
28.2
0
10
20
30
40
50
Forest Cultivated land Villages Built up areas Inland water
m 3 p
e r h a
Gross volume/ha
Commercial volume/ha
Figure 34: Average gross and commercial volume per hectare for major National LUCs
9.2.2. The total gross and commercial volume for the major National LUCs
In Bangladesh the total gross volume is 212 million m3 and the total commercial volume is150 million m3 as shown in Table 36. Almost 50% of the total gross volume, and more than50% of the total commercial volume, can be found in “Villages” (Figure 35 and Figure 36).Approximately 1/3 of the gross volume, and less than 30% of the commercial volume, isfound in “Forest”. “Cultivated land” contains about 17% of the total gross and 16% of the totalcommercial volume. “Built up areas” and “Inland water” contain low volumes.
Table 36: Total gross and commercial value for major National LUCs (million m3)
ForestCultivated
landVillages
Built uparea
Inlandwater
Total
Gross volume 70 36 103 2.4 1.0 212
Commercial volume 43 24 81 1.8 0.6 150
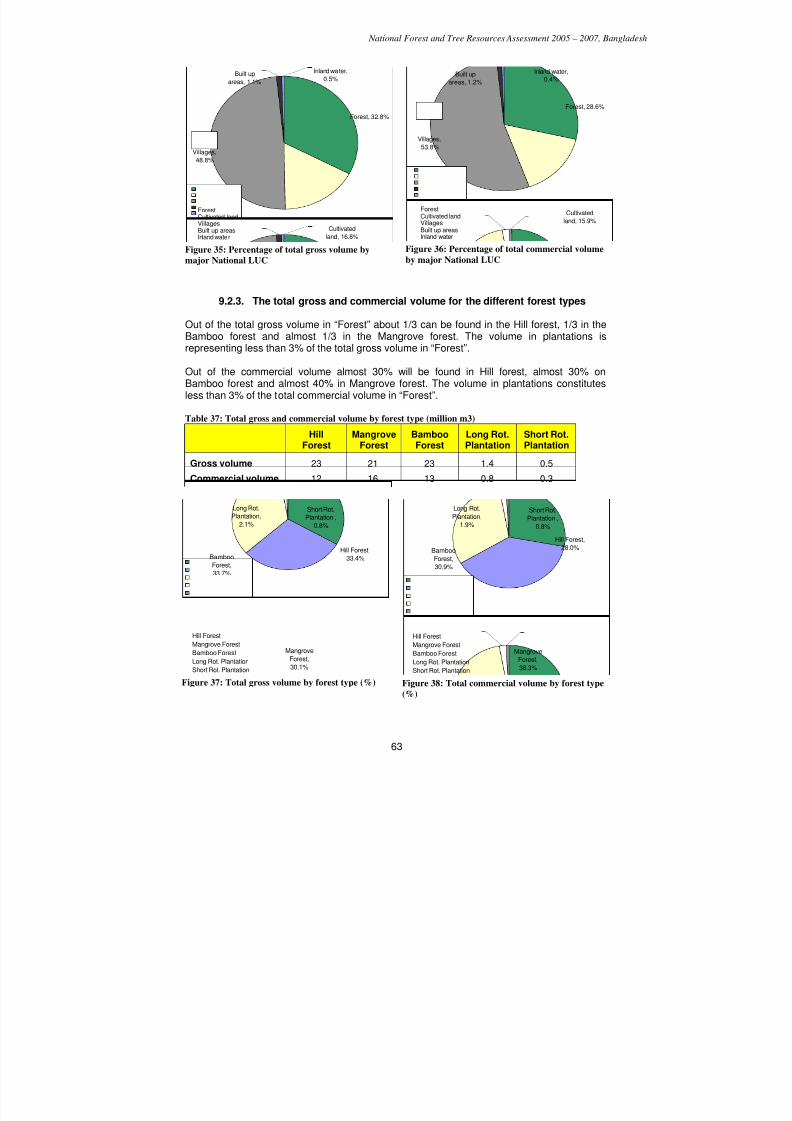
7/23/2019 NFA Final Report (1) (1)
http://slidepdf.com/reader/full/nfa-final-report-1-1 63/118
National Forest and Tree Resources Assessment 2005 – 2007, Bangladesh
63
Forest, 32.8%
Cultivated
land, 16.8%
Built up
areas, 1.1%
Inland water,
0.5%
Villages,
48.8%
ForestCultivated landVillagesBuilt up areasInland water
Figure 35: Percentage of total gross volume by
major National LUC
Forest, 28.6%
Cultivated
land, 15.9%
Villages,53.8%
Inland water,
0.4%Built up
areas, 1.2%
ForestCultivated landVillagesBuilt up areasInland water
Figure 36: Percentage of total commercial volume
by major National LUC
9.2.3. The total gross and commercial volume for the different forest types
Out of the total gross volume in “Forest” about 1/3 can be found in the Hill forest, 1/3 in theBamboo forest and almost 1/3 in the Mangrove forest. The volume in plantations isrepresenting less than 3% of the total gross volume in “Forest”.
Out of the commercial volume almost 30% will be found in Hill forest, almost 30% onBamboo forest and almost 40% in Mangrove forest. The volume in plantations constitutesless than 3% of the total commercial volume in “Forest”.
Table 37: Total gross and commercial volume by forest type (million m3)
HillForest
MangroveForest
BambooForest
Long Rot.Plantation
Short Rot.Plantation
Gross volume 23 21 23 1.4 0.5
Commercial volume 12 16 13 0.8 0.3
Hill Forest,33.4%
Mangrove
Forest,30.1%
BambooForest,33.7%
Short Rot.Plantation ,
0.8%
Long Rot.Plantation,
2.1%
Hill Forest
Mangrove Forest
Bamboo Forest
Long Rot. Plantation
Short Rot. Plantation
Figure 37: Total gross volume by forest type (%)
Hill Forest,28.0%
MangroveForest,
38.3%
Bamboo
Forest,30.9%
Long Rot.
Plantation,1.9%
Short Rot.Plantation ,
0.8%
Hill Forest
Mangrove Forest
Bamboo Forest
Long Rot. Plantation
Short Rot. Plantation
Figure 38: Total commercial volume by forest type
(%)
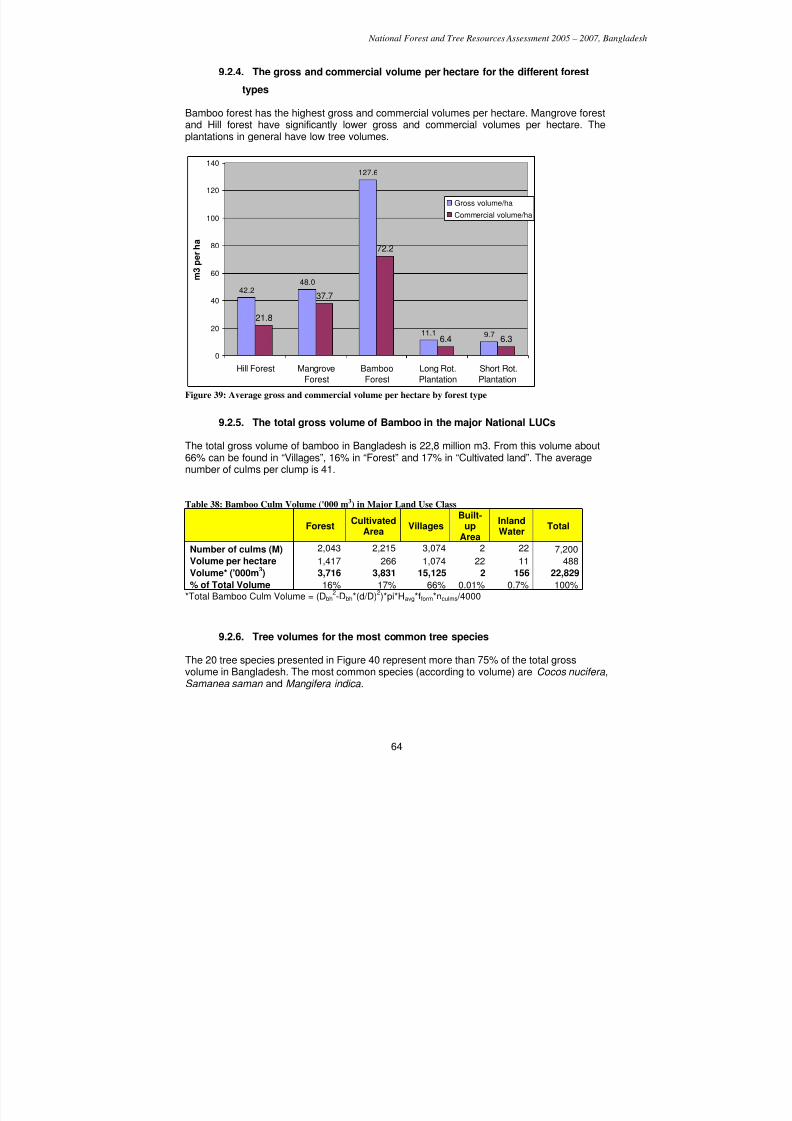
7/23/2019 NFA Final Report (1) (1)
http://slidepdf.com/reader/full/nfa-final-report-1-1 64/118
National Forest and Tree Resources Assessment 2005 – 2007, Bangladesh
64
9.2.4. The gross and commercial volume per hectare for the different forest
types
Bamboo forest has the highest gross and commercial volumes per hectare. Mangrove forestand Hill forest have significantly lower gross and commercial volumes per hectare. The
plantations in general have low tree volumes.
42.248.0
127.6
11.1 9.7
21.8
37.7
72.2
6.4 6.3
0
20
40
60
80
100
120
140
Hill Forest Mangrove
Forest
Bamboo
Forest
Long Rot.
Plantation
Short Rot.
Plantation
m
3 p e r h a
Gross volume/ha
Commercial volume/ha
Figure 39: Average gross and commercial volume per hectare by forest type
9.2.5. The total gross volume of Bamboo in the major National LUCs
The total gross volume of bamboo in Bangladesh is 22,8 million m3. From this volume about66% can be found in “Villages”, 16% in “Forest” and 17% in “Cultivated land”. The averagenumber of culms per clump is 41.
Table 38: Bamboo Culm Volume ('000 m3) in Major Land Use Class
ForestCultivated
AreaVillages
Built-up
Area
InlandWater
Total
Number of culms (M)2,043 2,215 3,074 2 22
7,200Volume per hectare 1,417 266 1,074 22 11 488
Volume* ('000m3) 3,716 3,831 15,125 2 156 22,829
% of Total Volume 16% 17% 66% 0.01% 0.7% 100%*Total Bamboo Culm Volume = (Dbh
2-Dbh*(d/D)
2)*pi*Havg*fform*nculms /4000
9.2.6. Tree volumes for the most common tree species
The 20 tree species presented in Figure 40 represent more than 75% of the total grossvolume in Bangladesh. The most common species (according to volume) are Cocos nucifera ,Samanea saman and Mangifera indica .
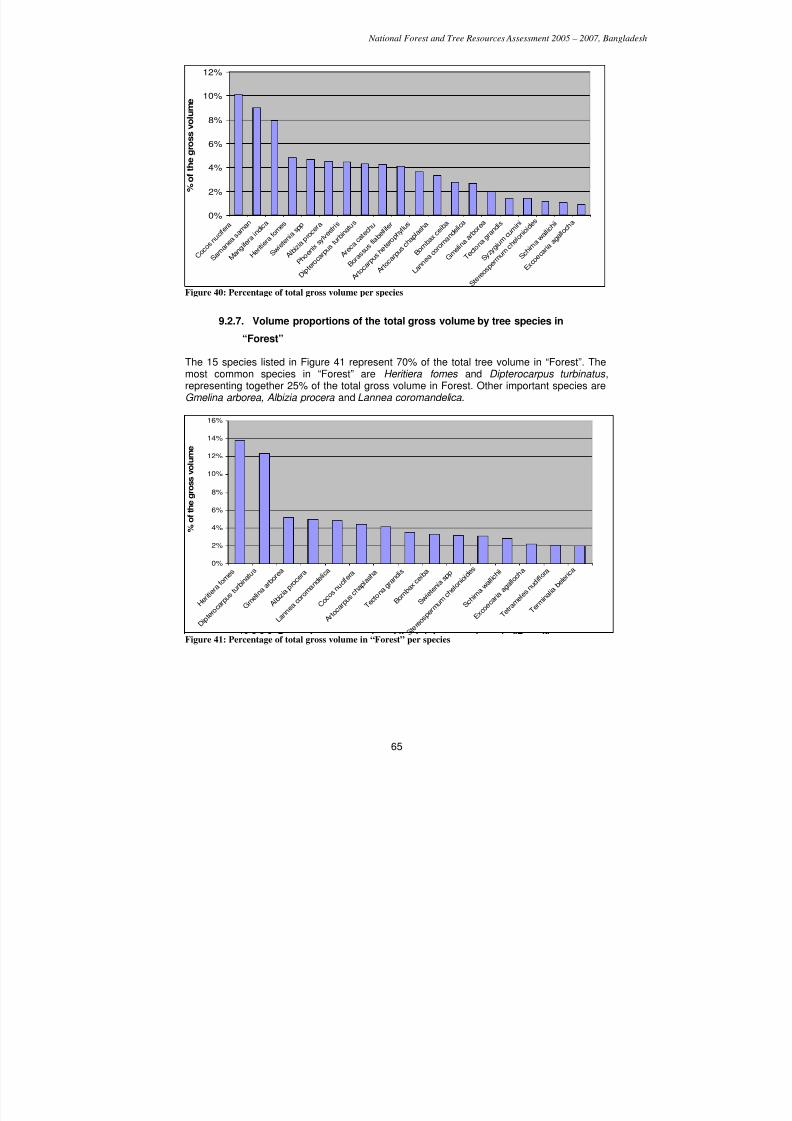
7/23/2019 NFA Final Report (1) (1)
http://slidepdf.com/reader/full/nfa-final-report-1-1 65/118
National Forest and Tree Resources Assessment 2005 – 2007, Bangladesh
65
0%
2%
4%
6%
8%
10%
12%
E x c o e c
a r i a
a g a l l
o c h a
S c h i m
a w a l l i c h
i i
S t e r e o s p e
r m u m
c h e
l o n i o i
d e s
S y z y g i u m
c u m i n i
T e c t o
n a g r a n d i s
G m e l i n a
a r b
o r e a
L a n n
e a c o r o m a n
d e l i c
a
B o m b a
x c e i b a
A r t o c a
r p u s
c h a
p l a s h a
A r t o c a r p u s
h e t e r o p h y l l u
s
B o r a s s u s
f l a b e
l l i f e r
A r e c
a c a t e c h u
D i p t
e r o c a r p u s
t u r b i n a
t u s
P h o e n i x
s y l v e
s t r i s
A l b i z
i a p r
o c e r a
S w i e
t e n i a
s p p
H e r i t i e r
a f o m
e s
M a n
g i f e r a
i n d i c
a
S a m a n e a
s a m
a n
C o c o s n
u c i f e
r a
% o f t h e g r o s s v o l u m e
Figure 40: Percentage of total gross volume per species
9.2.7. Volume proportions of the total gross volume by tree species in
“Forest”
The 15 species listed in Figure 41 represent 70% of the total tree volume in “Forest”. Themost common species in “Forest” are Heritiera fomes and Dipterocarpus turbinatus ,representing together 25% of the total gross volume in Forest. Other important species areGmelina arborea, Albizia procera and Lannea coromandelica.
0%
2%
4%
6%
8%
10%
12%
14%
16%
T e r m i n a
l i a b e l e
r i c a
T e t r a
m e l e s
n u d i f l o
r a
E x c o e c
a r i a
a g a l l
o c h a
S c h i m
a w a l l i c h
i i
S t e r e o s p
e r m u
m c h e l o
n i o i d
e s
S w i e t
e n i a
s p p
B o m b a
x c e i b a
T e c t o
n a g r a n
d i s
A r t o c
a r p u
s c h a
p l a s h a
C o c o
s n u c i f e
r a
L a n n
e a c o r o m a
n d e l i c a
A l b i z
i a p r
o c e r a
G m e l i n a
a r b
o r e a
D i p t e r o
c a r p u s
t u r b i n a
t u s
H e r i t i e r
a f o m
e s
% o f t h e g r o s s v o l u m e
Figure 41: Percentage of total gross volume in “Forest” per species
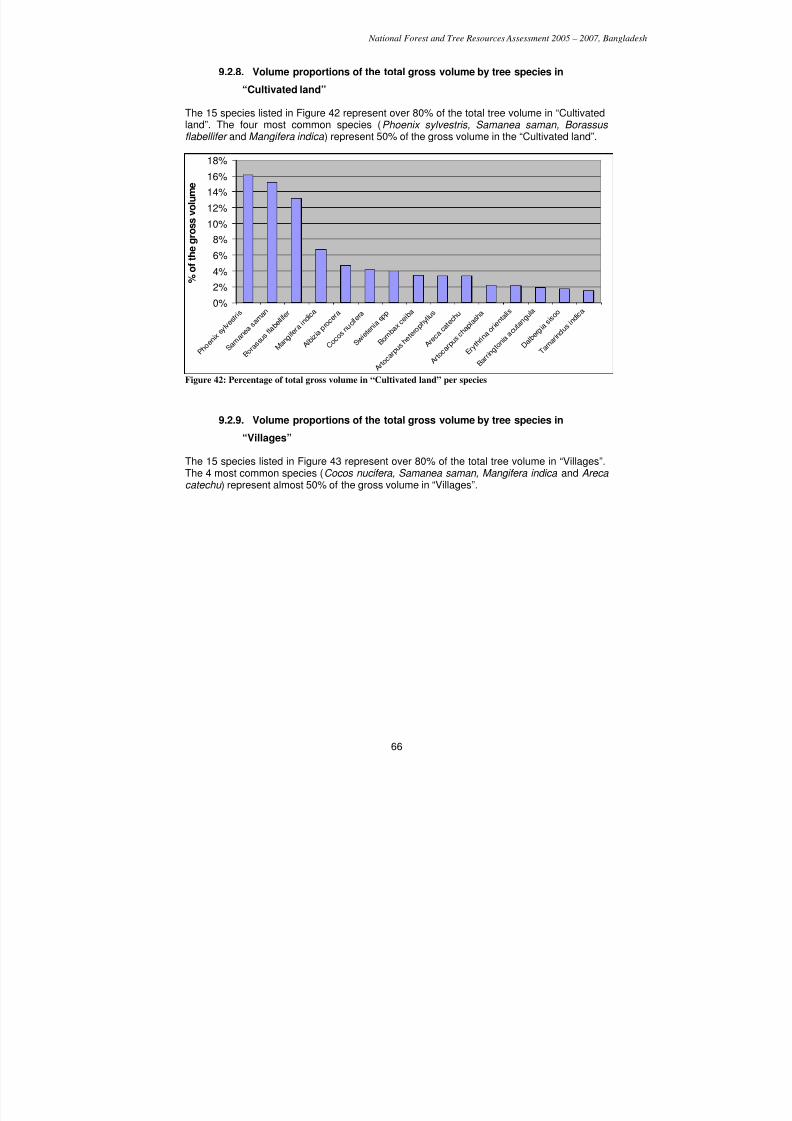
7/23/2019 NFA Final Report (1) (1)
http://slidepdf.com/reader/full/nfa-final-report-1-1 66/118
National Forest and Tree Resources Assessment 2005 – 2007, Bangladesh
66
9.2.8. Volume proportions of the total gross volume by tree species in
“Cultivated land”
The 15 species listed in Figure 42 represent over 80% of the total tree volume in “Cultivatedland”. The four most common species (Phoenix sylvestris, Samanea saman, Borassus
flabellifer and Mangifera indica ) represent 50% of the gross volume in the “Cultivated land”.
0%
2%4%
6%
8%
10%
12%
14%
16%
18%
T a m a r i n d
u s i n d i c
a
D a l b
e r g i a
s i s o o
B a r r i n g
t o n i a
a c u t a n g
u l a
E r y t h r i n
a o r i e n
t a l i s
A r t o c a
r p u s
c h a
p l a s h a
A r e c
a c a t e c h u
A r t o c
a r p u
s h e t e r
o p h y l l u
s
B o m b a
x c e i b a
S w i e t
e n i a
s p p
C o c o
s n u c i f e
r a
A l b i z
i a p r
o c e r a
M a n
g i f e r a
i n d i c
a
B o r a s s u s
f l a b e
l l i f e r
S a m a n
e a s a m
a n
P h o e n i x
s y l v e
s t r i s
%
o f t h e g r o s s v o l u m e
Figure 42: Percentage of total gross volume in “Cultivated land” per species
9.2.9. Volume proportions of the total gross volume by tree species in
“Villages”
The 15 species listed in Figure 43 represent over 80% of the total tree volume in “Villages”.The 4 most common species (Cocos nucifera, Samanea saman, Mangifera indica and Arecacatechu ) represent almost 50% of the gross volume in “Villages”.
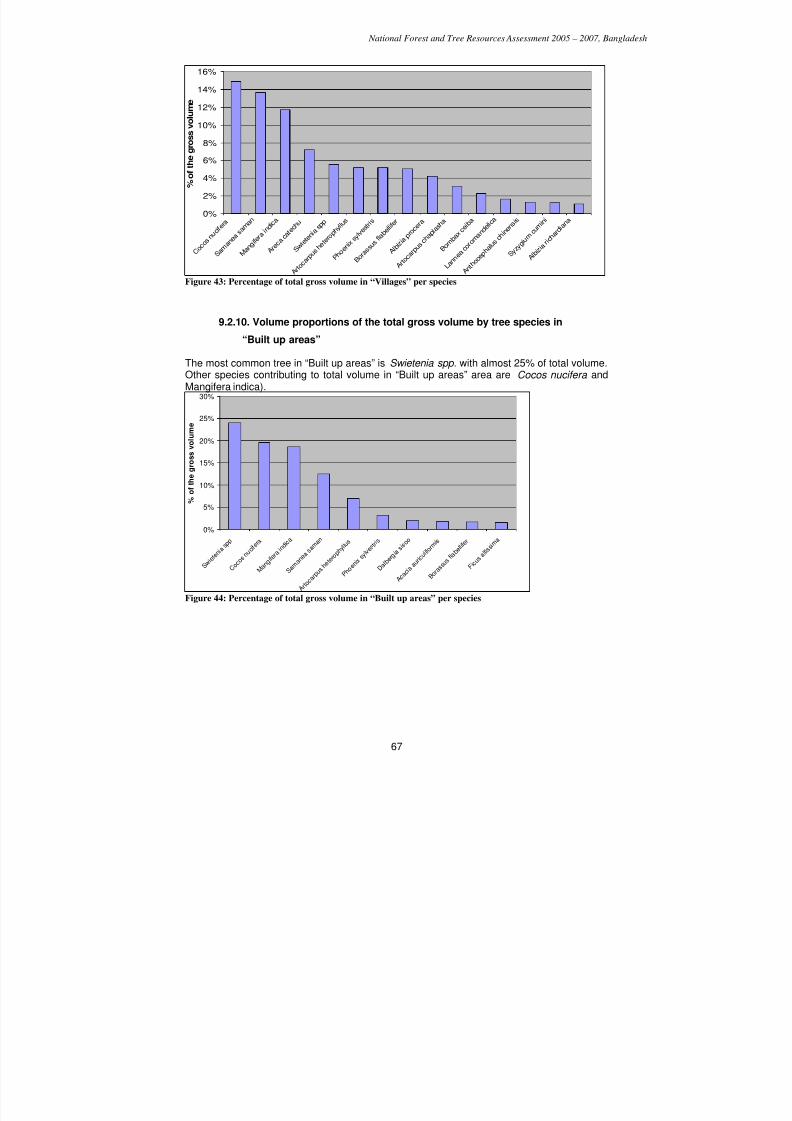
7/23/2019 NFA Final Report (1) (1)
http://slidepdf.com/reader/full/nfa-final-report-1-1 67/118
National Forest and Tree Resources Assessment 2005 – 2007, Bangladesh
67
0%
2%
4%
6%
8%
10%
12%
14%
16%
A l b i z
i a r i c h a
r d i a
n a
S y z y g i u m
c u m i n i
A n t h
o c e p h a
l u s c h i n e
n s i s
L a n n
e a c o r o m a
n d e l i c a
B o m b a
x c e i b a
A r t o c
a r p u
s c h a
p l a s h a
A l b i z
i a p r
o c e r a
B o r a s s u s
f l a b e
l l i f e r
P h o e n i x
s y l v e
s t r i s
A r t o c a
r p u s
h e t e r o p h
y l l u s
S w i e t
e n i a
s p p
A r e c
a c a t e c h u
M a n g i f e
r a i n d i c
a
S a m a n
e a s a m
a n
C o c o
s n u c i f e
r a
% o f t h e g r o s
s v o l u m e
Figure 43: Percentage of total gross volume in “Villages” per species
9.2.10. Volume proportions of the total gross volume by tree species in
“Built up areas”
The most common tree in “Built up areas” is Swietenia spp . with almost 25% of total volume.Other species contributing to total volume in “Built up areas” area are Cocos nucifera andMangifera indica).
0%
5%
10%
15%
20%
25%
30%
F i c u s a l t
i s s i m a
B o r a s s u s f l a b
e l l i f e r
A c a c i a a u r i c u l i
f o r m i s
D a l b e r g i a
s i s o o
P h o e n i x
s y l v e s t r i s
A r t o c
a r p u s h e t e
r o p h y l l u s
S a m a n e a
s a m a n
M a n g i f e r a
i n d i c a
C o c o s n u
c i f e r a
S w i e t e n
i a s p p
% o f t h e g r o s s v o l u m e
Figure 44: Percentage of total gross volume in “Built up areas” per species
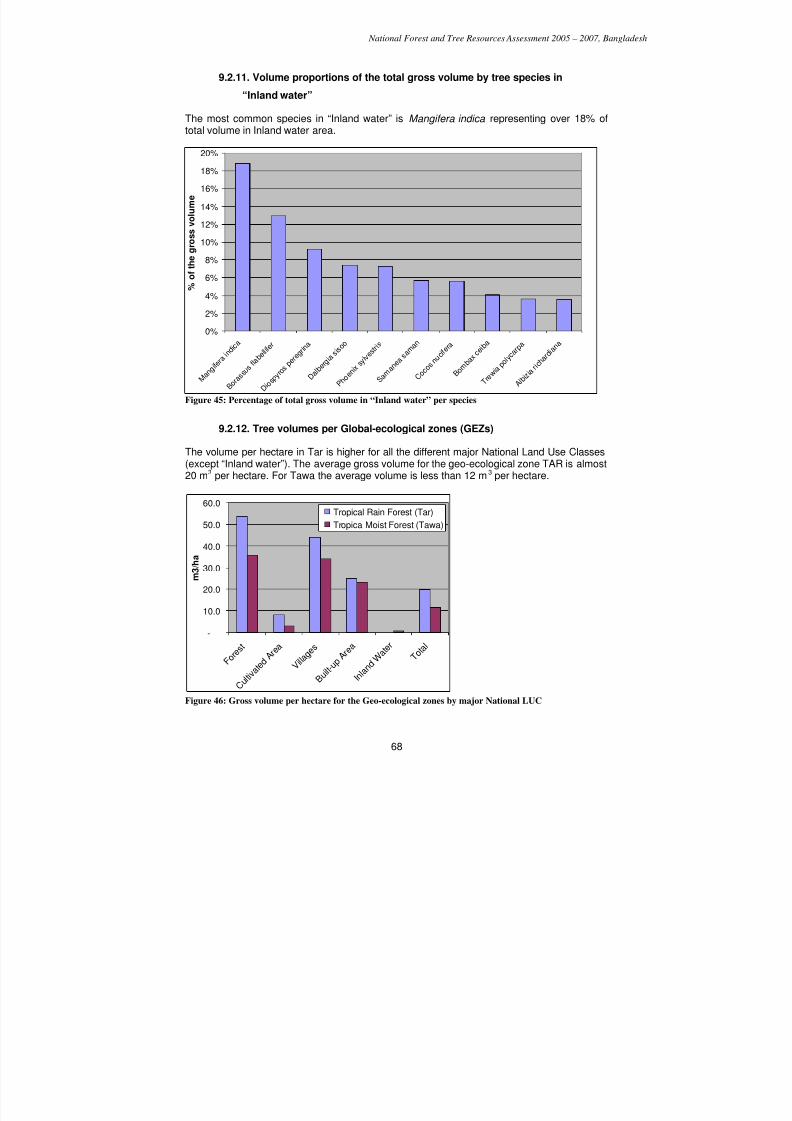
7/23/2019 NFA Final Report (1) (1)
http://slidepdf.com/reader/full/nfa-final-report-1-1 68/118
National Forest and Tree Resources Assessment 2005 – 2007, Bangladesh
68
9.2.11. Volume proportions of the total gross volume by tree species in
“Inland water”
The most common species in “Inland water” is Mangifera indica representing over 18% oftotal volume in Inland water area.
0%
2%
4%
6%
8%
10%
12%
14%
16%
18%
20%
A l b i z i a r i c h a r d i a n
a
T r e w i a p o l y c
a r p a
B o m b a x c e i b a
C o c o s n u c i f e r a
S a m a n e a
s a m a n
P h o e n i x
s y l v e
s t r i s
D a l b e
r g i a s i s o o
D i o s p y r o s
p e r e g r i n a
B o r a s s u s
f l a b e l l i f e r
M a n g i f e r a
i n d i c a
% o
f t h e g r o s s v o l u m e
Figure 45: Percentage of total gross volume in “Inland water” per species
9.2.12. Tree volumes per Global-ecological zones (GEZs)
The volume per hectare in Tar is higher for all the different major National Land Use Classes(except “Inland water”). The average gross volume for the geo-ecological zone TAR is almost20 m3 per hectare. For Tawa the average volume is less than 12 m3 per hectare.
-
10.0
20.0
30.0
40.0
50.0
60.0
F o r e s t
C u l t i v
a t e d A
r e a
V i l l a g
e s
B u i l t - u p
A r e a
I n l a n d W
a t e r
T o t a l
m 3 / h a
Tropical Rain Forest (Tar)
Tropica Moist Forest (Tawa)
Figure 46: Gross volume per hectare for the Geo-ecological zones by major National LUC
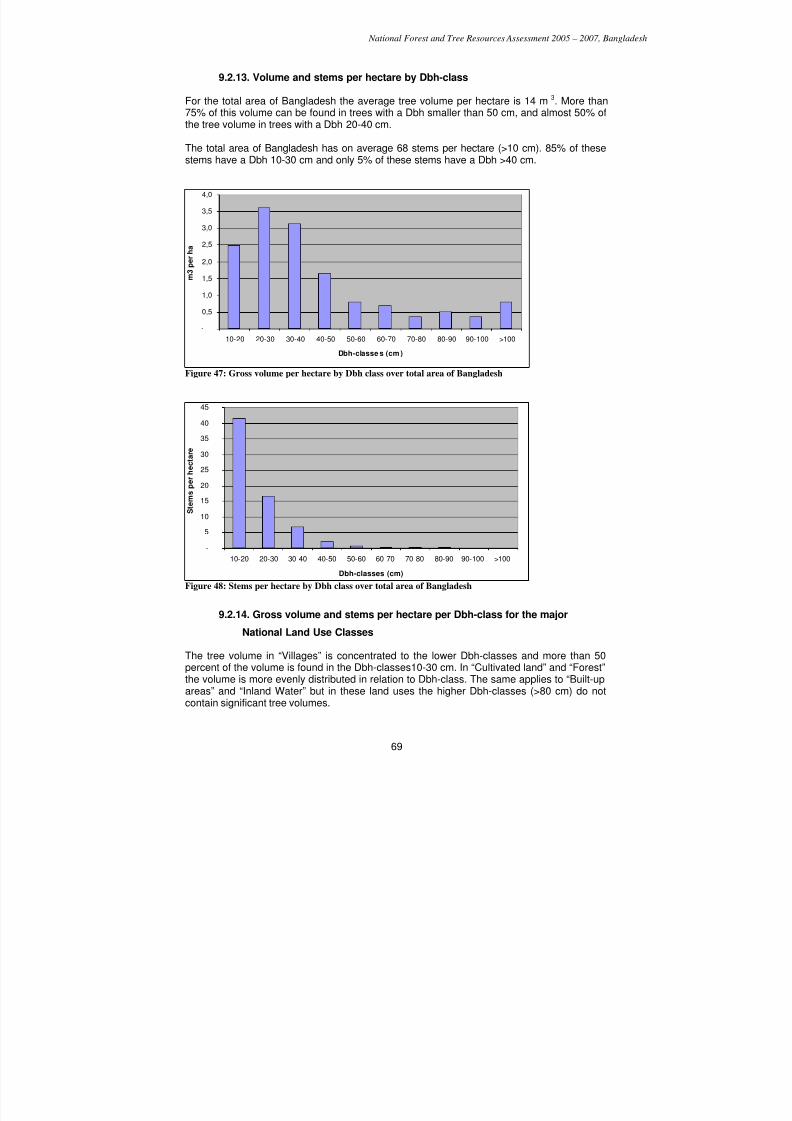
7/23/2019 NFA Final Report (1) (1)
http://slidepdf.com/reader/full/nfa-final-report-1-1 69/118
National Forest and Tree Resources Assessment 2005 – 2007, Bangladesh
69
9.2.13. Volume and stems per hectare by Dbh-class
For the total area of Bangladesh the average tree volume per hectare is 14 m 3. More than75% of this volume can be found in trees with a Dbh smaller than 50 cm, and almost 50% ofthe tree volume in trees with a Dbh 20-40 cm.
The total area of Bangladesh has on average 68 stems per hectare (>10 cm). 85% of thesestems have a Dbh 10-30 cm and only 5% of these stems have a Dbh >40 cm.
-
0,5
1,0
1,5
2,0
2,5
3,0
3,5
4,0
10-20 20-30 30-40 40-50 50-60 60-70 70-80 80-90 90-100 >100
Dbh-classe s (cm)
m
3 p e r h a
Figure 47: Gross volume per hectare by Dbh class over total area of Bangladesh
-
5
10
15
20
25
30
35
40
45
10-20 20-30 30-40 40-50 50-60 60-70 70-80 80-90 90-100 >100
Dbh-classes (cm)
S t e m s p e r h e c t a r e
Figure 48: Stems per hectare by Dbh class over total area of Bangladesh
9.2.14. Gross volume and stems per hectare per Dbh-class for the major
National Land Use Classes
The tree volume in “Villages” is concentrated to the lower Dbh-classes and more than 50percent of the volume is found in the Dbh-classes10-30 cm. In “Cultivated land” and “Forest”the volume is more evenly distributed in relation to Dbh-class. The same applies to “Built-up
areas” and “Inland Water” but in these land uses the higher Dbh-classes (>80 cm) do notcontain significant tree volumes.
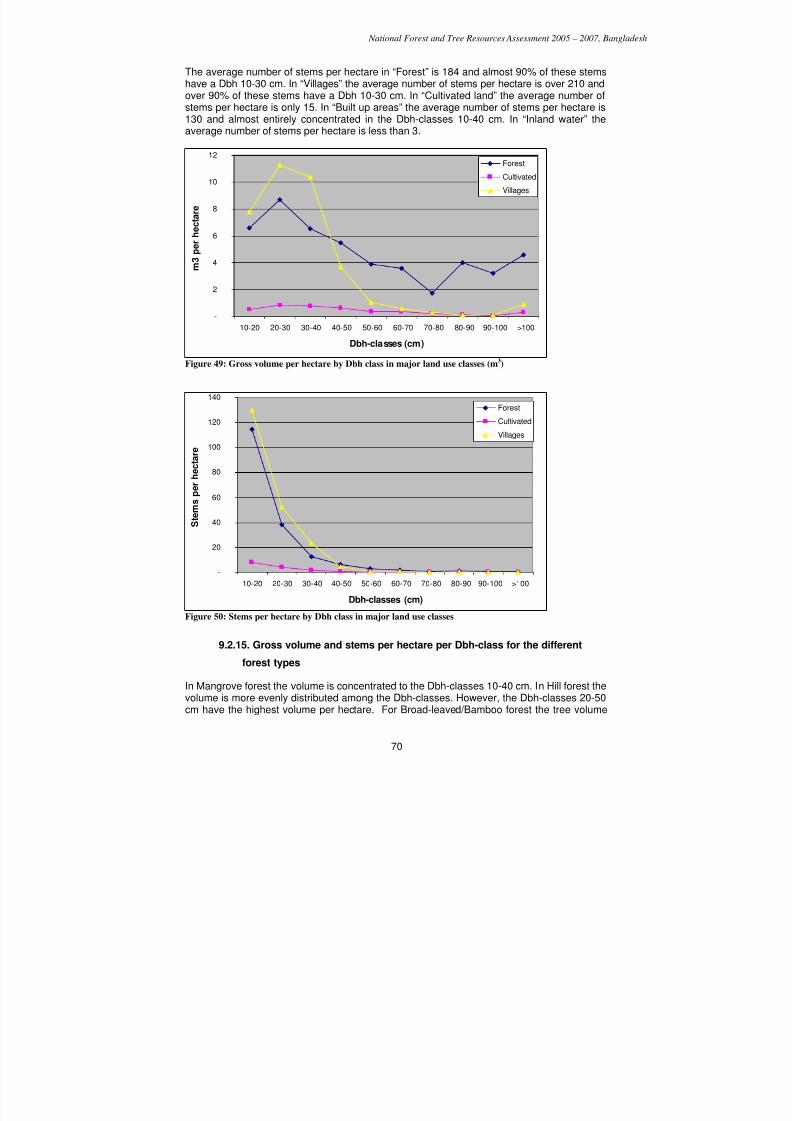
7/23/2019 NFA Final Report (1) (1)
http://slidepdf.com/reader/full/nfa-final-report-1-1 70/118
National Forest and Tree Resources Assessment 2005 – 2007, Bangladesh
70
The average number of stems per hectare in “Forest” is 184 and almost 90% of these stemshave a Dbh 10-30 cm. In “Villages” the average number of stems per hectare is over 210 andover 90% of these stems have a Dbh 10-30 cm. In “Cultivated land” the average number ofstems per hectare is only 15. In “Built up areas” the average number of stems per hectare is130 and almost entirely concentrated in the Dbh-classes 10-40 cm. In “Inland water” theaverage number of stems per hectare is less than 3.
-
2
4
6
8
10
12
10-20 20-30 30-40 40-50 50-60 60-70 70-80 80-90 90-100 >100
Dbh-classes (cm)
m 3 p e r h e c t a r e
Forest
Cultivated
Villages
Figure 49: Gross volume per hectare by Dbh class in major land use classes (m3)
-
20
40
60
80
100
120
140
10-20 20-30 30-40 40-50 50-60 60-70 70-80 80-90 90-100 >100
Dbh-classes (cm)
S t e m s p e r h e c t a r e
Forest
Cultivated
Villages
Figure 50: Stems per hectare by Dbh class in major land use classes
9.2.15. Gross volume and stems per hectare per Dbh-class for the different
forest types
In Mangrove forest the volume is concentrated to the Dbh-classes 10-40 cm. In Hill forest thevolume is more evenly distributed among the Dbh-classes. However, the Dbh-classes 20-50cm have the highest volume per hectare. For Broad-leaved/Bamboo forest the tree volume
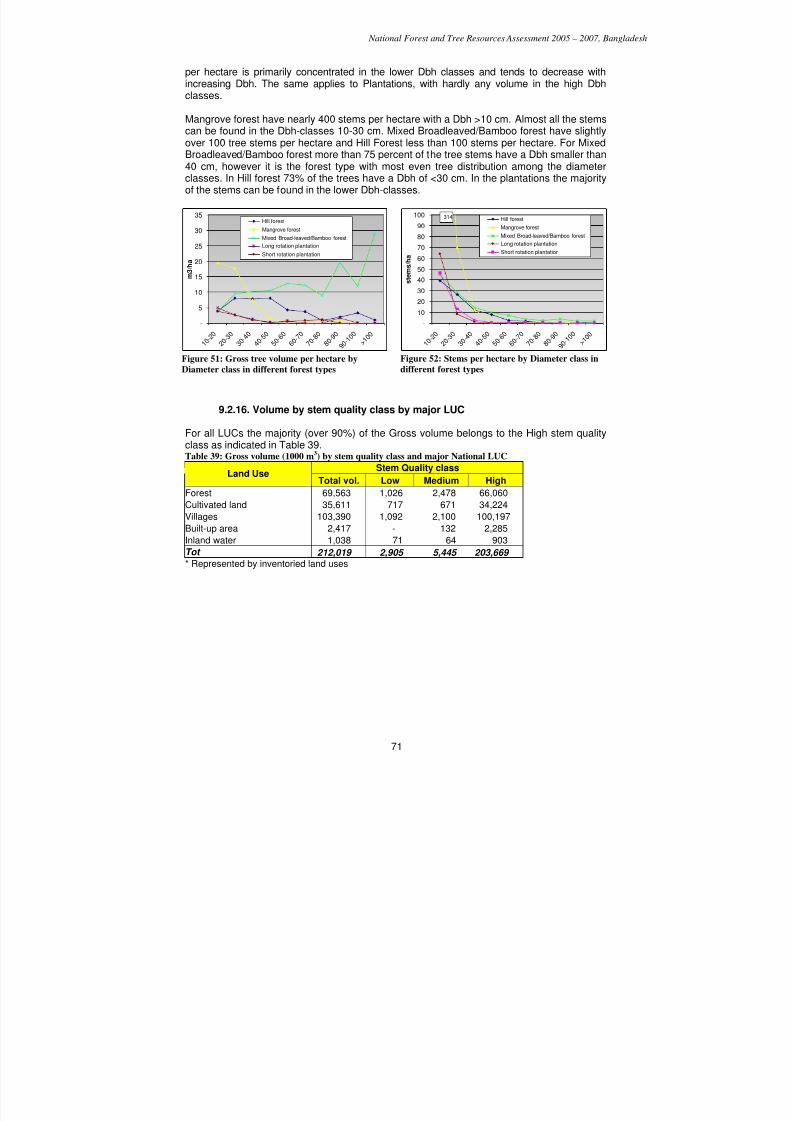
7/23/2019 NFA Final Report (1) (1)
http://slidepdf.com/reader/full/nfa-final-report-1-1 71/118
National Forest and Tree Resources Assessment 2005 – 2007, Bangladesh
71
per hectare is primarily concentrated in the lower Dbh classes and tends to decrease withincreasing Dbh. The same applies to Plantations, with hardly any volume in the high Dbhclasses.
Mangrove forest have nearly 400 stems per hectare with a Dbh >10 cm. Almost all the stemscan be found in the Dbh-classes 10-30 cm. Mixed Broadleaved/Bamboo forest have slightlyover 100 tree stems per hectare and Hill Forest less than 100 stems per hectare. For MixedBroadleaved/Bamboo forest more than 75 percent of the tree stems have a Dbh smaller than40 cm, however it is the forest type with most even tree distribution among the diameterclasses. In Hill forest 73% of the trees have a Dbh of <30 cm. In the plantations the majorityof the stems can be found in the lower Dbh-classes.
-
5
10
15
20
25
30
35
1 0 - 2 0
2 0 - 3 0
3 0 - 4 0
4 0 - 5 0
5 0 - 6 0
6 0 - 7 0
7 0 - 8 0
8 0 - 9 0
9 0 - 1 0 0
> 1 0 0
m
3 / h a
Hill forest
Mangrove forest
Mixed Broad-leaved/Bamboo forest
Long rotation plantation
Short rotation plantation
Figure 51: Gross tree volume per hectare by
Diameter class in different forest types
314
-
10
20
30
40
50
60
70
80
90
100
1 0 - 2 0
2 0 - 3 0
3 0 - 4 0
4 0 - 5 0
5 0 - 6 0
6 0 - 7 0
7 0 - 8 0
8 0 - 9 0
9 0 - 1 0 0
> 1 0 0
s t e
m s / h a
Hill forest
Mangrove forest
Mixed Broad-leaved/Bamboo forest
Long rotation plantation
Short rotation plantation
Figure 52: Stems per hectare by Diameter class in
different forest types
9.2.16. Volume by stem quality class by major LUC
For all LUCs the majority (over 90%) of the Gross volume belongs to the High stem qualityclass as indicated in Table 39.Table 39: Gross volume (1000 m3) by stem quality class and major National LUC
Stem Quality classLand Use
Total vol. Low Medium High
Forest 69,563 1,026 2,478 66,060
Cultivated land 35,611 717 671 34,224
Villages 103,390 1,092 2,100 100,197
Built-up area 2,417 - 132 2,285
Inland water 1,038 71 64 903
Tot 212,019 2,905 5,445 203,669* Represented by inventoried land uses
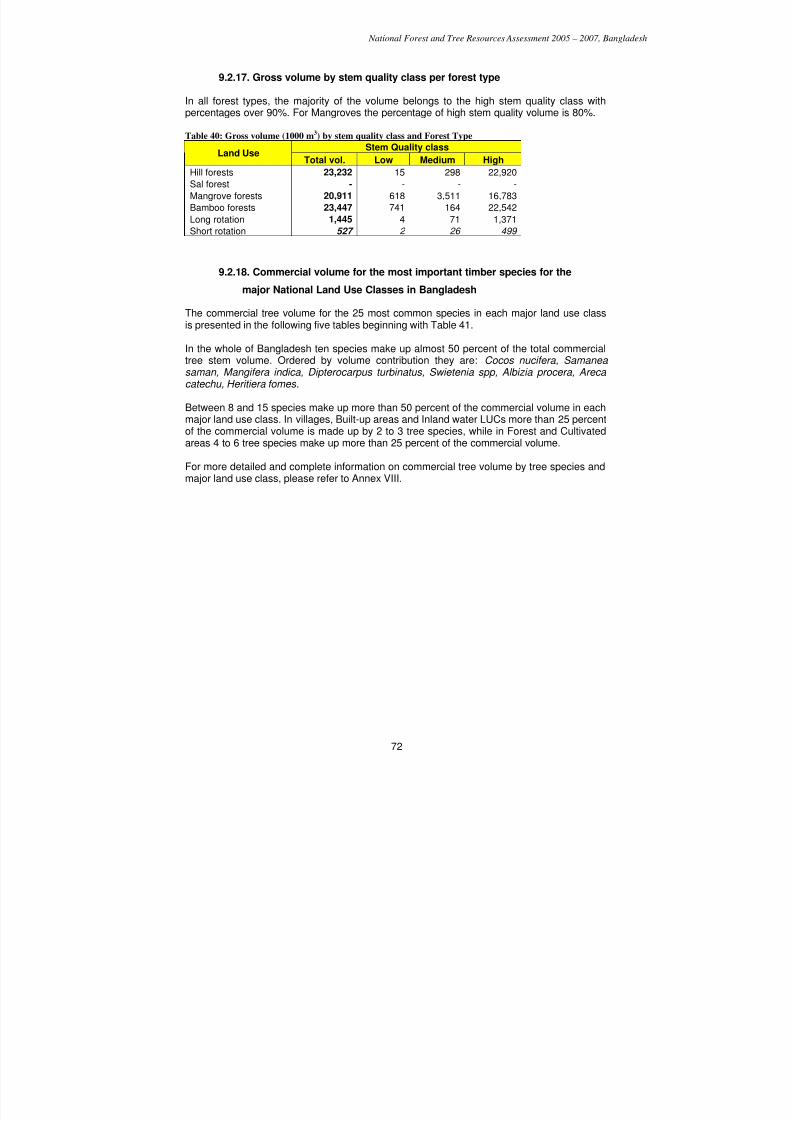
7/23/2019 NFA Final Report (1) (1)
http://slidepdf.com/reader/full/nfa-final-report-1-1 72/118
National Forest and Tree Resources Assessment 2005 – 2007, Bangladesh
72
9.2.17. Gross volume by stem quality class per forest type
In all forest types, the majority of the volume belongs to the high stem quality class withpercentages over 90%. For Mangroves the percentage of high stem quality volume is 80%.
Table 40: Gross volume (1000 m3
) by stem quality class and Forest TypeStem Quality class
Land UseTotal vol. Low Medium High
Hill forests 23,232 15 298 22,920
Sal forest - - - -
Mangrove forests 20,911 618 3,511 16,783
Bamboo forests 23,447 741 164 22,542
Long rotation 1,445 4 71 1,371
Short rotation 527 2 26 499
9.2.18. Commercial volume for the most important timber species for themajor National Land Use Classes in Bangladesh
The commercial tree volume for the 25 most common species in each major land use classis presented in the following five tables beginning with Table 41.
In the whole of Bangladesh ten species make up almost 50 percent of the total commercialtree stem volume. Ordered by volume contribution they are: Cocos nucifera, Samaneasaman, Mangifera indica, Dipterocarpus turbinatus, Swietenia spp, Albizia procera, Arecacatechu, Heritiera fomes .
Between 8 and 15 species make up more than 50 percent of the commercial volume in eachmajor land use class. In villages, Built-up areas and Inland water LUCs more than 25 percentof the commercial volume is made up by 2 to 3 tree species, while in Forest and Cultivatedareas 4 to 6 tree species make up more than 25 percent of the commercial volume.
For more detailed and complete information on commercial tree volume by tree species andmajor land use class, please refer to Annex VIII.
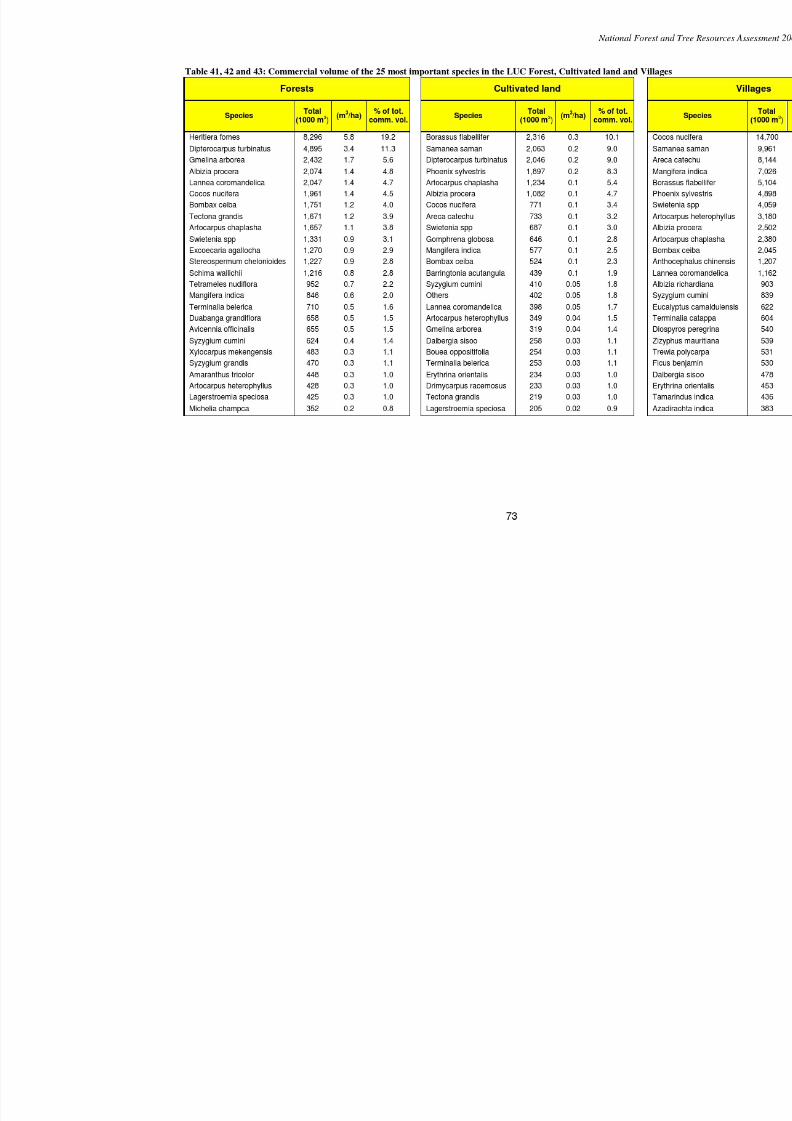
7/23/2019 NFA Final Report (1) (1)
http://slidepdf.com/reader/full/nfa-final-report-1-1 73/118
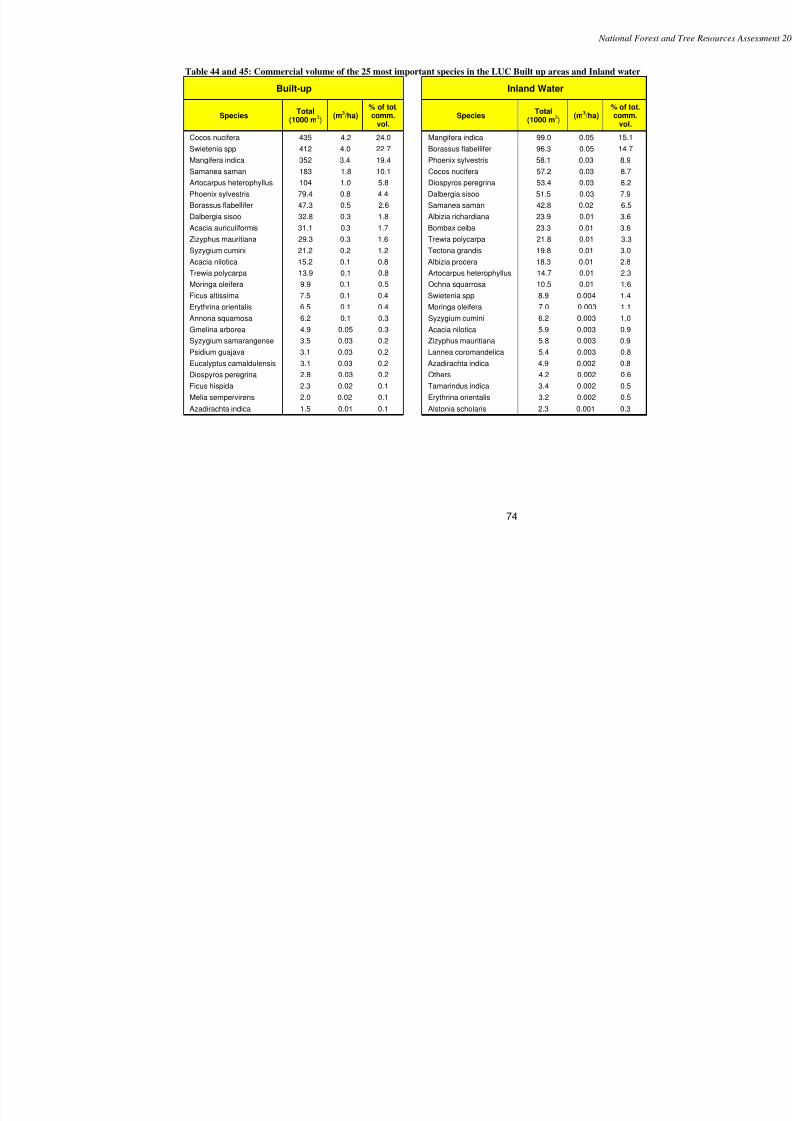
7/23/2019 NFA Final Report (1) (1)
http://slidepdf.com/reader/full/nfa-final-report-1-1 74/118
National Forest and
74
Table 44 and 45: Commercial volume of the 25 most important species in the LUC Built up areas and Inland water
Built-up Inland Water
SpeciesTotal
(1000 m3)
(m3/ha)
% of tot.comm.
vol.Species
Total(1000 m
3)
(m3/ha)
% of tot.comm.
vol.
Cocos nucifera 435 4.2 24.0 Mangifera indica 99.0 0.05 15.1Swietenia spp 412 4.0 22.7 Borassus flabellifer 96.3 0.05 14.7
Mangifera indica 352 3.4 19.4 Phoenix sylvestris 58.1 0.03 8.9
Samanea saman 183 1.8 10.1 Cocos nucifera 57.2 0.03 8.7
Artocarpus heterophyllus 104 1.0 5.8 Diospyros peregrina 53.4 0.03 8.2
Phoenix sylvestris 79.4 0.8 4.4 Dalbergia sisoo 51.5 0.03 7.9
Borassus flabellifer 47.3 0.5 2.6 Samanea saman 42.8 0.02 6.5
Dalbergia sisoo 32.8 0.3 1.8 Albizia richardiana 23.9 0.01 3.6
Acacia auriculiformis 31.1 0.3 1.7 Bombax ceiba 23.3 0.01 3.6
Zizyphus mauritiana 29.3 0.3 1.6 Trewia polycarpa 21.8 0.01 3.3
Syzygium cumini 21.2 0.2 1.2 Tectona grandis 19.8 0.01 3.0
Acacia nilotica 15.2 0.1 0.8 Albizia procera 18.3 0.01 2.8
Trewia polycarpa 13.9 0.1 0.8 Artocarpus heterophyllus 14.7 0.01 2.3Moringa oleifera 9.9 0.1 0.5 Ochna squarrosa 10.5 0.01 1.6
Ficus altissima 7.5 0.1 0.4 Swietenia spp 8.9 0.004 1.4
Erythrina orientalis 6.5 0.1 0.4 Moringa oleifera 7.0 0.003 1.1
Annona squamosa 6.2 0.1 0.3 Syzygium cumini 6.2 0.003 1.0
Gmelina arborea 4.9 0.05 0.3 Acacia nilotica 5.9 0.003 0.9
Syzygium samarangense 3.5 0.03 0.2 Zizyphus mauritiana 5.8 0.003 0.9
Psidium guajava 3.1 0.03 0.2 Lannea coromandelica 5.4 0.003 0.8
Eucalyptus camaldulensis 3.1 0.03 0.2 Azadirachta indica 4.9 0.002 0.8
Diospyros peregrina 2.8 0.03 0.2 Others 4.2 0.002 0.6
Ficus hispida 2.3 0.02 0.1 Tamarindus indica 3.4 0.002 0.5
Melia sempervirens 2.0 0.02 0.1 Erythrina orientalis 3.2 0.002 0.5
Azadirachta indica 1.5 0.01 0.1 Alstonia scholaris 2.3 0.001 0.3
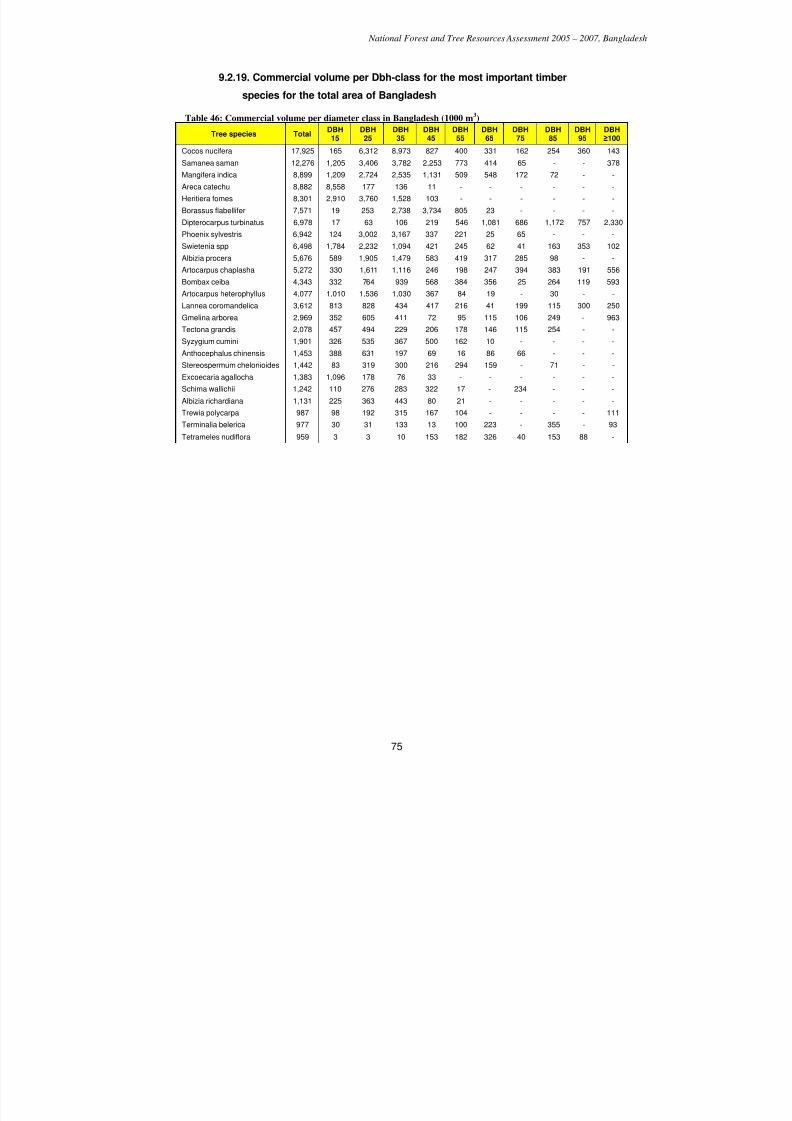
7/23/2019 NFA Final Report (1) (1)
http://slidepdf.com/reader/full/nfa-final-report-1-1 75/118
National Forest and Tree Resources Assessment 2005 – 2007, Bangladesh
75
9.2.19. Commercial volume per Dbh-class for the most important timber
species for the total area of Bangladesh
Table 46: Commercial volume per diameter class in Bangladesh (1000 m3)
Tree species TotalDBH
15
DBH
25
DBH
35
DBH
45
DBH
55
DBH
65
DBH
75
DBH
85
DBH
95
DBH
≥100
Cocos nucifera 17,925 165 6,312 8,973 827 400 331 162 254 360 143
Samanea saman 12,276 1,205 3,406 3,782 2,253 773 414 65 - - 378
Mangifera indica 8,899 1,209 2,724 2,535 1,131 509 548 172 72 - -
Areca catechu 8,882 8,558 177 136 11 - - - - - -
Heritiera fomes 8,301 2,910 3,760 1,528 103 - - - - - -
Borassus flabellifer 7,571 19 253 2,738 3,734 805 23 - - - -
Dipterocarpus turbinatus 6,978 17 63 106 219 546 1,081 686 1,172 757 2,330
Phoenix sylvestris 6,942 124 3,002 3,167 337 221 25 65 - - -
Swietenia spp 6,498 1,784 2,232 1,094 421 245 62 41 163 353 102
Albizia procera 5,676 589 1,905 1,479 583 419 317 285 98 - -
Artocarpus chaplasha 5,272 330 1,611 1,116 246 198 247 394 383 191 556
Bombax ceiba 4,343 332 764 939 568 384 356 25 264 119 593
Artocarpus heterophyllus 4,077 1,010 1,536 1,030 367 84 19 - 30 - -
Lannea coromandelica 3,612 813 828 434 417 216 41 199 115 300 250
Gmelina arborea 2,969 352 605 411 72 95 115 106 249 - 963
Tectona grandis 2,078 457 494 229 206 178 146 115 254 - -
Syzygium cumini 1,901 326 535 367 500 162 10 - - - -
Anthocephalus chinensis 1,453 388 631 197 69 16 86 66 - - -
Stereospermum chelonioides 1,442 83 319 300 216 294 159 - 71 - -
Excoecaria agallocha 1,383 1,096 178 76 33 - - - - - -
Schima wallichii 1,242 110 276 283 322 17 - 234 - - -
Albizia richardiana 1,131 225 363 443 80 21 - - - - -
Trewia polycarpa 987 98 192 315 167 104 - - - - 111Terminalia belerica 977 30 31 133 13 100 223 - 355 - 93
Tetrameles nudiflora 959 3 3 10 153 182 326 40 153 88 -
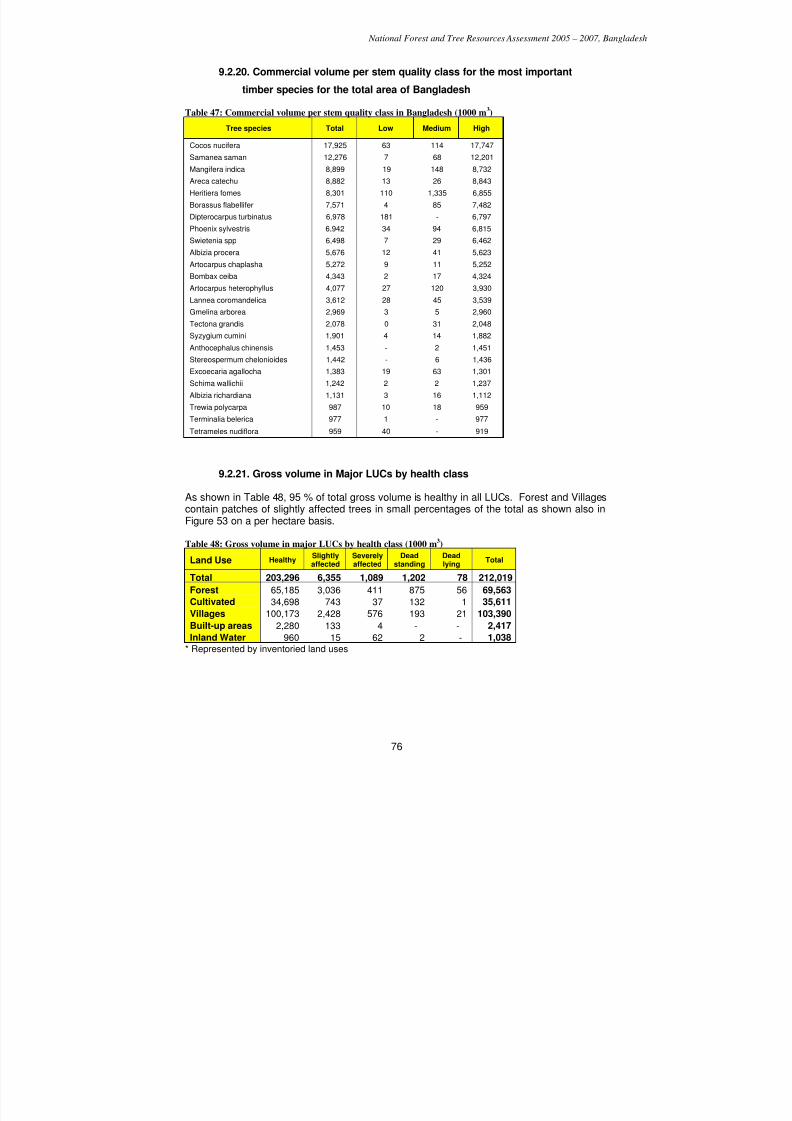
7/23/2019 NFA Final Report (1) (1)
http://slidepdf.com/reader/full/nfa-final-report-1-1 76/118
National Forest and Tree Resources Assessment 2005 – 2007, Bangladesh
76
9.2.20. Commercial volume per stem quality class for the most important
timber species for the total area of Bangladesh
Table 47: Commercial volume per stem quality class in Bangladesh (1000 m3)
Tree species Total Low Medium High
Cocos nucifera 17,925 63 114 17,747
Samanea saman 12,276 7 68 12,201
Mangifera indica 8,899 19 148 8,732
Areca catechu 8,882 13 26 8,843
Heritiera fomes 8,301 110 1,335 6,855
Borassus flabellifer 7,571 4 85 7,482
Dipterocarpus turbinatus 6,978 181 - 6,797
Phoenix sylvestris 6,942 34 94 6,815
Swietenia spp 6,498 7 29 6,462
Albizia procera 5,676 12 41 5,623
Artocarpus chaplasha 5,272 9 11 5,252
Bombax ceiba 4,343 2 17 4,324Artocarpus heterophyllus 4,077 27 120 3,930
Lannea coromandelica 3,612 28 45 3,539
Gmelina arborea 2,969 3 5 2,960
Tectona grandis 2,078 0 31 2,048
Syzygium cumini 1,901 4 14 1,882
Anthocephalus chinensis 1,453 - 2 1,451
Stereospermum chelonioides 1,442 - 6 1,436
Excoecaria agallocha 1,383 19 63 1,301
Schima wallichii 1,242 2 2 1,237
Albizia richardiana 1,131 3 16 1,112
Trewia polycarpa 987 10 18 959
Terminalia belerica 977 1 - 977
Tetrameles nudiflora 959 40 - 919
9.2.21. Gross volume in Major LUCs by health class
As shown in Table 48, 95 % of total gross volume is healthy in all LUCs. Forest and Villagescontain patches of slightly affected trees in small percentages of the total as shown also inFigure 53 on a per hectare basis.
Table 48: Gross volume in major LUCs by health class (1000 m3)
Land Use Healthy Slightlyaffected
Severelyaffected
Deadstanding
Deadlying
Total
Total 203,296 6,355 1,089 1,202 78 212,019
Forest 65,185 3,036 411 875 56 69,563
Cultivated 34,698 743 37 132 1 35,611
Villages 100,173 2,428 576 193 21 103,390
Built-up areas 2,280 133 4 - - 2,417
Inland Water 960 15 62 2 - 1,038* Represented by inventoried land uses
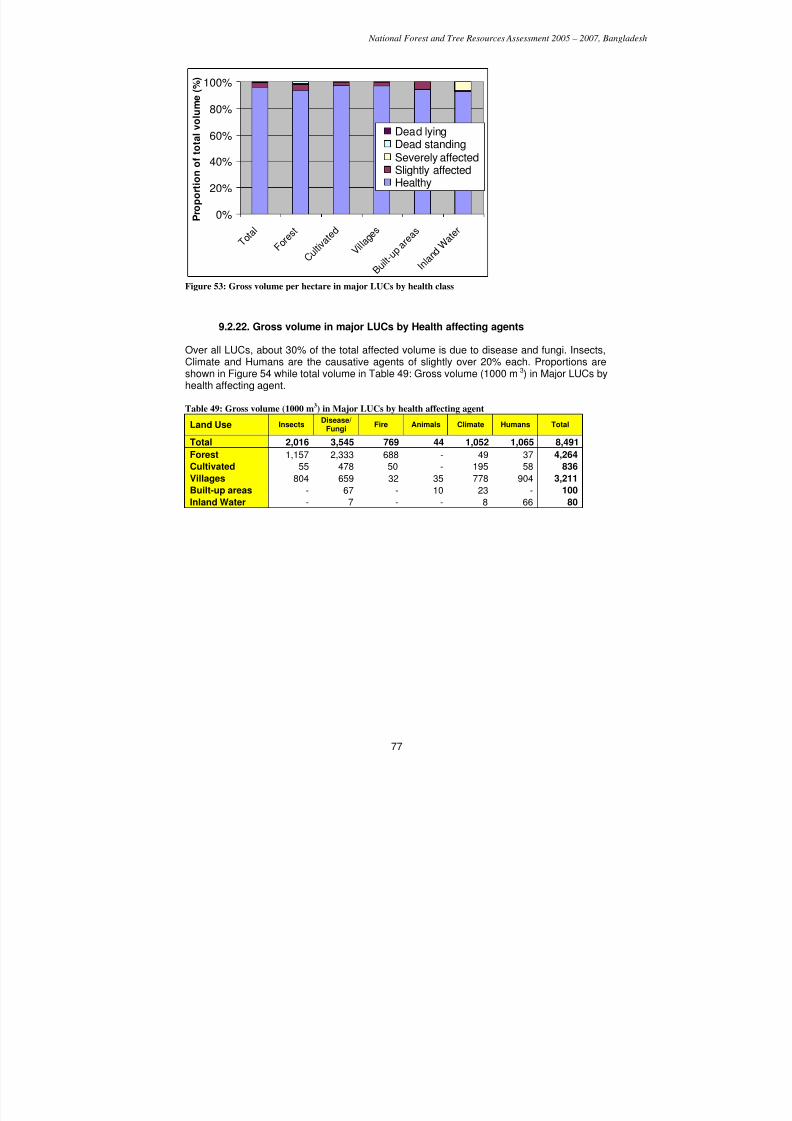
7/23/2019 NFA Final Report (1) (1)
http://slidepdf.com/reader/full/nfa-final-report-1-1 77/118
National Forest and Tree Resources Assessment 2005 – 2007, Bangladesh
77
0%
20%
40%
60%
80%
100%
T o t a l
F o r e s t
C u l t i v
a t e d
V i l l a g
e s
B u i l t - u p
a r e a s
I n l a n d W
a t e r
P r o p o r t i o n o f t o t a
l v o l u m e ( % )
Dead lyingDead standingSeverely affectedSlightly affectedHealthy
Figure 53: Gross volume per hectare in major LUCs by health class
9.2.22. Gross volume in major LUCs by Health affecting agents
Over all LUCs, about 30% of the total affected volume is due to disease and fungi. Insects,Climate and Humans are the causative agents of slightly over 20% each. Proportions areshown in Figure 54 while total volume in Table 49: Gross volume (1000 m3) in Major LUCs byhealth affecting agent.
Table 49: Gross volume (1000 m3) in Major LUCs by health affecting agent
Land Use InsectsDisease/
FungiFire Animals Climate Humans Total
Total 2,016 3,545 769 44 1,052 1,065 8,491
Forest 1,157 2,333 688 - 49 37 4,264
Cultivated 55 478 50 - 195 58 836
Villages 804 659 32 35 778 904 3,211
Built-up areas - 67 - 10 23 - 100
Inland Water - 7 - - 8 66 80
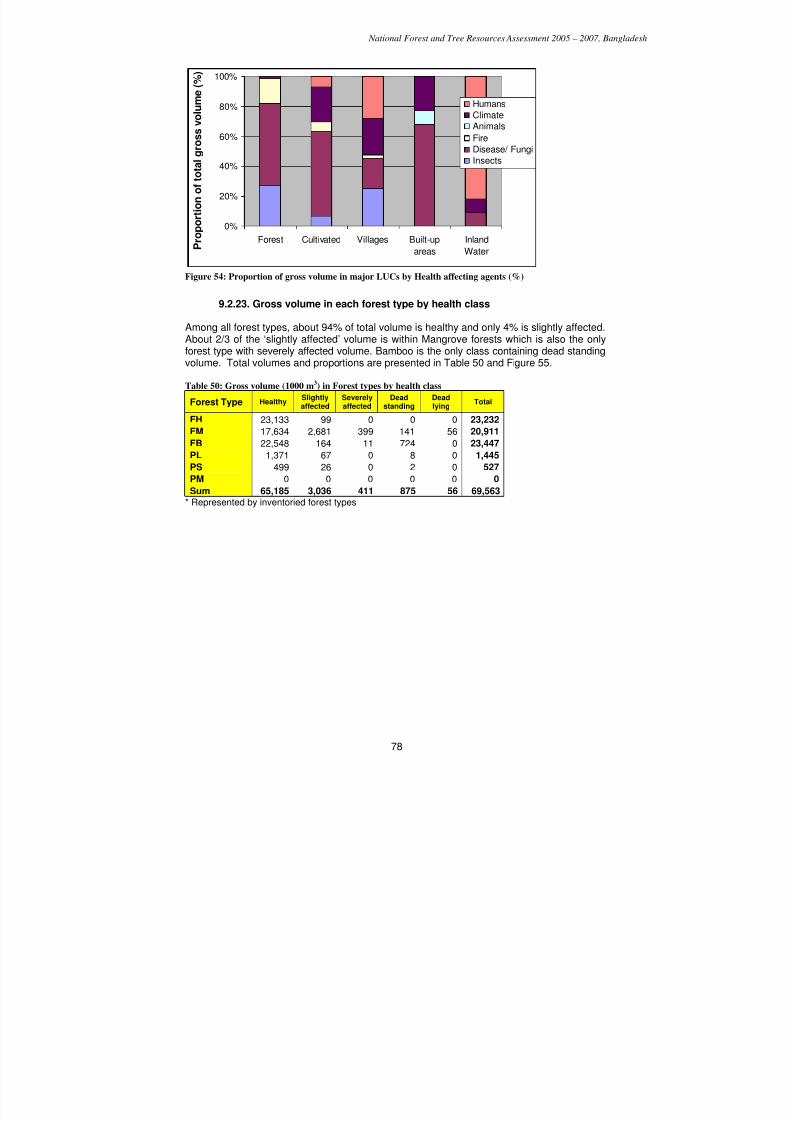
7/23/2019 NFA Final Report (1) (1)
http://slidepdf.com/reader/full/nfa-final-report-1-1 78/118
National Forest and Tree Resources Assessment 2005 – 2007, Bangladesh
78
0%
20%
40%
60%
80%
100%
Forest Cultivated Villages Built-up
areas
Inland
Water P r o p o r t i o n o f t o t a l g r o s
s v o l u m e ( % )
Humans
Climate
Animals
FireDisease/ Fungi
Insects
Figure 54: Proportion of gross volume in major LUCs by Health affecting agents (%)
9.2.23. Gross volume in each forest type by health class
Among all forest types, about 94% of total volume is healthy and only 4% is slightly affected.About 2/3 of the ‘slightly affected’ volume is within Mangrove forests which is also the onlyforest type with severely affected volume. Bamboo is the only class containing dead standingvolume. Total volumes and proportions are presented in Table 50 and Figure 55.
Table 50: Gross volume (1000 m3) in Forest types by health class
Forest Type HealthySlightlyaffected
Severelyaffected
Deadstanding
Deadlying
Total
FH 23,133 99 0 0 0 23,232
FM 17,634 2,681 399 141 56 20,911
FB 22,548 164 11 724 0 23,447
PL 1,371 67 0 8 0 1,445
PS 499 26 0 2 0 527
PM 0 0 0 0 0 0
Sum 65,185 3,036 411 875 56 69,563* Represented by inventoried forest types
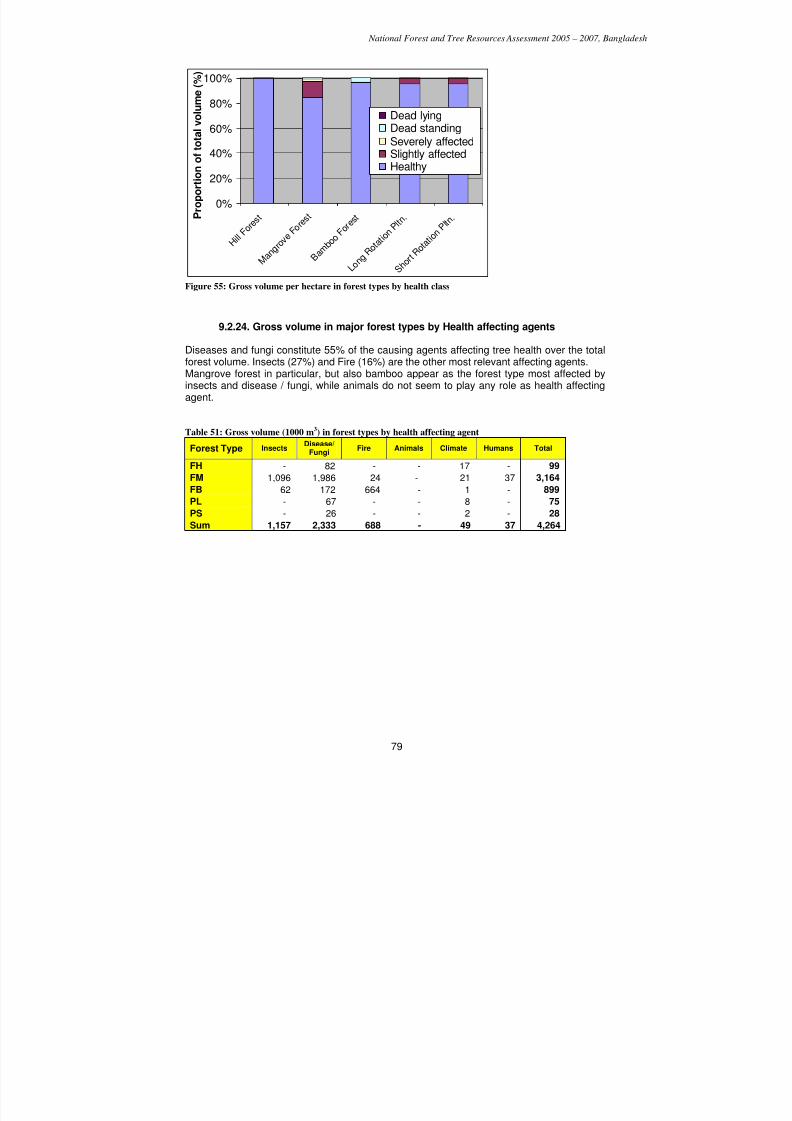
7/23/2019 NFA Final Report (1) (1)
http://slidepdf.com/reader/full/nfa-final-report-1-1 79/118
National Forest and Tree Resources Assessment 2005 – 2007, Bangladesh
79
0%
20%
40%
60%
80%
100%
H i l l F
o r e s t
M a n g r o v e F o r e
s t
B a m b o o
F o r e s t
L o n g
R o t a t i o n P l t n
.
S h o r t
R o t a t i o n P l t n
. P r o p o r t i o n o f t o t a l v o l u m e ( % )
Dead lyingDead standing
Severely affectedSlightly affectedHealthy
Figure 55: Gross volume per hectare in forest types by health class
9.2.24. Gross volume in major forest types by Health affecting agents
Diseases and fungi constitute 55% of the causing agents affecting tree health over the totalforest volume. Insects (27%) and Fire (16%) are the other most relevant affecting agents.Mangrove forest in particular, but also bamboo appear as the forest type most affected byinsects and disease / fungi, while animals do not seem to play any role as health affectingagent.
Table 51: Gross volume (1000 m3) in forest types by health affecting agent
Forest Type InsectsDisease/
FungiFire Animals Climate Humans Total
FH - 82 - - 17 - 99
FM 1,096 1,986 24 - 21 37 3,164
FB 62 172 664 - 1 - 899
PL - 67 - - 8 - 75
PS - 26 - - 2 - 28
Sum 1,157 2,333 688 - 49 37 4,264
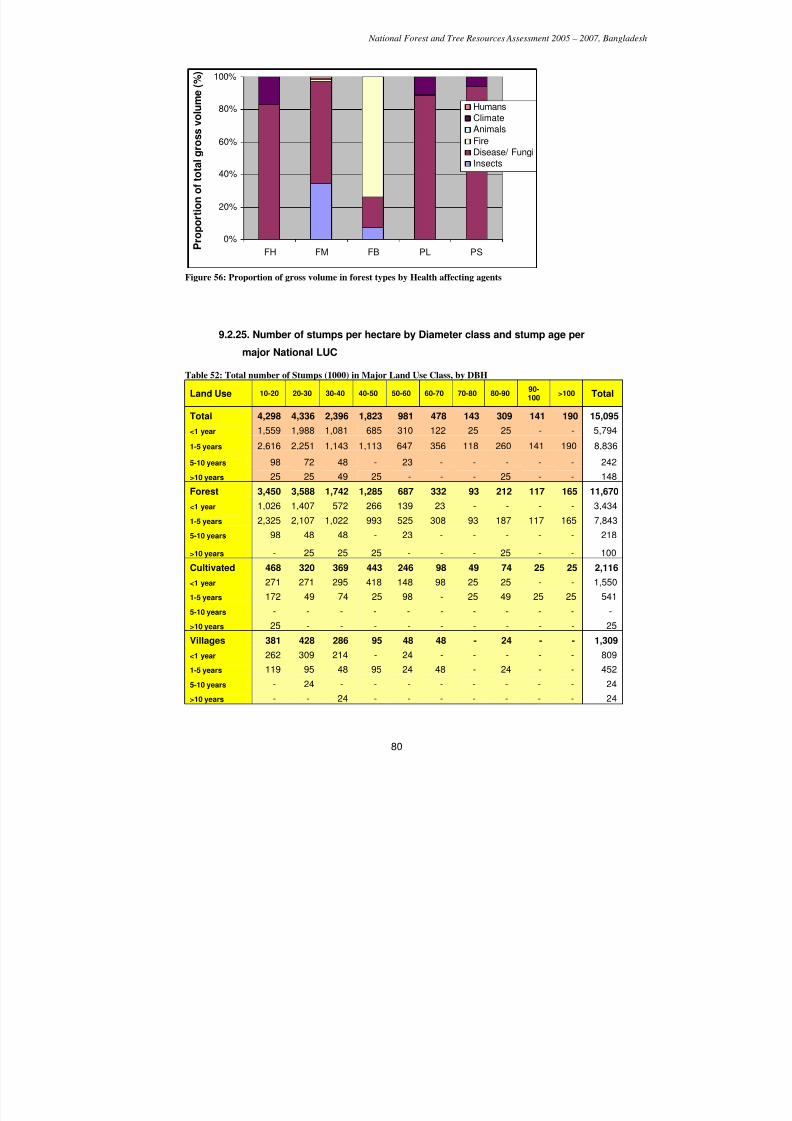
7/23/2019 NFA Final Report (1) (1)
http://slidepdf.com/reader/full/nfa-final-report-1-1 80/118
National Forest and Tree Resources Assessment 2005 – 2007, Bangladesh
80
0%
20%
40%
60%
80%
100%
FH FM FB PL PS P r o p o r t i o n o f t o t a l g r o s
s v o l u m e ( % )
HumansClimateAnimals
FireDisease/ FungiInsects
Figure 56: Proportion of gross volume in forest types by Health affecting agents
9.2.25. Number of stumps per hectare by Diameter class and stump age per
major National LUC
Table 52: Total number of Stumps (1000) in Major Land Use Class, by DBH
Land Use 10-20 20-30 30-40 40-50 50-60 60-70 70-80 80-9090-100
>100 Total
Total 4,298 4,336 2,396 1,823 981 478 143 309 141 190 15,095<1 year 1,559 1,988 1,081 685 310 122 25 25 - - 5,794
1-5 years 2,616 2,251 1,143 1,113 647 356 118 260 141 190 8,836
5-10 years 98 72 48 - 23 - - - - - 242
>10 years 25 25 49 25 - - - 25 - - 148
Forest 3,450 3,588 1,742 1,285 687 332 93 212 117 165 11,670
<1 year 1,026 1,407 572 266 139 23 - - - - 3,434
1-5 years 2,325 2,107 1,022 993 525 308 93 187 117 165 7,843
5-10 years 98 48 48 - 23 - - - - - 218
>10 years - 25 25 25 - - - 25 - - 100Cultivated 468 320 369 443 246 98 49 74 25 25 2,116
<1 year 271 271 295 418 148 98 25 25 - - 1,550
1-5 years 172 49 74 25 98 - 25 49 25 25 541
5-10 years - - - - - - - - - - -
>10 years 25 - - - - - - - - - 25
Villages 381 428 286 95 48 48 - 24 - - 1,309
<1 year 262 309 214 - 24 - - - - - 809
1-5 years 119 95 48 95 24 48 - 24 - - 452
5-10 years - 24 - - - - - - - - 24
>10 years - - 24 - - - - - - - 24
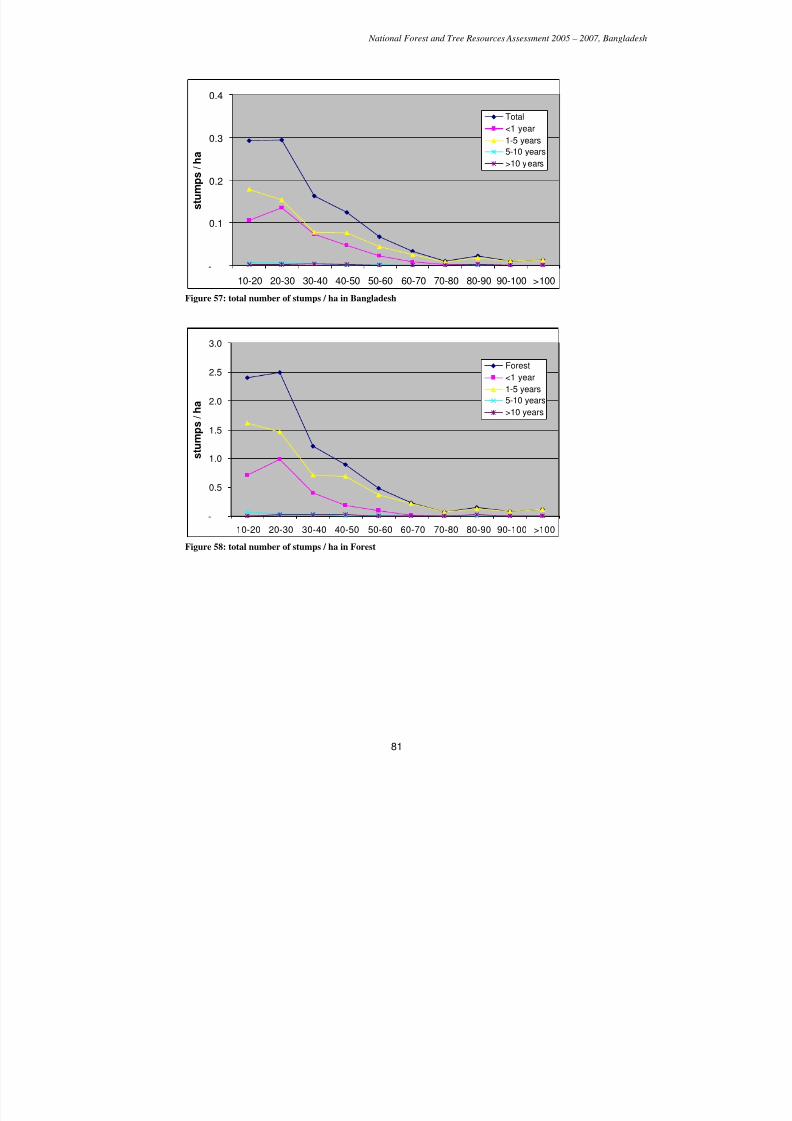
7/23/2019 NFA Final Report (1) (1)
http://slidepdf.com/reader/full/nfa-final-report-1-1 81/118
National Forest and Tree Resources Assessment 2005 – 2007, Bangladesh
81
-
0.1
0.2
0.3
0.4
10-20 20-30 30-40 40-50 50-60 60-70 70-80 80-90 90-100 >100
s t u m p s / h a
Total
<1 year
1-5 years5-10 years
>10 years
Figure 57: total number of stumps / ha in Bangladesh
-
0.5
1.0
1.5
2.0
2.5
3.0
10-20 20-30 30-40 40-50 50-60 60-70 70-80 80-90 90-100 >100
s t u m p s /
h a
Forest
<1 year
1-5 years
5-10 years
>10 years
Figure 58: total number of stumps / ha in Forest
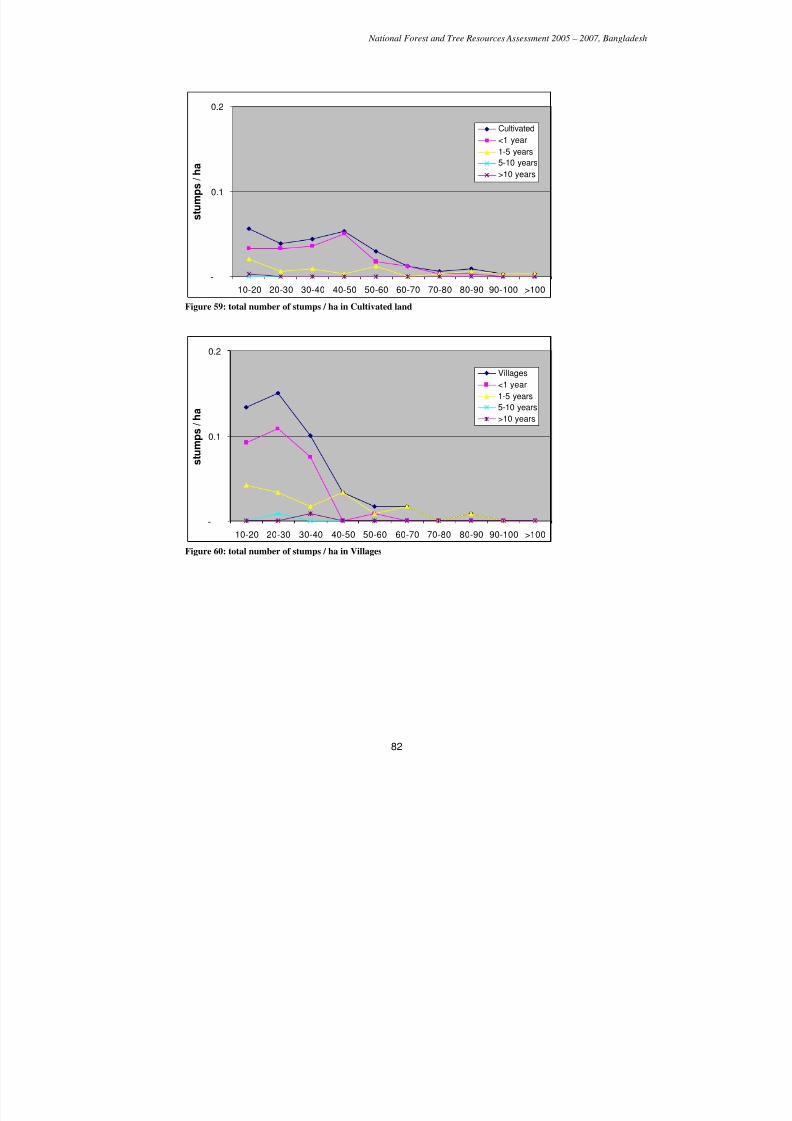
7/23/2019 NFA Final Report (1) (1)
http://slidepdf.com/reader/full/nfa-final-report-1-1 82/118
National Forest and Tree Resources Assessment 2005 – 2007, Bangladesh
82
-
0.1
0.2
10-20 20-30 30-40 40-50 50-60 60-70 70-80 80-90 90-100 >100
s t u m p s / h a
Cultivated
<1 year1-5 years
5-10 years
>10 years
Figure 59: total number of stumps / ha in Cultivated land
-
0.1
0.2
10-20 20-30 30-40 40-50 50-60 60-70 70-80 80-90 90-100 >100
s t u m p s / h a
Villages
<1 year
1-5 years
5-10 years
>10 years
Figure 60: total number of stumps / ha in Villages
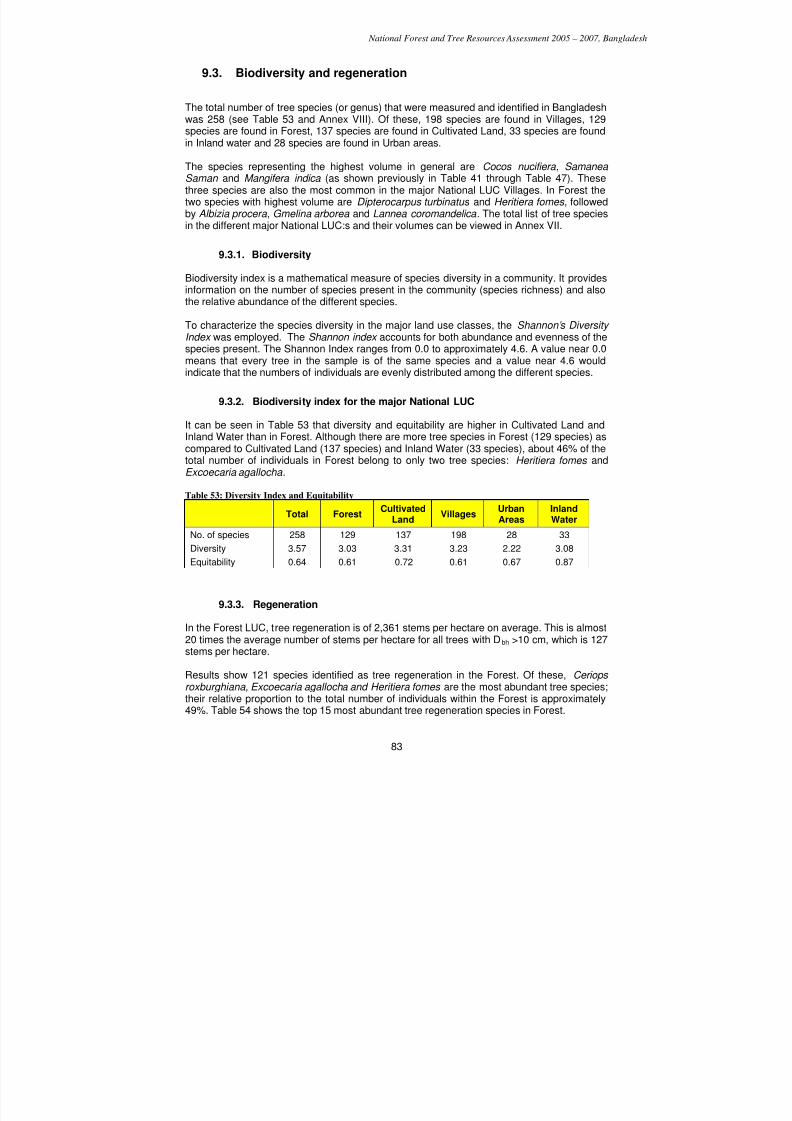
7/23/2019 NFA Final Report (1) (1)
http://slidepdf.com/reader/full/nfa-final-report-1-1 83/118
National Forest and Tree Resources Assessment 2005 – 2007, Bangladesh
83
9.3. Biodiversity and regeneration
The total number of tree species (or genus) that were measured and identified in Bangladeshwas 258 (see Table 53 and Annex VIII). Of these, 198 species are found in Villages, 129species are found in Forest, 137 species are found in Cultivated Land, 33 species are foundin Inland water and 28 species are found in Urban areas.
The species representing the highest volume in general are Cocos nucifiera , SamaneaSaman and Mangifera indica (as shown previously in Table 41 through Table 47). Thesethree species are also the most common in the major National LUC Villages. In Forest thetwo species with highest volume are Dipterocarpus turbinatus and Heritiera fomes , followedby Albizia procera , Gmelina arborea and Lannea coromandelica . The total list of tree speciesin the different major National LUC:s and their volumes can be viewed in Annex VII.
9.3.1. Biodiversity
Biodiversity index is a mathematical measure of species diversity in a community. It providesinformation on the number of species present in the community (species richness) and alsothe relative abundance of the different species.
To characterize the species diversity in the major land use classes, the Shannon’s DiversityIndex was employed. The Shannon index accounts for both abundance and evenness of thespecies present. The Shannon Index ranges from 0.0 to approximately 4.6. A value near 0.0means that every tree in the sample is of the same species and a value near 4.6 wouldindicate that the numbers of individuals are evenly distributed among the different species.
9.3.2. Biodiversity index for the major National LUC
It can be seen in Table 53 that diversity and equitability are higher in Cultivated Land andInland Water than in Forest. Although there are more tree species in Forest (129 species) ascompared to Cultivated Land (137 species) and Inland Water (33 species), about 46% of thetotal number of individuals in Forest belong to only two tree species: Heritiera fomes andExcoecaria agallocha .
Table 53: Diversity Index and Equitability
Total ForestCultivated
LandVillages
UrbanAreas
InlandWater
No. of species 258 129 137 198 28 33
Diversity 3.57 3.03 3.31 3.23 2.22 3.08
Equitability 0.64 0.61 0.72 0.61 0.67 0.87
9.3.3. Regeneration
In the Forest LUC, tree regeneration is of 2,361 stems per hectare on average. This is almost20 times the average number of stems per hectare for all trees with Dbh >10 cm, which is 127stems per hectare.
Results show 121 species identified as tree regeneration in the Forest. Of these, Ceriopsroxburghiana, Excoecaria agallocha and Heritiera fomes are the most abundant tree species;their relative proportion to the total number of individuals within the Forest is approximately49%. Table 54 shows the top 15 most abundant tree regeneration species in Forest.
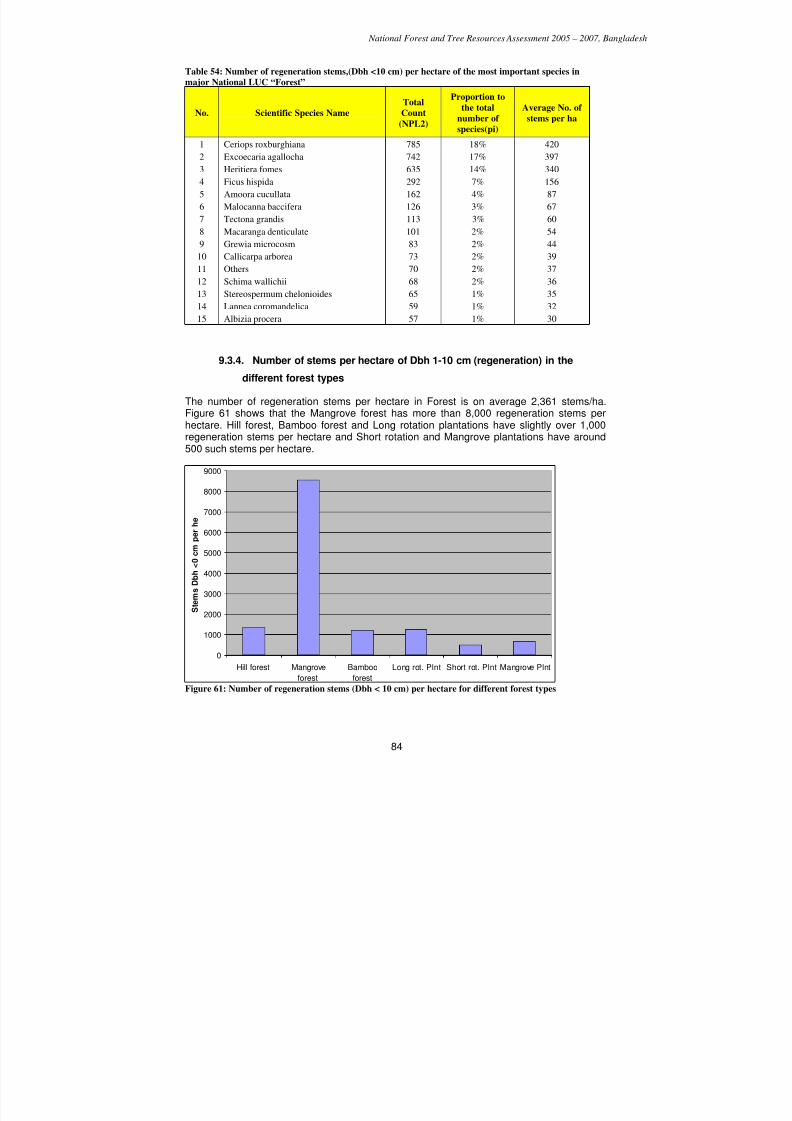
7/23/2019 NFA Final Report (1) (1)
http://slidepdf.com/reader/full/nfa-final-report-1-1 84/118
National Forest and Tree Resources Assessment 2005 – 2007, Bangladesh
84
Table 54: Number of regeneration stems,(Dbh <10 cm) per hectare of the most important species in
major National LUC “Forest”
No. Scientific Species Name
Total
Count
(NPL2)
Proportion to
the total
number of
species(pi)
Average No. of
stems per ha
1 Ceriops roxburghiana 785 18% 420
2 Excoecaria agallocha 742 17% 397
3 Heritiera fomes 635 14% 340
4 Ficus hispida 292 7% 156
5 Amoora cucullata 162 4% 87
6 Malocanna baccifera 126 3% 67
7 Tectona grandis 113 3% 60
8 Macaranga denticulate 101 2% 54
9 Grewia microcosm 83 2% 44
10 Callicarpa arborea 73 2% 39
11 Others 70 2% 37
12 Schima wallichii 68 2% 36
13 Stereospermum chelonioides 65 1% 35
14 Lannea coromandelica 59 1% 32
15 Albizia procera 57 1% 30
9.3.4. Number of stems per hectare of Dbh 1-10 cm (regeneration) in the
different forest types
The number of regeneration stems per hectare in Forest is on average 2,361 stems/ha.
Figure 61 shows that the Mangrove forest has more than 8,000 regeneration stems perhectare. Hill forest, Bamboo forest and Long rotation plantations have slightly over 1,000regeneration stems per hectare and Short rotation and Mangrove plantations have around500 such stems per hectare.
0
1000
2000
3000
4000
5000
6000
7000
8000
9000
Hill forest Mangrove
forest
Bamboo
forest
Long rot. Plnt Short rot. Plnt Mangrove Plnt
S t e m s D b h < 0 c
m p e r h e
Figure 61: Number of regeneration stems (Dbh < 10 cm) per hectare for different forest types
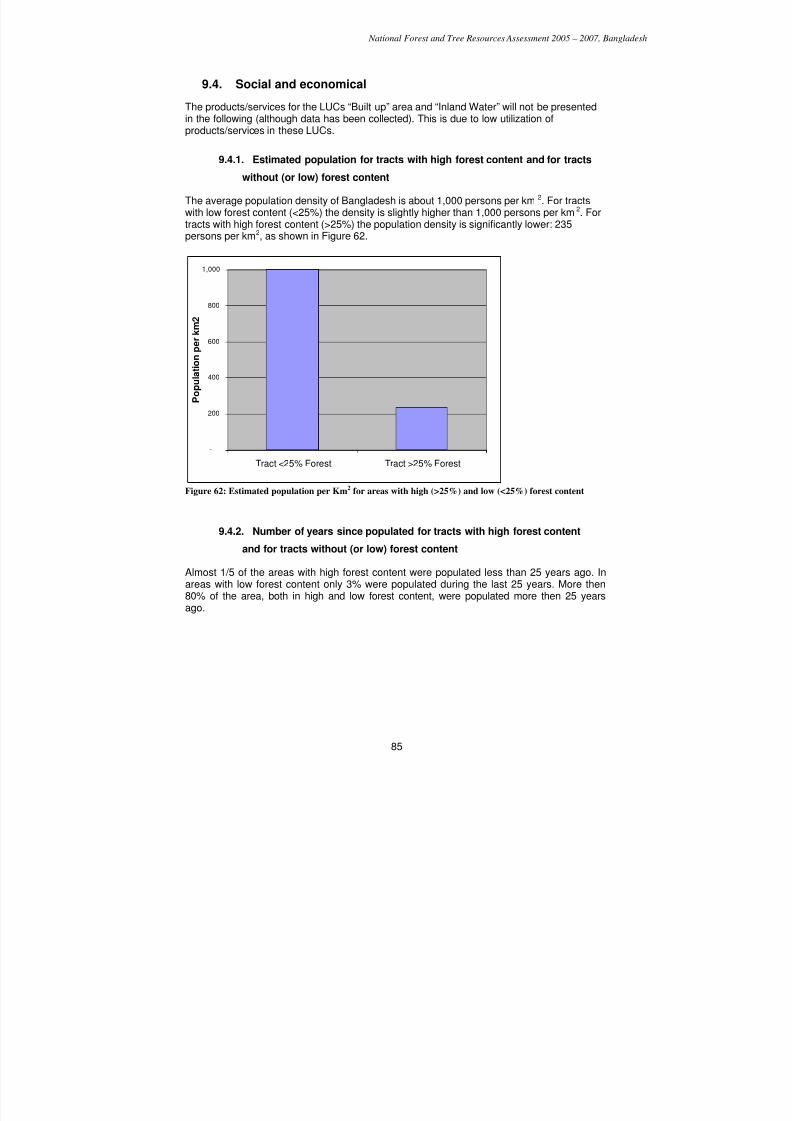
7/23/2019 NFA Final Report (1) (1)
http://slidepdf.com/reader/full/nfa-final-report-1-1 85/118
National Forest and Tree Resources Assessment 2005 – 2007, Bangladesh
85
9.4. Social and economical
The products/services for the LUCs “Built up” area and “Inland Water” will not be presentedin the following (although data has been collected). This is due to low utilization ofproducts/services in these LUCs.
9.4.1. Estimated population for tracts with high forest content and for tracts
without (or low) forest content
The average population density of Bangladesh is about 1,000 persons per km2. For tractswith low forest content (<25%) the density is slightly higher than 1,000 persons per km2. Fortracts with high forest content (>25%) the population density is significantly lower: 235persons per km2, as shown in Figure 62.
-
200
400
600
800
1,000
Tract <25% Forest Tract >25% Forest
P o p u l a t i o n p e r k m 2
Figure 62: Estimated population per Km2 for areas with high (>25%) and low (<25%) forest content
9.4.2. Number of years since populated for tracts with high forest content
and for tracts without (or low) forest content
Almost 1/5 of the areas with high forest content were populated less than 25 years ago. Inareas with low forest content only 3% were populated during the last 25 years. More then80% of the area, both in high and low forest content, were populated more then 25 yearsago.
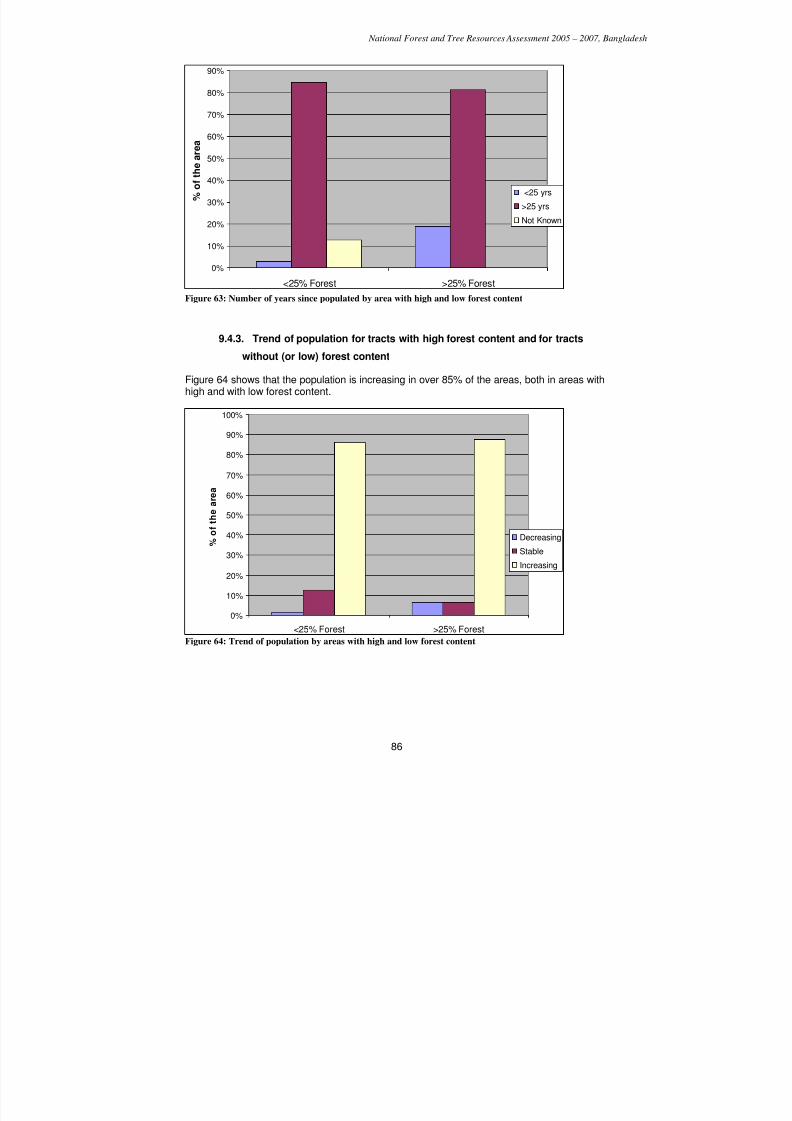
7/23/2019 NFA Final Report (1) (1)
http://slidepdf.com/reader/full/nfa-final-report-1-1 86/118
National Forest and Tree Resources Assessment 2005 – 2007, Bangladesh
86
0%
10%
20%
30%
40%
50%
60%
70%
80%
90%
<25% Forest >25% Forest
% o f t h e a r e a
<25 yrs
>25 yrs
Not Known
Figure 63: Number of years since populated by area with high and low forest content
9.4.3. Trend of population for tracts with high forest content and for tracts
without (or low) forest content
Figure 64 shows that the population is increasing in over 85% of the areas, both in areas withhigh and with low forest content.
0%
10%
20%
30%
40%
50%
60%
70%
80%
90%
100%
<25% Forest >25% Forest
% o f t h e a r e a
Decreasing
StableIncreasing
Figure 64: Trend of population by areas with high and low forest content
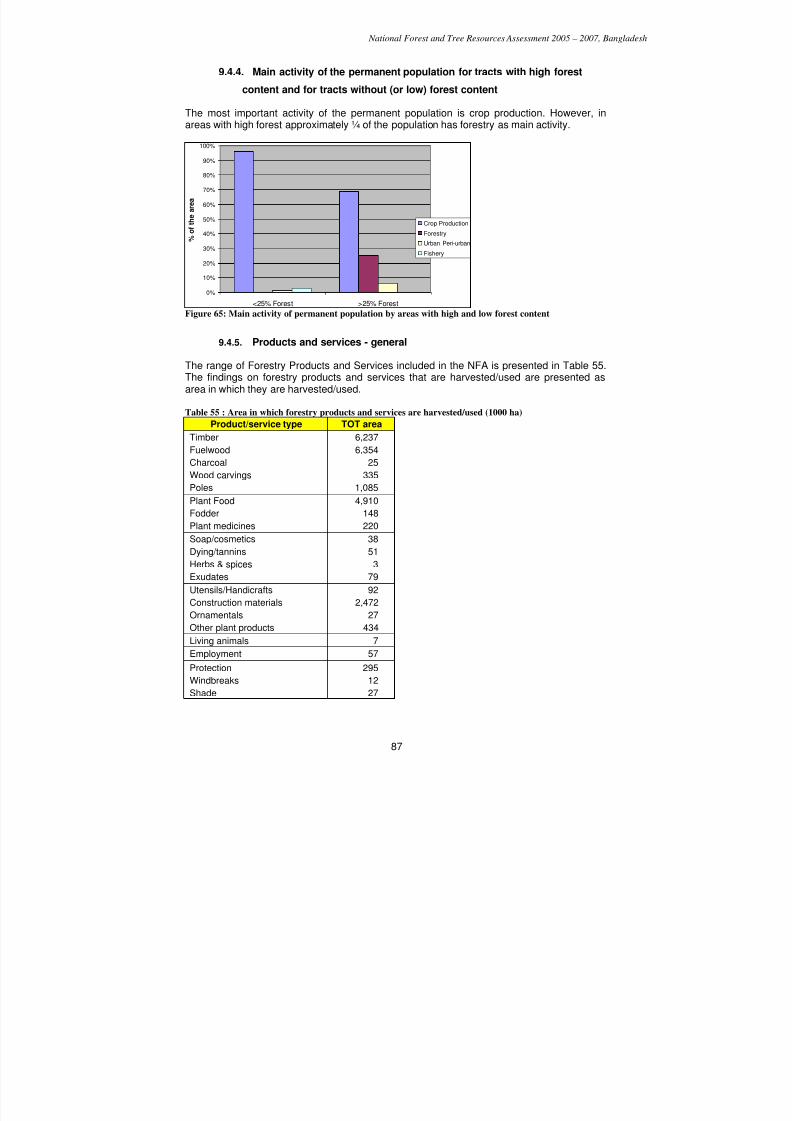
7/23/2019 NFA Final Report (1) (1)
http://slidepdf.com/reader/full/nfa-final-report-1-1 87/118
National Forest and Tree Resources Assessment 2005 – 2007, Bangladesh
87
9.4.4. Main activity of the permanent population for tracts with high forest
content and for tracts without (or low) forest content
The most important activity of the permanent population is crop production. However, inareas with high forest approximately ¼ of the population has forestry as main activity.
0%
10%
20%
30%
40%
50%
60%
70%
80%
90%
100%
<25% Forest >25% Forest
% o f t h e a r e a
Crop Production
Forestry
Urban Peri-urban
Fishery
Figure 65: Main activity of permanent population by areas with high and low forest content
9.4.5. Products and services - general
The range of Forestry Products and Services included in the NFA is presented in Table 55.The findings on forestry products and services that are harvested/used are presented asarea in which they are harvested/used.
Table 55 : Area in which forestry products and services are harvested/used (1000 ha)Product/service type TOT area
Timber 6,237
Fuelwood 6,354
Charcoal 25
Wood carvings 335
Poles 1,085
Plant Food 4,910
Fodder 148
Plant medicines 220
Soap/cosmetics 38
Dying/tannins 51Herbs & spices 3
Exudates 79
Utensils/Handicrafts 92
Construction materials 2,472
Ornamentals 27
Other plant products 434
Living animals 7
Employment 57
Protection 295
Windbreaks 12
Shade 27
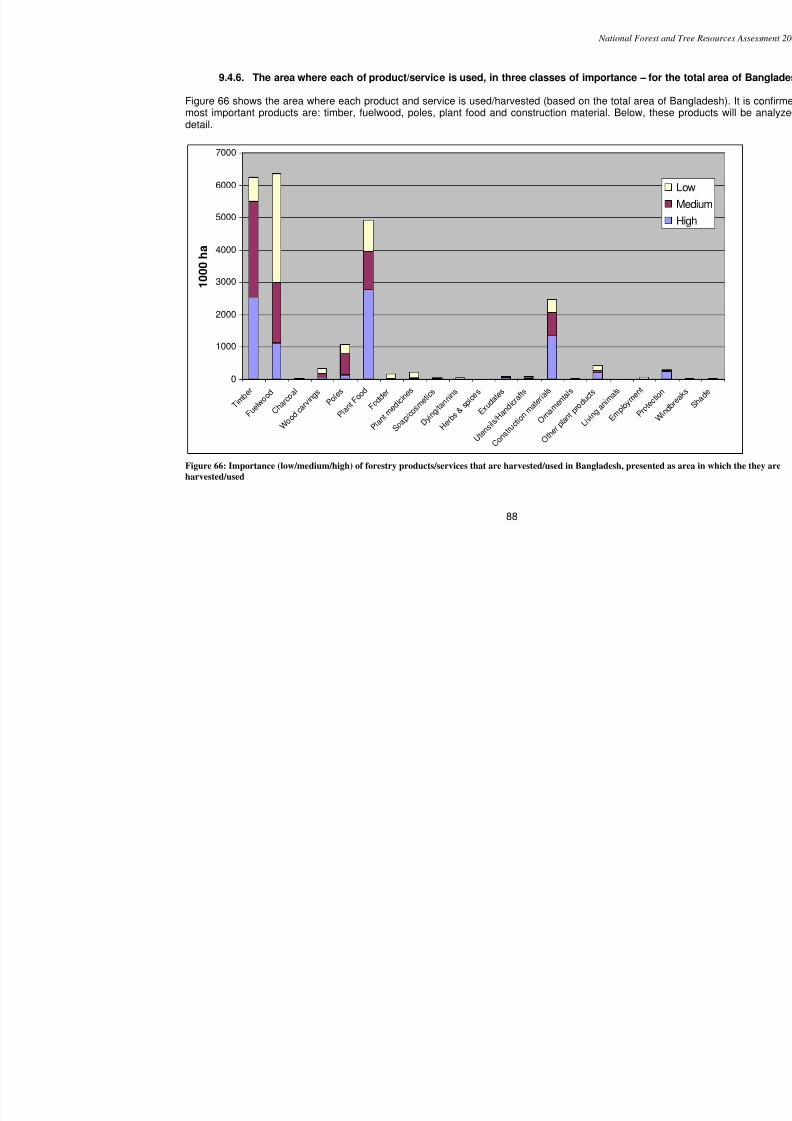
7/23/2019 NFA Final Report (1) (1)
http://slidepdf.com/reader/full/nfa-final-report-1-1 88/118
National Forest and
88
9.4.6. The area where each of product/service is used, in three classes of importance – for th
Figure 66 shows the area where each product and service is used/harvested (based on the total area of Bmost important products are: timber, fuelwood, poles, plant food and construction material. Below, thesedetail.
0
1000
2000
3000
4000
5000
6000
7000
T i m b e
r
F u
e l w o o d
C
h a r c o a l
W o o d c
a r v i n g s
P o l e s
P l a n t F
o o d
F o d d e r
P l a n t m
e d i c i n
e s
S o a p / c o
s m e t i c s
D y i n g / t a n n i n s
H e r b s &
s p i c e
s
E x u d a t e s
U t e n s i l s / H a n
d i c r a f t s
C o n s t r u
c t i o n m
a t e r i a l s
O r n a m e n t a l s
O t h e r p l a n t p
r o d u c t s
L i v i n g a n i m a l s
E m p l o y m e n t
P r o t e c t i o n
W i n d b r
1 0 0 0 h
a
Figure 66: Importance (low/medium/high) of forestry products/services that are harvested/used in Bangladesh, presented as
harvested/used
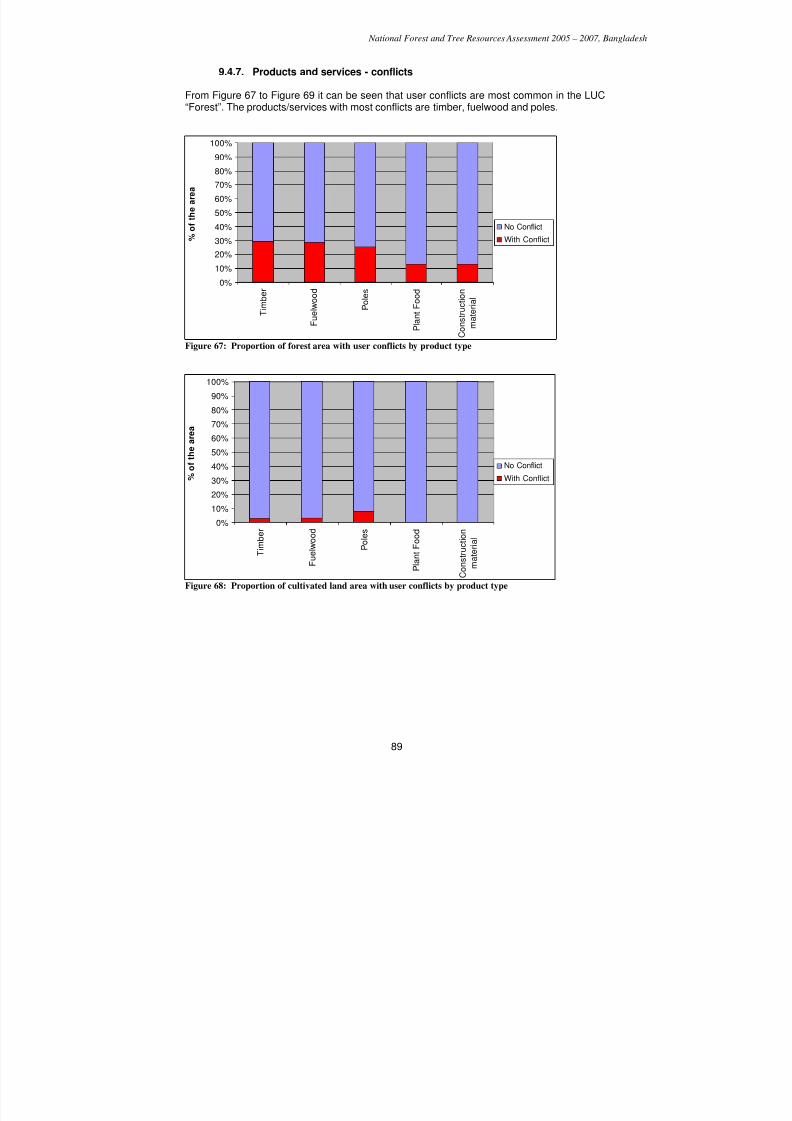
7/23/2019 NFA Final Report (1) (1)
http://slidepdf.com/reader/full/nfa-final-report-1-1 89/118
National Forest and Tree Resources Assessment 2005 – 2007, Bangladesh
89
9.4.7. Products and services - conflicts
From Figure 67 to Figure 69 it can be seen that user conflicts are most common in the LUC“Forest”. The products/services with most conflicts are timber, fuelwood and poles.
0%
10%
20%
30%
40%
50%
60%
70%
80%
90%
100%
T i m b e r
F u e l w o o d
P o l e s
P l a n t F o o d
C o n s t r u c t i o n
m a t e r i a l
% o f t h e a r e a
No Conflict
With Conflict
Figure 67: Proportion of forest area with user conflicts by product type
0%
10%
20%
30%
40%
50%
60%
70%
80%
90%
100%
T
i m b e r
F u e
l w o o d
P o l e s
P l a n t F o o d
C o n s t r
u c t i o n
m a t e r i a l
%
o f t h e a r e a
No Conflict
With Conflict
Figure 68: Proportion of cultivated land area with user conflicts by product type
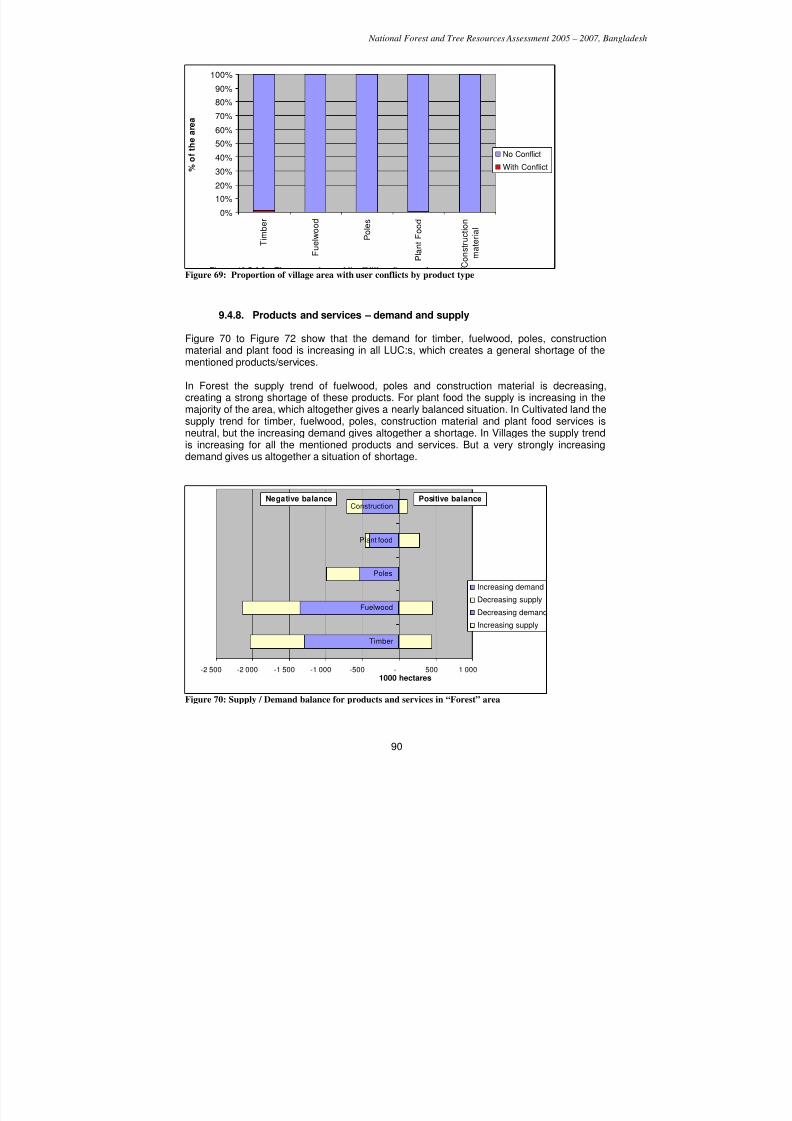
7/23/2019 NFA Final Report (1) (1)
http://slidepdf.com/reader/full/nfa-final-report-1-1 90/118
National Forest and Tree Resources Assessment 2005 – 2007, Bangladesh
90
0%
10%
20%
30%
40%
50%
60%
70%
80%
90%
100%
T i m b e r
F u e l w o o d
P o l e s
P l a n t F o o d
C o n s t r u c t i o n
m a t e r i a l
% o f t h e
a r e a
No Conflict
With Conflict
Figure 69: Proportion of village area with user conflicts by product type
9.4.8. Products and services – demand and supply
Figure 70 to Figure 72 show that the demand for timber, fuelwood, poles, constructionmaterial and plant food is increasing in all LUC:s, which creates a general shortage of thementioned products/services.
In Forest the supply trend of fuelwood, poles and construction material is decreasing,creating a strong shortage of these products. For plant food the supply is increasing in themajority of the area, which altogether gives a nearly balanced situation. In Cultivated land thesupply trend for timber, fuelwood, poles, construction material and plant food services isneutral, but the increasing demand gives altogether a shortage. In Villages the supply trendis increasing for all the mentioned products and services. But a very strongly increasingdemand gives us altogether a situation of shortage.
-2 500 -2 000 -1 500 -1 000 -500 - 500 1 000
Timber
Fuelwood
Poles
Plant food
Construction
1000 hectares
Increasing demand
Decreasing supply
Decreasing demand
Increasing supply
Negative balance Positive balance
Figure 70: Supply / Demand balance for products and services in “Forest” area
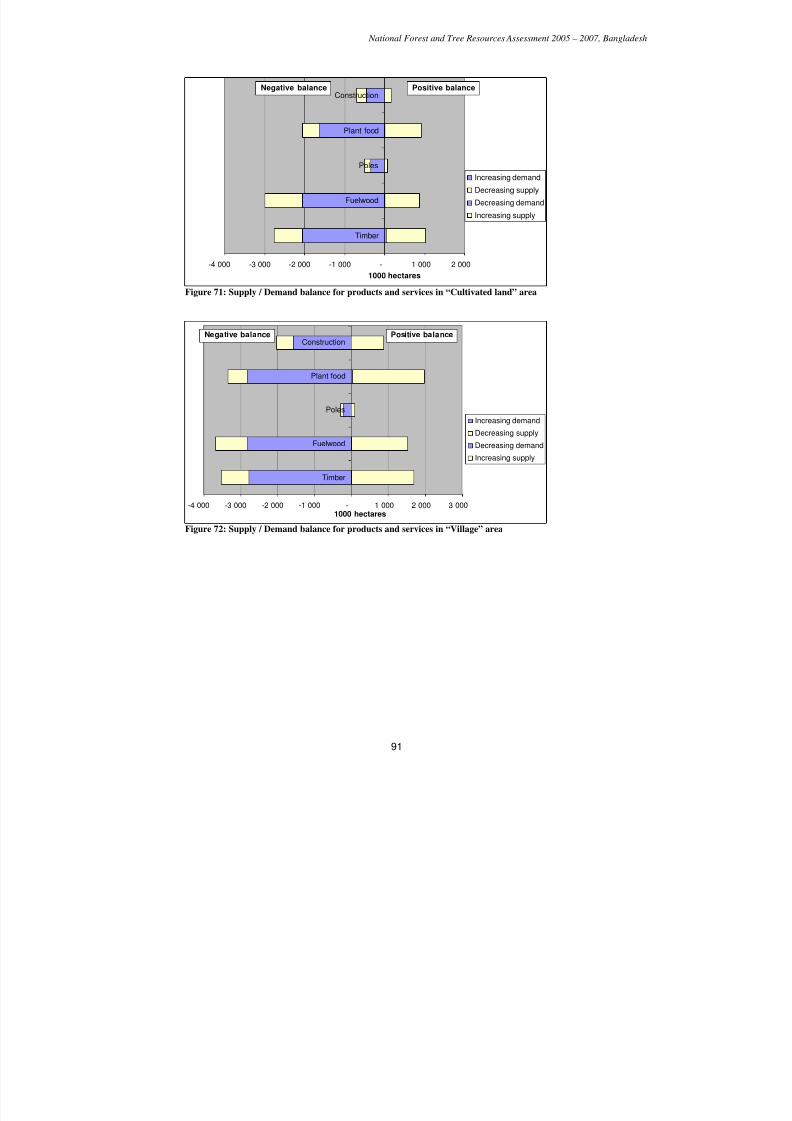
7/23/2019 NFA Final Report (1) (1)
http://slidepdf.com/reader/full/nfa-final-report-1-1 91/118
National Forest and Tree Resources Assessment 2005 – 2007, Bangladesh
91
-4 000 -3 000 -2 000 -1 000 - 1 000 2 000
Timber
Fuelwood
Poles
Plant food
Construction
1000 hectares
Increasing demand
Decreasing supply
Decreasing demand
Increasing supply
Positive balanceNegative balance
Figure 71: Supply / Demand balance for products and services in “Cultivated land” area
-4 000 -3 000 -2 000 -1 000 - 1 000 2 000 3 000
Timber
Fuelwood
Poles
Plant food
Construction
1000 hectares
Increasing demand
Decreasing supply
Decreasing demand
Increasing supply
Negative balance Positive balance
Figure 72: Supply / Demand balance for products and services in “Village” area
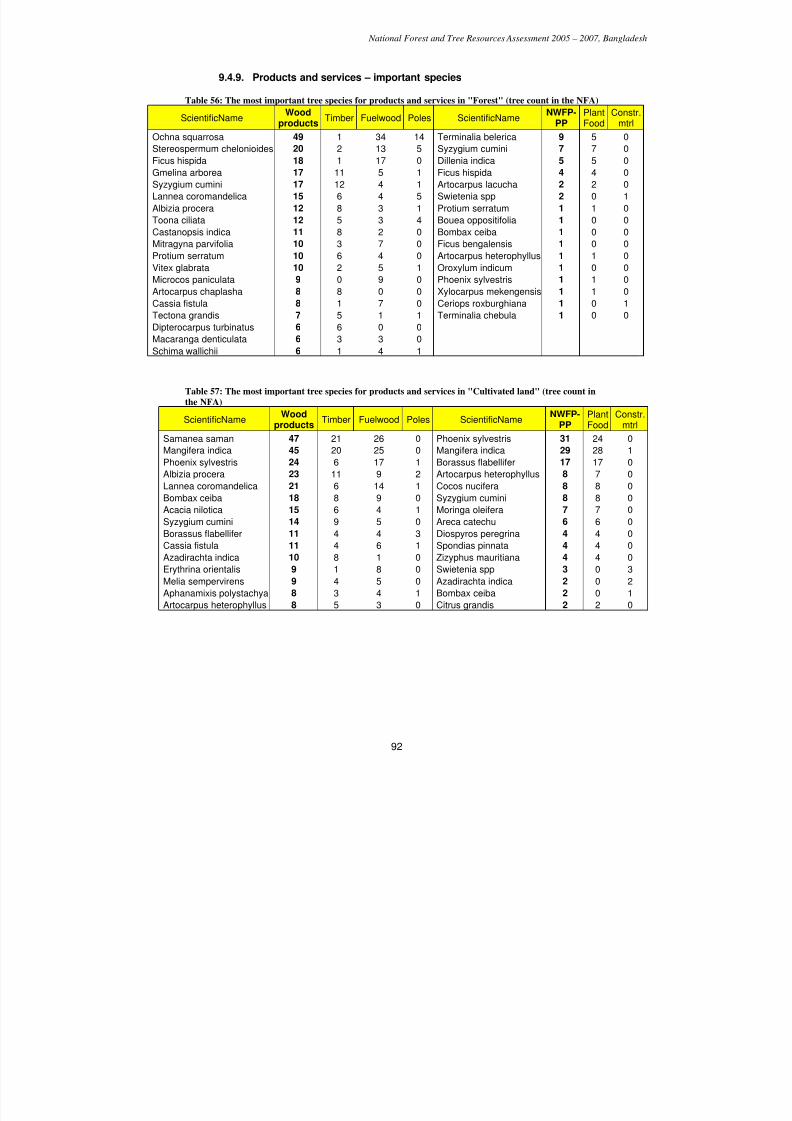
7/23/2019 NFA Final Report (1) (1)
http://slidepdf.com/reader/full/nfa-final-report-1-1 92/118
National Forest and Tree Resources Assessment 2005 – 2007, Bangladesh
92
9.4.9. Products and services – important species
Table 56: The most important tree species for products and services in "Forest" (tree count in the NFA)
ScientificNameWood
productsTimber Fuelwood Poles ScientificName
NWFP-PP
PlantFood
Constr.mtrl
Ochna squarrosa 49 1 34 14 Terminalia belerica 9 5 0Stereospermum chelonioides 20 2 13 5 Syzygium cumini 7 7 0
Ficus hispida 18 1 17 0 Dillenia indica 5 5 0
Gmelina arborea 17 11 5 1 Ficus hispida 4 4 0
Syzygium cumini 17 12 4 1 Artocarpus lacucha 2 2 0
Lannea coromandelica 15 6 4 5 Swietenia spp 2 0 1
Albizia procera 12 8 3 1 Protium serratum 1 1 0
Toona ciliata 12 5 3 4 Bouea oppositifolia 1 0 0
Castanopsis indica 11 8 2 0 Bombax ceiba 1 0 0
Mitragyna parvifolia 10 3 7 0 Ficus bengalensis 1 0 0
Protium serratum 10 6 4 0 Artocarpus heterophyllus 1 1 0
Vitex glabrata 10 2 5 1 Oroxylum indicum 1 0 0
Microcos paniculata 9 0 9 0 Phoenix sylvestris 1 1 0Artocarpus chaplasha 8 8 0 0 Xylocarpus mekengensis 1 1 0
Cassia fistula 8 1 7 0 Ceriops roxburghiana 1 0 1
Tectona grandis 7 5 1 1 Terminalia chebula 1 0 0
Dipterocarpus turbinatus 6 6 0 0
Macaranga denticulata 6 3 3 0
Schima wallichii 6 1 4 1
Table 57: The most important tree species for products and services in "Cultivated land" (tree count in
the NFA)
ScientificName Woodproducts
Timber Fuelwood Poles ScientificName NWFP-PP
PlantFood
Constr.mtrl
Samanea saman 47 21 26 0 Phoenix sylvestris 31 24 0
Mangifera indica 45 20 25 0 Mangifera indica 29 28 1
Phoenix sylvestris 24 6 17 1 Borassus flabellifer 17 17 0
Albizia procera 23 11 9 2 Artocarpus heterophyllus 8 7 0
Lannea coromandelica 21 6 14 1 Cocos nucifera 8 8 0
Bombax ceiba 18 8 9 0 Syzygium cumini 8 8 0
Acacia nilotica 15 6 4 1 Moringa oleifera 7 7 0
Syzygium cumini 14 9 5 0 Areca catechu 6 6 0
Borassus flabellifer 11 4 4 3 Diospyros peregrina 4 4 0
Cassia fistula 11 4 6 1 Spondias pinnata 4 4 0
Azadirachta indica 10 8 1 0 Zizyphus mauritiana 4 4 0Erythrina orientalis 9 1 8 0 Swietenia spp 3 0 3
Melia sempervirens 9 4 5 0 Azadirachta indica 2 0 2
Aphanamixis polystachya 8 3 4 1 Bombax ceiba 2 0 1
Artocarpus heterophyllus 8 5 3 0 Citrus grandis 2 2 0
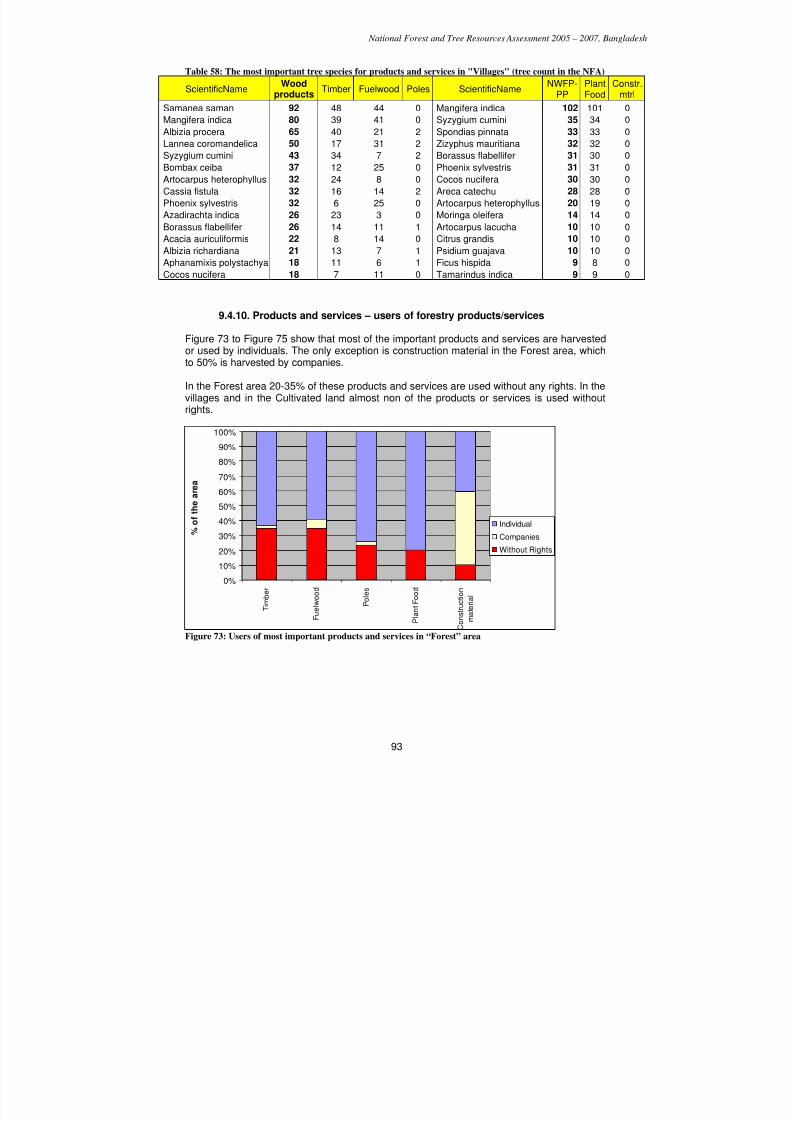
7/23/2019 NFA Final Report (1) (1)
http://slidepdf.com/reader/full/nfa-final-report-1-1 93/118
National Forest and Tree Resources Assessment 2005 – 2007, Bangladesh
93
Table 58: The most important tree species for products and services in "Villages" (tree count in the NFA)
ScientificNameWood
productsTimber Fuelwood Poles ScientificName
NWFP-PP
PlantFood
Constr.mtrl
Samanea saman 92 48 44 0 Mangifera indica 102 101 0
Mangifera indica 80 39 41 0 Syzygium cumini 35 34 0
Albizia procera 65 40 21 2 Spondias pinnata 33 33 0
Lannea coromandelica 50 17 31 2 Zizyphus mauritiana 32 32 0
Syzygium cumini 43 34 7 2 Borassus flabellifer 31 30 0
Bombax ceiba 37 12 25 0 Phoenix sylvestris 31 31 0
Artocarpus heterophyllus 32 24 8 0 Cocos nucifera 30 30 0
Cassia fistula 32 16 14 2 Areca catechu 28 28 0
Phoenix sylvestris 32 6 25 0 Artocarpus heterophyllus 20 19 0
Azadirachta indica 26 23 3 0 Moringa oleifera 14 14 0
Borassus flabellifer 26 14 11 1 Artocarpus lacucha 10 10 0
Acacia auriculiformis 22 8 14 0 Citrus grandis 10 10 0
Albizia richardiana 21 13 7 1 Psidium guajava 10 10 0
Aphanamixis polystachya 18 11 6 1 Ficus hispida 9 8 0
Cocos nucifera 18 7 11 0 Tamarindus indica 9 9 0
9.4.10. Products and services – users of forestry products/services
Figure 73 to Figure 75 show that most of the important products and services are harvestedor used by individuals. The only exception is construction material in the Forest area, whichto 50% is harvested by companies.
In the Forest area 20-35% of these products and services are used without any rights. In thevillages and in the Cultivated land almost non of the products or services is used withoutrights.
0%
10%20%
30%
40%
50%
60%
70%
80%
90%
100%
T i m b e r
F u e l w o o d
P o l e s
P l a n t F o o d
C o n s t r u c t i o n
m a t e r i a l
% o f t h e a r e a
Individual
Companies
Without Rights
Figure 73: Users of most important products and services in “Forest” area
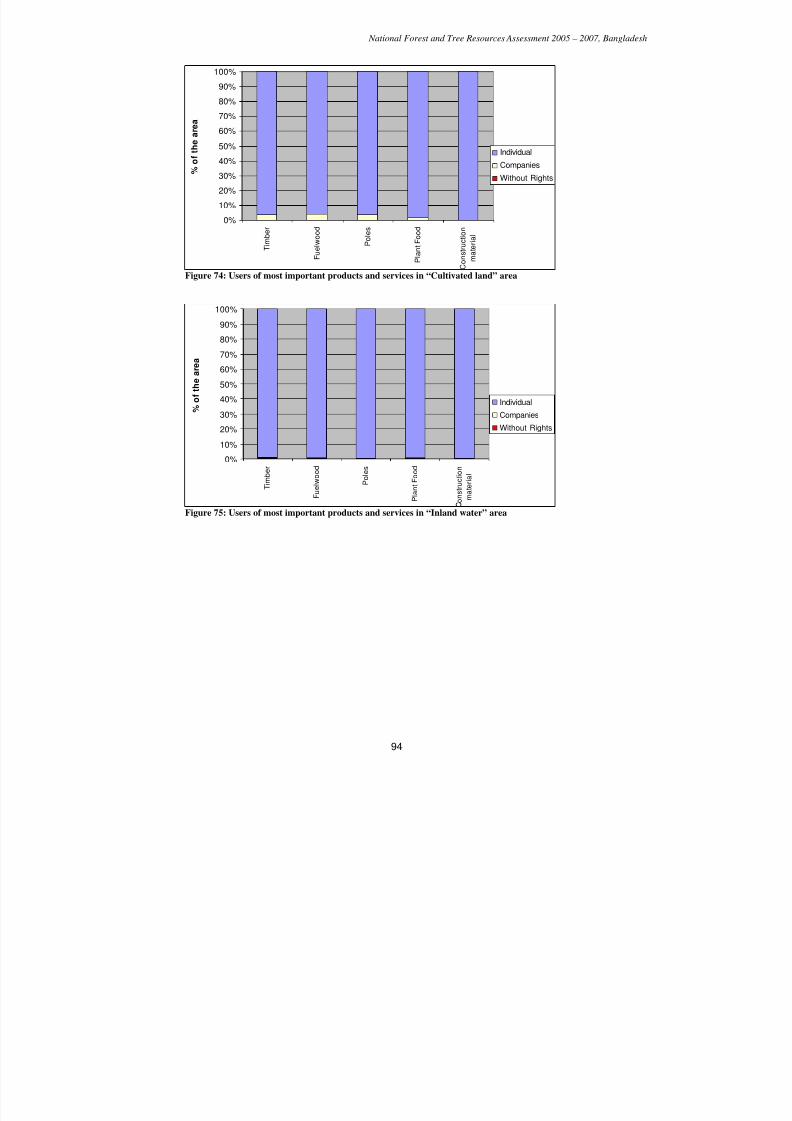
7/23/2019 NFA Final Report (1) (1)
http://slidepdf.com/reader/full/nfa-final-report-1-1 94/118
National Forest and Tree Resources Assessment 2005 – 2007, Bangladesh
94
0%
10%
20%
30%
40%
50%
60%
70%
80%
90%
100%
T i m b e r
F u e l w o o d
P o l e s
P l a n t F o o d
C o n s t r u c t i o n
m a t e r i a l
% o f t h e a r e a
Individual
Companies
Without Rights
Figure 74: Users of most important products and services in “Cultivated land” area
0%
10%
20%30%
40%
50%
60%
70%
80%
90%
100%
T i m b e r
F u e l w o o d
P o l e s
P l a n t F o o d
o n s t r u c t i o n
m a t e r i a l
% o f t h e a r e a
Individual
CompaniesWithout Rights
Figure 75: Users of most important products and services in “Inland water” area
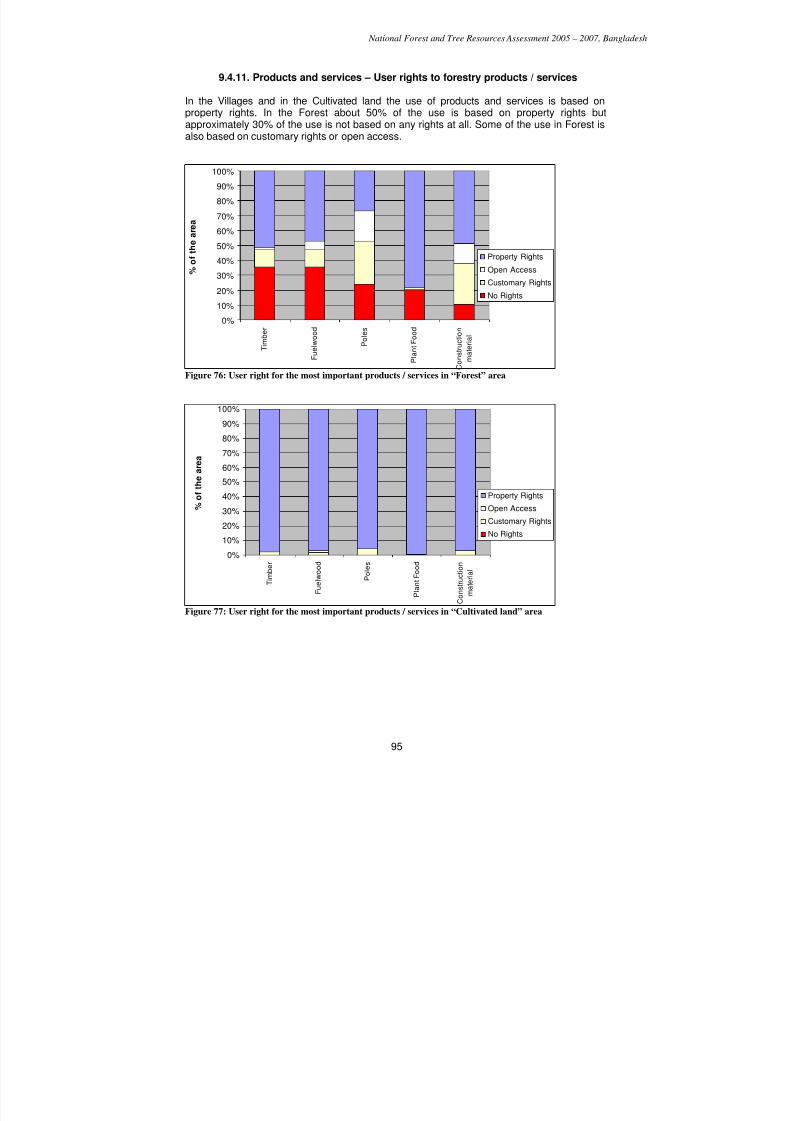
7/23/2019 NFA Final Report (1) (1)
http://slidepdf.com/reader/full/nfa-final-report-1-1 95/118
National Forest and Tree Resources Assessment 2005 – 2007, Bangladesh
95
9.4.11. Products and services – User rights to forestry products / services
In the Villages and in the Cultivated land the use of products and services is based onproperty rights. In the Forest about 50% of the use is based on property rights butapproximately 30% of the use is not based on any rights at all. Some of the use in Forest is
also based on customary rights or open access.
0%
10%
20%30%
40%
50%
60%
70%
80%
90%
100%
T i m b e r
F u e l w o o d
P o l e s
P l a n t F o o d
C o n s t r u c t i o n
m a t e r i a l
% o f t h e a r e a
Property Rights
Open Access
Customary Rights
No Rights
Figure 76: User right for the most important products / services in “Forest” area
0%
10%
20%
30%
40%
50%
60%
70%
80%
90%
100%
T i m b e r
F u e l w o o d
P o l e s
P l a n t F o o d
C o n s t r u c t i o n
m a t e r i a l
%
o f t h e a r e a
Property Rights
Open Access
Customary Rights
No Rights
Figure 77: User right for the most important products / services in “Cultivated land” area
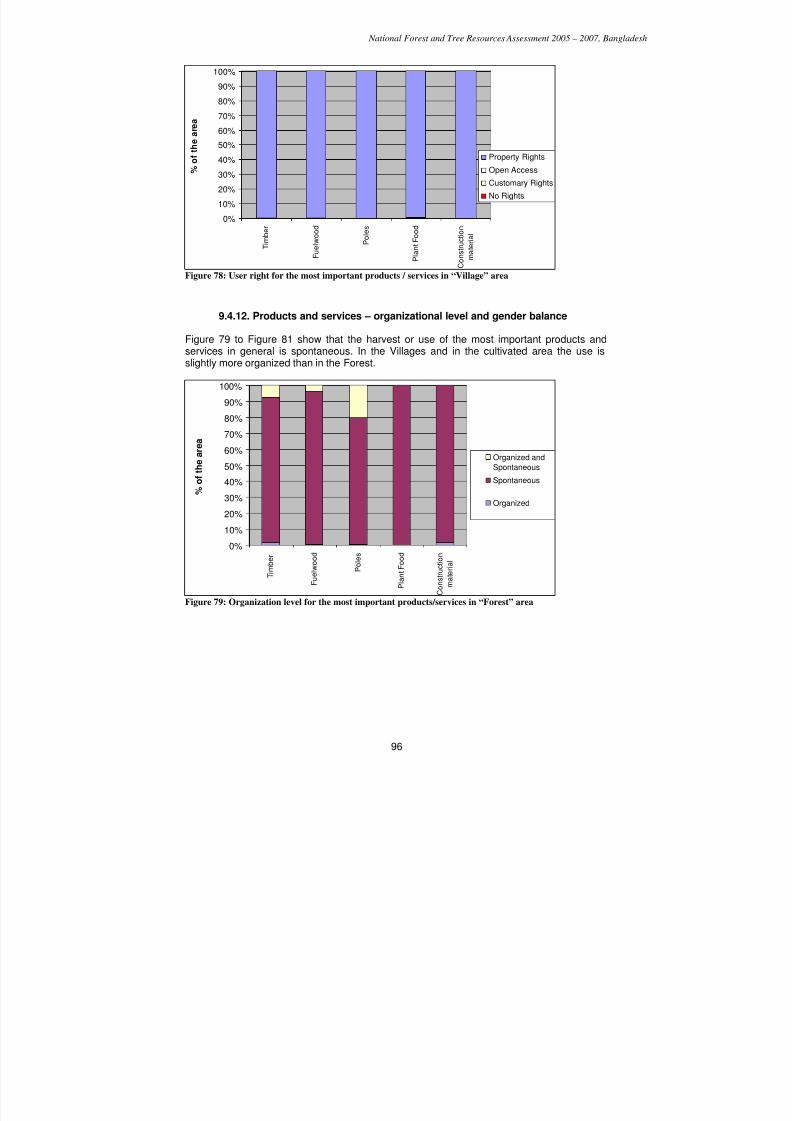
7/23/2019 NFA Final Report (1) (1)
http://slidepdf.com/reader/full/nfa-final-report-1-1 96/118
National Forest and Tree Resources Assessment 2005 – 2007, Bangladesh
96
0%
10%
20%
30%
40%
50%
60%
70%
80%
90%
100%
T i m b e r
F u e l w o o d
P o l e s
P l a n t F o o d
C o n s t r u c t i o n
m a t e r i a l
% o f t h e
a r e a
Property Rights
Open Access
Customary Rights
No Rights
Figure 78: User right for the most important products / services in “Village” area
9.4.12. Products and services – organizational level and gender balance
Figure 79 to Figure 81 show that the harvest or use of the most important products andservices in general is spontaneous. In the Villages and in the cultivated area the use isslightly more organized than in the Forest.
0%
10%
20%
30%
40%
50%
60%
70%
80%
90%
100%
T i m b e r
F u e l w o o d
P o l e s
P l a n t F o o d
C o n s t r u c t i o n
m a t e r i a l
% o f t h e a r e a
Organized and
Spontaneous
Spontaneous
Organized
Figure 79: Organization level for the most important products/services in “Forest” area
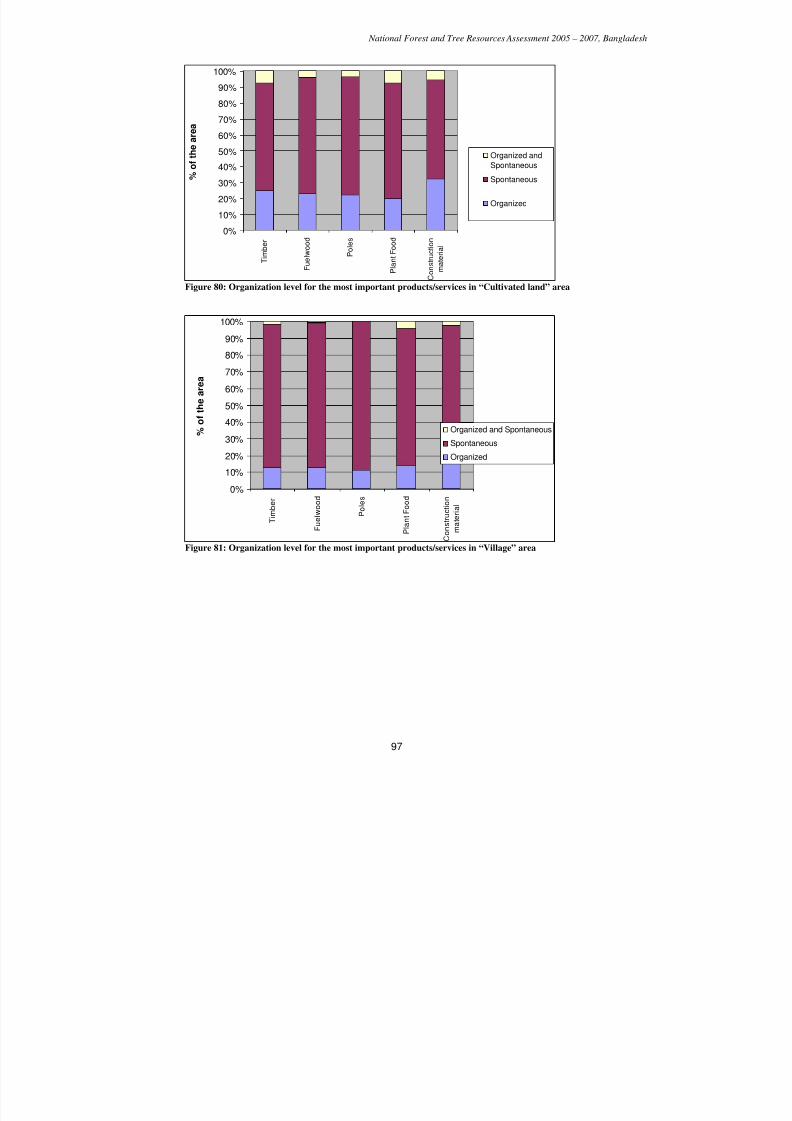
7/23/2019 NFA Final Report (1) (1)
http://slidepdf.com/reader/full/nfa-final-report-1-1 97/118
National Forest and Tree Resources Assessment 2005 – 2007, Bangladesh
97
0%
10%
20%
30%
40%
50%60%
70%
80%
90%
100%
T i m b e r
F u e l w o o d
P o l e s
P l a n t F o o d
C
o n s t r u c t i o n
m a t e r i a l
% o f t h e a r e a
Organized and
Spontaneous
Spontaneous
Organized
Figure 80: Organization level for the most important products/services in “Cultivated land” area
0%
10%
20%
30%
40%
50%
60%
70%
80%
90%
100%
T i m b e r
F u e l w o o d
P o l e s
P l a n t F o o d
C o n s t r u c t i o n
m a t e r i a l
% o f
t h e a r e a
Organized and Spontaneous
Spontaneous
Organized
Figure 81: Organization level for the most important products/services in “Village” area
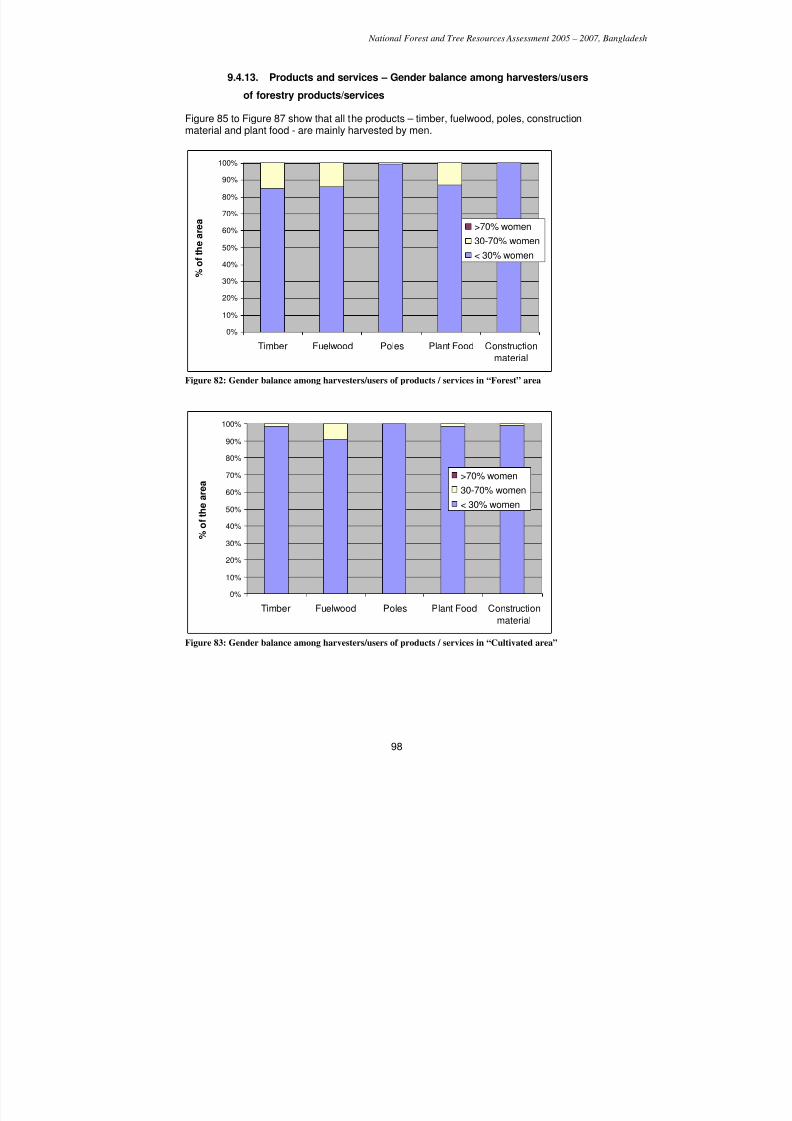
7/23/2019 NFA Final Report (1) (1)
http://slidepdf.com/reader/full/nfa-final-report-1-1 98/118
National Forest and Tree Resources Assessment 2005 – 2007, Bangladesh
98
9.4.13. Products and services – Gender balance among harvesters/users
of forestry products/services
Figure 85 to Figure 87 show that all the products – timber, fuelwood, poles, constructionmaterial and plant food - are mainly harvested by men.
0%
10%
20%
30%
40%
50%
60%
70%
80%
90%
100%
Timber Fuelwood Poles Plant Food Construction
material
%
o f t h e a r e a
>70% women
30-70% women
< 30% women
Figure 82: Gender balance among harvesters/users of products / services in “Forest” area
0%
10%
20%
30%
40%
50%
60%
70%
80%
90%
100%
Timber Fuelwood Poles Plant Food Construction
material
% o
f t h e a r e a
>70% women
30-70% women
< 30% women
Figure 83: Gender balance among harvesters/users of products / services in “Cultivated area”
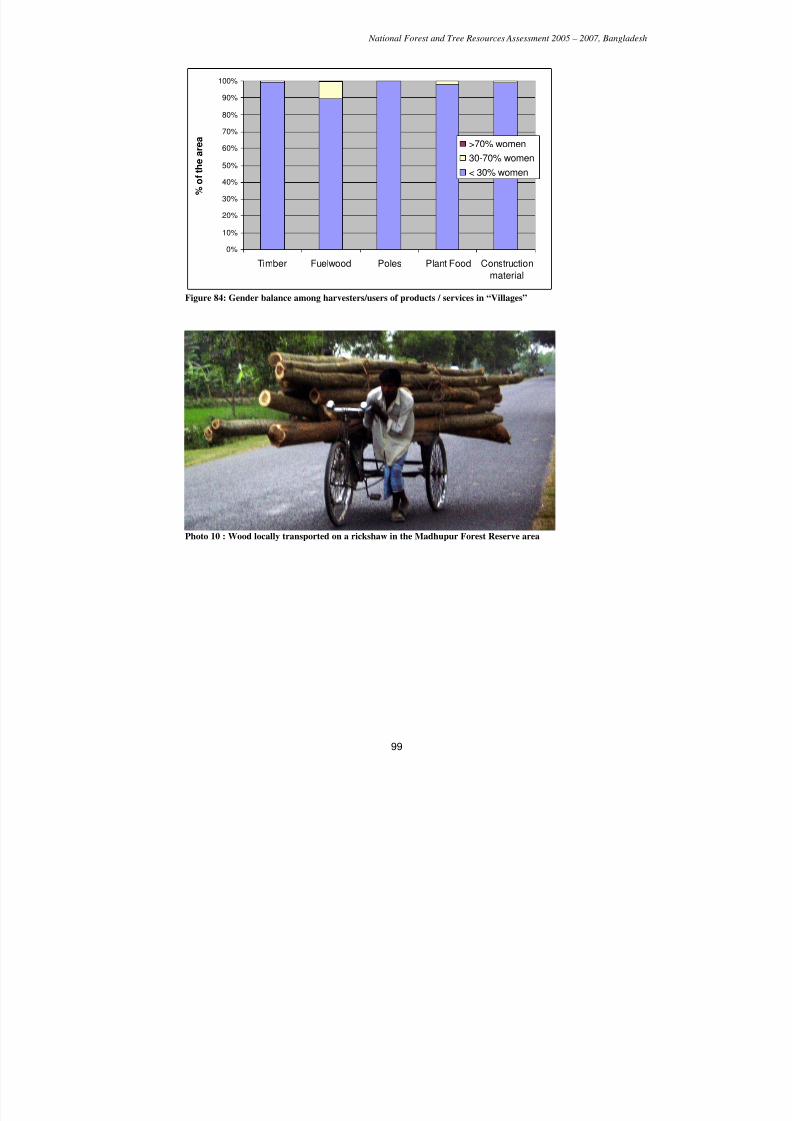
7/23/2019 NFA Final Report (1) (1)
http://slidepdf.com/reader/full/nfa-final-report-1-1 99/118
National Forest and Tree Resources Assessment 2005 – 2007, Bangladesh
99
0%
10%
20%
30%
40%
50%
60%
70%
80%
90%
100%
Timber Fuelwood Poles Plant Food Construction
material
% o
f t h e a r e a >70% women
30-70% women
< 30% women
Figure 84: Gender balance among harvesters/users of products / services in “Villages”
Photo 10 : Wood locally transported on a rickshaw in the Madhupur Forest Reserve area
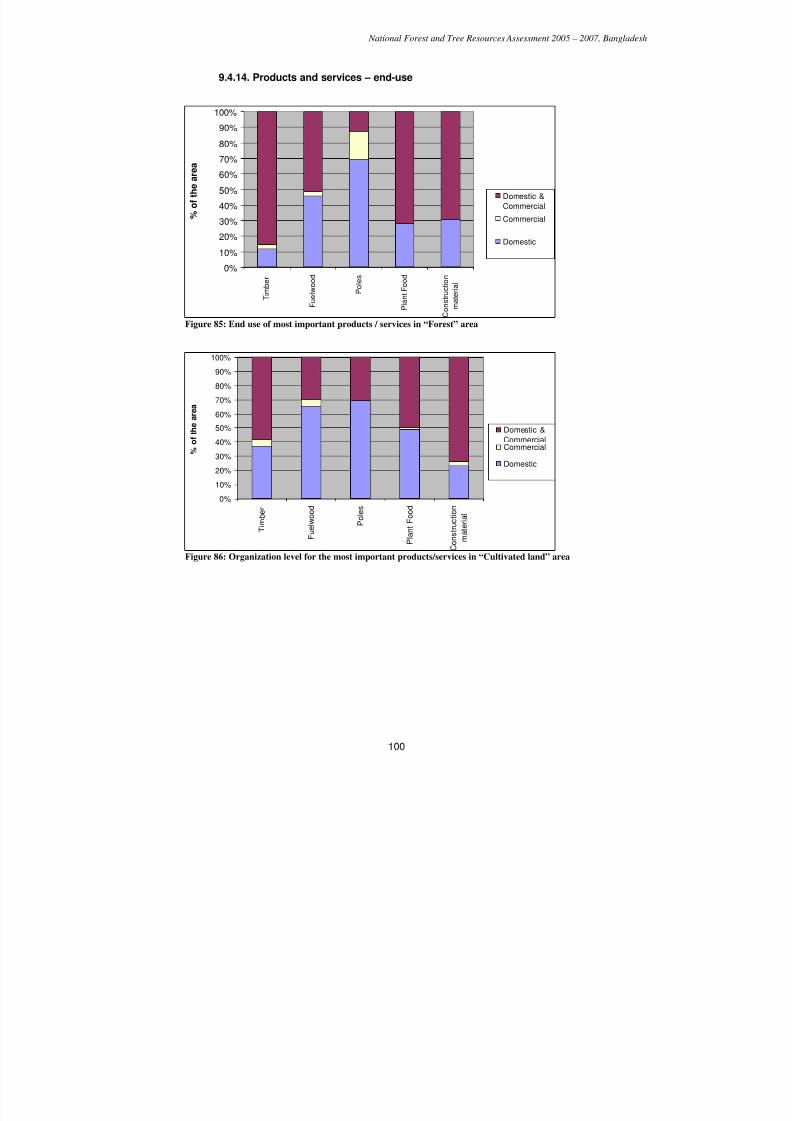
7/23/2019 NFA Final Report (1) (1)
http://slidepdf.com/reader/full/nfa-final-report-1-1 100/118
National Forest and Tree Resources Assessment 2005 – 2007, Bangladesh
100
9.4.14. Products and services – end-use
0%
10%
20%
30%
40%
50%
60%
70%
80%
90%
100%
T i m b e r
F u e l w o o d
P o l e s
P l a n t F o o d
C o n s t r u c t i o n
m a t e r i a l
% o f t h e a r e a
Domestic &
Commercial
Commercial
Domestic
Figure 85: End use of most important products / services in “Forest” area
0%
10%
20%
30%
40%
50%60%
70%
80%
90%
100%
T i m b e r
F u e l w o o d
P o l e s
P l a n t F o o d
C o n s t r u c t i o n
m a t e r i a l
% o f t h e a r
e a
Domestic &
CommercialCommercial
Domestic
Figure 86: Organization level for the most important products/services in “Cultivated land” area
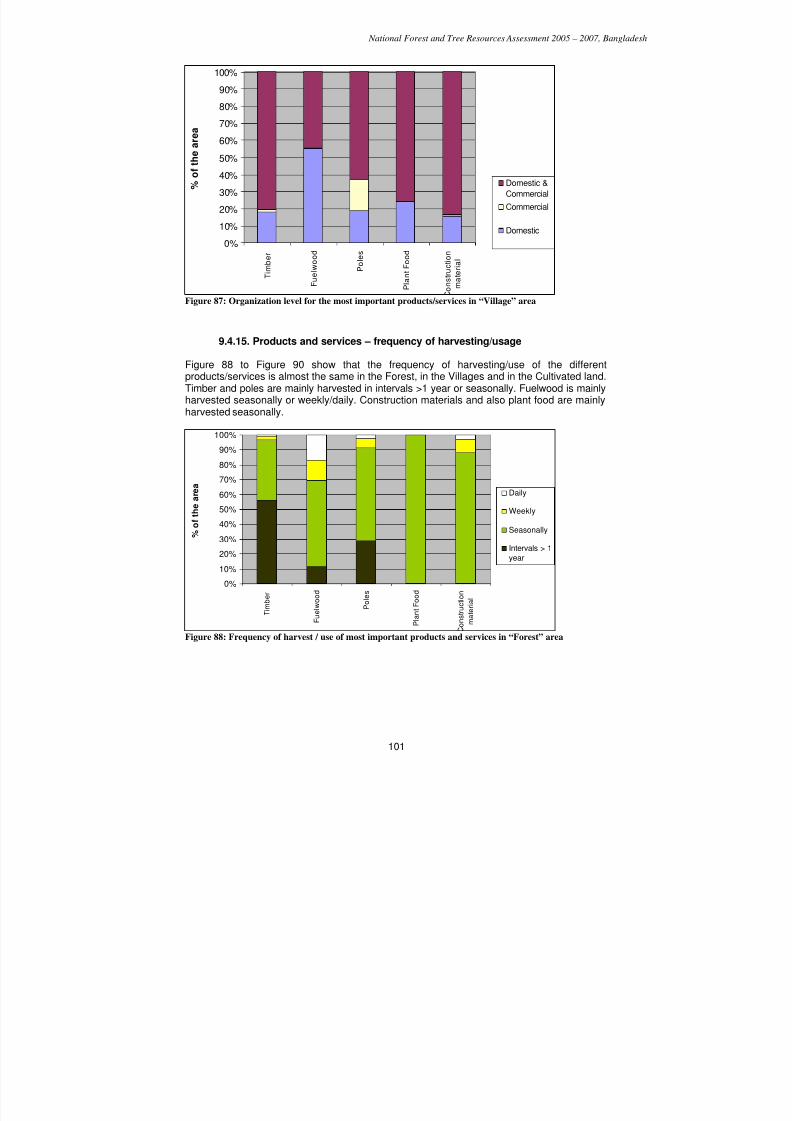
7/23/2019 NFA Final Report (1) (1)
http://slidepdf.com/reader/full/nfa-final-report-1-1 101/118
National Forest and Tree Resources Assessment 2005 – 2007, Bangladesh
101
0%
10%
20%
30%
40%
50%
60%
70%
80%
90%
100%
T
i m b e r
F u e
l w o o d
P o l e s
P l a n
t F o o d
o n s t r u c t i o n
m a t
e r i a l
% o f t h e a r e a
Domestic &
Commercial
Commercial
Domestic
Figure 87: Organization level for the most important products/services in “Village” area
9.4.15. Products and services – frequency of harvesting/usage
Figure 88 to Figure 90 show that the frequency of harvesting/use of the differentproducts/services is almost the same in the Forest, in the Villages and in the Cultivated land.Timber and poles are mainly harvested in intervals >1 year or seasonally. Fuelwood is mainlyharvested seasonally or weekly/daily. Construction materials and also plant food are mainly
harvested seasonally.
0%
10%
20%
30%
40%
50%
60%
70%
80%
90%
100%
T i m b e r
F u e l w o o d
P o l e s
P l a n t F o o d
o n s t r u c t i o n
m a t e r i a l
% o f t h e a r e a
Daily
Weekly
Seasonally
Intervals > 1year
Figure 88: Frequency of harvest / use of most important products and services in “Forest” area
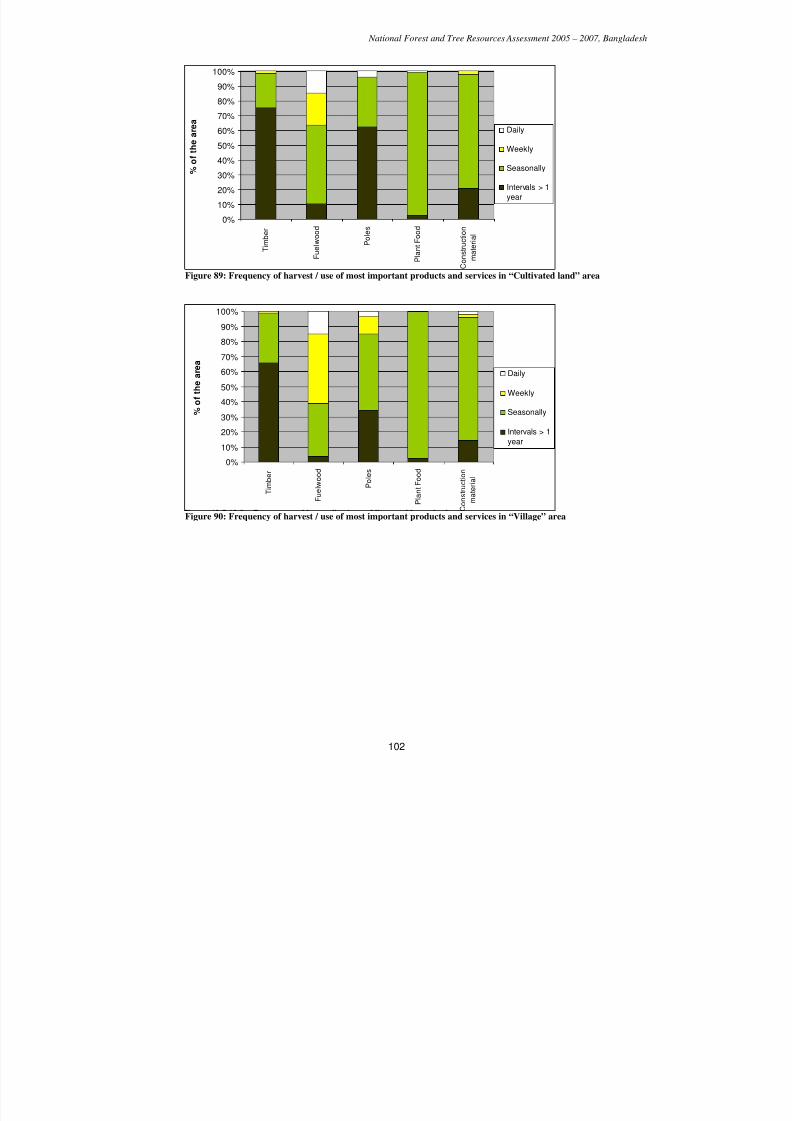
7/23/2019 NFA Final Report (1) (1)
http://slidepdf.com/reader/full/nfa-final-report-1-1 102/118
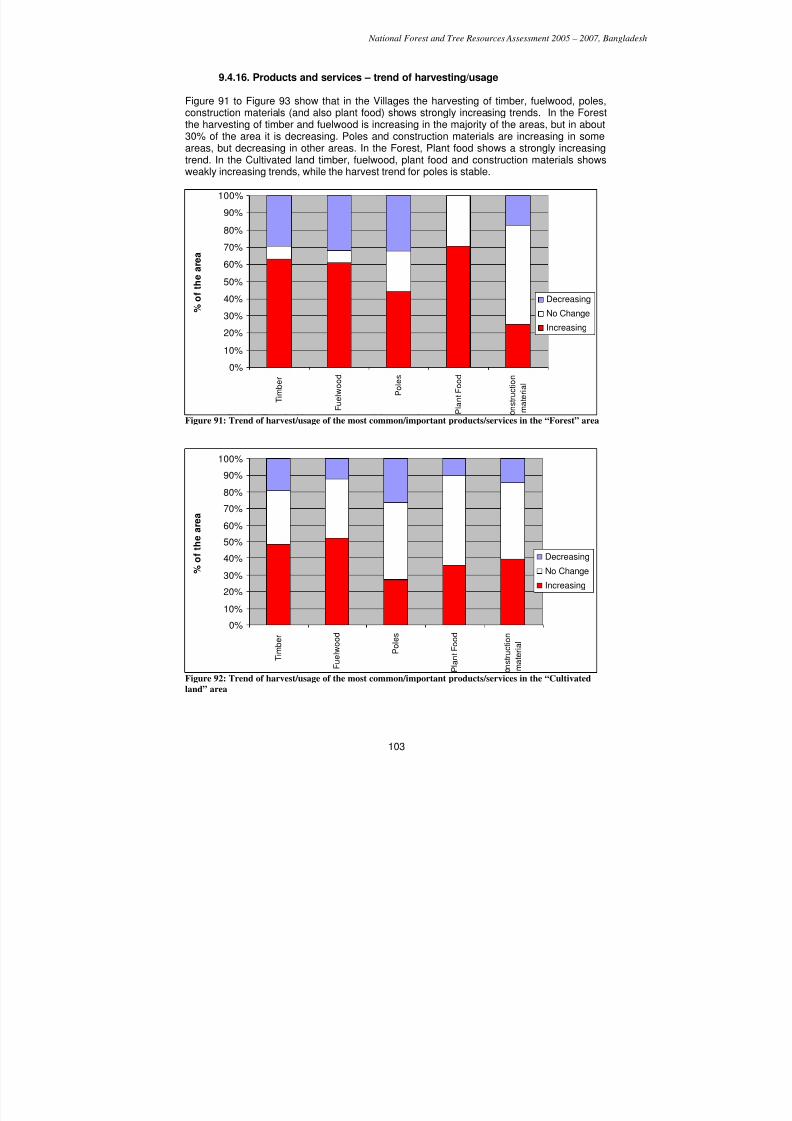
7/23/2019 NFA Final Report (1) (1)
http://slidepdf.com/reader/full/nfa-final-report-1-1 103/118
National Forest and Tree Resources Assessment 2005 – 2007, Bangladesh
103
9.4.16. Products and services – trend of harvesting/usage
Figure 91 to Figure 93 show that in the Villages the harvesting of timber, fuelwood, poles,construction materials (and also plant food) shows strongly increasing trends. In the Forestthe harvesting of timber and fuelwood is increasing in the majority of the areas, but in about
30% of the area it is decreasing. Poles and construction materials are increasing in someareas, but decreasing in other areas. In the Forest, Plant food shows a strongly increasingtrend. In the Cultivated land timber, fuelwood, plant food and construction materials showsweakly increasing trends, while the harvest trend for poles is stable.
0%
10%
20%
30%
40%
50%
60%
70%
80%
90%
100%
T i m b e r
F u e l w o o d
P o l e s
P l a n t F o o d
n s t r u c t i o n
m a t e r i a l
%
o f t h e
a r e a
Decreasing
No Change
Increasing
Figure 91: Trend of harvest/usage of the most common/important products/services in the “Forest” area
0%
10%
20%
30%
40%
50%
60%
70%
80%
90%
100%
T i m b e r
F u e l w o o d
P o l e s
P l a n t F o o d
n s t r u c t i o n
m a t e r i a l
% o f
t h e a r e a
Decreasing
No Change
Increasing
Figure 92: Trend of harvest/usage of the most common/important products/services in the “Cultivated
land” area
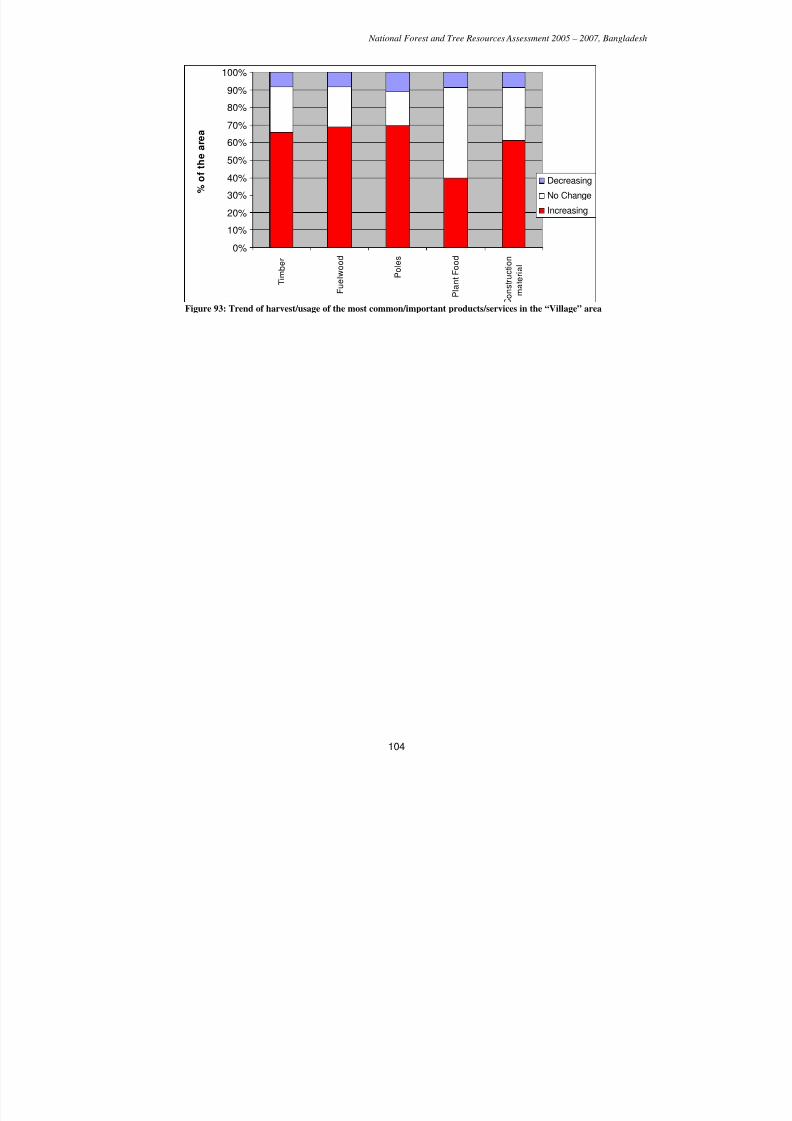
7/23/2019 NFA Final Report (1) (1)
http://slidepdf.com/reader/full/nfa-final-report-1-1 104/118
National Forest and Tree Resources Assessment 2005 – 2007, Bangladesh
104
0%
10%
20%
30%
40%
50%
60%
70%
80%
90%
100%
T i m
b e r
F u e l w o o d
P
o l e s
P l a n t
F o o d
o n s t r u
c t i o n
m a t e r i a l
% o f t h e a r e
a
Decreasing
No Change
Increasing
Figure 93: Trend of harvest/usage of the most common/important products/services in the “Village” area
7/23/2019 NFA Final Report (1) (1)
http://slidepdf.com/reader/full/nfa-final-report-1-1 105/118
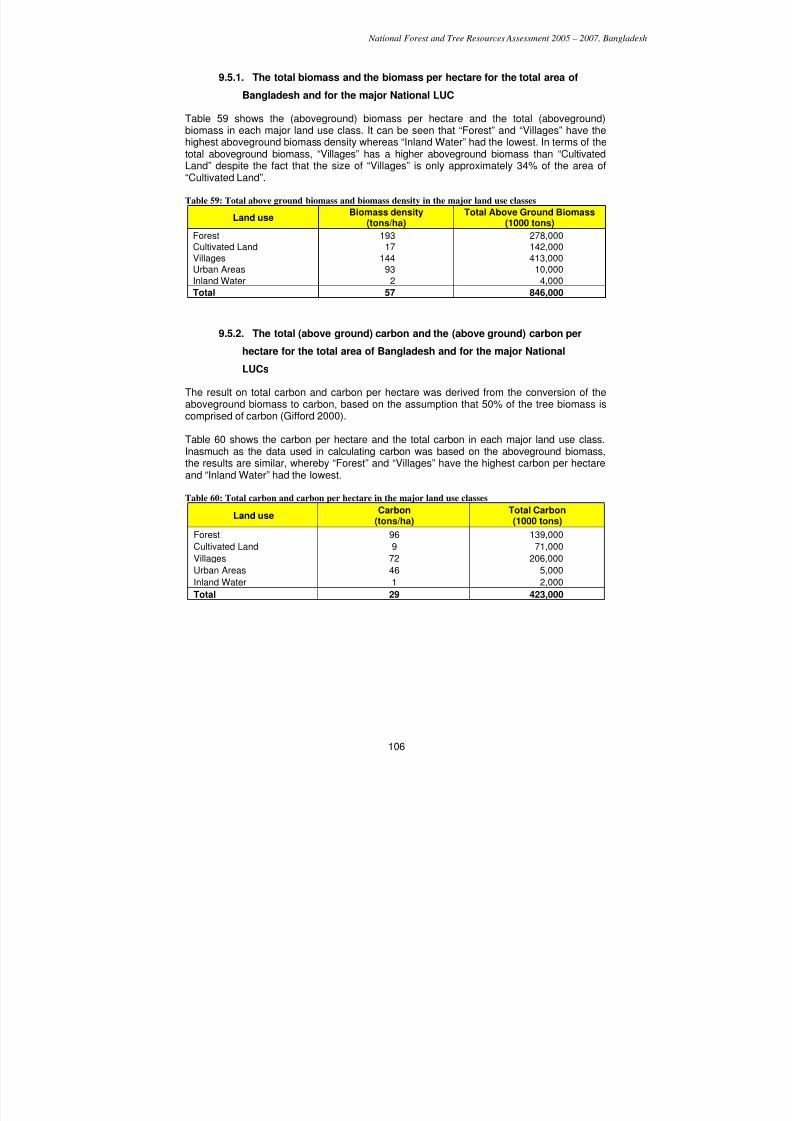
7/23/2019 NFA Final Report (1) (1)
http://slidepdf.com/reader/full/nfa-final-report-1-1 106/118
National Forest and Tree Resources Assessment 2005 – 2007, Bangladesh
106
9.5.1. The total biomass and the biomass per hectare for the total area of
Bangladesh and for the major National LUC
Table 59 shows the (aboveground) biomass per hectare and the total (aboveground)biomass in each major land use class. It can be seen that “Forest” and “Villages” have thehighest aboveground biomass density whereas “Inland Water” had the lowest. In terms of thetotal aboveground biomass, “Villages” has a higher aboveground biomass than “CultivatedLand” despite the fact that the size of “Villages” is only approximately 34% of the area of“Cultivated Land”.
Table 59: Total above ground biomass and biomass density in the major land use classes
Land useBiomass density
(tons/ha)Total Above Ground Biomass
(1000 tons)
Forest 193 278,000Cultivated Land 17 142,000
Villages 144 413,000Urban Areas 93 10,000
Inland Water 2 4,000
Total 57 846,000
9.5.2. The total (above ground) carbon and the (above ground) carbon per
hectare for the total area of Bangladesh and for the major National
LUCs
The result on total carbon and carbon per hectare was derived from the conversion of theaboveground biomass to carbon, based on the assumption that 50% of the tree biomass is
comprised of carbon (Gifford 2000).
Table 60 shows the carbon per hectare and the total carbon in each major land use class.Inasmuch as the data used in calculating carbon was based on the aboveground biomass,the results are similar, whereby “Forest” and “Villages” have the highest carbon per hectareand “Inland Water” had the lowest.
Table 60: Total carbon and carbon per hectare in the major land use classes
Land use Carbon
(tons/ha)Total Carbon(1000 tons)
Forest 96 139,000
Cultivated Land 9 71,000
Villages 72 206,000
Urban Areas 46 5,000
Inland Water 1 2,000
Total 29 423,000
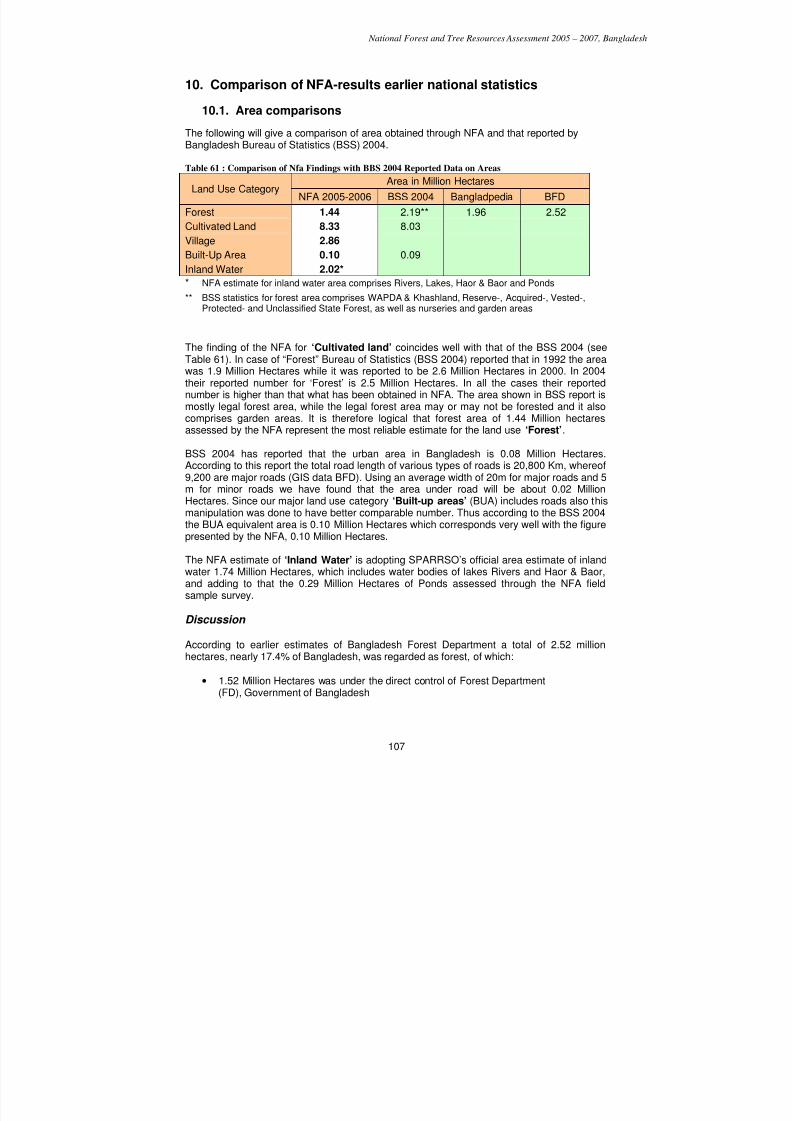
7/23/2019 NFA Final Report (1) (1)
http://slidepdf.com/reader/full/nfa-final-report-1-1 107/118
National Forest and Tree Resources Assessment 2005 – 2007, Bangladesh
107
10. Comparison of NFA-results earlier national statistics
10.1. Area comparisons
The following will give a comparison of area obtained through NFA and that reported byBangladesh Bureau of Statistics (BSS) 2004.
Table 61 : Comparison of Nfa Findings with BBS 2004 Reported Data on Areas
Area in Million HectaresLand Use Category
NFA 2005-2006 BSS 2004 Bangladpedia BFD
Forest 1.44 2.19** 1.96 2.52
Cultivated Land 8.33 8.03
Village 2.86
Built-Up Area 0.10 0.09
Inland Water 2.02*
* NFA estimate for inland water area comprises Rivers, Lakes, Haor & Baor and Ponds
** BSS statistics for forest area comprises WAPDA & Khashland, Reserve-, Acquired-, Vested-,Protected- and Unclassified State Forest, as well as nurseries and garden areas
The finding of the NFA for ‘Cultivated land’ coincides well with that of the BSS 2004 (seeTable 61). In case of “Forest” Bureau of Statistics (BSS 2004) reported that in 1992 the areawas 1.9 Million Hectares while it was reported to be 2.6 Million Hectares in 2000. In 2004their reported number for ‘Forest’ is 2.5 Million Hectares. In all the cases their reportednumber is higher than that what has been obtained in NFA. The area shown in BSS report ismostly legal forest area, while the legal forest area may or may not be forested and it also
comprises garden areas. It is therefore logical that forest area of 1.44 Million hectaresassessed by the NFA represent the most reliable estimate for the land use ‘Forest’.
BSS 2004 has reported that the urban area in Bangladesh is 0.08 Million Hectares.According to this report the total road length of various types of roads is 20,800 Km, whereof9,200 are major roads (GIS data BFD). Using an average width of 20m for major roads and 5m for minor roads we have found that the area under road will be about 0.02 MillionHectares. Since our major land use category ‘Built-up areas’ (BUA) includes roads also thismanipulation was done to have better comparable number. Thus according to the BSS 2004the BUA equivalent area is 0.10 Million Hectares which corresponds very well with the figurepresented by the NFA, 0.10 Million Hectares.
The NFA estimate of ‘Inland Water’ is adopting SPARRSO’s official area estimate of inlandwater 1.74 Million Hectares, which includes water bodies of lakes Rivers and Haor & Baor,and adding to that the 0.29 Million Hectares of Ponds assessed through the NFA fieldsample survey.
Discussion
According to earlier estimates of Bangladesh Forest Department a total of 2.52 millionhectares, nearly 17.4% of Bangladesh, was regarded as forest, of which:
• 1.52 Million Hectares was under the direct control of Forest Department
(FD), Government of Bangladesh
7/23/2019 NFA Final Report (1) (1)
http://slidepdf.com/reader/full/nfa-final-report-1-1 108/118
National Forest and Tree Resources Assessment 2005 – 2007, Bangladesh
108
• 0.73 Million Hectares was Unclassed State Forest (USF) under thecontrol of district administration and
• 0.27 Million Hectares was privately owned Village Forest (VF).
Banglapedia presents the area of forest land as 1.96 Million Hectares.
BSS 2004 presents the forest area in Bangladesh as follows.State Forest 1.64 Million HectaresUSF 0.55 Million HectaresTotal 2.19 Million Hectares.
The NFA data analyses show that the total area of the land use ‘Forest’ in Bangladesh is1.44 Million Hectares. No estimates of the errors for of these statistics are available, exceptfor that of NFA. The sampling error for the estimated forest area as 1.44 Million Hectares byNFA 2005 is 18% and it was reduced further through the employment of full cover mapping.
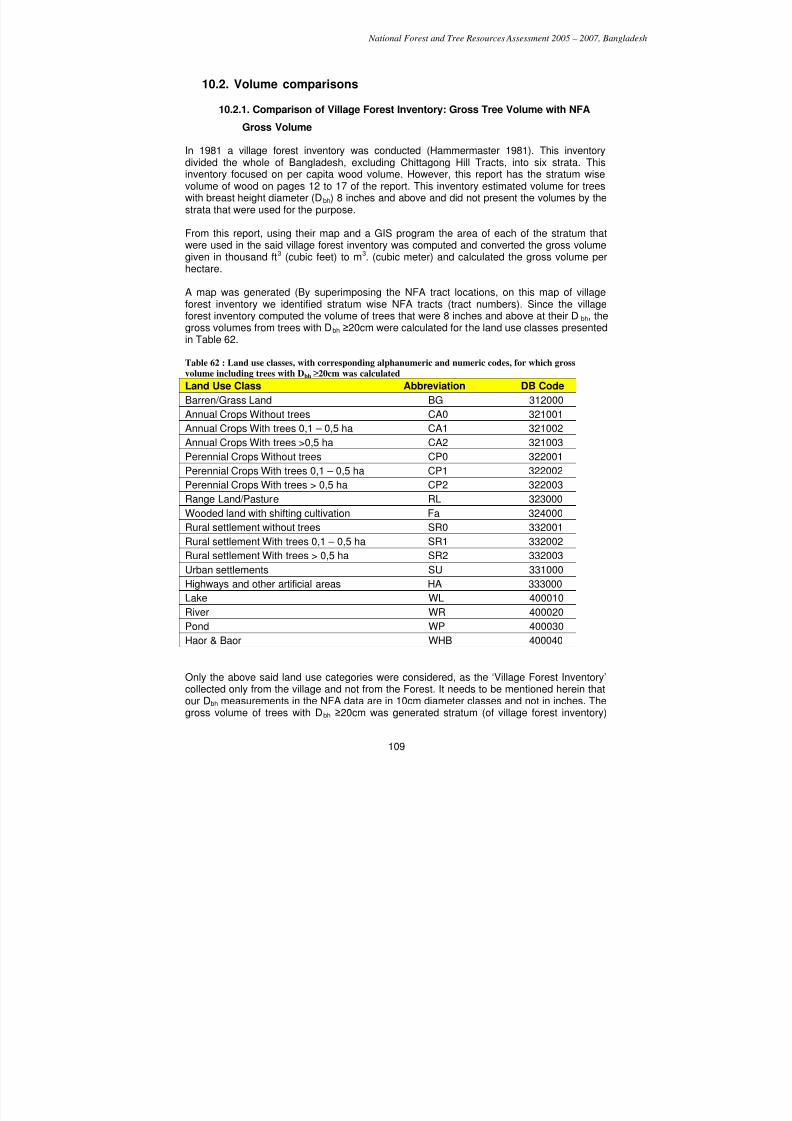
7/23/2019 NFA Final Report (1) (1)
http://slidepdf.com/reader/full/nfa-final-report-1-1 109/118
National Forest and Tree Resources Assessment 2005 – 2007, Bangladesh
109
10.2. Volume comparisons
10.2.1. Comparison of Village Forest Inventory: Gross Tree Volume with NFA
Gross Volume
In 1981 a village forest inventory was conducted (Hammermaster 1981). This inventorydivided the whole of Bangladesh, excluding Chittagong Hill Tracts, into six strata. Thisinventory focused on per capita wood volume. However, this report has the stratum wisevolume of wood on pages 12 to 17 of the report. This inventory estimated volume for treeswith breast height diameter (Dbh) 8 inches and above and did not present the volumes by thestrata that were used for the purpose.
From this report, using their map and a GIS program the area of each of the stratum thatwere used in the said village forest inventory was computed and converted the gross volumegiven in thousand ft3 (cubic feet) to m3. (cubic meter) and calculated the gross volume perhectare.
A map was generated (By superimposing the NFA tract locations, on this map of villageforest inventory we identified stratum wise NFA tracts (tract numbers). Since the villageforest inventory computed the volume of trees that were 8 inches and above at their Dbh, thegross volumes from trees with Dbh ≥20cm were calculated for the land use classes presentedin Table 62.
Table 62 : Land use classes, with corresponding alphanumeric and numeric codes, for which gross
volume including trees with Dbh ≥20cm was calculated
Land Use Class Abbreviation DB Code
Barren/Grass Land BG 312000
Annual Crops Without trees CA0 321001Annual Crops With trees 0,1 – 0,5 ha CA1 321002
Annual Crops With trees >0,5 ha CA2 321003
Perennial Crops Without trees CP0 322001
Perennial Crops With trees 0,1 – 0,5 ha CP1 322002
Perennial Crops With trees > 0,5 ha CP2 322003
Range Land/Pasture RL 323000
Wooded land with shifting cultivation Fa 324000
Rural settlement without trees SR0 332001
Rural settlement With trees 0,1 – 0,5 ha SR1 332002
Rural settlement With trees > 0,5 ha SR2 332003Urban settlements SU 331000
Highways and other artificial areas HA 333000
Lake WL 400010
River WR 400020
Pond WP 400030
Haor & Baor WHB 400040
Only the above said land use categories were considered, as the ‘Village Forest Inventory’
collected only from the village and not from the Forest. It needs to be mentioned herein thatour Dbh measurements in the NFA data are in 10cm diameter classes and not in inches. Thegross volume of trees with Dbh ≥20cm was generated stratum (of village forest inventory)
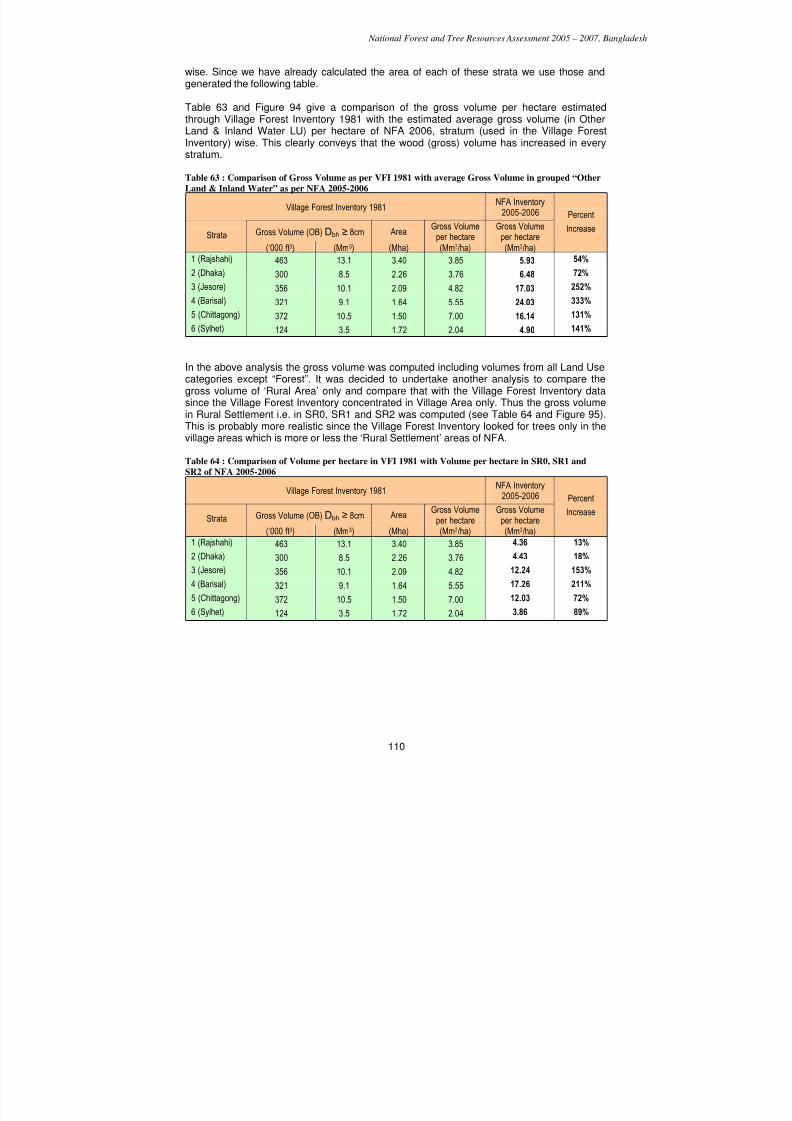
7/23/2019 NFA Final Report (1) (1)
http://slidepdf.com/reader/full/nfa-final-report-1-1 110/118
National Forest and Tree Resources Assessment 2005 – 2007, Bangladesh
110
wise. Since we have already calculated the area of each of these strata we use those andgenerated the following table.
Table 63 and Figure 94 give a comparison of the gross volume per hectare estimatedthrough Village Forest Inventory 1981 with the estimated average gross volume (in OtherLand & Inland Water LU) per hectare of NFA 2006, stratum (used in the Village ForestInventory) wise. This clearly conveys that the wood (gross) volume has increased in everystratum.
Table 63 : Comparison of Gross Volume as per VFI 1981 with average Gross Volume in grouped “Other
Land & Inland Water” as per NFA 2005-2006
Village Forest Inventory 1981NFA Inventory
2005-2006
Gross Volume (OB) Dbh ≥ 8cm AreaGross Volume
per hectareGross Volume
per hectareStrata
(‘000 ft3) (Mm3) (Mha) (Mm3/ha) (Mm3/ha)
Percent
Increase
1 (Rajshahi) 463 13.1 3.40 3.85 5.93 54%
2 (Dhaka) 300 8.5 2.26 3.76 6.48 72%3 (Jesore) 356 10.1 2.09 4.82 17.03 252%
4 (Barisal) 321 9.1 1.64 5.55 24.03 333%
5 (Chittagong) 372 10.5 1.50 7.00 16.14 131%
6 (Sylhet) 124 3.5 1.72 2.04 4.90 141%
In the above analysis the gross volume was computed including volumes from all Land Usecategories except “Forest”. It was decided to undertake another analysis to compare thegross volume of ‘Rural Area’ only and compare that with the Village Forest Inventory datasince the Village Forest Inventory concentrated in Village Area only. Thus the gross volume
in Rural Settlement i.e. in SR0, SR1 and SR2 was computed (see Table 64 and Figure 95).This is probably more realistic since the Village Forest Inventory looked for trees only in thevillage areas which is more or less the ‘Rural Settlement’ areas of NFA.
Table 64 : Comparison of Volume per hectare in VFI 1981 with Volume per hectare in SR0, SR1 and
SR2 of NFA 2005-2006
Village Forest Inventory 1981NFA Inventory
2005-2006
Gross Volume (OB) Dbh ≥ 8cm AreaGross Volume
per hectareGross Volume
per hectareStrata
(‘000 ft3) (Mm3) (Mha) (Mm3/ha) (Mm3/ha)
Percent
Increase
1 (Rajshahi) 463 13.1 3.40 3.85 4.36 13%
2 (Dhaka) 300 8.5 2.26 3.76 4.43 18%
3 (Jesore) 356 10.1 2.09 4.82 12.24 153%
4 (Barisal) 321 9.1 1.64 5.55 17.26 211%
5 (Chittagong) 372 10.5 1.50 7.00 12.03 72%
6 (Sylhet) 124 3.5 1.72 2.04 3.86 89%
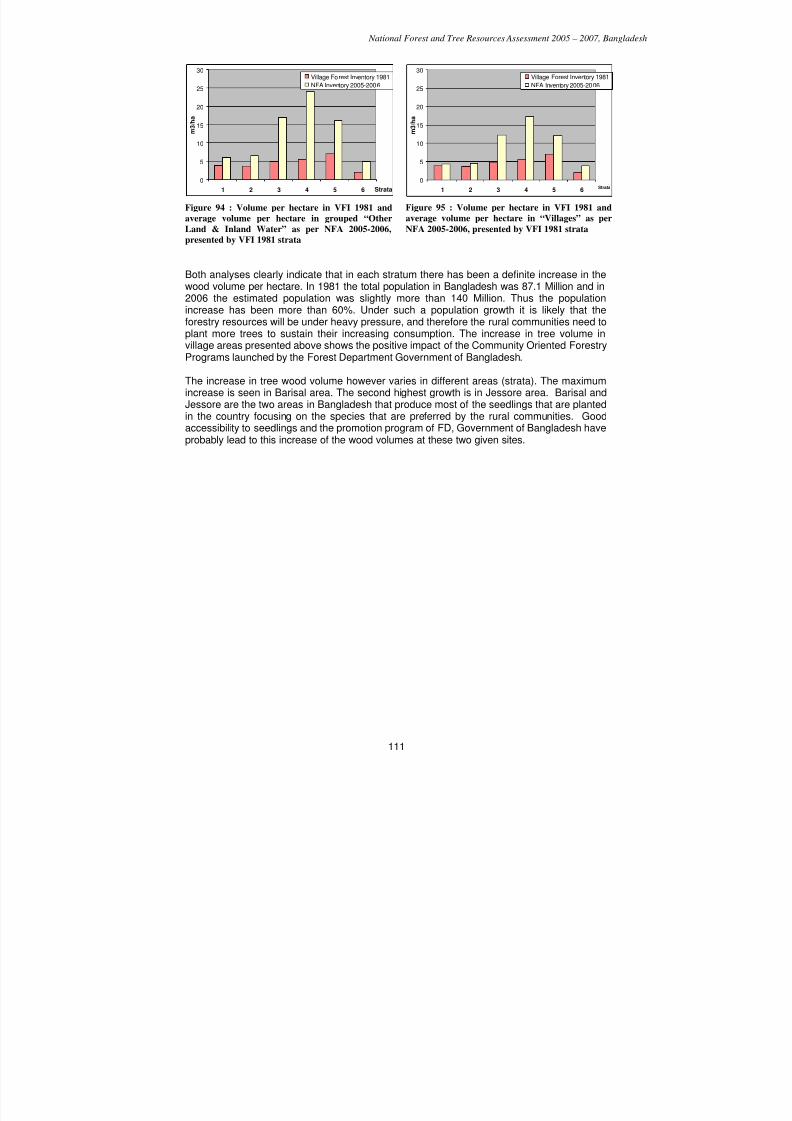
7/23/2019 NFA Final Report (1) (1)
http://slidepdf.com/reader/full/nfa-final-report-1-1 111/118
National Forest and Tree Resources Assessment 2005 – 2007, Bangladesh
111
Both analyses clearly indicate that in each stratum there has been a definite increase in thewood volume per hectare. In 1981 the total population in Bangladesh was 87.1 Million and in2006 the estimated population was slightly more than 140 Million. Thus the populationincrease has been more than 60%. Under such a population growth it is likely that theforestry resources will be under heavy pressure, and therefore the rural communities need toplant more trees to sustain their increasing consumption. The increase in tree volume invillage areas presented above shows the positive impact of the Community Oriented ForestryPrograms launched by the Forest Department Government of Bangladesh.
The increase in tree wood volume however varies in different areas (strata). The maximumincrease is seen in Barisal area. The second highest growth is in Jessore area. Barisal andJessore are the two areas in Bangladesh that produce most of the seedlings that are planted
in the country focusing on the species that are preferred by the rural communities. Goodaccessibility to seedlings and the promotion program of FD, Government of Bangladesh haveprobably lead to this increase of the wood volumes at these two given sites.
0
5
10
15
20
25
30
1 2 3 4 5 6 Strata
m 3 / h a
Village Forest Inventory 1981
NFA Inventory 2005-2006
Figure 94 : Volume per hectare in VFI 1981 and
average volume per hectare in grouped “Other
Land & Inland Water” as per NFA 2005-2006,
presented by VFI 1981 strata
0
5
10
15
20
25
30
1 2 3 4 5 6Strata
m 3 / h a
Village Forest Inventory 1981
NFA Inventory 2005-2006
Figure 95 : Volume per hectare in VFI 1981 and
average volume per hectare in “Villages” as per
NFA 2005-2006, presented by VFI 1981 strata
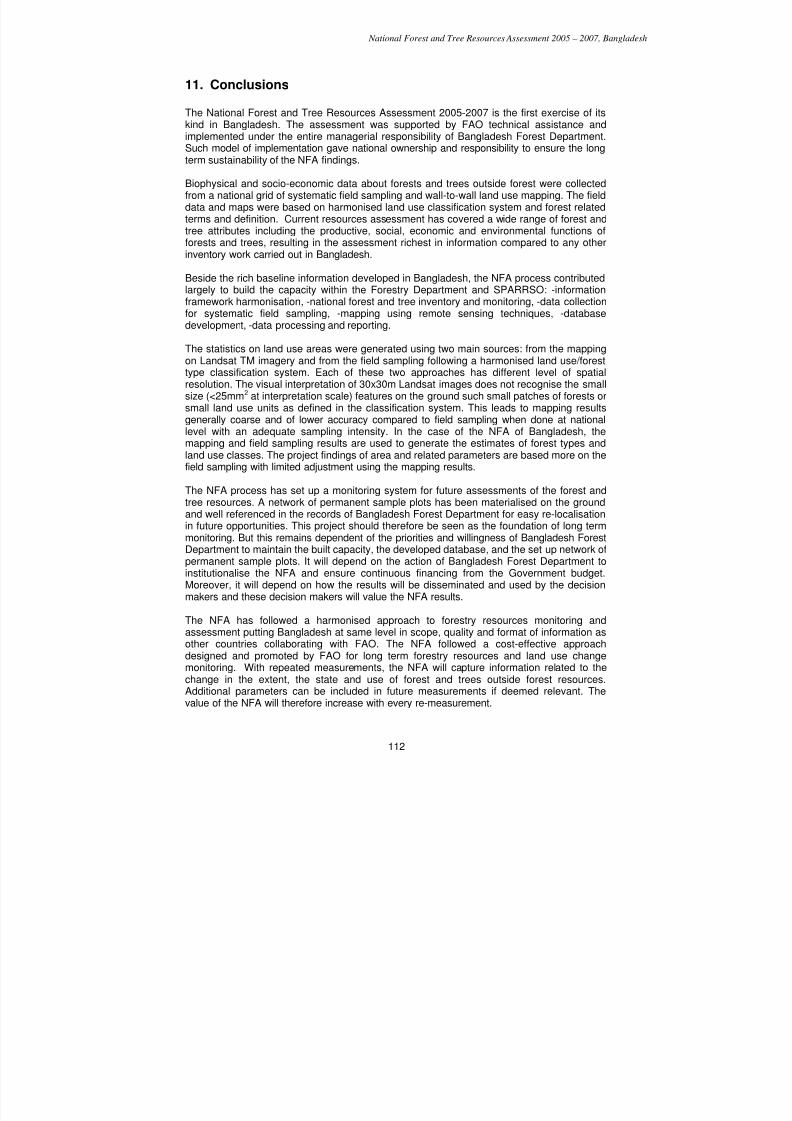
7/23/2019 NFA Final Report (1) (1)
http://slidepdf.com/reader/full/nfa-final-report-1-1 112/118
National Forest and Tree Resources Assessment 2005 – 2007, Bangladesh
112
11. Conclusions
The National Forest and Tree Resources Assessment 2005-2007 is the first exercise of itskind in Bangladesh. The assessment was supported by FAO technical assistance and
implemented under the entire managerial responsibility of Bangladesh Forest Department.Such model of implementation gave national ownership and responsibility to ensure the longterm sustainability of the NFA findings.
Biophysical and socio-economic data about forests and trees outside forest were collectedfrom a national grid of systematic field sampling and wall-to-wall land use mapping. The fielddata and maps were based on harmonised land use classification system and forest relatedterms and definition. Current resources assessment has covered a wide range of forest andtree attributes including the productive, social, economic and environmental functions offorests and trees, resulting in the assessment richest in information compared to any otherinventory work carried out in Bangladesh.
Beside the rich baseline information developed in Bangladesh, the NFA process contributedlargely to build the capacity within the Forestry Department and SPARRSO: -informationframework harmonisation, -national forest and tree inventory and monitoring, -data collectionfor systematic field sampling, -mapping using remote sensing techniques, -databasedevelopment, -data processing and reporting.
The statistics on land use areas were generated using two main sources: from the mappingon Landsat TM imagery and from the field sampling following a harmonised land use/foresttype classification system. Each of these two approaches has different level of spatialresolution. The visual interpretation of 30x30m Landsat images does not recognise the smallsize (<25mm2 at interpretation scale) features on the ground such small patches of forests orsmall land use units as defined in the classification system. This leads to mapping resultsgenerally coarse and of lower accuracy compared to field sampling when done at nationallevel with an adequate sampling intensity. In the case of the NFA of Bangladesh, themapping and field sampling results are used to generate the estimates of forest types andland use classes. The project findings of area and related parameters are based more on thefield sampling with limited adjustment using the mapping results.
The NFA process has set up a monitoring system for future assessments of the forest andtree resources. A network of permanent sample plots has been materialised on the groundand well referenced in the records of Bangladesh Forest Department for easy re-localisationin future opportunities. This project should therefore be seen as the foundation of long termmonitoring. But this remains dependent of the priorities and willingness of Bangladesh Forest
Department to maintain the built capacity, the developed database, and the set up network ofpermanent sample plots. It will depend on the action of Bangladesh Forest Department toinstitutionalise the NFA and ensure continuous financing from the Government budget.Moreover, it will depend on how the results will be disseminated and used by the decisionmakers and these decision makers will value the NFA results.
The NFA has followed a harmonised approach to forestry resources monitoring andassessment putting Bangladesh at same level in scope, quality and format of information asother countries collaborating with FAO. The NFA followed a cost-effective approachdesigned and promoted by FAO for long term forestry resources and land use changemonitoring. With repeated measurements, the NFA will capture information related to thechange in the extent, the state and use of forest and trees outside forest resources.
Additional parameters can be included in future measurements if deemed relevant. Thevalue of the NFA will therefore increase with every re-measurement.
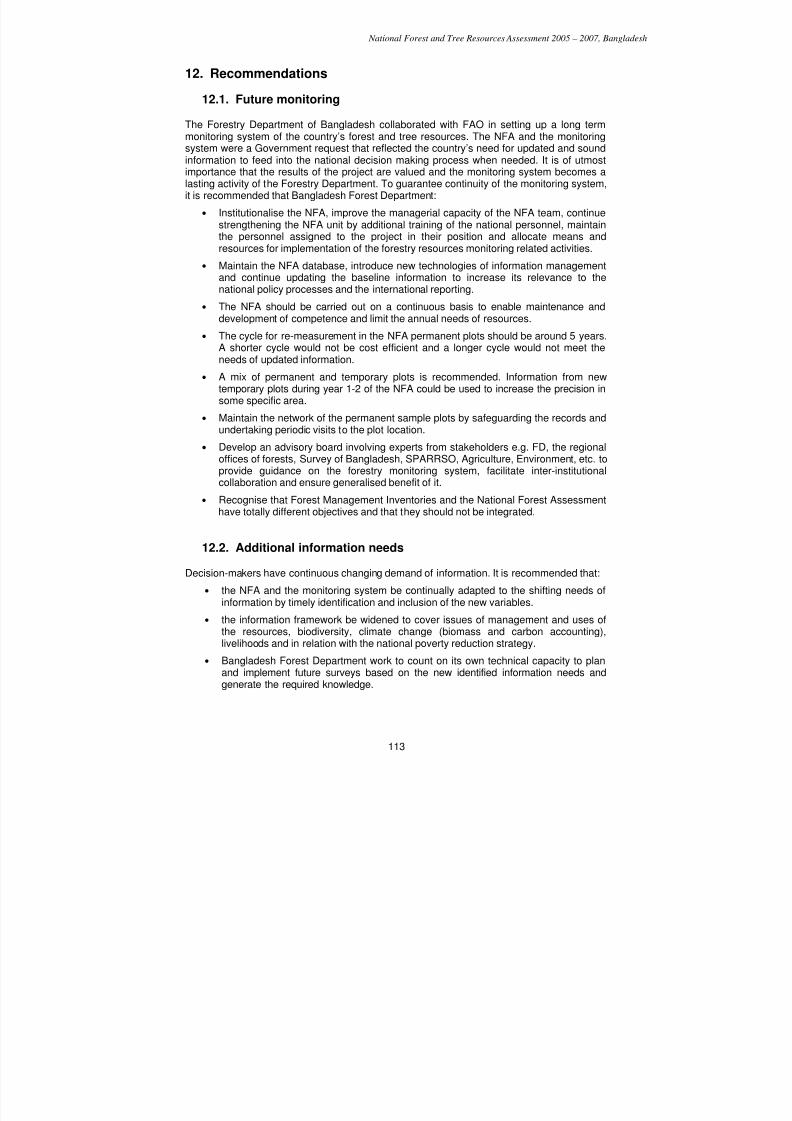
7/23/2019 NFA Final Report (1) (1)
http://slidepdf.com/reader/full/nfa-final-report-1-1 113/118
National Forest and Tree Resources Assessment 2005 – 2007, Bangladesh
113
12. Recommendations
12.1. Future monitoring
The Forestry Department of Bangladesh collaborated with FAO in setting up a long term
monitoring system of the country’s forest and tree resources. The NFA and the monitoringsystem were a Government request that reflected the country’s need for updated and soundinformation to feed into the national decision making process when needed. It is of utmostimportance that the results of the project are valued and the monitoring system becomes alasting activity of the Forestry Department. To guarantee continuity of the monitoring system,it is recommended that Bangladesh Forest Department:
• Institutionalise the NFA, improve the managerial capacity of the NFA team, continuestrengthening the NFA unit by additional training of the national personnel, maintainthe personnel assigned to the project in their position and allocate means andresources for implementation of the forestry resources monitoring related activities.
• Maintain the NFA database, introduce new technologies of information management
and continue updating the baseline information to increase its relevance to thenational policy processes and the international reporting.
• The NFA should be carried out on a continuous basis to enable maintenance anddevelopment of competence and limit the annual needs of resources.
• The cycle for re-measurement in the NFA permanent plots should be around 5 years.A shorter cycle would not be cost efficient and a longer cycle would not meet theneeds of updated information.
• A mix of permanent and temporary plots is recommended. Information from newtemporary plots during year 1-2 of the NFA could be used to increase the precision insome specific area.
• Maintain the network of the permanent sample plots by safeguarding the records andundertaking periodic visits to the plot location.
• Develop an advisory board involving experts from stakeholders e.g. FD, the regionaloffices of forests, Survey of Bangladesh, SPARRSO, Agriculture, Environment, etc. toprovide guidance on the forestry monitoring system, facilitate inter-institutionalcollaboration and ensure generalised benefit of it.
• Recognise that Forest Management Inventories and the National Forest Assessmenthave totally different objectives and that they should not be integrated.
12.2. Additional information needsDecision-makers have continuous changing demand of information. It is recommended that:
• the NFA and the monitoring system be continually adapted to the shifting needs ofinformation by timely identification and inclusion of the new variables.
• the information framework be widened to cover issues of management and uses ofthe resources, biodiversity, climate change (biomass and carbon accounting),livelihoods and in relation with the national poverty reduction strategy.
• Bangladesh Forest Department work to count on its own technical capacity to planand implement future surveys based on the new identified information needs andgenerate the required knowledge.
7/23/2019 NFA Final Report (1) (1)
http://slidepdf.com/reader/full/nfa-final-report-1-1 114/118
National Forest and Tree Resources Assessment 2005 – 2007, Bangladesh
114
• Bangladesh Forest Department work to assign dedicated personnel who ensure thatthe interest of the forestry sector and interest of Bangladesh in general prevail byoptimising the available resources and ensuring high quality delivery.
12.3. Actions for resources development
• The country-wide presence of Bangladesh Forest Department consist a greatpotential for undertaking future systematic monitoring of the resources. Technicalpersonnel in the Districts require a close follow-up and training to ensure enhancedquality of data collection and timely implementation of the entire NFA process.
• The value of the NFA data will increase with every re-measurement of the permanentsample sites in order to capture information on changes. The data and the permanentsampling grid is potentially useful to many other institutions. Collaborationconcerning the fieldwork and the sharing of data between relevant institutionalstakeholders should therefore be promoted. It could also help spreading the
workload related to conducting periodic fieldwork.
• The NFA findings will help identify priority areas and will be of use for thedevelopment of the forestry sector (national forest programme) and an evaluation offorestry policy/strategies in order to ensure a coherent legislation. The NFA is part ofa continual process and not the end product in itself.
• The diversity of ownership of the forestry resources in Bangladesh and the highdensity of population lead to the recommendation of developing wise policies andmanagement plans for forests and TOF to include a participatory approach with theprivate stakeholders.
12.4. International reporting
The NFA will facilitate International Reporting as it produces information required by anumber of international processes according to international standards. However, the drivingforce behind the NFA is the extent to which data is of use at national level e.g. for policydevelopment or for resources management.
Data related to the composition of forests, their state and the uses of forestry resources willalways come from field inventories through on-the-ground measurements, being the onlyway to capture reliable information on the majority of the many functions of forest and trees.
The FAO support to the national forest and tree resources assessment of Bangladesh is atwo-way process, building national capacity in NFA and providing continuous feedback onmethodological issues to FAO. It is recommendable
• To continue improve the compatibility between the differentclassification systems and forest/land use related terms and definitionemployed nationally and in relation with the international reportingrequirements.
• To add new scope of information on global benefits such as biodiversity,climate change, trends (deforestation, improvement or degradation ofnatural forests.
• To include any new parameters that can be of importance to the
international processes.
7/23/2019 NFA Final Report (1) (1)
http://slidepdf.com/reader/full/nfa-final-report-1-1 115/118
National Forest and Tree Resources Assessment 2005 – 2007, Bangladesh
115
12.5. Capacity building
To ensure the continuity of forestry resources monitoring it is necessary to build and maintainnational capacities related to sampling design, field data collection, data processing andanalysis, remote sensing and reporting. FD needs to formulate a “Plan of Action” to securethat the experiences gained from the NFA will be followed-up and implemented in such away that the capacity to carry out long term NFAs is guarantied. The RIMS-unit (centraltasks) and the Management Plan Divisions (field work) both need to be strengthened in orderto take on the NFA task.
The RIMS-unit and the three Management Plan Divisions must maintain staff and theircompetences through continuous capacity building related to NFA activities. BangladeshForest Department must work to improve the field and map data processing and analyticalcapacity within the NFA team. Without such capacity and improved outcomes of the NFA andthe resources monitoring process, Bangladesh Forest Department might find it difficult to justify maintaining and financing NFA Unit.
7/23/2019 NFA Final Report (1) (1)
http://slidepdf.com/reader/full/nfa-final-report-1-1 116/118
National Forest and Tree Resources Assessment 2005 – 2007, Bangladesh
116
13. Bibliography and reference literature
Avery, T.U. 1967. Natural Resource Measurements. McGraw-Hills, Inc. pp 339.
Bangladesh Bureau of Statistics (BBS) 2005. Statistical Year Book of Bangladesh 2004, 24thedition. Ministry of Planning, Government of Bangladesh, December 2005. pp 28.
Banglapedia. http://banglapedia.org/
Baten, S.A. 1969. Revised Working Plan for the Forests of the Chittagong Division for the period
from 1968-69 to 1977-78 . Forest Department Government of Bangladesh. pp 153.
Brown, S. and A. E. Lugo. 1992. Above ground biomass estimates for tropical moist forests of the
Brazilian Amazon. Interciencia 17:8-18.
Chaffy, D.R.; Miller, F.R. and J.H Sandom. 1985. A Forest Inventory of the Sundarbans, Bangladesh. Overseas Development Administration; Land Resources Development Centre;
Tolworth Tower, Surbiton, Surrey, England KT6 7DY. pp 196.
Choudhury, M.U. 1973. Working Plan for Chittagong Hill Tracts South Forest Division for the
period 1969-70 to 1988-89, Vol I and II . Forest Department Government of Bangladesh. pp
145.
Choudhury, J.K. 1986. Sylhet Forest Division at a Glance. pp 54
Choudhury, J.H. 2001. Forest management plan for Sylhet for the period 1992-2001.
Choudhury, J.K. 2002. An Introduction to Forest Management for the Students of Environmental
Science. pp 115.
Curtis, S. J. 1924. Management plan for Sundarbans.
FAO 2001. Global Ecological Zoning for the Global Forest Resources Assessment 2000. FRA
Working Paper 56. FAO Rome.
FAO 2006. Global forest resources assessment 2005. FAO Forestry Paper No. 147. FAO Rome (also
available at http://www.fao.org/forestry/site/41555/en/).
Forest Department 1996. Inventory of Sundarbans. FD, Government of Bangladesh
Forest Department 2004. Strengthening Capacity to Generate Quality Information on Forest
Resources. Ministry of Environment and Forests, Government of Bangladesh November 30,
2004 (Ref Planning Commission’s letter No. PoKo/Krishi/BoPoMo (Ban)-199/2004/478
Dated November 30, 2004) pp 39.
Forest Department 2006. Social Forestry in Bangladesh, Bulletin No 5. Government of Bangladesh.
June 2006.
7/23/2019 NFA Final Report (1) (1)
http://slidepdf.com/reader/full/nfa-final-report-1-1 117/118
National Forest and Tree Resources Assessment 2005 – 2007, Bangladesh
117
Forestal, 1960. First detailed inventory of Sundarbans in 1960. Forestry and Engineering
International Limited of Vancouver, Canada.
Forestal 1964. Chittagong Hill Tracts Forest Inventory Survey 1961-1963, Kassalong and Rankhiang
Reserved Forests. Forestry and Engineering International Limited. Vancouver, Canada. May
1964. (Project No F334 under Colombo Plan, Pakistan, Canada).
Gifford, R. 2000. Carbon Content of Woody Roots: Revised Analysis and a Comparison with Woody
Shoot Components. National Carbon Accounting System Technical Report No. 7 (Revision
1). Australian Greenhouse Office, Canberra.
Hammermaster, E.T. 1981. Village Forest Inventory of Bangladesh: Inventory Results. Field
Document No 5. FAO of United Nations. UNDP/FAO Project BGD/78/020. pp 59.
Haroun Er Rashid 1991. Geography of Bangladesh, University Press Ltd, Dhaka.
Hussain, Z. and G. Acharya. 1994. Mangroves of the Sundarbans Volume two: Bangladesh. IUCN.
Ministry of Environment and Forests (MoEF) 2004. Technical Assistance Project Proposal
(TAPP). Project document of MOEF. November 30, 2004.
Nishat, A. et. al. 2005. Restoration of Degraded Coastal Ecosystem by Participatory Approach: A
Pilot Initiative. Rehabilitation of Critical Coastal Ecosystem: Chokoria Sundarbans. IUCN,
Bangladesh. (Awaiting publication).
ODA 1985. Second detailed inventory of Sundarban 1980-198 . Overseas Development
Administration (ODA) U.K.
Purkayastha, C. 1938. Plantation scheme for the period from 1935 to 1938 for Sylhet Working plan.
Prepared in 1938 by N.N. Das for the period 1938-1947.
7/23/2019 NFA Final Report (1) (1)
http://slidepdf.com/reader/full/nfa-final-report-1-1 118/118
National Forest and Tree Resources Assessment 2005 – 2007, Bangladesh
ANNEXES
ANNEX I LAND USE CLASSIFICATION - DEFINITIONS.....................................................119
ANNEX II FIELD FORMS................................................................................................. 123
ANNEX III NFA VARIABLES AND RELATED ATTRIBUTES............................................... 132
ANNEX IV GEOGRAPHIC COORDINATES (LATITUDE / LONGITUDE) OF NFA SAMPLE
UNITS (TRACT SW CORNER, PLOT STARTING POINT, TRACT CENTRE)...........135
ANNEX V GETTING STARTED WITH THE NFA DATABASE .............................................. 141
ANNEX VI GUIDELINES FOR NFA DATA PROCESSING................................................... 152
ANNEX VII FAO STATISTICAL GUIDE LINES ................................................................169
ANNEX VIII LIST OF ALL TREE SPECIES MEASURED DURING THE FIELD INVENTORY ...... 174
ANNEX IX LAND USE / FOREST TYPE MAP................................................................... 179
ANNEX X LANDSAT TM IMAGERIES USED FOR THE REMOTE SENSING SURVEY ........... 183
ANNEX XI RESULTS WITH DESCRIPTIVE STATISTICS ......................................................185
ANNEX XII NFA FIELD MANUAL..................................................................................196
ANNEX XIII RESULTS FOR INTERNATIONAL REPORTING (FRA 2010)........................... 280