Embed Size (px)
Citation preview
ORIGINAL RESEARCH ARTICLEpublished: 26 November 2013doi: 10.3389/fncir.2013.00160
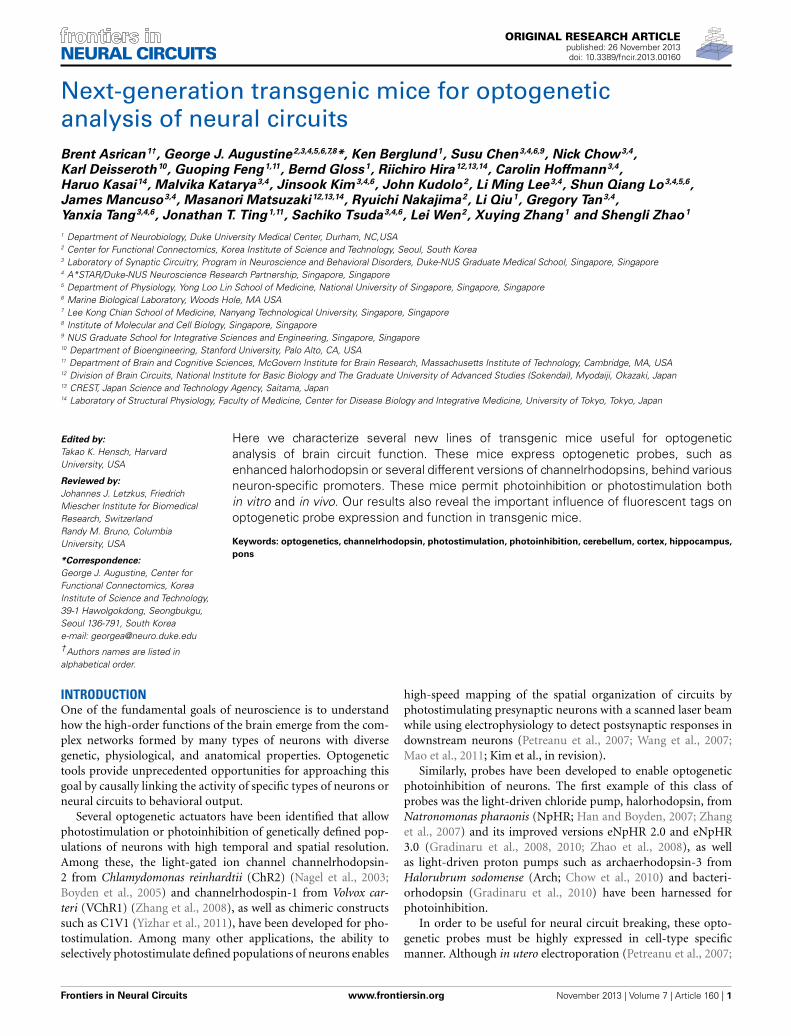
Next-generation transgenic mice for optogeneticanalysis of neural circuitsBrent Asrican1†, George J. Augustine2,3,4,5,6,7,8*, Ken Berglund1, Susu Chen3,4,6,9, Nick Chow3,4,
Karl Deisseroth10, Guoping Feng1,11, Bernd Gloss1, Riichiro Hira12,13,14, Carolin Hoffmann3,4,
Haruo Kasai14, Malvika Katarya3,4, Jinsook Kim3,4,6, John Kudolo2, Li Ming Lee3,4, Shun Qiang Lo3,4,5,6,
James Mancuso3,4, Masanori Matsuzaki12,13,14, Ryuichi Nakajima2, Li Qiu1, Gregory Tan3,4,
Yanxia Tang3,4,6, Jonathan T. Ting1,11, Sachiko Tsuda3,4,6, Lei Wen2, Xuying Zhang1 and Shengli Zhao1
1 Department of Neurobiology, Duke University Medical Center, Durham, NC,USA2 Center for Functional Connectomics, Korea Institute of Science and Technology, Seoul, South Korea3 Laboratory of Synaptic Circuitry, Program in Neuroscience and Behavioral Disorders, Duke-NUS Graduate Medical School, Singapore, Singapore4 A*STAR/Duke-NUS Neuroscience Research Partnership, Singapore, Singapore5 Department of Physiology, Yong Loo Lin School of Medicine, National University of Singapore, Singapore, Singapore6 Marine Biological Laboratory, Woods Hole, MA USA7 Lee Kong Chian School of Medicine, Nanyang Technological University, Singapore, Singapore8 Institute of Molecular and Cell Biology, Singapore, Singapore9 NUS Graduate School for Integrative Sciences and Engineering, Singapore, Singapore10 Department of Bioengineering, Stanford University, Palo Alto, CA, USA11 Department of Brain and Cognitive Sciences, McGovern Institute for Brain Research, Massachusetts Institute of Technology, Cambridge, MA, USA12 Division of Brain Circuits, National Institute for Basic Biology and The Graduate University of Advanced Studies (Sokendai), Myodaiji, Okazaki, Japan13 CREST, Japan Science and Technology Agency, Saitama, Japan14 Laboratory of Structural Physiology, Faculty of Medicine, Center for Disease Biology and Integrative Medicine, University of Tokyo, Tokyo, Japan
Edited by:
Takao K. Hensch, HarvardUniversity, USA
Reviewed by:
Johannes J. Letzkus, FriedrichMiescher Institute for BiomedicalResearch, SwitzerlandRandy M. Bruno, ColumbiaUniversity, USA
*Correspondence:
George J. Augustine, Center forFunctional Connectomics, KoreaInstitute of Science and Technology,39-1 Hawolgokdong, Seongbukgu,Seoul 136-791, South Koreae-mail: [email protected]†Authors names are listed inalphabetical order.
Here we characterize several new lines of transgenic mice useful for optogeneticanalysis of brain circuit function. These mice express optogenetic probes, such asenhanced halorhodopsin or several different versions of channelrhodopsins, behind variousneuron-specific promoters. These mice permit photoinhibition or photostimulation bothin vitro and in vivo. Our results also reveal the important influence of fluorescent tags onoptogenetic probe expression and function in transgenic mice.
Keywords: optogenetics, channelrhodopsin, photostimulation, photoinhibition, cerebellum, cortex, hippocampus,
pons
INTRODUCTIONOne of the fundamental goals of neuroscience is to understandhow the high-order functions of the brain emerge from the com-plex networks formed by many types of neurons with diversegenetic, physiological, and anatomical properties. Optogenetictools provide unprecedented opportunities for approaching thisgoal by causally linking the activity of specific types of neurons orneural circuits to behavioral output.
Several optogenetic actuators have been identified that allowphotostimulation or photoinhibition of genetically defined pop-ulations of neurons with high temporal and spatial resolution.Among these, the light-gated ion channel channelrhodopsin-2 from Chlamydomonas reinhardtii (ChR2) (Nagel et al., 2003;Boyden et al., 2005) and channelrhodospin-1 from Volvox car-teri (VChR1) (Zhang et al., 2008), as well as chimeric constructssuch as C1V1 (Yizhar et al., 2011), have been developed for pho-tostimulation. Among many other applications, the ability toselectively photostimulate defined populations of neurons enables
high-speed mapping of the spatial organization of circuits byphotostimulating presynaptic neurons with a scanned laser beamwhile using electrophysiology to detect postsynaptic responses indownstream neurons (Petreanu et al., 2007; Wang et al., 2007;Mao et al., 2011; Kim et al., in revision).
Similarly, probes have been developed to enable optogeneticphotoinhibition of neurons. The first example of this class ofprobes was the light-driven chloride pump, halorhodopsin, fromNatronomonas pharaonis (NpHR; Han and Boyden, 2007; Zhanget al., 2007) and its improved versions eNpHR 2.0 and eNpHR3.0 (Gradinaru et al., 2008, 2010; Zhao et al., 2008), as wellas light-driven proton pumps such as archaerhodopsin-3 fromHalorubrum sodomense (Arch; Chow et al., 2010) and bacteri-orhodopsin (Gradinaru et al., 2010) have been harnessed forphotoinhibition.
In order to be useful for neural circuit breaking, these opto-genetic probes must be highly expressed in cell-type specificmanner. Although in utero electroporation (Petreanu et al., 2007;
Frontiers in Neural Circuits www.frontiersin.org November 2013 | Volume 7 | Article 160 | 1
NEURAL CIRCUITS
Asrican et al. Novel optogenetic mice
Huber et al., 2008) and virus-based introduction of optogeneticprobes (for examples, see Boyden et al., 2005; Ishizuka et al., 2006;Atasoy et al., 2008; Kuhlman and Huang, 2008; Tsai et al., 2009)enable high-copy expression in mammalian systems, these strate-gies are limited by incomplete coverage of target neuronal pop-ulations, variable expression levels across cells, and difficulty inidentifying a cell-type specific promoter with an appropriate sizefor viral packaging. These limitations can be overcome by gener-ating transgenic animals with targeted expression of optogeneticprobes. Transgenic animal lines offer the important advantage ofreproducible and stable patterns of optogenetic probe expressionin defined neuronal populations within all individuals of the lineacross generations.
ChR2 and NpHR have been inserted downstream of a varietyof different promoters including Thy1 (Arenkiel et al., 2007; Wanget al., 2007; Zhao et al., 2008), Omp (Dhawale et al., 2010) andOrexin (Tsunematsu et al., 2011). Because this strategy is based onrandom insertion of a transgene, which can cause problems dueto multiple insertion sites, it is becoming more popular to usebacterial artificial chromosomes (BAC) containing the gene foroptogenetic probes along with cell-type specific promoters andnecessary regulatory elements for transgene expression. ChR2 hasbeen successfully expressed in such BAC-based transgenic mice,under regulation by the Vglut2 (Hägglund et al., 2010), Chat (Renet al., 2011; Zhao et al., 2011), VGAT, TPH2, and Pvalb (Zhaoet al., 2011) promoters.
A more flexible approach to generating optogenetic micecomes from crossing existing Cre driver lines with lines contain-ing transgenes for optogenetic probes downstream of a floxedstop cassette. This approach takes advantage of the hundreds ofcell-type specific Cre driver lines that are available. For condi-tional expression of optogenetic probes from a defined genomiclocus, the Cre/loxP system has been proven an efficient approachto achieve genetic targeting of optogenetic probes with high lev-els of expression. To generate a Cre-responsive allele, the genefor the optogenetic probe is inserted into a modified Rosa26locus under the control of a floxed stop cassette, with expres-sion driven by a strong and ubiquitous promoter (Madisen et al.,2010). Recently such lines were developed to allow conditionalexpression of ChR2, Arch, or eNpHR: after breeding those micewith Cre driver lines, the optogenetic probes are specificallyand robustly expressed in a variety of neuron types (Madisenet al., 2012). By using a tamoxifen-sensitive Cre mouse line, ithas even been possible to precisely control the timing of ChR2expression (Katzel et al., 2011). The tetracycline transactivator(tTA)-tetracycline operator (tetO) promoter system is an alterna-tive bigenic approach to generating transgenic optogenetic mice(Chuhma et al., 2011; Tanaka et al., 2012).
Expansion of optogenetic mapping of neural circuits requiresthe creation of new tools that expand the number of neuronaltargets available for photostimulation/photoinhibition, as well aspermit combination of tools in the same animal. With these goalsin mind, we have used a variety of strategies to generate additionalmouse lines. These new transgenic lines take advantage of knownpromoter sequences, a previously described BAC transgenic strat-egy, or a combination of existing transgenic lines for conditionalexpression. These mice provide new opportunities for optoge-netic manipulation of neuronal activity and also provide some
useful technical guidance for engineering future optogeneticmice. This paper describes these new mice and characterizes theirutility for optogenetic analysis of neural circuitry, with empha-sis on their use for high-speed photostimulation-mediated circuitmapping (Petreanu et al., 2007; Wang et al., 2007; Mao et al., 2011;Kim et al., in revision).
MATERIALS AND METHODSTRANSGENIC MICETransgenic mice expressing optogenetic actuators in specific,genetically-defined populations of neurons were prepared usingeither conventional targeting vectors, as described in Wanget al. (2007), or using a BAC transgenic strategy, as describedin Zhao et al. (2011). The specific features of the variouslines described in this paper are shown in Table 1. Notethat many of these have been given to Jackson Labs (JAX)for commercial distribution. Transgenic mice were backcrossedto C57BL/6 and hemizygous transgenic mice were used inour experiments. PCR-based genotyping of mice was done asdescribed in Wang et al. (2007); see Table 1 for the primersused for genotyping each mouse line. PCP2-ChR2-H134R micewere generated by crossing hemizygous PCP2-cre transgenicmice [(Pcp2-cre)2Mpin/J; Jackson Labs] (Barski et al., 2000)to hemizygous mice expressing floxed ChR2-H134R [B6;129S-Gt(ROSA)26Sortm32(CAG−COP4∗H134R/EYFP)Hze/J ] (Madisen et al.,2012) and selecting mice positive for both transgenes. Mice weremaintained with free access to food and water under a 12 hlight/dark cycle. All experimental procedures were approved byand conducted in accordance with the ethical guidelines of theanimal care and use committees of our respective institutions.
HISTOLOGICAL CHARACTERIZATION OF TRANSGENE EXPRESSIONHistology was used to characterize brain expression of opto-genetic probes. For this purpose, adult transgenic mice wereeuthanized with an overdose of halothane or isoflurane andtranscardially perfused with 0.1 M phosphate buffer saline (pH7.4) followed by 4% paraformaldehyde. The brain was removedand stored at 4◦C in the fixative overnight. The brain wasthen sectioned into 50-μm-thick slices on a freezing microtome.Low magnification fluorescence images were obtained on anupright epi-fluorescence microscope (Nikon Eclipse E600-FN orZeiss AxioImager). Higher magnification images were obtainedby laser-scanning confocal microscopes (Leica TCS SP2, NikonA1Rsi or Zeiss LSM510 META). In some cases, live slices fromPV-ChR2-EYFP or Thy1-hChR2-tdTomato mouse brains wereprepared as described below and then imaged on a 2-photonmicroscope (Olympus FV-1000).
WHOLE-CELL PATCH CLAMP RECORDING FROM BRAIN SLICESBrain slices were prepared from transgenic mice aged 2 weeksto 3 months, using conventional methods (Pettit and Augustine,2000; Wang et al., 2007). In brief, isolated brains were sliced(200–350 μm thick parasagittal or coronal sections) in a cold arti-ficial cerebrospinal fluid (ACSF) containing (in mM): 125 NaCl,2.5 KCl, 1.25 NaH2PO4, 26 NaHCO3, 20 D(+)-glucose, 2–2.5CaCl2 and 1–1.3 MgCl2 (some experiments included 0.4 mMascorbic acid) or a high-sucrose ACSF containing: 240 Sucrose,26 NaHCO3, 2.5 KCl, 1.0 CaCl2, 4 MgCl2, 1.25 NaH2PO4, and
Frontiers in Neural Circuits www.frontiersin.org November 2013 | Volume 7 | Article 160 | 2
Asrican et al. Novel optogenetic mice
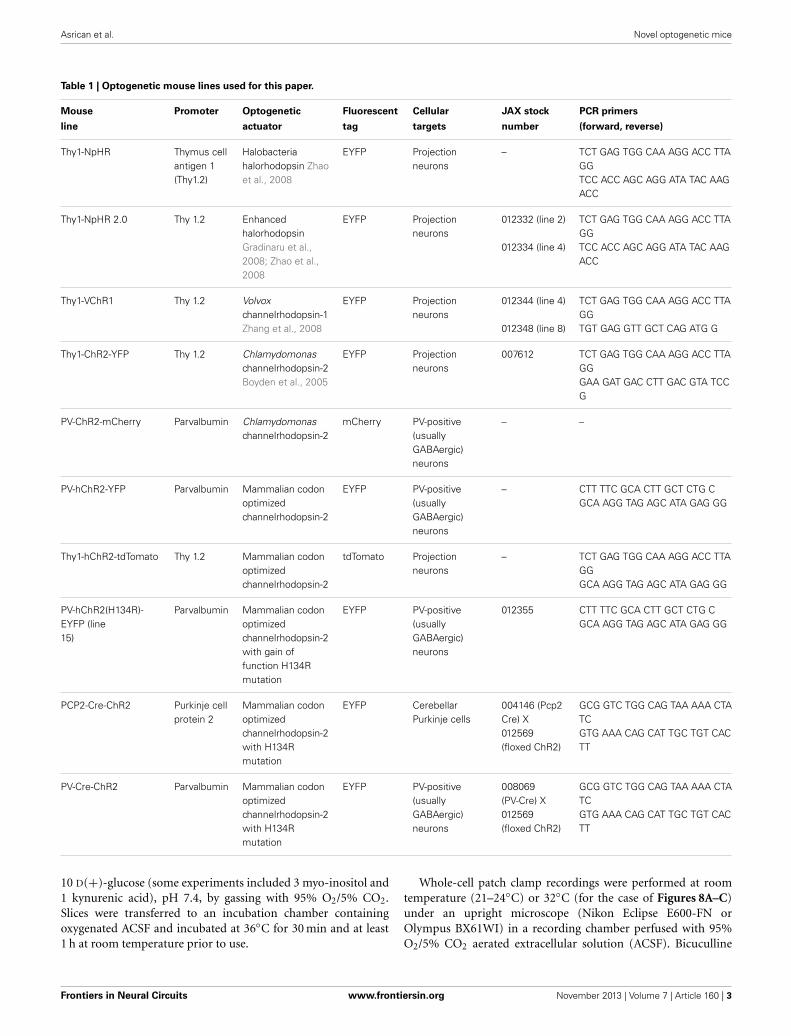
Table 1 | Optogenetic mouse lines used for this paper.
Mouse Promoter Optogenetic Fluorescent Cellular JAX stock PCR primers
line actuator tag targets number (forward, reverse)
Thy1-NpHR Thymus cellantigen 1(Thy1.2)
Halobacteriahalorhodopsin Zhaoet al., 2008
EYFP Projectionneurons
– TCT GAG TGG CAA AGG ACC TTAGGTCC ACC AGC AGG ATA TAC AAGACC
Thy1-NpHR 2.0 Thy 1.2 EnhancedhalorhodopsinGradinaru et al.,2008; Zhao et al.,2008
EYFP Projectionneurons
012332 (line 2)
012334 (line 4)
TCT GAG TGG CAA AGG ACC TTAGGTCC ACC AGC AGG ATA TAC AAGACC
Thy1-VChR1 Thy 1.2 Volvoxchannelrhodopsin-1Zhang et al., 2008
EYFP Projectionneurons
012344 (line 4)
012348 (line 8)
TCT GAG TGG CAA AGG ACC TTAGGTGT GAG GTT GCT CAG ATG G
Thy1-ChR2-YFP Thy 1.2 Chlamydomonaschannelrhodopsin-2Boyden et al., 2005
EYFP Projectionneurons
007612 TCT GAG TGG CAA AGG ACC TTAGGGAA GAT GAC CTT GAC GTA TCCG
PV-ChR2-mCherry Parvalbumin Chlamydomonaschannelrhodopsin-2
mCherry PV-positive(usuallyGABAergic)neurons
– –
PV-hChR2-YFP Parvalbumin Mammalian codonoptimizedchannelrhodopsin-2
EYFP PV-positive(usuallyGABAergic)neurons
– CTT TTC GCA CTT GCT CTG CGCA AGG TAG AGC ATA GAG GG
Thy1-hChR2-tdTomato Thy 1.2 Mammalian codonoptimizedchannelrhodopsin-2
tdTomato Projectionneurons
– TCT GAG TGG CAA AGG ACC TTAGGGCA AGG TAG AGC ATA GAG GG
PV-hChR2(H134R)-EYFP (line15)
Parvalbumin Mammalian codonoptimizedchannelrhodopsin-2with gain offunction H134Rmutation
EYFP PV-positive(usuallyGABAergic)neurons
012355 CTT TTC GCA CTT GCT CTG CGCA AGG TAG AGC ATA GAG GG
PCP2-Cre-ChR2 Purkinje cellprotein 2
Mammalian codonoptimizedchannelrhodopsin-2with H134Rmutation
EYFP CerebellarPurkinje cells
004146 (Pcp2Cre) X012569(floxed ChR2)
GCG GTC TGG CAG TAA AAA CTATCGTG AAA CAG CAT TGC TGT CACTT
PV-Cre-ChR2 Parvalbumin Mammalian codonoptimizedchannelrhodopsin-2with H134Rmutation
EYFP PV-positive(usuallyGABAergic)neurons
008069(PV-Cre) X012569(floxed ChR2)
GCG GTC TGG CAG TAA AAA CTATCGTG AAA CAG CAT TGC TGT CACTT
10 D(+)-glucose (some experiments included 3 myo-inositol and1 kynurenic acid), pH 7.4, by gassing with 95% O2/5% CO2.Slices were transferred to an incubation chamber containingoxygenated ACSF and incubated at 36◦C for 30 min and at least1 h at room temperature prior to use.
Whole-cell patch clamp recordings were performed at roomtemperature (21–24◦C) or 32◦C (for the case of Figures 8A–C)under an upright microscope (Nikon Eclipse E600-FN orOlympus BX61WI) in a recording chamber perfused with 95%O2/5% CO2 aerated extracellular solution (ACSF). Bicuculline
Frontiers in Neural Circuits www.frontiersin.org November 2013 | Volume 7 | Article 160 | 3
Asrican et al. Novel optogenetic mice
(10 μM; Sigma, St. Louis, MO) or GABAzine (SR-95531; 10 μM;Sigma, St. Louis, MO) or 50 μM picrotoxin (Wako, Osaka, Japan),CNQX (10 μM; Sigma) and APV (2-amino-5-phosphonovalericacid; 50 μM; Sigma) were sometimes added to the ACSF to blocksynaptic transmission.
Neurons expressing the various optogenetic probes were iden-tified by their fluorescence; for this purpose, the following fil-ter sets were employed: EYFP—465–495 nm excitation, 505 nmdichroic, 515–555 nm emission; mCherry—528–553 nm excita-tion, 565 nm dichroic, 590–650 nm emission. Fluorescence wasdetected with a CoolSNAP-fx camera (Photometrics, Tucson, AZ)or with an Olympus FV1000-MPE laser-scanning microscope.Whole-cell patch-clamp recordings were made from these neu-rons using pipettes (2–7 M�) filled with internal solution con-taining (in mM): 130 K-gluconate, 2 NaCl, 4 MgCl2, 20 HEPES, 4Na2ATP, 0.4 Na3GTP, 0.25–0.5 EGTA, and 0–0.5 Na2 phospho-creatine, pH 7.25 with 1 M KOH; 290–295 mOsm. For experi-ments involving 2-photon imaging of neurons in slices, internalsolutions also contained the fluorescent dye Alexa Fluor 594(Invitrogen). In these experiments, an Olympus FV-1000 micro-scope was used for 2-photon imaging (790 nm excitation) ofneuronal structure. Unless otherwise indicated, all current mea-surements were made at a holding potential of −70 mV. Whenappropriate, a junction potential of 10 mV was taken into accountwhen reporting membrane potentials. Electrical responses wereacquired with a patch-clamp amplifier (Multiclamp 700B,Axoclamp 1B, or Axoclamp 2B; all Molecular Devices), digitizedat 20 kHz via a Digidata 1440A interface (Molecular Devices),acquired using pClamp software (Molecular Devices), and ana-lyzed using Clampfit, Igor Pro, and/or Origin 8 software.
PHOTOSTIMULATION/PHOTOINHIBITIONTwo different styles of light stimuli were employed to pho-tostimulate or photoinhibit neurons in our experiments. Forwide-field illumination, an upright epi-fluorescence microscope(Nikon Eclipse E600-FN) was used to illuminate the entire widthof the microscope field. In such experiments, an arc lamp wasused to provide light which was then filtered by various band-pass filters to activate ChR2 (465–495 nm), NpHR and eNpHR2.0(545–585 nm), and VChR1 (528–553 nm). Light pulse durationwas controlled by an electronic shutter (Uniblitz T132; Vincent,Rochester, NY) and intensity was adjusted by neutral densityfilters. In a few experiments, a light-emitting diode (PrizmatixUHP-LED-460) provided monochromatic light (460 nm) to acti-vate ChR2.
In other experiments, optogenetic probes were activated bysmall spots of laser light as previously described in Wang et al.(2007). These experiments used a FV-1000MPE laser scanningmicroscope (Olympus) equipped with a 25× (1.05 NA) water-immersion objective. In brief, an area of ∼500 × 500 μm wasscanned with a 405 nm laser spot (typically 4 ms duration) in a32 × 32 array of pixels. The laser spot was scanned in a pseu-dorandom sequence, to avoid activation of adjacent pixels, whilecellular responses were simultaneously measured with whole-cellpatch clamp recordings.
For in vivo photoinhibition (Figure 5), transgenic miceexpressing eNpHR2.0 (aged 3–6.5 months) were used. To fasten
the mice under the microscope, headplates were attached to theskull, as described in Hira et al. (2013), and the mice wereallowed to recover from this surgery for several days. Micewere then anesthetized with isoflurane (0.7–1.1%), the skullwas opened, and the mice were placed under the microscope(Olympus FV1000-MPE laser-scanning microscope). Electricalrecordings were made with an Elgiloy microelectrode with animpedance of 2 M� (TM33B20KT; WPI) that was inserted intothe left caudal forelimb area (CFA; Hira et al., 2013) at a depthof ∼600 μm beneath the cortical surface. Electrode signals wereamplified (DAM-80 amplifier; WPI), filtered at 1–300 Hz or 500–1000 Hz (SIM900; Stanford Research Systems, Sunnyvale, CA),and sampled at 5 kHz (FV1000 system; Olympus).
Spot photostimulation was performed in anesthetized miceusing a green laser (559 nm; 3.2 mW) and an upright microscope(Olympus BX61WI). The area of photostimulation was 2.6 ×2.6 mm when using a 5× MPL objective (0.10 NA, Olympus) andincluded the cortical surface of the left CFA. This area was dividedinto two-dimensional 32 × 32 pixel arrays and each pixel wasthen individually illuminated with the laser scanning system, asdescribed above. To reconstruct a local field potential (LFP) map,the LFP signals were filtered at 1–300 Hz. For each pixel, the meanLFP signal measured for 50 ms before the start of the illuminationwas subtracted from the maximal signal during the illumination(20 ms) at each pixel.
To examine photoinhibition of limb movements, forelimbmovement was evoked by intracortical microstimulation anddetected by a CCD camera. Stimulation was performed with atungsten microelectrode (2 M� impedance; TM33B20KT; WPI)inserted to the right CFA at a depth of ∼600 μm beneaththe cortical surface. Thirty minutes after isoflurane anesthesia,the right CFA was stimulated with a 150 ms train of 0.5 mscathodal pulses of 60 μA at 333 Hz. While the electrical stim-ulation was repeated at 1 Hz, the whole field of view (3.7 mmdiameter), including the cortical surface of the right CFA,was repeatedly and uniformly illuminated for ∼10 s with anorange laser (594 nm; MGL-N-593.5, Changchun New IndustriesOptoelectronics Tech.) that was introduced to the microscopethrough a large-core fiber. Laser intensity on the cortical surfacewas ∼100 mW (9 mW/mm2).
RESULTSIMPROVED PHOTOINHIBITION WITH ENHANCED HALORHODOPSINWe begin characterization of our new optogenetic mouse lines bydescribing NpHR transgenic mice. Neurons from transgenic miceexpressing the first-generation halorhodopsin (NpHR) exhib-ited light-induced photocurrents and photoinhibition of actionpotential firing (Zhao et al., 2008). However, in these mice somehalorhodopsin was retained within the endoplasmic reticulum,yielding neurons with swollen dendrites and axons (Zhao et al.,2008). To avoid problems with intracellular trafficking of NpHR,we took advantage of an enhanced halorhodopsin (eNpHR2.0)that has an added ER export motif and an improved signal peptidesequence to enhance membrane trafficking (Gradinaru et al.,2008; Zhao et al., 2008).
We engineered two transgenic mouse lines, lines 2 and 4, thatused the Thy1.2 promoter to yield neuron-specific expression
Frontiers in Neural Circuits www.frontiersin.org November 2013 | Volume 7 | Article 160 | 4
Asrican et al. Novel optogenetic mice
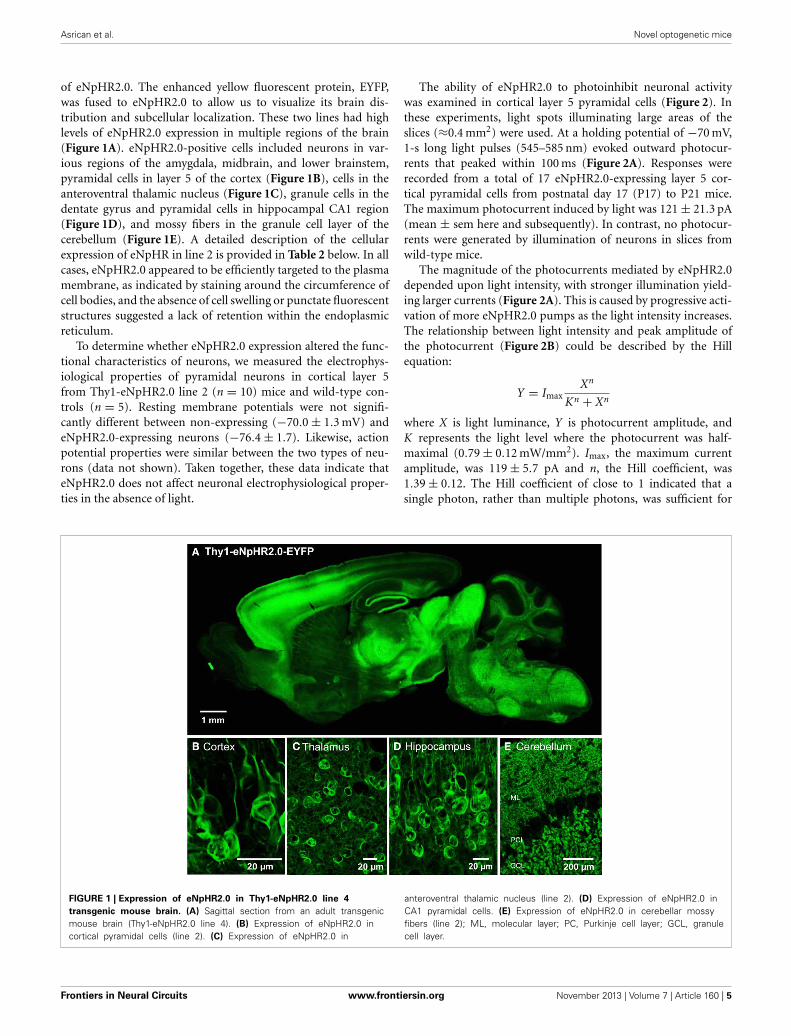
of eNpHR2.0. The enhanced yellow fluorescent protein, EYFP,was fused to eNpHR2.0 to allow us to visualize its brain dis-tribution and subcellular localization. These two lines had highlevels of eNpHR2.0 expression in multiple regions of the brain(Figure 1A). eNpHR2.0-positive cells included neurons in var-ious regions of the amygdala, midbrain, and lower brainstem,pyramidal cells in layer 5 of the cortex (Figure 1B), cells in theanteroventral thalamic nucleus (Figure 1C), granule cells in thedentate gyrus and pyramidal cells in hippocampal CA1 region(Figure 1D), and mossy fibers in the granule cell layer of thecerebellum (Figure 1E). A detailed description of the cellularexpression of eNpHR in line 2 is provided in Table 2 below. In allcases, eNpHR2.0 appeared to be efficiently targeted to the plasmamembrane, as indicated by staining around the circumference ofcell bodies, and the absence of cell swelling or punctate fluorescentstructures suggested a lack of retention within the endoplasmicreticulum.
To determine whether eNpHR2.0 expression altered the func-tional characteristics of neurons, we measured the electrophys-iological properties of pyramidal neurons in cortical layer 5from Thy1-eNpHR2.0 line 2 (n = 10) mice and wild-type con-trols (n = 5). Resting membrane potentials were not signifi-cantly different between non-expressing (−70.0 ± 1.3 mV) andeNpHR2.0-expressing neurons (−76.4 ± 1.7). Likewise, actionpotential properties were similar between the two types of neu-rons (data not shown). Taken together, these data indicate thateNpHR2.0 does not affect neuronal electrophysiological proper-ties in the absence of light.
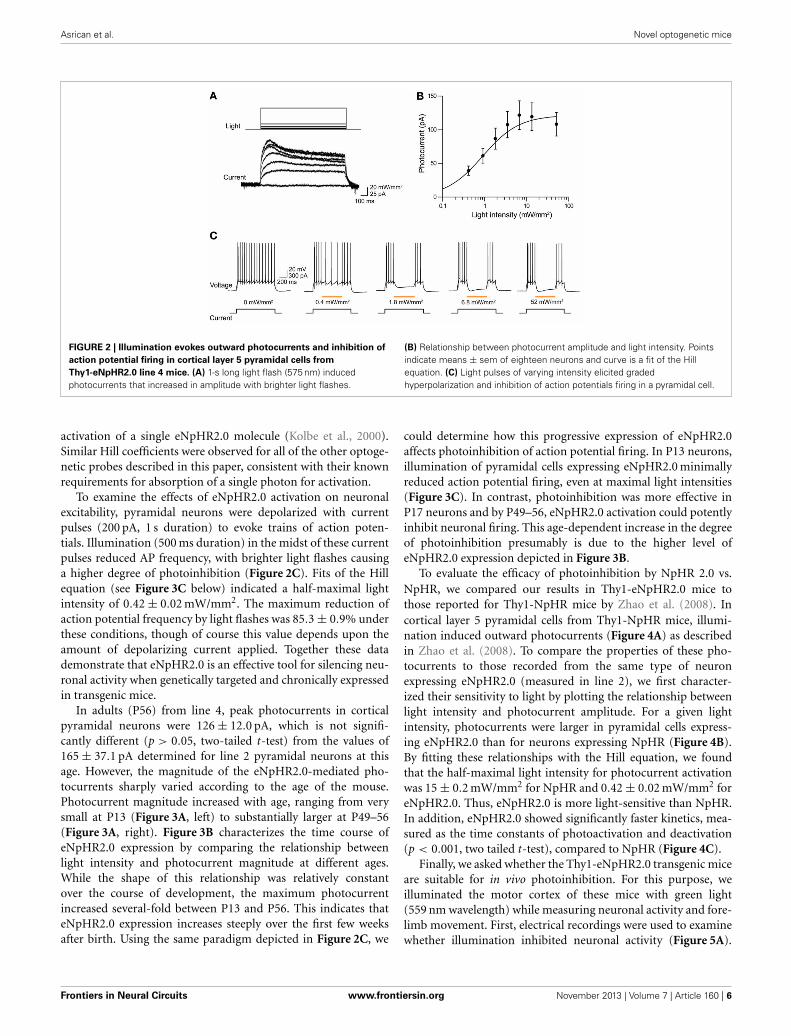
The ability of eNpHR2.0 to photoinhibit neuronal activitywas examined in cortical layer 5 pyramidal cells (Figure 2). Inthese experiments, light spots illuminating large areas of theslices (≈0.4 mm2) were used. At a holding potential of −70 mV,1-s long light pulses (545–585 nm) evoked outward photocur-rents that peaked within 100 ms (Figure 2A). Responses wererecorded from a total of 17 eNpHR2.0-expressing layer 5 cor-tical pyramidal cells from postnatal day 17 (P17) to P21 mice.The maximum photocurrent induced by light was 121 ± 21.3 pA(mean ± sem here and subsequently). In contrast, no photocur-rents were generated by illumination of neurons in slices fromwild-type mice.
The magnitude of the photocurrents mediated by eNpHR2.0depended upon light intensity, with stronger illumination yield-ing larger currents (Figure 2A). This is caused by progressive acti-vation of more eNpHR2.0 pumps as the light intensity increases.The relationship between light intensity and peak amplitude ofthe photocurrent (Figure 2B) could be described by the Hillequation:
Y = ImaxXn
Kn + Xn
where X is light luminance, Y is photocurrent amplitude, andK represents the light level where the photocurrent was half-maximal (0.79 ± 0.12 mW/mm2). Imax, the maximum currentamplitude, was 119 ± 5.7 pA and n, the Hill coefficient, was1.39 ± 0.12. The Hill coefficient of close to 1 indicated that asingle photon, rather than multiple photons, was sufficient for
FIGURE 1 | Expression of eNpHR2.0 in Thy1-eNpHR2.0 line 4
transgenic mouse brain. (A) Sagittal section from an adult transgenicmouse brain (Thy1-eNpHR2.0 line 4). (B) Expression of eNpHR2.0 incortical pyramidal cells (line 2). (C) Expression of eNpHR2.0 in
anteroventral thalamic nucleus (line 2). (D) Expression of eNpHR2.0 inCA1 pyramidal cells. (E) Expression of eNpHR2.0 in cerebellar mossyfibers (line 2); ML, molecular layer; PC, Purkinje cell layer; GCL, granulecell layer.
Frontiers in Neural Circuits www.frontiersin.org November 2013 | Volume 7 | Article 160 | 5
Asrican et al. Novel optogenetic mice
FIGURE 2 | Illumination evokes outward photocurrents and inhibition of
action potential firing in cortical layer 5 pyramidal cells from
Thy1-eNpHR2.0 line 4 mice. (A) 1-s long light flash (575 nm) inducedphotocurrents that increased in amplitude with brighter light flashes.
(B) Relationship between photocurrent amplitude and light intensity. Pointsindicate means ± sem of eighteen neurons and curve is a fit of the Hillequation. (C) Light pulses of varying intensity elicited gradedhyperpolarization and inhibition of action potentials firing in a pyramidal cell.
activation of a single eNpHR2.0 molecule (Kolbe et al., 2000).Similar Hill coefficients were observed for all of the other optoge-netic probes described in this paper, consistent with their knownrequirements for absorption of a single photon for activation.
To examine the effects of eNpHR2.0 activation on neuronalexcitability, pyramidal neurons were depolarized with currentpulses (200 pA, 1 s duration) to evoke trains of action poten-tials. Illumination (500 ms duration) in the midst of these currentpulses reduced AP frequency, with brighter light flashes causinga higher degree of photoinhibition (Figure 2C). Fits of the Hillequation (see Figure 3C below) indicated a half-maximal lightintensity of 0.42 ± 0.02 mW/mm2. The maximum reduction ofaction potential frequency by light flashes was 85.3 ± 0.9% underthese conditions, though of course this value depends upon theamount of depolarizing current applied. Together these datademonstrate that eNpHR2.0 is an effective tool for silencing neu-ronal activity when genetically targeted and chronically expressedin transgenic mice.
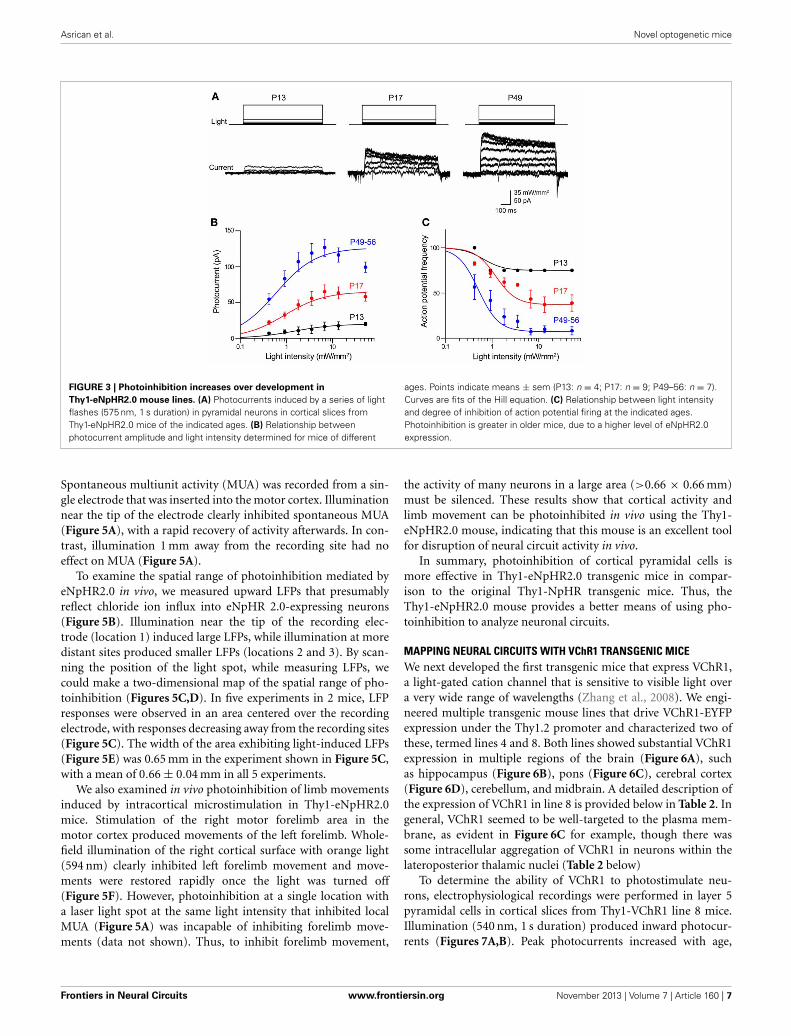
In adults (P56) from line 4, peak photocurrents in corticalpyramidal neurons were 126 ± 12.0 pA, which is not signifi-cantly different (p > 0.05, two-tailed t-test) from the values of165 ± 37.1 pA determined for line 2 pyramidal neurons at thisage. However, the magnitude of the eNpHR2.0-mediated pho-tocurrents sharply varied according to the age of the mouse.Photocurrent magnitude increased with age, ranging from verysmall at P13 (Figure 3A, left) to substantially larger at P49–56(Figure 3A, right). Figure 3B characterizes the time course ofeNpHR2.0 expression by comparing the relationship betweenlight intensity and photocurrent magnitude at different ages.While the shape of this relationship was relatively constantover the course of development, the maximum photocurrentincreased several-fold between P13 and P56. This indicates thateNpHR2.0 expression increases steeply over the first few weeksafter birth. Using the same paradigm depicted in Figure 2C, we
could determine how this progressive expression of eNpHR2.0affects photoinhibition of action potential firing. In P13 neurons,illumination of pyramidal cells expressing eNpHR2.0 minimallyreduced action potential firing, even at maximal light intensities(Figure 3C). In contrast, photoinhibition was more effective inP17 neurons and by P49–56, eNpHR2.0 activation could potentlyinhibit neuronal firing. This age-dependent increase in the degreeof photoinhibition presumably is due to the higher level ofeNpHR2.0 expression depicted in Figure 3B.
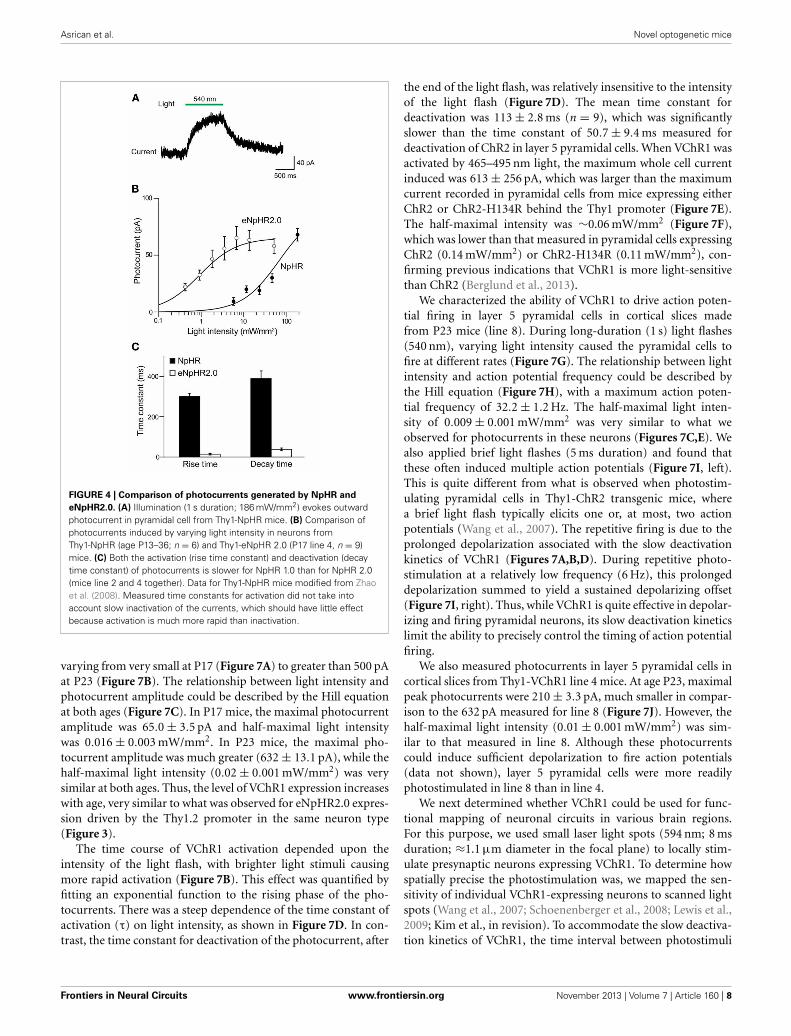
To evaluate the efficacy of photoinhibition by NpHR 2.0 vs.NpHR, we compared our results in Thy1-eNpHR2.0 mice tothose reported for Thy1-NpHR mice by Zhao et al. (2008). Incortical layer 5 pyramidal cells from Thy1-NpHR mice, illumi-nation induced outward photocurrents (Figure 4A) as describedin Zhao et al. (2008). To compare the properties of these pho-tocurrents to those recorded from the same type of neuronexpressing eNpHR2.0 (measured in line 2), we first character-ized their sensitivity to light by plotting the relationship betweenlight intensity and photocurrent amplitude. For a given lightintensity, photocurrents were larger in pyramidal cells express-ing eNpHR2.0 than for neurons expressing NpHR (Figure 4B).By fitting these relationships with the Hill equation, we foundthat the half-maximal light intensity for photocurrent activationwas 15 ± 0.2 mW/mm2 for NpHR and 0.42 ± 0.02 mW/mm2 foreNpHR2.0. Thus, eNpHR2.0 is more light-sensitive than NpHR.In addition, eNpHR2.0 showed significantly faster kinetics, mea-sured as the time constants of photoactivation and deactivation(p < 0.001, two tailed t-test), compared to NpHR (Figure 4C).
Finally, we asked whether the Thy1-eNpHR2.0 transgenic miceare suitable for in vivo photoinhibition. For this purpose, weilluminated the motor cortex of these mice with green light(559 nm wavelength) while measuring neuronal activity and fore-limb movement. First, electrical recordings were used to examinewhether illumination inhibited neuronal activity (Figure 5A).
Frontiers in Neural Circuits www.frontiersin.org November 2013 | Volume 7 | Article 160 | 6
Asrican et al. Novel optogenetic mice
FIGURE 3 | Photoinhibition increases over development in
Thy1-eNpHR2.0 mouse lines. (A) Photocurrents induced by a series of lightflashes (575 nm, 1 s duration) in pyramidal neurons in cortical slices fromThy1-eNpHR2.0 mice of the indicated ages. (B) Relationship betweenphotocurrent amplitude and light intensity determined for mice of different
ages. Points indicate means ± sem (P13: n = 4; P17: n = 9; P49–56: n = 7).Curves are fits of the Hill equation. (C) Relationship between light intensityand degree of inhibition of action potential firing at the indicated ages.Photoinhibition is greater in older mice, due to a higher level of eNpHR2.0expression.
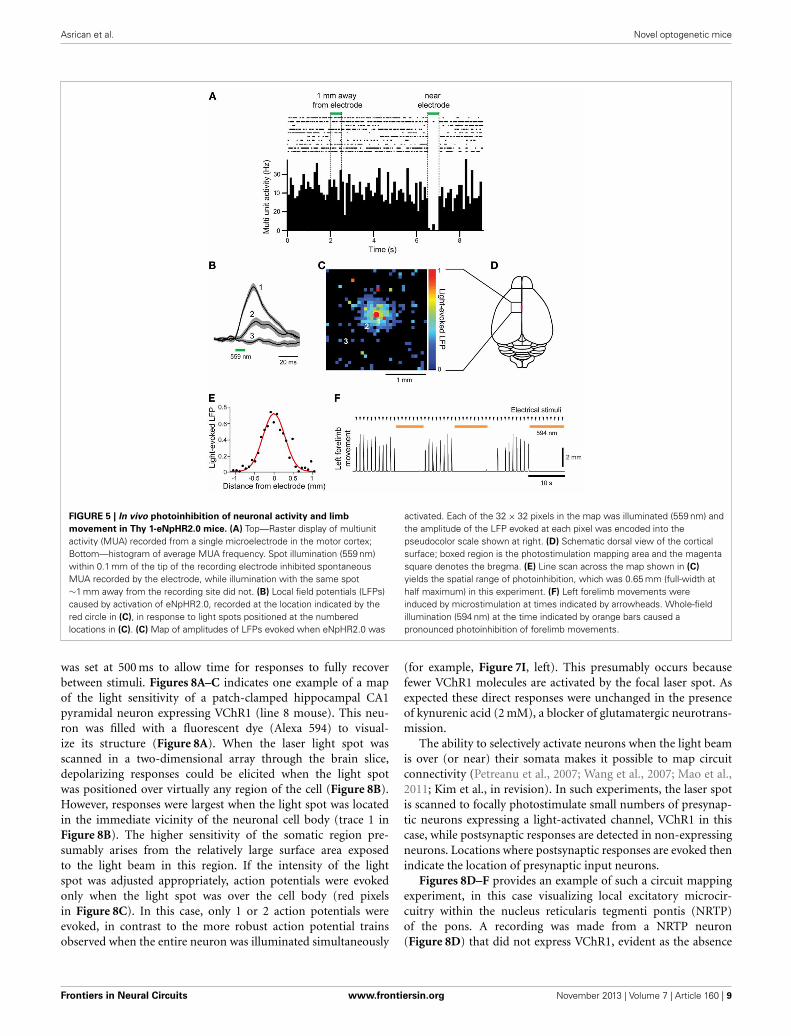
Spontaneous multiunit activity (MUA) was recorded from a sin-gle electrode that was inserted into the motor cortex. Illuminationnear the tip of the electrode clearly inhibited spontaneous MUA(Figure 5A), with a rapid recovery of activity afterwards. In con-trast, illumination 1 mm away from the recording site had noeffect on MUA (Figure 5A).
To examine the spatial range of photoinhibition mediated byeNpHR2.0 in vivo, we measured upward LFPs that presumablyreflect chloride ion influx into eNpHR 2.0-expressing neurons(Figure 5B). Illumination near the tip of the recording elec-trode (location 1) induced large LFPs, while illumination at moredistant sites produced smaller LFPs (locations 2 and 3). By scan-ning the position of the light spot, while measuring LFPs, wecould make a two-dimensional map of the spatial range of pho-toinhibition (Figures 5C,D). In five experiments in 2 mice, LFPresponses were observed in an area centered over the recordingelectrode, with responses decreasing away from the recording sites(Figure 5C). The width of the area exhibiting light-induced LFPs(Figure 5E) was 0.65 mm in the experiment shown in Figure 5C,with a mean of 0.66 ± 0.04 mm in all 5 experiments.
We also examined in vivo photoinhibition of limb movementsinduced by intracortical microstimulation in Thy1-eNpHR2.0mice. Stimulation of the right motor forelimb area in themotor cortex produced movements of the left forelimb. Whole-field illumination of the right cortical surface with orange light(594 nm) clearly inhibited left forelimb movement and move-ments were restored rapidly once the light was turned off(Figure 5F). However, photoinhibition at a single location witha laser light spot at the same light intensity that inhibited localMUA (Figure 5A) was incapable of inhibiting forelimb move-ments (data not shown). Thus, to inhibit forelimb movement,
the activity of many neurons in a large area (>0.66 × 0.66 mm)must be silenced. These results show that cortical activity andlimb movement can be photoinhibited in vivo using the Thy1-eNpHR2.0 mouse, indicating that this mouse is an excellent toolfor disruption of neural circuit activity in vivo.
In summary, photoinhibition of cortical pyramidal cells ismore effective in Thy1-eNpHR2.0 transgenic mice in compar-ison to the original Thy1-NpHR transgenic mice. Thus, theThy1-eNpHR2.0 mouse provides a better means of using pho-toinhibition to analyze neuronal circuits.
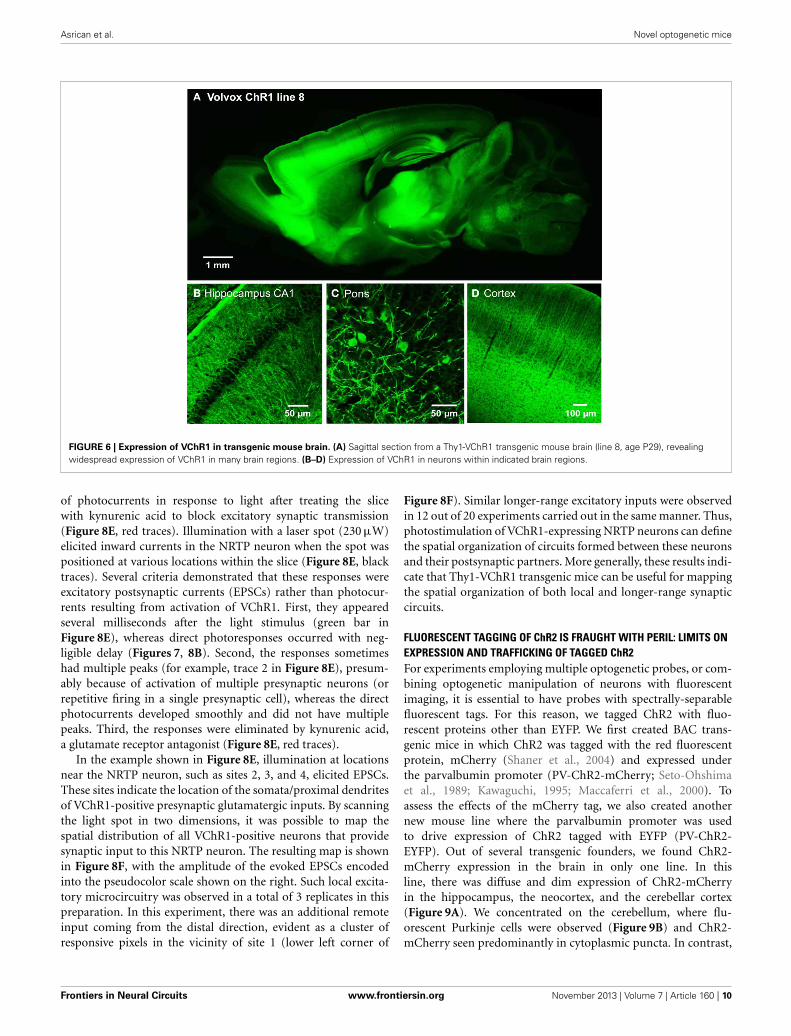
MAPPING NEURAL CIRCUITS WITH VChR1 TRANSGENIC MICEWe next developed the first transgenic mice that express VChR1,a light-gated cation channel that is sensitive to visible light overa very wide range of wavelengths (Zhang et al., 2008). We engi-neered multiple transgenic mouse lines that drive VChR1-EYFPexpression under the Thy1.2 promoter and characterized two ofthese, termed lines 4 and 8. Both lines showed substantial VChR1expression in multiple regions of the brain (Figure 6A), suchas hippocampus (Figure 6B), pons (Figure 6C), cerebral cortex(Figure 6D), cerebellum, and midbrain. A detailed description ofthe expression of VChR1 in line 8 is provided below in Table 2. Ingeneral, VChR1 seemed to be well-targeted to the plasma mem-brane, as evident in Figure 6C for example, though there wassome intracellular aggregation of VChR1 in neurons within thelateroposterior thalamic nuclei (Table 2 below)
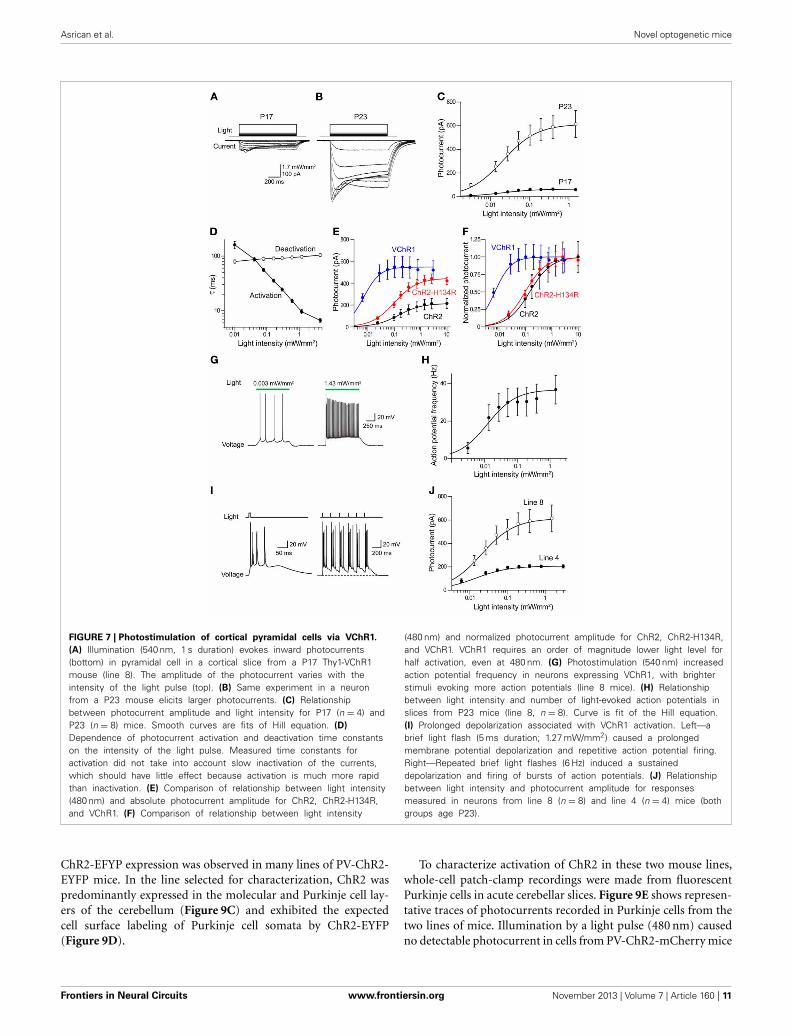
To determine the ability of VChR1 to photostimulate neu-rons, electrophysiological recordings were performed in layer 5pyramidal cells in cortical slices from Thy1-VChR1 line 8 mice.Illumination (540 nm, 1 s duration) produced inward photocur-rents (Figures 7A,B). Peak photocurrents increased with age,
Frontiers in Neural Circuits www.frontiersin.org November 2013 | Volume 7 | Article 160 | 7
Asrican et al. Novel optogenetic mice
FIGURE 4 | Comparison of photocurrents generated by NpHR and
eNpHR2.0. (A) Illumination (1 s duration; 186 mW/mm2) evokes outwardphotocurrent in pyramidal cell from Thy1-NpHR mice. (B) Comparison ofphotocurrents induced by varying light intensity in neurons fromThy1-NpHR (age P13–36; n = 6) and Thy1-eNpHR 2.0 (P17 line 4, n = 9)mice. (C) Both the activation (rise time constant) and deactivation (decaytime constant) of photocurrents is slower for NpHR 1.0 than for NpHR 2.0(mice line 2 and 4 together). Data for Thy1-NpHR mice modified from Zhaoet al. (2008). Measured time constants for activation did not take intoaccount slow inactivation of the currents, which should have little effectbecause activation is much more rapid than inactivation.
varying from very small at P17 (Figure 7A) to greater than 500 pAat P23 (Figure 7B). The relationship between light intensity andphotocurrent amplitude could be described by the Hill equationat both ages (Figure 7C). In P17 mice, the maximal photocurrentamplitude was 65.0 ± 3.5 pA and half-maximal light intensitywas 0.016 ± 0.003 mW/mm2. In P23 mice, the maximal pho-tocurrent amplitude was much greater (632 ± 13.1 pA), while thehalf-maximal light intensity (0.02 ± 0.001 mW/mm2) was verysimilar at both ages. Thus, the level of VChR1 expression increaseswith age, very similar to what was observed for eNpHR2.0 expres-sion driven by the Thy1.2 promoter in the same neuron type(Figure 3).
The time course of VChR1 activation depended upon theintensity of the light flash, with brighter light stimuli causingmore rapid activation (Figure 7B). This effect was quantified byfitting an exponential function to the rising phase of the pho-tocurrents. There was a steep dependence of the time constant ofactivation (τ) on light intensity, as shown in Figure 7D. In con-trast, the time constant for deactivation of the photocurrent, after
the end of the light flash, was relatively insensitive to the intensityof the light flash (Figure 7D). The mean time constant fordeactivation was 113 ± 2.8 ms (n = 9), which was significantlyslower than the time constant of 50.7 ± 9.4 ms measured fordeactivation of ChR2 in layer 5 pyramidal cells. When VChR1 wasactivated by 465–495 nm light, the maximum whole cell currentinduced was 613 ± 256 pA, which was larger than the maximumcurrent recorded in pyramidal cells from mice expressing eitherChR2 or ChR2-H134R behind the Thy1 promoter (Figure 7E).The half-maximal intensity was ∼0.06 mW/mm2 (Figure 7F),which was lower than that measured in pyramidal cells expressingChR2 (0.14 mW/mm2) or ChR2-H134R (0.11 mW/mm2), con-firming previous indications that VChR1 is more light-sensitivethan ChR2 (Berglund et al., 2013).
We characterized the ability of VChR1 to drive action poten-tial firing in layer 5 pyramidal cells in cortical slices madefrom P23 mice (line 8). During long-duration (1 s) light flashes(540 nm), varying light intensity caused the pyramidal cells tofire at different rates (Figure 7G). The relationship between lightintensity and action potential frequency could be described bythe Hill equation (Figure 7H), with a maximum action poten-tial frequency of 32.2 ± 1.2 Hz. The half-maximal light inten-sity of 0.009 ± 0.001 mW/mm2 was very similar to what weobserved for photocurrents in these neurons (Figures 7C,E). Wealso applied brief light flashes (5 ms duration) and found thatthese often induced multiple action potentials (Figure 7I, left).This is quite different from what is observed when photostim-ulating pyramidal cells in Thy1-ChR2 transgenic mice, wherea brief light flash typically elicits one or, at most, two actionpotentials (Wang et al., 2007). The repetitive firing is due to theprolonged depolarization associated with the slow deactivationkinetics of VChR1 (Figures 7A,B,D). During repetitive photo-stimulation at a relatively low frequency (6 Hz), this prolongeddepolarization summed to yield a sustained depolarizing offset(Figure 7I, right). Thus, while VChR1 is quite effective in depolar-izing and firing pyramidal neurons, its slow deactivation kineticslimit the ability to precisely control the timing of action potentialfiring.
We also measured photocurrents in layer 5 pyramidal cells incortical slices from Thy1-VChR1 line 4 mice. At age P23, maximalpeak photocurrents were 210 ± 3.3 pA, much smaller in compar-ison to the 632 pA measured for line 8 (Figure 7J). However, thehalf-maximal light intensity (0.01 ± 0.001 mW/mm2) was sim-ilar to that measured in line 8. Although these photocurrentscould induce sufficient depolarization to fire action potentials(data not shown), layer 5 pyramidal cells were more readilyphotostimulated in line 8 than in line 4.
We next determined whether VChR1 could be used for func-tional mapping of neuronal circuits in various brain regions.For this purpose, we used small laser light spots (594 nm; 8 msduration; ≈1.1 μm diameter in the focal plane) to locally stim-ulate presynaptic neurons expressing VChR1. To determine howspatially precise the photostimulation was, we mapped the sen-sitivity of individual VChR1-expressing neurons to scanned lightspots (Wang et al., 2007; Schoenenberger et al., 2008; Lewis et al.,2009; Kim et al., in revision). To accommodate the slow deactiva-tion kinetics of VChR1, the time interval between photostimuli
Frontiers in Neural Circuits www.frontiersin.org November 2013 | Volume 7 | Article 160 | 8
Asrican et al. Novel optogenetic mice
FIGURE 5 | In vivo photoinhibition of neuronal activity and limb
movement in Thy 1-eNpHR2.0 mice. (A) Top—Raster display of multiunitactivity (MUA) recorded from a single microelectrode in the motor cortex;Bottom—histogram of average MUA frequency. Spot illumination (559 nm)within 0.1 mm of the tip of the recording electrode inhibited spontaneousMUA recorded by the electrode, while illumination with the same spot∼1 mm away from the recording site did not. (B) Local field potentials (LFPs)caused by activation of eNpHR2.0, recorded at the location indicated by thered circle in (C), in response to light spots positioned at the numberedlocations in (C). (C) Map of amplitudes of LFPs evoked when eNpHR2.0 was
activated. Each of the 32 × 32 pixels in the map was illuminated (559 nm) andthe amplitude of the LFP evoked at each pixel was encoded into thepseudocolor scale shown at right. (D) Schematic dorsal view of the corticalsurface; boxed region is the photostimulation mapping area and the magentasquare denotes the bregma. (E) Line scan across the map shown in (C)
yields the spatial range of photoinhibition, which was 0.65 mm (full-width athalf maximum) in this experiment. (F) Left forelimb movements wereinduced by microstimulation at times indicated by arrowheads. Whole-fieldillumination (594 nm) at the time indicated by orange bars caused apronounced photoinhibition of forelimb movements.
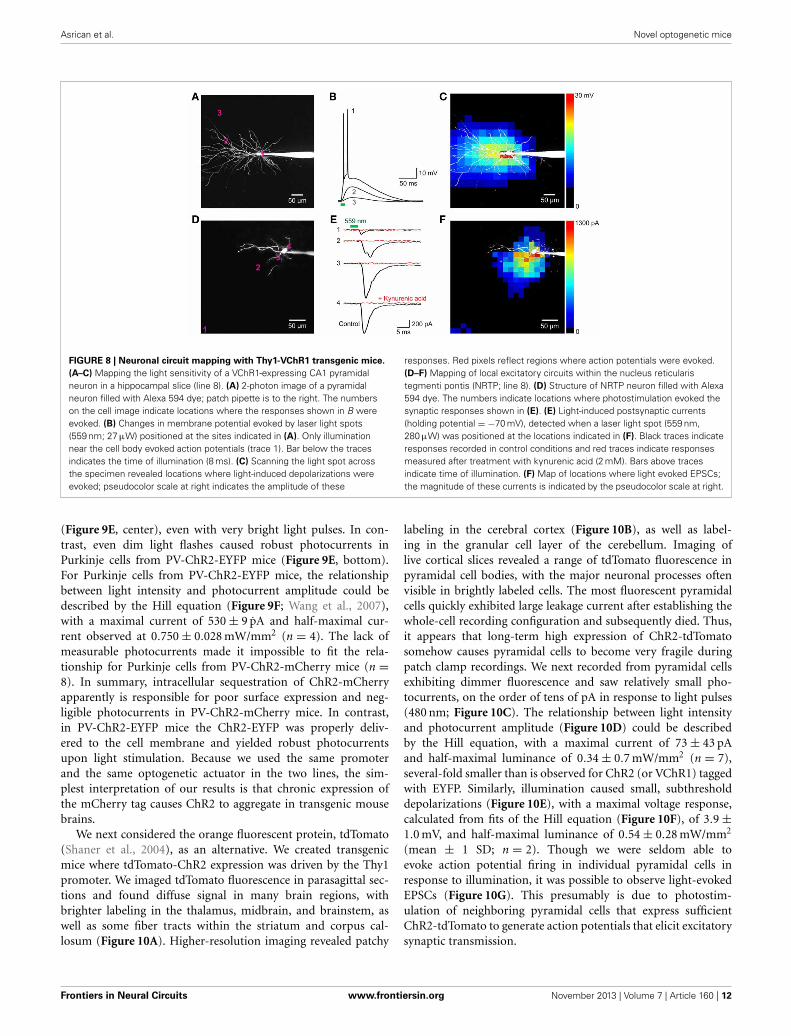
was set at 500 ms to allow time for responses to fully recoverbetween stimuli. Figures 8A–C indicates one example of a mapof the light sensitivity of a patch-clamped hippocampal CA1pyramidal neuron expressing VChR1 (line 8 mouse). This neu-ron was filled with a fluorescent dye (Alexa 594) to visual-ize its structure (Figure 8A). When the laser light spot wasscanned in a two-dimensional array through the brain slice,depolarizing responses could be elicited when the light spotwas positioned over virtually any region of the cell (Figure 8B).However, responses were largest when the light spot was locatedin the immediate vicinity of the neuronal cell body (trace 1 inFigure 8B). The higher sensitivity of the somatic region pre-sumably arises from the relatively large surface area exposedto the light beam in this region. If the intensity of the lightspot was adjusted appropriately, action potentials were evokedonly when the light spot was over the cell body (red pixelsin Figure 8C). In this case, only 1 or 2 action potentials wereevoked, in contrast to the more robust action potential trainsobserved when the entire neuron was illuminated simultaneously
(for example, Figure 7I, left). This presumably occurs becausefewer VChR1 molecules are activated by the focal laser spot. Asexpected these direct responses were unchanged in the presenceof kynurenic acid (2 mM), a blocker of glutamatergic neurotrans-mission.
The ability to selectively activate neurons when the light beamis over (or near) their somata makes it possible to map circuitconnectivity (Petreanu et al., 2007; Wang et al., 2007; Mao et al.,2011; Kim et al., in revision). In such experiments, the laser spotis scanned to focally photostimulate small numbers of presynap-tic neurons expressing a light-activated channel, VChR1 in thiscase, while postsynaptic responses are detected in non-expressingneurons. Locations where postsynaptic responses are evoked thenindicate the location of presynaptic input neurons.
Figures 8D–F provides an example of such a circuit mappingexperiment, in this case visualizing local excitatory microcir-cuitry within the nucleus reticularis tegmenti pontis (NRTP)of the pons. A recording was made from a NRTP neuron(Figure 8D) that did not express VChR1, evident as the absence
Frontiers in Neural Circuits www.frontiersin.org November 2013 | Volume 7 | Article 160 | 9
Asrican et al. Novel optogenetic mice
FIGURE 6 | Expression of VChR1 in transgenic mouse brain. (A) Sagittal section from a Thy1-VChR1 transgenic mouse brain (line 8, age P29), revealingwidespread expression of VChR1 in many brain regions. (B–D) Expression of VChR1 in neurons within indicated brain regions.
of photocurrents in response to light after treating the slicewith kynurenic acid to block excitatory synaptic transmission(Figure 8E, red traces). Illumination with a laser spot (230 μW)elicited inward currents in the NRTP neuron when the spot waspositioned at various locations within the slice (Figure 8E, blacktraces). Several criteria demonstrated that these responses wereexcitatory postsynaptic currents (EPSCs) rather than photocur-rents resulting from activation of VChR1. First, they appearedseveral milliseconds after the light stimulus (green bar inFigure 8E), whereas direct photoresponses occurred with neg-ligible delay (Figures 7, 8B). Second, the responses sometimeshad multiple peaks (for example, trace 2 in Figure 8E), presum-ably because of activation of multiple presynaptic neurons (orrepetitive firing in a single presynaptic cell), whereas the directphotocurrents developed smoothly and did not have multiplepeaks. Third, the responses were eliminated by kynurenic acid,a glutamate receptor antagonist (Figure 8E, red traces).
In the example shown in Figure 8E, illumination at locationsnear the NRTP neuron, such as sites 2, 3, and 4, elicited EPSCs.These sites indicate the location of the somata/proximal dendritesof VChR1-positive presynaptic glutamatergic inputs. By scanningthe light spot in two dimensions, it was possible to map thespatial distribution of all VChR1-positive neurons that providesynaptic input to this NRTP neuron. The resulting map is shownin Figure 8F, with the amplitude of the evoked EPSCs encodedinto the pseudocolor scale shown on the right. Such local excita-tory microcircuitry was observed in a total of 3 replicates in thispreparation. In this experiment, there was an additional remoteinput coming from the distal direction, evident as a cluster ofresponsive pixels in the vicinity of site 1 (lower left corner of
Figure 8F). Similar longer-range excitatory inputs were observedin 12 out of 20 experiments carried out in the same manner. Thus,photostimulation of VChR1-expressing NRTP neurons can definethe spatial organization of circuits formed between these neuronsand their postsynaptic partners. More generally, these results indi-cate that Thy1-VChR1 transgenic mice can be useful for mappingthe spatial organization of both local and longer-range synapticcircuits.
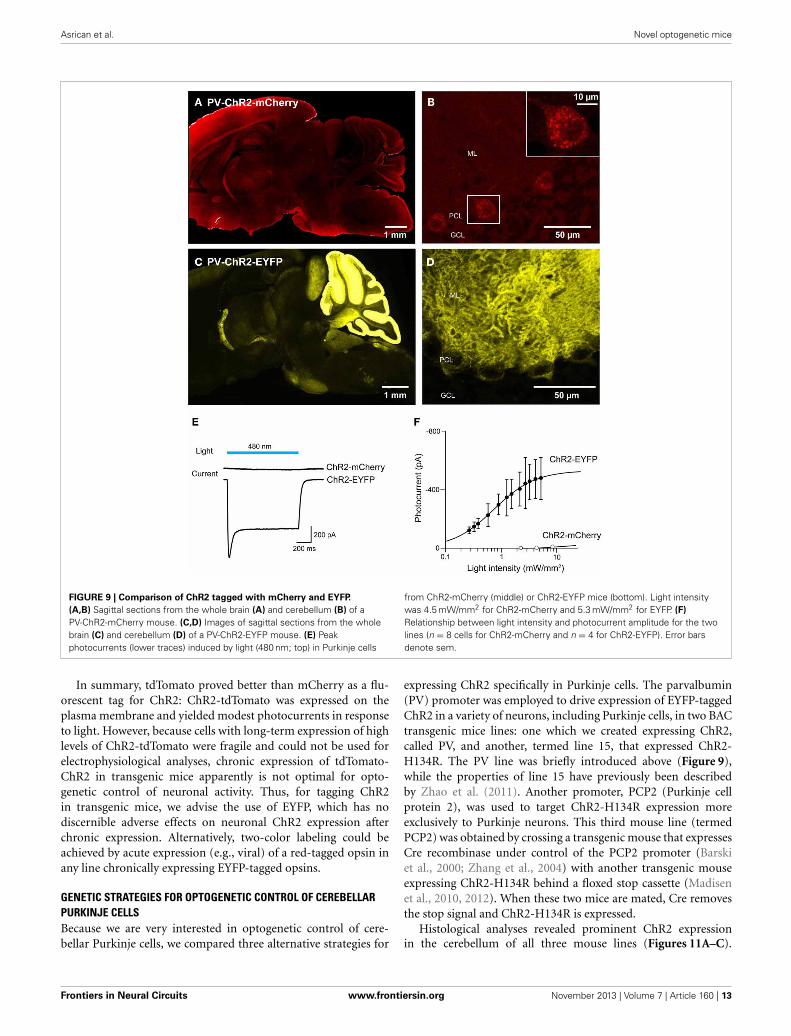
FLUORESCENT TAGGING OF ChR2 IS FRAUGHT WITH PERIL: LIMITS ONEXPRESSION AND TRAFFICKING OF TAGGED ChR2For experiments employing multiple optogenetic probes, or com-bining optogenetic manipulation of neurons with fluorescentimaging, it is essential to have probes with spectrally-separablefluorescent tags. For this reason, we tagged ChR2 with fluo-rescent proteins other than EYFP. We first created BAC trans-genic mice in which ChR2 was tagged with the red fluorescentprotein, mCherry (Shaner et al., 2004) and expressed underthe parvalbumin promoter (PV-ChR2-mCherry; Seto-Ohshimaet al., 1989; Kawaguchi, 1995; Maccaferri et al., 2000). Toassess the effects of the mCherry tag, we also created anothernew mouse line where the parvalbumin promoter was usedto drive expression of ChR2 tagged with EYFP (PV-ChR2-EYFP). Out of several transgenic founders, we found ChR2-mCherry expression in the brain in only one line. In thisline, there was diffuse and dim expression of ChR2-mCherryin the hippocampus, the neocortex, and the cerebellar cortex(Figure 9A). We concentrated on the cerebellum, where flu-orescent Purkinje cells were observed (Figure 9B) and ChR2-mCherry seen predominantly in cytoplasmic puncta. In contrast,
Frontiers in Neural Circuits www.frontiersin.org November 2013 | Volume 7 | Article 160 | 10
Asrican et al. Novel optogenetic mice
FIGURE 7 | Photostimulation of cortical pyramidal cells via VChR1.
(A) Illumination (540 nm, 1 s duration) evokes inward photocurrents(bottom) in pyramidal cell in a cortical slice from a P17 Thy1-VChR1mouse (line 8). The amplitude of the photocurrent varies with theintensity of the light pulse (top). (B) Same experiment in a neuronfrom a P23 mouse elicits larger photocurrents. (C) Relationshipbetween photocurrent amplitude and light intensity for P17 (n = 4) andP23 (n = 8) mice. Smooth curves are fits of Hill equation. (D)
Dependence of photocurrent activation and deactivation time constantson the intensity of the light pulse. Measured time constants foractivation did not take into account slow inactivation of the currents,which should have little effect because activation is much more rapidthan inactivation. (E) Comparison of relationship between light intensity(480 nm) and absolute photocurrent amplitude for ChR2, ChR2-H134R,and VChR1. (F) Comparison of relationship between light intensity
(480 nm) and normalized photocurrent amplitude for ChR2, ChR2-H134R,and VChR1. VChR1 requires an order of magnitude lower light level forhalf activation, even at 480 nm. (G) Photostimulation (540 nm) increasedaction potential frequency in neurons expressing VChR1, with brighterstimuli evoking more action potentials (line 8 mice). (H) Relationshipbetween light intensity and number of light-evoked action potentials inslices from P23 mice (line 8, n = 8). Curve is fit of the Hill equation.(I) Prolonged depolarization associated with VChR1 activation. Left—abrief light flash (5 ms duration; 1.27 mW/mm2) caused a prolongedmembrane potential depolarization and repetitive action potential firing.Right—Repeated brief light flashes (6 Hz) induced a sustaineddepolarization and firing of bursts of action potentials. (J) Relationshipbetween light intensity and photocurrent amplitude for responsesmeasured in neurons from line 8 (n = 8) and line 4 (n = 4) mice (bothgroups age P23).
ChR2-EFYP expression was observed in many lines of PV-ChR2-EYFP mice. In the line selected for characterization, ChR2 waspredominantly expressed in the molecular and Purkinje cell lay-ers of the cerebellum (Figure 9C) and exhibited the expectedcell surface labeling of Purkinje cell somata by ChR2-EYFP(Figure 9D).
To characterize activation of ChR2 in these two mouse lines,whole-cell patch-clamp recordings were made from fluorescentPurkinje cells in acute cerebellar slices. Figure 9E shows represen-tative traces of photocurrents recorded in Purkinje cells from thetwo lines of mice. Illumination by a light pulse (480 nm) causedno detectable photocurrent in cells from PV-ChR2-mCherry mice
Frontiers in Neural Circuits www.frontiersin.org November 2013 | Volume 7 | Article 160 | 11
Asrican et al. Novel optogenetic mice
FIGURE 8 | Neuronal circuit mapping with Thy1-VChR1 transgenic mice.
(A–C) Mapping the light sensitivity of a VChR1-expressing CA1 pyramidalneuron in a hippocampal slice (line 8). (A) 2-photon image of a pyramidalneuron filled with Alexa 594 dye; patch pipette is to the right. The numberson the cell image indicate locations where the responses shown in B wereevoked. (B) Changes in membrane potential evoked by laser light spots(559 nm; 27 μW) positioned at the sites indicated in (A). Only illuminationnear the cell body evoked action potentials (trace 1). Bar below the tracesindicates the time of illumination (8 ms). (C) Scanning the light spot acrossthe specimen revealed locations where light-induced depolarizations wereevoked; pseudocolor scale at right indicates the amplitude of these
responses. Red pixels reflect regions where action potentials were evoked.(D–F) Mapping of local excitatory circuits within the nucleus reticularistegmenti pontis (NRTP; line 8). (D) Structure of NRTP neuron filled with Alexa594 dye. The numbers indicate locations where photostimulation evoked thesynaptic responses shown in (E). (E) Light-induced postsynaptic currents(holding potential = −70 mV), detected when a laser light spot (559 nm,280 μW) was positioned at the locations indicated in (F). Black traces indicateresponses recorded in control conditions and red traces indicate responsesmeasured after treatment with kynurenic acid (2 mM). Bars above tracesindicate time of illumination. (F) Map of locations where light evoked EPSCs;the magnitude of these currents is indicated by the pseudocolor scale at right.
(Figure 9E, center), even with very bright light pulses. In con-trast, even dim light flashes caused robust photocurrents inPurkinje cells from PV-ChR2-EYFP mice (Figure 9E, bottom).For Purkinje cells from PV-ChR2-EYFP mice, the relationshipbetween light intensity and photocurrent amplitude could bedescribed by the Hill equation (Figure 9F; Wang et al., 2007),with a maximal current of 530 ± 9 pA and half-maximal cur-rent observed at 0.750 ± 0.028 mW/mm2 (n = 4). The lack ofmeasurable photocurrents made it impossible to fit the rela-tionship for Purkinje cells from PV-ChR2-mCherry mice (n =8). In summary, intracellular sequestration of ChR2-mCherryapparently is responsible for poor surface expression and neg-ligible photocurrents in PV-ChR2-mCherry mice. In contrast,in PV-ChR2-EYFP mice the ChR2-EYFP was properly deliv-ered to the cell membrane and yielded robust photocurrentsupon light stimulation. Because we used the same promoterand the same optogenetic actuator in the two lines, the sim-plest interpretation of our results is that chronic expression ofthe mCherry tag causes ChR2 to aggregate in transgenic mousebrains.
We next considered the orange fluorescent protein, tdTomato(Shaner et al., 2004), as an alternative. We created transgenicmice where tdTomato-ChR2 expression was driven by the Thy1promoter. We imaged tdTomato fluorescence in parasagittal sec-tions and found diffuse signal in many brain regions, withbrighter labeling in the thalamus, midbrain, and brainstem, aswell as some fiber tracts within the striatum and corpus cal-losum (Figure 10A). Higher-resolution imaging revealed patchy
labeling in the cerebral cortex (Figure 10B), as well as label-ing in the granular cell layer of the cerebellum. Imaging oflive cortical slices revealed a range of tdTomato fluorescence inpyramidal cell bodies, with the major neuronal processes oftenvisible in brightly labeled cells. The most fluorescent pyramidalcells quickly exhibited large leakage current after establishing thewhole-cell recording configuration and subsequently died. Thus,it appears that long-term high expression of ChR2-tdTomatosomehow causes pyramidal cells to become very fragile duringpatch clamp recordings. We next recorded from pyramidal cellsexhibiting dimmer fluorescence and saw relatively small pho-tocurrents, on the order of tens of pA in response to light pulses(480 nm; Figure 10C). The relationship between light intensityand photocurrent amplitude (Figure 10D) could be describedby the Hill equation, with a maximal current of 73 ± 43 pAand half-maximal luminance of 0.34 ± 0.7 mW/mm2 (n = 7),several-fold smaller than is observed for ChR2 (or VChR1) taggedwith EYFP. Similarly, illumination caused small, subthresholddepolarizations (Figure 10E), with a maximal voltage response,calculated from fits of the Hill equation (Figure 10F), of 3.9 ±1.0 mV, and half-maximal luminance of 0.54 ± 0.28 mW/mm2
(mean ± 1 SD; n = 2). Though we were seldom able toevoke action potential firing in individual pyramidal cells inresponse to illumination, it was possible to observe light-evokedEPSCs (Figure 10G). This presumably is due to photostim-ulation of neighboring pyramidal cells that express sufficientChR2-tdTomato to generate action potentials that elicit excitatorysynaptic transmission.
Frontiers in Neural Circuits www.frontiersin.org November 2013 | Volume 7 | Article 160 | 12
Asrican et al. Novel optogenetic mice
FIGURE 9 | Comparison of ChR2 tagged with mCherry and EYFP.
(A,B) Sagittal sections from the whole brain (A) and cerebellum (B) of aPV-ChR2-mCherry mouse. (C,D) Images of sagittal sections from the wholebrain (C) and cerebellum (D) of a PV-ChR2-EYFP mouse. (E) Peakphotocurrents (lower traces) induced by light (480 nm; top) in Purkinje cells
from ChR2-mCherry (middle) or ChR2-EYFP mice (bottom). Light intensitywas 4.5 mW/mm2 for ChR2-mCherry and 5.3 mW/mm2 for EYFP. (F)
Relationship between light intensity and photocurrent amplitude for the twolines (n = 8 cells for ChR2-mCherry and n = 4 for ChR2-EYFP). Error barsdenote sem.
In summary, tdTomato proved better than mCherry as a flu-orescent tag for ChR2: ChR2-tdTomato was expressed on theplasma membrane and yielded modest photocurrents in responseto light. However, because cells with long-term expression of highlevels of ChR2-tdTomato were fragile and could not be used forelectrophysiological analyses, chronic expression of tdTomato-ChR2 in transgenic mice apparently is not optimal for opto-genetic control of neuronal activity. Thus, for tagging ChR2in transgenic mice, we advise the use of EYFP, which has nodiscernible adverse effects on neuronal ChR2 expression afterchronic expression. Alternatively, two-color labeling could beachieved by acute expression (e.g., viral) of a red-tagged opsin inany line chronically expressing EYFP-tagged opsins.
GENETIC STRATEGIES FOR OPTOGENETIC CONTROL OF CEREBELLARPURKINJE CELLSBecause we are very interested in optogenetic control of cere-bellar Purkinje cells, we compared three alternative strategies for
expressing ChR2 specifically in Purkinje cells. The parvalbumin(PV) promoter was employed to drive expression of EYFP-taggedChR2 in a variety of neurons, including Purkinje cells, in two BACtransgenic mice lines: one which we created expressing ChR2,called PV, and another, termed line 15, that expressed ChR2-H134R. The PV line was briefly introduced above (Figure 9),while the properties of line 15 have previously been describedby Zhao et al. (2011). Another promoter, PCP2 (Purkinje cellprotein 2), was used to target ChR2-H134R expression moreexclusively to Purkinje neurons. This third mouse line (termedPCP2) was obtained by crossing a transgenic mouse that expressesCre recombinase under control of the PCP2 promoter (Barskiet al., 2000; Zhang et al., 2004) with another transgenic mouseexpressing ChR2-H134R behind a floxed stop cassette (Madisenet al., 2010, 2012). When these two mice are mated, Cre removesthe stop signal and ChR2-H134R is expressed.
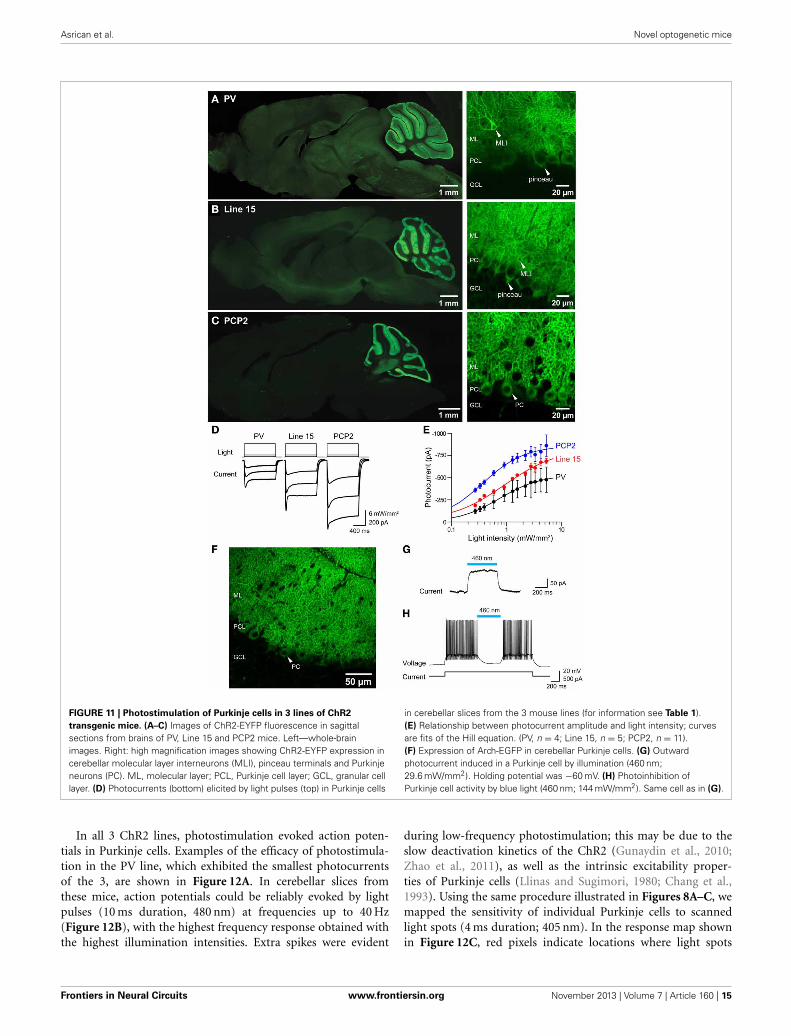
Histological analyses revealed prominent ChR2 expressionin the cerebellum of all three mouse lines (Figures 11A–C).
Frontiers in Neural Circuits www.frontiersin.org November 2013 | Volume 7 | Article 160 | 13
Asrican et al. Novel optogenetic mice
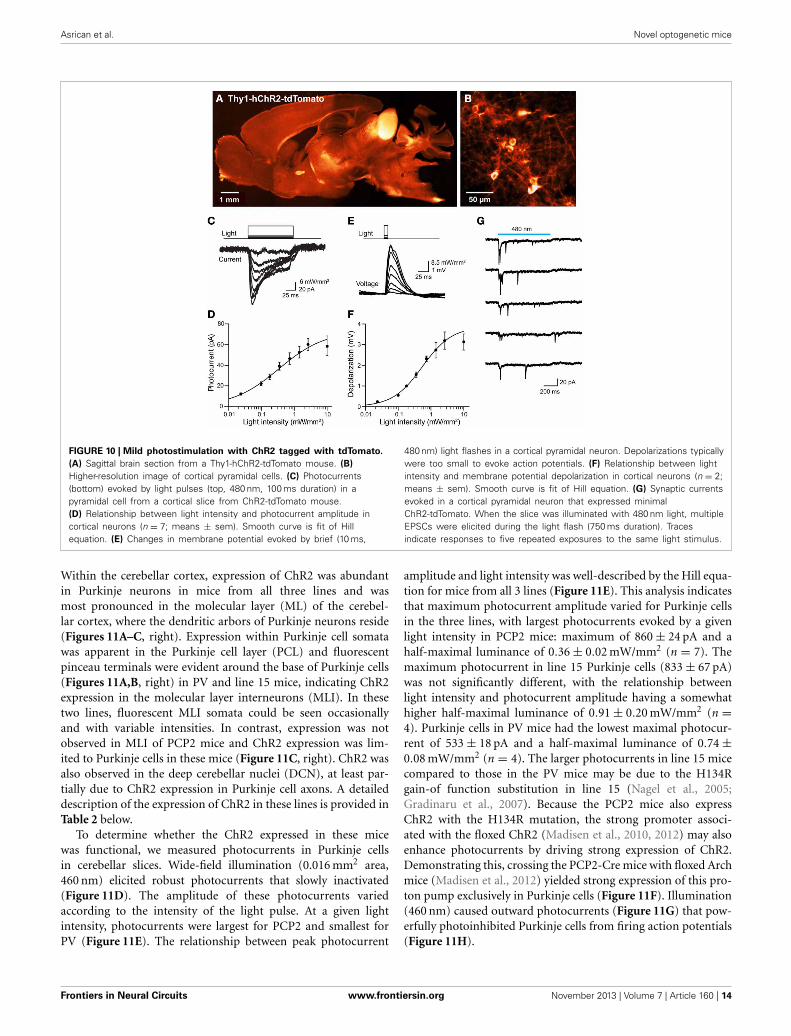
FIGURE 10 | Mild photostimulation with ChR2 tagged with tdTomato.
(A) Sagittal brain section from a Thy1-hChR2-tdTomato mouse. (B)
Higher-resolution image of cortical pyramidal cells. (C) Photocurrents(bottom) evoked by light pulses (top, 480 nm, 100 ms duration) in apyramidal cell from a cortical slice from ChR2-tdTomato mouse.(D) Relationship between light intensity and photocurrent amplitude incortical neurons (n = 7; means ± sem). Smooth curve is fit of Hillequation. (E) Changes in membrane potential evoked by brief (10 ms,
480 nm) light flashes in a cortical pyramidal neuron. Depolarizations typicallywere too small to evoke action potentials. (F) Relationship between lightintensity and membrane potential depolarization in cortical neurons (n = 2;means ± sem). Smooth curve is fit of Hill equation. (G) Synaptic currentsevoked in a cortical pyramidal neuron that expressed minimalChR2-tdTomato. When the slice was illuminated with 480 nm light, multipleEPSCs were elicited during the light flash (750 ms duration). Tracesindicate responses to five repeated exposures to the same light stimulus.
Within the cerebellar cortex, expression of ChR2 was abundantin Purkinje neurons in mice from all three lines and wasmost pronounced in the molecular layer (ML) of the cerebel-lar cortex, where the dendritic arbors of Purkinje neurons reside(Figures 11A–C, right). Expression within Purkinje cell somatawas apparent in the Purkinje cell layer (PCL) and fluorescentpinceau terminals were evident around the base of Purkinje cells(Figures 11A,B, right) in PV and line 15 mice, indicating ChR2expression in the molecular layer interneurons (MLI). In thesetwo lines, fluorescent MLI somata could be seen occasionallyand with variable intensities. In contrast, expression was notobserved in MLI of PCP2 mice and ChR2 expression was lim-ited to Purkinje cells in these mice (Figure 11C, right). ChR2 wasalso observed in the deep cerebellar nuclei (DCN), at least par-tially due to ChR2 expression in Purkinje cell axons. A detaileddescription of the expression of ChR2 in these lines is provided inTable 2 below.
To determine whether the ChR2 expressed in these micewas functional, we measured photocurrents in Purkinje cellsin cerebellar slices. Wide-field illumination (0.016 mm2 area,460 nm) elicited robust photocurrents that slowly inactivated(Figure 11D). The amplitude of these photocurrents variedaccording to the intensity of the light pulse. At a given lightintensity, photocurrents were largest for PCP2 and smallest forPV (Figure 11E). The relationship between peak photocurrent
amplitude and light intensity was well-described by the Hill equa-tion for mice from all 3 lines (Figure 11E). This analysis indicatesthat maximum photocurrent amplitude varied for Purkinje cellsin the three lines, with largest photocurrents evoked by a givenlight intensity in PCP2 mice: maximum of 860 ± 24 pA and ahalf-maximal luminance of 0.36 ± 0.02 mW/mm2 (n = 7). Themaximum photocurrent in line 15 Purkinje cells (833 ± 67 pA)was not significantly different, with the relationship betweenlight intensity and photocurrent amplitude having a somewhathigher half-maximal luminance of 0.91 ± 0.20 mW/mm2 (n =4). Purkinje cells in PV mice had the lowest maximal photocur-rent of 533 ± 18 pA and a half-maximal luminance of 0.74 ±0.08 mW/mm2 (n = 4). The larger photocurrents in line 15 micecompared to those in the PV mice may be due to the H134Rgain-of function substitution in line 15 (Nagel et al., 2005;Gradinaru et al., 2007). Because the PCP2 mice also expressChR2 with the H134R mutation, the strong promoter associ-ated with the floxed ChR2 (Madisen et al., 2010, 2012) may alsoenhance photocurrents by driving strong expression of ChR2.Demonstrating this, crossing the PCP2-Cre mice with floxed Archmice (Madisen et al., 2012) yielded strong expression of this pro-ton pump exclusively in Purkinje cells (Figure 11F). Illumination(460 nm) caused outward photocurrents (Figure 11G) that pow-erfully photoinhibited Purkinje cells from firing action potentials(Figure 11H).
Frontiers in Neural Circuits www.frontiersin.org November 2013 | Volume 7 | Article 160 | 14
Asrican et al. Novel optogenetic mice
FIGURE 11 | Photostimulation of Purkinje cells in 3 lines of ChR2
transgenic mice. (A–C) Images of ChR2-EYFP fluorescence in sagittalsections from brains of PV, Line 15 and PCP2 mice. Left—whole-brainimages. Right: high magnification images showing ChR2-EYFP expression incerebellar molecular layer interneurons (MLI), pinceau terminals and Purkinjeneurons (PC). ML, molecular layer; PCL, Purkinje cell layer; GCL, granular celllayer. (D) Photocurrents (bottom) elicited by light pulses (top) in Purkinje cells
in cerebellar slices from the 3 mouse lines (for information see Table 1).(E) Relationship between photocurrent amplitude and light intensity; curvesare fits of the Hill equation. (PV, n = 4; Line 15, n = 5; PCP2, n = 11).(F) Expression of Arch-EGFP in cerebellar Purkinje cells. (G) Outwardphotocurrent induced in a Purkinje cell by illumination (460 nm;29.6 mW/mm2). Holding potential was −60 mV. (H) Photoinhibition ofPurkinje cell activity by blue light (460 nm; 144 mW/mm2). Same cell as in (G).
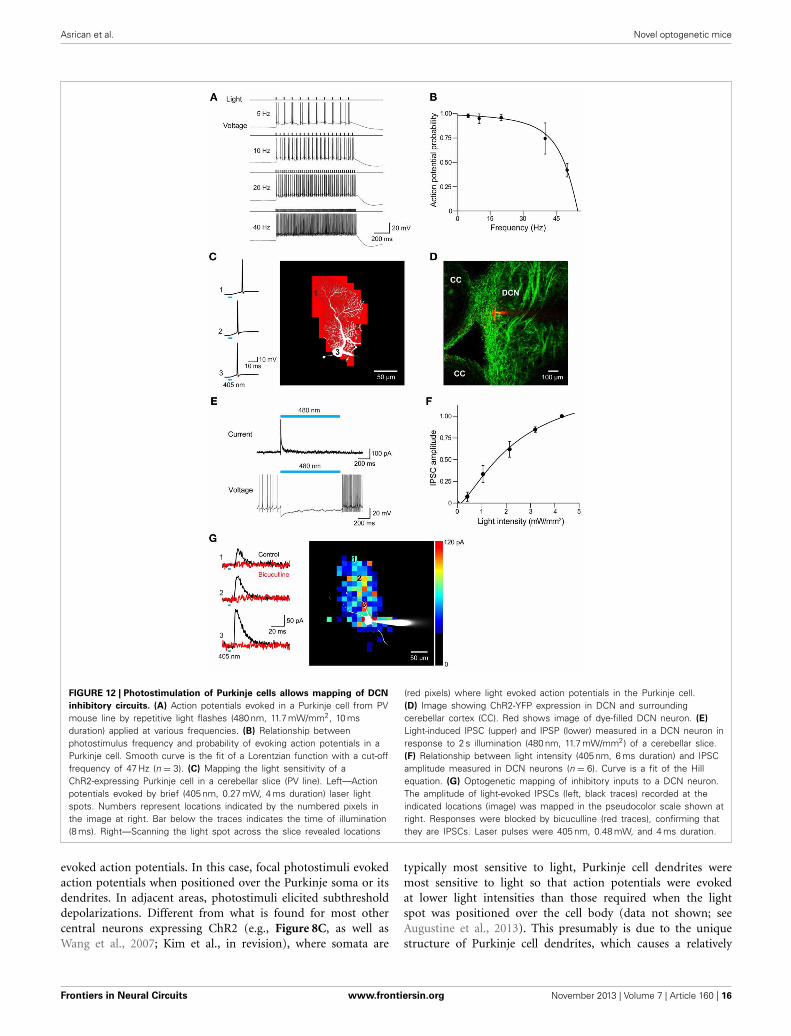
In all 3 ChR2 lines, photostimulation evoked action poten-tials in Purkinje cells. Examples of the efficacy of photostimula-tion in the PV line, which exhibited the smallest photocurrentsof the 3, are shown in Figure 12A. In cerebellar slices fromthese mice, action potentials could be reliably evoked by lightpulses (10 ms duration, 480 nm) at frequencies up to 40 Hz(Figure 12B), with the highest frequency response obtained withthe highest illumination intensities. Extra spikes were evident
during low-frequency photostimulation; this may be due to theslow deactivation kinetics of the ChR2 (Gunaydin et al., 2010;Zhao et al., 2011), as well as the intrinsic excitability proper-ties of Purkinje cells (Llinas and Sugimori, 1980; Chang et al.,1993). Using the same procedure illustrated in Figures 8A–C, wemapped the sensitivity of individual Purkinje cells to scannedlight spots (4 ms duration; 405 nm). In the response map shownin Figure 12C, red pixels indicate locations where light spots
Frontiers in Neural Circuits www.frontiersin.org November 2013 | Volume 7 | Article 160 | 15
Asrican et al. Novel optogenetic mice
FIGURE 12 | Photostimulation of Purkinje cells allows mapping of DCN
inhibitory circuits. (A) Action potentials evoked in a Purkinje cell from PVmouse line by repetitive light flashes (480 nm, 11.7 mW/mm2, 10 msduration) applied at various frequencies. (B) Relationship betweenphotostimulus frequency and probability of evoking action potentials in aPurkinje cell. Smooth curve is the fit of a Lorentzian function with a cut-offfrequency of 47 Hz (n = 3). (C) Mapping the light sensitivity of aChR2-expressing Purkinje cell in a cerebellar slice (PV line). Left—Actionpotentials evoked by brief (405 nm, 0.27 mW, 4 ms duration) laser lightspots. Numbers represent locations indicated by the numbered pixels inthe image at right. Bar below the traces indicates the time of illumination(8 ms). Right—Scanning the light spot across the slice revealed locations
(red pixels) where light evoked action potentials in the Purkinje cell.(D) Image showing ChR2-YFP expression in DCN and surroundingcerebellar cortex (CC). Red shows image of dye-filled DCN neuron. (E)
Light-induced IPSC (upper) and IPSP (lower) measured in a DCN neuron inresponse to 2 s illumination (480 nm, 11.7 mW/mm2) of a cerebellar slice.(F) Relationship between light intensity (405 nm, 6 ms duration) and IPSCamplitude measured in DCN neurons (n = 6). Curve is a fit of the Hillequation. (G) Optogenetic mapping of inhibitory inputs to a DCN neuron.The amplitude of light-evoked IPSCs (left, black traces) recorded at theindicated locations (image) was mapped in the pseudocolor scale shown atright. Responses were blocked by bicuculline (red traces), confirming thatthey are IPSCs. Laser pulses were 405 nm, 0.48 mW, and 4 ms duration.
evoked action potentials. In this case, focal photostimuli evokedaction potentials when positioned over the Purkinje soma or itsdendrites. In adjacent areas, photostimuli elicited subthresholddepolarizations. Different from what is found for most othercentral neurons expressing ChR2 (e.g., Figure 8C, as well asWang et al., 2007; Kim et al., in revision), where somata are
typically most sensitive to light, Purkinje cell dendrites weremost sensitive to light so that action potentials were evokedat lower light intensities than those required when the lightspot was positioned over the cell body (data not shown; seeAugustine et al., 2013). This presumably is due to the uniquestructure of Purkinje cell dendrites, which causes a relatively
Frontiers in Neural Circuits www.frontiersin.org November 2013 | Volume 7 | Article 160 | 16
Asrican et al. Novel optogenetic mice
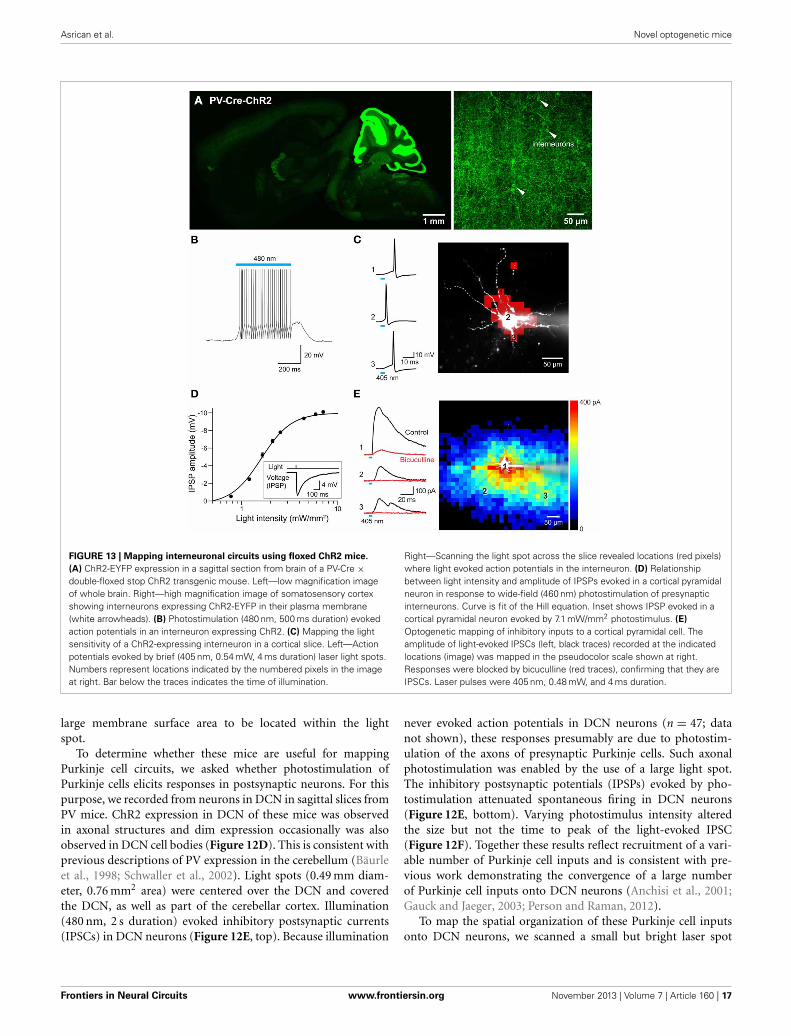
FIGURE 13 | Mapping interneuronal circuits using floxed ChR2 mice.
(A) ChR2-EYFP expression in a sagittal section from brain of a PV-Cre ×double-floxed stop ChR2 transgenic mouse. Left—low magnification imageof whole brain. Right—high magnification image of somatosensory cortexshowing interneurons expressing ChR2-EYFP in their plasma membrane(white arrowheads). (B) Photostimulation (480 nm, 500 ms duration) evokedaction potentials in an interneuron expressing ChR2. (C) Mapping the lightsensitivity of a ChR2-expressing interneuron in a cortical slice. Left—Actionpotentials evoked by brief (405 nm, 0.54 mW, 4 ms duration) laser light spots.Numbers represent locations indicated by the numbered pixels in the imageat right. Bar below the traces indicates the time of illumination.
Right—Scanning the light spot across the slice revealed locations (red pixels)where light evoked action potentials in the interneuron. (D) Relationshipbetween light intensity and amplitude of IPSPs evoked in a cortical pyramidalneuron in response to wide-field (460 nm) photostimulation of presynapticinterneurons. Curve is fit of the Hill equation. Inset shows IPSP evoked in acortical pyramidal neuron evoked by 7.1 mW/mm2 photostimulus. (E)
Optogenetic mapping of inhibitory inputs to a cortical pyramidal cell. Theamplitude of light-evoked IPSCs (left, black traces) recorded at the indicatedlocations (image) was mapped in the pseudocolor scale shown at right.Responses were blocked by bicuculline (red traces), confirming that they areIPSCs. Laser pulses were 405 nm, 0.48 mW, and 4 ms duration.
large membrane surface area to be located within the lightspot.
To determine whether these mice are useful for mappingPurkinje cell circuits, we asked whether photostimulation ofPurkinje cells elicits responses in postsynaptic neurons. For thispurpose, we recorded from neurons in DCN in sagittal slices fromPV mice. ChR2 expression in DCN of these mice was observedin axonal structures and dim expression occasionally was alsoobserved in DCN cell bodies (Figure 12D). This is consistent withprevious descriptions of PV expression in the cerebellum (Bäurleet al., 1998; Schwaller et al., 2002). Light spots (0.49 mm diam-eter, 0.76 mm2 area) were centered over the DCN and coveredthe DCN, as well as part of the cerebellar cortex. Illumination(480 nm, 2 s duration) evoked inhibitory postsynaptic currents(IPSCs) in DCN neurons (Figure 12E, top). Because illumination
never evoked action potentials in DCN neurons (n = 47; datanot shown), these responses presumably are due to photostim-ulation of the axons of presynaptic Purkinje cells. Such axonalphotostimulation was enabled by the use of a large light spot.The inhibitory postsynaptic potentials (IPSPs) evoked by pho-tostimulation attenuated spontaneous firing in DCN neurons(Figure 12E, bottom). Varying photostimulus intensity alteredthe size but not the time to peak of the light-evoked IPSC(Figure 12F). Together these results reflect recruitment of a vari-able number of Purkinje cell inputs and is consistent with pre-vious work demonstrating the convergence of a large numberof Purkinje cell inputs onto DCN neurons (Anchisi et al., 2001;Gauck and Jaeger, 2003; Person and Raman, 2012).
To map the spatial organization of these Purkinje cell inputsonto DCN neurons, we scanned a small but bright laser spot
Frontiers in Neural Circuits www.frontiersin.org November 2013 | Volume 7 | Article 160 | 17
Asrican et al. Novel optogenetic mice
(6 ms duration; 405 nm) while recording IPSCs from postsy-naptic DCN neurons. Photostimulation evoked IPSCs at manylocations (Figure 12G, left); blockade by bicuculline (10 μM)confirmed that these responses were indeed IPSCs. The spa-tial map of these response locations (Figure 12G, right) revealedthat Purkinje cell inputs are spread over a wide area within thedorsal-ventral axis. It is likely that this represents innervation bya bundle of Purkinje cell axons photostimulated by the brightlight spot, with these axons diverging out of the slice at the topof the map.
In summary, all 3 mouse lines allow photostimulation ofPurkinje cells. This capability enables mapping of Purkinje cellcircuitry, among many other applications. Because the PCP2 miceexhibit highest ChR2 expression in Purkinje cells, and negligi-ble expression in MLI, these mice will be the preferred optionexcept for applications where the slower deactivation kinetics ofthe H134R mutation might be limiting.
PHOTOSTIMULATION MAPPING OF CORTICAL INTERNEURONCIRCUITSUse of the Cre/lox system to regulate ChR2 expression in trans-genic mice opens up many more opportunities for optogeneticcontrol of neurons (Madisen et al., 2012). For example, matingthese mice with another mouse line expressing Cre recombinaseunder the control of the PV promoter (Hippenmeyer et al., 2005)provides an alternative to the PV and line 15 BAC transgenicmice described above. Histological analyses of mice derived fromthis cross revealed robust ChR2-H134R expression throughoutthe ML of the cerebellum (Figure 13A, left). Moderate expressioncould be detected in the reticular thalamic nucleus, inferior col-liculus, lateral leminiscus, brainstem, and cerebral cortex (Table 2below). High-magnification images of cortex revealed expres-sion in presumed PV-interneurons within layers 4–5 (Figure 13A,right) but not in cortical pyramidal neurons.
To extend previous optogenetic analyses of cortical interneu-rons (Katzel et al., 2011; Atallah et al., 2012; Lee et al., 2012;Wilson et al., 2012), we used laser-scanning photostimulation tomap the connections between PV-interneurons and pyramidalneurons. Action potential trains were evoked in the interneu-rons in response to wide-field illumination (0.56 mm diameter,500 ms duration, 470–495 nm) of cortical slices (Figure 13B).Adjustment of laser intensity established conditions where actionpotentials were evoked only when scanned laser spots (405 nm,4 ms duration) were positioned over the soma or proximal den-drites of these PV-interneurons (Figure 13C).
Photostimulation of PV-interneurons activated inhibitory cir-cuits within the cortex. This was examined via recordings fromlayer 5 pyramidal cells within the somatosensory barrel cortex.Brief light flashes (4 ms duration, 460 nm) did not cause depolar-izations or inward photocurrents, providing further indicationsthat pyramidal cells in these mice do not express ChR2. However,the light flashes did evoke hyperpolarizing IPSPs in these cells(Figure 13D inset). These IPSPs were larger in amplitude withbrighter light flashes (Figure 13D), due to recruitment of increas-ing numbers of presynaptic interneurons. By scanning a smalllaser spot, while recording from the layer 5 pyramidal cells, itwas possible to map the spatial organization of PV interneuron
inputs to these pyramidal cells. The example shown in Figure 13Eillustrates the relatively wide-ranging input provided to pyra-midal cells by PV interneurons. This is similar to input mapsobtained by stimulating all major subtypes of Gad2-expressinginterneurons (Katzel et al., 2011). This map differs in shape frompreviously published maps of pyramidal cell-pyramidal cell con-nectivity in the cortex (Wang et al., 2007). It is also apparent thatIPSC rise time varied according to the location of the light spot,with locations close to the pyramidal cell body evoking fasterIPSCs than those evoked in more distal locations (Figure 13E,left). This could in part be due to dendritic passive filtering of thesignals (Magee, 2000) or could reflect a difference in the kinet-ics of synaptic transmission associated with different presynapticinterneurons (Markram et al., 2004).
In summary, these results indicate that the transgenic micewith ChR2 expression controlled by a floxed stop cassette arevery useful tools for mapping the circuits in which presynapticcortical interneurons (in this case, PV-expressing interneurons)participate, confirming and extending the conclusions of Madisenet al. (2012). More generally, by mating these mice to other Credriver lines it should be possible to target virtually any type ofpresynaptic neuron for such studies.
DISCUSSIONThe growing variety of optogenetic actuators, and transgenicmouse lines expressing these optogenetic probes in neurons,provide increasingly valuable opportunities to investigate circuitfunction in the mouse brain (Mancuso et al., 2011; Yizhar et al.,2011; Zhang et al., 2011; Zhao et al., 2011; Madisen et al., 2012).Here we have characterized several new transgenic mice thatreflect various approaches for optogenetic control of neurons andexpand the capabilities of this tool set.
NEW MICE EXPRESSING OPTOGENETIC ACTUATORSWe have characterized new transgenic mouse lines for photoin-hibition via NpHR. Poor membrane trafficking of NpHR createsseveral problems, such as small photocurrent amplitude and ERdistention (Gradinaru et al., 2010). Although neurons expressingthis form of NpHR exhibit remarkable anatomical defects, theyseem electrically normal and are capable of generating photocur-rents (Zhao et al., 2008). Versions of NpHR with improved mem-brane trafficking (eNpHR2.0, eNpHR 3.0) avoid ER retentionproblems and yield significantly larger photocurrents (Gradinaruet al., 2010). Our transgenic mice expressing eNpHR2.0 exhibitedthe expected improvement in membrane targeting, as evidencedby the absence of ER swelling. However, we also made three sur-prising observations in these mice. First, maximum photocurrentamplitude (Figure 4B) was not increased over what has beenreported for NpHR (Zhao et al., 2008) in the same type of neu-rons (cortical pyramidal cells) and with expression driven by thesame promoter (Thy 1.2). Second, photocurrents mediated byeNpHR2.0 were activated at lower light intensities compared tophotocurrents recorded in Thy1-NpHR mice (Figure 4B). Third,photocurrents mediated by eNpHR2.0 exhibited markedly fasteractivation and deactivation kinetics (Figure 4C). The reasons forthese unexpected results are unclear but the latter two mightarise as a consequence of improved intracellular trafficking of
Frontiers in Neural Circuits www.frontiersin.org November 2013 | Volume 7 | Article 160 | 18
Asrican et al. Novel optogenetic mice
eNpHR2.0 in the new Thy1-eNpHR mice. The use of eNpHR3.0might improve things even further and, in fact, a Cre-inducibleeNpHR3.0 mouse has already been developed (Madisen et al.,2012). While photoinhibition is robust in this line, the Cre driverline strategy is limited because it can drive expression of only oneoptogenetic effector or reporter. Additionally, the requirement formating two transgenic mouse lines can slow experiments. In suchcases our eNpHR2.0 mice will be a valuable alternative.
With these new transgenic mice, we have shown that it ispossible to reliably photoinhibit neuronal activity both in vitro(Figure 2) and in vivo (Figure 5) and to control motor behav-ior via light (Figure 5F) with sub-millimeter spatial resolution(Figures 5C,E). This performance enables many other photoin-hibition applications. The red-shifted excitation spectrum ofeNpHR2.0 is compatible with independent photostimulation viaChR2 (Gradinaru et al., 2008). It should be noted that we haveexcited ChR2 with 405 nm laser light, which falls short of theeNpHR excitation spectrum, while the 570 nm light we used toexcite eNpHR2.0 is well beyond the excitation maximum forChR2. Thus, the Thy1-eNpHR2.0 transgenic mice could be matedwith ChR2 transgenic mice to permit bi-directional control ofneuronal activity both in vitro and vivo.
We have also characterized several novel mouse lines usefulfor photostimulation. Thy1-VChR1 transgenic mice proved quiteefficient for photostimulation of several types of neurons in var-ious brain regions. In cortical pyramidal cells, VChR1-mediatedphotocurrents were quite substantial in amplitude (several hun-dred pA in P23 mice; Figure 7C), comparable to the largestphotocurrents reported for the same type of neuron in Thy1-ChR2 mice (Wang et al., 2007). Furthermore, VChR1 appearedto be more light-sensitive than ChR2 even when using blue (465–495 nm) light for photostimulation (Figures 7E,F), potentiallymaking the VChR1 mice more valuable than ChR2 mice forin vivo photostimulation applications. As reported previously, thekinetics of deactivation of VChR1 is substantially slower thanthe deactivation of ChR2, yielding a depolarization that persistsfor more than 100 ms after the end of a light flash (Figure 7I).This additional excitatory drive can yield extra action potentialsthat could be a limitation when using these mice for experimentswhere it is important to precisely control the timing, number, orfrequency of action potentials. Nonetheless, the VChR1 mice werefound to be quite useful for circuit analysis: with these mice, wecould employ local photostimulation to map the spatial organi-zation of synaptic connections in the NRTP (Figure 8F) and weare now using these mice for similar applications in other brainregions.
A similar type of trade-off can be seen in photostimu-lation with ChR2 vs. the ChR2 mutant H134R: while pho-tocurrents mediated by ChR2-H134R deactivate more slowlythan those produced by ChR2, ChR2-H134R photocurrents aresomewhat larger in amplitude (Nagel et al., 2005; Gradinaruet al., 2007). We compared photostimulation properties inPurkinje cells expressing either ChR2 (PV) or ChR2-H134R (line15) in BAC transgenic mice using the PV promoter to driveexpression of these two ChR2 variants. In the cells expressingChR2-H134R, photocurrent amplitude was somewhat larger, asexpected (Figure 11E). However, the differences in deactivation
kinetics are not a fatal flaw: because of the intrinsic electri-cal properties of Purkinje cells, even brief activation of ChR2produces extra spikes (Figure 12A). Despite the potential forrepetitive firing, optogenetic circuit mapping can be done bothwith the PV line (Figure 12F) as well as with line 15 (data notshown). Thus, for some applications kinetic properties are moreimportant, while for others the magnitude of photostimulation isthe main consideration. We have described mouse lines that areappropriate in either case.
FLUORESCENT TAGGING OF ChR2It is useful to have optogenetic actuators with a wide range of flu-orescent tags. For example, one channel of fluorescence emissioncan be used to visualize neuronal structure, while another can beused to define the spatial distribution of an optogenetic probe.Using tags of different colors also permits visualization of multi-ple types of actuators in different neuron types. For such reasons,we examined the effects of a total of three fluorescent tags (EYFP,mCherry, and tdTomato) on the function of ChR2 in transgenicmouse lines. Our results reveal that EYFP works well, while bothmCherry and tdTomoto caused critical problems. EGFP taggingalso seems to have no adverse effect on the function of Arch(Figures 11G,H and Madisen et al., 2012) or ChR2 (e.g., Katzelet al., 2011).
In Purkinje cells from PV-ChR2-mCherry mice, there was vir-tually no ChR2 present on the plasma membrane as evident inthe absence of photocurrents in response to light. Instead, ChR2appeared to be aggregated within the cytoplasm (Figure 9). Thisis remarkable, given that mCherry has been used successfullyto tag ChR2 and other optogenetic probes in cultured neurons(Zhang et al., 2007), virus-injected mouse brains (Adamantidiset al., 2007; Zhang et al., 2007), and even in vivo in neurons dif-ferentiated from stem cells (Weick et al., 2010). However, aggre-gation has been reported in transgenic mice expressing mCherryfused to other proteins (Davidson and Campbell, 2009; Perryet al., 2009; Kremers et al., 2011) and there are suggestions ofaggregation in transgenic mice expressing mCherry-tagged ChR2and NpHR (see Figure 1E2 in Chuhma et al., 2011). Thus, aggre-gation of mCherry seems to occur, particularly when the mCherryfusion protein is chronically expressed at high levels.
Tagging ChR2 with tdTomato created a different set ofissues: membrane trafficking of ChR2-tdTomato seemed ade-quate, because photocurrents could be detected in cortical pyra-midal neurons expressing ChR2-tdTomato. However, neuronsexpressing the highest levels of ChR2-tdTomato seemed fragile, asevident by leakiness after establishing whole-cell recording con-ditions. This was a consistent finding observed in laboratoriesin 2 different countries and might help account for previousobservations that neurons expressing ChR2-tdTomato are moreheterogeneous in their sensitivity to light and tend to be less sensi-tive to photostimulation (Madisen et al., 2012). The reason for theapparent fragility of neurons expressing ChR2-tdTomato is notclear, but might be related to the tendency of tdTomato to dimer-ize (Shaner et al., 2004, 2007). Whatever the reasons for theseproblems, for purposes of expression in transgenic mice it seemsadvisable to avoid tagging ChR2 (and other optogenetic probes)with mCherry or tdTomato. Alternatively, it may be possible
Frontiers in Neural Circuits www.frontiersin.org November 2013 | Volume 7 | Article 160 | 19
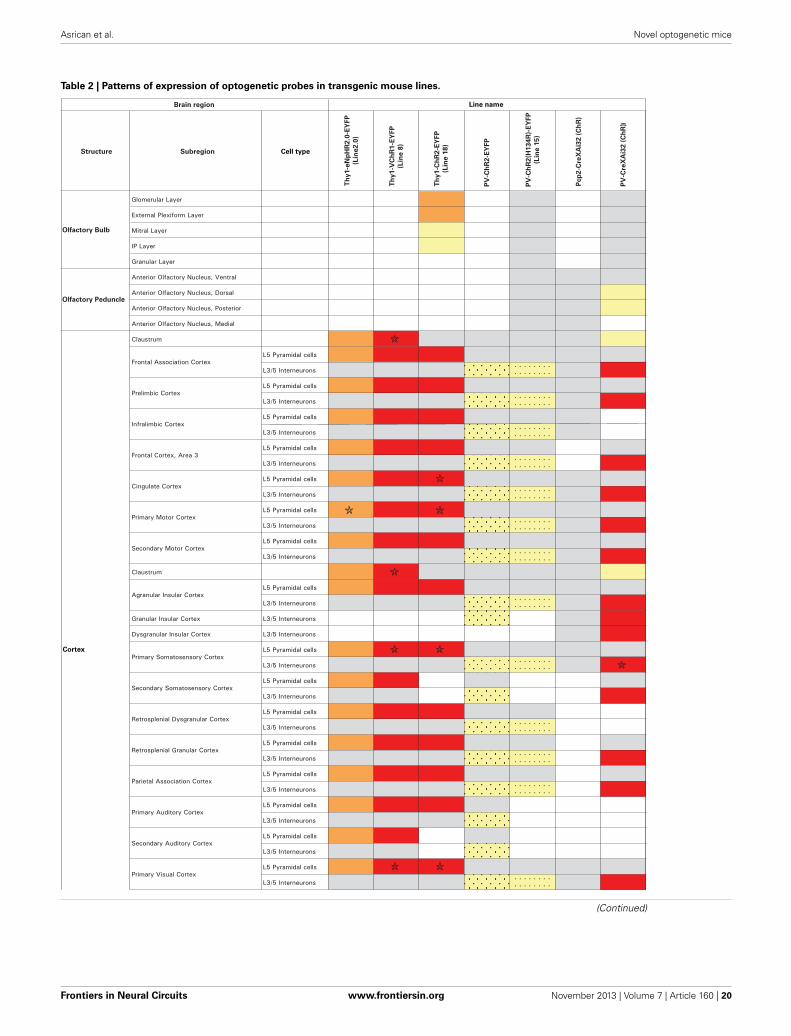
Asrican et al. Novel optogenetic mice
Table 2 | Patterns of expression of optogenetic probes in transgenic mouse lines.
))
Glomerular Layer
External Plexiform Layer
Mitral Layer
IP Layer
Granular Layer
Anterior Olfactory Nucleus, Ventral
Anterior Olfactory Nucleus, Dorsal
Anterior Olfactory Nucleus, Posterior
Anterior Olfactory Nucleus, Medial
Claustrum
L5 Pyramidal cells
L3/5 Interneurons・・・・・・・・・・・・・・・・
L5 Pyramidal cells
L3/5 Interneurons・・・・・・・・・・・・・・・・
L5 Pyramidal cells
L3/5 Interneurons・・・・・・・・・・・・・・・・
L5 Pyramidal cells
L3/5 Interneurons・・・・・・・・・・・・・・・・
L5 Pyramidal cells
L3/5 Interneurons・・・・・・・・・・・・・・・・
L5 Pyramidal cells
L3/5 Interneurons・・・・・・・・・・・・・・・・
L5 Pyramidal cells
L3/5 Interneurons・・・・・・・・・・・・・・・・
Claustrum
L5 Pyramidal cells
L3/5 Interneurons・・・・・・・・・・・・・・・・
Granular Insular Cortex L3/5 Interneurons
Dysgranular Insular Cortex L3/5 Interneurons
L5 Pyramidal cells
L3/5 Interneurons・・・・・・・・・・・・・・・・
L5 Pyramidal cells
L3/5 Interneurons
L5 Pyramidal cells
L3/5 Interneurons・・・・・・・・・・・・・・・・
L5 Pyramidal cells
L3/5 Interneurons・・・・・・・・・・・・・・・・
L5 Pyramidal cells
L3/5 Interneurons・・・・・・・・・・・・・・・・
L5 Pyramidal cells
L3/5 Interneurons
L5 Pyramidal cells
L3/5 Interneurons
L5 Pyramidal cells
L3/5 Interneurons・・・・・・・・・・・・・・・・
Frontal Association Cortex
Secondary Motor Cortex
Primary Motor Cortex
Frontal Cortex, Area 3
Cingulate Cortex
Parietal Association Cortex
Prelimbic Cortex
Primary Somatosensory Cortex
Infralimbic Cortex
Primary Auditory Cortex
Secondary Somatosensory Cortex
Retrosplenial Dysgranular Cortex
Retrosplenial Granular Cortex
Agranular Insular Cortex
Primary Visual Cortex
Secondary Auditory Cortex
Structure
Olfactory Bulb
Olfactory Peduncle
Subregion
Brain region
Cell type
Line name
Th
y1-e
Np
HR
2.0
-EY
FP
(Lin
e2.0
)
Th
y1-V
Ch
R1-E
YFP
(Lin
e 8
)
Th
y1-C
hR
2-E
YFP
(Lin
e 1
8)
PV
-Ch
R2-E
YFP
Pcp
2-C
reX
Ai3
2 (
Ch
R)
PV
-Cre
XA
i32 (
Ch
R)
PV
-Ch
R2(H
134R
)-E
YFP
(Lin
e 1
5)
Cortex
(Continued)
Frontiers in Neural Circuits www.frontiersin.org November 2013 | Volume 7 | Article 160 | 20
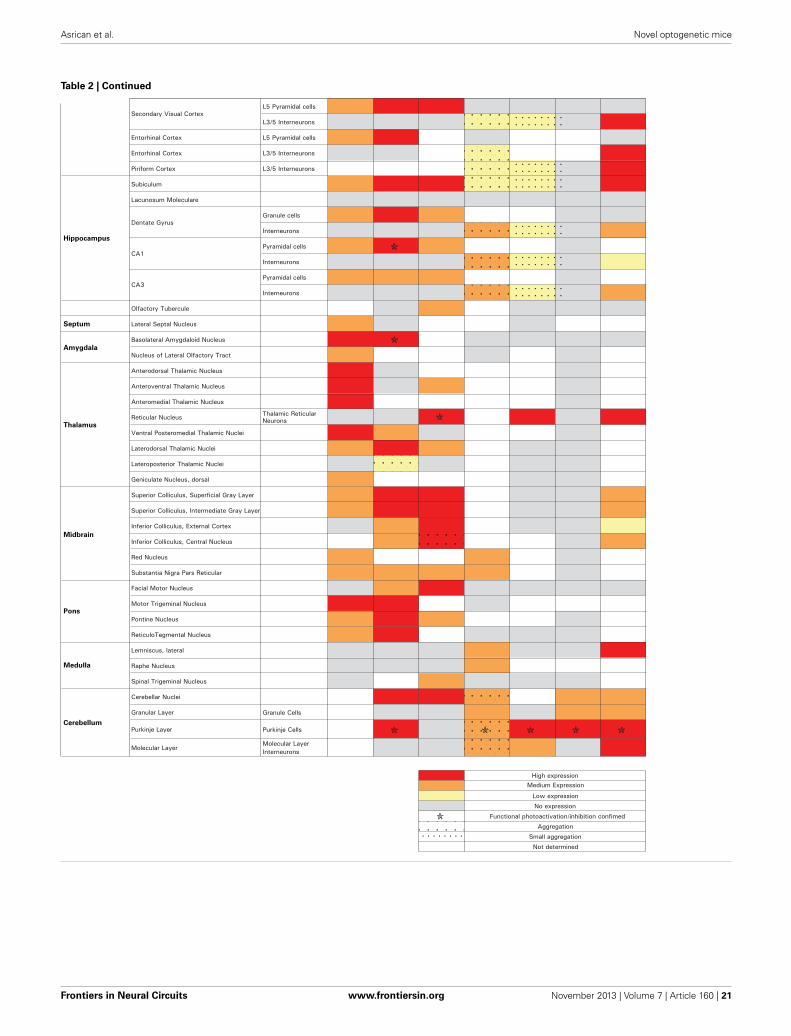
Asrican et al. Novel optogenetic mice
Table 2 | Continued
L5 Pyramidal cells
L3/5 Interneurons・・・・・・・・・・・・・・・・
Entorhinal Cortex L5 Pyramidal cells
Entorhinal Cortex L3/5 Interneurons
Piriform Cortex L3/5 Interneurons・・・・・・・・・・・・・・・・
Subiculum・・・・・・・・・・・・・・・・
Lacunosum Moleculare
Granule cells
Interneurons・・・・・・・・・・・・・・・・
Pyramidal cells
Interneurons・・・・・・・・・・・・・・・・
Pyramidal cells
Interneurons・・・・・・・・・・・・・・・・
Olfactory Tubercule
Lateral Septal Nucleus
Basolateral Amygdaloid Nucleus
Nucleus of Lateral Olfactory Tract
Anterodorsal Thalamic Nucleus
Anteroventral Thalamic Nucleus
Anteromedial Thalamic Nucleus
Reticular Nucleus Thalamic Reticular Neurons
Ventral Posteromedial Thalamic Nuclei
Laterodorsal Thalamic Nuclei
Lateroposterior Thalamic Nuclei
Geniculate Nucleus, dorsal
Superior Colliculus, Superficial Gray Layer
Superior Colliculus, Intermediate Gray Layer
Inferior Colliculus, External Cortex
Inferior Colliculus, Central Nucleus
Red Nucleus
Substantia Nigra Pars Reticular
Facial Motor Nucleus
Motor Trigeminal Nucleus
Pontine Nucleus
ReticuloTegmental Nucleus
Lemniscus, lateral
Raphe Nucleus
Spinal Trigeminal Nucleus
Cerebellar Nuclei
Granular Layer Granule Cells
Purkinje Layer Purkinje Cells
Molecular LayerMolecular Layer Interneurons
・・・・・・・・
High expressionMedium Expression
Low expression
Small aggregation
Functional photoactivation/inhibition confimed
No expression
Aggregation
Not determined
Dentate Gyrus
CA1
CA3
Secondary Visual Cortex
Cerebellum
Medulla
Pons
Thalamus
Amygdala
Septum
Hippocampus
Midbrain
Frontiers in Neural Circuits www.frontiersin.org November 2013 | Volume 7 | Article 160 | 21
Asrican et al. Novel optogenetic mice
to use bi-cistronic strategies, such as IRES or 2a sequences (Tanget al., 2009; Katzel et al., 2011), to express both ChR2 andfluorophores as separate proteins.
MOLECULAR GENETIC EXPRESSION STRATEGIESRecent advances in transgenic mouse technology and optogeneticprobe development provide various approaches for cell-specificcontrol of neurons in the mouse brain (Hägglund et al., 2010;Zhao et al., 2011; Madisen et al., 2012; Tanaka et al., 2012). Weperformed a side-by-side comparison of three transgenic mouselines that express ChR2 in cerebellar Purkinje cells. Our analy-sis demonstrated clear differences between these lines, both inthe degree of cell-type specificity of ChR2 expression and inphotostimulation capabilities. Our conclusion was that target-ing based on Purkinje cell-type expression of Cre recombinaseplus the use of a mouse line expressing a Cre-inducible ChR2-H134R yield expression exclusively in Purkinje cells and largestphotocurrents at a given light intensity (Figure 11). It is possi-ble that future mouse lines incorporating Cre-indicible versionsof even newer ChR2 variants could improve functionality stillfurther (Gunaydin et al., 2010; Berndt et al., 2011; Kleinlogelet al., 2011). Furthermore, our results confirm the versatility ofthe Cre/lox strategy for expression of other optogenetic probes,such as Arch, in Purkinje cells and suggest a broad utility fortargeting ChR2 expression to other genetically-defined neuronalpopulations. Indeed, the availability of many hundreds of Credriver lines should greatly facilitate the generation of trans-genic mice expressing optogenetic probes in almost any neuronof interest.
FUNCTIONAL CONNECTOMICSThe mouse brain consists of approximately 1011 neurons of hun-dreds of different types that form ∼1014 synaptic connections(Marois and Ivanoff, 2005). In recent years it has been pro-posed that this complete collection of synaptic connections—theconnectome—might be fully described (Lichtman et al., 2008;see also Sporns et al., 2005 for the human brain). While mostcurrent efforts to characterize the mouse brain connectomeare based on high-content anatomical analyses (Smith, 2007;Lichtman and Denk, 2011), it is also possible to envision a func-tional analysis based on ChR2-mediated photostimulation (Luoet al., 2008; Augustine et al., 2012). For this purpose, we have
summarized the patterns of expression of such probes for someof the lines that are characterized in the present paper, as well asin previous work done as part of the collaboration between theAugustine, Deisseroth and Feng labs (Table 2). This analysis isbased on histological observation of fluorescently-tagged probesin the cell bodies of the indicated neurons, as well as confir-mation of functionality in some cases. This summary makesclear that on the order of 100 different types of neurons arenow addressable via optogenetic photostimulation, meaning thatthe spatial organization of their circuits can be characterizedusing the local photostimulation approach depicted in Figures 8,13. This already represents a significant fraction of all neurontypes found in the mouse brain and it is reasonable to imag-ine that the remaining cell types could be covered by matingexisting Cre driver lines to floxed ChR2 lines, as exemplified inFigures 11–13. Recent improvements in optogenetic approachesfor imaging neuronal activity (Kralj et al., 2011; Baker et al., 2012;Jin et al., 2012; Knopfel, 2012; Akerboom et al., 2013; Grimleyet al., 2013; Marvin et al., 2013) promise to further acceleratemapping throughput (Luo et al., 2008; Mancuso et al., 2011;Augustine et al., 2012).
In conclusion, we have characterized several new lines oftransgenic mice that will aid optogenetic analysis of brainfunction at the level of individual neurons, synaptic circuits,and the entire connectome. Most of these mice are commer-cially available (Table 1) and express a variety of optogeneticprobes in many different types of neurons (Table 2). In addi-tion, our efforts indicate some pitfalls associated with trans-genic expression of fluorescently tagged optogenetic probesand compare several different molecular genetic strategiesfor transgenic expression of optogenetic probes in mouseneurons.
ACKNOWLEDGMENTSWe thank P. Namburi for software development, J. Sng forproviding PV-Cre mice, and E. Ellison, H. Gill, M. Kee, M. Lee,and P. Teo for technical assistance. This work was supported by aCRP grant from the National Research Foundation of Singaporeand by the World Class Institute (WCI) Program of the NationalResearch Foundation of Korea (NRF) funded by the Ministry ofEducation, Science and Technology of Korea (MEST) (NRF GrantNumber: WCI 2009-003).
REFERENCESAdamantidis, A. R., Zhang, F., Aravanis,
A. M., Deisseroth, K., and deLecea, L. (2007). Neural substratesof awakening probed with opto-genetic control of hypocretin neu-rons. Nature 450, 420–424. doi:10.1038/nature06310
Akerboom, J., Carreras Calderon, N.,Tian, L., Wabnig, S., Prigge, M.,Tolo, J., et al. (2013). Geneticallyencoded calcium indicators formulti-color neural activity imagingand combination with optogenet-ics. Front. Mol. Neurosci. 6:2. doi:10.3389/fnmol.2013.00002
Anchisi, D., Scelfo, B., andTempia, F. (2001). Postsynapticcurrents in deep cerebellarnuclei. J. Neurophysiol. 85,323–331.
Arenkiel, B. R., Peca, J., Davison, I.G., Feliciano, C., Deisseroth, K.,Augustine, G. J., et al. (2007).In vivo light-induced activationof neural circuitry in transgenicmice expressing channelrhodopsin-2. Neuron 54, 205–218. doi:10.1016/j.neuron.2007.03.005
Atasoy, D., Aponte, Y., Su, H. H., andSternson, S. M. (2008). A FLEXswitch targets Channelrhodopsin-2
to multiple cell types for imagingand long-range circuit mapping.J. Neurosci. 28, 7025–7030. doi:10.1523/JNEUROSCI.1954-08.2008
Atallah, B. V., Bruns, W., Carandini,M., and Scanziani, M. (2012).Parvalbumin-expressing interneu-rons linearly transform corticalresponses to visual stimuli. Neuron73, 159–170. doi: 10.1016/j.neuron.2011.12.013
Augustine, G. J., Berglund, K., Gill, H.,Hoffmann, C., Katarya, M., Kim, J.,et al. (2012). Optogenetic mappingof brain circuitry. Proc. SPIE 8548,85483Y. doi: 10.1117/12.2008665
Augustine, G. J., Chen, S., Gill, H.,Katarya, M., Kim, J., Kudolo,J., et al. (2013). High-speedoptogenetic circuit mapping.Proc. SPIE 8586, 858603. doi:10.1117/12.2012404
Baker, B. J., Jin, L., Han, Z., Cohen,L. B., Popovic, M., Platisa, J.,et al. (2012). Genetically encodedfluorescent voltage sensors usingthe voltage-sensing domain ofNematostella and Danio phos-phatases exhibit fast kinetics.J. Neurosci. Methods 208, 190–196.doi: 10.1016/j.jneumeth.2012.05.016
Frontiers in Neural Circuits www.frontiersin.org November 2013 | Volume 7 | Article 160 | 22
Asrican et al. Novel optogenetic mice
Barski, J. J., Dethleffsen, K., and Meyer,M. (2000). Cre recombinase expres-sion in cerebellar Purkinje cells.Genesis 28, 93–98. doi: 10.1002/1526-968X(200011/12)28:3/4<93::AID-GENE10>3.3.CO;2-N
Bäurle, J., Hoshi, M., and Grusser-Cornehls, U. (1998). Dependenceof parvalbumin expression onPurkinje cell input in the deepcerebellar nuclei. J. Comp. Neurol.392, 499–514. doi: 10.1002/(SICI)1096-9861(19980323)392:4<499::AID-CNE7>3.0.CO;2-W
Berglund, K., Birkner, E., Augustine, G.,and Hochgeschwender, U. (2013).Light-emitting channelrhodopsinsfor combined optogenetic andchemical-genetic control ofneurons. PLoS ONE 8:e59759.doi: 10.1371/journal.pone.0059759
Berndt, A., Schoenenberger, P., Mattis,J., Tye, K. M., Deisseroth, K.,Hegemann, P., et al. (2011). High-efficiency channelrhodopsinsfor fast neuronal stimulation atlow light levels. Proc. Natl. Acad.Sci. U.S.A. 108, 7595–7600. doi:10.1073/pnas.1017210108
Boyden, E. S., Zhang, F., Bamberg,E., Nagel, G., and Deisseroth, K.(2005). Millisecond-timescale,genetically targeted optical controlof neural activity. Nat. Neurosci. 8,1263–1268. doi: 10.1038/nn1525
Chang, W., Strahlendorf, J. C., andStrahlendorf, H. K. (1993). Ioniccontributions to the oscillatoryfiring activity of rat Purkinjecells in vitro. Brain Res. 614,335–341. doi: 10.1016/0006-8993(93)91052-T
Chow, B. Y., Han, X., Dobry, A. S.,Qian, X., Chuong, A. S., Li, M.,et al. (2010). High-performancegenetically targetable optical neu-ral silencing by light-driven protonpumps. Nature 463, 98–102. doi:10.1038/nature08652
Chuhma, N., Tanaka, K. F., Hen,R., and Rayport, S. (2011).Functional connectome of thestriatal medium spiny neuron.J. Neurosci. 31, 1183–1192. doi:10.1523/JNEUROSCI.3833-10.2011
Davidson, M. W., and Campbell, R.E. (2009). Engineered fluorescentproteins: innovations and applica-tions. Nat. Methods 6, 713–717. doi:10.1038/nmeth1009-713
Dhawale, A. K., Hagiwara, A., Bhalla,U. S., Murthy, V. N., and Albeanu,D. F. (2010). Non-redundant odorcoding by sister mitral cells revealedby light addressable glomeruliin the mouse. Nat. Neurosci. 13,1404–1412. doi: 10.1038/nn.2673
Gauck, V., and Jaeger, D. (2003).The contribution of NMDA and
AMPA conductances to the controlof spiking in neurons of the deepcerebellar nuclei. J. Neurosci. 23,8109–8118.
Gradinaru, V., Thompson, K. R., andDeisseroth, K. (2008). eNpHR:a Natronomonas halorhodopsinenhanced for optogenetic applica-tions. Brain Cell Biol. 36, 129–139.doi: 10.1007/s11068-008-9027-6
Gradinaru, V., Thompson, K. R.,Zhang, F., Mogri, M., Kay, K.,Schneider, M. B., et al. (2007).Targeting and readout strate-gies for fast optical neuralcontrol in vitro and in vivo.J. Neurosci. 27, 14231–14238. doi:10.1523/JNEUROSCI.3578-07.2007
Gradinaru, V., Zhang, F.,Ramakrishnan, C., Mattis, J.,Prakash, R., Diester, I., et al. (2010).Molecular and cellular approachesfor diversifying and extendingoptogenetics. Cell 141, 154–165.doi: 10.1016/j.cell.2010.02.037
Grimley, J. S., Li, L., Wang, W., Beese, L.S., Hellinga, H. W., and Augustine,G. J. (2013). Visualization ofsynaptic inhibition with an optoge-netic sensor developed by cell-freeprotein engineering automation.J. Neurosci. 33, 16297–16309. doi:10.1523/JNEUROSCI.4616-11.2013
Gunaydin, L. A., Yizhar, O., Berndt,A., Sohal, V. S., Deisseroth,K., and Hegemann, P. (2010).Ultrafast optogenetic control. Nat.Neurosci. 13, 387–392. doi: 10.1038/nn.2495
Hägglund, M., Borgius, L., Dougherty,K. J., and Kiehn, O. (2010).Activation of groups of excitatoryneurons in the mammalian spinalcord or hindbrain evokes locomo-tion. Nat. Neurosci. 13, 246–252.doi: 10.1038/nn.2482
Han, X., and Boyden, E. S. (2007).Multiple-color optical activation,silencing, and desynchroniza-tion of neural activity, withsingle-spike temporal resolu-tion. PLoS ONE 2:e299. doi:10.1371/journal.pone.0000299
Hippenmeyer, S., Vrieseling, E., Sigrist,M., Portmann, T., Laengle, C.,Ladle, D. R., et al. (2005) A devel-opmental switch in the responseof DRG neurons to ETS transcrip-tion factor signaling. PLoS Biol.3:e159. doi: 10.1371/journal.pbio.0030159
Hira, R., Ohkubo, F., Ozawa, K.,Isomura, Y., Kitamura, K., Kano,M., et al. (2013). Spatiotemporaldynamics of functional clusters ofneurons in the mouse motor cor-tex during a voluntary movement.J. Neurosci. 33, 1377–1390. doi:10.1523/JNEUROSCI.2550-12.2013
Huber, D., Petreanu, L., Ghitani, N.,Ranade, S., Hromadka, T., Mainen,Z., et al. (2008). Sparse opticalmicrostimulation in barrel cortexdrives learned behaviour in freelymoving mice. Nature 451, 61–64.doi: 10.1038/nature06445
Ishizuka, T., Kakuda, M., Araki, R.,and Yawo, H. (2006). Kineticevaluation of photosensitivity ingenetically engineered neuronsexpressing green algae light-gatedchannels. Neurosci. Res. 54, 85–94.doi: 10.1016/j.neures.2005.10.009
Jin, L., Han, Z., Platisa, J., Wooltorton,J. R., Cohen, L. B., and Pieribone,V. A. (2012). Single action poten-tials and subthreshold electricalevents imaged in neurons witha fluorescent protein voltageprobe. Neuron 75, 779–785. doi:10.1016/j.neuron.2012.06.040
Katzel, D., Zemelman, B. V., Buetfering,C., Wolfel, M., and Miesenbock, G.(2011). The columnar and lami-nar organization of inhibitory con-nections to neocortical excitatorycells. Nat. Neurosci. 14, 100–107.doi: 10.1038/nn.2687
Kawaguchi, Y. (1995). Physiologicalsubgroups of nonpyramidal cellswith specific morphological charac-teristics in layer II/III of rat frontalcortex. J. Neurosci. 15, 2638–2655.
Kleinlogel, S., Feldbauer, K., Dempski,R. E., Fotis, H., Wood, P. G.,Bamann, C., et al. (2011). Ultralight-sensitive and fast neuronalactivation with the Ca2+-permeablechannelrhodopsin CatCh. Nat.Neurosci. 14, 513–518. doi: 10.1038/nn.2776
Knopfel, T. (2012). Genetically encodedoptical indicators for the anal-ysis of neuronal circuits. Nat.Rev. Neurosci. 13, 687–700. doi:10.1038/nrn3293
Kolbe, M., Besir, H., Essen, L. O.,and Oesterhelt, D. (2000). Structureof the light-driven chloride pumphalorhodopsin at 1.8 A resolu-tion. Science 288, 1390–1396. doi:10.1126/science.288.5470.1390
Kralj, J. M., Hochbaum, D. R.,Douglass, A. D., and Cohen, A.E. (2011). Electrical spiking inEscherichia coli probed with afluorescent voltage-indicating pro-tein. Science 333, 345–348. doi:10.1126/science.1204763
Kremers, G. J., Gilbert, S. G., Cranfill, P.J., Davidson, M. W., and Piston, D.W. (2011). Fluorescent proteins at aglance. J. Cell Sci. 124, 157–160. doi:10.1242/jcs.072744
Kuhlman, S. J., and Huang, Z. J.(2008). High-resolution labelingand functional manipulation ofspecific neuron types in mouse
brain by Cre-activated viral geneexpression. PLoS ONE 3:e2005. doi:10.1371/journal.pone.0002005
Lee, S. H., Kwan, A. C., Zhang, S.,Phoumthipphavong, V., Flannery,J. G., Masmanidis, S. C., et al.(2012). Activation of specificinterneurons improves V1 featureselectivity and visual perception.Nature 488, 379–383. doi: 10.1038/nature11312
Lewis, T. L. Jr., Mao, T., Svoboda, K.,and Arnold, D. B. (2009). Myosin-dependent targeting of transmem-brane proteins to neuronal den-drites. Nat. Neurosci. 12, 568–576.doi: 10.1038/nn.2318
Lichtman, J. W., and Denk, W.(2011). The big and the small:challenges of imaging the brain’scircuits. Science 334, 618–623. doi:10.1126/science.1209168
Lichtman, J. W., Livet, J., and Sanes,J. R. (2008). A technicolourapproach to the connectome. Nat.Rev. Neurosci. 9, 417–422. doi:10.1038/nrn2391
Llinas, R., and Sugimori, M. (1980).Electrophysiological propertiesof in vitro Purkinje cell dendritesin mammalian cerebellar slices.J. Physiol. 305, 197–213.
Luo, L., Callaway, E. M., and Svoboda,K. (2008). Genetic dissection ofneural circuits. Neuron 57, 634–660.doi: 10.1016/j.neuron.2008.01.002
Maccaferri, G., Roberts, J. D., Szucs, P.,Cottingham, C. A., and Somogyi, P.(2000). Cell surface domain specificpostsynaptic currents evoked byidentified GABAergic neuronesin rat hippocampus in vitro.J. Physiol. 524(Pt 1), 91–116.doi: 10.1111/j.1469-7793.2000.t01-3-00091.x
Madisen, L., Mao, T., Koch, H., Zhuo,J. M., Berenyi, A., Fujisawa, S.,et al. (2012). A toolbox of Cre-dependent optogenetic transgenicmice for light-induced activationand silencing. Nat. Neurosci. 15,793–802. doi: 10.1038/nn.3078
Madisen, L., Zwingman, T. A., Sunkin,S. M., Oh, S. W., Zariwala, H. A.,Gu, H., et al. (2010). A robustand high-throughput Cre reportingand characterization system for thewhole mouse brain. Nat. Neurosci.13, 133–140. doi: 10.1038/nn.2467
Magee, J. C. (2000). Dendritic inte-gration of excitatory synaptic input.Nat. Rev. Neurosci. 1, 181–190. doi:10.1038/35044552
Mancuso, J. J., Kim, J., Lee, S., Tsuda,S., Chow, N. B., and Augustine,G. J. (2011). Optogenetic probingof functional brain circuitry. Exp.Physiol. 96, 26–33. doi: 10.1113/exp-physiol.2010.055731
Frontiers in Neural Circuits www.frontiersin.org November 2013 | Volume 7 | Article 160 | 23
Asrican et al. Novel optogenetic mice
Mao, T., Kusefoglu, D., Hooks, B.M., Huber, D., Petreanu, L., andSvoboda, K. (2011). Long-rangeneuronal circuits underlying theinteraction between sensory andmotor cortex. Neuron 72, 111–123.doi: 10.1016/j.neuron.2011.07.029
Markram, H., Toledo-Rodriguez, M.,Wang, Y., Gupta, A., Silberberg, G.,and Wu, C. (2004). Interneuronsof the neocortical inhibitory system.Nat. Rev. Neurosci. 5, 793–807. doi:10.1038/nrn1519
Marois, R., and Ivanoff, J. (2005).Capacity limits of informa-tion processing in the brain.Trends Cogn. Sci. 9, 296–305. doi:10.1016/j.tics.2005.04.010
Marvin, J. S., Borghuis, B. G., Tian,L., Cichon, J., Harnett, M. T.,Akerboom, J., et al. (2013). Anoptimized fluorescent probe forvisualizing glutamate neurotrans-mission. Nat. Methods 10, 162–170.doi: 10.1038/nmeth.2333
Nagel, G., Brauner, M., Liewald,J. F., Adeishvili, N., Bamberg,E., and Gottschalk, A.(2005). Light activation ofchannelrhodopsin-2 in excitablecells of Caenorhabditis eleganstriggers rapid behavioral responses.Curr. Biol. 15, 2279–2284. doi:10.1016/j.cub.2005.11.032
Nagel, G., Szellas, T., Huhn, W.,Kateriya, S., Adeishvili, N.,Berthold, P., et al. (2003).Channelrhodopsin-2, a directlylight-gated cation-selective mem-brane channel. Proc. Natl. Acad.Sci. U.S.A. 100, 13940–13945. doi:10.1073/pnas.1936192100
Perry, C. N., Kyoi, S., Hariharan,N., Takagi, H., Sadoshima, J.,and Gottlieb, R. A. (2009). Novelmethods for measuring car-diac autophagy in vivo. MethodsEnzymol. 453, 325–342. doi:10.1016/S0076-6879(08)04016-0
Person, A. L., and Raman, I. M. (2012).Purkinje neuron synchrony elicitstime-locked spiking in the cerebel-lar nuclei. Nature 481, 502–505. doi:10.1038/nature10732
Petreanu, L., Huber, D., Sobczyk,A., and Svoboda, K. (2007).Channelrhodopsin-2-assisted cir-cuit mapping of long-range callosalprojections. Nat. Neurosci. 10,663–668. doi: 10.1038/nn1891
Pettit, D. L., and Augustine, G. J.(2000). Distribution of functionalglutamate and GABA receptors onhippocampal pyramidal cells andinterneurons. J. Neurophysiol. 84,28–38.
Ren, J., Qin, C., Hu, F., Tan, J.,Qiu, L., Zhao, S., et al. (2011).Habenula “cholinergic” neuronsco-release glutamate and acetyl-choline and activate postsynapticneurons via distinct transmissionmodes. Neuron 69, 445–452. doi:10.1016/j.neuron.2010.12.038
Schoenenberger, P., Grunditz, A., Rose,T., and Oertner, T. G. (2008).Optimizing the spatial resolutionof Channelrhodopsin-2 activation.Brain Cell Biol. 36, 119–127. doi:10.1007/s11068-008-9025-8
Schwaller, B., Meyer, M., andSchiffmann, S. (2002). ‘New’functions for ‘old’ proteins: therole of the calcium-binding pro-teins calbindin D-28k, calretininand parvalbumin, in cerebellarphysiology. Studies with knockoutmice. Cerebellum 1, 241–258. doi:10.1080/147342202320883551
Seto-Ohshima, A., Emson, P. C.,Berchtold, M. W., and Heizmann,C. W. (1989). Localization of par-valbumin mRNA in rat brain by insitu hybridization histochemistry.Exp. Brain Res. 75, 653–658. doi:10.1007/BF00249917
Shaner, N. C., Campbell, R. E.,Steinbach, P. A., Giepmans, B.N., Palmer, A. E., and Tsien, R.Y. (2004). Improved monomericred, orange and yellow fluorescentproteins derived from Discosomasp. red fluorescent protein. Nat.Biotechnol. 22, 1567–1572. doi:10.1038/nbt1037
Shaner, N. C., Patterson, G. H., andDavidson, M. W. (2007). Advancesin fluorescent protein technology.J. Cell Sci. 120, 4247–4260. doi:10.1242/jcs.005801
Smith, S. J. (2007). Circuit recon-struction tools today. Curr. Opin.Neurobiol. 17, 601–608. doi:10.1016/j.conb.2007.11.004
Sporns, O., Tononi, G., and Kötter, R.(2005). The human connectome: astructural description of the humanbrain. PLoS Comput. Biol. 1:e42. doi:10.1371/journal.pcbi.0010042
Tanaka, K. F., Matsui, K., Sasaki, T.,Sano, H., Sugio, S., Fan, K., et al.(2012). Expanding the repertoire ofoptogenetically targeted cells withan enhanced gene expression sys-tem. Cell Rep. 2, 397–406. doi:10.1016/j.celrep.2012.06.011
Tang, W., Ehrlich, I., Wolff, S. B.,Michalski, A. M., Wolfl, S., Hasan,M. T., et al. (2009). Faithfulexpression of multiple proteinsvia 2A-peptide self-processing:a versatile and reliable method
for manipulating brain circuits.J. Neurosci. 29, 8621–8629. doi:10.1523/JNEUROSCI.0359-09.2009
Tsai, H. C., Zhang, F., Adamantidis, A.,Stuber, G. D., Bonci, A., de Lecea,L., et al. (2009). Phasic firing indopaminergic neurons is sufficientfor behavioral conditioning. Science324, 1080–1084. doi: 10.1126/sci-ence.1168878
Tsunematsu, T., Kilduff, T. S., Boyden,E. S., Takahashi, S., Tominaga,M., and Yamanaka, A. (2011).Acute optogenetic silencingof orexin/hypocretin neuronsinduces slow-wave sleep in mice.J. Neurosci. 31, 10529–10539.doi: 10.1523/JNEUROSCI.0784-11.2011
Wang, H., Peca, J., Matsuzaki, M.,Matsuzaki, K., Noguchi, J., Qiu,L., et al. (2007). High-speedmapping of synaptic connec-tivity using photostimulationin Channelrhodopsin-2 trans-genic mice. Proc. Natl. Acad.Sci. U.S.A. 104, 8143–8148. doi:10.1073/pnas.0700384104
Weick, J. P., Johnson, M. A., Skroch, S.P., Williams, J. C., Deisseroth, K.,and Zhang, S. C. (2010). Functionalcontrol of transplantable humanESC-derived neurons via opto-genetic targeting. Stem Cells28, 2008–2016. doi: 10.1002/stem.514
Wilson, N. R., Runyan, C. A., Wang,F. L., and Sur, M. (2012). Divisionand subtraction by distinctcortical inhibitory networksin vivo. Nature 488, 343–348. doi:10.1038/nature11347
Yizhar, O., Fenno, L. E., Davidson,T. J., Mogri, M., and Deisseroth,K. (2011). Optogenetics in neu-ral systems. Neuron 71, 9–34. doi:10.1016/j.neuron.2011.06.004
Zhang, F., Prigge, M., Beyriere, F.,Tsunoda, S. P., Mattis, J., Yizhar, O.,et al. (2008). Red-shifted optoge-netic excitation: a tool for fast neu-ral control derived from Volvox car-teri. Nat. Neurosci. 11, 631–633. doi:10.1038/nn.2120
Zhang, F., Vierock, J., Yizhar, O., Fenno,L. E., Tsunoda, S., Kianianmomeni,A., et al. (2011). The micro-bial opsin family of optogenetictools. Cell 147, 1446–1457. doi:10.1016/j.cell.2011.12.004
Zhang, F., Wang, L. P., Brauner, M.,Liewald, J. F., Kay, K., Watzke,N., et al. (2007). Multimodal fastoptical interrogation of neural cir-cuitry. Nature 446, 633–639. doi:10.1038/nature05744
Zhang, X. M., Ng, A. H., Tanner, J. A.,Wu, W. T., Copeland, N. G., Jenkins,N. A., et al. (2004). Highly restrictedexpression of Cre recombinase incerebellar Purkinje cells. Genesis40, 45–51. doi: 10.1002/gene.20062
Zhao, S., Cunha, C., Zhang, F., Liu,Q., Gloss, B., Deisseroth, K., et al.(2008). Improved expression ofhalorhodopsin for light-inducedsilencing of neuronal activity.Brain Cell Biol. 36, 141–154. doi:10.1007/s11068-008-9034-7
Zhao, S., Ting, J. T., Atallah, H.E., Qiu, L., Tan, J., Gloss, B.,et al. (2011). Cell type-specificchannelrhodopsin-2 transgenicmice for optogenetic dissectionof neural circuitry function. Nat.Methods 8, 745–752. doi: 10.1038/nmeth.1668
Conflict of Interest Statement: Theauthors declare that the researchwas conducted in the absence of anycommercial or financial relationshipsthat could be construed as a potentialconflict of interest.
Received: 09 May 2013; paper pend-ing published: 17 July 2013; accepted:19 September 2013; published online: 26November 2013.Citation: Asrican B, Augustine GJ,Berglund K, Chen S, Chow N, DeisserothK, Feng G, Gloss B, Hira R, HoffmannC, Kasai H, Katarya M, Kim J, Kudolo J,Lee LM, Lo SQ, Mancuso J, MatsuzakiM, Nakajima R, Qiu L, Tan G, TangY, Ting JT, Tsuda S, Wen L, Zhang Xand Zhao S (2013) Next-generationtransgenic mice for optogenetic anal-ysis of neural circuits. Front. NeuralCircuits 7:160. doi: 10.3389/fncir.2013.00160This article was submitted to the journalFrontiers in Neural Circuits.Copyright © 2013 Asrican, Augustine,Berglund, Chen, Chow, Deisseroth,Feng, Gloss, Hira, Hoffmann, Kasai,Katarya, Kim, Kudolo, Lee, Lo, Mancuso,Matsuzaki, Nakajima, Qiu, Tan, Tang,Ting, Tsuda, Wen, Zhang and Zhao.This is an open-access article dis-tributed under the terms of the CreativeCommons Attribution License (CC BY).The use, distribution or reproductionin other forums is permitted, providedthe original author(s) or licensor arecredited and that the original publicationin this journal is cited, in accordancewith accepted academic practice. Nouse, distribution or reproduction ispermitted which does not comply withthese terms.
Frontiers in Neural Circuits www.frontiersin.org November 2013 | Volume 7 | Article 160 | 24