Embed Size (px)
Citation preview

Next Generation Scalable and Efficient Data Protection
STOS004
Dr. Sam Siewert, Software Engineer, Intel
Greg Scott, Cloud Storage Manager, Intel

2
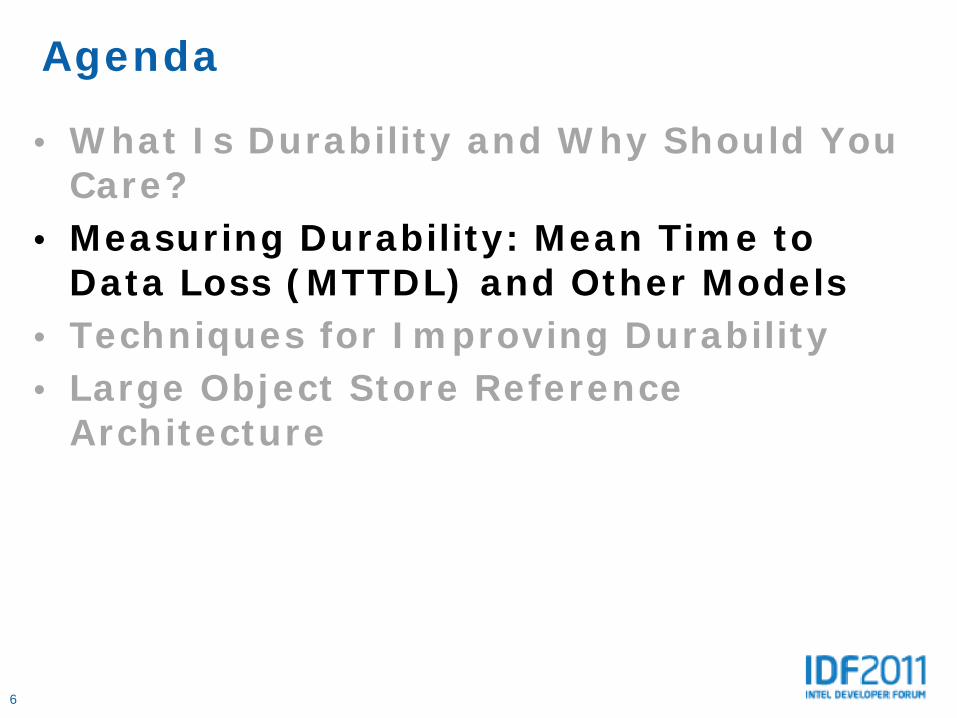
Agenda
• What Is Durability and Why Should You Care?
• Measuring Durability: Mean Time to Data Loss (MTTDL) and Other Models
• Techniques for Improving Durability• Large Object Store Reference
Architecture

3
Agenda
• What Is Durability and Why Should You Care?
• Measuring Durability: Mean Time to Data Loss (MTTDL) and Other Models
• Techniques for Improving Durability• Large Object Store Reference
Architecture

4
The Problem…
Hard drive non recoverable error probability approaching 100%
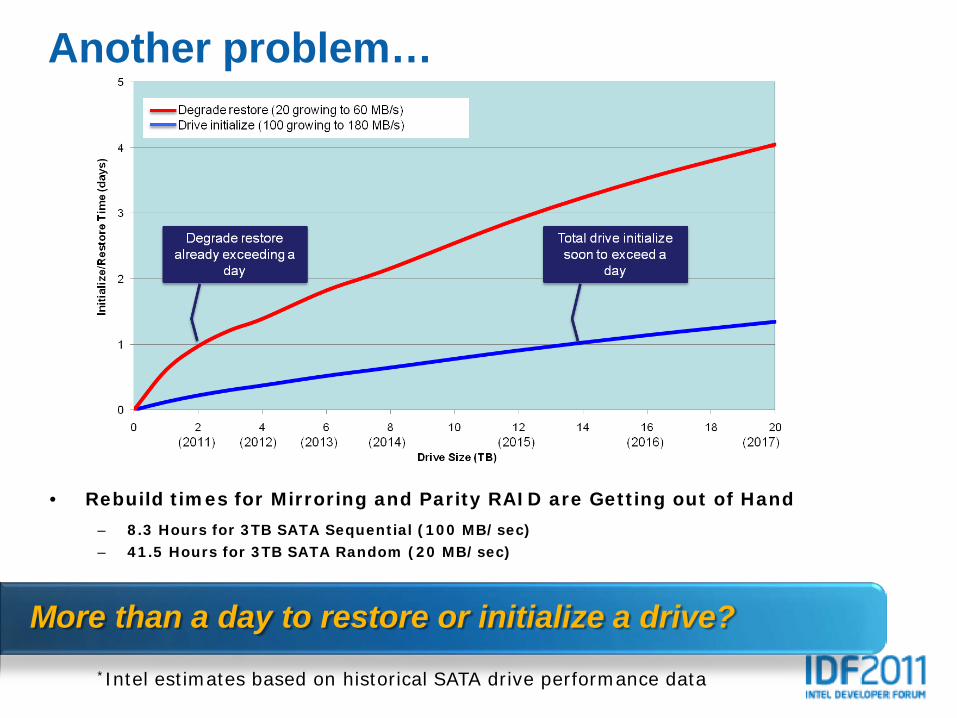
Another problem…
More than a day to restore or initialize a drive?*Intel estimates based on historical SATA drive performance data
• Rebuild times for Mirroring and Parity RAID are Getting out of Hand– 8.3 Hours for 3TB SATA Sequential (100 MB/sec)– 41.5 Hours for 3TB SATA Random (20 MB/sec)
6
Agenda
• What Is Durability and Why Should You Care?
• Measuring Durability: Mean Time to Data Loss (MTTDL) and Other Models
• Techniques for Improving Durability• Large Object Store Reference
Architecture

7
Measuring Data Durability…• Mean time to data loss (MTTDL)
– Average time before a system will lose data
• MTTDL Probability– Probability that a system will lose data
• Function of – Mean-time-to-failure (MTTF), same as MTBF
SATA spec says 500,000 hours, but not at 100% duty cycle
SATA HDD Experience shows MTTF typically 200,000 hours
– Mean-time-to-repair (MTTR) Time to recover from a failure Example is time to re-mirror a drive

8
How Good is Standard MTTDL Model?
• Model Compare to Statistics for SATA Disks?
• Compare Standard RAID Data Protection to Erasure Codes?
• Check Results with NOMDL
A large-scale study of failures in high-performance computing systems”, Bianca Schroeder, Garth A. Gibson
Mid to End of LifeInfant Mortality
NodeLevel
SystemLevel

Models for Expected Data Loss• Mean Time to Data Loss (MTTDL)
– Simple 2-State Markov Model
• Normalized Magnitude of Data Loss (NOMDL)– Sector Level phenomena – partial failures– Multi-state Monte Carlo simulation– Estimates amount of expected data loss per terabyte per year
9
Healthy
SectorRemap
Failure
HealthyFailure
(Erasure)
Rebuild(MTTR)
Read failure(MTBF) Data
LossRebuild
NRE
Retry
IdleScrub
Data Loss
Recover
NOMDLMTTDL

10
MTTDL Example: RAID 1
• Two 3TB SATA Desktop Drives• Drives are mirrored• Following sequence of events
• Simple 2-state model
Mirr
ored
Loss of data because of two failures before restore
1. Data corruption on one2. Re-mirror to restore data3. Second drive fails before first is
restored4. Loss of data
Re-
Mirr
or

11
setsets
LifetimeMTTDL
lossdata
ktfailure
MTTDLkNetP
MTTFketP
set 1,*)1()(
1),1()(
*)(
1
_ =−=
=−=
−
−
Birth/Death Exponential Model– P(t)=Probability of Failure over time period– k=probability of failure, t=time– MTTF = Mean Time To Failure (or Between)– N=Population, Lifetime=e.g. Annual– MTTDL=Mean Time to Data Loss in Population
How good is it?• Optimistic – Only 2 states• Pessimistic – Does not account for proactive data protection measures• Does model resiliency to drive failures
The Annual Probability of Data Loss

12
MTTDL RAID Examples• RAID1 Equation
– Joint probability of 2 erasures
– Coupling of mirror drives– Exposure window
• RAID5 Equation– (N+1)*N Double Fault
Scenarios
• RAID6 Equation– Joint probability 3
erasures– (N+2)*(N+1)*N Triple
Fault Scenarios
“Engineering Estimate” for probability of loss
MTTRNNMTTFMTTDLRAID **)1(
2
5 +=
2
3
6 **)1(*)2( MTTRNNNMTTFMTTDLRAID ++
=
MTTRNMTTFMTTDLRAID *
2
1 =
)_(*______
WindowExposureSetinDevicesLossDatawithFailuresCombinedMTTDL =

Scaling With VirtualizationKeeps Sets Independent, Constant Overhead,
Virtual Mapping of RAID Sets over Nodes/Drives
13

14
Agenda
• What Is Durability and Why Should You Care?
• Measuring Durability: Mean Time to Data Loss (MTTDL) and Other Models
• Techniques for Improving Durability• Large Object Store Reference
Architecture

15
Erasure Coding (EC)RAID Erasure Coding
EC extends the data protection architectures of RAID 5/6 to RAID kk = the number of failures that can be tolerated without data loss:
For RAID 5, k=1; For RAID 6, k=2; For EC, k = n
RAID 5/6
Disk Disk
data
m data
Disk Disk
1 or 2 parity
data1
data m
data m+1
data m+2
Server
SAS to disks
App
Erasure Coding Client
data
m minimum k spare
slice 1
slice m
slice m+1
slice n
MetaData
Service
SCSI to disk or IP to storage servers
App
StorageNode
StorageService
StorageNode
StorageService
StorageNode
StorageService
StorageNode
StorageService
data location
SCSI to disk
EMC* Atmos* and Isilon* are example systems using EC

MTTDL Example: Erasure Coding• 10:16 example• fragments across 16
drives• All drives functioning• Failure occurs:
16
Loss of data if 6 drives fails before drive 1 restore
1. Drive 1 fails (MTT fail)2. Drive replaced (MTT repair)3. Restore started (MTT restore)4. 6 more drives fail (MTT data loss)5. Loss of data
New writes to all drives
build lost frags

17
Why different?• Resilient to Triple Faults or Better
• Numerator is Joint Probability of Triple … N-tuple Failure (Erasure)
• Denominator Includes Linear Coupling Terms
• Parity De-Clustering Vastly Improves MTTR
The MTTDL Equation for EC
6
7
6 *)(*)1(*)2(*)3(*)4(*)5(*)6(* MTTRNNNNNNNSMTTFMTTDLEC ++++++
=
3
4
3 *)(*)1(*)2(*)3(* MTTRNNNNSMTTFMTTDLEC +++
=
Power LawImprovements
Linear DegradationDue to Coupling

18
Agenda
• What Is Durability and Why Should You Care?
• Measuring Durability: Mean Time to Data Loss (MTTDL) and Other Models
• Techniques for Improving Durability• Large Object Store Reference
Architecture

19
Tomorrow’s Datacenter
Tomorrow’s datacenters add lower cost, high-capacity storage to traditional low-latency, premium storage
Compute
ContentDelivery Network WWW
VPN or LAN
VirtualizedServers
DedicatedServers
Consumer orBiz Customer
Employee
“Centralized”Storage
Premium SLA Storage
High-CapacityStorage
IOPS/TB focuse.g. Business
Database
$/TB optimizede.g. Backup or Large Object
Storage
Low-Latency, ProximityStorage
Collaborative,IT infra.,App dev,
Web infra.
Business processes, Decision
support, HPC

Durability Options for Large Object
20
Comparison of a rack implementation• 42U Rack• 32 Storage Nodes
(SN)• 10 Hard drives per
SN• No single point of
failure in rack • Comparison of both
durability and $/TB
Durability Config
Minimal drives(m)
Sparedrives(k)
No single failure drives
ErasureCoding 16
10 drives in 10 SNs
6 drives in 6 SNs
No additional
RAID 0+1 10 drives in 1 SN
10 drives in 2nd SN
No additional
RAID 5+1 9 drives in 2 SNs
1 drive in each SN
10 drives in 2nd SN
RAID 6+1 8 drives in 2 SNs
2 drives in each SN
10 drives in 2nd SN
RAID 3way
10 drives in 1 SN
10 drives in 2nd and 3rd SN
No additional

Large Object Store Rack(Network Configuration)
21
x40-1/10GE x8-10GE
Cleint/MD Server
Storage ServerStorage ServerStorage ServerStorage ServerStorage ServerStorage ServerStorage ServerStorage ServerStorage ServerStorage ServerStorage ServerStorage ServerStorage ServerStorage ServerStorage ServerStorage ServerStorage ServerStorage ServerStorage ServerStorage ServerStorage ServerStorage ServerStorage ServerStorage ServerStorage ServerStorage ServerStorage ServerStorage ServerStorage ServerStorage ServerStorage ServerStorage Server
Client/MD Server
x40-1/10GE x8-10GE
Client/MD Server
No Single Point of Failure:Dual Switches and Dual Connectivity to all servers in rack
Redundant Client/Metadata Servers• x2 10GE BaseT to active switch 1• x2 10GE BaseT to active switch 2
32 Storage Servers• x1 GE BaseT to active switch 1• x1 GE BaseT to active switch 2
Dual 1/10GE BaseT Switch• x8 10GE to client TOR
switches• x4 10GE to each CS/MD
server• x32 GE to active switch 2
Clients
GE
10GE
10GE

Large Object Store Rack(Storage Node)
Amplidata
x6 SAS 6Gb/s
2G ECCDDR3
Memory
SuperMicroSASLP-MV8
Western Digital3TB SATA
Storage Drive
x4 SATA 6Gb/s
X86-64 RedHat* Linux*
x10 1u 3.5” SATA Disk Enclosure
x4PCIeG2
DMIG2
Intel®Dual GbE
~1PB of raw storage in a 42u rackHigh Efficiency, Durability, Scalability with Erasure Coding
x2 GbE
Large object storage(e.g. Haystack)
Intel®Xeon™
E3-1220L
Intel®206
chipset
x4PCIeG2
x10 SATA 6Gb/s
PortwellWADE8011
Mini-ITX board
Storage Server Reference Architecture
x2x8 10GbE
SFP+
x2x32 GbE
x2Arista 7140T
42 R
U
x40-1/10GE x8-10GE
Cleint/MD Server
Storage ServerStorage ServerStorage ServerStorage ServerStorage ServerStorage ServerStorage ServerStorage ServerStorage ServerStorage ServerStorage ServerStorage ServerStorage ServerStorage ServerStorage ServerStorage ServerStorage ServerStorage ServerStorage ServerStorage ServerStorage ServerStorage ServerStorage ServerStorage ServerStorage ServerStorage ServerStorage ServerStorage ServerStorage ServerStorage ServerStorage ServerStorage Server
Client/MD Server
x40-1/10GE x8-10GE
Client/MD Server

Large Object Store Rack(Controller Node)
23
Seagate500GB SATA Storage Drive
Amplidata
X86-64 RedHat* Linux*
Dual Metadata and Client (erasure encode/decode) serverDual10GE throughput to Application Servers and to Storage Servers
Large object storage(e.g. Haystack)
x2- x8 10GbE SFP+
x2- x210GbE BaseT
x2Arista 7140T
Client/Metadata Server Reference Architecture
12G ECCDDR3
Memory
Intel®5520
chipset
Intel® Server Board
S5520UR
QPI
Intel® Xeon®
processor 5620
12G ECCDDR3
Memory
Intel® Xeon®
processor 5620
Intel®X520-T2
Dual 10GbE
x4PCIeG2
Intel®X520-T2
Dual 10GbE
x4 PCIe G2
Intel®Solid-State Drive 320 Series
x2 SATA 3G
x2 SATA 3G
Intel® Server ChassisSR2625URLXT
42 R
U
x40-1/10GE x8-10GE
Cleint/MD Server
Storage ServerStorage ServerStorage ServerStorage ServerStorage ServerStorage ServerStorage ServerStorage ServerStorage ServerStorage ServerStorage ServerStorage ServerStorage ServerStorage ServerStorage ServerStorage ServerStorage ServerStorage ServerStorage ServerStorage ServerStorage ServerStorage ServerStorage ServerStorage ServerStorage ServerStorage ServerStorage ServerStorage ServerStorage ServerStorage ServerStorage ServerStorage Server
Client/MD Server
x40-1/10GE x8-10GE
Client/MD Server

Converged Storage Server with EC Value (320 Drive, 960TB comparison, no single point of failure1)
24
Value Description Number nodes=32, 10 drives/node, Cap/Node=30TB
EC16m=10, k=616 nodes
RAID0+1m=10, k=02 nodes
RAID5+1m=9, k=12 nodes
RAID6+1m=8, k=22 nodes
RAID 3waym=10, k=03 nodes
Efficiency Raw/Usable Efficiency 63% 50% 40% 34% 33%
Usable Capacity (TB) 600 480 432 384 320
Power/UsableCapacity 53% 67% 74% 83% 1
Durability Relative data lossrisk 10-8 2288 1.6 10-6 1
Scalability2 best storage scaling $343 $429 $476 $536 $643
1Hardware configuration Large Object Reference Architecture
EC is the best efficiency at equivalent durability compared to RAID6+1
2Estimate using ServersDirect and CDW web prices 8/9/2011

Summary
• Increasing drive density and rebuild time are creating data protection crisis
• MTTDL model a sufficient predictor of data loss risk
• Erasure Codes offer the improved data durability over traditional RAID and triple replication at lower cost
• Intel’s large object reference architecture provides a cost effective implementation
25

Call to Action
• Be aware of data durability especially for building capacity storage with SATA drives
• Understand impact of data durability of Scale-out Storage
• Migrate to Erasure Coding for Large Object Store for optimal durability
26

27
Additional Sources of Information on This Topic:
1. “An Analysis of Data Corruption in the Storage Stack”, Lakshmi Bairavasundaram, Garth R. Goodson, et al
2. “A large-scale study of failures in high-performance computing systems”, Bianca Schroeder, Garth A. Gibson
3. “Disk failures in the real world: What does an MTTF of 1,000,000 hours mean to you?”, Bianca Schroeder, Garth A. Gibson
4. “An Analysis of Latent Sector Errors in Disk Drives”, LakshmiBairavasundaram, Garth R. Goodson, et al
5. Memory Systems: Cache, DRAM, Disk, Bruce Jacob, Spencer Ng, David Wang.
6. “Mean time to meaningless: MTTDL, Markov models, and storage system reliability”, Kevin Greenan, James Plank, Jay Wylie, Hot Topics in Storage and File Systems, June 2010.
28
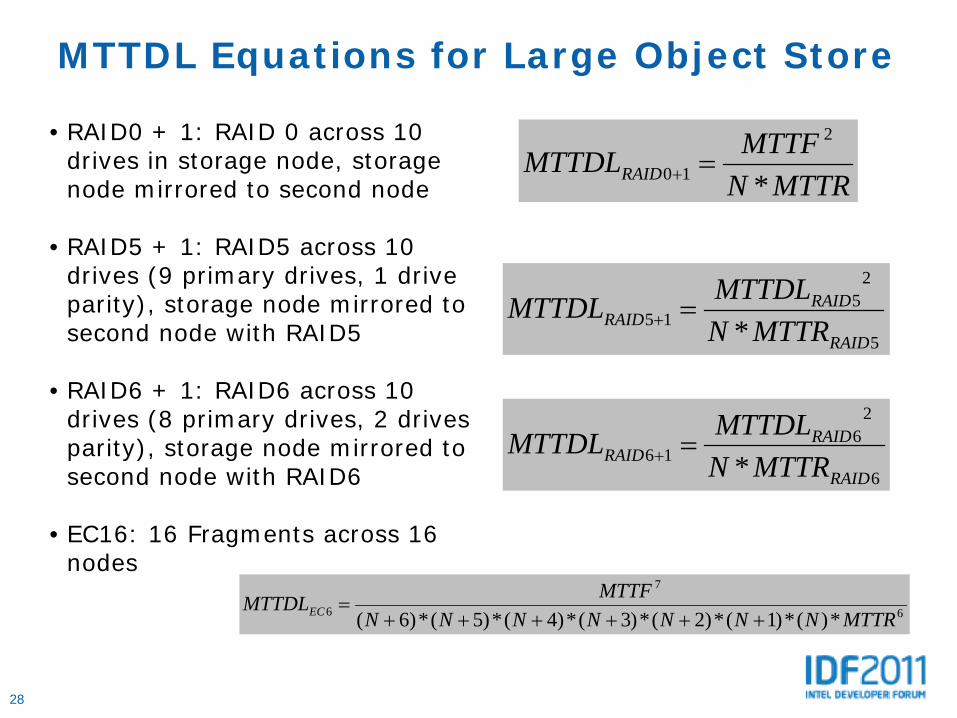
MTTDL Equations for Large Object Store
5
25
15 * RAID
RAIDRAID MTTRN
MTTDLMTTDL =+
6
26
16 * RAID
RAIDRAID MTTRN
MTTDLMTTDL =+
6
7
6 *)(*)1(*)2(*)3(*)4(*)5(*)6( MTTRNNNNNNNMTTFMTTDLEC ++++++
=
• RAID0 + 1: RAID 0 across 10 drives in storage node, storage node mirrored to second node
• RAID5 + 1: RAID5 across 10 drives (9 primary drives, 1 drive parity), storage node mirrored to second node with RAID5
• RAID6 + 1: RAID6 across 10 drives (8 primary drives, 2 drives parity), storage node mirrored to second node with RAID6
• EC16: 16 Fragments across 16 nodes
MTTRNMTTFMTTDLRAID *
2
10 =+

29
Legal Disclaimer• INFORMATION IN THIS DOCUMENT IS PROVIDED IN CONNECTION WITH INTEL® PRODUCTS. NO LICENSE, EXPRESS OR
IMPLIED, BY ESTOPPEL OR OTHERWISE, TO ANY INTELLECTUAL PROPERTY RIGHTS IS GRANTED BY THIS DOCUMENT. EXCEPT AS PROVIDED IN INTEL’S TERMS AND CONDITIONS OF SALE FOR SUCH PRODUCTS, INTEL ASSUMES NO LIABILITY WHATSOEVER, AND INTEL DISCLAIMS ANY EXPRESS OR IMPLIED WARRANTY, RELATING TO SALE AND/OR USE OF INTEL® PRODUCTS INCLUDING LIABILITY OR WARRANTIES RELATING TO FITNESS FOR A PARTICULAR PURPOSE, MERCHANTABILITY, OR INFRINGEMENT OF ANY PATENT, COPYRIGHT OR OTHER INTELLECTUAL PROPERTY RIGHT. INTEL PRODUCTS ARE NOT INTENDED FOR USE IN MEDICAL, LIFE SAVING, OR LIFE SUSTAINING APPLICATIONS.
• Intel may make changes to specifications and product descriptions at any time, without notice.• All products, dates, and figures specified are preliminary based on current expectations, and are subject to change without
notice.• Intel, processors, chipsets, and desktop boards may contain design defects or errors known as errata, which may cause
the product to deviate from published specifications. Current characterized errata are available on request.• Any code names featured are used internally within Intel to identify products that are in development and not yet publicly
announced for release. Customers, licensees and other third parties are not authorized by Intel to use code names in advertising, promotion or marketing of any product or services and any such use of Intel's internal code names is at the sole risk of the user
• Software and workloads used in performance tests may have been optimized for performance only on Intel microprocessors. Performance tests, such as SYSmark* and MobileMark*, are measured using specific computer systems, components, software, operations and functions. Any change to any of those factors may cause the results to vary. You should consult other information and performance tests to assist you in fully evaluating your contemplated purchases, including the performance of that product when combined with other products.
• Intel processor numbers are not a measure of performance. Processor numbers differentiate features within each processor family, not across different processor families. Go to: http://www.intel.com/products/processor_number
• Intel product plans in this presentation do not constitute Intel plan of record product roadmaps. Please contact your Intel representative to obtain Intel's current plan of record product roadmaps.
• Intel, Xeon, Sponsors of Tomorrow and the Intel logo are trademarks of Intel Corporation in the United States and other countries.
• *Other names and brands may be claimed as the property of others.• Copyright ©2011 Intel Corporation.

30
Risk FactorsThe above statements and any others in this document that refer to plans and expectations for the second quarter, the year and the future are forward-looking statements that involve a number of risks and uncertainties. Words such as “anticipates,” “expects,” “intends,” “plans,” “believes,” “seeks,” “estimates,” “may,” “will,” “should,” and their variations identify forward-looking statements. Statements that refer to or are based on projections, uncertain events or assumptions also identify forward-looking statements. Many factors could affect Intel’s actual results, and variances from Intel’s current expectations regarding such factors could cause actual results to differ materially from those expressed in these forward-looking statements. Intel presently considers the following to be the important factors that could cause actual results to differ materially from the company’s expectations. Demand could be different from Intel's expectations due to factors including changes in business and economic conditions, including supply constraints andother disruptions affecting customers; customer acceptance of Intel’s and competitors’ products; changes in customer order patterns including order cancellations; and changes in the level of inventory at customers. Potential disruptions in the high technology supply chain resulting from the recent disaster in Japan could cause customer demand to be different from Intel’s expectations. Intel operates in intensely competitive industries that are characterized by a high percentage of costs that are fixed or difficult to reduce in the short term and product demand that is highly variable and difficult to forecast. Revenue and the gross margin percentage areaffected by the timing of Intel product introductions and the demand for and market acceptance of Intel's products; actions taken by Intel's competitors, including product offerings and introductions, marketing programs and pricing pressures and Intel’s response to such actions; and Intel’s ability to respond quickly to technological developments and to incorporate new features into its products. The gross margin percentage could vary significantly from expectations based on capacity utilization; variations in inventoryvaluation, including variations related to the timing of qualifying products for sale; changes in revenue levels; product mix and pricing; the timing and execution of the manufacturing ramp and associated costs; start-up costs; excess or obsolete inventory; changes in unit costs; defects or disruptions in the supply of materials or resources; product manufacturing quality/yields; andimpairments of long-lived assets, including manufacturing, assembly/test and intangible assets. Expenses, particularly certain marketing and compensation expenses, as well as restructuring and asset impairment charges, vary depending on the level of demand for Intel's products and the level of revenue and profits. The majority of Intel’s non-marketable equity investment portfolio balance is concentrated in companies in the flash memory market segment, and declines in this market segment or changes in management’s plans with respect to Intel’s investments in this market segment could result in significant impairment charges,impacting restructuring charges as well as gains/losses on equity investments and interest and other. Intel's results could be affected by adverse economic, social, political and physical/infrastructure conditions in countries where Intel, its customers or its suppliers operate, including military conflict and other security risks, natural disasters, infrastructure disruptions, health concerns and fluctuations in currency exchange rates. Intel’s results could be affected by the timing of closing of acquisitions and divestitures. Intel's results could be affected by adverse effects associated with product defects and errata (deviations from published specifications), and by litigation or regulatory matters involving intellectual property, stockholder, consumer, antitrust and other issues, such as the litigation and regulatory matters described in Intel's SEC reports. An unfavorable ruling could include monetary damages or an injunction prohibiting us from manufacturing or selling one or more products, precluding particular business practices, impacting Intel’s ability to design its products, or requiring other remedies such as compulsory licensing of intellectual property. A detailed discussion of these and other factors that could affect Intel’s results is included in Intel’s SEC filings, including the report on Form 10-Q for the quarter ended April 2, 2011.
Rev. 5/9/11