Embed Size (px)
Citation preview
Next Generation Nanoscale Biosensors using Single Walled
Carbon Nanotubes Corona Phase Molecular Recognition
(CoPhMoRe)
CMC Strategy Forum – Washington D.C., USA
July 17, 2018
Xun Gong, MD, PhDPostdoctoral Associate, Department of Chemical
Engineering
Prof. Michael S. Strano, PhDCarbon P. Dubbs Professor of Chemical
Engineering
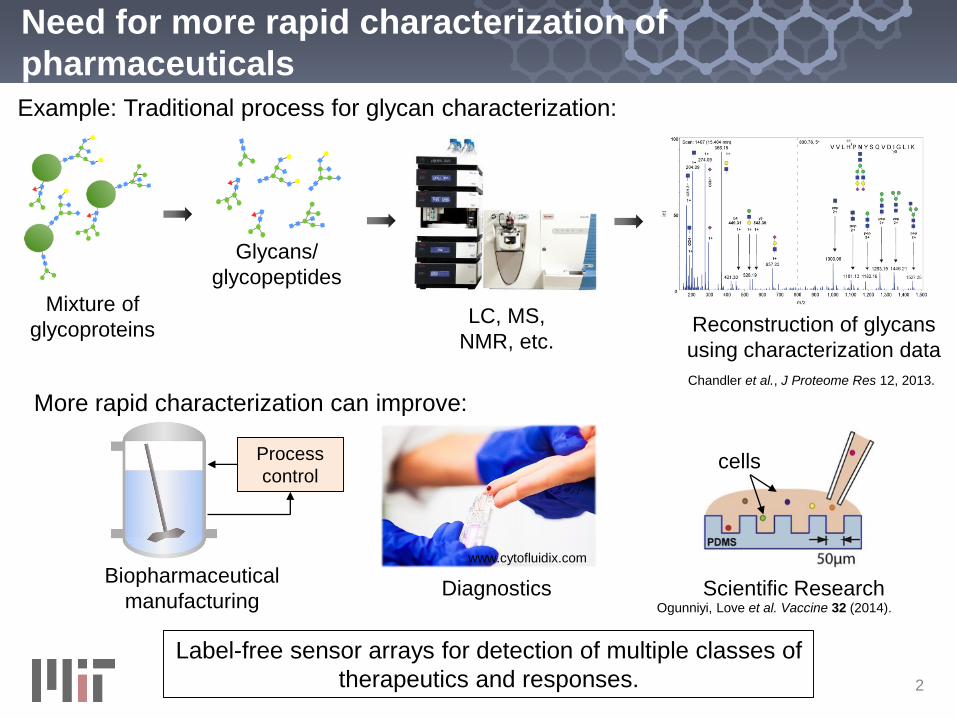
Need for more rapid characterization of
pharmaceuticals
2
Mixture of
glycoproteins
Glycans/
glycopeptides
LC, MS,
NMR, etc.
Chandler et al., J Proteome Res 12, 2013.
Reconstruction of glycans
using characterization data
Example: Traditional process for glycan characterization:
Label-free sensor arrays for detection of multiple classes of
therapeutics and responses.
More rapid characterization can improve:
Biopharmaceutical
manufacturing
Process
control
Diagnostics
www.cytofluidix.com
Scientific ResearchOgunniyi, Love et al. Vaccine 32 (2014).
cells

Single Walled Carbon Nanotube (SWNT)
3
nIR Fluorescence
No photo-bleaching1
0
2
4
6
8
10
400 650 900 1150 1400
0
0.2
0.4
0.6
0.8
1
Wavelength (nm)
Abso
rba
nce
(cm
-1)
No
rma
lize
d F
luo
rescen
ce
SWNT
Fluorescence
Blood
Abs.Water
Abs.Water Abs.
Tissue Transparency2 Spatial Information3
1) Angewandte Chemie 2006, 118 ,8318-8321, 2) Biochim et Biophys Acta 1988, 933,
184-192, 3) Nature Nanotech 2013, 8, 959-968

CoPhMoRe in Comparison
4
Antibodies Aptamers Molecular
Imprinting
CoPhMoRe
Route of
Synthesis
Biological Biological Synthetic Synthetic
Stability Poor Poor High High
Selectivity Very High High Medium Medium
Signal
Transduction
No No No Fluorescence
Targets Biomacromolecules Small/Large
Molecules
Low MW
Compounds
(Expanding)

nIR-fluorescent single-walled carbon nanotubes (SWNTs)
as signal transducers
5Boghossian, Strano, et. al., ChemSusChem, 4 (2011) 848–863.
Reuel, Strano et al., ACS Nano, 7, 2013, 7472-7482.

Outline
6
Synthetic molecular recognition using Corona Phase Molecule
Recognition (CoPhMoRe)
Sensors utilizing existing recognition elements

Corona Phase Molecular Recognition - CoPhMoRe
7
Synthetic non-
biological antibody
HydrophilicHydrophobic
Polymer
Fluorescent nanoparticle
(Single walled carbon nanotube - SWNT) Corona
A binding event is translated to a
change in the fluorescence spectra
Polymer wraps SWNT
and forms corona
Polymer modulates
analyte binding
The Solar Corona
Analyte

Hydrophilic
Hydrophobic
SWNT
Hydrophobic
1. Construct library of wrapping polymers to create many corona phases
Analyte
2. Screen all corona phases against analyte library
Hydrophilic
Hydrophobic
SWNT
Hydrophobic
1. Construct library of wrapping polymers to create many corona phases
Analyte
2. Screen all corona phases against analyte library
Hydrophilic
Hydrophobic
SWNT
Hydrophobic
1. Construct library of wrapping polymers to
create many corona phases
Intensity Wavelength
3. Look for changes in
SWNT emission spectra
Corona Phase Molecular Recognition (CoPhMoRe): Towards
synthetic lectins
Nature Nanotech 2013, 8, 959-968
6

Screening Libraries
9
… …
Other Examples (DNA, Surfactants, Synthetic Polymers)
PEG Phospholipids Library for Insulin Detection

Screening Shows CoPhMoRe Phases Sensitive to
Insulin
10
(a)
(b) (c)
(d) (e)
Insulin
Apoliporprotein-AI
o
IR
I
G Bisker, Strano et al ACS Sensors 2018
2
1.8
1.6
1.4
1.2
1
0.8
0.6
0.4
0.2
0
Quenching: 62 +/- 2%

The Case for Molecular Recognition
11
Analyte Selectivity
Polymer Interactions (ITC)
G Bisker, et al in submission
Insulin PBS

Molecular Recognition of Whole Insulin
12
FVNQ
HL C G S H L V E A L Y L V C G
ER
GFFYTPKT
GI
V
E
Q C C T S I C S L Y Q L E N Y C N
G Bisker, Strano et al ACS Sensors 2018

Sensor Response Calibration
13
𝑘𝑑 = (0.2 − 0.9) 𝜇𝑀 𝑘𝑑 = (11 − 13) 𝜇𝑀
G Bisker, Strano et al ACS Sensors 2018
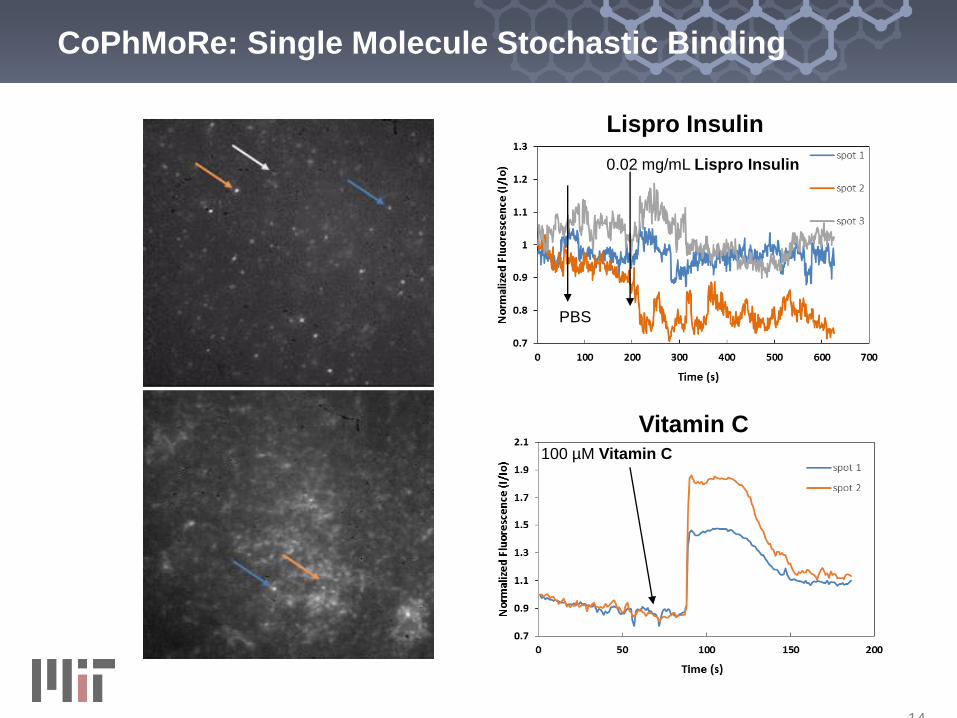
CoPhMoRe: Single Molecule Stochastic Binding
14
PBS
0.02 mg/mL Lispro Insulin
100 µM Vitamin C
Lispro Insulin
Vitamin C

-15
-10
-5
0
5
10
15
Wav
elen
gth
Sh
ift
(nm
)
BA-PhO-Dex - SWCNT
-1.0
-0.5
0.0
0.5
1.0
Re
lati
ve
In
ten
sit
y C
ha
ng
e
RITC-PEG-RITC - SWCNT
Small Molecule CoPhMoRe Sensors
15
RITC-PEG-RITC
Fmoc-Phe-PPEG8
-1.0
-0.5
0.0
0.5
1.0
Re
lati
ve
In
ten
sit
y C
ha
ng
e
Fmoc-Phe-PPEG8 - SWCNT
L-thyroxine
estradiol
BA-PhO-Dex
riboflavin
Co
ntr
ol
DM
SO
17-a
lph
a-es
trad
iol
2,4-
Din
itro
ph
eno
l
Ace
tylc
ho
line
chlo
rid
e
alp
ha-
To
cop
her
ol
Ad
eno
sin
e
AT
P
cAM
P
Cre
atin
ine
Cyt
idin
e
D-A
spar
tic
acid
D-F
ruct
ose
D-G
alac
tose
D-G
luco
se
D-M
ann
ose
Do
pam
ine
Gly
cin
e
Gu
ano
sin
e
His
tam
ine
L-A
sco
rbic
aci
d
L-C
itru
llin
e
L-H
isti
din
e
L-T
hyr
oxi
ne
Mel
ato
nin
NA
DH
Qu
inin
e
Rib
ofl
avin
Sal
icyl
ic a
cid
Ser
oto
nin
So
diu
m a
zid
e
So
diu
m p
yru
vate
Su
cro
se
Th
ymid
ine
Try
pto
ph
an
Tyr
amin
e
Ure
a-1.0
-0.5
0.0
0.5
1.0
Rel
ativ
e In
ten
sity
Ch
ang
e
NH2-PPEG8 - SWCNT

Steroid Library
16
Cortisol Testosterone DHEA Pregnenolone
Estradiol Corticosterone Progesterone Cortisone
Aldosterone Prednisolone Prednisone
Tested these steroids against our polymer library
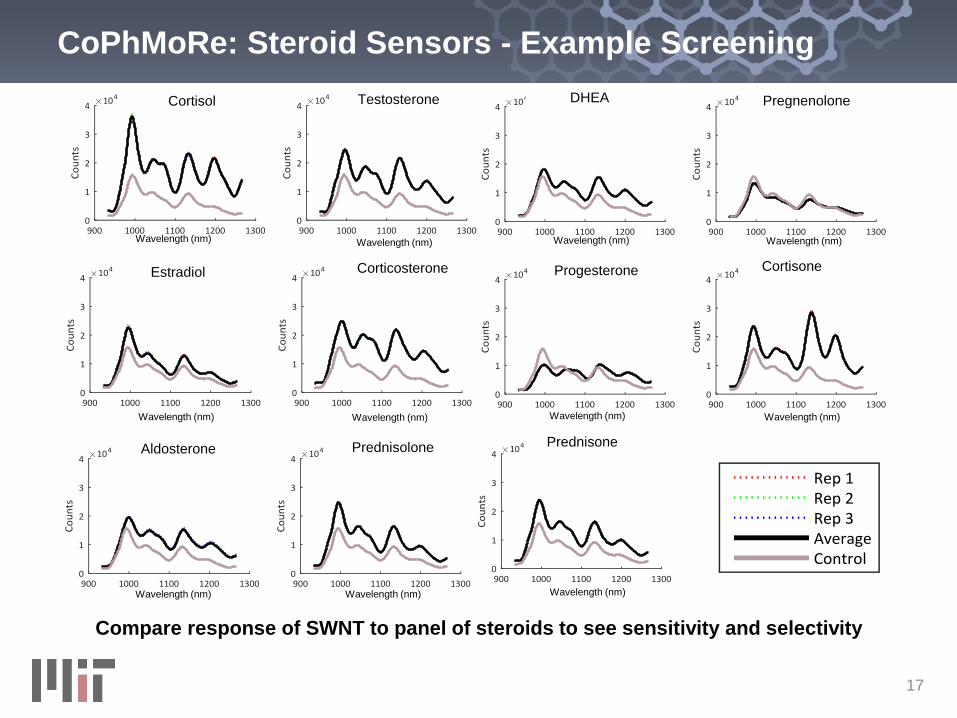
CoPhMoRe: Steroid Sensors - Example Screening
Compare response of SWNT to panel of steroids to see sensitivity and selectivity
17
Cortisol Testosterone
Wavelength (nm) Wavelength (nm)
DHEA Pregnenolone
Wavelength (nm) Wavelength (nm)
Progesterone Cortisone
Wavelength (nm)Wavelength (nm)
Estradiol Corticosterone
Wavelength (nm)Wavelength (nm)
Aldosterone Prednisolone
Wavelength (nm) Wavelength (nm)
Prednisone
Wavelength (nm)

CoPhMoRe: Steroid Sensors - Progesterone
18
0
5
10
15
20
25
% C
ha
ng
e in
Pe
ak A
rea
Chirality Dependent Response
Solution Phase Selectivity
Solution Phase Calibration
Hydrogel Reversible Response
0 µM
100 µM
0 µM
100 µM
0 µM
100 µM
0 µM

Monomer 1 ( PBA )
19
Polymer library for Carbohydrate Detection
Library construction scheme:
Monomer 2
Analyte library #1:
Sugar alcohols
Ahn, Strano et al. Submitted.

20
Only Alternating Polymers Respond to Sugar AlcoholsS
ugar
Alc
ohol Lib
rary
N
anotu
be F
luore
scent R
esponse
Block Random Alternating
Ahn, Strano et al. Submitted.

21
Variation of alternating comonomer revealed selective
arabinose sensor
D-Arabinose
Phenylboronic acid
(PBA)
7
Phenylboronic acid
(PBA)
14
OH
No selectivity

22
Boronic acid position affects its accessibility
Synthesized three polymers using three different PBA monomers.
ortho =2
=meta 3
para =4

23
Position of boronic acid affects strength of enantiomer
binding
=metaortho = para =
Boronic acid in the para position
results in the strongest response to
D-arabinose over L-arabinose
Polymer structure:
Ahn, Strano et al. Submitted.

24
Position of boronic acid affects sensor selectivity
ortho meta paraAhn, Strano et al. Submitted.

Boronic acid-based saccharide sensors as
synthetic lectins
25
Single-walled carbon nanotube sensors designed for monosaccharide
recognition can be used to detect more complex glycan structures
Saccharide concentration: 10 mM Protein concentration: 10 mg/mlConcentration: 10 mM

Outline
26
Synthetic molecular recognition using CoPhMoRe
Sensors utilizing existing recognition elements

Label-free sensors using lectin-functionalized
carbon nanotubes
27
0 50 100 1500
100
200
300
400
500
0 50 100 1500
1000
2000
3000
0 50 100 1500
200
400
600
800
0 50 100 1500
200
400
600
800
0 50 100 1500
500
1000
1500
0 50 100 1500
100
200
300
400
2nd add:
% Modulation
Nu
mb
er
of
Se
ns
ors
1 mg/ml
Chicken IgY
1 mg/ml
Human IgG
0.3 mg/ml
Chicken IgY
Reuel, Strano et al., ACS Nano, 7, 2013, 7472-7482.
Detection scheme: Glycoprotein addition
Glycan detection using PSA-functionalized SWNTs (mannose specific)
Sensors embedded
in a hydrogel
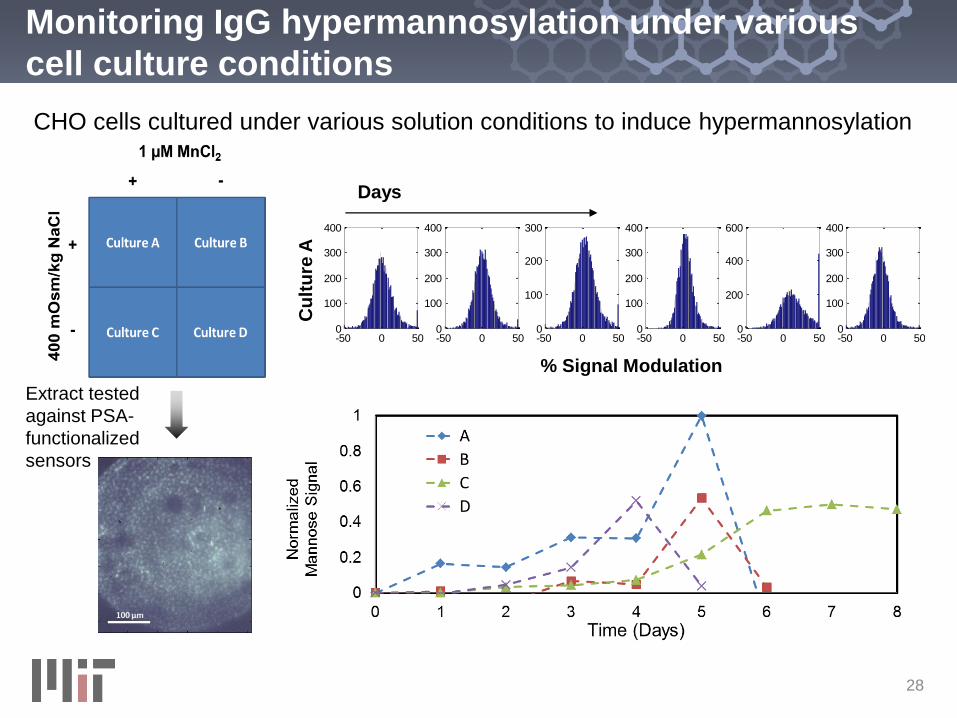
Monitoring IgG hypermannosylation under various
cell culture conditions
28
CHO cells cultured under various solution conditions to induce hypermannosylation
-50 0 500
100
200
300
400
-50 0 500
100
200
300
400
-50 0 500
100
200
300
-50 0 500
100
200
300
400
-50 0 500
200
400
600
-50 0 500
100
200
300
400
Cu
ltu
re A
Days
% Signal Modulation
Extract tested
against PSA-
functionalized
sensors
29
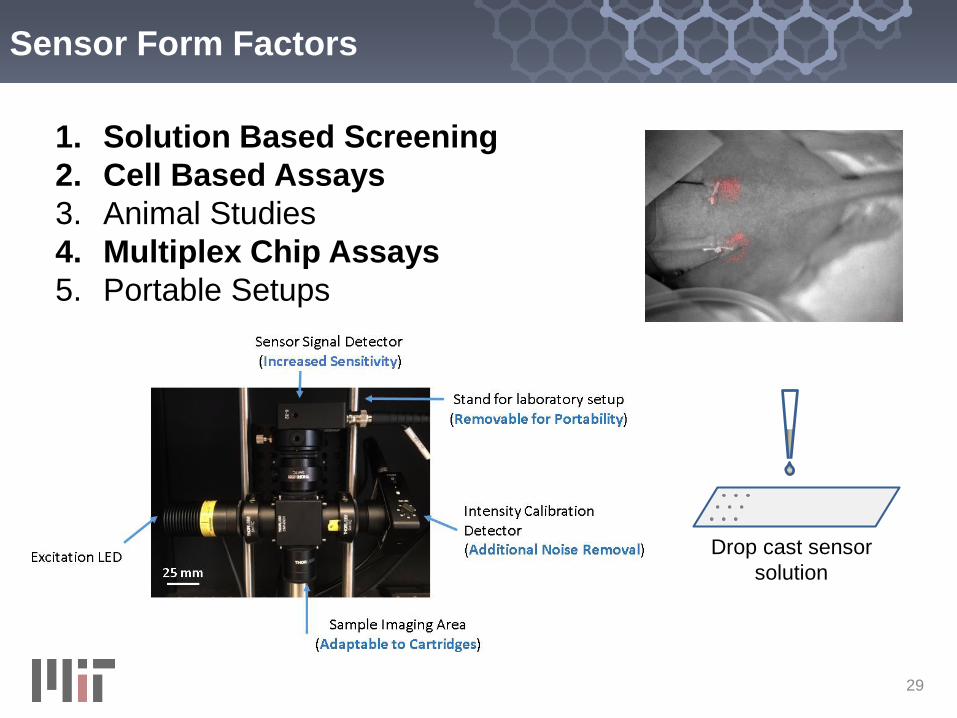
Sensor Form Factors
1. Solution Based Screening
2. Cell Based Assays
3. Animal Studies
4. Multiplex Chip Assays
5. Portable Setups
Drop cast sensor
solution

Advantages of SWNT nanosensor arrays
30Kruss S, …, Strano MS. PNAS 2017.
SWNT nanosensors can provide superior spatiotemporal resolution of cellular efflux
relative to existing state-of-the-art techniques
• Optical transduction enables simple sensor array fabrication
• Millisecond resolution (dependent on optical setup)
• Single molecule sensitivity
Fluorescence intensity trace of a
single (GA)15-ssDNA/SWCNT
imaged on a surface while adding
dopamine (10 µM).
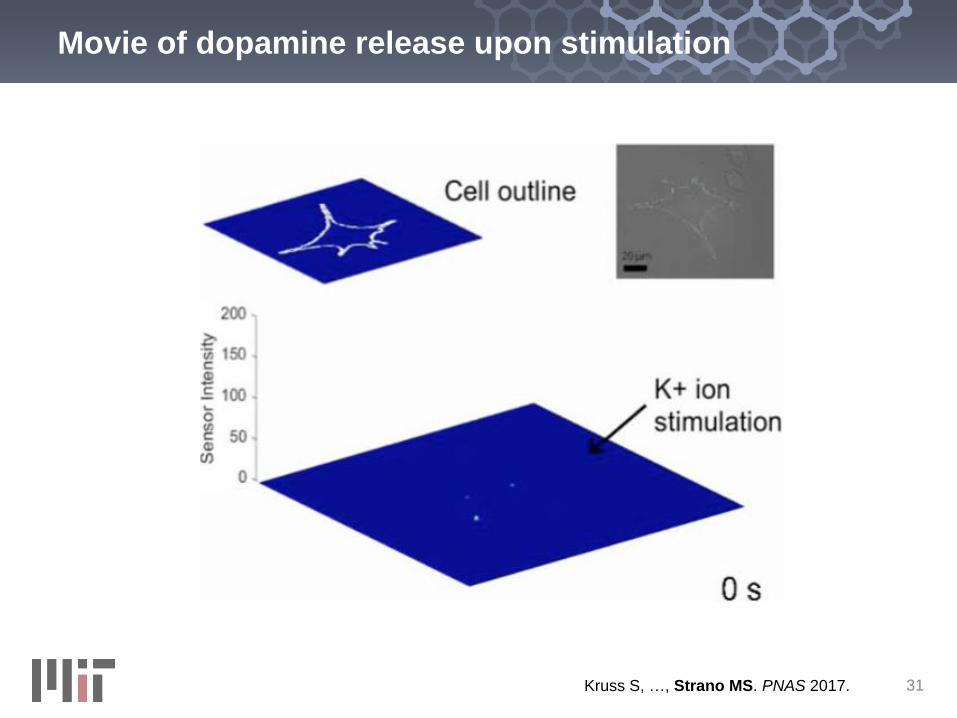
Movie of dopamine release upon stimulation
31Kruss S, …, Strano MS. PNAS 2017.

CoPhMoRe: In Vitro Detection of NO
Intracellular NO based on SWNT fluorescence
32Ulissi ZW, Sen F, …, Strano MS. Nano Letters 2014.
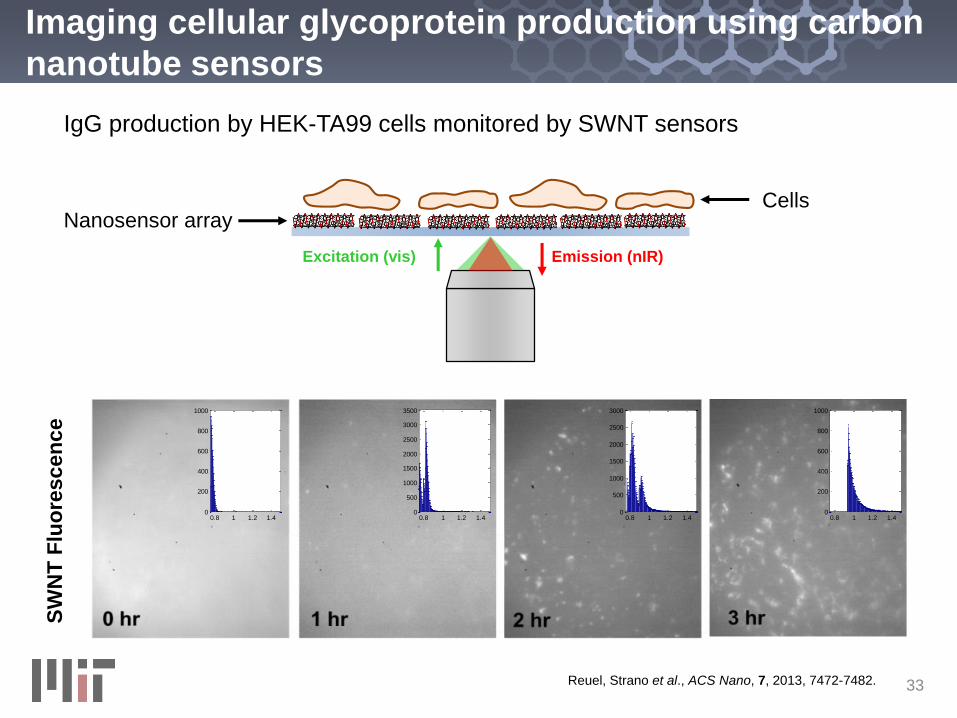
Imaging cellular glycoprotein production using carbon
nanotube sensors
33Reuel, Strano et al., ACS Nano, 7, 2013, 7472-7482.
SW
NT
Flu
ore
sc
en
ce
0.8 1 1.2 1.4
x 104
0
200
400
600
800
1000
0.8 1 1.2 1.4
x 104
0
500
1000
1500
2000
2500
3000
3500
0.8 1 1.2 1.4
x 104
0
500
1000
1500
2000
2500
3000
0.8 1 1.2 1.4
x 104
0
200
400
600
800
1000
0.8 1 1.2 1.4
x 104
0
200
400
600
800
1000
0.8 1 1.2 1.4
x 104
0
500
1000
1500
2000
2500
3000
3500
0.8 1 1.2 1.4
x 104
0
500
1000
1500
2000
2500
3000
0.8 1 1.2 1.4
x 104
0
200
400
600
800
1000
0.8 1 1.2 1.4
x 104
0
200
400
600
800
1000
0.8 1 1.2 1.4
x 104
0
500
1000
1500
2000
2500
3000
3500
0.8 1 1.2 1.4
x 104
0
500
1000
1500
2000
2500
3000
0.8 1 1.2 1.4
x 104
0
200
400
600
800
1000
0.8 1 1.2 1.4
x 104
0
200
400
600
800
1000
0.8 1 1.2 1.4
x 104
0
500
1000
1500
2000
2500
3000
3500
0.8 1 1.2 1.4
x 104
0
500
1000
1500
2000
2500
3000
0.8 1 1.2 1.4
x 104
0
200
400
600
800
1000
IgG production by HEK-TA99 cells monitored by SWNT sensors
Excitation (vis) Emission (nIR)
Nanosensor arrayCells

Label-free, multiplexed nanosensor arrays
34
Printed SWNT sensors enable facile fabrication of label-free microarrays
1 nL spots
500 µm
Dong, Strano et al., ACS Nano 2018.

Mathematical model for the analysis of
complex label-free lectin microarray data
Traditional lectin microarrays require fluorescent labeling and a washing step,
which fundamentally prevents the measurement of weak interactions.
Kuno et al., Nature Methods 2 (2005) 851-856.
Hirabayashi et al., Chem Soc Rev 42 (2013) 4443-4458.
Lectin microarrays offer the ability to multiplex glycan characterization by
measuring a large number of glycan-lectin binding interactions simultaneously.
35

Quantitative glycoprofiling using label-free lectin
microarrays
Label-free lectin microarrays can measure dynamic glycan-lectin binding
data and enable more comprehensive glycan characterization. However,
to date, no formal mathematical model has been developed for extracting
glycan information from large sets of lectin microarray data.
Label-free lectin microarray (2015)2Conventional lectin microarray (2014)1
1Gerlach et al., Anal. Methods 6 (2014) 440-449 2Geuijen et al., Anal. Chem 87 (2015) 8115-8122 36

Mathematical formulation of glycoprofiling
Glycoprofiling involves the elucidation and quantification of all
glycoforms in a mixture
,
,
,
,
,
P A
P B
P C
P D
P E
C
C
C
C
C
PCT
P
A
B
C
D
E
G
G
G
G
G
G P C
1 0 0 0 0
0 1 0 0 1
1 0 0 1 0
0 0 2 0 0
1 0 0 0 1
P
Glycan A Glycoform A
37

Modeling Reversible Interactions
At Steady State:
38
, j
j
j T j j j D j
j
d tk L t G t k K t
dt
max
1
max
2
max
11 ,
1
22 ,
1
,
1
j
j
T j
j D
j
T j
j D
jj
j T j
j D
GL
K
GL
K
GL
K
max
max
max
,
1
1
1
for each lectin,
1
j
j
jj
Tj
j D
j jjj
j D
GL
K
G
K
L
jGj

Solving Steady-State Solution for Two Glycans
0
0
0.115
ss
I I
I
0
0
0.112
ss
I I
I
, ,
, ,
, ,
PNA,
0.20 0.20 0.115
1
PNA A PNA B
PNA A PNA B
A B
D DPNA A PNA B
A BT
D D
G G
K K
G GL
K K
, ,
, ,
, ,
PNA,
0.20 0.20 0.115
1
PNA A PNA B
PNA A PNA B
A B
D DPNA A PNA B
A BT
D D
G G
K K
G GL
K K
0.76
0.54
A
B
G M
G M
After subbing in the KD values:
39
max
10
0 ,
0.20 = 20% sensor response at saturation
j
j
j
T
I I
I L

Model fits using dynamic data
40
LectinGlycan A Glycan B
KD (µM) kf (M-1 s-1) KD (µM) kf (M-1 s-1)
ECL 0.70 32000 3.0 30000
PNA 5.0 80000 0.45 60000
Fitting the model to the dynamic binding data enables us to isolate the contribute
in sensor response from each glycan in time
PNA-SWNTs ECL-SWNTs

Steady state and dynamic analyses yielded similar
estimations of glycan concentrations
Utilizing dynamic binding
data introduces additional
orthogonality into the
microarray
• Decreases number of
lectins needed
• Increases the degree of
glycan characterization
possible using a single
array
41

Nanosensors for Diagnostics and Biomonitoring
42
1) Corona Phase Molecular Recognition:
CoPhMoRe - new method for creating
molecular recognition sites by nanoparticle
templating
2) Multiplexed label free, nanosensor arrays
for process monitoring
Biomolecule detection and characterization using
nanosensor arrays
3) Mathematical model of sensor array
information
Optimization of sensor design and extraction
of additional information

Acknowledgements - Strano Research Group
Professor Michael S. Strano, PhD
Carbon P. Dubbs Professor of Chemical Engineering
Graduate Students
Naveed Bakh Michael Lee Daniel Salem Kevin Silmore Albert Liu Ananth Rajan
Anton Cottrill Minkyung Park Samuel Faucher Tedrick Lew Zhe Yuan Cache Hamilton
Postdoctoral Associates & Fellows
Freddy Nguyen Daichi Kozawa Xun Gong Dorsa Parviz Juyao-Ivy Dong
Volodymyr Koman Pingwei Liu Seonyeong Kwak Manki Son
Alumni
Gili Bisker Nicole Iverson Markita Landry
Jiyoung Ahn Min Hao Wong Song Wang
Punit Mehra Sebastian Kruss
Website: srg.mit.edu
43