Embed Size (px)
Citation preview

April 11, 2017 ▪ BOSLAB ▪ Mark Hartman
Next-Gen Sequencing in the High School Classroom

Outline • Introduce the BioSeq program • Walk through one of our favorite projects as an example
of what we do • Technical details about the experiment • How we run it in schools
• Show examples of some other projects

BioSeq program overview • What is BioSeq? Educational outreach program from
Tufts, Department of Chemistry, PI Prof. David Walt • What do we do? Increase access to next-generation
sequencing technology, promote scientific research in general, target the high school audience
• How are we able to do this? Funded by NIH Science Education Partnership Award (SEPA)

The need for genetics outreach • Genetics information is
increasingly commonplace • In the future we are likely to
encounter sequencing in many contexts
• Sequencing and bioinformatics remain inaccessible to the public
• Disconnect between current science and the science classroom

Bioinformatics Inquiry through Sequencing
Goal: Improve interest in and understanding of bioinformatics and sequencing, and improve attitudes toward scientific research
BioSeq
Educational sequencing
center Classroom modules
Summer course
Support science fair projects, class projects, independent summer
projects, etc.
Run lab experiments in local high school
classrooms
Six-week summer class at Tufts for high school
seniors to introduce sequencing and bioinformatics
Assessment

• Most activities in classroom, some activities in lab at Tufts • We allow two weeks for sample processing and sequencing
Overview of lessons
Classroom experiment
(data collection)
Introduction (research question)
Students analyze data (interpretation
of results)
Sample processing and sequencing at
Tufts

Approach Inquiry-based learning • Inquiry inspires student
interest in science, and improves retention of science content and procedures
Near peer mentoring • Younger students can
envision themselves as future scientists
• Undergrads involved in both design and teaching
MD Pluth, et al. Collaboration and Near-Peer Mentoring as a Platform for Sustainable Science Education Outreach. Journal of Chemical Education. 92 625-630.
Blanchard et al. Is inquiry possible in light of accountability?: A quantitative comparison of the relative effectiveness of guided inquiry and verification laboratory instruction.
Science Education. (2010)

Current and future modules • Personal Microbiome Portrait • Genetics of Race • Mutations Investigation • Food Microbiomes • Microbiomes of Water • Personal Genomics • DNA Sequencing for Forensics

Current and future modules • Personal Microbiome Portrait • Genetics of Race • Mutations Investigation • Food Microbiomes • Microbiomes of Water • Personal Genomics • DNA Sequencing for Forensics

Exploring Inter- and Intra-personal Variation in Microbial Communities
Hartman MR, Harrington KT, Etson CM, Fierman MB, Slonim DK, Walt DR. FEMS Microbiology Letters.
10.1093/femsle/fnw266, (In press, 2016.)

Our bodies, our microbiomes
1. Sender, R., Fuchs, S. & Milo, R. (2016) Revised estimates for the number of human and bacteria cells in the body. PLOS Biology 14(8): e1002533. 2. Qin et al. (2010) A human gut microbial gene catalogue established by metagenomic sequencing. Nature 464, 59-65.
Karyome 10 trillion cells 3 Gb per cell
~20,000 genes
Microbiome 1 microbial cell per human cell1
100-1,000 unique species >500,000 genes2
Mitochondria 100 mitochondria per cell, 5 mtDNA per
mitochondria = 5 quadrillion mtDNA 17 Kb per mtDNA
37 genes
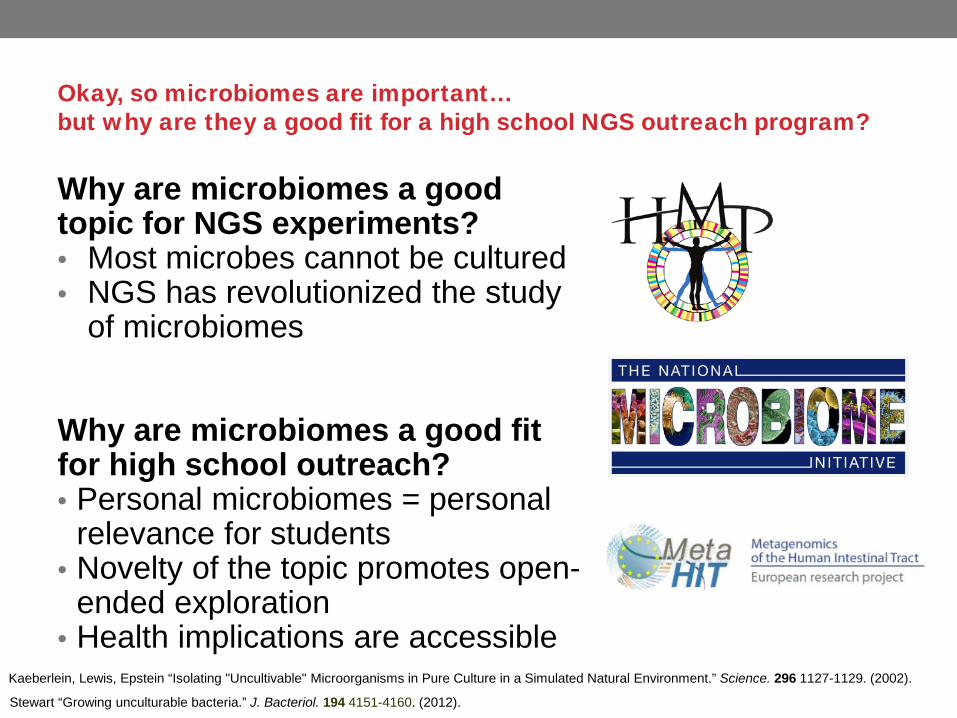
Okay, so microbiomes are important… but why are they a good fit for a high school NGS outreach program?
Why are microbiomes a good topic for NGS experiments? • Most microbes cannot be cultured • NGS has revolutionized the study
of microbiomes
Why are microbiomes a good fit for high school outreach? • Personal microbiomes = personal
relevance for students • Novelty of the topic promotes open-
ended exploration • Health implications are accessible
Stewart “Growing unculturable bacteria.” J. Bacteriol. 194 4151-4160. (2012).
Kaeberlein, Lewis, Epstein “Isolating "Uncultivable" Microorganisms in Pure Culture in a Simulated Natural Environment.” Science. 296 1127-1129. (2002).

• Most activities in classroom, some activities in lab at Tufts • We allow two weeks for sample processing and sequencing
Overview of lessons
Classroom experiment
(data collection)
Introduction (research question)
Students analyze data (interpretation
of results)
Sample processing and sequencing at
Tufts

Research question
versus

Sample collection Hard Palate Retroauricular Crease
Swab the entire hard palate for 20 seconds
Swab back and forth along the entire crease 50 times

Sample collection • Swab the entire hard
palate for 20 seconds • Use moderate force • Rotate the swab so all
surfaces come in contact with your palate
• Place the swab in a sterile tube
• CAREFULLY use scissors to cut the swab handle
• Use a marker to label your tube
Hard Palate
Swab the entire hard palate for 20 seconds

Sample processing PCR 1
Amplify desired regions Cell lysis
PCR clean up
PCR clean up Library pooling
Sampling
Quality check
PCR 2 Add unique barcode to each sample
Sequencing

Targeted vs. Total sequencing
From <https://www.neb.com/tools-and-resources/feature-articles/addressing-challenges-in-microbiome-dna-analysis>
Recall our research question: We want to identify species and then compare microbial populations.

Targeted amplification • Primers flank V3 and V4 hypervariable regions of
16S ribosomal RNA gene • Single amplicon ~460 bp
Kuczynski et al. “Experimental and analytical tools for studying the human microbiome.” Nature Reviews Genetics 13, 47-58 (2012).
Klindworth et al. “Evaluation of general 16S ribosomal RNA gene PCR primers for classical and next‐generation sequencing‐based diversity studies.” Nucleic Acids Res 41(1) (2013).
Forward: TCGTCGGCAGCGTCAGATGTGTATAAGAGACAG(N)0-3CCTACGGGNGGCWGCAG
Reverse: GTCTCGTGGGCTCGGAGATGTGTATAAGAGACAG(N)0-3GACTACHVGGGTATCTAATCC Underlined region contains “adapter” (sequencing primer) and “linker” (sequence for subsequent index PCR).

Sample processing PCR 1
Amplify desired regions Cell lysis
PCR clean up
PCR clean up Library pooling
Sampling
Quality check
PCR 2 Add unique barcode to each sample
Sequencing

Sequencing process • Sequencing by synthesis
technology: Sequence DNA by observing the synthesis of a complimentary strand
• Capacity ~10 million clusters per run
Illumina MiSeq sequencer
MiSeq Standard Flow Cell
Compare to the HiSeq X series which generates 6 billion reads per run…

Sequencing by synthesis
K. Voelkerding, et al, Clinical Chemistry, 2009

Sequencing output Read 1: GCCTACGGGTGGCAACAGTGGGGAATCTTCCGCAATGGACGAAAGTCTGACGGAGCAACGCCGCGTGAGTGATGACGGCCTTCGGGTTGTAAAGCTCTGTTAATCGGGACGAAAGGTCTTCTTGCGAATAGTTAGAAGAATTGACGGTACCGGAATAGAAAGCCACGGCTAACTACGTGCCAGCAGCCGCGGTAATACGTAGGTGGCAAGCGTTGTCCGGAATTATTGGGCGTAAAGCGCGCGCAGGCGGA
Read 2: TGGCCTACAGTAGTCACTGTCTCTTATACACATCTCCGAGCCCACGAGACTGCAGCTAATCTCGTATGCCGTCTTCTGCTTGAAAAAAAAAAAAAAAAAAGAAGTAATGCAGGGGTGTGAGTGACTAAGAGGAGAGTGGTATGACATAAAACTAAGAAAACAACTAAAACAAGGGGAGGGCACAATATAACGTATCTCTGAGATGGTACTATGTGTCTGTGTAGCATCTGACATAATAACGTCCATATTCA
Read 31,164: CCTACGGGTGGCTGCAGTGGGGAATCTTCCGCAATGGACGAAAGTCTGACGGAGCAACGCCGCGTGAGTGATGACGGCCTTCGGGTTGTAAAGCTCTGTTAATCGGGACGAAAGGTCCTCTTGCGAATAGTTAGAGGAATTGACGGTACCGGAATAGAAAGCCACGGCTAACTACGTGCCAGCAGCCGCGGTAATACGTAGGTGGCAAGCGTTGTCCGGAATTATTGGGCGTAAAGCGCGCGCAGGCGGAT
…
Raw sequencing data: After base calls, demultiplexing, adapter trimming
Desired output data: Relative abundances of microbes so we can compare populations

Workflow for comparing microbiome samples
Raw reads
Join paired end reads
Pick operational taxonomic units
Diversity analysis
Stratify samples
QIIM
E to
ols
Relative abundances
Per-sample analyses
Cross-sample analyses
QIIME is an open-source bioinformatics pipeline for performing microbiome analysis (developed primarily in the Knight and Caporaso labs)
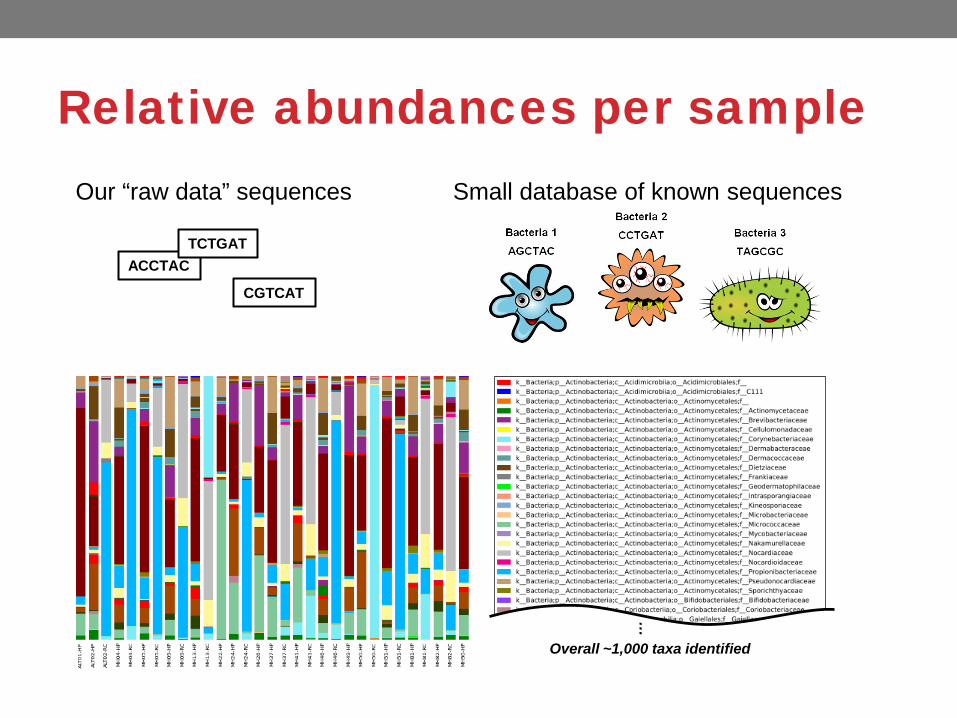
Relative abundances per sample
Overall ~1,000 taxa identified …
ACCTAC TCTGAT
CGTCAT
Our “raw data” sequences Small database of known sequences

Cross-sample comparisons
Sample 2 Sample 1
Gemella Porphyromonas Actinobacillus Mannheimia Leptotrichia
Rothia Veillonella
Haemophilus Streptococcus
Prevotella
Anaerococcus Propionibacterium
Staphylococcus Peptoniphilus
Finegoldia
Sample 1 Sample 2

Lesson #5: Results and discussion
• Health disclaimers • Results • Common bacteria
Streptococcus: Typically thrives in warm and wet environments. Propionibacterium: Consumes sebum, a type of oil that be produced on your skin. Actinomyces, Clostridium, Fusobacterium, Prevotella, Veillonella: Examples of obligate anaerobes (microbes that are not tolerant of oxygen).

Return to the research question
versus
• Revisit the students’ original hypotheses
• Survey students on their actual data-supported conclusions
• Why? What are the implications?
(Is this experimental outcome supported by more rigorous analysis?)
At the completion of the experiment, students are rewarded with stickers
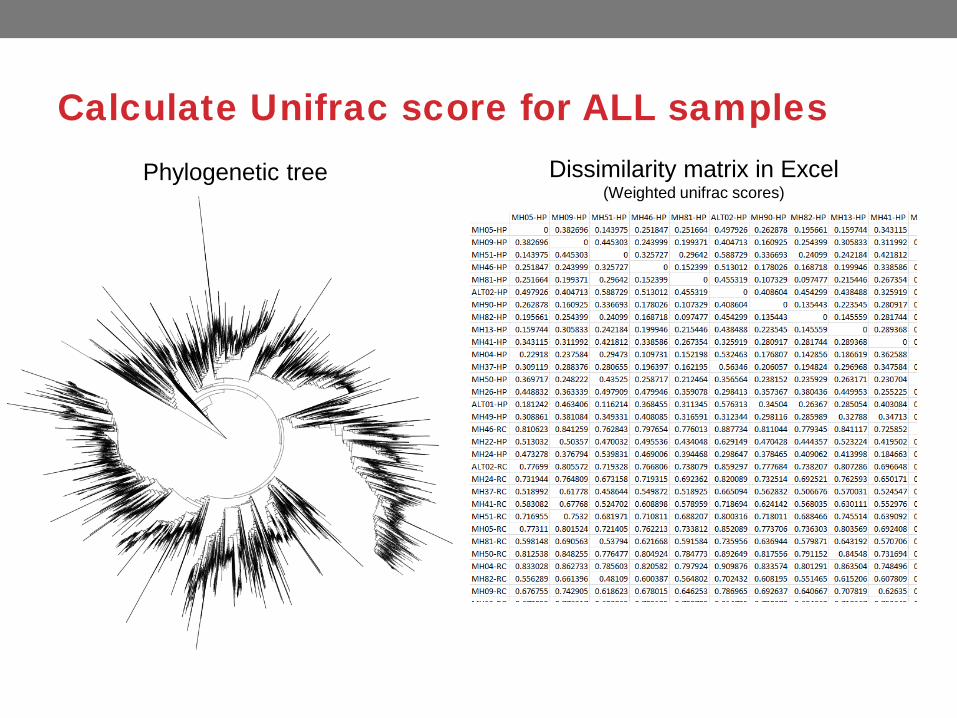
Calculate Unifrac score for ALL samples Phylogenetic tree Dissimilarity matrix in Excel
(Weighted unifrac scores)

Body site versus individual variation
p < 1x10-15
Higher dissimilarity metric arises from body site-to-site variation (same individual) than from person-to-person variation (same body site)
• Find the distribution of dissimilarity scores for each category of sample comparisons
(Is this really supported by more rigorous analysis?)

Personal Microbiome wrap-up • Probably our most popular outreach activity, reaching
hundreds of students in the local area • Positive assessment results indicate gains in knowledge
and attitudes toward science

Like 23andMe, but for microbiomes
https://ubiome.com/explorer

Further Reading

Thanks! BioSeq team
• Kristin Harrington • Dr. Matt Fierman • Prof. Donna Slonim • Prof. David Walt
Walt lab
Funders
• Hannah DeBaets • Chris Blackwood • Tabitha Amondi • Bridget Yang • Anthony Garrity • Quin Bottom-Johnson
• Kevin Lim • Brittany Bowman • Elise Gan • Jack Reid • Hannah Voelker • Matt Cassar
Partner teachers and administrators