Embed Size (px)
Citation preview
Next-Gen Endpoint Risks and Protections: A SANS Survey
©2017 SANS™ Institute
A SANS SurveyWritten by G. W. Ray Davidson, PhD
March 2017
Sponsored by Malwarebytes
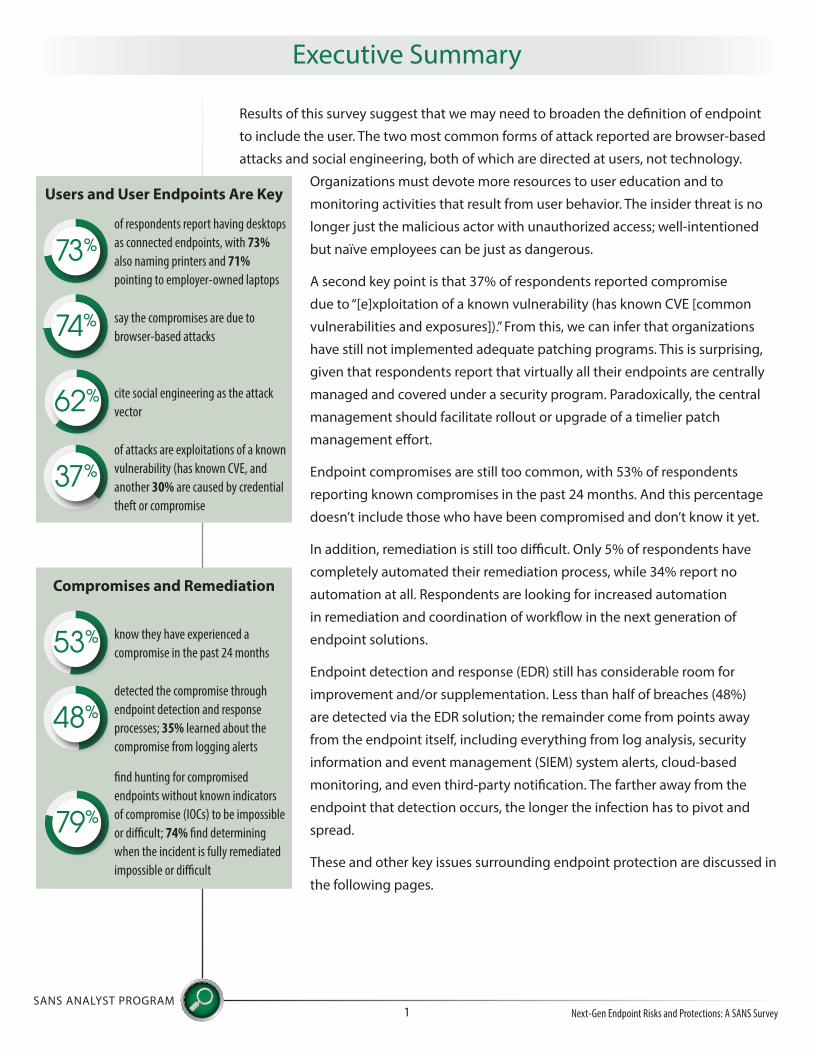
Results of this survey suggest that we may need to broaden the definition of endpoint
to include the user. The two most common forms of attack reported are browser-based
attacks and social engineering, both of which are directed at users, not technology.
Organizations must devote more resources to user education and to
monitoring activities that result from user behavior. The insider threat is no
longer just the malicious actor with unauthorized access; well-intentioned
but naïve employees can be just as dangerous.
A second key point is that 37% of respondents reported compromise
due to “[e]xploitation of a known vulnerability (has known CVE [common
vulnerabilities and exposures]).” From this, we can infer that organizations
have still not implemented adequate patching programs. This is surprising,
given that respondents report that virtually all their endpoints are centrally
managed and covered under a security program. Paradoxically, the central
management should facilitate rollout or upgrade of a timelier patch
management effort.
Endpoint compromises are still too common, with 53% of respondents
reporting known compromises in the past 24 months. And this percentage
doesn’t include those who have been compromised and don’t know it yet.
In addition, remediation is still too difficult. Only 5% of respondents have
completely automated their remediation process, while 34% report no
automation at all. Respondents are looking for increased automation
in remediation and coordination of workflow in the next generation of
endpoint solutions.
Endpoint detection and response (EDR) still has considerable room for
improvement and/or supplementation. Less than half of breaches (48%)
are detected via the EDR solution; the remainder come from points away
from the endpoint itself, including everything from log analysis, security
information and event management (SIEM) system alerts, cloud-based
monitoring, and even third-party notification. The farther away from the
endpoint that detection occurs, the longer the infection has to pivot and
spread.
These and other key issues surrounding endpoint protection are discussed in
the following pages.
SANS ANALYST PROGRAMNext-Gen Endpoint Risks and Protections: A SANS Survey 1
Executive Summary
of respondents report having desktops as connected endpoints, with 73% also naming printers and 71% pointing to employer-owned laptops
of attacks are exploitations of a known vulnerability (has known CVE, and another 30% are caused by credential theft or compromise
say the compromises are due to browser-based attacks
cite social engineering as the attack vector
Users and User Endpoints Are Key
73%
74%
62%
37%
know they have experienced a compromise in the past 24 months
detected the compromise through endpoint detection and response processes; 35% learned about the compromise from logging alerts
find hunting for compromised endpoints without known indicators of compromise (IOCs) to be impossible or difficult; 74% find determining when the incident is fully remediated impossible or difficult
Compromises and Remediation
53%
48%
79%

Respondents and Their Endpoints
SANS ANALYST PROGRAMNext-Gen Endpoint Risks and Protections: A SANS Survey 2
Organizations of all sizes and from multiple geographic regions are represented in this
survey, which was taken by 246 respondents from the SANS community. They report a
variety of endpoints connecting to their enterprises. A significant percentage are seeing
Internet of Things (IoT) devices and smart sensors connecting to their networks, while a
small fraction are also dealing with wearables and smart cars.
About the Respondents
Security analysts and managers make up a large portion of the survey respondents,
echoing last year’s survey. In this year’s survey, 59% of respondents have security in
their title, while another 21% of respondents represent views of IT managers or system
administrators. See Figure 1.
What is your primary role in your organization, whether as an employee or contractor?
Syst
em a
dmin
istr
ator
/Sy
stem
ana
lyst
IT m
anag
er o
r dire
ctor
Secu
rity
adm
inis
trat
or/
Secu
rity
anal
yst
Net
wor
k op
erat
ions
ad
min
istr
ator
Secu
rity
arch
itect
Secu
rity
man
ager
o
r dire
ctor
CIO
/CTO
/ VP
of t
echn
olog
y
CSO
/CIS
O/V
P of
sec
urity
Figure 1. Top Respondent Roles
25%
20%
15%
10%
5%
0%
Respondents and Their Endpoints (CONTINUED)
SANS ANALYST PROGRAMNext-Gen Endpoint Risks and Protections: A SANS Survey 3
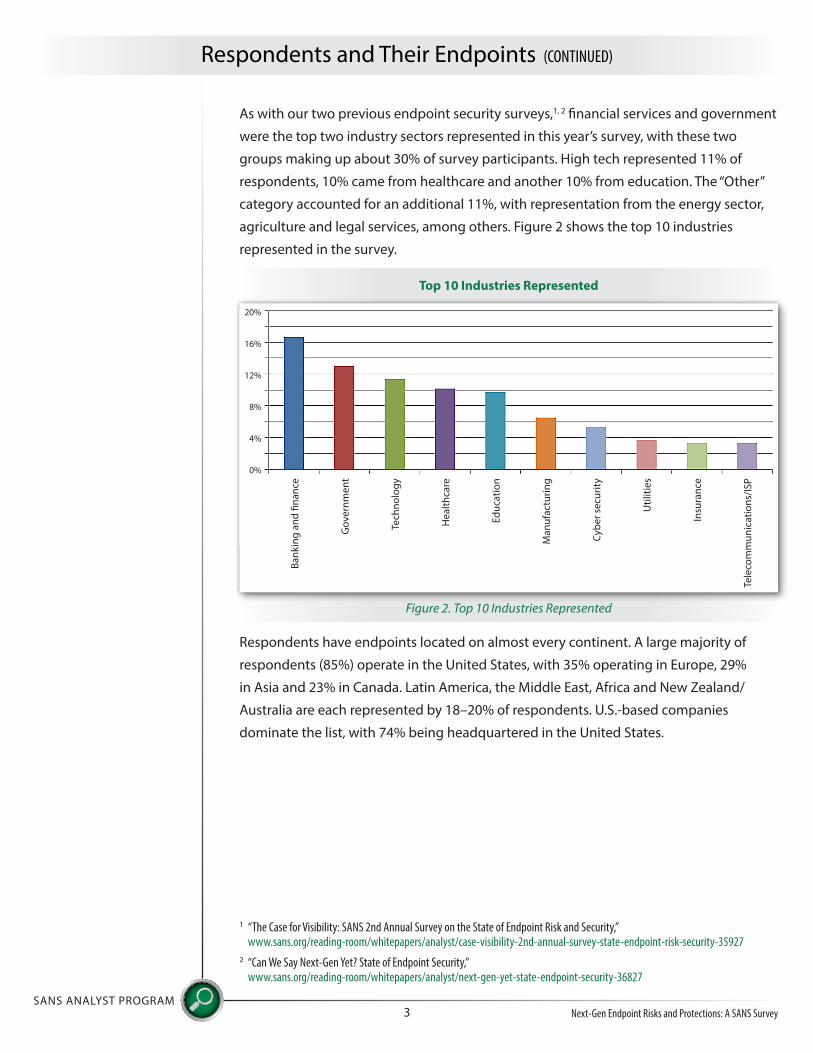
As with our two previous endpoint security surveys,1, 2 financial services and government
were the top two industry sectors represented in this year’s survey, with these two
groups making up about 30% of survey participants. High tech represented 11% of
respondents, 10% came from healthcare and another 10% from education. The “Other”
category accounted for an additional 11%, with representation from the energy sector,
agriculture and legal services, among others. Figure 2 shows the top 10 industries
represented in the survey.
Respondents have endpoints located on almost every continent. A large majority of
respondents (85%) operate in the United States, with 35% operating in Europe, 29%
in Asia and 23% in Canada. Latin America, the Middle East, Africa and New Zealand/
Australia are each represented by 18–20% of respondents. U.S.-based companies
dominate the list, with 74% being headquartered in the United States.
1 “The Case for Visibility: SANS 2nd Annual Survey on the State of Endpoint Risk and Security,” www.sans.org/reading-room/whitepapers/analyst/case-visibility-2nd-annual-survey-state-endpoint-risk-security-35927
2 “Can We Say Next-Gen Yet? State of Endpoint Security,” www.sans.org/reading-room/whitepapers/analyst/next-gen-yet-state-endpoint-security-36827
Top 10 Industries Represented
Man
ufac
turin
g
Tech
nolo
gy
Bank
ing
and
finan
ce
Cybe
r sec
urity
Insu
ranc
e
Hea
lthca
re
Gov
ernm
ent
Util
ities
Tele
com
mun
icat
ions
/ISP
Educ
atio
n
Figure 2. Top 10 Industries Represented
20%
16%
12%
8%
4%
0%

Respondents and Their Endpoints (CONTINUED)
SANS ANALYST PROGRAMNext-Gen Endpoint Risks and Protections: A SANS Survey 4
About Their Endpoints
The respondents represented small to very large companies, having a range from
fewer than 100 user accounts and endpoints to more than 500,000 connected to the
network. The size distribution, as in 2016, was split, with 33% (30% in 2016) representing
organizations with more than 10,000 endpoints connecting, 33% (34% in 2016) from
organizations with 1,000 to 9,999 endpoints, and 30% (28% in 2016) with fewer than 999
endpoints connecting. See Figure 3.
The most common types of endpoints connecting continue to be employer owned:
desktops (73%), printers (73%), networking devices (71%), laptops (71%) and servers
(70%). More importantly, 63% are seeing employee-owned devices connecting to
their networks.
How many unique user accounts and endpoints are currently connecting to your organization’s network?
5,00
0–9,
999
500–
999
Less
than
100
10,0
00–2
4,99
9
50,0
00–9
9,99
9
1,00
0–2,
499
100–
499
25,0
00–4
9,99
9
100,
000–
500,
000
Mor
e th
an 5
00,0
00
2,50
0–4,
999
Figure 3. Size Defined by Number of User Accounts and Endpoints
16%
12%
8%
4%
0%
User Accounts Endpoints
Percentage of respondents’
organizations that have employee-owned devices connecting to
their networks
63%

Respondents and Their Endpoints (CONTINUED)
SANS ANALYST PROGRAMNext-Gen Endpoint Risks and Protections: A SANS Survey 5
It is instructive to look at the types of devices connecting to organizations’ networks
and consider which types of devices are centrally managed and/or covered under
organizational security programs. Figure 4 illustrates the management and coverage
styles categorized by device type.
What device types are connecting to your network or part of your network? Which are under central management?
Identify which are explicitly included in your security/risk management programs.
0% 40% 80%20% 60%
Desktops (employer-owned)
Mobile devices (employer-owned)
Industrial control systems (SCADA, plant floor manufacturing)
Environmental controls (HVAC, water treatment)
Smart cars
Laptops (employer-owned)
Physical perimeter security systems (electronic access controls, surveillance programs)
Other IoT devices
Servers (development, database, email, web, DNS)
Endpoints hosted in the cloud (emulated or virtualized)
Wearables
Printers
Mobile devices (employee-owned; tablets, notebooks/iPads, smartphones)
Point-of-sale (POS) devices
Routers, firewalls, switches and other network devices
Laptops (employee-owned)
Smart sensors (Internet of Things)
Connecting Centrally Managed Included in Security Program
Figure 4. Devices in Use and Included in Security Programs
TAKEAWAY
Printers are still not adequately
secured. Because printers
are not normally under the
control of end users, they are
less likely to be vulnerable
to the social engineering
and other end-user focused
attacks that constitute the
primary attack vector in most
networks. However, they
are still vulnerable to lateral
attacks and malware spreading
to and through them. They
should definitely be included
in security management
programs.

Respondents and Their Endpoints (CONTINUED)
SANS ANALYST PROGRAMNext-Gen Endpoint Risks and Protections: A SANS Survey 6
Close examination of the graph reveals that in some cases (notably servers, network
devices, and employer-owned desktops and laptops) more respondents reported a
device type as being covered by their security/management program than are actually
connecting to the network. This seems counterintuitive, but may be due to inaccuracies
in estimation by respondents, or it may simply be that organizations have the capacity to
manage more devices than they are currently connecting to the network.
More importantly, many more employee-owned and IoT devices are connecting to the
network than are centrally managed and covered by the security program. This is not
surprising because these devices are more difficult to centrally manage. But it does
point out a critical systemic vulnerability that organizations must address. Users have
demanded the ability to use bring-your-own-device (BYOD) resources, and employers
have complied. However, it’s difficult to dictate and enforce policy without the use of
host-based agents. Unfortunately, the wide variety of user devices and applications
means that agents are not universally compatible, and they can sometimes break things,
to the dismay of users.
Another interesting anomaly is that 22% of respondents report point-of-sale (POS)
devices connecting to their networks, even though retail represents less than 1% of the
industry responses. We saw the same result in the 2016 survey, where 27% reported POS
devices connecting to their networks. Many industries, although they may not consider
themselves part of the retail sector, are operating PoS terminals to accept payments
for services and goods—for example, a hospital selling pharmaceuticals, or a state
department of motor vehicles collecting fees.
Endpoint and User Account Management
Centralized management of endpoints and accounts is frequently mentioned as a
tool for improving security3, 4, 5 often as part of implementation of the CIS Controls for
Effective Cyber Defense6 (formerly known as the Critical Security Controls). This survey
examined the extent to which both endpoints and user accounts are under centralized
management. When considering all types of endpoints together (regardless of type
of endpoint), responses show that nearly all endpoints and user accounts are under
centralized management. See Figures 5 and 6.
TAKEAWAY
Organizations should
implement a strategy of
protecting the network
(through access controls, etc.)
from unmanaged user-owned
endpoints where installation
of agents on employee-owned
devices is not feasible.
Wearable technologies
were mentioned by 17%
of respondents, and smart
cars, which are new this year,
were connecting at 5% of
respondent organizations.
Not surprisingly, coverage
of wearables and personally
owned smart cars in central
management or security
programs is lagging their
connections to the network,
just as with other employee-
owned devices.
3 “Streamline Risk Management by Automating the SANS 20 Critical Security Controls,” www.sans.org/reading-room/whitepapers/analyst/streamline-risk-management-automating-20-critical-security-controls-35215
4 “Implementing the CIS Critical Security Controls,” updated in January 2017, www.sans.org/reading-room/whitepapers/analyst/implementing-critical-security-controls-37547
5 “The Critical Security Controls: What’s NAC Got to Do with IT?,” www.sans.org/reading-room/whitepapers/analyst/critical-security-controls-nac-it-35727
6 www.cisecurity.org/critical-controls [Registration required.]

Respondents and Their Endpoints (CONTINUED)
SANS ANALYST PROGRAMNext-Gen Endpoint Risks and Protections: A SANS Survey 7
Endpoints vs. Endpoints Under Centralized Management
2,50
0–4,
999
100–
499
Unk
now
n
5,00
0–9,
999
25,0
00–4
9,99
9
500–
999
Less
than
100
10,0
00–2
4,99
9
50,0
00–9
9,99
9
100,
000–
500,
000
Mor
e th
an 5
00,0
00
1,00
0–2,
499
Figure 5. Endpoints Mostly Under Centralized Control
16%
12%
8%
4%
0%
Endpoints Endpoints Under Centralized Management
User Accounts vs. User Accounts Under Centralized Management2,
500–
4,99
9
100–
499
Unk
now
n
5,00
0–9,
999
25,0
00–4
9,99
9
500–
999
Less
than
100
10,0
00–2
4,99
9
50,0
00–9
9,99
9
100,
000–
500,
000
Mor
e th
an 5
00,0
00
1,00
0–2,
499
Figure 6. User Accounts Mostly Under Centralized Control
16%
12%
8%
4%
0%
User Accounts User Accounts Under Centralized Management

Respondents and Their Endpoints (CONTINUED)
SANS ANALYST PROGRAMNext-Gen Endpoint Risks and Protections: A SANS Survey 8
Visibility into Endpoints
Management of endpoints relative to the network includes control of access to network resources. Because control of that access depends on characteristics of the endpoint, the endpoint control system must be able to assess those characteristics. Examination of the survey data shows higher availability of relatively static information such as operating system, type and version (with physical location a notable exception), and increasingly lower availability of more ephemeral, memory-resident information. The results are shown in Figure 7.
Indicate whether or not you are able to acquire the listed endpoint information from your current infrastructure. Indicate N/A if the data is not needed to address compromises.
0% 40% 80%20% 60%
OS and version
User login including date, time, location
Browser history artifacts
Information regarding running applications
Disk-based artifacts
Unauthorized possession of sensitive data (PHI, company proprietary)
Other
Type of endpoint
Listening network ports
Physical location of endpoint
ARP cache entries
Active Directory (or other directory) Object
Vulnerability scan data
DNS cache entries
Radius accounting
Installed software and version
Network interface configuration
Route tables
Version of endpoint
Running processes
Registry-based artifacts
Memory-based artifacts
Able to Acquire Unable to Acquire
Figure 7. Ability to Acquire Endpoint Information

Respondents and Their Endpoints (CONTINUED)
SANS ANALYST PROGRAMNext-Gen Endpoint Risks and Protections: A SANS Survey 9
Interestingly, the least-available endpoint information is associated with a user-
associated characteristic: unauthorized possession of specific types of data. This is not
surprising if we consider the relative difficulty of acquiring the information, whether in
a manual or automated fashion. But it is a major concern because the data itself is the
object of an attack. The other characteristics are simply indicators of the attack, and they
could be obscured as part of an attack scenario.
According to the survey respondents, memory-based artifacts
are the second-most difficult data type to acquire. This is likely
to remain a challenge for the foreseeable future, because the
data is ephemeral and may be invalid by the time it is acquired.
In addition, remote acquisition of RAM is technically very
challenging—and not yet feasible on a large scale. Registry-
based artifacts and DNS cache entries are also considered
difficult to acquire by respondents. It is worth noting that,
for incident response, these artifacts are best obtained from
memory and will be subject to the challenge noted previously.
Next comes physical location of the endpoint, which may point out the need for
improvement (or implementation!) of asset management systems, although increases in
device mobility can easily subvert most such systems.
Secure the Endpoint by Securing the User
Our understanding of the insider threat is also maturing. In the past, the insider threat was primarily thought of as a malicious actor who intentionally misuses access to negatively affect an organization.7 However, a recent analysis indicated that 25% of breaches in that study were due to simple negligence on the part of an employee or contractor.8 It is no longer sufficient to guard against malicious actors; organizations must secure their endpoints by securing the users that control them.9
7 “Combating the Insider Threat,” National Cybersecurity and Communications Integration Center, September 2014, www.us-cert.gov/sites/default/files/publications/Combating%20the%20Insider%20Threat_0.pdf
8 2016 Ponemon Cost of Data Breach Study: Global Analysis, June 20169 “Taking Action Against the Insider Threat,” www.sans.org/reading-room/whitepapers/analyst/action-insider-threat-37322

SANS ANALYST PROGRAMNext-Gen Endpoint Risks and Protections: A SANS Survey 10
Exploits at the Endpoint
0% 40% 80%20% 60%
More than half (53%) of responders reported they had endpoint compromises in the
past 24 months, with 10% of respondents saying they didn’t know whether they’d been
breached. In last year’s survey, 44% reported breaches to one or more endpoint.10 This
year’s results reflect either an increase in breach activity or an increase in detection
capability (or both). The clear majority of endpoints breached were desktops and
employer-owned laptops, as they had been in 2016. In 2017, desktops and laptops were
responsible for 86% and 79% of breaches, respectively. Most endpoint compromises
involved more than one device, as illustrated in Figure 8.
Over the past 24 months, what types of endpoints have been compromised? Please indicate if these were widespread or limited in scope to either a small number of endpoints or just one endpoint.
Desktops (employer-owned)
Mobile devices (employee-owned; tablets, notebooks/iPads, smartphones)
Physical perimeter security systems (electronic access controls, surveillance programs)
Environmental controls (HVAC, water treatment)
Other
Laptops (employee-owned)
Printers
Smart sensors (Internet of Things)
Mobile devices (employer-owned)
Industrial control systems (SCADA, plant floor manufacturing)
Smart cars
Laptops (employer-owned)
Endpoints hosted in the cloud (emulated or virtualized)
Point of sale (POS) devices
Servers (development, database, email, web, DNS)
Routers, firewalls, switches and other network devices
Wearables
Single Endpoint Small Number of Endpoints Widespread
Figure 8. Endpoints Compromised
10 “Can We Say Next-Gen Yet? State of Endpoint Security,” www.sans.org/reading-room/whitepapers/analyst/next-gen-yet-state-endpoint-security-36827
Percentage of respondents reporting
an endpoint compromise in the past 24 months
53%

Exploits at the Endpoint (CONTINUED)
SANS ANALYST PROGRAMNext-Gen Endpoint Risks and Protections: A SANS Survey 11
Users Are Being Targeted
The primary reported attack vectors, with 74% and 62% respectively, were browser-based attacks and social engineering/phishing. These attacks are especially notable because they are directed at users, rather than technology. See Figure 9.
Even with new technologies, such as BYOD, IoT, wearables and automobiles,11 the primary target in a system is the user and his/her use of the technology. This has led to the development of methods, called user behavior analytics, to monitor user behaviors for anomalies and other signs of suspicious behavior.12
The next most frequently reported cause of compromise, selected by 37% of respondents, was “Exploitation of a known vulnerability (has published CVE).” This is especially troubling because it means that organizations are still not patching systems in a timely fashion.
Another 30% say breaches discovered in their enterprises had utilized “Credential theft or compromise,” which is frequently (although not always), associated with password re-use. Another 26% of breaches involved “Infected or malicious USB.” So the pattern is obvious: Endpoints associated with users are targeted most often because users make mistakes that can be easily exploited.
How were these endpoints compromised? Select all that apply.
Infe
cted
or m
alic
ious
USB
Mac
hine
inte
rfac
e vu
lner
abili
ty
Expl
oita
tion
of k
now
n vu
lner
abili
ty
(has
pub
lishe
d CV
E)
Brow
ser-
base
d at
tack
s (d
rive-
by
dow
nloa
ds fr
om th
e w
eb
to th
e en
dpoi
nt)
Com
prom
ised
app
s on
the
endp
oint
Firm
war
e m
anip
ulat
ion
Cred
entia
l the
ft o
r com
prom
ise
Soci
al e
ngin
eerin
g of
end
use
r (p
hish
ing)
Infe
cted
thro
ugh
othe
r att
ache
d m
edia
dev
ices
Web
cam
bre
ach
Expl
oita
tion
of “z
ero-
day”
vu
lner
abili
ty
(no
publ
ishe
d CV
E)
Oth
er
Figure 9. Endpoint Attack Vectors
60%
40%
20%
0%
The Golden Age of protocol
vulnerabilities is gone. This is
the new era, where users and
their predicted behaviors are
the targets.
The pattern is obvious:
Endpoints associated
with users are
targeted most often
because users make
mistakes that can be
easily exploited.
11 “Securing the ‘Internet of Things’ Survey,” www.sans.org/reading-room/whitepapers/covert/securing-internet-things-survey-34785 12 “The Expanding Role of Data Analytics in Threat Detection,”
www.sans.org/reading-room/whitepapers/analyst/expanding-role-data-analytics-threat-detection-36362
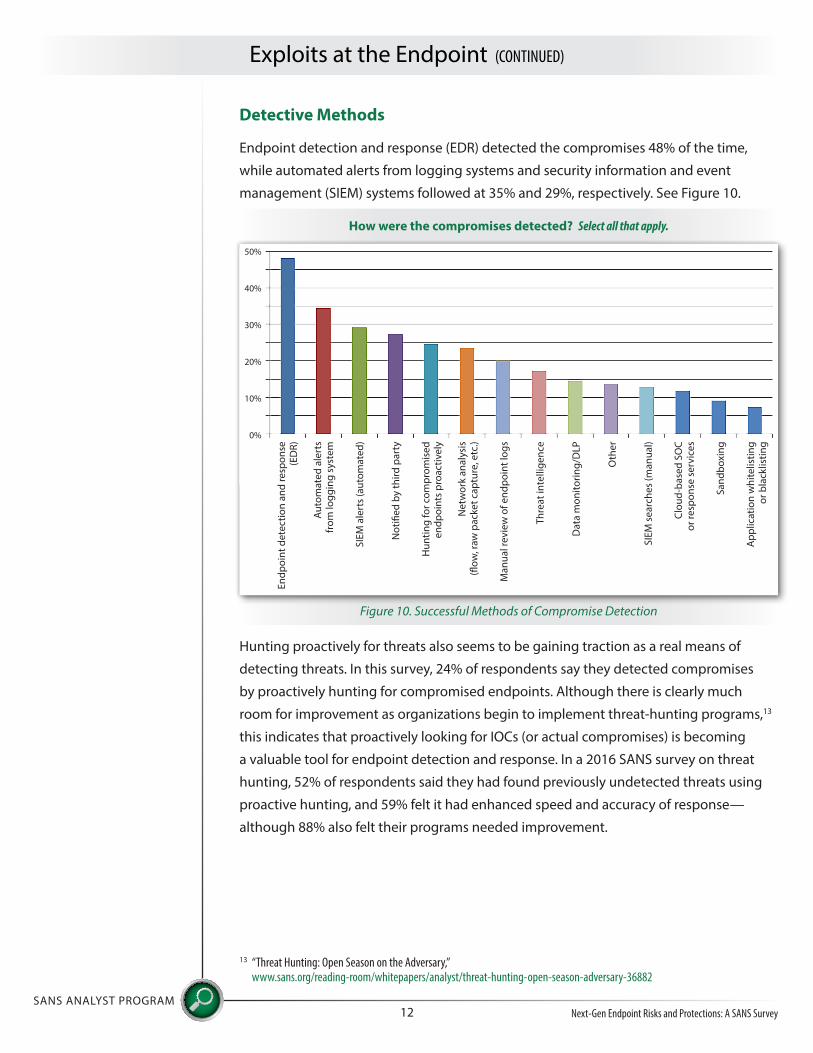
Detective Methods
Endpoint detection and response (EDR) detected the compromises 48% of the time,
while automated alerts from logging systems and security information and event
management (SIEM) systems followed at 35% and 29%, respectively. See Figure 10.
Hunting proactively for threats also seems to be gaining traction as a real means of
detecting threats. In this survey, 24% of respondents say they detected compromises
by proactively hunting for compromised endpoints. Although there is clearly much
room for improvement as organizations begin to implement threat-hunting programs,13
this indicates that proactively looking for IOCs (or actual compromises) is becoming
a valuable tool for endpoint detection and response. In a 2016 SANS survey on threat
hunting, 52% of respondents said they had found previously undetected threats using
proactive hunting, and 59% felt it had enhanced speed and accuracy of response—
although 88% also felt their programs needed improvement.
Exploits at the Endpoint (CONTINUED)
SANS ANALYST PROGRAMNext-Gen Endpoint Risks and Protections: A SANS Survey 12
How were the compromises detected? Select all that apply.
Net
wor
k an
alys
is
(flow
, raw
pac
ket c
aptu
re, e
tc.)
Oth
er
SIEM
ale
rts
(aut
omat
ed)
Endp
oint
det
ectio
n an
d re
spon
se
(ED
R)
Man
ual r
evie
w o
f end
poin
t log
s
SIEM
sea
rche
s (m
anua
l)
Sand
boxi
ng
Not
ified
by
third
par
ty
Auto
mat
ed a
lert
s fr
om lo
ggin
g sy
stem
Thre
at in
telli
genc
e
Clou
d-ba
sed
SOC
or re
spon
se s
ervi
ces
App
licat
ion
whi
telis
ting
or b
lack
listin
g
Hun
ting
for c
ompr
omis
ed
endp
oint
s pr
oact
ivel
y
Dat
a m
onito
ring/
DLP
Figure 10. Successful Methods of Compromise Detection
50%
40%
30%
20%
10%
0%
13 “Threat Hunting: Open Season on the Adversary,” www.sans.org/reading-room/whitepapers/analyst/threat-hunting-open-season-adversary-36882

We also asked responders to specify additional network-related data they consider
necessary for supporting endpoint detection and response. The highest priority was
specified as access logs and user data, but traffic data, including DNS data, was also
listed by most responders as important. See Figure 11.
Incorporation of these capabilities, or the ability to incorporate the data into the incident
response and remediation workflow, would improve automation and incident response
(IR) remediation capability.
Remediation
Because the scope of a compromise can expand much faster than remediation efforts
(especially manual remediation), 65% of responders want a response to an endpoint
query within 5 minutes, and an additional 16% are willing to wait 30 minutes. That
means 81% of responders expect a response from an endpoint query within 30 minutes.
Even with automated remediation processes, delays in detection and alerting mean
that compromises can spread internally and increase the difficulties in containment and
remediation. Faster is better. Because most organizations spend up to a half day per
endpoint in remediation, the costs multiply quickly. Time is of the essence.
Exploits at the Endpoint (CONTINUED)
SANS ANALYST PROGRAMNext-Gen Endpoint Risks and Protections: A SANS Survey 13
What additional network data do you consider necessary to supporting endpoint detection and response? Select all that apply.
Full
pack
et c
aptu
re
DN
S da
ta
Acce
ss lo
gs a
nd u
ser d
ata
Net
wor
k flo
w d
ata
Net
wor
k se
curit
y da
ta fr
om
IPS/
Fire
wal
ls/U
TM
Met
adat
a (p
acke
t hea
der i
nfor
mat
ion)
Figure 11. Network Data Needed to Support Endpoint Detection and Response
80%
60%
40%
20%
0%
The scope of a
compromise can
expand much faster
than remediation
efforts. Time is of the
essence.

Are They Gone Yet?
Determining the scope of a threat across multiple endpoints and then determining
whether all traces are remediated are the two most difficult aspects of remediating
discovered threats, according to respondents. This differs slightly from last year, when
the most difficult reported aspect was “Determining impacted data on breached
endpoints,” but the three most difficult remediation processes were the same for both
years. See Figure 12.
Knowing whether the bad actors and their malware traces “are really gone” is a critical
accounting that must be accomplished after a breach. Yet this answer option also
received the highest “impossible” score, making it even more difficult than scoping out
the full impact of the event.
Exploits at the Endpoint (CONTINUED)
SANS ANALYST PROGRAMNext-Gen Endpoint Risks and Protections: A SANS Survey 14
Rate the level of difficulty for the following remediation processes.
Impossible Difficult Easy Unknown
Figure 12. Difficulty of Remediation Processes
70%
60%
50%
40%
30%
20%
10%
0%
Detecting and remediating compromised endpoints in the cloud
Determining scope of a threat across multiple endpoints
Determining when the incident is fully remediated (e.g., is the attacker really gone?)
Hunting for compromised endpoints with known indicators of compromise (IOCs)
Identifying impacted data on breached endpoints
Preventing inadvertent data loss during wipe
Removing all artifacts on endpoints
Workflow or follow-through to ensure full remediation
Other

In addition, the difficulty in identifying what data was compromised is especially
problematic, because that is required for reporting in the event of a breach. While
it’s possible to argue that we can never know for certain that an adversary is gone
(absence of evidence is not evidence of absence, after all), implementation of a
continuous monitoring program can be a huge step in the right direction. According
to the most recent SANS survey of continuous monitoring programs,14 only 11% of
organizations practice continuous monitoring and assessment, while 37% conduct
weekly assessments (as suggested by the CIS Controls). So this is a “quick win” for most
organizations.
Automating Workflow
Another aspect of remediation that was rated as difficult by 52% of respondents is
“Workflow or follow-through to ensure full remediation.” The lack of satisfaction ties to
the extent of automation of the remediation process. In our survey, 59% of responders
say they have at least partially automated their remediation workflow process, but 34%
say they have no automation at all.
As such, 52% of responders say they spend only 1 to 4 staff hours on remediation per
endpoint. Most of the compromises reported in this survey involved a small number of
endpoints, yet some of the compromises were widespread. Therefore, detection and
prevention of lateral movement can be an effective means of maintaining efficiency by
blocking attacks faster as they move from endpoint to endpoint, as well as providing
data needed on all affected endpoints to coordinate remediation.
Exploits at the Endpoint (CONTINUED)
SANS ANALYST PROGRAMNext-Gen Endpoint Risks and Protections: A SANS Survey 15
Introduction of even a small
amount of automation, or
incrementally improving
automated workflow for
those that have implemented
some of these capabilities,
can increase the efficiency
of remediation and allow
resources to be focused
elsewhere.
14 “Reducing Attack Surface: SANS’ Second Survey on Continuous Monitoring Programs,” www.sans.org/reading-room/whitepapers/leadership/reducing-attack-surface-sans-second-survey-continuous-monitoring-programs-37417

Based on this year’s survey results, threats against endpoints are on the rise, while
controls to protect endpoints remain relatively static when compared to last year’s
survey. Yet slight signs of improvement, such as those 27% of respondents’ organizations
that found threats by using proactive threat hunting, show that endpoint protections are
slowly graduating from Level 2 to Level 3 of the endpoint security maturity model shown
in Figure 13.
Most responders are considering some combination of in-house and cloud-based
controls as part of next-gen endpoint security, while demanding multiple features to
protect their endpoints, access, applications and network. They want remediation of
ransomware and faster answers to their queries, and they would like to detect unknown
malware while reducing false positives.
SANS ANALYST PROGRAMNext-Gen Endpoint Risks and Protections: A SANS Survey 16
Looking to the Future
15 “Behind the Curve? A Maturity Model for Endpoint Security,” www.sans.org/reading-room/whitepapers/analyst/curve-maturity-model-endpoint-security-36342, Figure 2, p. 9.
Figure 13. Endpoint Security Maturity Model15
Looking to the Future (CONTINUED)
SANS ANALYST PROGRAMNext-Gen Endpoint Risks and Protections: A SANS Survey 17
Next-Gen Capabilities
When asked about capabilities, responders place highest priority on detection and
analysis of malware-less (memory-based) attacks, with 73% saying these capabilities
are very important. This is not surprising, given that advances in detection capabilities
have forced malware to run in memory only, and detection of memory-based artifacts is
(according to Figure 7) substantially lacking in current tools.
Another priority for responders is the detection and analysis of anomalous activity,
both on the network in general and on endpoints themselves. In this survey, 66% of
respondents called both of these capabilities “very important.” This again speaks to the
importance of implementing a continuous monitoring program. Implementation of such
a program has multiple benefits. The first stage of implementation is determination of a
normal baseline of endpoint and user activity against which anomalies can be identified.
This baseline can be used as a reference for the monitoring program itself and also
during implementation of other solutions. During normal operation of the monitoring
program, endpoint status and user behavior are continuously checked against the
baseline to identify anomalous behavior for follow-up and possible remediation. Indeed,
59% of respondents said full visibility of the security status of all endpoints on the
network is very important.
The desire for capabilities related to automation and workflow ranks as a lower priority
than the capabilities listed above. This prioritization suggests that, until visibility and
detection are adequate, organizations are less interested in automating their workflow
processes. This makes sense. Why automate a process that doesn’t receive complete data
on the threat?
TAKEAWAY
Establish a baseline of normal
endpoint and user activities
and continuously monitor
ongoing endpoint and user
behaviors against that baseline
to identify abnormalities and
the need for follow-up or
remediation.

Looking to the Future (CONTINUED)
SANS ANALYST PROGRAMNext-Gen Endpoint Risks and Protections: A SANS Survey 18
Next-Gen Technologies
With ransomware on the rise and affecting all industries,16 it’s no surprise that the top technology on respondents’ lists of requirements for next-gen endpoint protection is anti-ransomware. Antivirus, anti-exploit, reporting dashboards and IDS/IPS/Firewalls round out the top five technical features they say they expect in next-gen endpoint protection. See Figure 14.
With the addition of application whitelisting and encryption, seven features are in demand by over 90% of respondents. In fact, for all the features and functions listed in Figure 14, over 80% of respondents see them as desirable. (It may be worth noting that no cost was specified for any of the functionalities.) Given the choice between having the functionality in the cloud, in-house or both, most respondents chose either in-house or both, indicating a desire to maintain some control. The only features for which more than 10% chose the cloud were dashboards, analytics and threat intelligence, all of which are either externally provided data or derivative products of internal data.
16 www.darkreading.com/endpoint/ransomware-how-a-security-inconvenience-became-the-industrys-most-feared-vulnerability/a/d-id/1327873
Please indicate which features and functions you would expect to be included in centralized, automated next-generation endpoint detection and remediation?
Select only those that you feel apply, and indicate whether these controls should be cloud-based, in-house or both.
0% 40% 80%20% 60%
Anti-ransomware
Application whitelisting
Configuration assessment
User behavior monitoring
USB protections
Heuristics
Security analytics
Other
Anti-exploit
Application blacklisting
Incident response support
Endpoint asset classification
IDS/IPS/Firewalls or agents
Threat remediation (signatures for known threats)
Threat intelligence
Application detection
Root cause analysis support
Antivirus
Encryption
Data protection and compliance
Vulnerability remediation automation
Dashboards and reporting
Endpoint access controls
Threat remediation (signature-less for unknown threats)
Vulnerability assessment or mapping
Sensitive data classification
Cloud-based Both In-house
Figure 14. Technical Features Expected in Next-Gen Endpoint Protections

Endpoints continue to be vulnerable, primarily because of user-associated technologies
and activities, including browser-based attacks and social engineering. Increased user
awareness and training can help secure users.
Even a well-trained and well-intentioned user can be compromised. Organizations
should consider implementing a program of continuous monitoring, both to determine
a baseline of “normal” activities and to monitor for anomalous behavior that may need
follow-up. The emerging field of user behavior analytics may provide additional tools for
this effort.
Organizations are still being compromised via known vulnerabilities. This can be
addressed by improving the timeliness of patching programs. Most endpoints are
already under a central management solution, which can facilitate the improvement.
As organizations develop sufficient maturity, they should automate remediation
activities as much as possible. The scope of a breach can quickly outpace remediation
efforts. And, once an organization has moved past the tactical, reactive stage, proactive
activities such as threat hunting can provide value in heading off damage from a
compromise.
SANS ANALYST PROGRAMNext-Gen Endpoint Risks and Protections: A SANS Survey 19
Conclusion
G. W. Ray Davidson, PhD, is the former dean of academic affairs for the SANS Technology Institute.
He continues to serve as a mentor, subject matter expert and technical reviewer for the SANS Institute
and holds several GIAC certifications. Ray started his career as a research scientist and subsequently
led global security projects for a major pharmaceutical company. He has taught at the college level
and worked at a security startup. Ray currently works with clients to develop and implement network
security monitoring and threat intelligence capabilities. He is also active in the leadership of the
Michigan Cyber Civilian Corps.
SANS ANALYST PROGRAMNext-Gen Endpoint Risks and Protections: A SANS Survey 20
About the Author
Sponsor
SANS would like to thank this survey’s sponsor: