Embed Size (px)
Citation preview
News
STEPHEN MAIRE Global Head of Investor Relations and Communications 212.553.7424 [email protected]
MICHAEL ADLER Senior Vice President Corporate Communications 212.553.4667 [email protected]
MOODY'S CORPORATION REPORTS RESULTS FOR THIRD QUARTER 2017
3Q17 revenue of $1.1 billion up 16% from 3Q16
3Q17 operating income of $445.4 million up 12% from 3Q16
3Q17 diluted EPS of $1.63 up 24% from 3Q16; adjusted diluted EPS of $1.52 up 10%
■ FY 2017 diluted EPS guidance range is now $6.18 to $6.33; adjusted diluted EPS guidance range is now $5.85 to $6.00; both ranges up approximately $0.50 from prior guidance
Adjusted diluted EPS now also excludes amortization of all acquisition-related intangible assets
NEW YORK, NY – November 3, 2017 – Moody’s Corporation (NYSE: MCO) today
announced results for the third quarter of 2017 and provided its current outlook
for full year 2017. Results and guidance include Bureau van Dijk starting from the
acquisition close date of August 10, 2017.
“Moody’s strong third quarter financial results were driven by record revenue in
Moody’s Investors Service, with corporate and structured finance contributing the
largest gains, double-digit organic revenue growth in Moody’s Analytics, and the
addition of Bureau van Dijk,” said Raymond McDaniel, President and Chief
Executive Officer of Moody’s. “Primarily due to strong underlying business
performance, we are increasing our full year 2017 diluted EPS guidance range to
$6.18 to $6.33 and our adjusted diluted EPS guidance range to $5.85 to $6.00.”
Mr. McDaniel added, “We are excited to welcome our Bureau van Dijk colleagues
to Moody’s, and we remain confident in the complementary nature of the
businesses and the many exciting opportunities ahead.”
THIRD QUARTER 2017 HIGHLIGHTS
Moody’s Corporation reported record revenue of $1.1 billion for the three months
ended September 30, 2017, up 16% from the same period in 2016.
Operating expenses totaled $617.5 million, up 19% from the prior-year period, of
which Bureau van Dijk operating expenses and expenses associated with the
Bureau van Dijk acquisition (“Acquisition-Related Expenses”) constituted eight
percentage points.
Operating income was $445.4 million, up 12%. Adjusted operating income was
$498.5 million, up 14%. Third quarter 2017 adjusted operating income excludes
depreciation and amortization, as well as Acquisition-Related Expenses. Third
quarter 2016 adjusted operating income excludes depreciation and amortization,
as well as a restructuring charge. Operating margin for the third quarter was
41.9% and the adjusted operating margin was 46.9%.
Diluted EPS of $1.63 was up 24% from the third quarter of 2016. Adjusted diluted
EPS of $1.52 was up 10%. Third quarter 2017 adjusted diluted EPS excludes a
$0.23 per share gain on a foreign currency hedge associated with the Bureau van
Dijk acquisition (the “Purchase Price Hedge Gain”), $0.08 per share related to
amortization of all acquisition-related intangible assets and $0.04 per share of
Acquisition-Related Expenses. Third quarter 2016 adjusted diluted EPS excludes
$0.04 per share related to amortization of all acquisition-related intangibles and
$0.03 per share from a restructuring charge. Both third quarter 2017 diluted EPS
and adjusted diluted EPS include a $0.04 per share tax benefit related to the
adoption of accounting standard update ASU 2016-09, “Improvements to
Employee Share-Based Payment Accounting.”
2
MCO THIRD QUARTER 2017 REVENUE UP 16%
Moody’s Corporation reported global revenue of $1.1 billion for the third quarter
of 2017, up 16% from the third quarter of 2016.
U.S. revenue was $588.4 million, up 8%, and non-U.S. revenue was $474.5
million, up 28%. Revenue generated outside the U.S. constituted 45% of total
revenue, up from 40% in the prior-year period. Foreign currency translation
favorably impacted Moody’s revenue by 1%.
MIS Third Quarter Revenue Up 13%
Global revenue for Moody’s Investors Service (MIS) for the third quarter of 2017
was $694.2 million, up 13% from the prior-year period. U.S. revenue was $427.7
million, up 9%, while non-U.S. revenue was $266.5 million, up 21%. Foreign
currency translation favorably impacted MIS revenue by 1%.
Corporate finance revenue was $350.2 million, up 17% from the prior-year period.
This result reflected strong U.S. investment grade and Asian speculative grade
bond issuance as well as a strong contribution from U.S. rated bank loans. U.S. and
non-U.S. corporate finance revenues were each up 17%.
Structured finance revenue totaled $128.3 million, up 23% from the prior-year
period, primarily driven by strong CLO issuance and an increase in U.S. CMBS
rated transactions. U.S. and non-U.S. structured finance revenues were up 25%
and 19%, respectively.
Financial institutions revenue was $102.1 million, up 7% from the prior-year
period. This result was largely driven by an increase in banking issuance from
infrequent issuers in EMEA. U.S. financial institutions revenue was down 2%, while
non-U.S. revenue was up 13%.
Public, project and infrastructure finance revenue was $109.2 million, up 4% from
the prior-year period. This result was primarily driven by increased infrastructure
finance activity in EMEA and Asia, offset by a decrease in U.S. public finance
3
issuance. U.S. public, project and infrastructure finance revenue was down 16%,
while non-U.S. revenue was up 53%.
MA Third Quarter Revenue Up 21%
Global revenue for Moody’s Analytics (MA) for the third quarter of 2017 was
$368.7 million, up 21% from the third quarter of 2016. U.S. revenue was $160.7
million, up 4%, while non-U.S. revenue was $208.0 million, up 38%. Foreign
currency translation favorably impacted MA revenue by 1%. Excluding Bureau van
Dijk, global organic MA revenue for the third quarter of 2017 was $338.5 million,
up 11% from the third quarter of 2016.
Global revenue from research, data and analytics (RD&A) was $218.4 million, up
30% from the prior-year period. The growth in RD&A revenue was driven by the
addition of Bureau van Dijk, as well as strength in the credit research and data
feeds businesses. U.S. and non-U.S. RD&A revenues were up 7% and 65%,
respectively. Excluding Bureau van Dijk, global organic RD&A revenue was $188.2
million, up 12% from the third quarter of 2016. Bureau van Dijk’s revenue
contribution for the third quarter was reduced by $14 million as a result of a
deferred revenue adjustment required as part of acquisition accounting.
Global enterprise risk solutions (ERS) revenue was $112.6 million, up 11% from the
prior-year period. U.S. ERS revenue was down 4%, while non-U.S. revenue was up
21%.
Global revenue from professional services of $37.7 million was up 6% from the
prior-year period. U.S. and non-U.S. professional services revenues were up 5%
and 6%, respectively.
THIRD QUARTER 2017 OPERATING EXPENSES UP 19%
Third quarter 2017 operating expenses for Moody’s Corporation totaled $617.5
million, up 19% from the prior-year period, of which Bureau van Dijk operating
expenses and Acquisition-Related Expenses constituted eight percentage points.
The overall increase was primarily attributable to higher accruals for incentive
4
compensation, Bureau van Dijk operating expenses, including amortization of
acquired intangible assets, and Acquisition-Related Expenses. The impact of
foreign currency translation was negligible.
Operating income was $445.4 million, up 12%. Foreign currency translation
favorably impacted operating income by 2%. Adjusted operating income of
$498.5 million was up 14% from the prior-year period. Operating margin was
41.9%, down from 43.3%. Adjusted operating margin was 46.9%, down from
47.8%.
Moody’s effective tax rate was 31.4% for the third quarter of 2017, up from 30.5%
for the prior-year period. This increase is primarily due to an increase in the rate of
non-U.S. taxes and the tax on the Purchase Price Hedge Gain, partially offset by a
tax benefit from the adoption of the new accounting standard for equity
compensation.
YEAR-TO-DATE 2017 REVENUE UP 14%
For Moody’s Corporation overall, global revenue was $3,038.6 million for the first
nine months of 2017, up 14% from the first nine months of 2016. U.S. revenue
was $1,734.0 million, up 10%, while non-U.S. revenue was $1,304.6 million, up
20% from the prior-year period. The impact of foreign currency translation was
negligible.
Year-to-Date MIS Revenue Up 16%
MIS revenue totaled $2,049.1 million for the first nine months of 2017, up 16%
from the prior-year period. U.S. revenue was $1,262.6 million, up 12%. Non-U.S.
revenue was $786.5 million, up 24%, and represented 38% of MIS revenue, up
from 36% in the first nine months of 2016.
Year-to-Date MA Revenue Up 10%
MA revenue totaled $989.5 million for the first nine months of 2017, up 10% from
the prior-year period. U.S. revenue of $471.4 million was up 6%. Non-U.S. revenue
was $518.1 million, up 14%, and represented 52% of MA revenue, up from 50% in 5
the first nine months of 2016. Excluding Bureau van Dijk, organic MA revenue was
$959.3 million, up 7% from the first nine months of 2016.
YEAR-TO-DATE 2017 OPERATING EXPENSES UP 9%
Operating expenses for Moody’s Corporation in the first nine months of 2017
totaled $1,692.3 million, up 9% from the prior-year period, of which Bureau van
Dijk operating expenses and Acquisition-Related Expenses constituted three
percentage points. The overall increase was primarily driven by higher accruals for
incentive compensation and Bureau van Dijk operating expenses, including
amortization of acquired intangible assets, and Acquisition-Related Expenses.
Foreign currency translation favorably impacted expenses by 1%.
Operating income was $1,346.3 million, up 21% from the first nine months of
2016. Foreign currency translation favorably impacted operating income by 1%.
Adjusted operating income of $1,471.4 million was up 21% from the prior-year
period. Moody’s reported operating margin was 44.3%, up from 41.8%. Adjusted
operating margin was 48.4%, up from 45.7%.
The effective tax rate for the first nine months of 2017 was 29.0%, down from
31.5% in the prior-year period, primarily due to the non-cash, non-taxable gain
from a strategic realignment and expansion involving Moody’s Chinese affiliate
China Cheng Xin International Credit Rating Co. Ltd. (the “CCXI Gain”) and a tax
benefit from the adoption of the new accounting standard for equity
compensation.
Diluted EPS of $5.02 for the first nine months of 2017 was up 41% compared to
the same period in 2016. Adjusted diluted EPS of $4.57 for the first nine months of
2017 increased 24% from the same period in 2016. Year-to-date adjusted diluted
EPS excludes the $0.36 per share Purchase Price Hedge Gain, $0.31 per share CCXI
Gain, $0.14 per share related to amortization of all acquisition-related intangibles,
and $0.08 per share of Acquisition-Related Expenses. Year-to-date 2016 adjusted
diluted EPS excludes $0.09 per share related to amortization of all acquisition-
related intangibles and $0.04 per share from a restructuring charge. Both 2017
6
diluted EPS and adjusted diluted EPS include an $0.18 per share tax benefit related
to the adoption of the new accounting standard for equity compensation.
2017 CAPITAL ALLOCATION AND LIQUIDITY
$101.7 Million Returned to Shareholders in Third Quarter
During the third quarter of 2017, Moody’s repurchased 0.2 million shares at a total
cost of $29.1 million, or an average cost of $130.75 per share, and issued 0.3
million shares as part of its employee stock-based compensation plans. Moody’s
returned $72.6 million to its shareholders via dividend payments during the third
quarter of 2017.
Over the first nine months of 2017, Moody’s repurchased 1.4 million shares at a
total cost of $163.6 million, or an average cost of $116.70 per share, and issued 2.2
million shares as part of its employee stock-based compensation plans. Moody’s
returned $217.8 million to its shareholders via dividend payments during the first
nine months of 2017.
Outstanding shares as of September 30, 2017 totaled 191.1 million and were
approximately flat to September 30, 2016. As of September 30, 2017, Moody’s
had approximately $600 million of share repurchase authority remaining.
At quarter-end, Moody’s had $5.7 billion of outstanding debt and approximately
$700 million of additional borrowing capacity available under its revolving credit
facility. Total cash, cash equivalents and short-term investments at quarter-end
were $1.1 billion, down 52% from December 31, 2016. Cash flow from operations
for the first nine months of 2017 was $342.7 million, a decline from $889.0
million in the first nine months of 2016. Free cash flow for the first nine months of
2017 was $273.3 million, a decline from $804.2 million in the first nine months of
2016. These declines in cash flow were due to payments the Company made in the
first quarter of 2017 pursuant to its 2016 settlement with the Department of
Justice and various states attorneys general.
7
ASSUMPTIONS AND OUTLOOK FOR FULL YEAR 2017
Moody’s outlook for 2017 is based on assumptions about many geopolitical
conditions and macroeconomic and capital market factors, including interest
rates, foreign currency exchange rates, corporate profitability and business
investment spending, mergers and acquisitions, consumer borrowing and
securitization, and the amount of debt issued. These assumptions are subject to
uncertainty, and results for the year could differ materially from our current
outlook. Our guidance assumes foreign currency translation at end-of-quarter
exchange rates. Specifically, our forecast reflects exchange rates for the British
pound (£) of $1.34 to £1 and for the euro (€) of $1.18 to €1.
Moody’s full year 2017 guidance incorporates Bureau van Dijk’s results starting
from the acquisition close date of August 10, 2017. Bureau van Dijk’s revenue
contribution for full year 2017 will be reduced by an estimated $39 million ($14
million in the third quarter and an estimated $25 million in the fourth quarter) as
a result of a deferred revenue adjustment required as part of acquisition
accounting .
Certain components of Moody’s 2017 guidance have been modified to reflect the
company’s current view of business conditions.
Full year 2017 diluted EPS is now expected to be $6.18 to $6.33. Excluding the
impacts from the Purchase Price Hedge Gain, the CCXI Gain, amortization of all
acquisition-related intangibles and Acquisition-Related Expenses, full year 2017
adjusted diluted EPS is now expected to be $5.85 to $6.00 (refer to Table 12 –
2017 Outlook for a reconciliation of diluted EPS to adjusted diluted EPS). Both
ranges include an estimated $0.20 per share tax benefit related to the adoption of
the new accounting standard for equity compensation.
Moody’s now expects revenue to increase in the low-teens percent range.
Operating expenses are now expected to decrease in the 20% to 25% range.
Excluding the 2016 settlement and restructuring charges and Acquisition-Related
Expenses, adjusted operating expenses are now expected to increase in the low-
8
double-digit percent range. Depreciation and amortization expense is now
expected to be approximately $160 million.
Free cash flow is now expected to be approximately $600 million.
For MIS, Moody’s now expects 2017 revenue to increase in the low-teens percent
range. U.S. revenue is now expected to increase in the low-double-digit percent
range and non-U.S. revenue is now expected to increase in the high-teens percent
range.
Corporate finance revenue is now expected to increase in the low-twenties
percent range. Structured Finance revenue is now expected to increase
approximately 10%. Financial institutions revenue is now expected to increase in
the low-double-digit percent range. Public, project and infrastructure finance
revenue is now expected to be approximately flat.
For MA, Moody’s now expects 2017 revenue to increase in the low-teens percent
range. Non-U.S. revenue is now expected to increase in the low-twenties percent
range. Excluding Bureau van Dijk, MA revenue is still expected to increase in the
high-single-digit percent range.
RD&A revenue is now expected to increase in the low-twenties percent range.
Excluding Bureau van Dijk, RD&A revenue is still expected to increase in the low-
double-digit percent range.
A full summary of Moody’s guidance as of November 3, 2017 is included in Table
12 – 2017 Outlook table at the end of this press release.
9
CONFERENCE CALL
Moody’s will hold a conference call to discuss its third quarter 2017 results and its
updated 2017 outlook on November 3, 2017, at 11:30 a.m. ET. Individuals within
the U.S. and Canada can access the call by dialing +1-877-400-0505. Other callers
should dial +1-719-234-7477. Please dial into the call by 11:20 a.m. ET. The
passcode for the call is 5032731.
The teleconference will also be webcast with an accompanying slide presentation
which can be accessed through Moody's Investor Relations website,
ir.moodys.com, under “Featured Events and Presentations”. The webcast will be
available until 3:30 p.m. Eastern Time on December 2, 2017.
A replay of the teleconference will be available from 3:30 p.m. Eastern Time,
November 3, 2017 until 3:30 p.m. Eastern Time, December 2, 2017. The replay can
be accessed from within the United States and Canada by dialing +1-888-203-
1112. Other callers can access the replay at +1-719-457-0820. The replay
confirmation code is 5032731.
*****
ABOUT MOODY'S CORPORATION
Moody's is an essential component of the global capital markets, providing credit
ratings, research, tools and analysis that contribute to transparent and integrated
financial markets. Moody’s Corporation (NYSE: MCO) is the parent company of
Moody's Investors Service, which provides credit ratings and research covering
debt instruments and securities, and Moody's Analytics, which offers leading-edge
software, advisory services and research for credit and economic analysis and
financial risk management. The corporation, which reported revenue of $3.6
billion in 2016, employs approximately 11,700 people worldwide and maintains a
presence in 41 countries. Further information is available at www.moodys.com.
10
“Safe Harbor” Statement under the Private Securities Litigation Reform Act
of 1995
Certain statements contained in this release are forward-looking statements and are based on future expectations, plans and prospects for Moody’s business and operations that involve a number of risks and uncertainties. The forward-looking statements in this release are made as of the date hereof, and Moody’s disclaims any duty to supplement, update or revise such statements on a going-forward basis, whether as a result of subsequent developments, changed expectations or otherwise. In connection with the “safe harbor” provisions of the Private Securities Litigation Reform Act of 1995, Moody’s is identifying certain factors that could cause actual results to differ, perhaps materially, from those indicated by these forward-looking statements. Those factors, risks and uncertainties include, but are not limited to, world-wide credit market disruptions or an economic slowdown, which could affect the volume of debt and other securities issued in domestic and/or global capital markets; other matters that could affect the volume of debt and other securities issued in domestic and/or global capital markets, including regulation, credit quality concerns, changes in interest rates and other volatility in the financial markets such as that due to the U.K.’s referendum vote whereby the U.K. citizens voted to withdraw from the EU; the level of merger and acquisition activity in the U.S. and abroad; the uncertain effectiveness and possible collateral consequences of U.S. and foreign government actions affecting world-wide credit markets, international trade and economic policy; concerns in the marketplace affecting our credibility or otherwise affecting market perceptions of the integrity or utility of independent credit agency ratings; the introduction of competing products or technologies by other companies; pricing pressure from competitors and/or customers; the level of success of new product development and global expansion; the impact of regulation as an NRSRO, the potential for new U.S., state and local legislation and regulations, including provisions in the Financial Reform Act and regulations resulting from that Act; the potential for increased competition and regulation in the EU and other foreign jurisdictions; exposure to litigation related to our rating opinions, as well as any other litigation, government and regulatory proceedings, investigations and inquires to which the Company may be subject from time to time; provisions in the Financial Reform Act legislation modifying the pleading standards, and EU regulations modifying the liability standards, applicable to credit rating agencies in a manner adverse to credit rating agencies; provisions of EU regulations imposing additional procedural and substantive requirements on the pricing of services; the possible loss of key employees; failures or malfunctions of our operations and infrastructure; any vulnerabilities to cyber threats or other cybersecurity concerns; the outcome of any review by controlling tax authorities of the Company’s global tax planning initiatives; exposure to potential criminal sanctions or civil remedies if the Company fails to comply with foreign and U.S. laws and regulations that are applicable in the jurisdictions in which the Company operates, including sanctions laws, anti-corruption laws, and local laws prohibiting corrupt payments to government officials; the impact of mergers, acquisitions or other business combinations and the ability of the Company to successfully integrate acquired businesses; currency and foreign exchange volatility; the level of future cash flows; the levels of capital investments; and a decline in the demand for credit risk management tools by financial institutions. Other factors, risks and uncertainties relating to our acquisition of Bureau van Dijk could cause our actual results to differ, perhaps materially, from those indicated by these forward-looking statements, including risks relating to the integration of Bureau van Dijk’s operations, products and employees into Moody’s and the possibility that anticipated synergies and other benefits of the acquisition will not be realized in the amounts anticipated or will not be realized within the expected timeframe; risks that the acquisition could have an adverse effect on the business of Bureau van Dijk or its prospects, including, without limitation, on relationships with vendors, suppliers or customers; claims made, from time to time, by vendors, suppliers or customers; changes in the European or global marketplaces that have an adverse effect on the business of Bureau van Dijk; and other factors, risks and uncertainties relating to the transaction as set forth under the caption “‘Safe Harbor’ Statement under the Private Securities Litigation Reform Act of 1995 ” in Moody’s report on Form 8-K filed on May 15, 2017, which are incorporated by reference herein. These factors, risks and uncertainties as well as other risks and uncertainties that could cause Moody’s actual results to differ materially from those contemplated, expressed, projected, anticipated or implied in the forward-looking statements are described in greater detail under “Risk Factors” in Part I, Item 1A of the Company’s annual report on Form 10-K for the year ended December 31, 2016, and in other filings made by the Company from time to time with the SEC or in materials incorporated herein or therein. Stockholders and investors are cautioned that the occurrence of any of these factors, risks and uncertainties may cause the Company’s actual results to differ materially from those contemplated, expressed, projected, anticipated or implied in the forward-looking statements, which could have a material and adverse effect on the Company’s business, results of operations and financial condition. New factors may emerge from time to time, and it is not possible for the Company to predict new factors, nor can the Company assess the potential effect of any new factors on it.
11
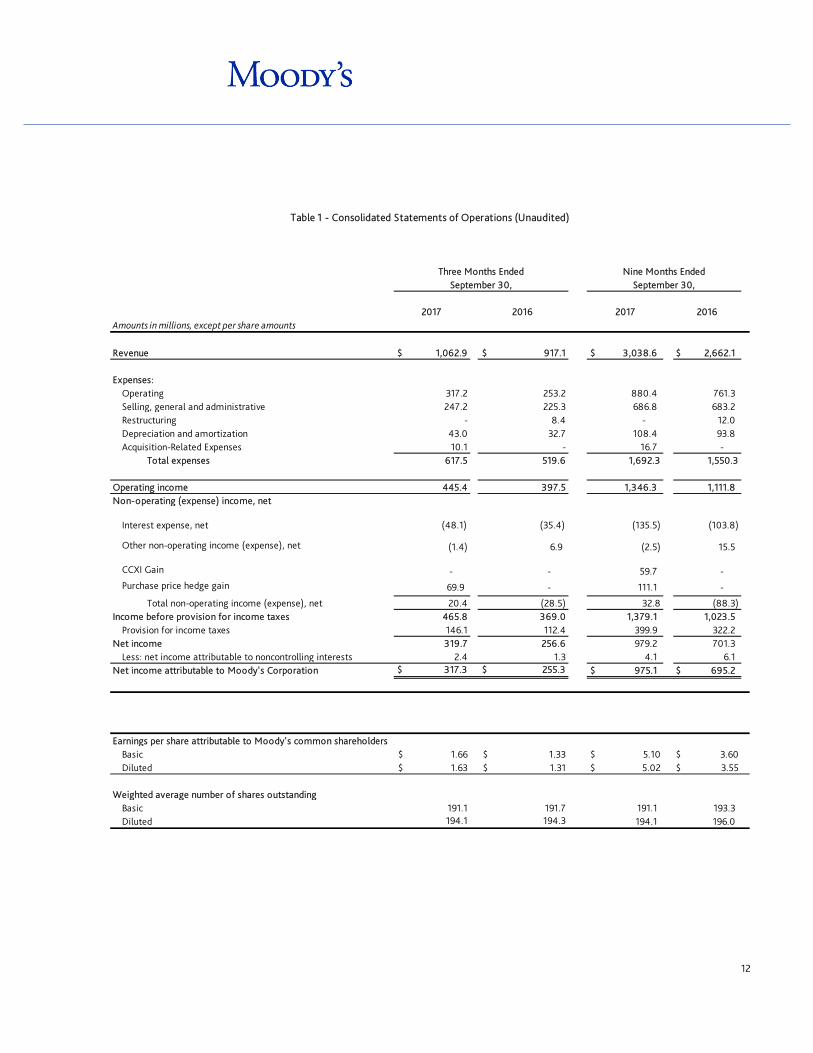
$ 1,062.9 $ 917.1 $ 3,038.6 $ 2,662.1
317.2 253.2 880.4 761.3 247.2 225.3 686.8 683.2
- 8.4 - 12.0 43.0 32.7 108.4 93.8 10.1 - 16.7 -
Total expenses 617.5 519.6 1,692.3 1,550.3
445.4 397.5 1,346.3 1,111.8
(48.1) (35.4) (135.5) (103.8)
(1.4) 6.9 (2.5) 15.5
- - 59.7 -
69.9 - 111.1 -
Total non-operating income (expense), net 20.4 (28.5) 32.8 (88.3) 465.8 369.0 1,379.1 1,023.5 146.1 112.4 399.9 322.2 319.7 256.6 979.2 701.3 2.4 1.3 4.1 6.1
$ 317.3 $ 255.3 $ 975.1 $ 695.2
$ 1.66 $ 1.33 $ 5.10 $ 3.60 $ 1.63 $ 1.31 $ 5.02 $ 3.55
191.1 191.7 191.1 193.3 194.1 194.3 194.1 196.0
Table 1 - Consolidated Statements of Operations (Unaudited)
Three Months Ended Nine Months EndedSeptember 30, September 30,
2017 2016 2017 2016Amounts in millions, except per share amounts
Revenue
Expenses:OperatingSelling, general and administrativeRestructuringDepreciation and amortizationAcquisition-Related Expenses
Operating incomeNon-operating (expense) income, net
Interest expense, net
Other non-operating income (expense), net
CCXI Gain
Purchase price hedge gain
Income before provision for income taxesProvision for income taxes
Net incomeLess: net income attributable to noncontrolling interests
Net income attributable to Moody's Corporation
Earnings per share attributable to Moody's common shareholdersBasicDiluted
Weighted average number of shares outstandingBasicDiluted
12

Corporate Finance $ 350.2 $ 299.6 $ 1,058.8 $ 844.7 Structured Finance 128.3 104.2 347.7 306.3
Financial Institutions 102.1 95.8 316.8 280.4
Public, Project and Infrastructure Finance 109.2 105.2 312.0 309.0
MIS Other 4.4 7.5 13.8 22.6
Intersegment royalty 29.0 25.3 82.0 73.9
Sub-total MIS 723.2 637.6 2,131.1 1,836.9 Eliminations (29.0) (25.3) (82.0) (73.9) Total MIS revenue 694.2 612.3 2,049.1 1,763.0
Research, Data and Analytics 218.4 167.7 574.7 500.9 Enterprise Risk Solutions 112.6 101.5 305.8 288.5 Professional Services 37.7 35.6 109.0 109.7 Intersegment revenue 4.1 4.2 11.6 9.8 Sub-total MA 372.8 309.0 1,001.1 908.9 Eliminations (4.1) (4.2) (11.6) (9.8) Total MA revenue 368.7 304.8 989.5 899.1
$ 1,062.9 $ 917.1 $ 3,038.6 $ 2,662.1
United States $ 588.4 $ 545.7 $ 1,734.0 $ 1,571.6 International 474.5 371.4 1,304.6 1,090.5
$ 1,062.9 $ 917.1 $ 3,038.6 $ 2,662.1
2017 2016
Table 2 - Supplemental Revenue Information (Unaudited)
Three Months Ended Nine Months EndedSeptember 30, September 30,
Moody's Investors Service
Moody's Analytics
Total Moody's Corporation revenue
Moody's Corporation revenue by geographic area
Amounts in millions 2017 2016
13
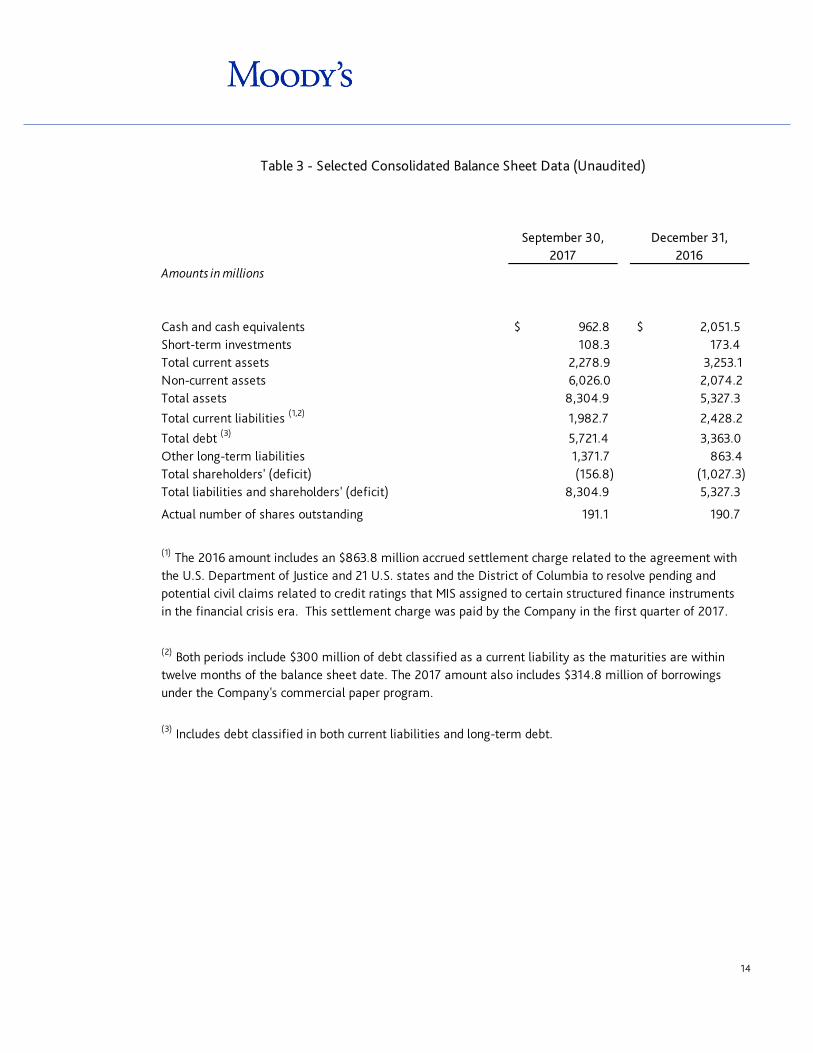
Amounts in millions
Cash and cash equivalents $ 962.8 $ 2,051.5 Short-term investments 108.3 173.4 Total current assets 2,278.9 3,253.1 Non-current assets 6,026.0 2,074.2 Total assets 8,304.9 5,327.3
Total current liabilities (1,2) 1,982.7 2,428.2
Total debt (3) 5,721.4 3,363.0 Other long-term liabilities 1,371.7 863.4 Total shareholders' (deficit) (156.8) (1,027.3)
8,304.9 5,327.3
Actual number of shares outstanding 191.1 190.7
Total liabilities and shareholders' (deficit)
(1) The 2016 amount includes an $863.8 million accrued settlement charge related to the agreement with the U.S. Department of Justice and 21 U.S. states and the District of Columbia to resolve pending and potential civil claims related to credit ratings that MIS assigned to certain structured finance instruments in the financial crisis era. This settlement charge was paid by the Company in the first quarter of 2017.
(2) Both periods include $300 million of debt classified as a current liability as the maturities are within twelve months of the balance sheet date. The 2017 amount also includes $314.8 million of borrowings under the Company's commercial paper program.
(3) Includes debt classified in both current liabilities and long-term debt.
Table 3 - Selected Consolidated Balance Sheet Data (Unaudited)
September 30, December 31, 2017 2016
14
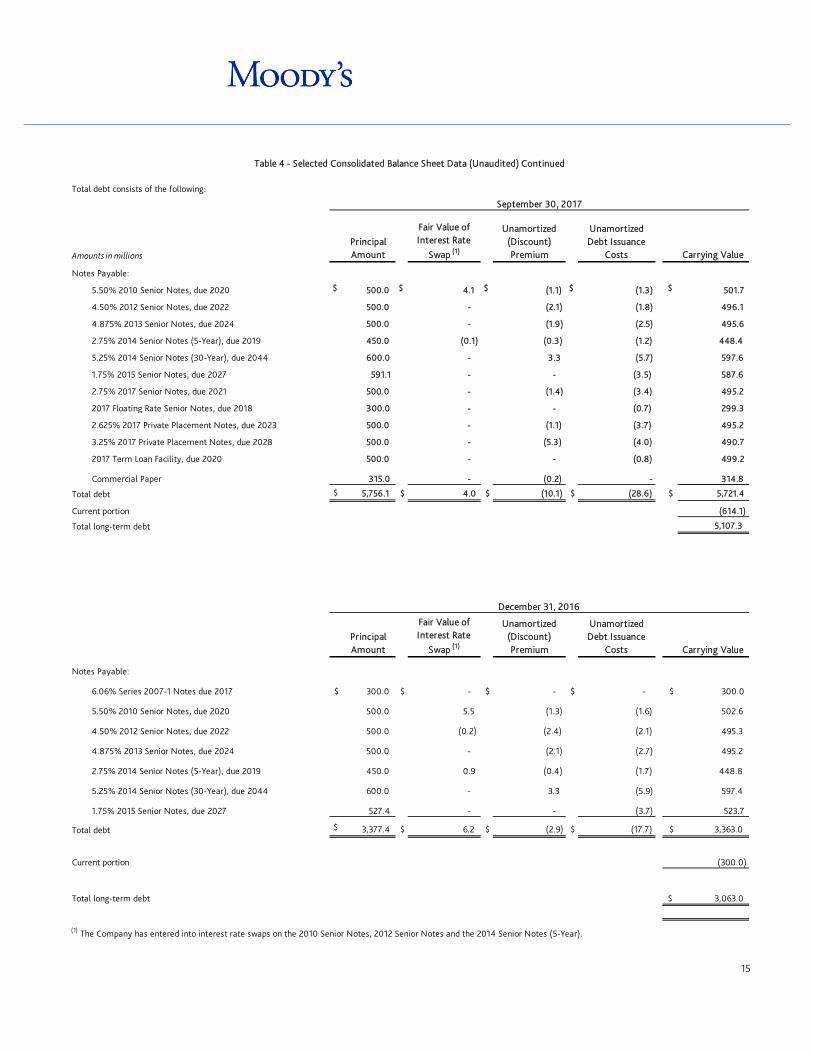
Total debt consists of the following:
Amounts in millions
Principal Amount
Fair Value of Interest Rate
Swap (1)
Unamortized (Discount) Premium
Unamortized Debt Issuance
Costs Carrying Value
$ 500.0 $ 4.1 $ (1.1) $ (1.3) $ 501.7
500.0 - (2.1) (1.8) 496.1
500.0 - (1.9) (2.5) 495.6
450.0 (0.1) (0.3) (1.2) 448.4
600.0 - 3.3 (5.7) 597.6
591.1 - - (3.5) 587.6
500.0 - (1.4) (3.4) 495.2
300.0 - - (0.7) 299.3
500.0 - (1.1) (3.7) 495.2
500.0 - (5.3) (4.0) 490.7
500.0 - - (0.8) 499.2
315.0 - (0.2) - 314.8
$ 5,756.1 $ 4.0 $ (10.1) $ (28.6) $ 5,721.4
(614.1)
5,107.3
Principal Amount
Fair Value of Interest Rate
Swap (1)
Unamortized (Discount) Premium
Unamortized Debt Issuance
Costs Carrying Value
$ 300.0 $ - $ - $ - $ 300.0
500.0 5.5 (1.3) (1.6) 502.6
500.0 (0.2) (2.4) (2.1) 495.3
500.0 - (2.1) (2.7) 495.2
450.0 0.9 (0.4) (1.7) 448.8
600.0 - 3.3 (5.9) 597.4
527.4 - - (3.7) 523.7
$ 3,377.4 $ 6.2 $ (2.9) $ (17.7) $ 3,363.0
(300.0)
$ 3,063.0
5.25% 2014 Senior Notes (30-Year), due 2044
1.75% 2015 Senior Notes, due 2027
2.75% 2017 Senior Notes, due 2021
2017 Floating Rate Senior Notes, due 2018
September 30, 2017
Notes Payable:
5.50% 2010 Senior Notes, due 2020
4.50% 2012 Senior Notes, due 2022
4.875% 2013 Senior Notes, due 2024
(1) The Company has entered into interest rate swaps on the 2010 Senior Notes, 2012 Senior Notes and the 2014 Senior Notes (5-Year).
5.50% 2010 Senior Notes, due 2020
4.50% 2012 Senior Notes, due 2022
4.875% 2013 Senior Notes, due 2024
2.75% 2014 Senior Notes (5-Year), due 2019
5.25% 2014 Senior Notes (30-Year), due 2044
Table 4 - Selected Consolidated Balance Sheet Data (Unaudited) Continued
1.75% 2015 Senior Notes, due 2027
Total debt
Current portion
Total long-term debt
Current portion
Total long-term debt
December 31, 2016
Notes Payable:
6.06% Series 2007-1 Notes due 2017
2.625% 2017 Private Placement Notes, due 2023
3.25% 2017 Private Placement Notes, due 2028
2017 Term Loan Facility, due 2020
Commercial Paper
Total debt
2.75% 2014 Senior Notes (5-Year), due 2019
15
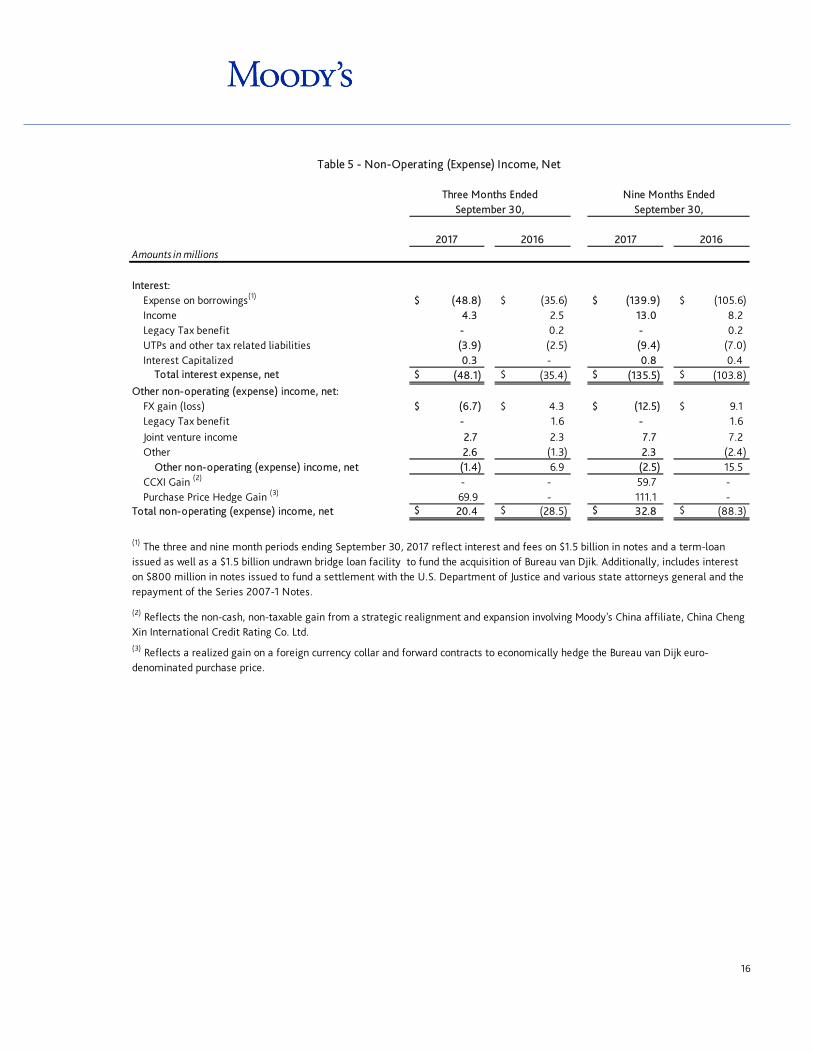
$ (48.8) $ (35.6) $ (139.9) $ (105.6) 4.3 2.5 13.0 8.2 - 0.2 - 0.2 (3.9) (2.5) (9.4) (7.0) 0.3 - 0.8 0.4
Total interest expense, net $ (48.1) $ (35.4) $ (135.5) $ (103.8)
$ (6.7) $ 4.3 $ (12.5) $ 9.1 - 1.6 - 1.6 2.7 2.3 7.7 7.2 2.6 (1.3) 2.3 (2.4)
Other non-operating (expense) income, net (1.4) 6.9 (2.5) 15.5 - - 59.7 -
69.9 - 111.1 - $ 20.4 $ (28.5) $ 32.8 $ (88.3)
Table 5 - Non-Operating (Expense) Income, Net
Three Months Ended Nine Months EndedSeptember 30, September 30,
2017 2016 2017 2016Amounts in millions
Interest:Expense on borrowings(1)
IncomeLegacy Tax benefit UTPs and other tax related liabilities Interest Capitalized
Other non-operating (expense) income, net:FX gain (loss)Legacy Tax benefit
(1) The three and nine month periods ending September 30, 2017 reflect interest and fees on $1.5 billion in notes and a term-loan issued as well as a $1.5 billion undrawn bridge loan facility to fund the acquisition of Bureau van Djik. Additionally, includes interest on $800 million in notes issued to fund a settlement with the U.S. Department of Justice and various state attorneys general and the repayment of the Series 2007-1 Notes.
(2) Reflects the non-cash, non-taxable gain from a strategic realignment and expansion involving Moody's China affiliate, China Cheng Xin International Credit Rating Co. Ltd. (3) Reflects a realized gain on a foreign currency collar and forward contracts to economically hedge the Bureau van Dijk euro-denominated purchase price.
Joint venture income Other
CCXI Gain (2)
Purchase Price Hedge Gain (3)
Total non-operating (expense) income, net
16
Amounts in millions
$ 723.2 $ 372.8
$ (33.1)
$ 1,062.9
$ 637.6
$ 309.0
$ (29.5)
$ 917.1
319.2 278.3 (33.1) 564.4 272.8 235.2 (29.5) 478.5
404.0 94.5 - 498.5 364.8 73.8 - 438.6
Restructuring - - - - 7.6 0.8 - 8.4
- 10.1 - 10.1 - - - -
18.6 24.4 - 43.0 19.1 13.6 - 32.7
$ 385.4 $ 60.0
$ -
$ 445.4
$ 338.1
$ 59.4
$ -
$ 397.5
55.9% 25.3% 46.9% 57.2% 23.9% 47.8%53.3% 16.1% 41.9% 53.0% 19.2% 43.3%
$ 2,131.1 $ 1,001.1 $ (93.6) $ 3,038.6 $ 1,836.9 $ 908.9 $ (83.7) $ 2,662.1
898.9 761.9 (93.6) 1,567.2 830.1 698.1 (83.7) 1,444.5
1,232.2 239.2 - 1,471.4 1,006.8 210.8 - 1,217.6
Restructuring - - - - 10.2 1.8 - 12.0 - 16.7 - 16.7 - - - -
56.4 52.0 - 108.4 54.8 39.0 - 93.8 $ 1,175.8 $ 170.5 $ - $ 1,346.3 $ 941.8 $ 170.0 $ - $ 1,111.8
57.8% 23.9% 48.4% 54.8% 23.2% 45.7%55.2% 17.0% 44.3% 51.3% 18.7% 41.8%
Three Months Ended September 30,2017 2016
MIS MA Eliminations Consolidated MIS MA Eliminations Consolidated
RevenueOperating, selling, general and administrative expense
Adjusted operating income
Consolidated
Acquisition-Related Expenses
Depreciation and amortization
Operating income
Adjusted operating margin
Adjusted operating marginOperating margin
Revenue
Operating, selling, general and administrative expense
Adjusted operating income
Acquisition-Related Expenses
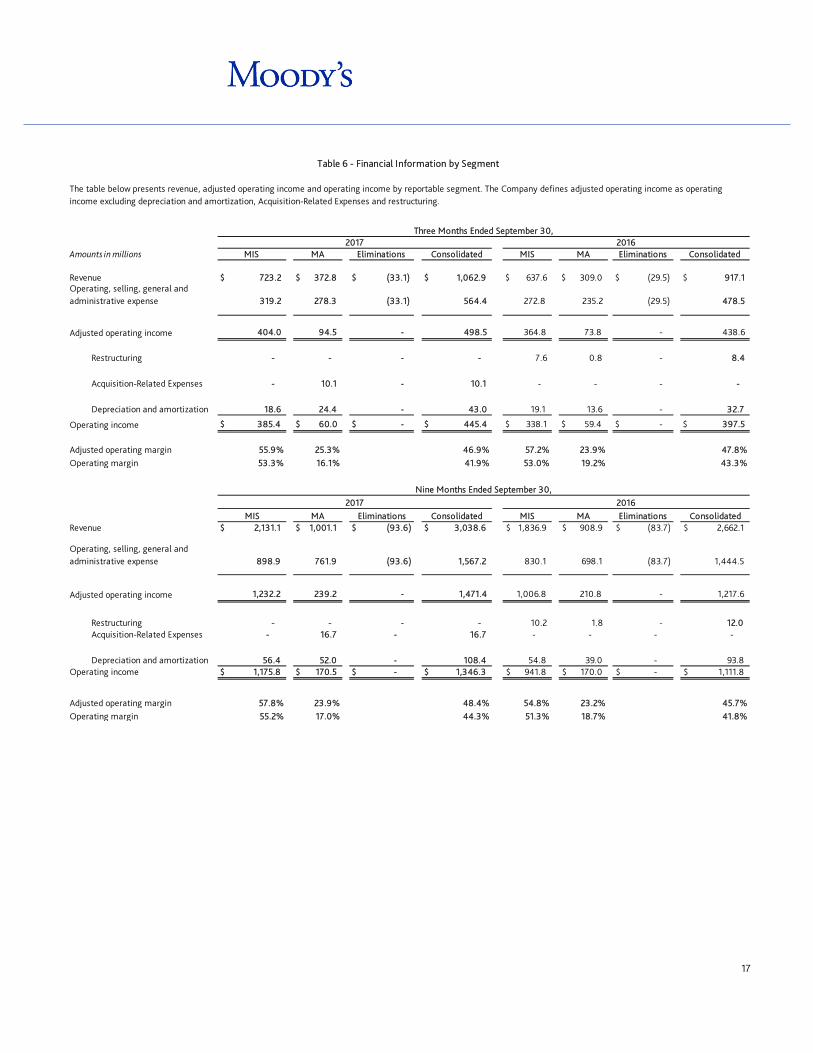
Table 6 - Financial Information by Segment
The table below presents revenue, adjusted operating income and operating income by reportable segment. The Company defines adjusted operating income as operating income excluding depreciation and amortization, Acquisition-Related Expenses and restructuring.
Depreciation and amortizationOperating income
Operating margin
Nine Months Ended September 30,2017 2016
MIS MA Eliminations Consolidated MIS MA Eliminations
17
Amounts in millions
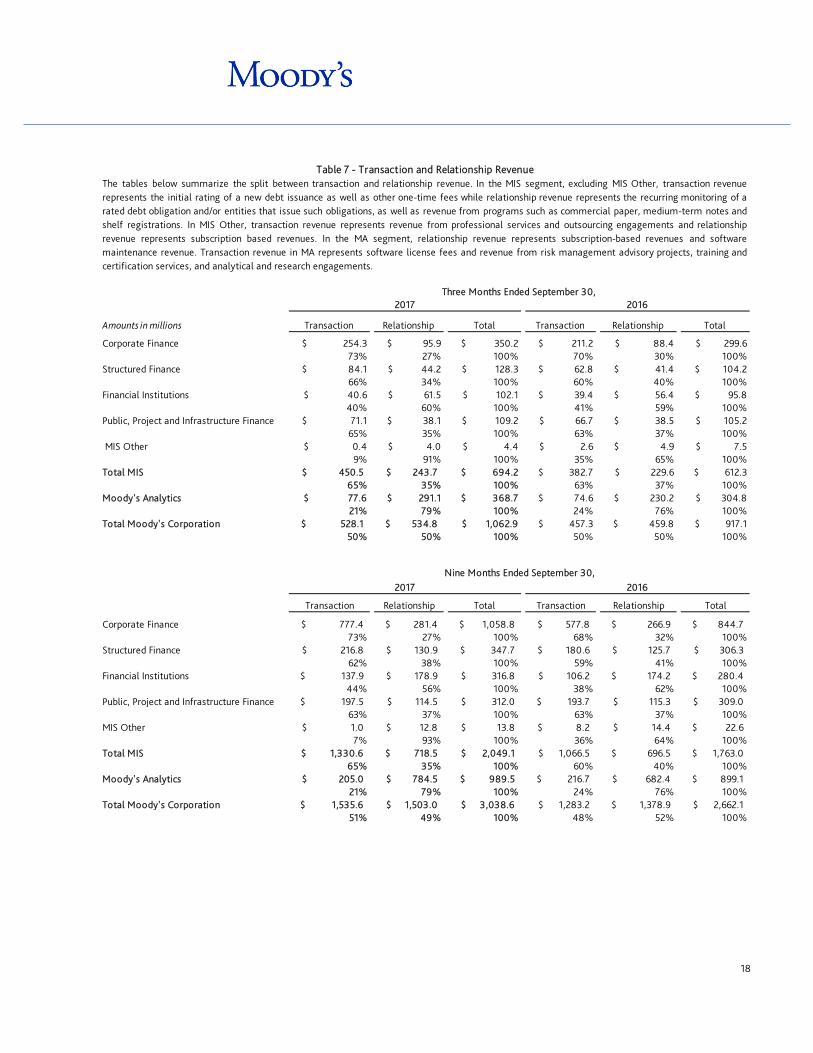
Corporate Finance $ 254.3 $ 95.9 $ 350.2 $ 211.2 $ 88.4 $ 299.6 73% 27% 100% 70% 30% 100%
Structured Finance $ 84.1 $ 44.2 $ 128.3 $ 62.8 $ 41.4 $ 104.2 66% 34% 100% 60% 40% 100%
Financial Institutions $ 40.6 $ 61.5 $ 102.1 $ 39.4 $ 56.4 $ 95.8 40% 60% 100% 41% 59% 100%
Public, Project and Infrastructure Finance $ 71.1 $ 38.1 $ 109.2 $ 66.7 $ 38.5 $ 105.2 65% 35% 100% 63% 37% 100%
MIS Other $ 0.4 $ 4.0 $ 4.4 $ 2.6 $ 4.9 $ 7.5 9% 91% 100% 35% 65% 100%
Total MIS 450.5$ 243.7$ $ 694.2 $ 382.7 $ 229.6 $ 612.3 65% 35% 100% 63% 37% 100%
Moody's Analytics $ 77.6 $ 291.1 $ 368.7 $ 74.6 $ 230.2 $ 304.8 21% 79% 100% 24% 76% 100%
Total Moody's Corporation 528.1$ 534.8$ $ 1,062.9 $ 457.3 $ 459.8 $ 917.1 50% 50% 100% 50% 50% 100%
Corporate Finance 777.4$ 281.4$ 1,058.8$ 577.8$ 266.9$ 844.7$ 73% 27% 100% 68% 32% 100%
Structured Finance 216.8$ 130.9$ 347.7$ 180.6$ 125.7$ 306.3$ 62% 38% 100% 59% 41% 100%
Financial Institutions 137.9$ 178.9$ 316.8$ 106.2$ 174.2$ 280.4$ 44% 56% 100% 38% 62% 100%
Public, Project and Infrastructure Finance 197.5$ 114.5$ 312.0$ 193.7$ 115.3$ 309.0$ 63% 37% 100% 63% 37% 100%
MIS Other 1.0$ 12.8$ 13.8$ 8.2$ 14.4$ 22.6$ 7% 93% 100% 36% 64% 100%
Total MIS 1,330.6$ 718.5$ 2,049.1$ 1,066.5$ 696.5$ 1,763.0$ 65% 35% 100% 60% 40% 100%
Moody's Analytics 205.0$ 784.5$ 989.5$ 216.7$ 682.4$ 899.1$ 21% 79% 100% 24% 76% 100%
Total Moody's Corporation 1,535.6$ 1,503.0$ 3,038.6$ 1,283.2$ 1,378.9$ 2,662.1$ 51% 49% 100% 48% 52% 100%
Three Months Ended September 30,2017 2016
Transaction Relationship Total Transaction Relationship Total
Table 7 - Transaction and Relationship RevenueThe tables below summarize the split between transaction and relationship revenue. In the MIS segment, excluding MIS Other, transaction revenuerepresents the initial rating of a new debt issuance as well as other one-time fees while relationship revenue represents the recurring monitoring of arated debt obligation and/or entities that issue such obligations, as well as revenue from programs such as commercial paper, medium-term notes andshelf registrations. In MIS Other, transaction revenue represents revenue from professional services and outsourcing engagements and relationshiprevenue represents subscription based revenues. In the MA segment, relationship revenue represents subscription-based revenues and softwaremaintenance revenue. Transaction revenue in MA represents software license fees and revenue from risk management advisory projects, training andcertification services, and analytical and research engagements.
Nine Months Ended September 30,2017 2016
Transaction Relationship Total Transaction Relationship Total
18
Adjusted Financial MeasuresThe tables below reflect certain adjusted results that the SEC defines as "non-GAAP financial measures" as well as a reconciliation of each adjusted measure to its most directly comparable GAAP measure. Management believes that such adjusted financial measures, when read in conjunction with the Company's reported results, can provide useful supplemental information for investors analyzing period-to-period comparisons of the Company's performance, facilitate comparisons to competitors' operating results and to provide greater transparency to investors of supplemental information used by management in its financial and operational decision-making. These adjusted measures, as defined by the Company, are not necessarily comparable to similarly defined measures of other companies. Furthermore, these adjusted measures should not be viewed in isolation or used as a substitute for other GAAP measures in assessing the operating performance or cash flows of the Company.
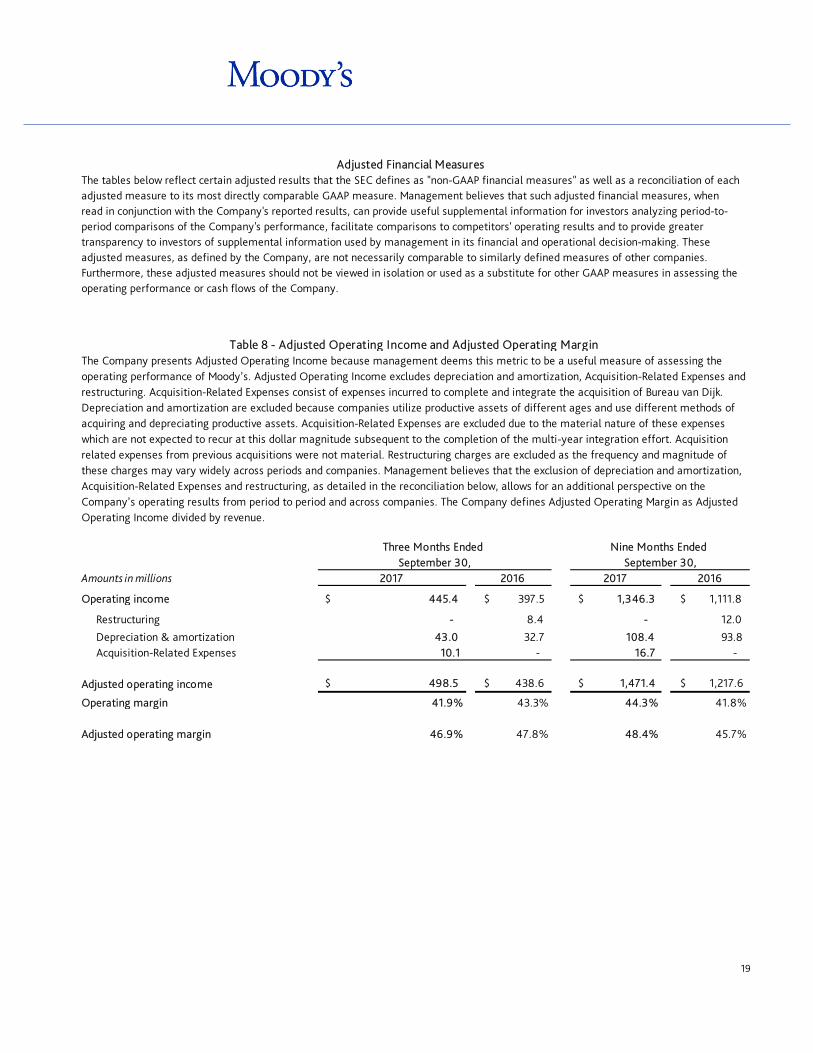
$ 445.4 $ 397.5 $ 1,346.3 $ 1,111.8
Restructuring - 8.4 - 12.0
Depreciation & amortization 43.0 32.7 108.4 93.8 Acquisition-Related Expenses 10.1 - 16.7 -
$ 498.5 $ 438.6 $ 1,471.4 $ 1,217.6
41.9% 43.3% 44.3% 41.8%
46.9% 47.8% 48.4% 45.7%
Table 8 - Adjusted Operating Income and Adjusted Operating MarginThe Company presents Adjusted Operating Income because management deems this metric to be a useful measure of assessing the operating performance of Moody’s. Adjusted Operating Income excludes depreciation and amortization, Acquisition-Related Expenses and restructuring. Acquisition-Related Expenses consist of expenses incurred to complete and integrate the acquisition of Bureau van Dijk. Depreciation and amortization are excluded because companies utilize productive assets of different ages and use different methods of acquiring and depreciating productive assets. Acquisition-Related Expenses are excluded due to the material nature of these expenses which are not expected to recur at this dollar magnitude subsequent to the completion of the multi-year integration effort. Acquisition related expenses from previous acquisitions were not material. Restructuring charges are excluded as the frequency and magnitude of these charges may vary widely across periods and companies. Management believes that the exclusion of depreciation and amortization, Acquisition-Related Expenses and restructuring, as detailed in the reconciliation below, allows for an additional perspective on the Company’s operating results from period to period and across companies. The Company defines Adjusted Operating Margin as Adjusted Operating Income divided by revenue.
Three Months Ended September 30,
Nine Months Ended September 30,
Amounts in millions 2017 2016 2017 2016
Operating income
Adjusted operating income
Operating margin
Adjusted operating margin
19
2017 2016
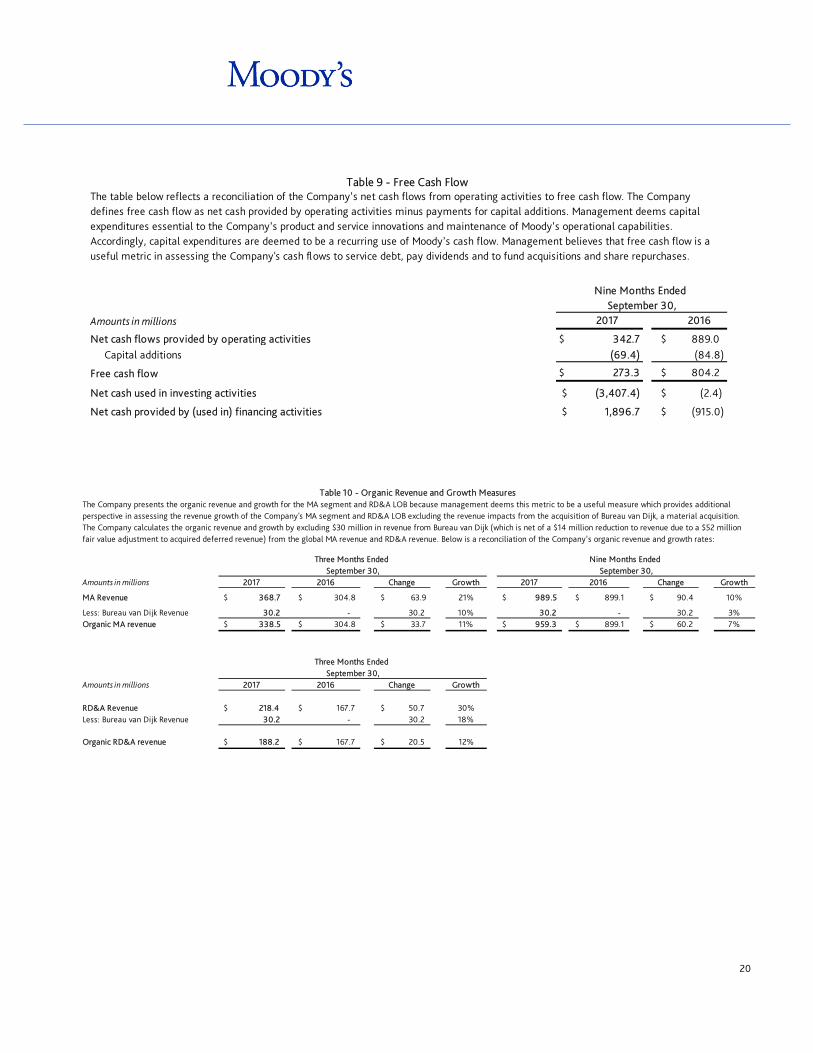
$ 342.7 $ 889.0 Capital additions (69.4) (84.8)
$ 273.3 $ 804.2
$ (3,407.4) $ (2.4)
$ 1,896.7 $ (915.0)
Free cash flow
Net cash used in investing activities
Net cash provided by (used in) financing activities
Table 9 - Free Cash FlowThe table below reflects a reconciliation of the Company’s net cash flows from operating activities to free cash flow. The Company defines free cash flow as net cash provided by operating activities minus payments for capital additions. Management deems capital expenditures essential to the Company’s product and service innovations and maintenance of Moody’s operational capabilities. Accordingly, capital expenditures are deemed to be a recurring use of Moody’s cash flow. Management believes that free cash flow is a useful metric in assessing the Company's cash flows to service debt, pay dividends and to fund acquisitions and share repurchases.
Nine Months Ended September 30,
Amounts in millions
Net cash flows provided by operating activities
Amounts in millions Growth Growth
MA Revenue $ 368.7 $ 304.8 $ 63.9 21% $ 989.5 $ 899.1 $ 90.4 10%
Less: Bureau van Dijk Revenue 30.2 - 30.2 10% 30.2 - 30.2 3% Organic MA revenue $ 338.5 $ 304.8 $ 33.7 11% $ 959.3 $ 899.1 $ 60.2 7%
Amounts in millions Growth
RD&A Revenue $ 218.4 $ 167.7 $ 50.7 30%Less: Bureau van Dijk Revenue 30.2 - 30.2 18%
Organic RD&A revenue $ 188.2 $ 167.7 $ 20.5 12%
Three Months Ended September 30,
2017 2016 Change
Table 10 - Organic Revenue and Growth MeasuresThe Company presents the organic revenue and growth for the MA segment and RD&A LOB because management deems this metric to be a useful measure which provides additional perspective in assessing the revenue growth of the Company's MA segment and RD&A LOB excluding the revenue impacts from the acquisition of Bureau van Dijk, a material acquisition. The Company calculates the organic revenue and growth by excluding $30 million in revenue from Bureau van Dijk (which is net of a $14 million reduction to revenue due to a $52 million fair value adjustment to acquired deferred revenue) from the global MA revenue and RD&A revenue. Below is a reconciliation of the Company’s organic revenue and growth rates:
Three Months Ended September 30,
Nine Months Ended September 30,
2017 2016 Change 2017 2016 Change
20
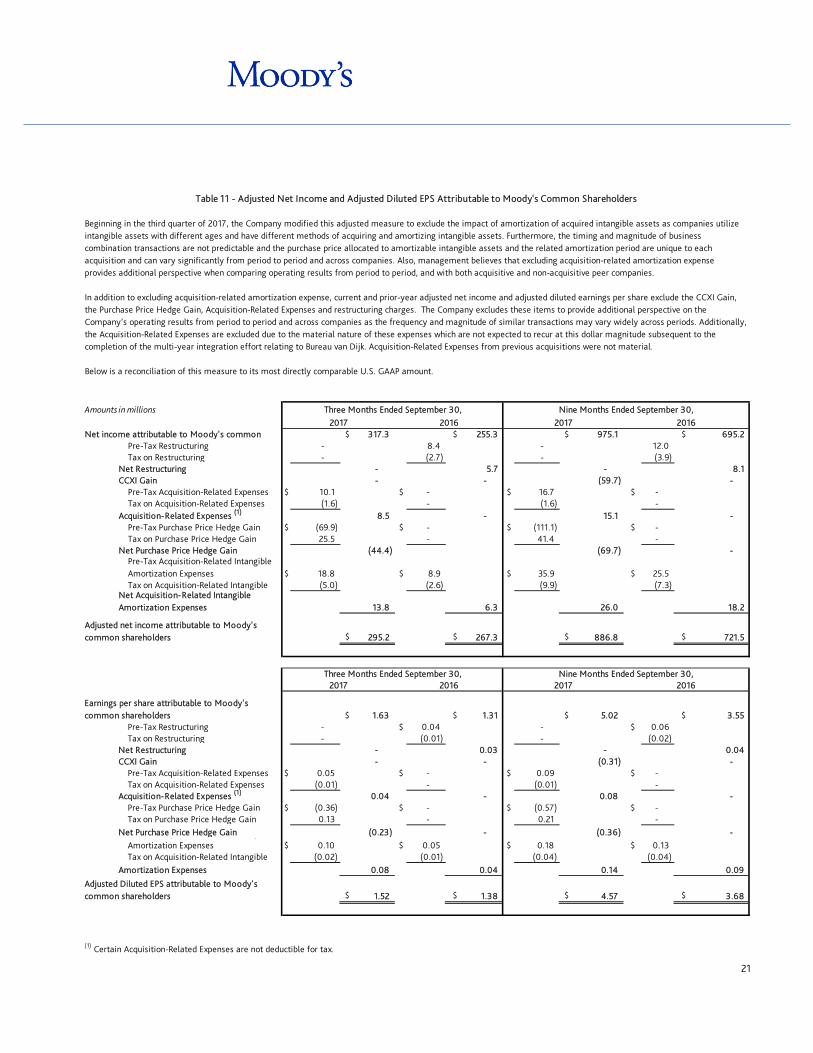
Below is a reconciliation of this measure to its most directly comparable U.S. GAAP amount.
Amounts in millions
$ 317.3 $ 255.3 $ 975.1 $ 695.2 Pre-Tax Restructuring - 8.4 - 12.0 Tax on Restructuring - (2.7) - (3.9)
Net Restructuring - 5.7 - 8.1 CCXI Gain - - (59.7) -
Pre-Tax Acquisition-Related Expenses $ 10.1 $ - $ 16.7 $ - Tax on Acquisition-Related Expenses (1.6) - (1.6) -
Acquisition-Related Expenses (1) 8.5 - 15.1 - Pre-Tax Purchase Price Hedge Gain $ (69.9) $ - $ (111.1) $ - Tax on Purchase Price Hedge Gain 25.5 - 41.4 -
Net Purchase Price Hedge Gain (44.4) (69.7) - Pre-Tax Acquisition-Related Intangible Amortization Expenses $ 18.8 $ 8.9 $ 35.9 $ 25.5 Tax on Acquisition-Related Intangible (5.0) (2.6) (9.9) (7.3)
Net Acquisition-Related Intangible Amortization Expenses 13.8 6.3 26.0 18.2
$ 295.2 $ 267.3 $ 886.8 $ 721.5
2016 2017 2016
Table 11 - Adjusted Net Income and Adjusted Diluted EPS Attributable to Moody's Common Shareholders
Beginning in the third quarter of 2017, the Company modified this adjusted measure to exclude the impact of amortization of acquired intangible assets as companies utilize intangible assets with different ages and have different methods of acquiring and amortizing intangible assets. Furthermore, the timing and magnitude of business combination transactions are not predictable and the purchase price allocated to amortizable intangible assets and the related amortization period are unique to each acquisition and can vary significantly from period to period and across companies. Also, management believes that excluding acquisition-related amortization expense provides additional perspective when comparing operating results from period to period, and with both acquisitive and non-acquisitive peer companies.
In addition to excluding acquisition-related amortization expense, current and prior-year adjusted net income and adjusted diluted earnings per share exclude the CCXI Gain, the Purchase Price Hedge Gain, Acquisition-Related Expenses and restructuring charges. The Company excludes these items to provide additional perspective on the Company’s operating results from period to period and across companies as the frequency and magnitude of similar transactions may vary widely across periods. Additionally, the Acquisition-Related Expenses are excluded due to the material nature of these expenses which are not expected to recur at this dollar magnitude subsequent to the completion of the multi-year integration effort relating to Bureau van Dijk. Acquisition-Related Expenses from previous acquisitions were not material.
Net income attributable to Moody's common
Adjusted net income attributable to Moody's common shareholders
Three Months Ended September 30, Nine Months Ended September 30,2017
$ 1.63 $ 1.31 $ 5.02 $ 3.55 Pre-Tax Restructuring - $ 0.04 - $ 0.06 Tax on Restructuring - (0.01) - (0.02)
Net Restructuring - 0.03 - 0.04 CCXI Gain - - (0.31) -
Pre-Tax Acquisition-Related Expenses $ 0.05 $ - $ 0.09 $ - Tax on Acquisition-Related Expenses (0.01) - (0.01) -
Acquisition-Related Expenses (1) 0.04 - 0.08 - Pre-Tax Purchase Price Hedge Gain $ (0.36) $ - $ (0.57) $ - Tax on Purchase Price Hedge Gain 0.13 - 0.21 -
Net Purchase Price Hedge Gain (0.23) - (0.36) - q g Amortization Expenses $ 0.10 $ 0.05 $ 0.18 $ 0.13 Tax on Acquisition-Related Intangible (0.02) (0.01) (0.04) (0.04) q g
Amortization Expenses 0.08 0.04 0.14 0.09
$ 1.52 $ 1.38 $ 4.57 $ 3.68
(1) Certain Acquisition-Related Expenses are not deductible for tax.
Earnings per share attributable to Moody's common shareholders
Adjusted Diluted EPS attributable to Moody's common shareholders
Three Months Ended September 30, Nine Months Ended September 30,2017 2016 2017 2016
21
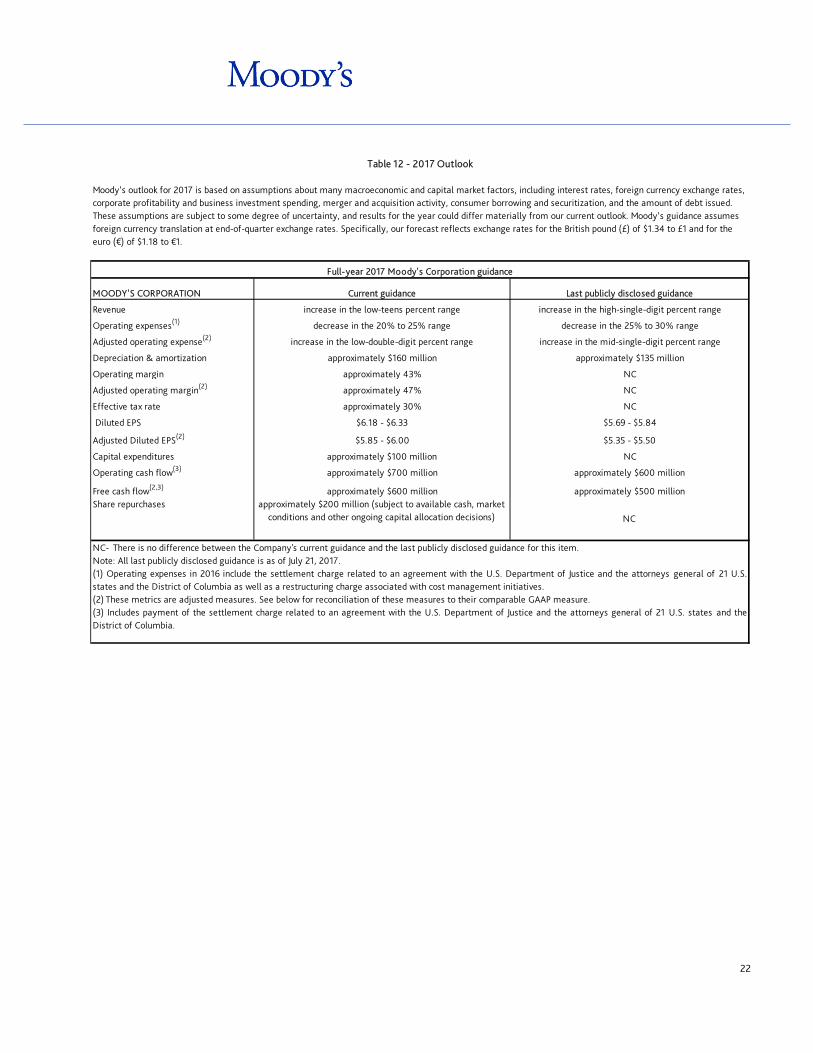
Operating margin approximately 43% NC
Full-year 2017 Moody's Corporation guidance
MOODY'S CORPORATION Current guidance Last publicly disclosed guidance
Revenue increase in the low-teens percent range increase in the high-single-digit percent range
Operating expenses(1) decrease in the 20% to 25% range decrease in the 25% to 30% range
Adjusted operating expense(2) increase in the low-double-digit percent range increase in the mid-single-digit percent range
Depreciation & amortization approximately $160 million approximately $135 million
Operating cash flow(3) approximately $700 million approximately $600 million
Adjusted operating margin(2) approximately 47% NC
Effective tax rate approximately 30% NC
Diluted EPS $6.18 - $6.33 $5.69 - $5.84
Adjusted Diluted EPS(2) $5.85 - $6.00 $5.35 - $5.50
Capital expenditures approximately $100 million NC
Free cash flow(2,3) approximately $600 million approximately $500 millionShare repurchases approximately $200 million (subject to available cash, market
conditions and other ongoing capital allocation decisions) NC
NC- There is no difference between the Company's current guidance and the last publicly disclosed guidance for this item. Note: All last publicly disclosed guidance is as of July 21, 2017. (1) Operating expenses in 2016 include the settlement charge related to an agreement with the U.S. Department of Justice and the attorneys general of 21 U.S.states and the District of Columbia as well as a restructuring charge associated with cost management initiatives. (2) These metrics are adjusted measures. See below for reconciliation of these measures to their comparable GAAP measure. (3) Includes payment of the settlement charge related to an agreement with the U.S. Department of Justice and the attorneys general of 21 U.S. states and theDistrict of Columbia.
Table 12 - 2017 Outlook
Moody’s outlook for 2017 is based on assumptions about many macroeconomic and capital market factors, including interest rates, foreign currency exchange rates, corporate profitability and business investment spending, merger and acquisition activity, consumer borrowing and securitization, and the amount of debt issued. These assumptions are subject to some degree of uncertainty, and results for the year could differ materially from our current outlook. Moody’s guidance assumes foreign currency translation at end-of-quarter exchange rates. Specifically, our forecast reflects exchange rates for the British pound (£) of $1.34 to £1 and for the euro (€) of $1.18 to €1.
22
MIS Non-U.S. increase in the high-teens percent range increase in the low-teens percent range
Full-year 2017 revenue guidance
MIS Current guidance Last publicly disclosed guidance
Table 12- 2017 Outlook Continued
MIS global increase in the low-teens percent range increase in the high-single-digit percent range
MIS U.S. increase in the low-double-digit percent range increase in the mid-single-digit percent range
increase in the low-teens percent range
SFG approximately 10% increase in the mid-single-digit percent range
FIG increase in the low-double-digit percent range increase in the high-single-digit percent range
MA U.S. increase in the mid-single-digit percent range NC
MA Non-U.S. increase in the low-twenties percent range increase in the low-double-digit percent range
RD&A(4) increase in the low-twenties percent range increase in the low-double-digit percent range
PS increase in the low-single-digit percent range NC
NC- There is no difference between the Company's current guidance and the last publicly disclosed guidance for this item. Note: All last publicly disclosed guidance is as of July 21, 2017. (4) Excluding Bureau van Dijk, MA global and RD&A current guidance has not changed since the last publicly disclosed guidance for these items.
ERS increase in the mid-single-digit percent range NC
PPIF approximately flat increase in the low-single-digit percent range
MA
MA global(4) increase in the low-teens percent range increase in the high-single-digit percent range
CFG increase in the low-twenties percent range
23
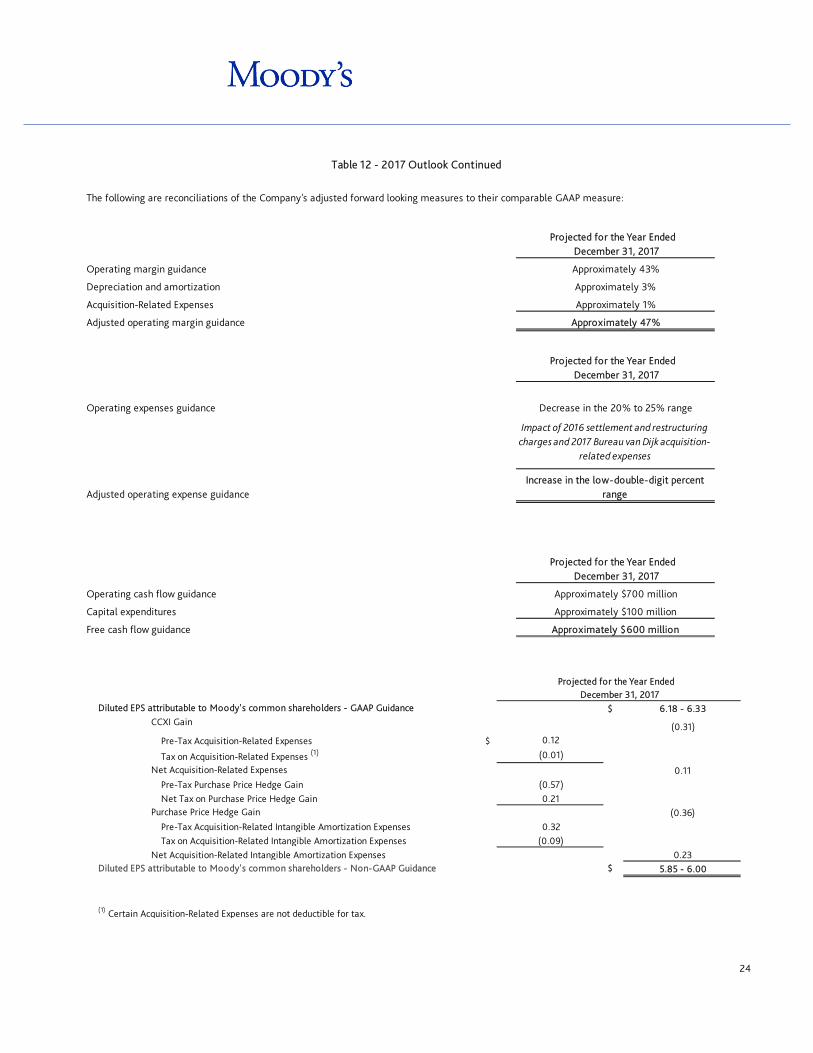
$ CCXI Gain
$
Pre-Tax Purchase Price Hedge GainNet Tax on Purchase Price Hedge Gain
$
(1) Certain Acquisition-Related Expenses are not deductible for tax.
5.85 - 6.00
Net Acquisition-Related Expenses
Diluted EPS attributable to Moody's common shareholders - GAAP Guidance
Diluted EPS attributable to Moody's common shareholders - Non-GAAP GuidanceNet Acquisition-Related Intangible Amortization Expenses
Pre-Tax Acquisition-Related Expenses
Tax on Acquisition-Related Expenses (1)
Projected for the Year Ended December 31, 2017
0.32
0.12
(0.01)
(0.57) 0.21
(0.09)
Purchase Price Hedge Gain
6.18 - 6.33
(0.31)
0.11
(0.36)
0.23
Pre-Tax Acquisition-Related Intangible Amortization ExpensesTax on Acquisition-Related Intangible Amortization Expenses
Projected for the Year Ended December 31, 2017
Operating cash flow guidance Approximately $700 million
Acquisition-Related Expenses Approximately 1%
Adjusted operating margin guidance Approximately 47%
Projected for the Year Ended December 31, 2017
Operating expenses guidance Decrease in the 20% to 25% range
Table 12 - 2017 Outlook Continued
Impact of 2016 settlement and restructuring charges and 2017 Bureau van Dijk acquisition-
related expenses
Adjusted operating expense guidanceIncrease in the low-double-digit percent
range
The following are reconciliations of the Company's adjusted forward looking measures to their comparable GAAP measure:
Projected for the Year Ended December 31, 2017
Operating margin guidance Approximately 43%
Depreciation and amortization Approximately 3%
Capital expenditures Approximately $100 million
Free cash flow guidance Approximately $600 million
24