Embed Size (px)
Citation preview

NNeewwsslleetttteerr
Number 35 December 2009

Newsletter 35
Compiled by Yves Ferrand Coordinator
Office national de la chasse et de la faune sauvage Research Department Migratory Birds Unit
BP 20 F 78612 Le Perray-en-Yvelines Cedex
December 2009 This Newsletter is published with financial assistance of Office national de la chasse et de la faune sauvage

WI/IUCN-WSSG Newsletter n°35 December 2009 2
This Newsletter seeks to be a contact organ to inform the members of the Woodcock and Snipe Specialist Group (WSSG), a research unit of Wetlands International (WI) and of IUCN, the International Union for Conservation of Nature. The subjects of WSSG are species of the genera Scolopax, Gallinago and Lymnocryptes that in several respects differ remarkably from all other wader species. For this reason a separate research unit was established.
CONTENTS Page Editorial …………………………………………………………………………………...………………………………..3 Development of a winter survey for Wilson’s Snipe in the Mississippi flyway ………………………………..4 DAVID G. KREMENTZ & J. MATTHEW CARROLL 2009 Belarus Woodcock Report ………………………………………………………………………………………..8 EDWARD MONGIN, YURI BOGUTSKI, ELENA DAVIDYONOK & ALEKSEY MONGIN Eurasian woodcock ( Scolopax rusticola) monitoring in Pilis (Hungary) ………………………………………10 NORBERT BLEIER & ZSOMBOR FÁCZÁNYI Estimation of the Woodcock hunting bag in European Ru ssia in 2008-2009 …………………………………12 YURI BLOKHIN & SERGEI FOKIN Autumn migration and Woodcock ringing in Central Ru ssia in 2009 ………………………………………..…15 SERGEI FOKIN, PETR ZVEREV, YURI ROMANOV & MARINA KOZLOVA Woodcock weight characteristics and variations thro ugh the year ……………………………………………..……….18 PETR ZVEREV Population trends of the Eurasian Woodcock Scolopax rusticola in SW Finland …………………………....21 LENNART SAARI The occurrence of the Common Snipe Gallinago gallinago on the island of Aasla, SW Finland, in 2005 – 2009……………………………………………………………………………………………………………..22 LENNART SAARI Swinhoe's Snipe Gallinago megala recorded in Finland …………………………………………………………..24 LENNART SAARI Towards an understanding of the origins and ecology of Woodcock wintering in Britain and Ireland …………………………………………………………………………………………………….26 ADELE POWELL A study of age ratios on two Woodcock sites in West Wales………………………………………………...….28 OWEN WILLIAMS An example of roding site fidelity in a Woodcock ma le……………………………………………………………31 BLAISE MULHAUSER & JEAN-LOU ZIMMERMANN 2008-2009 French Woodcock report ………………………………………………………………………….………..34 FRANÇOIS GOSSMANN, CLAUDINE BASTAT, MICHEL GUÉNÉZAN & YVES FERRAND Evaluation of the 2008/09 Woodcock hunting season in France …………………………………………….…...38 JEAN-PAUL BOIDOT Evaluation of the 2008/09 Woodcock hunting season in Europe from FANBPO members reports …………………………………………………………………………………….….40 JEAN-PAUL BOIDOT & GÉRARD AUROUSSEAU

WI/IUCN-WSSG Newsletter n°35 December 2009 3
2008-2009 French Snipes report …………………………………………………………………………………….…..41 GILLES LERAY, PATRICE FÉVRIER & YVES FERRAND Does early peak in Jack Snipes Lymnocryptes minimus on postnuptial migration correlate with breeding success? ………………………………………………………………………………………49 GUY-NOËL OLIVIER Observation of repeated attacks of a Snipe Gallinago gallinago by a Falcon Falco sp.. Comparison with the techniques of another predator: the Marsh-Harrier Circus aeruginosus…………….50 GUY-NOËL OLIVIER Is South Piedmont in Italy an adult Woodcock reservoi r ?……………………………………………….………..51 SILVIO SPANO Woodcock monitoring in Azores (Portugal) …………………………………………………………...……………...52 DAVID GONÇALVES, MANUEL LEITÃO JOÃO LUÍS PACHECO, ANDRÉ JESUS, JAIME PONTE & JOSÉ SEQUEIRA Could snipe in the Azores be used as a model to exp lain the constrained island biodiversity? ……….…..56 TIAGO RODRIGUES, SERGEI V. DROVETSKI & DAVID GONÇALVES Recent Woodcock and Snipe publications ……………………………………………...………………………..…..58 Editorial As you can see in this issue of our Newsletter, the Woodcock and Snipe Specialist Group show a great dynamism. The number of papers submitted has never been so high (which reduces the space for the editorial …but it doesn’t matter!). Their diversity is also very appealing. From anecdotes to research projects through monitoring surveys, I am sure you will find information you are interested in. Many thanks to all contributors. The year 2010 will be the one of our major event, the 7th Woodcock and Snipe Workshop, which will be held for the first time in Russia, at St Petersburg, from 19th to 21st September. Our Russian colleagues are largely involved in research and field work on our species and this Workshop will be a great opportunity to meet them and to visit some sites that provide very suitable habitat for woodcock and snipes during their breeding and migratory periods. We have entrusted the “Monomax” Company with the organisation of the Workshop. A website will be soon to your disposal to get all information about place, accommodation, visa formalities,… and everything you will need. Good success with your scientific work and see you in Saint Petersburg in September. Yves Ferrand Coordinator Office national de la chasse et de la faune sauvage Research Department – Migratory Birds Unit BP 20 F – 78612 Le Perray-en-Yvelines Cedex Telephone : +33 1 30 46 60 16/00 ; Fax : +33 1 30 46 60 99 e.mail : [email protected]

WI/IUCN-WSSG Newsletter n°35 December 2009 4
NNeewwss ffrroomm………….. UUSSAA Development of a Winter Survey for Wilson’s Snipe i n the Mississippi Flyway DAVID G. KREMENTZ, USGS Arkansas Cooperative Fish and Wildlife Research Unit, University of Arkansas, Department of Biological Sciences, University of Arkansas, Fayetteville, AR 72701, USA Email: [email protected] J. MATTHEW CARROLL, Arkansas Cooperative Fish and Wildlife Research Unit, University of Arkansas, Department of Biological Sciences, University of Arkansas, Fayetteville, AR 72701, USA Email: [email protected] Despite being widespread and relatively important in the bag of webless game birds, the Wilson’s snipe (Gallinago delicata) is one of the least studied North American game birds (Fogarty et al. 1977, Arnold 1994, Mueller 1999). Currently there are no reliable estimates of population numbers or trends for the snipe (Arnold 1994, Mueller 1999), and this absence of information was discussed by Tuck (1972), Fogarty et al. (1977), Arnold (1994), and Mueller (1999). The only continent wide trend survey for snipe is the Christmas Bird Count (CBC) which was not designed for surveying snipe. The CBC indicates that snipe significantly declined between 1959 and 1988 (trend: -1.2 (-2.2 - -0.1 95%CI), 1466 routes). Tuck (1972) also discussed winter surveys that were based on line transects focused on winter concentration areas across the U.S. winter grounds. These surveys were to be augmented by CBC data recognizing that the CBC was not designed to survey snipe. As with the breeding ground surveys, Tuck (1972) indicated that there were problems with this approach. The primary issues noted were: 1) numbers of snipe recorded fluctuated among years at individual sites, 2) the number of snipe wintering outside of the United States was uncertain and could change annually, and 3) that weather and water levels affected survey-specific detection. Despite the stated limitations of the winter survey approach, Tuck (1972:380) concluded that, “Winter population censuses have most merit and would be most reliable if carried out in the southern states in early February when the population is relatively stable.” Based on the combined consensus that population abundance estimation methods for snipe are needed (Tuck 1972, Fogarty et al. 1977, Arnold 1994, Mueller 1999) and that Tuck
(1972) recommended that winter population surveys offered the most promise, we are proposing to develop a winter ground survey for Wilson’s snipe in the Mississippi Flyway as a first step towards developing the methods for a United States-wide winter snipe survey. The objectives of our study are to: 1) develop a feasible roadside survey for wintering snipe, 2) estimate winter snipe population abundance for the Mississippi Flyway, 3) to determine whether survey-specific covariates need to be included in the survey design, and 4) to examine factors affecting between-year variability in individual site abundance estimates. Methods The study area included the snipe wintering grounds in the lower Mississippi Flyway (Figure 1). Based on current CBC data (Sauer et al. 1996), the primary wintering states for the Mississippi Flyway include Arkansas, Louisiana, and Mississippi. Within these states there are 3 concentration areas that include the Arkansas/Mississippi Delta, the southwestern Louisiana coastal plain and the Red River Valley in Louisiana. These 3 regions were the focal areas for our sampling scheme. Within the study area, we used townships as the sampling unit. We included 50 townships of which 20 were based on Christmas Bird Count data and 30 were chosen randomly. We stratified the sampling frame into 3 landscape types on the basis of CBC snipe abundance. The number of random sites was based on the proportion of the 3 states surveyed to the overall study area. Within each township, 9 line transects along secondary roads (1.8 km x ~200 m wide; 16.2

WI/IUCN-WSSG Newsletter n°35 December 2009 3
km total) were specified as the sub-sampling unit. Our criteria for secondary roads included in the survey were roads with low traffic and/or low speed limits and roads that were >1.8 km long. Survey sites (road sections) were based on random stratified points. We surveyed the nearest suitable road to the location of each random point. Routes were run from a slow moving truck using binoculars and window-mounted spotting scopes to count birds. All birds seen were recorded regardless of the distance from the observer. Briefly stopping the vehicle and alternating speeds was sometimes required to scrutinize certain habitat types. Also, the cryptic coloration and typically solitary nature of snipe required a methodical approach to conducting surveys. Along these routes, we recorded the GPS coordinates of start and stop location, distance from the road to each bird (or flock and how many individuals were in the flock), vegetation height, weather conditions, average water
depth, percent water and vegetation cover in a segment, and general habitat type. We conducted line transect surveys throughout the daytime from 21 January to 23 February 2009 as Tuck (1972) indicated that snipe had not yet begun spring migration then and were relatively stable in distribution. Upon completion of the study, snipe densities will be estimated using program DISTANCE for the sample area and will be expanded to the township level assuming that landscape adjacent to the road is reflective of the township landscape. Site-specific and survey-specific covariates thought important to estimating detection will be formally tested for importance in DISTANCE. Factors affecting snipe densities for townships sampled in both years will be compared using appropriate candidate models and model selection will be based on Akaike’s Information Criteria.
Figure 1: Study area including the lower Mississippi Valley, Red River region of Louisiana and southwestern Louisiana. Black symbols represent townships that were surveyed, February 2009.
Results Road availability and access varied greatly among townships. In more urban areas, surveys were many times not possible due to safety concerns and/or a lack of roads meeting our criteria for suitable road segments. In townships where there were not enough road segments, surveys were conducted on roads outside of the townships if they were within one surveys length from the border of the township (1.8 km). Incomplete surveys, although rare, were typically due to road conditions or access difficulties. Also, logistical issues such as gates, private property, treacherous roads and nonexistent roads/farm lanes, made some points impossible to use as a reference for surveys. We detected 1492 Wilson’s snipe from 21 January – 23 February 2009. We detected snipe in 49% of the townships surveyed. One township in Mississippi accounted for 338 snipe detected and one township in Arkansas had 232 snipe detected. The remaining 922 snipe were detected in townships throughout the study area. However, no snipe were detected in the two townships that were surveyed in the Red River region of Louisiana.
5

WI/IUCN-WSSG Newsletter n°35 December 2009 3
Most snipe (91%) were detected in association with shallow standing water (Fig. 2). 59% of snipe were detected in areas with between 25-<50% water cover. The next most commonly used sites by snipe had <25% water cover (29%), 50-<75% water cover (8%) and >75% water cover (5%). Comparing habitat available with numbers of snipe detected, we noted that snipe appeared to use agriculture more often than available (Fig. 3). General agricultural habitats defined as crop fields (including rice) and pasture had the highest number of snipe comprising 95% of the total number of snipe detected (Fig. 3). More specifically, of the 95% of birds detected in generalized agricultural habitats 14% were detected in rice fields and 6.5% were detected in pastures. Fish pond/ mudflat habitats
accounted for about 5% of the total snipe detected but <1% of the total habitats observed. Residential areas and marshes each had <1% of the snipe detected. Wooded areas, open water areas, and various habitats categorized as other accounted for zero snipe detected. In terms of habitats with varying percent water cover, general agricultural habitats with 25-50% water cover accounted for more than half of the snipe detections (807) (Fig. 4 & 5). Agricultural habitats with 0-<25% water cover had 429 birds detected, and agricultural habitats with 50-<75% had 116 birds detected. Fishpond/mudflat habitats were the only habitats with birds detected in association with >75% shallow water cover. .
0
100
200
300
400
500
600
700
800
900
1000
<25 25-<50 50-75 >75
Shallow Water Cover (%)
Num
ber
of B
irds
0
10
20
30
40
50
60
70
80
90
100
ag
wooded
deve
loped
othe
r
open
wat
er
wetlands
aqua
cultu
re
Habitat
Per
cent
townships
surveys
birds detected
Figure 2: Number of birds detected in habitats with varying percentages of shallow water cover in the lower Mississippi Flyway, February 2009.
Figure 3: Percent of Wilson’s snipe detected compared to the habitat types observed in the lower Mississippi Flyway during February, 2009 and township habitat types indicated by National Agricultural Statistics Service (USDA) data in the surveyed townships.
Nu
mb
er
of
bir
ds
6

WI/IUCN-WSSG Newsletter n°35 December 2009 2
Water Coverage (%)
0
100
200
300
400
500
600
700
800
900
agriculture residential pond/mudflat marsh
Habitat
Num
ber
of B
ird
s
0-<25
25-<50
50-<75
75-100
Figure 4: The relationship between water cover and habitat type used by Wilson’s snipe in the primary wintering area of the lower Mississippi Flyway, February 2009.
Acknowledgements These results are from the first year of a two-year study funded by the Webless Migratory Game Bird Management Program (U.S. Fish and Wildlife Service), and the USGS Arkansas Cooperative Fish & Wildlife Research Unit.
In examining the frequency histogram of snipe detected versus distance from the transect line, we determined that we needed to left truncate at 20 m because of the road and associated right of way were not used by snipe. We detected 85 snipe beyond 200 m and opted to truncate those observations. We used a global detection function, half normal cosine key function and cosine series expansion to estimate an overall snipe density. We estimated 9.1 (2.45 SE) snipe per square kilometer. Our estimated strip width was 70.4 m, and the mean cluster size was 1.82 (0.73 SE) individuals per cluster. In 2010 we will repeat the line transects surveyed in 2009. We will also double survey coverage in 2010 by adding more townships within the study area. Habitat covariates will be recorded in order to detect possible patterns in habitats occupied by snipe. Yearly snipe abundances at sites for 2009 and 2010 will be compared with Christmas Bird Count data from each respective township for those years. Program DISTANCE will ultimately be used to generate a density estimation that will be expanded to determine an estimate of snipe abundance in the lower Mississippi Alluvial Valley.
Figure 5: Snipe counts within the study area. Each circle represents a township where surveys occurred with the corresponding count number.
Nu
mb
er
of
bir
ds
7

WI/IUCN-WSSG Newsletter n°35 December 2009 3
References Arnold K. A. 1994. Common snipe. Pages 117-125 in T.C. Tacha and C.E. Braun, editors. Migratory shore and upland game bird management in North American. Int. Assoc. Fish and Wildlife Agency, Washington, DC. Fogarty, M. J., Arnold K. A., McKibben L., Popischal L. B & R. J. Tully. 1980. Common snipe Pp. 189-209 in G.C. Sanderson, editor. Management of migratory shore and upland game birds in North America. University of Nebraska Press, Lincoln and London. Mueller H. 1999. Common snipe (Gallinago gallinago) in The Birds of North America, No. 417 (A. Poole and F. Gill, eds.). The Birds of North America, Inc., Philadelphia, PA. Sauer J. R., Schwartz S. & B. Hoover. 1996. The Christmas Bird Count Home Page. Version 95.1. Patuxent Wildlife Research Center, Laurel, MD. Tuck L. M. 1972. The snipes: a study of the genus Capella. Volume 5. Canadian Wildlife. Service Monograph Series. No. 5.
NNeewwss ffrroomm………….. BBEELLAARRUUSS
2009 Belarus Woodcock Report EDWARD MONGIN, APB-Birdlife Belarus, Lyn’kova str. 17A-22, 220104 Minsk, Belarus Email: [email protected] YURI BOGUTSKI, Berezinski Biosphere Reserve, Domzeritsi, Vitebsk Region, Belarus ELENA DAVIDYONOK, APB-Birdlife Belarus, Minsk ALEKSEY MONGIN, APB-Birdlife Belarus, Minsk This season is the fifth year of Woodcock studies in Belarus with the financial assistance of the Office national de la chasse et de la faune sauvage. This year the main task of the project was Woodcock and Snipe species (Gallinago gallinago, Gallinago media and Lymnocryptes minimus) ringing during the autumn migration. Breeding survey Thanks to activities in the Berezinsky Reserve, census of the breeding population from the observation of roding males were carried out at 12 listening points during June. Listening points were located in two squares (12x12 km). Censuses were continued during 120 minutes. In total 164 contacts with roding males were registered at the census points. Average number of woodcocks per 2 hours was 13.7+3.63. Five-year data of counts are shown in Table 1. Maximum contacts at one point were 22 during two hours.
Ringing and surveys during the autumn migration Woodcock ringing and study of migration were carried out in the Berezinsky Reserve vicinities. The main study period was 26 September – 29 October. This autumn season was very rainy. Only 4 days were without precipitation in October. Ground was moist and soft, which was favourable to feeding Woodcocks. After heavy rains we even found on meadows many pools with large numbers of ? ducks. We recorded 182 feeding birds during 29 night trips and 36 woodcocks were caught. Among them 1 bird was ringed one year ago at the same place and 1 bird was recaught after four days. The catching success rate was 20%, which was less than the last year (31%). Few birds were caught in the full moon and windless nights. .
Year 2005 2006 2007 2008 2009
N. listening points 12 12 12 12 12
Average number of contacts 15.9+6.40 12.5+4.91 20.8+6.06 12.7+3.34 13.7+3.63
Table 1: Average number of contacts during two-hour counts in the Berezinsky Reserve.
8

WI/IUCN-WSSG Newsletter n°35 December 2009 3
0
5
10
15
20
25
26-sept 1-oct 6-oct 11-oct 16-oct 21-oct 26-oct
Num
bers
0
5
10
15
20
25
30
35
40
Sep-3 Sep-4 Sep-5 Sep-6 Oct-1 Oct-2 Oct-3 Oct-4 Oct-5 Oct-6 N ov-1
2009 2008 2007
%
of
mea
n p
er 5
day
per
iod
Figure 1: Passage dynamics of Woodcock according to records of nocturnal contacts in vicinities of the Berezinsky Reserve in 2009. The black dots indicate days without counts on the plot.
Figure 2: Passage dynamics of woodcock according to records of nocturnal contacts in 2007-2009. Data grouped in five-day periods.
0
1
2
3
4
5
6
7
8
9
10
6-Oct 11-Oct 16-Oct 21-Oct 26-Oct
Nu
mb
ers
Figure 3: Passage dynamics of Jack Snipe according to records of nocturnal contacts in vicinities of the Berezinsky Reserve in 2009. The black dots indicate days without counts.
It is interesting to note that the adult woodcock caught on 9 October had 10th and 9th primaries growing. Clausager (1973) reports that the primary moult in adults is generally completed by the end of September, but that in a few individuals it may last until mid-October. The latter are possibly females having late broods that complete the primary moult later. This season 42% juveniles were from late broods. Many of the juveniles had growing tail feathers. Passage dynamics according to records of nocturnal contacts on the monitoring plot are given in Figure 1. The age ratio (juv/ad) among caught woodcocks was 1.2 and thus first-year woodcocks represented 54.3% of all ringed birds. Passage dynamics of woodcock according to grouped observations by pentads are presented in Figure 2. The main wave of passage was observed up to the third decade of October. It seems that most birds have completed the passage over Belarus by this time . We also caught and ringed 2 Jack Snipes, 9 Common Snipes and 1 Great Snipe during our night trips. The Great Snipe juvenile was caught on 12 October. It is the latest date of the species registration among our observations. The earliest migratory birds are recorded during July and August (Mongin 2002). According to our five-year observations in the Berezinsky Reserve Jack Snipe is recorded from the third decade of September to November. This year the first Jack Snipe was registered on 7 October and the maximal number of birds was recorded in the third pentad of October (Figure 3). Birds were observed on small channels and rain puddles as well.
References Clausager I. 1973. Age and sex determination of the woodcock (Scolopax rusticola). Danish Review of Game Biology, 8: 1-18. Mongin E. 2002. Snipes Gallinago gallinago, Gallinago media and Lymnocryptes minimus in Belarus. In: Sazas S., Mongin E., Grishanov G., Kuresoo A. & Meissner W. Snipes of the Eastern Baltic Region and Belarus. OMPO special publication. Vilnius: 15-35.
9

WI/IUCN-WSSG Newsletter n°35 December 2009
10
NNeewwss ffrroomm………….. HHUUNNGGAARRYY Eurasian woodcock ( Scolopax rusticola) monitoring in Pilis (Hungary) NORBERT BLEIER , Szent István University, Institute of Wildlife Conservation, Páter K. u. 1., 2103 Gödöllı, HUNGARY Email:[email protected] ZSOMBOR FÁCZÁNYI , Fairy Bird Woodcock Research Association, Petıfi u. 42., 8085 Vértesboglár, HONGRIE, Email: [email protected] In spring 2009, the Fairy Bird Woodcock Hunter and Research Association started a monitoring in a small study area, in addition to a woodcock monitoring programme set up by the Hungarian National Chamber of Hunters and Szent István University at a national level. Although the members of the association also took part in the national monitoring, the question arose as to how a twice a day observation in a smaller area may complement the nationwide survey carried out with weekly observations and only one data registration per observation point. Material and methods Observation period Our survey – unlike the nationwide monitoring program which takes place between 28 February and 2 May - was conducted between 1 March and 10 April for two reasons: (i) according to our experience (for example, the previous hunting season) this migratory bird never arrives before March and the last observations occur usually in mid-April (sometimes before 10 April); (ii) as for the national monitoring, the observers are volunteers, mostly enthusiastic woodcock hunters for whom this period of the year represents the woodcock season. Study site Three observation points were located in the area of Pilis Forest Administration Zrt., close to Julianna-farm-stead: Vadrózsás (N 47° 32’ E 18° 54’), Katonasír (N 47° 32,40’ E 18° 55’), Barkócaberkenye (N 47° 32’ E 18° 56’). The study site is a traditional woodcock roding area with vegetation composed of closed forest blocks, meadows, hedges and young aforestations. A mosaic of different-aged
woodlands and slashings makes the area diverse. The altitude of the observation points was respectively 401, 378 and 319 m above sea level. All three points were situated in a valley between two ridges of hills along an almost straight line at 788, 1310 and 2010 meters from each other. Census method The aim was to collect data on morning and evening roding at all three observation points every day during the 41 days of the observation period. Out of accordance with the national monitoring and other similar foreign country surveys, we did not plan two-hour observations. In practice, observations lasted 30-40 minutes, including the 20 minutes long roding time usual in this period of the year. All woodcocks seen and heard in the course of roding and birds flushed within 20 m of the observation points when approaching or leaving it were registered. If a normal roding call was heard, one contact was registered. In case of a “pairing call”, 2 contacts were registered. Results In total, 182 sequences of observation have been performed by about twenty observers. The first observation occurred in the evening on 1 March. No roding birds were observed till 6 March. From this date, roding woodcocks were observed at each sequence of observation till 3 April, on which date no bird was observed (missing data for 27 and 29 March). In the following days, roding woodcocks were irregularly seen and heard in low numbers indicating that roding was close to end. After 10 April, no woodcock was observed. Due to non-continuous sequences of observation, data are summed up into five-day

WI/IUCN-WSSG Newsletter n°35 December 2009
11
periods (Table 1). Figure 1 presents the intra-seasonal evolution of the mean number of contacts by five-day period for every observation point and for the total observations. A continuous increase can be observed from 1 March to the second half of
March (except for point 3 in the 16-20 March period), followed by a sharp decrease. From our data, no statistical differences were found between dawn and dusk on the mean number of contacts per sequence [resp. 1.87 (166/89) and 1.70 (158/93). .
Point 1 Point 2 Point 3 total
1-5 March 0 (4) 0 (3) 1 (5) 1 (12)
6-10 March 2 (8) 2 (4) 9 (9) 13 (21)
11-15 March 23 (9) 12 (6) 14 (7) 49 (22)
16-20 March 24 (9) 25 (9) 12 (9) 61 (27)
21-25 March 38 (9) 27 (9) 21 (8) 86 (26)
26-30 March 20 (5) 11 (5) 29 (8) 60 (18)
31 March - 4 April 11 (7) 18 (9) 9 (8) 38 (24)
5-9 April 7 (10) 5 (10) 3 (8) 15 (28)
40 days 125 (61) 100 (55) 98 (62) 323 (178)
Discussion Weather conditions can have an impact on the Woodcock migration phenology. Although nearly 10 cm of snow covered the area at the beginning of March, it continuously melted away and disappeared in a few days. Thus we think that the weather conditions in Spring 2009 have not significantly modified the vernal arrival of woodcock compared to the previous years. During the peak of the roding period, a woodcock was seen or heard almost every minute. Despite non-continuous observations and a probability < 1 in detection of roding birds (problem of visibility), the data show that the first and the last observations fell more or less on the same dates at all three observation points (resp. 6,7 and 10 March and 6,9 and 10 April).
The data from the single observation points provide information on roding activity occurring at the given place and on the intensity of roding. The intensity of roding is defined by the number of birds actually present in the area (the migration dynamics), however, other factors may influence this number (such as weather conditions, disturbance, sexual activity of birds, etc.). Hence, the aggregate data from observation points allow us to draw conclusions about the migration dynamics. Thus when pooling the data from the three observation points and taking into account the number of observation occasions as well as the number of contacts, we obtain a diagram similar to a bell-shaped curve, which informs us about the migration dynamics and the peak period of migration in the examined area.
Table 1: Number of contacts (roding males) by five-day periods for every point of observation and for all points (in brackets, number of observation sequences).
0,0
0,5
1,0
1,5
2,0
2,5
3,0
3,5
4,0
4,5
1-5March
6-10March
11-15March
16-20March
21-25March
26-30March
31 March- 4 April
5-9 April
mea
n of
point 1
point 2
point 3
total
Figure 1: Mean number of contacts by five-day periods at every point of observation and for all points.
Mean number of co
ntacts
WI/IUCN-WSSG Newsletter n°35 December 2009
12
NNeewwss ffrroomm………….. RRUUSSSSIIAA
Estimation of the Woodcock hunting bag in European Russia in 2008-2009 YURI BLOKHIN & SERGEI FOKIN , State informational-analytical center of game animals and environment (Federal state office “Centrokhotcontrol”)- Russian Ministry of Agriculture, Moscow, Russia. E-mails: [email protected], [email protected] Information collection on hunting bags of migratory birds is a major part of the population monitoring. Currently, the State service of animal censuses in Russia does not receive enough information for many game birds, including Woodcock. Since data directly issued from hunting licenses are inaccessible, an inquiry among hunters is necessary. This is possible with the help of the Central administration of the Russian Hunting Association "Rosohotrybolovsojuz" and the Vologda Hunting Department. Material and method In Spring 2008, 10800 questionnaires called “Individual card of woodcock roding shooting” were distributed among hunters in European Russia and Ural through “Rosohotrybolovsojuz” and 7500 in 2009. The hunters were asked to fill in the questionnaire anonymously. Five pieces of information were required: hunting area, hunting dates, amount of bagged woodcocks and lost birds, and information on the quality of the hunting season in comparison with the last year. To fill in the questionnaire was compulsory. During the two last years, data were received from 31 Republics and Oblasts of the Russian Federation out of the 43 where questionnaires were sent. In 2008, 26 Oblasts or Republics (60 %) responded and 2,558 questionnaires (24 %) were returned. In 2009, 26 Oblasts or Republics (62 %) responded and 2,899 questionnaires (39%) were returned. Such a high return is due to the active work of the Vologda Hunting Department (579 questionnaires returned in the first year, 1,036 questionnaires in the second). Many questionnaires were also collected in 2008/2009 from Yaroslavl (208/504), Nizhniy Novgorod (164/145), Tver (266/32), Ulyanovsk (122/139), Tula (100/154) and
Pskov (196/18) Oblasts. The questionnaires containing ambiguities and mistakes were rejected. In 2008, 1,560 questionnaires (61 % of total sending) were taken into account. Three respondents did not hunt and 1,557 shot 4,491 woodcocks and lost 714 birds. This sample contained data from 271 hunting territories located in 182 districts and 25 Oblasts and Republics of the Russian Federation. In 2009, 1,823 questionnaires (63.9 % of total sending) were taken into account for analysis. 45 respondents (2.6 %) did not hunt and 1,778 hunters shot 5,248 woodcocks and lost 822 birds. These data were received from 232 hunting territories located in 160 districts and 21 Oblasts and Republics of the Russian Federation. Delimitation of Russian Federation regions used in this paper was defined in 2000 (Blokhin et al, 2006) and differs from the recent district distribution . Results In 2008, data was collected from 28 March to 14 May (i.e. 48 days) and in 2009 from 28 March to 17 May (i.e. 51 days). According to new regulation, the Spring hunting period increased from 10 days in 2008 to 16 days in 2009. In 2008, a hunter spent 4.37 ± 0.08 days (n = 1,532) in average hunting during the roding hunting season. 35.4 % of hunters hunted one day out of ten, and 24.7 % hunted during all the ten-day hunting season. In Yaroslavl, Tver and Tambov Oblasts where roding hunting is rather intense, the hunters hunted 5 - 6 days in average for a 10-day season. In Vologda and Nizhniy Novgorod Oblasts, the majority of hunters (54 - 61 %) spent only one day hunting. In Leningrad, Pskov and Ryazan Oblasts about half of hunters (46 - 50 %) spent only one day hunting.

WI/IUCN-WSSG Newsletter n°35 December 2009
13
In 2009, a hunter spent 4.59 ± 0,07 days (n = 1,766) in average hunting during the roding hunting season. 17 % of hunters hunted only one day, and 5.4 % hunted during all the 16-day hunting season. In Vladimir, Tver, Penza, Belgorod Oblasts, the hunters hunted 6 - 9 days in average for a season. In Bashkortostan, Vladimir, Vologda, Tambov and Sverdlovsk Oblasts, 25 - 35 % of hunters spent only one day hunting.
In 2009, 47.7 % of hunters declared that the roding hunting season was worse than in 2008, and 43.7 % that it was better (n = 1,505). However, this result was not registered everywhere. In Central and Central Black Earth regions, the 2009 roding hunting season appeared to be better than in 2008. In 2008, 53.2 % of respondents declared that the roding hunting season was worse than in 2007, and 34.8 % that it was better (n = 1,378).
Maximum individual hunting bag
Mean individual hunting bag
Regions
2008 2009 2008 2009
North 15 22 2.50 ± 0.09 2.77 ± 0.08
North-West 15 8 3.33 ± 0.14 2.9 ± 0.65
Central 20 25 2.92 ± 0.09 3.13 ± 0.09
Central-Black soil 8 11 1.87 ± 0.16 3.25 ± 0.20
Volga-Viatka 17 22 3.14 ± 0.13 4.44 ± 0.28
Povolzhsky 15 9 3.53 ± 0.24 1.55 ± 0.13
Ural 12 11 3.09 ± 0.34 3.78 ± 0.29
In 2008, for the whole Russian regions, the largest individual hunting bag was 20 birds (in Tver Oblast) and the highest individual losses were 7 birds (in Kostroma Oblast) (Table 1). On average, a hunter shot 2.88 ± 0.05 woodcocks and lost 0.47 ± 0.02 birds (n = 1,557). Without taking into account hunters who shot no woodcock, the mean seasonal hunting bag of "successful" hunters was 3.47 ± 0.05 and the mean number of lost birds was 0.53 ± 0.02 (n = 1,293). In 2009, the maximal individual hunting bag registered was 25 birds, and the maximal number of birds lost by a hunter was 7 (both in Yaroslavl Oblast). On average, a hunter shot 2.95 ± 0.05 woodcocks and lost 0.49 ± 0.02 birds (n = 1,778). The mean seasonal hunting bag of "successful" hunters was 3.52 ± 0.06 and the mean number of lost birds was 0.55 ± 0.02 (n =1,489). In details, in 2008, less than two birds per hunter were shot on average in Tambov (1.43 ± 0.21) and Tula (1.96 ± 0.21) Oblasts. More than four woodcocks per hunter were bagged on average in Bryansk Oblast, however the data set is small (n = 7). In other Oblasts, the
mean individual hunting bags ranged from 2.22 ± 0.3 (Kursk) to 3.96 ± 0.65 (Ryazan) woodcocks. In 2009, less than two birds per hunter were shot on average in Tatarstan and Bashkortostan Republics, and in Novgorod and Ulyanovsk Oblasts. More than four woodcocks on average were bagged per hunter in Pskov (5.67 ± 1.41), Ryazan (5.25 ± 0.59) and Nizhniy-Novgorod (4.44 ± 0.28) Oblasts, but for the first two regions, the data set appears too small (n = 3 and 12, resp.). In other Oblasts, the mean individual hunting bags ranged from 2.15 ± 0.38 (Penza) to 3.93 ± 0.32 (Sverdlovsk) woodcocks. In 2008, lost birds made up 15.9 % of shot woodcocks. 83 % of hunters bagged at least one woodcock, among which 16.1 % bagged only one bird and 13.1 % more than 5 (Table 2). In 2009, lost birds made up 15.7 % of shot woodcocks. 84 % of hunters bagged at least one woodcock, among which 22.2 % bagged only one bird and 15.4 % more than 5 (Table 2).
Table 1: Mean and maximum individual Spring Woodcock hunting bag for 7 Russian regions in 2008 and 2009.

WI/IUCN-WSSG Newsletter n°35 December 2009
14
Discussion Analysis of official hunting licenses and special permits shows that many of them do not mention the hunting bag or contain false information and, consequently, emphasizes an obvious weakness of such data for the assessment of hunting bags, despite these licences being compulsory. On the contrary, questionnaires are voluntary. However, false information, for instance due to the filling in of several questionnaires by the same person, also appears. Such questionnaires have not been included in the present paper.
Individual Woodcock Spring hunting bags appeared high everywhere in 2008 and 2009, in comparison with the results obtained earlier using another method (Blokhin et al., 2006). Till 2003, in the European part of Russia, the mean Spring hunting bag per hunter was comprised between 0,7 and 1,2 woodcock. According to opinion of respondents, the number of roding birds decreased from year to year. However, the hunting activity expressed by the mean number of hunting days per hunter was particularly high in 2009 as the hunting season increased from 10 days in the previous seasons to 16 days. .
% of hunters according to the hunting bag
Year n 0 1 2 3 4 5 >5
for the season 1,557 17.0 16.1 19.4 17.0 10.5 6.8 13.2 2008
for one trip
1,204 19.2 27.8 25.9 17.0 6.2 2.2 1.8
for the season 1,778 16.3 22.2 17.6 13.7 8.2 6.7 15.4 2009
for one trip 302 22.9 44.0 17.6 9.6 2.0 1.3 2.7
Table 2: Distribution of hunters (in %) according to their Woodcock Spring hunting bag in 2008 and 2009. Except for Vologda Oblast, the mode of distribution of questionnaires remains unknown. If they are distributed after the hunting season, the results will be probably be overestimated in so far as the questionnaires will be mainly filled up by successful hunters (Antipov, 2009). However, anonymous questionnaires usually provide more accurate information about the hunting bags than official documents such as licenses and hunting permits (Mishvelov et al., 2007) and estimation of hunting bags is usually higher. In many cases, regional hunters associations do not return the questionnaires (or only a few). This is not the case in Vologda Oblast where, in 2009, each hunter received a questionnaire at the same time as his permit. The Vologda hunting department considers that all legal hunters have correctly reported their hunting bag. Under this assumption, 2.7 % of 37,100 hunters registered in this Oblast only hunted during roding with a total Spring Woodcock hunting bag of about 3000 woodcocks (bagged and lost birds). In Vologda Oblast, during the 1996-2002 period, the mean number
of Woodcock bagged per hunter per season was comprised between 0.4 to 0.7 birds ant the total bag between 6,000 to 12,000 woodcocks. Due to the low level of individual bags, this could mean that the number of “roding” hunters was much higher than it is now. But this is inconsistent with the increase trend in the number of Woodcock hunters shown by Blokhin et al. (2006). However, some bias occurred in the calculation during the 1996-2002 period. The method was different from the current one since it did not use basic data but only official tables which were already made at a regional level and subject to interpretation. Moreover, calculation was drawn from about 19,000 hunting licenses dedicated to several game birds and not only to Woodcock. This clearly introduces a bias for the estimation of the Spring Woodcock hunting bag, since the individual hunting bag was underestimated and the overall number of woodcock hunters was overestimated in the calculation of the overall hunting bag in the area.

WI/IUCN-WSSG Newsletter n°35 December 2009
15
Conclusion Our knowledge on Spring Woodcock hunting bags is based on personal experience, long-term observations and on hunting statistics of former years. It enables us to critically estimate information provided by hunters. The hunting bag statistics available for Woodcock and other game birds are based on various primary sources of information They can be carried out
in different ways but are all based on inquiries among hunters who are expected to give interesting data. In comparison with results obtained using different methods, it is possible to provide an objective estimation of hunting bags. The previoulsy published results on Spring woodcock hunting and on Russian hunting bags will thus probably need to be reconsidered.
References Antipov A.M. 2009. Methodical mistakes of definition of success of spring hunting for ducks at processing licenses.. Conservation of animal diversity and wildlife management of Russia. Documents of the 3 International scientific-practical conference. - Moscow: MTA, 2009. 527-530 Blokhin Yu. Yu., Mezhnev A.P. & S.Yu. Fokin. 2006. Woodcock hunting bag statistics in Russia since 1996. Sixth European Woodcock and Snipe Workshop. Proceedings of an International Symposium of the Wetlands International Woodcock and Snipe Specialist Group/Nantes, France, 25-27 November 2003. Ed. Y. Ferrand. // Wetlands International. International Wader Studies 13: 17-23. Mishvelov Е.G., Bortcov P.А., Drup А.I., Saphatov P.V. & I.G. Trautvajn. 2007. Features of the account of hunting bag of some kinds of the hunting animals in territory of Stavropol territory. Conservation of animal diversity and wildlife management of Russia. Documents of the 2nd International scientific-practical conference. Moscow: MTA, 2007. 172-174.
Autumn migration and Woodcock ringing in Central Ru ssia in 2009 SERGEI FOKIN , PETR ZVEREV, YURI ROMANOV & M ARINA KOZLOVA , State informational-analytical center of game animals and environment (Federal state office “Centrokhotcontrol”)- Russian Ministry of Agriculture, Moscow, Russia. E-mails: [email protected], [email protected] According to the agreement between the State informational-analytical center of game animals and environment (Russia) and Office national de la chasse et de la faune sauvage (France) in 2009, the Moscow scientific " Woodcock" group has organized ringing and study of autumn migration woodcock in Central Russia. The main works were made in the Kostroma and Tver Oblasts. Kostroma Oblast Ringing in Kostroma was carried out in 4 pastures grazed by 700 cows in total and located at 2-25 km from Susanino (58*09’N 41*37’E). Till the beginning of autumn, warm and dry weather characterized the Kostroma area and only a few woodcocks were observed at night.
After strong rains on 23 September many woodcocks were observed at night at feeding sites and during the daytime in forest. The 2009 autumn migration peak took place from 29 September to 3 October. After this period, a cold snap occurred and the number of observed woodcocks decreased. Evolution of the number of contacts during the night catching trips is presented in Figure 1. The duration of trips was comprised between 2.5 hours and 6 hours. In total, 123 woodcocks (27 adults/96 juveniles) were ringed during the night trips and 70 hours of searching were performed . The juveniles can be divided into 82 “early brood” and 14 “late brood”. Seven direct and one indirect retraps (on 26 September 2009 for a woodcock ringed at the same place on 2 October 2008) were recorded.

WI/IUCN-WSSG Newsletter n°35 December 2009
16
Figure 1: Evolution of the number of contacts at night trips in Kostroma(Susanino district) in autumn 2009. Tver Oblast Ringing took place in the Maksatikha district (57. 47 N; 36.03 E) from 28 September to 11 October. Captures were mainly performed in a pasture located in an open area of 400 hectares. Another pasture that was the main ringing area in the previous years was used more rarely in 2009 in spite of the high quality of ringing sites for woodcock (intense grazing). Weather conditions can influence the presence of woodcocks in the pastures and hayfields. Figure 2 presents the evolution of the number of woodcocks found in the same area in autumn 2005 (drought), 2006 (rainy and warm), 2007 (dry, then rainy), 2008 (warm and rainy) and 2009. In 2009, 73 woodcocks were found in all ringing areas in Tver Oblast (56 in 2005, 47 in 2006, 75 in 2007, 56 in 2008) during a period twice shorter than in the previous years. In 12 days, approximately three times as many woodcocks were found. Two more active periods can be identified: 27 September to 4 October and 8 October to 12 October. From 28 September to 10 October, on average 4.2 birds per day were seen from 2005 to 2008.
In 2009, the average increased to 6.1. The average number of woodcocks recorded in 2009 was one third higher than in the previous years. This suggests that the number of woodcocks in autumn 2009 in Maksatikha district increased significantly, whereas in 2008, it decreased by more than half in comparison with the 2005-2007 period. This could be used as an indirect index of the reproduction success. In total, 29 woodcocks were ringed in autumn 2009 in Tver Oblast (Maksatikha district). The proportion of juveniles in captures was 86 %. All juvenile birds were from “early broods”. The weight of adults ranged from 370 to 410 g (average 388 g) and that of juveniles from 310 to 410 g (average 350 g). The average of all ringed birds was 355 g. In addition, 14 woodcocks were ringed in other places of Central Russia. The high proportion of juveniles confirmed our opinion that the breeding success was rather good for woodcock in Russia in Spring 2009.
10
30
2017
11
1518
41
24
32
19 18 19
13
20
2
0
5
10
15
20
25
30
35
40
45
50
23/09/2009
24/09/2009
25/09/2009
26/09/2009
27/09/2009
28/09/2009
29/09/2009
30/09/2009
01/10/2009
02/10/2009
03/10/2009
04/10/2009
05/10/2009
06/10/2009
07/10/2009
08/10/2009
09/10/2009
10/10/2009
11/10/2009
12/10/2009
n

WI/IUCN-WSSG Newsletter n°35 December 2009
17
0
2
4
6
8
10
12
14
16
23/9
25/9
27/9
29/9
1/10
3/10
5/10
7/10
9/10
11/1
0
13/1
0
15/1
0
17/1
0
19/1
0
21/1
0
23/1
0
25/1
0
n
2005
2006
2007
2008
2009
Figure 2: Evolution of the number of contacts at night trips in the open pastures of Maksatikha district in autumn 2005 to 2009. Summary of Woodcock ringing in Central Russia in Autumn 2009 N. contacts: 435 N. ringed woodcocks: 166 % of juveniles: 79.5 (132/166) % of early brood: 86.4 (114/132) N. direct recoveries: 7 N. indirect recoveries: 1 Capture rate: 39.8 %
©Y. Ferrand

WI/IUCN-WSSG Newsletter n°35 December 2009
18
Woodcock weight characteristics and variations thro ugh the year PETR ZVEREV, State informational-analytical center of game animals and environment (Federal state office “Centrokhotcontrol”)- Russian Ministry of Agriculture, Scientific research group “Woodcock”, Moscow, Russia. Email: [email protected] Woodcock is perhaps the only wildfowl species that is weighted not only by professional ornithologists but also by hunters, especially in Western Europe countries. The most important changes in woodcock weight take place during the migration periods when birds quickly accumulate fat for migratory flights. In European Russia, autumn migration takes place from mid-September to the end of October (Figure 1). The aim of this paper is to analyze the Woodcock weight characteristics during an annual cycle. Method Research was carried out on woodcocks captured for ringing in the European part of Russia (Arkhangel’sk, Vologda, Tver, Yaroslavl, Moscow, Vladimir, Kostroma, Smolensk, Perm, Pskov Oblasts) and also in wintering areas (Krasnodar Oblast and
Abkhazia) from 1992 to 2009. Data were analyzed by five-day periods. Results and discussion Distribution of Woodcock weights in autumn is given in Figure 2. Weight appears to increase regularly from the beginning of September to the end of October, and then decreases slowly (n = 1 for 1st decade of November). In November, December and January, the birds have reached their wintering places and have spent most of the fat stored for the migratory flight. A similar pattern is observed in North-West Russia. By the end of October, the mean weight of woodcock ranges from 350 to 400 g (n = 42). Malchenskiy & Pukinskiy (1983) give 270 g as mean weight of woodcocks captured in Spring in the St. Petersburg region (range: 240-290 g; n = 41), and 374 g for those captured in autumn (n = 71). .
Figure 1: Proportion (in %) of woodcocks ringed in European part of Russia from August to November by 5-day periods.
0
2
4
6
8
10
12
14
16
18
20
Aug
ust
Aug
ust
Aug
ust
Aug
ust
Aug
ust
Aug
ust
Sep
tem
ber
Sep
tem
ber
Sep
tem
ber
Sep
tem
ber
Sep
tem
ber
Sep
tem
ber
Oct
ober
Oct
ober
Oct
ober
Oct
ober
Oct
ober
Oct
ober
Nov
embe
r
Nov
embe
r
% r
inge
d w
oodc
ocks
% ringed
woodco
cks

WI/IUCN-WSSG Newsletter n°35 December 2009
19
In France, the weight of woodcocks captured in the North and in highlands is on average higher than that of birds captured along the seaside (Devort, 1977; Fadat, 1995). The mean wintering weights range from 300 to 320 g. Woodcocks with the smallest weights usually winter along the Atlantic and Mediterranean coasts and the birds with the highest weights stay in the inner regions of France. The mean Woodcock weights decrease from North-East to South-West: 330.7 g on average for160 birds captured in North of France, 333.1g for 1,108 woodcocks captured in East of France and 311g for 346 birds captured in South of France. In Italy, the mean weight of woodcocks is estimated at 318 g (n = 1,299) (Spano, 2001).
It was estimated at 302.1g in Marrocco, (n = 2,576; Fraguglione, 1979) and at 316 g in Ireland (Mc Cabe, 1983). In England, according to data collected in the 1945-1947 period, the mean weight of woodcocks is 329 g (Alexander, 1947). In Sweden, the mean weight was estimated at 303 ± 31g and 272 ± 2 g in April in different regions (Marcström, 1974). Woodcock weights calculated during wintering in Western Europe fit with data collected in Krasnodar Oblast (Adler, Khosta, Sochi, Matsesta, Abkhazia) and Abkhazia. The mean weight of woodcocks wintering along the Black Sea winterings is 320 g (range: 245,0 - 385,0 g), i.e. 30 g lower than the mean weight in autumn in Central Russia (350 g) (Table 1).
Every year in Western Europe, the hunters shot woodcocks (perhaps exhausted) weighing slightly more than 250 grams, but they also shot woodcocks / birds weighing more than 400g. In France, in the département of Isere
(Alps) a woodcock (that weighed) weighing 540 g was found in 1983. Six woodcocks with weights above 500 g were found in Italy in 1970 (Ferrand & Gossmann, 1995). .
200
250
300
350
400
450
500
mea
n w
eigh
t (g)
June July Aug. Sept. Oct. Nov. Dec. Jan.
Figure 2: Evolution by decades of mean weight for woodcocks ringed in Central and Northern regions of Russia from end of July to beginning of January. Bars represent the maximum and minimum weight registered for the given period. = periods with n<30.

WI/IUCN-WSSG Newsletter n°35 December 2009
20
Conclusion The Woodcock weight depends mainly on the season The most rapid changes (every day) take place in autumn and spring during the migration periods. The fat reserves vary according to the weather conditions, migration, quality of nocturnal sites,…. The fat layer is an energetic reserve and also a thermal insulator. In autumn, in European Russia, woodcock weight starts to increase in the second decade of September and reaches its peak by the end of October. During the autumn migratory flight to wintering sites, the weight decreases continuously. After arrival at wintering sites, it increases again till mid-December and remains relatively stable till February, except
in case of a cold spell. During the harsh periods, the lack of food can lead to a weight decrease of 40%! On the contrary, during the mild periods, the birds that can easily feed accumulate fat and their weight can sometimes reach more than 400 g. A similar pattern is observed before, during and after the spring migration. During the reproduction period, woodcocks spend most of their energy searching for a mate or raising chicks. As a result, the weight decreases. By the end of mating season, the weight is not higher than 300 g on average and the males’ weight can decrease to 250 g. In summary, the weight of woodcock as a migratory species is very variable along the year.
Acknowledgements I am very grateful to Dr. Yves Ferrand and Dr. Francois Gossmann for the help in Woodcock ringing in Russia owing to long-term conventions between Office national de la chasse et de la faune sauvage (ONCFS) and State informational- analytical center of game animals and environment (SIACGAE). I am also thankful to Dr. Sergei Fokin, chief of the Moscow woodcock group, for his scientific advice.
References Alexander, W.B. 1946. The Woodcock in the British Isles. Ibis 88, 271-286. Devort M. 1977. La Bécasse. Anatomie-Mœurs- Migrations-Essai de différenciation des sexes en Bretagne. Ed. de l’Orée. 135 p. Fadat C. 1995. La Bécasse des bois en hiver. 325 p. Ferrand, Y. & F. Gossmann. 1995. La Becasse des bois. Paris: Hatier, 166 pp. Мальчевский А.С., Пукинский Ю.Б. Птицы Ленинградской области и сопредельных территорий. Т. 1, Л., 1983, с. 337-338 Spano S. 2001. Il Punto sulla Beccaccia. Stato delle conoscenze scientifiche al 2001. Editoriale Olimpia. 182 с.

WI/IUCN-WSSG Newsletter n°35 December 2009
21
NNeewwss ffrroomm………….. FFIINNLLAANNDD Population trends of the Eurasian Woodcock Scolopax rusticola in SW Finland LENNART SAARI , Pitkäniementie 55, FIN-21150 Röölä, Finland Email: [email protected] The population trends and the phenology of the Eurasian Woodcock Scolopax rusticola for the island of Aasla, SW Finland, have been presented earlier in this journal (Saari 2002, 2003). These studies covered the data until the end of the year 2002. Since then there have been observations for an additional seven years until the end of the year 2009, for which I will give a short summary here with some comments on the population trends for the whole 35 year study period of the Woodcock on the island. . Results Night censuses. . The night censuses were continued with three annual counts in May - June in the period 2003 - 2009. There was much annual variation, but the means remained exactly the same for the periods 1979 - 2002 and 1979 - 2009: 27.7 (SD = 6.7; n = 24 and 31, respectively)! Such a stability seems remarkable. . The annual maximum counts for each of the study years are given in Figure 1. The highest number of contacts during one night for the entire study period was recorded in 2009 with
47 contacts in the night between 26 and 27 June from 22: 35 to 03: 24 hrs Finnish summer time (the observation period that night was from 21:32 to 03:37 hrs so the whole activity period of the Woodcock was probably covered), but this was not an "official" census. Other methods for estimating population trends are less accurate than the night bird censuses. However, the sum of the maximum monthly numbers of birds recorded gives some idea about the trends, as the study effort does not affect these figures so much. This being particularly the case for the Woodcock, where the annual numbers recorded are heavily dependent on the numbers of nights spent in the field in the summer months. The Woodcock was especially studied by Perttunen (1979) in 1977 with many summer nights spent out in the field. These data were given in Table 3 by Saari (2003). The respective annual totals for 2003 to 2009 were 70, 76, 63, 54, 96, 76 and 112. The total for 2009 was slightly higher than the previous maximum from the year 1977 (109), when an intensive study of the species was made. This also shows a remarkable stability of the population size.
0
5
10
15
20
25
30
35
40
45
1979
1980
1981
1982
1983
1984
1985
1986
1987
1988
1989
1990
1991
1992
1993
1994
1995
1996
1997
1998
1999
2000
2001
2002
2003
2004
2005
2006
2007
2008
2009
n
Figure 1: Maximum annual count registered during the night censuses at Aasla (Finland) from 1979 to 2009.
WI/IUCN-WSSG Newsletter n°35 December 2009
22
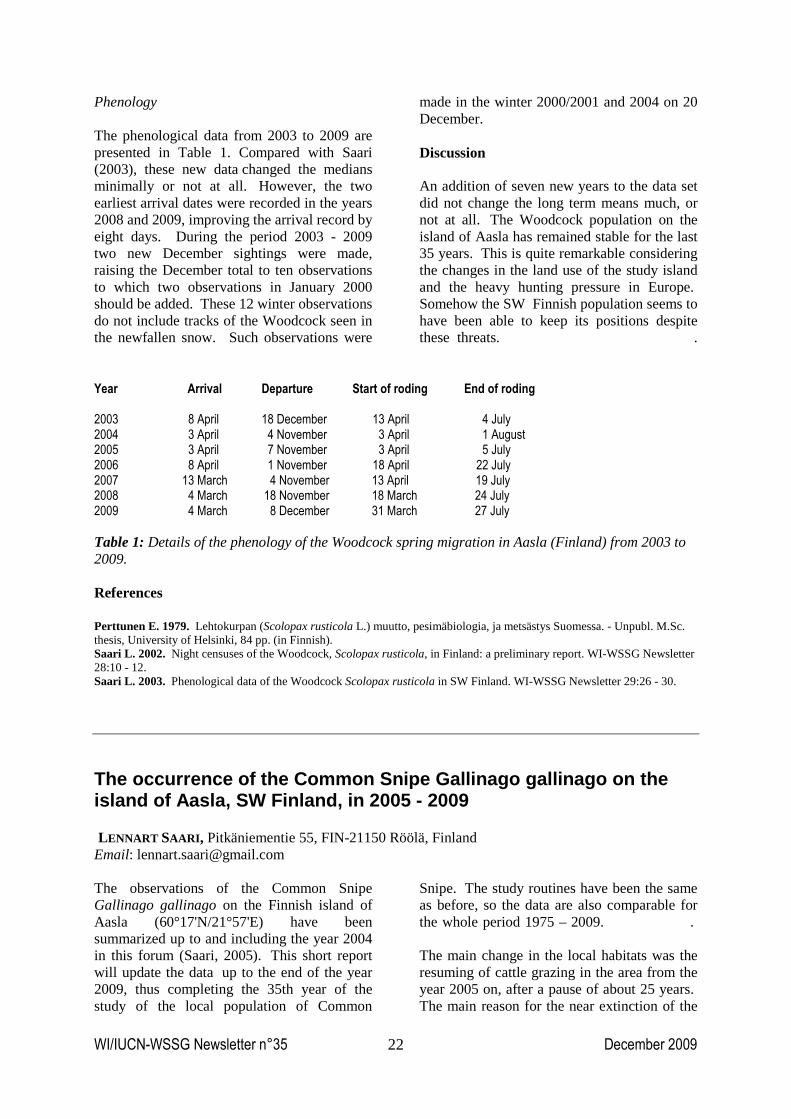
Phenology The phenological data from 2003 to 2009 are presented in Table 1. Compared with Saari (2003), these new data changed the medians minimally or not at all. However, the two earliest arrival dates were recorded in the years 2008 and 2009, improving the arrival record by eight days. During the period 2003 - 2009 two new December sightings were made, raising the December total to ten observations to which two observations in January 2000 should be added. These 12 winter observations do not include tracks of the Woodcock seen in the newfallen snow. Such observations were
made in the winter 2000/2001 and 2004 on 20 December. Discussion An addition of seven new years to the data set did not change the long term means much, or not at all. The Woodcock population on the island of Aasla has remained stable for the last 35 years. This is quite remarkable considering the changes in the land use of the study island and the heavy hunting pressure in Europe. Somehow the SW Finnish population seems to have been able to keep its positions despite these threats. .
Year Arrival Departure Start of roding End of roding 2003 8 April 18 December 13 April 4 July 2004 3 April 4 November 3 April 1 August 2005 3 April 7 November 3 April 5 July 2006 8 April 1 November 18 April 22 July 2007 13 March 4 November 13 April 19 July 2008 4 March 18 November 18 March 24 July 2009 4 March 8 December 31 March 27 July
Table 1: Details of the phenology of the Woodcock spring migration in Aasla (Finland) from 2003 to 2009. References Perttunen E. 1979. Lehtokurpan (Scolopax rusticola L.) muutto, pesimäbiologia, ja metsästys Suomessa. - Unpubl. M.Sc. thesis, University of Helsinki, 84 pp. (in Finnish). Saari L. 2002. Night censuses of the Woodcock, Scolopax rusticola, in Finland: a preliminary report. WI-WSSG Newsletter 28:10 - 12. Saari L. 2003. Phenological data of the Woodcock Scolopax rusticola in SW Finland. WI-WSSG Newsletter 29:26 - 30.
The occurrence of the Common Snipe Gallinago gallinago on the island of Aasla, SW Finland, in 2005 - 2009 LENNART SAARI , Pitkäniementie 55, FIN-21150 Röölä, Finland Email: [email protected] The observations of the Common Snipe Gallinago gallinago on the Finnish island of Aasla (60°17'N/21°57'E) have been summarized up to and including the year 2004 in this forum (Saari, 2005). This short report will update the data up to the end of the year 2009, thus completing the 35th year of the study of the local population of Common
Snipe. The study routines have been the same as before, so the data are also comparable for the whole period 1975 – 2009. . The main change in the local habitats was the resuming of cattle grazing in the area from the year 2005 on, after a pause of about 25 years. The main reason for the near extinction of the

WI/IUCN-WSSG Newsletter n°35 December 2009
23
local population of Common Snipes was presumably the cessation of grazing. Resumed cattle grazing on the shore meadows of the island has considerably changed the landscape at the main breeding site of the Common Snipe on Aasla since 2005. This raises the question of whether the Common Snipe has been able to increase its local population in the area due to these habitat changes. . Results The phenological data for the period 2005 - 2009 are presented in Table 1. . The arrival dates were slightly earlier than those for the period 1975 - 2004. The earliest arrival date for the entire study period was 22
March 2008, improving the record with five days. The median arrival rate for fhe whole period 1975 - 2009 was pushed forward by one day to 8 April. The departure was also slightly later, including a postponement of the last date by one day to 2 January 2009. The median date of the autumn departure did not change, being still 31 October. . The drumming period was shorter than in 1975 - 2004, probably due to the lack of birds. In altogether five years there was a long gap in the records, starting in early May and ending about mid-June. The period between the dates given below have been snipeless in the 2000's:1 May - 15 June 2001, 1 May - 18 June 2003, 2 May - 14 June 2005, 1 May - 5 June 2007 and 10 May - 27 June 2009. .
Year Arrival Departure First drumming Last drumming 2005 6 April 5 November 28 April (28 April) 2006 13 April 4 November 13 April 13 June 2007 13 April 18 October (5 June) 23 June 2008 22 March 2 January 29 April (7 May) 2009 2 April 18 October 14 April 1 July
Table 1: Details of the Common Snipe spring migration phenology in Aasla (Finland) from 2005 to 2009.The dates in brackets are probably unrepresentative due to a small number of observations of snipes. Period Territories Line-transect Night censuses Number of individuals
1975 - 1979 27.8 (10.0) (10.0) 268.2 1980 - 1984 35.6 9.6 6.8 386.0 1985 - 1989 27.0 5.8 8.6 169.2 1990 - 1994 9.6 1.6 2.0 82.6 1995 - 1999 7.6 1.0 1.4 88.4 2000 - 2004 3.2 0 1.0 42.6 2005 - 2009 2.4 0.4 0.4 146.6
Table 2: Annual means of the number of Common Snipe according different census methods in Aasla (Finland) by 5 years-periods from 1975 to 2009.Line transects started in 1976 and night bird censuses in 1979; thus the means are for les than five years and the numbers are put in brackets. A total absence of snipe records between these dates is not due to a lack of field work; on the contrary this is the period of the year with the most intensive field work. These birds are interpreted as newcomers at Aasla, that come to establish territories and arrive long after the "real" spring migrants have migrated further.
The number of Common Snipes according to different census methods are given in Table 2 for five year periods as annual means. The number of territories in 2005 - 2009 was 2 -3, and both in the line-transects and night censuses, one bird was recorded in two of these years. These figures show that the
WI/IUCN-WSSG Newsletter n°35 December 2009
24
numbers still remain very low. The number of territories is now only about 7% of what it was at its maximum. Only when considering the total number of individuals recorded (expressed as bird-days) have some recoveries been recorded, but these birds were mostly seen during the migratory periods. Of the total of 149 birds seen in 2005, 140 were seen in the August - November period (among these, 70 in August and 59 in September). The August total was the second best on the record for the entire study period and that of September was the highest monthly total for the whole study period. The summer 2005 was dry until the heavy rains set in August which made the shore meadows ideal for the Snipe. . In 2009 the number of Snipes recorded in April was reasonably high (136 individuals). It was the highest total since 1983 (and ranked on the shared fourth place for the whole study period). This was probably due to the relatively slow advance of spring, but in May the numbers dropped to the recent customary low levels. .
Discussion The beginning of cattle grazing has not yet affected the number of Common Snipes. However, since 2005 there has been one autumn and one spring with high numbers of Snipes. This may indicate that in the future the number of breeding pairs may increase again. It is possible that the breeding population fell to such a low level that recovery is difficult as there is virtually no recruitment in the nearby areas. Summer migration has not been previously noticed in the Common Snipe, at least according to my knowledge. Here I interpret the result as evidence that new birds arrive and occupy territories usually in late June. Could it be that these birds have bred somewhere else previously? A shift of the breeding grounds during the same breeding season is known in a few Finnish bird species. This kind of movement is not usually detected if the breeding population is high and the newcomers just mix with the rest of the breeders.
References Saari L. 2005. Population trends of the Common Snipe Gallinago gallinago on the southwestern Finnish island of Aasla. WI- WSSG Newsletter 31: 15 - 19.
Swinhoe's Snipe Gallinago megala recorded in Finland LENNART SAARI , Pitkäniementie 55, FIN-21150 Röölä, Finland Email: [email protected] One of the rarest birds observed in Finland is the Swinhoe's Snipe Gallinago megala. This species has an extremely large range. Its population trend is not known, but the status of this species is evaluated as "Least Concern". It is strongly migratory and it breeds in scattered pairs from May to August. It forages singly or in dispersed flocks. The species is crepuscular and nocturnal in its foraging activities (BirdLife International 2009). . The species was observed at Tohmajärvi, Värtsilä, Niirala about one km from the Finnish/Russian border (62°10'N/30°37'E) between 13 June and 6 July 2008. The observation is accepted by the Finnish National Rarities Committee (see Lehikoinen et al.
2009). Details of the observation with pictures are given by e.g. Kivivuori 2008, Kivivuori et al. 2008 (in English), and Velmala 2008. Actually this bird was probably observed already on 3 June, possibly already on 11 May, but these observations were not sufficiently well described to be officially accepted. This was the second confirmed observation in the West Palearctic, the first one having been made in northern Urals in June 2002 at 67°08'N/ 65°00'E 1707 km from Niirala. From there it is still another 800 km to the nearest suspected breeding grounds near the city of Batov (60°25'N/69°50'E), which is situated 2080 km from Niirala. To the nearest confirmed breeding site close to Novosbirsk

WI/IUCN-WSSG Newsletter n°35 December 2009
25
(56°30'N/78°00'E) is still another 640 km (Kivivuori 2008). The observation from Israel in February - March 1998 has not been duly accepted. The Niirala bird was seen by an estimated 1500 bird watchers. From abroad, observers
(“tickers”) of this species were confirmed at least in Sweden, Norway, Denmark, Estonia, Latvia, Germany, the Netherlands, Belgium, the UK, France, Spain and Russia. Kivivuori et al. 2008 give a detailed description of the plumage, behaviour and voice of this individual.
References BirdLife International. 2009. Species factsheet: Gallinago megala. Downloaded from http://www.birdlife.org on 4/12/2009. Kivivuori H. 2008. Siperiankurppa Värtsilässä - uusi laji Suomelle. Siipirikko 4/2008: 15 - 20 (in Finnish). Kivivuori H., Lehikoinen A., Lehikoinen P. & A. Lindén. 2008. Swinhoe's Snipe at Tohmajärvi in summer 2008. Alula 14(3): 124 - 131. Lehikoinen A., Aalto T., Nikander P.J., Normaja J., Rauste V. & W. Velmala. 2009. Rare birds in Finland in 2008. The Yearbook of the Linnut magazine 2008: 90 - 103 (in Finnish with an English summary). Velmala W. 2008. Superkurppa Siperiasta. Linnut 43(3): 40 - 41 (in Finnish).
Swinhoe’s snipe Gallinago megala photographed in Punggol grasslands, Singapore, in 2005 by Paul Huang © (Source: www.mangoverde.com)

WI/IUCN-WSSG Newsletter n°35 December 2009
26
NNeewwss ffrroomm………….. GGRREEAATT--BBRRIITTAAIINN
Towards an understanding of the origins and ecology of Woodcock wintering in Britain and Ireland
ADELE POWELL , Edward Grey Institute, Department of Zoology, South Parks Road, Oxford OX1 3PS and Game & Wildlife Conservation Trust, Burgate Manor, Fordingbridge, Hampshire, SP6 1EF - Email: [email protected] There is still much to be learnt on the migration and winter ecology of the Eurasian woodcock Scolopax rusticola and here I outline the aims of my DPhil study and some preliminary results from the first field season. My study has two main aims: (1) to better determine the origins of migrant woodcock wintering in Britain and Ireland and (2) to compare the behaviour and habitat use of residents and migrants using the same wintering site. Origins of Woodcock wintering in Britain & Ireland Over the winter, the resident woodcock populations of Britain, Ireland, France, northern Italy and northern Spain are supplemented by a huge influx of migrants. These birds arrive from Scandinavia, Finland, the Baltic States and Russia, which constitute the main breeding grounds of the woodcock (over 90% of the European population occurs in these regions; Hagemeijer & Blair 1997) and may account for in excess of 85% of the birds wintering in Britain and Ireland (Hoodless & Coulson 1994). Information on the origins of birds wintering in Britain and Ireland, however, is based on just a small number of foreign ring recoveries (389 since 1909). Whilst ring recovery data provide vital information on bird movements, they are dependent on the number of birds ringed and recovered. The use of intrinsic markers, such as naturally occurring stable isotopes of common elements in animal tissues, offers an alternative approach (Inger & Bearhop 2008). Stable-isotope analysis enables the hatching or moulting location of a bird to be estimated from the chemical composition of its feathers. Although the resolution of the technique is limited to several degrees of latitude and longitude, it has the considerable advantage
over ringing that birds do not need to be marked and subsequently recovered, but that any bird can provide a sample. My aim is to use stable-isotope analysis to determine the relative proportions of foreign- and British-bred woodcock present in mid-winter and to determine whether the foreign migrants present in a given wintering location have few (high connectivity) or multiple (low connectivity) migratory origins. The results from a sample of 392 woodcock shot in Britain and Ireland during December and January, stratified by winter, region and age are presented. The winter of 2004/05 was selected because it represented a mild winter (December and January temperatures above average across most of Britain). 2008/09 was selected for comparison because it represented a cold winter, with an unusually cold spell lasting 11 days in early January. Isotopes of carbon and nitrogen were of little value in determining the breeding ground of woodcock samples. Hydrogen isotope values showed good correspondence with known geographical patterns in rainwater. It is now apparent that accurate ageing of woodcock is important to aid the correct interpretation of hydrogen isotope values. Cluster analysis yielded three statistically significant groups of hydrogen isotope values for juvenile and adult woodcock, equating to three broad breeding areas. Initial results suggest that approximately 17% of woodcock shot in Britain and Ireland were British breeders, 51% were from Russia and the Baltic states and 32% were from Fennoscandia. The relative proportions of woodcock from these three breeding areas varied across five wintering regions (SE Scotland, W Ireland, Wales, Norfolk, Cornwall). The data suggest that woodcock from Russia and Belarus travel to Britain across a broad front, because each of

WI/IUCN-WSSG Newsletter n°35 December 2009
27
the five wintering regions sampled had a broadly similar proportion of Russian birds. However, Scandinavian birds appear more restricted to the north and west, with a lower proportion reaching Norfolk or Cornwall. This is in agreement with our understanding from ring recoveries that birds from Norway and Sweden pass through Scotland on route to Ireland. These patterns should currently be interpreted with caution because the sample sizes are still small when broken down by wintering region and breeding area. The processing of more samples should help with clarifying the patterns. The lack of any major difference between the cold and mild winters, for instance, was surprising. The fact that statistical analysis showed this effect to be close to significance suggests that sample sizes may have been too small and that further data should reveal a clearer picture. Data on woodcock abundance is being collected as this too is important in providing an insight into differences in woodcock movements between regions and winters. Abundance data in conjunction with better-refined estimates of breeding origin will be important in estimating regional wintering abundance of woodcock from different breeding grounds. Winter behaviour of Woodcock in Hampshire, UK Recent studies by Duriez et al. (2005a,b) on a largely pastoral study area have greatly
improved our understanding of the foraging behaviour and spatial habitat use of woodcock in winter. However, further work is required to examine the applicability of these findings to other situations. I am working on a study area of c.38 km², composed predominantly of undulating arable farmland. Cattle- and sheep-grazed pastures comprise just 14% of the study area. There is one principal block of woodland (c.8 km²), but several smaller woods interspersed throughout the area, including small copses of wet woodland in a river valley. The area supports a good breeding population of woodcock as well being frequented by migrants in winter. My aim is to undertake a radio-tracking programme to compare the habitat use and foraging behaviour of resident and migrant woodcock during the winter. Woodcock density on the study area, estimated from spot-lamp counts, peaked at 10-12 birds/km² pasture during the third week of January 2009. Very few birds were seen on arable fields. Twenty-two woodcock were radio-tagged during the winter and tracked for periods of 9-173 days. They did not fly to fields every night and there was evidence of individual differences in behaviour patterns between birds. Half of them remained in woodland for at least one night, with three birds spending at least a third of their nights in woodland (Figure 1). Woodcock typically flew less than 1.5 km when leaving woodland for fields at night, but one bird travelled over 3 km. When frequenting fields, birds appeared to preferentially seek out meadows or pastures as opposed to arable fields. .
0
10
20
30
40
50
60
70
246 255 265 285 307 317 327 336 346 538 635 701 783 797 819 847 897 907 917 918 937 949 Bird (tag frequency)
% o
f nig
hts
in w
oodl
and
Figure 1: Percentage of nights on which woodcock were found residing in woodland over the study period.

WI/IUCN-WSSG Newsletter n°35 December 2009
28
Some of the radio-tagged woodcock had small home ranges and were very faithful to the same field at night and the same woodland stand during the day for many consecutive days, whereas others ranged over many fields on different nights. During a cold spell of 11 days continuous freezing conditions in early January 2009, the majority of birds initially exhibited minor changes in their behaviour and only shifted their daytime locations short distances. By the end of the cold spell, however, eight of the ten birds active at the time had left the study area for at least one day and one was
gone for 18 days. All birds returned to the study area when milder weather returned. Stable-isotope analysis of feather samples taken during capture will be used to determine the origin of each bird and should enable comparisons of resident and migrant behaviour. My hypothesis is that resident woodcock should have better spatial knowledge of food-rich patches than migrants and hence be able to satisfy their daily energy requirements more quickly. Consequently, they should (1) have smaller home ranges, (2) fly to fields less often and (3) experience lower predation than migrants. .
Acknowledgements The study is funded by the Countryside Alliance Foundation, Natural Environment Research Council and the Game & Wildlife Conservation Trust. Dr Andrew Hoodless gave advice and fitted the radio-tags. I am grateful to the many hunters who supplied feather samples. Hugo Straker, Gerald Gray, David Clark, Owen Williams, Colin Trotman, Peter Bickford-Smith and Larry Taafe were particularly helpful in organizing wing collections. Dr Jason Newton (SUERC) and Dr Steve Brooks (Iso-Analytical Ltd) provided advice on stable isotope analysis and the interpretation of results. Many thanks Mr R. Wills, Mrs B. Kunzl-Tacchi, Lord Camden, Mr J. Gavett and their staff for facilitating the radio-tracking on their estates. References Duriez O., Fritz H., Binet F., Tremblay Y. & Y. Ferrand. 2005a. Individual activity rates in wintering Eurasian woodcocks: starvation versus predation risk trade-off? Animal Behaviour 69: 39-49. Duriez O., Ferrand Y., Binet F., Corda, E., Gossmann F. & H. Fritz. 2005b. Habitat selection of the Eurasian woodcock in winter in relation to earthworm availability. Biological Conservation 122: 479-490. Hagemeijer W.J.M. & M.J. Blair. 1997. The EBCC Atlas of European Breeding Birds: Their Distribution and Abundance. T. & A.D. Poyser, London. Hoodless A.N. & J.C. Coulson. 1994. Survival rates and movements of British and Continental woodcock Scolopax rusticola in the British Isles. Bird Study 41: 48-60. Inger R. & S. Bearhop. 2008. Applications of stable isotope analyses to avian ecology. Ibis 150: 447-461.
A study of age ratios on two Woodcock sites in West Wales OWEN WILLIAMS , The Woodcock Network, Pantamlwg, Trefenter, Aberystwyth, Ceredigion, SY234HJ, UK - Email: [email protected] Until the formation of the Woodcock Network in 2007 woodcock ringing in the UK has been restricted to specific research projects run by Dr Andrew Hoodless of the Game and Wildlife Conservation Trust. Generally UK bird ringers have tended to concentrate on species that are caught by traditional mist netting techniques so only the occasional woodcock was ringed by this method. This along with the fact that woodcock are highly elusive by nature has
meant that they have been under-represented as a ringed species in the UK. Methods Over the past two winters the Woodcock Network has expanded its activities using spot-lamping techniques with 84 birds ringed in 2007/08 and 363 in 2008/09. This is still a small number of birds ringed compared with

WI/IUCN-WSSG Newsletter n°35 December 2009
29
other countries such as France which has a well established woodcock ringing scheme but it is anticipated that we will increase our level of activity over the next few years as we recruit and train more ringers throughout the British Isles.
Despite a limited database of birds ringed there have been some interesting observations made over the past two seasons on sites where there have already been a concentrated ringing effort.
Figure 1: Aerial view of study sites in West Wales. Areas bordered by black are feeding fields, areas bordered by grey are understood to be the roosting areas for each site. Site A. is situated about the 6.5 km from the coast of Cardigan Bay at the western end of a large open valley that runs WNW from the Cambrian Mountain plateau over a distance of 30 km. The valley near to the site has good pastures on the valley floor with abundant mixed woodland on the slopes on both sides. The high ground above the valley is about 100 m above the valley floor. The ground on the site constitutes semi-improved pastures on sloping fields grazed by sheep and cattle. The roost location for woodcock feeding on these fields is unclear, but it is suspected that this is a band of mixed woodland that runs along the south face of the valley just below the site. Site B. lies 1.2 Km to the southwest of site A. and is situated above a small tributary valley of the main valley near to site A. This small valley has steep wooded sides with dense groundcover. Woodcock have been observed flighting at dusk from this valley onto the adjacent fields where ringing on this site has taken place.

WI/IUCN-WSSG Newsletter n°35 December 2009
30
Study area West Wales is an area with little or no breeding woodcock, but a high concentration of wintering birds. Over the winter of 2008/09 ringing efforts were concentrated on two sites that are within 1km of each other (Figure 1) Hunting of woodcock in the area can be described as light. Between the two sites is a small pheasant shoot with woodland holding few woodcock due to the general day to day disturbance involved in running a shoot. On studying the data from each site we observed a difference in the ratio of adult to juvenile birds caught. Results. Permission was only obtained to work on Site B at the end of the winter of 2008/09 and so only 16 birds were ringed there between February and mid March. However it was noticed that unlike Site A, this site had a high proportion of adults [94 % (1/15) vs 40 % (22/56)]. Over the first six weeks of the winter of 2009/10 Site B again had a high level of adults [79 % (11/14)]. Although this was not as marked as in 2008/09 it is appreciably different to Site A [53 % (10/19)]. In October and early November of 2009 it was noticed that there was a higher than normal number of adults arriving in the first wave of migrants [58 % (14/24) from data collected in several sites in West Wales]. This phenomenon was also noted in France (Y. Ferrand, pers. com.).
Discussion It has to be understood that the samples on these sites are small, but the observation of a trend for considerably more adults than juveniles caught and ringed on Site B over two seasons suggests that this is unlikely to be just a ‘statistical anomaly’. Further study is needed before we can draw any firm conclusions about why this is happening, but it is interesting to try and explore possible explanations.
It is possible to conclude from the data gathered so far that there may be a degree of site selection occurring amongst adult woodcock in favour of Site B. Shooting pressure is known to distort adult to juvenile ratios, however this is unlikely to be the case here as the shooting pressure is the same on both sites. Also shooting would have the effect of increasing the ratio in favour of juveniles and not the opposite, which is observed on Site B. One explanation may lie in the topographical differences between the two sites. The long valley directly to the NNE of Site A is a likely migration corridor, at its upper reaches it is surrounded by upland with rough grazing and little cover or suitable pastures for woodcock. However, on arrival lower down the valley it would be clear that Site A offers an excellent roosting area in the mixed woodland on the SSW face of the valley, along with ample feeding fields within a very short distance on the wide grassy ridge above. Site B. in contrast, is hidden from the main valley and it is likely would only be discovered by accident as a result of birds moving randomly around the area. It is likely that adults with previous experience of the area would head for Site B on arrival as it offers the better shelter of a narrow valley. It is interesting to note that the adult : juvenile ratio on Site B on Sites A and B 2009/10 were closer than in the previous year. Adult birds clearly arrived earlier in this part of Wales in autumn 2009 and it could be possible that some juveniles arriving in the area after migration in autumn 2009 followed the adults straight to Site B thus distorting the ratio. Much more work is required on these two sites before we can draw any firm conclusions about what is happening here. However, it is apparent that adult : juvenile ratios seem to vary each autumn and between sites that are very close together. It would be interesting to hear from others who may have made similar observations, to try and gain a clearer understanding of this phenomenon. .

WI/IUCN-WSSG Newsletter n°35 December 2009
31
NNeewwss ffrroomm………….. SSWWIITTZZEERRLLAANNDD An example of roding site fidelity in a Woodcock ma le BLAISE MULHAUSER & JEAN-LOU ZIMMERMANN , Muséum d’histoire naturelle, Neuchâtel Terreaux 14, CH-2000 Neuchâtel, Suisse Email: [email protected] We studied Woodcock male behaviour at a same roding site during 8 years by using different methods (ringing, call recording and photographs). A systematic call registration allowed us to identify the birds (Mulhauser & Zimmermann, 2006) and monitor them during several years in their breeding site (Mulhauser & Zimmermann, 2009). This paper presents a remarkable fidelity of a male to its roding area during 6 consecutive years. Methods Data were collected from 2002 to 2009 in a 8 km-square roding area in the canton of Neuchâtel (Jura, Switzerland; central point: 46°55’ N, 6°28’ E). The data collection spread from 1st April to 15 July, mainly in the evening (95 % of cases).
Calls were recorded with a Nagra ARES-M digital recorder and a Sennheiser ME66 super-cardioidal microphone and a Sonosax SX-BD1 amplifier. The objective was to record all vocal contacts with woodcocks that were flying over the recording site. The limit for the validation of a contact (at least one recorded call sequence) was not the human ear but the recorder and microphone sensitivity . Windy and rainy weather was avoided since under these conditions the record is disturbed. Additional data were collected by videos and photographs taken with a digital camera equipped with a telephoto lens and a cobra flash to emphasize individual characteristics (twisted bill, missing finger, coloured arrangement of tail feathers,…).
Figure 1 : Sonogram of woodcock call and variables used for analysis (cf. text). A) total call B) whistle call (“tsit”).
A
B

WI/IUCN-WSSG Newsletter n°35 December 2009
32
Figure 3: Individual characteristics of Crocus sonogram with 5 croak calls and a total call duration above 3,500 milliseconds. Acoustic analysis was made with Bastound 3.0 software. The complete male call is consists of repeated croak calls (“cro”) and a whistle call (“tsit”; Figure 1). Five variables were measured : A: number of “cro” units between 2 whistle calls; B: duration between 2 “tsit” at 5 kHz, i.e. the total duration of a sequence silent intervals + calls (in ms); C: duration of silence interval between “tsit” and the first “cro” at 5 kHz (in ms); D: duration of the whole “cro” at 5 kHz (in ms); E: duration between the upslope and downslope of “tsit” at 4.5 kHz (in ms). In order to ascertain the individual call stability, 3 woodcocks were caught, ringed and radio-equiped (Biotrack transmitter) in 2005. Ringing was finally valuable for the study owing to the reflection of the ring when using
a flashlight for photographs (Figure 2). However, the most important condition to monitor a bird was the record of its call just before the capture. This was the case for Crocus, a male that we were able to recognise from year to year (Figure 3). Results Different components of a woodcock call are not only stable over a season but from one season to another as shown by the vocalization control of Crocus from 2005 to 2009 . During the 5 recording years, several variables remained sufficiently stable to allow us to identify this bird definitely: variation was only of 3.64 % for B and 4.99 % for E. These two variables are usually considered as the most discriminant for woodcock individual identification ((Ferrand, 1989 ; Hoodless et al. 2008 ; Mulhauser & Zimmermann, 2009).
Figure 2: Photograph of Crocus. Owing to use of flashlight, the ring is very visible like white marks on tail feathers which form a colour code for the bird during some months.
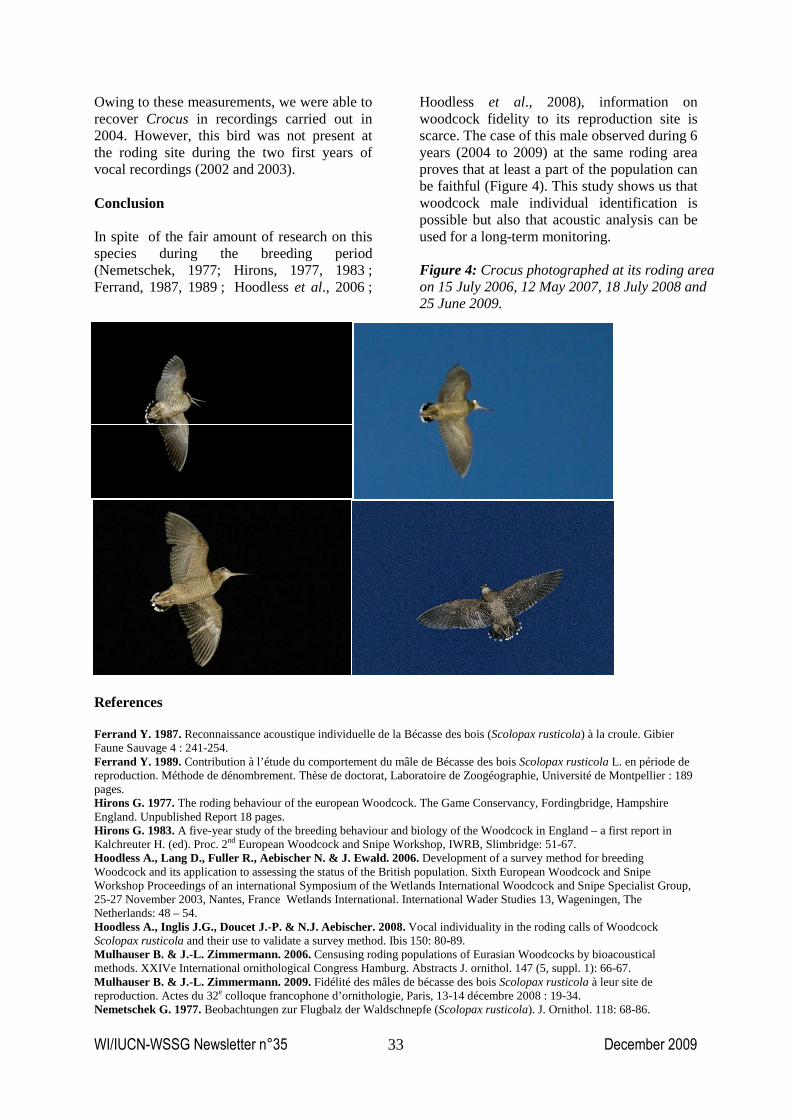
WI/IUCN-WSSG Newsletter n°35 December 2009
33
Owing to these measurements, we were able to recover Crocus in recordings carried out in 2004. However, this bird was not present at the roding site during the two first years of vocal recordings (2002 and 2003). Conclusion In spite of the fair amount of research on this species during the breeding period (Nemetschek, 1977; Hirons, 1977, 1983 ; Ferrand, 1987, 1989 ; Hoodless et al., 2006 ;
Hoodless et al., 2008), information on woodcock fidelity to its reproduction site is scarce. The case of this male observed during 6 years (2004 to 2009) at the same roding area proves that at least a part of the population can be faithful (Figure 4). This study shows us that woodcock male individual identification is possible but also that acoustic analysis can be used for a long-term monitoring.
References Ferrand Y. 1987. Reconnaissance acoustique individuelle de la Bécasse des bois (Scolopax rusticola) à la croule. Gibier Faune Sauvage 4 : 241-254. Ferrand Y. 1989. Contribution à l’étude du comportement du mâle de Bécasse des bois Scolopax rusticola L. en période de reproduction. Méthode de dénombrement. Thèse de doctorat, Laboratoire de Zoogéographie, Université de Montpellier : 189 pages. Hirons G. 1977. The roding behaviour of the european Woodcock. The Game Conservancy, Fordingbridge, Hampshire England. Unpublished Report 18 pages. Hirons G. 1983. A five-year study of the breeding behaviour and biology of the Woodcock in England – a first report in Kalchreuter H. (ed). Proc. 2nd European Woodcock and Snipe Workshop, IWRB, Slimbridge: 51-67. Hoodless A., Lang D., Fuller R., Aebischer N. & J. Ewald. 2006. Development of a survey method for breeding Woodcock and its application to assessing the status of the British population. Sixth European Woodcock and Snipe Workshop Proceedings of an international Symposium of the Wetlands International Woodcock and Snipe Specialist Group, 25-27 November 2003, Nantes, France Wetlands International. International Wader Studies 13, Wageningen, The Netherlands: 48 – 54. Hoodless A., Inglis J.G., Doucet J.-P. & N.J. Aebischer. 2008. Vocal individuality in the roding calls of Woodcock Scolopax rusticola and their use to validate a survey method. Ibis 150: 80-89. Mulhauser B. & J.-L. Zimmermann. 2006. Censusing roding populations of Eurasian Woodcocks by bioacoustical methods. XXIVe International ornithological Congress Hamburg. Abstracts J. ornithol. 147 (5, suppl. 1): 66-67. Mulhauser B. & J.-L. Zimmermann. 2009. Fidélité des mâles de bécasse des bois Scolopax rusticola à leur site de reproduction. Actes du 32e colloque francophone d’ornithologie, Paris, 13-14 décembre 2008 : 19-34. Nemetschek G. 1977. Beobachtungen zur Flugbalz der Waldschnepfe (Scolopax rusticola). J. Ornithol. 118: 68-86.
Figure 4: Crocus photographed at its roding area on 15 July 2006, 12 May 2007, 18 July 2008 and 25 June 2009.

WI/IUCN-WSSG Newsletter n°35 December 2009
34
NNeewwss ffrroomm………….. FFRRAANNCCEE 2008-2009 French Woodcock report FRANÇOIS GOSSMANN, CLAUDINE BASTAT , MICHEL GUÉNÉZAN , Office National de la Chasse et de la Faune Sauvage, Research Department – Migratory Birds Unit, 39 Bd Albert Einstein, CS 42355, F -44323 Nantes Cedex 3 E-mail: [email protected] YVES FERRAND, Office National de la Chasse et de la Faune Sauvage, Research Department – Migratory Birds Unit, BP 20, F -78612 Le Perray-en-Yvelines Cedex E-mail: [email protected] The 2008/09 season was first characterized by a delay in autumn migration and then high Woodcock numbers during Winter. The delay was mainly due to mild weather conditions in Russia and Central Europe in October and November. Indeed, first frosts were registered in these regions in the first decade of November whereas they usually occur around 20 September. Consequently, the birds were not in a hurry to reach their French wintering sites where heavy rains in November provided suitable wintering conditions for birds. However, the major event was a cold spell during the first half of January which forced a large part of woodcocks to move to the Channel-Atlantic regions. Ringing results Quantitative ringing results In total, 6,223 woodcocks were ringed in France during the 2008-09 wintering season
(Figure 1). This is again a record ! The success rate was slightly lower than in the previous season (26 % vs 29 %). However, the field work time was more important (6,673 hours, i.e. 10 % more than in 2007/08). About 25 300 woodcocks were found by the ringers. Of course, this explains the high number of ringed birds. Moreover, due to heavy rains everywhere in France no regions were avoided by woodcocks in winter. Owing to a great effort during the cold spell, the number of captures was maintained at a high level, especially in the coastal départements. Proportion of juveniles The proportion of juveniles among ringed birds was 63 % ( 59% in 2007/08). This value is the second highest during the last 10 seasons. Added to high abundance (cf. IAN and ICA), this likely reflects a good reproduction success in 2008. .
0
1000
2000
3000
4000
5000
6000
7000
83-
84
84-
85
85-
86
86-
87
87-
88
88-
89
89-
90
90-
91
91-
92
92-
93
93-
94
94-
95
95-
96
96-
97
97-
98
98-
99
99-
00
00-
01
01-
02
02-
03
03-
04
04-
05
05-
06
06-
07
07-
08
08-
09
n
Figure 1: Inter-annual fluctuations of ringing results.

WI/IUCN-WSSG Newsletter n°35 December 2009
35
Monitoring of abundance during the migratory and wintering period Two indices allow the monitoring of Woodcock migratory and wintering numbers in France: the mean number of contacts/hour (IAN) registered during ringing trips and a hunting index [ICA : number of seen woodcocks / standardised hunting trip (duration = 3.5 hours)] collected by the Club national des bécassiers. In 2008-09, IAN was estimated from more than 25,300 contacts recorded during 6,673 hours and ICA from a sample of 1,167 hunters and slightly more than 32,600 hunting trips. For this season, IAN amounts to 3.92 and ICA to 1.64 (Figure 2). These values are the highest ever registered. Woodcock were particularly abundant in North and Centre of France. Such abundance strengthens the increase trend observed since the mid-1990’s. As for the last
season, tests were made for the 1996/97 – 2008/09 period for ICA and for the 2002/03 – 2008/09 for IAN and ICA due to change in the data collection for IAN (cf. Newsletter 34). ICA clearly increased during the last 13 hunting seasons (p = 0.011). Of course this increase is also observed for ICA and IAN as from 2002/03. Remember that stability is characteristic of the 1996/97 – 2001/02 period. Consequently, migrants and wintering woodcocks in France are in a good “demographic health” for the study period. High abundance noticed for the whole of the 2008/09 season appears to be monthly distributed (Figure 3). As soon as November, the mean values are high compared with previous values. In December and January, IAN is clearly above the values of the previous seasons. Owing to a cold spell, IAN decreases in February but recovers a high value in March.
The cold spell in January was a major event in 2008/09. It lasted from end December to mid-January. The whole of France was concerned except the South-East. A usual, many woodcocks flew away to Channel-Atlantic regions and there IAN reached very high values (5 – 9.1). A special protocol (called “Cold spell protocol”) was launched on 6 January to monitor the woodcock movements during this harsh period. It consists of censuses in inner
and coastal reference sites. In addition, unusual behaviour of birds is recorded (abnormal concentrations, observation in the daytime, short flight distance,…). Information bulletins are published every 3 days to take stock of the situation and propose special regulations (usually a temporary suspension of shooting). Two special bulletins have been published in January. Hunting ban was implemented in 57 French départements for 10 days in average.
1,50
1,70
1,90
2,10
2,30
2,50
2,70
2,90
3,10
3,30
3,50
3,70
3,90
4,10
1996-97
1997-98
1998-99
1999-00
2000-01
2001-02
2002-03
2003-04
2004-05
2005-06
2006-07
2007-08
2008-09
IA
0,5
0,7
0,9
1,1
1,3
1,5
1,7
1,9
IAN
ICA
Figure 2: Annual fluctuations of the number of contacts/h during ringing trips (IAN: nocturnal index of abundance) and hunting trips (ICA: hunting index of abundance; Source: Club national des bécassiers).Data have been divided into two periods due to a change in the method of calculation of IAN in 2002/03(see Newsletter 34).
IAN
ICA

WI/IUCN-WSSG Newsletter n°35 December 2009
36
Roding results In 2008, roding censuses took place in 57 départements and 892 listening points were visited. National occupation rate This rate corresponds to the % of listening points at which at least one roding male was observed (= positive site). In 2009, the value was 22.4 %. This is lower than the value registered in 2007 and 2008. The high abundance sites (n.contacts ≥ 5) follows the same trend: 9.1 % in 2007, 8.7 % in 2008 and 6.6 % in 2009.
Breeding population trend The trend of the French breeding Woodcock population has been analysed for the last 10-year period. In total, 50 départements censused roding woodcocks without interruption from 2000 to 2009. The trend is more or less stable for the proportion of positive sites (p = 0.053) but clearly stable for the proportion of high abundance sites (p = 0.919). If we look at the results of the last nine 10 year-periods available in our data set, it seems that a new general trend is beginning for breeding woodcocks in France in Spring 2009 (Figure 4). Since the end of the 1990’s, a probable increase was observed. Stability of
0
0,5
1
1,5
2
2,5
3
3,5
4
4,5
5
October November December January February March
IAN
moy 03-04
moy 04-05
moy 05-06
moy 06-07
moy 07-08
moy 08-09
IAN
Figure 3: Monthly fluctuations of IAN from 2003/04 to 2008/09.
2008-2009 ringing season in numbers N. départements : 88 N. ringing sites : 1,509 N. ringers : 360 N. nocturnal trips (hours) : 3,128 (6,673) N. contacts : 25,332 N. ringed woodcocks : 6,223 Success rate : 26 % N. direct retraps : 151 N. indirect retraps : 220 N. direct recoveries: 351 N. indirect recoveries: 550
Annual direct recovery rate: 5.6 %
Again in the 2008/09 season, Woodcock migratory and wintering numbers were monitored in the course of the season. Data were collected every 10 days by electronic mail. In total, information collected in this way represents 79% of the final field work time and 81.5 % of the ringed Woodcock. This allowed us to have a realistic idea of the situation in the course of the season owing to values (IAN, age-ratio) very close to the final ones. Moreover, the analysis of ICA, also estimated in the course of the season by the Club national des bécassiers,supports IAN results. Three bulletins and 4 short reports have been published from November to February.

WI/IUCN-WSSG Newsletter n°35 December 2009
37
both proportion of positive sites and high abundance sites stops the process. It still remains to be known whether this stability
will be lasting , or if we are on the brink of a drop in numbers. .
Conclusion Woodcock monitoring in France shows that this species is overall not endangered in the Western Palearctic. The high numbers of wintering woodcock show that the breeding success was good in 2009. This also means that the surface area of potential breeding habitats in the core of the breeding area (Russia,
Scandinavia, Central Europe) does not decline. On the contrary, they could be enlarged owing to deagriculturization which favours the emergence of suitable habitats. Of course, the present monitoring is restricted to one country but the recent increase of interest for Woodcock monitoring in Great Britain, Ireland and Spain is a very good news for the wintering surveys. .
Acknowledgments
0,15
0,17
0,19
0,21
0,23
0,25
0,27
0,29
0,3119
92
1993
1994
1995
1996
1997
1998
1999
2000
2001
2002
2003
2004
2005
2006
2007
2008
2009
% s
ites
1992-011993-021994-031995-041996-051997-061998-071999-082000-09
0,15
0,20
0,25
0,30
0,35
0,40
1992
1993
1994
1995
1996
1997
1998
1999
2000
2001
2002
2003
2004
2005
2006
2007
2008
2009
% s
ites
forte
abo
ndan
ce /
site
s po
sitif
s
1992-011993-021994-031995-041996-051997-061998-071999-082000-09
This report is the result of an important field work carried out by members of the ONCFS/FNC Woodcock network. We thank all of them : professionals of ONCFS, Fédérations départementales des chasseurs and volunteers. We also thank the Club national des bécassiers for allowing us to use the data collected by Club members.
Figure 4: Inter-annual variations of the proportion of positive sites and high abundance sites/positive sites for the 9 available 10 year-periods.
% p
osi
tive
sit
es
% h
igh
ab
un
dan
ce s
ites
/ p
osi
tive
sit
es

WI/IUCN-WSSG Newsletter n°35 December 2009
38
Evaluation of the 2008/09 Woodcock hunting season i n France JEAN-PAUL BOIDOT , Club national des bécassiers, Le Moulin du Buis, Beg Aël, 29940 La Forêt-Fouesnant, France - E-mail: [email protected] This report is the 15th to be published by the Club national des bécassiers (CNB; a French Woodcock Hunter Association). As the previous ones, it is based on information collected during hunting trips (mainly number of seen and shot woodcocks) and on a wing collection. In 2008/09, 1,167 CNB members sent information on their hunting trips and 1,241 participated in the wing collection. In total, 10,151 wings were analysed, 9,356 birds were weighted and 2,130 were sexed. The data were collected in the major part of the Woodcock wintering area in France (Figure 1). Hunting index of abundance (ICA) The hunting index of abundance (ICA) used by CNB has been defined as the number of different woodcocks seen during a hunting trip, the standardised duration of which was 3.5 hours (Cau & Boidot, 2005)
In 2008/089, ICA was estimated from 32,613 hunting trips. Its national annual value is 1.64. This value is high and corresponds to an excellent hunting season (cf. Ferrand & Gossmann in this issue) all the more because hunting was banned during 10 days in January in 55 départements owing to a cold spell. The monthly variations of ICA (Figure 2) show that the values are above the average of those obtained in the last 12 years. The peak observed in January is unusual but linked to the cold spell which led the birds to be concentrated in the main French Woodcock hunting area (départements along the Atlantic coast). In spite of a monthly hunting time overall shorter than in 2007/08, the monthly hunting bags are slightly higher than for the previous hunting season in December, January and February (Figure 3). From all the data, we can consider that, in 2008/09, a “mean” French Woodcock hunter made 28 hunting trips, saw 46 woodcocks and shot 11 of them. .
Number of wings 0 1-100 101-250 >250
Figure 1: Distribution of the number of Woodcock wings collected in every French département during the 2008/09 survey.
Ratio juvenile/adult For 2008/09, the proportion of juveniles in the French Woodcock hunting bags is estimated at 68.7 %. This value is rather high and corresponds very likely to a good reproduction success in Spring 2008. Ratio male/female In 2008/09, the proportion of Woodcock males in the CNB members hunting bags was 39 %. This value, extraordinarily stable, is exactly the same as in the last 3 previous seasons. Variations in weight The mean weight of a woodcock shot in 2008/09 was 316 g as in 2007/08. As usual, the weight of females was slightly higher than that of males (317 g vs 313 g).

WI/IUCN-WSSG Newsletter n°35 December 2009
39
Adult females were the heaviest, 320 g in average. The mean weights of juvenile females and adult males were 316 g and 317 g, respectively. The mean weight of juvenile males reached 311 g. From the 2nd decade of December to the 1st decade of January, the mean weights decreased due to weather conditions which made the detection of earthworms harder. During this period, females lost 20 g in average. Conclusion According to the data collected by CNB members, a slight delay in 2008 autumn
migration and a large distribution of woodcocks all over the country in November and December can be noticed. As shown by ICA values , important numbers arrived in France from November to January. In summary, the 2008/09 Woodcock hunting season was excellent with rather high bird numbers due to a good reproduction success and to a cold spell which forced a part of the population (particularly adults) to move to South and West. Woodcock bag limits set in a large part of France probably contributed to having a sustainable total bag. .
Acknowledgements We thank all volunteers who contributed to help us in wing analysis and also the members of CNB scientific and technical commissions or reports writers: J.C. Blanchard, G. Aurousseau, A. Mesplède, R. Fulchic, J.M. Desbieys, J.F. Cau, N. Lefeuvre and J.P. Lepetit.
0,00
0,50
1,00
1,50
2,00
2,50
sept. oct. nov. dec. jan. feb.
ICA
average 1996/97 - 2007/08
2008-09
0
5000
10000
15000
20000
25000
30000
35000
40000
45000
50000
55000
60000
65000
70000
75000
80000
oct. nov. dec. jan. feb.
n
0
5
10
15
20
25
30
35
40
45
%
2007/08
2008/09
2007/08
2008/09
Figure 2: ICA monthly variations in France for the 2008/09 hunting season and average for the 1996/97 - 2007/08 period.
Figure 3: Monthly distribution of the number of hunting trips hours (in bars) and of the hunting bag ratio (in lines) for the 2007/08 and 2008/09 hunting seasons.

WI/IUCN-WSSG Newsletter n°35 December 2009
40
Evaluation of the 2008/09 Woodcock hunting season in Europe from FANBPO members reports JEAN-PAUL BOIDOT , FANBPO & Club national des bécassiers, Le Moulin du Buis, Beg Aël, 29940 La Forêt-Fouesnant, France - E-mail: [email protected] GÉRARD AUROUSSEAU, FANBPO & Club national des bécassiers, Villa Kiluma, 771 Chemin de Fontmerle, 06250 Mougins, France The aim of the Federation of European Woodcock Hunters Associations (FANBPO) is to collect information on Woodcock, Woodcock hunting and Woodcock hunters in Europe in order to achieve a monitoring and a sustainable use of the Woodcock populations at the scale of the Western Palearctic. Eleven national or regional associations belong to this Federation:
- the Club national des bécassiers ( CNB) in France,
- the Club de cazadores de becada ( CCB) in Spain,
- the National Woodcock association of Ireland ( NWAOI),
- the Welsh Woodcock club (WWC) in Wales,
- the Club della Beccaccia (CDB) in Italy,
- Amici di Scolopax (ADS) in Italy, - Beccacciæ,di Italia (BDI) in Italy,
- the Club des bécassiers de Hongrie (CBH) in Hungary,
- l'Association suisse des bécassiers (ASB),
- the Club des bécassiers de Grèce (BDG) in Grece,
- the Association nationale des chasseurs de bécasses (ANCG) in Portugal.
Every year wing collections are organised by these associations in their respective countries. In 2008/09, about 15,000 woodcock wings have been collected in France, Spain, Ireland, Italy and Switzerland. No samples are available for Hungary due to the Spring hunting ban in 2009. The proportions of juveniles and of juveniles with a complete moult of coverts and alula in Irish, Spanish, French, Italian and Swiss woodcock hunting bags are presented in the table below. .
Country % juveniles % juveniles with a complete coverts and alula moult / juveniles
sample size
Ireland 56 - 1,407
Spain 62 22 773
France 69 18 9,657
Italy 70 26 2,496
Switzerland 79 41 612
Ireland and Switzerland appear to be the two most distant countries in terms of proportion of age-ratio in the 2008/09 Woodcock hunting bag. The proportion of juveniles with a complete moult is particularly high in Switzerland compared with other countries.
Of course, we need further research to correctly interpret these results. In addition, collected data show that about 70 % of the Swiss Woodcock hunting bag was made from 10 October to 10 November in 2008/09.
Acknowledgments We thank N. Lefeuvre (CNB), J.P. Lepetit (CNB), A. Tedeschi (ADS), S. Spano (CDB), P. Pennacchini (BDI), P. Leresche (ASB), F. Diez (CCB), L. Taaffe (NWAOI) and D. Fluck (CBH) for their help in data collection needed for this report.

WI/IUCN-WSSG Newsletter n°35 December 2009
41
2008-2009 French Snipes report GILLES LERAY , Office National de la Chasse et de la Faune Sauvage, Research Department – Migratory Birds Unit, 39 Bd Albert Einstein, CS 42355, F -44323 Nantes Cedex 3 E-mail: [email protected] PATRICE FÉVRIER , Club international des chasseurs de bécassines, 5 avenue des Chasseurs, F-75017 Paris Web site: http://www.cicb-club.com YVES FERRAND, Office national de la chasse et de la faune sauvage, Research Department – Migratory Birds Unit, BP 20, F -78612 Le Perray-en-Yvelines Cedex E-mail: [email protected] Ringing results The French Snipes ONCFS/FNC network gathers 127 snipe ringers spread over 46 French départements. In total, 1,743 snipes were ringed in 2008 by the network: 1,534 common snipes (Gallinago gallinago) and 209 jack snipes (Lymnocryptes minimus). Plumage collection In addition to ringing , an analysis of Common Snipe and Jack Snipe plumage (wing and/or tail feathers) collected during the 2008/09 season was carried out to improve our knowledge on the fluctuations of the proportion of juveniles in the shooting bag and to get information on the phenology of migration. In total, the plumage of 4,027 Common Snipes and 1,026 Jack Snipes were gathered mainly by the CICB (International Club of Snipes Hunters) members and by the Fédérations départementales des chasseurs of Cantal, Lozère and Gironde. Common Snipe Geographical distribution of analyzed plumage As in the last year, data collected in 2008/09 were analysed after dividing the total sample into two parts corresponding to two flyways: a Fennoscandian one and a continental one (Rouxel, 2000; Figure 1). The sizes of each sample are close (1,935 plumage for the
Fennoscandian flyway, 2,092 plumage for the continental flyway), which validates this approach. Temporal distribution of analyzed plumage Under the same assumption as in the preceding report (i.e. the number of collected plumage (ncp) is positively correlated with real numbers), the post-nuptial migration took place between mid-September and mid-November following a similar pattern to that of the previous season : a progressive arrival of birds, stability of numbers, then a progressive decrease (Figure 2). Migration of the Fennoscandian flyway started in mid-August and numbers increased regularly till they reached a clear peak in the second half of September (Figure 3). Then a constant decrease was observed till the beginning of February. A different pattern is noticed for the continental flyway: a sudden arrival of birds in the second half of September, stability of numbers and then a sudden decrease in the second half of November. Proportion of juveniles For the whole collected plumage, the proportion of juveniles amounts to 68.0 % (age-ratio = 2.1). If we do not take August into account (as recommended by Devort, 1997), the proportion of juveniles is 65.7 % (age-ratio = 1.9). These values appear clearly below the average estimated since the mid-1980’s (74.4% for all data; 72.0% for data without August; Figure 4). .

WI/IUCN-WSSG Newsletter n°35 December 2009
42
Figure 1: Geographical distribution of numbers of Common Snipes whose plumage was collected in 2008/09 and limit between the two sub-samples corresponding to a distinct migratory flyway.
Figure 2: Temporal distribution (per 15 day-period) of collected plumage and of the proportion of juveniles for the whole Common Snipe sample.
11-100
1- 10
101-200
201-300
301-400
401-500
> 500
0
100
200
300
400
500
600
700
800
900
1-15/8 16-31/8 1-15/9 16-30/9 1-15/10 16-31/10 1-15/11 16-30/11 1-15/12 16-31/12 1-15/1 16-31/1 1-15/2
n
0
10
20
30
40
50
60
70
80
90
100
%
n. plumages
% juveniles

WI/IUCN-WSSG Newsletter n°35 December 2009
43
Fennoscandian flyway
0
50
100
150
200
250
300
350
400
450
1-15
/8
16-3
1/8
1-15
/9
16-3
0/9
1-15
/10
16-3
1/10
1-15
/11
16-3
0/11
1-15
/12
16-3
1/12
1-15
/1
16-3
1/1
1-15
/2
n
0
10
20
30
40
50
60
70
80
90
100
%
n. plumages
% juveniles
Continental flyway
0
50
100
150
200
250
300
350
400
450
500
1-15
/8
16-3
1/8
1-15
/9
16-3
0/9
1-15
/10
16-3
1/10
1-15
/11
16-3
0/11
1-15
/12
16-3
1/12
1-15
/1
16-3
1/1
1-15
/2
n
0
10
20
30
40
50
60
70
80
90
%
n. plumages
% juveniles
Figure 3: Temporal distribution (per 15 day-period) of collected plumage and of the proportion of juveniles for Common Snipe in each flyway. Juveniles represent 72.3% of birds in the Fennoscandian flyway and 64.2% in the continental flyway. In contrast to the last season, juveniles are less numerous in the continental flyway. The difference is statistically significant for the whole data set [Fisher exact test (p < 0.0001)] and for data without August (p < 0.01). As in every season, the proportion of juveniles follows a progressive decrease trend during the season (Figure 2). Remember that several factors (hunting pressure, weather conditions, annual productivity) can play a role in the proportion of juveniles in hunting bags, making its
interpretation difficult. However, with less than 70 % of juveniles, we think that the breeding success in 2008 was worse than usual. An analysis of the weather conditions at the scale of Europe shows that cold temperatures in May (first layings) were probably the cause of this bad success. Proportion of males/females Sex was defined for 1,049 adult birds and the proportion of males was 29.2 %. If we take into account all birds (juveniles + adults) for which sex determination was possible (n = 3,367), the proportion of males reached 35.4

WI/IUCN-WSSG Newsletter n°35 December 2009
44
%. In 2008/09, deficit in males appears still more pronounced than usual (for adults: 38 % in 2006/07, 35.6 % in 2007/08). The proportion of males (juveniles + adults) was very close for both flyways (Fisher exact
test; p = 0.857).However, this similarity is less clear if we take only adults into account: males seem to be more numerous in the Fennoscandian flyway (p = 0.580).
Jack Snipe Geographical distribution of analysed plumage In 2007/08, Jack Snipe plumage were collected in 34 départements in France. As for the last season, we defined two sub-samples: one for the “coastal flyway” and one for the “inland flyway” (Figure 5). 471 plumage were collected for the “coastal flyway” and 555 for the “inland flyway”. Temporal distribution of analysed plumage Under the same assumptions as for Common Snipe data analysis, the pattern of 2008 migration was very similar to that of the previous seasons: a peak in the second half of October after a fast increase in numbers in the beginning of the season. However, the decrease of numbers in the first half of
December was more pronounced (Figure 6). As opposed to 2007/08, it seems that arrival of birds was simultaneous in both flyways (Figure 7). Proportion of juveniles Age determination in Jack Snipe can be made by examination of tail feathers (Devort et al., submitted). In 2008/09, the proportion of juveniles amounted to 60.2 %. This value is the second lowest since the mid-90’s (52.6 % in 2005/06). The proportion of juveniles was 52.7 % for the “coastal flyway” and 67 % for the “inland flyway”. The difference is significant [Fisher exact test (p < 0.0001)]. Again, the temporal distribution of the proportion of juveniles appeared to be relatively stable over the course of the season for the whole data [Cochran-Armitage test (p = 0.099); Figure 8)]. .
0
10
20
30
40
50
60
70
80
90
100
1986
/87
1987
/88
1988
/89
1989
/90
1990
/91
1991
/92
1992
/93
1993
/94
1994
/95
1995
/96
1996
/97
1997
/98
1998
/99
1999
/00
2000
/01
2001
/02
2002
/03
2003
/04
2004
/05
2005
/06
2006
/07
2007
/08
2008
/09
% ju
veni
les
all data
without August data
Figure 4: Inter-annual variations of the proportion of juveniles among Common Snipe plumage collected in the 1986/87 - 2008/09 period for all data and for a sub-sample without August data (No collection in 1999/00 - 2003/04 period).
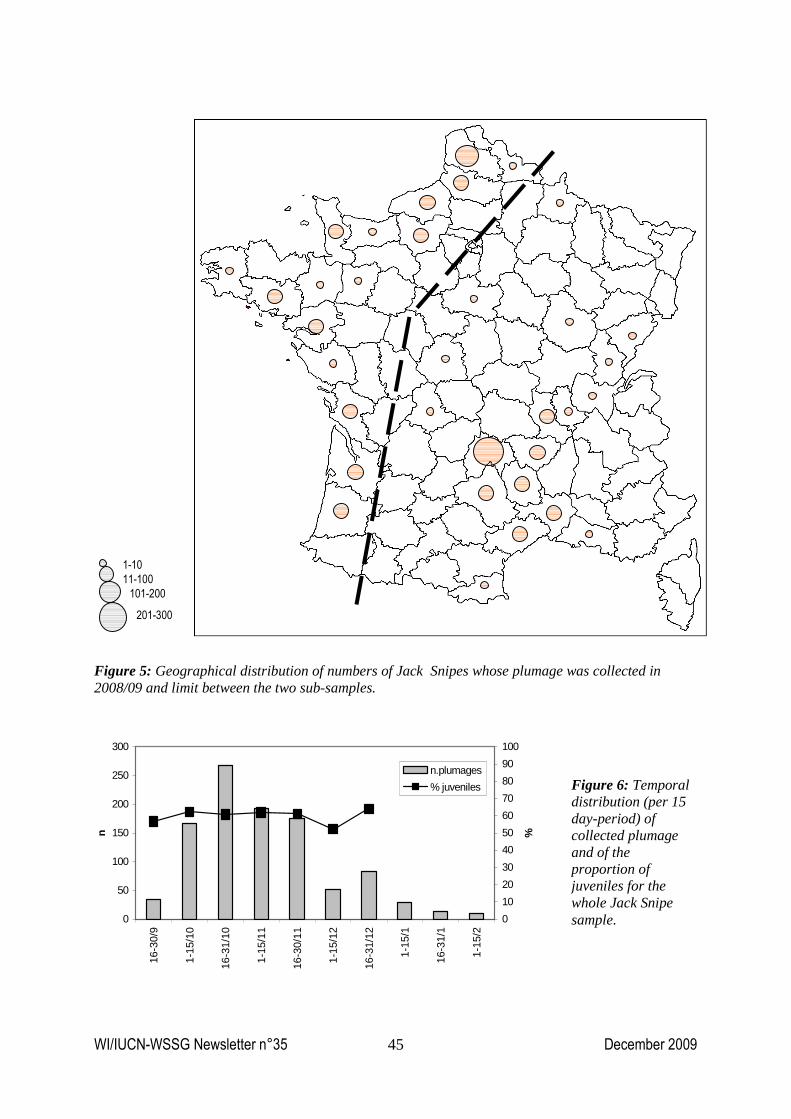
WI/IUCN-WSSG Newsletter n°35 December 2009
45
Figure 5: Geographical distribution of numbers of Jack Snipes whose plumage was collected in 2008/09 and limit between the two sub-samples.
101-200
1-10
201-300
11-100
0
50
100
150
200
250
300
16-3
0/9
1-15
/10
16-3
1/10
1-15
/11
16-3
0/11
1-15
/12
16-3
1/12
1-15
/1
16-3
1/1
1-15
/2
n
0
10
20
30
40
50
60
70
80
90
100
%
n.plumages
% juveniles Figure 6: Temporal distribution (per 15 day-period) of collected plumage and of the proportion of juveniles for the whole Jack Snipe sample.

WI/IUCN-WSSG Newsletter n°35 December 2009
46
« Coastal flyway »
0
20
40
60
80
100
120
16-3
0/9
1-15
/10
16-3
1/10
1-15
/11
16-3
0/11
1-15
/12
16-3
1/12
1-15
/1
16-3
1/1
1-15
/2
n
0
10
20
30
40
50
60
70
80
90
100
%
n. plumages
% juveniles
« Inland flyway»
0
20
40
60
80
100
120
140
160
180
16-3
0/9
1-15
/10
16-3
1/10
1-15
/11
16-3
0/11
1-15
/12
16-3
1/12
1-15
/1
16-3
1/1
1-15
/2
n
0
10
20
30
40
50
60
70
80
90
100
%
n. plumages
% juveniles
Figure 7: Temporal distribution (per 15 day-period) of collected plumage and of the proportion of juveniles for Jack Snipe in each “flyway”.
0
10
20
30
40
50
60
70
80
90
1993
-94
1994
-95
1995
-96
1996
-97
1997
-98
1998
-99
1999
-00
2000
-01
2001
-02
2002
-03
2003
-04
2004
-05
2005
-06
2006
-07
2007
-08
2008
-09
% ju
véni
les Figure 8: Inter-annual
variations of the proportion of juveniles in Jack Snipe plumage collected during the 1993/94 - 2008/09 period (No collection in 2002/03 and 2003/04 ).

WI/IUCN-WSSG Newsletter n°35 December 2009
47
Monitoring of hunting bags The inter-annual evolution of hunting bags is one of the tools for the monitoring of game populations. For species such as the snipes, which mainly concern specialist hunters, an estimation based on a sample of hunting territories (reference territories) is probably the most appropriate. But the problem is to keep the same sample of territories with similar habitat conditions as long as possible. Indeed, the interest of the method lies in its longevity
because the long-term trend is more significant than the absolute values. We know that the quality of territories is not equivalent from one to another. In other terms, they are not interchangeable. A missing territory in the network inevitably entails to a reduction of the initial sample. CICB has such a network mainly located in the north-west of France (Figure 9). Till 2007/08, this network was made up of 28 territories. In 2008/09, the number is reduced to 27. Details of hunting bags are shown in Table 1. .
The annual mean total hunting bag in the 27 sites amounts to slightly more than 4,600 common snipes and close to 1,100 jack snipes. The mean snipe hunting bag per site can work as an annual index of abundance (Figure 10). For Common Snipe, the 2008/09 value (159.7) is clearly below in the average for the 8 previous seasons (173.3). Inter-annual variations are rather large but no trend can be defined for the last 9 years (Page test; p = 0.967). For Jack Snipe, the 2008/09 value is also rather low (31.7) compared with the average for the last 8 seasons (41). No trend can be defined since 200/01 (Page test; p = 0.457). The Common Snipe/Jack Snipe ratio is always remarkably constant (Figure 11). In 2008/09, the Common Snipe represents 83.4 % of the total Snipe hunting bag. Average for the
2000/01 – 2008/09 period is 81.1 % (74.1 % - 84.4 %). Conclusion 2008/09 is characterized by Snipe numbers below those of the previous seasons. Two indicators lead to this statement: a less successful wing collection and mean hunting bags on reference territories under the average for the 2000’s. Moreover, the assumption of a bad reproduction success is supported by age-ratios which are the lowest ever registered since the beginning of the monitoring. Of course, this is the result of a single season which does not question the conservation status of these species that can be considered as not endangered. .
Figure 9 : Localisation of 27 reference sites for the monitoring of hunting bags during the 2000/01 - 2087/09 period.
Season Common
Snipe Jack Snipe Total
2000/01 4 003 738 4 741 2001/02 3 783 1 324 5 107 2002/03 4 373 1 036 5 409 2003/04 5 309 1 431 6 740 2004/05 5 718 1 220 6 938 2005/06 5 578 1 283 6 861 2006/07 4 090 953 5 043 2007/08 4 575 865 5 440 2008/09 4 311 855 5 166 Mean and total 4 637.8 1 078.3 51 445
Table 1: Detail of hunting bags per season for 27 reference sites.

WI/IUCN-WSSG Newsletter n°35 December 2009
48
Acknowledgments This report is the result of an important field work carried out by members of CICB and by the ONCFS/FNC Snipes network. We thank all of them : volunteers, Fédérations départementales des chasseurs and professionals of ONCFS. References Devort M. 1997. La Bécassine des marais. Eléments pour un plan d’action. CICB & OMPO, Paris & Confluences, Bordeaux, France ; 103 p. Rouxel,R. 2000. Les bécassines du paléarctique occidental. Publ. OMPO. Ed. Eveil Nature, Saint-Yriex-sur-Charente, France. 304 p.
30
40
50
60
70
80
90
100
2000/01 2001/02 2002/03 2003/04 2004/05 2005/06 2006/07 2007/08 2008/09
% C
omm
on S
nipe
0
50
100
150
200
250
2000/01 2001/02 2002/03 2003/04 2004/05 2005/06 2006/07 2007/08 2008/09
mea
n hu
ntin
g ba
g/ s
ite (
Com
mon
Sni
pe)
0
10
20
30
40
50
60
mea
n hu
ntin
g ba
g/si
te (
Jack
Sni
pe)
Common Snipe
Jack Snipe
Figure 10: Average of Common Snipe and Jack Snipe hunting bags for a reference site for the 2000/01 - 2008/09 period.
Figure 11: Proportion of Common Snipe in total Snipe hunting bag (Common Snipe + Jack Snipe) collected on 27 reference sites from 2000/01 to 2008/09.

WI/IUCN-WSSG Newsletter n°35 December 2009
49
Does early peak in Jack Snipes Lymnocryptes minimus on postnuptial migration correlate with breeding succe ss? GUY-NOËL OLIVIER , Migratory Birds of the Western Palearctic (OMPO), 5 Avenue des chasseurs, F-75017 Paris E-mail: [email protected] We will not be working here on isolated Jack Snipes we observed in August on our field laboratory located in Northern France, département of Pas-de-Calais and mentioned in the Monograph: The Jack Snipe edited by OMPO/CICB in 2008. However, let us here remind when exactly it occurred: 23 August 1964, 10 August 1978, 22 August 1986, 22 August 2005, 1 August 2006, 21 August 2009. Here, we shall just consider postnuptial migration of the Jack Snipe which occurs in Northern France in October and finishes around the 10th of November. Earlier peaks of migration that sometimes occur in mid-September are rather rare but have occurred in 1986, 1991, 1996, 2003, 2005 and 2009. We call a peak of early postnuptial migration when we observe 5 birds or more the same day at the same place. Thus, we correlated these peaks of early postnuptial migration in these years with breeding success and/or night temperatures in North-eastwards located countries, to determine the effect of these variables.
- In year 1986, we do not think that it could be correlated with breeding success since, during autumn we observed only 40 Jack Snipes, which is exceptionally low.
- In year 1991, we observed 120 Jack Snipes, which is more or less an average number.
- In year 1996, we observed 130 birds during this period, still an average number.
- In year 2003, we observed 420 Jack Snipes, which is very exceptional.
- In year 2005, the number of flushed birds was 240, which is good, considering that it is double the average number (130-140 birds).
- For year 2009, we flushed 8 Jack Snipes on 16th September (with a tractor pulling a mowing machine in places that had been worked 4 times before and needing cleaning) . It has to be noted that the next day, on 17th September, they were all gone after 14 hours spent resting and refuelling.
- From 16th to 26th September, when this note was written, only 3 single birds were observed. Thus, we shall have to wait until mid-November to draw a conclusion for this early peak of postnuptial migration of Jack Snipes.
Conclusions The question was whether early peaks of Jack Snipes on postnuptial migration could be correlated with breeding success. We honestly did not find an answer to this question. If we consider years 1991, 1996, 2003, 2005, the answer would be positive but year 1986 contradicts it. Since 1959, the year when we started to count the Jack Snipes, we flushed on our field laboratory according to the same protocol, i.e. counting them on the same managed wetland, three days a week, always in the afternoon. This leaves a gap of four days a week, which is significant for such a quick migrant and that we must take into account. Besides, if we look at our observation book, we see that years without an early peak of postnuptial migration in mid-September could also mean a good breeding season. We refer to year 1990 and year 1997 when 265 and 270 birds were counted, respectively. The causes of these early postnuptial migrations seem to have as starting point the sudden decrease in temperature in some breeding territories of North-eastern Europe, i.e. a sudden change in the night isotherm, as mentioned by several authors.

WI/IUCN-WSSG Newsletter n°35 December 2009
50
Observation of repeated attacks of a Snipe Gallinago gallinago by a Falcon Falco sp.. Comparison with the techniques of another predator: the Marsh-Harrier Circus aeruginosus GUY-NOËL OLIVIER , Migratory Birds of the Western Palearctic (OMPO), 5 Avenue des chasseurs, F-75017 Paris E-mail: [email protected] The 21st of August 2009, we eye witnessed several attacks on a Snipe by a Falcon. We are not sure which species of Falcon precisely we were in presence of, as we faced the sun. We have strong presumption that is was a Merlin Falco columbarius. At 11 A.M., driving our special marsh tractor, we were crossing a wheat stubble field situated at about 400 meters of the wetlands where we had management works to do. Suddenly our attention was attracted by two birds turning around the tractor at a close distance of about 10 meters. Wild birds are confident with tractors, they do not assimilate them to predation and in this case we think that the first bird, a Snipe, came close for protection. The strategy of defence of the Snipe was to circle around the tractor at a height not exceeding the stubble. The strategy of attack of the Falcon was to gain height, about 10 meters of altitude and then, in a semi-vertical swoop down at full speed, it tried to seize its prey. We saw it missing the Snipe three times, probably due to the fact that Gallinago was permanently circling at such low altitude (20 cm) skimming low over the stubble so that the Falcon had to stop its swoop beforehand. The two birds moved away so we do not know how it ended. What is certain is that the Snipe never changed strategy and its flight attitude was accurate. If it had got to an altitude of only one meter higher, it would not have had the slightest chance to escape. The technique used by the Marsh-Harrier Circus aeruginosus, another avian predator of
Snipes, is different as we often witness their presence in the reed beds where we manage places for Gallinago gallinago as well as for Lymnocryptes minimus. We have never observed a Marsh-Harrier alone catching a Snipe. On the other hand, one bird belonging to this species of predators causes havoc in broods of young Grey Partridges Perdix perdix and Common Pheasants Phasianus colchicus. Many times, we approached very closely Marsh-Harriers eating young Partridges whose strategy of defence is not as accurate as the Snipes’one. With Snipes it seems to be different. A Marsh-Harrier chasing alone frightens more the snipes who are alerted by the escape call of the first bird flushed and in less than three minutes all snipes are gone, except those resting in vegetation of 20 or 30 centimetres height who crouch down, motionless and invisible. We never witnessed a Snipe caught by a single Marsh-Harrier. But if Marsh-Harriers chase by pairs, it is different: one skims over the ground or the reeds trying to flush a Snipe, the second flies at about 25 meters of altitude and precedes its partner by about 30 meters. If a more confident Snipe, most of the time a juvenile bird, is flushed, the Marsh-Harrier in altitude swoops upon this prey and grabs it. We make this observation nearly every year during post-nuptial migration. Has any member of the group made similar observations on avian predation outside the breeding season? I would be most interested to know.

WI/IUCN-WSSG Newsletter n°35 December 2009
51
NNeewwss ffrroomm………….. IITTAALLYY Is South Piedmont in Italy an adult Woodcock reserv oir ? SILVIO SPANO, Club della Beccaccia-Italia, Via Flora 4-16146 Genova Email: [email protected] In Italian Piedmont, surrounded by the Alps and opened to East by the plain of Po, the Woodcock hunting bag is estimated at 20,000 every year. This is similar to those of the regions nearby. An analysis of these bags shows that Italian Piedmont could be an adult reservoir. From 1988 to 2007, the average age-ratio (proportion of juveniles) was 59.5 % then, in South Italy, this age-ratio was 71.6 % (1976-1999). In the last hunting seasons, the proportion of juveniles was usually low : 59 % in 1999, 43.1 % in 2000, 55.8 % in 200, 46 % in 2002, 54.3 % in 2003, 67 % in 2006, 51 % in 2007 and 61.4 % in 2008. Moreover, Piedmont can be separated into 2 sub-regions : North (Torino, Biella, Novara and Verbania provinces) and South (Cuneo, Asti and Alessandria provinces). In the North region, the proportion of juveniles was 79.6 % (n = 63) in 2004, 71.6 % (n = 81) in 2007 and 73.1 % (n = 83) in 2008. In the South region,
for the same year, the proportion of juveniles was respectively estimated at 85.7 % (n = 35; 62 % in Alessandria province), 51 % [n = 853 (regional inquiry); 55.3 % (n = 85; our data)] and 56.5 % (n = 46). A high proportion of adults characterises a stable and well structured Woodcock population submitted to a low hunting pressure. Adults are faithful to their wintering sites and it is likely that they have a higher reproduction success than juveniles. A high proportion of juveniles does not necessarily mean a population in a good health. It can also be the consequence of a too high mortality, which requires a high reproductive effort for juvenile breeders, probably less successful than adults. Consequently, preservation of adults seems to be important. The hunting law enforced in the Piedmont region is possibly more conservative than that in other regions as suggested by the high number of wintering woodcocks. .

WI/IUCN-WSSG Newsletter n°35 December 2009
52
NNeewwss ffrroomm………….. PPOORRTTUUGGAALL Woodcock monitoring in Azores (Portugal) DAVID GONÇALVES , CIBIO - Centro de Investigação em Biodiversidade e Recursos Genéticos, Campus Agrário de Vairão, Rua Padre Armando Quintas, 4485-661 Vairão, Portugal; Departamento de Biologia, Faculdade de Ciências, Universidade do Porto, Rua Campo Alegre, s/n, 4169-07 Porto, Portugal Email: [email protected] MANUEL LEITÃO JOÃO LUÍS PACHECO , Serviço Florestal de Ponta Delgada, Rua do Contador, nº 23, 9500-050, Ponta Delgada, Azores, Portugal ANDRÉ JESUS, Serviço Florestal do Nordeste; Rua do Poceirão s/n, 9630-171 Nordeste, Azores, Portugal JAIME PONTE, Serviço Florestal do Pico, Estrada Regional nº 62 - Cais do Pico, 9940-334 S. Roque do Pico, Azores, Portugal JOSÉ SEQUEIRA , Serviço Florestal das Flores e do Corvo, Rua Senador André de Freitas, 8, 9970-337 St.ª Cruz das Flores The Eurasian woodcock (Scolopax rusticola) is a resident breeding species in the Azores archipelago (Portugal), located in the North Atlantic Ocean (Godman 1870; Hartert & Ogilvie-Grant 1905; Chavigny & Mayaud 1932; Bannerman & Bannerman 1966). There it is also an important game species. During the last nine years, with the support from the regional hunting administration (Direcção Regional dos Recursos Florestais), we conducted a study on the natural history and ecology of this species. As part of this project annual surveys were implemented on three islands (Pico, since 2001; S. Miguel, since 2003; Flores, since 2007). Among the three, S. Miguel is the only island where woodcock hunting has not been allowed for several decades. The annual survey is based primarily on counts of roding birds at dusk during March-April (breeding abundance). From Pico island, since 2002, we also have records provided by local hunters (hunting season: October-November). Monitoring of breeding abundance (roding censuses) We followed the survey protocol described by Ferrand (1989, 1993). Observations took place at dusk, in the evening exhibition (roding) period. The most adequate period for monitoring woodcock populations in Azores by roding censuses is between March and April (Machado et al. 2006, 2008b). Therefore, during the roding period, at fixed observation
points, the number of contacts with roding birds was registered along March-April. At S. Miguel, previous work (developed in 2004; Machado et al. 2008a) showed a discontinuous woodcock distribution on the island; after 2004, observation points for annual survey were located according to it (Figure 1); each observation point was visited once. At Pico, the work carried out between 2001 and 2003 (Machado et al. 2002, Machado et al. 2006) showed that woodcock is distributed along the island; after 2003, annual roding censuses was performed visiting six observation points (Figure 1). Each point was visited once or twice ; in the last case only the highest value of contacts was considered for analysis. At Flores monitoring started in 2007, using four observation points located in favourable habitat for the woodcocks (Figure 1); each observation point was visited once. The annual variation in the number of contacts with roding birds at the three islands is represented in Figure 2. For each island, no differences [tested with Kruskal–Wallis ANOVA by Ranks Test (H)] were observed among years in this index of abundance (S. Miguel: H6,87=3.938, p>0.05; Pico - H8,48=10.467, p>0.05; Flores H2,12=1.081, p>0.05). Considering the last three years (2007-2009), with abundance values for the three islands, there were significant differences among islands (H2,70=31.487; p<0.001), with S. Miguel presenting lower abundance values than Pico and Flores. .

WI/IUCN-WSSG Newsletter n°35 December 2009
53
Figure 1: Location of Azores and distribution of the observation points for woodcock breeding abundance monitoring at Flores (n=4), Pico (n=6; after 2003) and S. Miguel (annually the number of observation points varied between 12 and 22 after 2004).
0
5
10
15
20
25
30
35
40
45
50
2001 2002 2003 2004 2005 2006 2007 2008 2009
contacts with rod
ing birds
Pico Flores S. Miguel
(4 )
(3)(4)
(7)(3)
(6) (6)
(6)
(4)
(4 )
(7)(23)
(9)(14)
(8)
(14) (12)
(6)
(7)
Figure 2: Annual variation in the number of contacts with roding birds (mean ± SE) at the three Azorean islands; for S. Miguel, only observation points with contacts were included; for the other islands, all observations points presented contacts; number of observation points between brackets.

WI/IUCN-WSSG Newsletter n°35 December 2009
54
Monitoring of hunting results At Pico a group of local hunters cooperate annually with information from their hunting results. Hunting index of abundance Local hunters frequently hunt only during a part of the day (morning or afternoon) and when they hunt all day, they stop to lunch. To simplify data analysis we asked the hunters to give information for each period of the day. Therefore, the term "hunting journey" in the present work corresponds to a morning or an afternoon of hunting. Previously instructed, for each hunting journey they fill out an inquiry. Among other information, they indicated the number of hunters in the group, the number of dogs, date, hunting start and end time, the estimated number of different woodcocks contacted and how many were bagged. From 2002 to 2005 a bag limit of two birds per
hunter per day was set . After 2005 the bag limit changed to three birds/hunter/day. For the six years with available data (Figure 3), a total of 157 hunting journey inquiries were considered valid for analysis. The mean duration of the hunting journey was 2.8 hours (SE=0.09 hours; n=157). We estimate a hunting index of abundance as the mean number of woodcocks seen/hunter/hour. The annual variation in this index and, again, in the index of breeding abundance for this island, are presented in Figure 3. Among years significant differences were observed (H5,157=26.04; p<0.001): 2002 values were lower than those obtained in 2003 and 2006. In fact, 2002 was a year of transition, from previous traditional roding hunting (practiced between the end of January till mid-March; Machado et al. 2006) to an autumn hunting season, practiced with dogs. Therefore, if we exclude 2002, a significant correlation (rs=0.90; p<0.05; n=5) is observed between annual mean values of the hunting index of abundance and of breeding abundance.
1.2
1.82.2
1.7
1,9
1.1
0,0
0,5
1,0
1,5
2,0
2,5
3,0
2002
(n=40)
2003
(n=44)
2004
(n=27)
2005 2006
(n=15)
2007
(n=12)
2008
(n=19)
Years
cont
acts
/hun
ter/
hour
0
5
10
15
20
25
30
35
40
contacts with rod
ing birds
contacts/hunter/hour contacts with roding birds
Figure 3: Annual variation in the hunting index of abundance (contacts/hunter/hour); mean ± SE) and breeding index of abundance (number of contacts with roding birds; mean) at Pico island. In 2005 it was not possible to get hunting data; in brackets, number of hunting journeys analysed.

WI/IUCN-WSSG Newsletter n°35 December 2009
55
Year
2002 (n=57)
2003 (n=99)
2004 (n=44)
2005 2006 (n=38)
2007 2008 (n=56)
% of young
26.32 48.48 36.36 --- 44.74 --- 44.64
young / adult female
0.63 2.40 1.07 --- 1.55 --- 1.47
female / male 1.04 0.73 0.83 --- 1.11 --- 1.08
Table 1: Annual variation in hunting bag composition concerning percentage of young, number of young per adult female and ratio female/male. In brackets, number of birds analysed. Hunting bag statistics Except for 2005 and 2007 hunting seasons, it was possible to determine the sex and age class for a sample of bagged birds (Table 1). Age class (young: < 1 year; adult ≥ 1 year) was determined by wing moult stage analysis (Clausager 1973; Ferrand & Gossmann 2009), complemented, for a bird’s subsample, by observation of presence/absence of bursa Fabricius after dissection. Sex was determined by dissection and gonads observation. In 2002 the proportion of young birds was significantly lower than that of adult birds (χ2
1=11.86; p<0.001), but in the other years, there were no significant differences (χ
21=0.04;
p>0.05 for 2003; χ21=2.75; p>0.05 for 2004;
χ21=0.24; p>0.05 for 2006; χ2
1=0.45; p>0.05 for 2008; Table 1). The high young/adult female ratio observed in the 2003 hunting season (2.4; Table 1) seems to indicate that this year was the one with the best breeding success. The lowest young/adult female ratio
was observed in 2002. The female/male ratio was always near one (Table 1). Conclusions Pico and Flores presented higher levels of woodcock breeding abundance. The low breeding abundance observed on S. Miguel justifies the continuation of the ban on woodcock hunting on that island. Despite these differences among islands, breeding abundance on each island remained stable throughout the years. In general, the annual proportion of young in the hunting bag was not different from the proportion of adults and the sex ratio among shot birds was near 1 (important for roding census results interpretation). A monitoring scheme, based on the roding survey and the analysis of hunting results, is crucial to carry out a sustainable management; in the future it will be extended to other islands of the Azorean archipelago. .
Acknowledgments This report is the result of an important field work, carried out not only by the authors but mainly by forest guards of the Forest Services. Thanks to all of them. We would like also to thank to all the hunters at Pico, especially to the group of Mr. Manuel Humberto. This project was funded by the Direcção Regional dos Recursos Florestais (Azores). References Bannerman D.A. & W.M . Bannerman. 1966. Birds of the Atlantic islands. A history of the birds of the Azores, vol. 3. Oliver and Boyd, Edinburgh. Chavigny J. & N. Mayaud. 1932. Sur l’Avifaune des Açores. Généralités et Étude contributive. Alauda IV-3: 304–348. Clausager I. 1973. Age and sex determination of the Woodcock, Scolopax rusticola. Danish Revue of Game Biology 8(1): 1-18. Ferrand Y. & F. Gossmann. 2009. Ageing and sexing series 5 : Ageing and sexing the Eurasian Woodcock Scolopax rusticola. Wader Study Group Bull. 116(2): 75-79. Ferrand Y. 1989. Contribution à l’étude du comportement du mâle de Bécasse des bois Scolopax rusticola L. en période de reprodution. Méthode de dénombrement. Thèse de Doctorat, Université Montpellier 3.

WI/IUCN-WSSG Newsletter n°35 December 2009
56
Ferrand Y. 1993. A census method for roding Eurasian Woodcocks in France. Biol Rep 16: 19–25. Godman F. 1870. Natural history of the Azores or Western Islands. Jonh Van Voorst, Paternoster Row, London. Hartert E. & W.R. Ogilvie-Grant. 1905. On the birds of the Azores. Novitates Zoologicae 12: 80-128. Machado A.L., Ferrand Y., Gossmann F., Silveira A.M. & D. Gonçalves. 2006. Woodcock (Scolopax rusticola) breeding biology in Pico Island (Azores—Portugal). In: Ferrand Y (ed) Sixth European Woodcock and Snipe Workshop—Proceedings of an International Symposium of the Wetlands International Woodcock and Snipe Specialist Group, Nantes, France. International Wader Studies 13, pp 10–16. Machado A.L., Brito J.C., Medeiros V., Leitão M., Moutinho C., Jesus A., Ferrand . & D. Gonçalves. 2008a. Distribution and habitat preferences of Eurasian woodcock Scolopax rusticola in S. Miguel island (Azores) during the breeding season. Wildlife Biology 14(1): 129-137. Machado A.L., Ferrand Y., Gossmann F., Silveira A.M. & D. Gonçalves. 2008b. Application of a roding survey method to the sedentary Eurasian Woodcock Scolopax rusticola population in Pico Island, Azores. European Journal of Wildlife Research 54: 205–214. Machado A.L., Gonçalves D., Ferrand Y. & M. Silveira. 2002. First data on Woodcock Scolopax rusticola breeding in Pico Island, Azores. Airo 12: 35–44.
Could snipe in the Azores be used as a model to exp lain the constrained island biodiversity? TIAGO RODRIGUES & SERGEI V. DROVETSKI , CIBIO - Centro de Investigação em Biodiversidade e Recursos Genéticos, Universidade do Porto, Campus Agrário de Vairão, Rua Padre Armando Quintas, 7, 4485-661 Vairão, Portugal Email: [email protected] & [email protected] DAVID GONÇALVES , CIBIO - Centro de Investigação em Biodiversidade e Recursos Genéticos, Universidade do Porto, Campus Agrário de Vairão, Rua Padre Armando Quintas, 7, 4485-661 Vairão, Portugal; Departamento de Biologia, Faculdade de Ciências, Universidade do Porto, Rua Campo Alegre, s/n, 4169-07 Porto, Portugal Email: [email protected] The Azores harbour an important Common snipe (Gallinago gallinago) breeding population (Equipa Atlas, 2008). During the winter the increase in snipe observations seems to be explained by the arrival of wintering continental birds (Rodrigues & Gonçalves, 2008). Data from ring recoveries supports the arrival of snipe from Eurasia (Clark & Clark, 1985) and for decades the Common snipe wintering in the Azores were assumed to belong to the Eurasian form (G. g. gallinago; Rodrigues & Gonçalves, 2008). The examination of birds hunted in the Azores revealed that the Nearctic Wilson’s snipe (G. g. delicata) was also present on São Miguel, Pico, Terceira, and Graciosa Islands during winter (Pereira, 2008; Rodrigues & Gonçalves, 2008). Recently we confirmed the presence of Wilson's snipe among birds shot on Flores. Therefore, Wilson's snipe appears to winter across the entire archipelago. Based on differences in winnowing display sounds (Miller, 1996) and morphology, the American Ornithologists Union (Banks et al., 2002) recognizes the Wilson’s snipe as a separate species. These arguments have been
accepted worldwide (Jiguet, 2004; Knox et al., 2008). However, our preliminary and limited published molecular data do not corroborate the specific status of Wilson’s snipe (Zink et al., 1995; Elbourne & Baker, 2007; Baker et al., 2009). Thus, although taxonomically distinct, Common and Wilson’s snipe appear to be recently diverged and likely share ecological similarities. In some Azorean islands snipe males begin displaying at the end of January – beginning of February (Equipa Atlas, 2008). This period overlaps with wintering (Cramp & Simmons, 1983) and could entice some migrants to engage in territorial behavior and attempt breeding on the Azores. The presence of Wilson’s snipe during this period in the archipelago suggests that both subspecies are equally exposed to these stimuli. There are a number of cases where similar forms have colonized oceanic islands on multiple occasions (Mayr, 1963; Baker, 1991). The particular outcome of the meeting of two related groups of colonists is usually explained

WI/IUCN-WSSG Newsletter n°35 December 2009
57
by their degree of divergence. If they diverged recently, it is assumed that they will merge but, if the isolation was long enough, they are assumed to co-exist as biological species (Newton, 2003). The probability of sympatry among closely related island taxa could be reduced by panmixia of the successive colonists or the rapid disappearance of one of them (Newton, 2003). These scenarios assume that colonizations are rare, otherwise a frequent supply of new colonists would facilitate the persistence of multiple taxa. These rare colonization events may explain the lack of closely related taxa observed on islands. In continental contact zones, when two lineages form a narrow, moving hybrid zone, cases of competitive exclusion have been described in birds (Pearson & Rohwer, 2000; Newton, 2003). This has not yet been described in islands; however, the exclusion of one colonist by another could represent an alternative explanation. Such exclusions would be difficult to observe and leave no traces in most cases.
Thus, snipe in the Azores may provide a unique opportunity to test whether island colonization represents a rare event or if one of the closely related but phenotypically distinct forms can exclude the other from the archipelago. To test these hypotheses we started an integrative study that will assess a) the level of genetic differentiation between the Azorean breeding population and both subspecies, b) how much local breeding activity overlaps with the stay of wintering birds and whether the latter are ready to breed before they leave, c) phenotypic and acoustic differences among Azorean, Wilson’s, and Eurasian Common snipe, and differences between sex and age classes, d) aggressiveness of both subspecies and Azorean residents in response to playback recordings of all groups. The success of this project depends on a wide diversity of geographic samples, across Wilson's and Common snipe's breeding ranges. In addition to contacts already established, we would appreciate the collaboration of other colleagues across the Holarctic to obtain representative samples (tissue, sound recordings, etc.). .
References:
Baker A. J. 1991. A review of New Zealand Ornithology. Current Ornithology 8: 1-67. Baker A.J., Tavares E.S. & R.F. Elbourne; 2009. Barcoding Vertebrates: Countering criticisms of single mithochondrial DNA gene barcoding in birds. Molecular Ecology Resources 9: 257-268. Banks R.C., Cicero C., Dunn J.L., Kratter A.W., Rasmussen P.C., Remsen Jr. J.V., Rising J.D. & F.S. Douglas. 2002. Forty-third supplement to the American Ornithologists’ Union check-list of North American Birds. The Auk 119: 897-906. Clark N. & J. Clark. 1985. Recent recoveries of waders ringed in Britain and Ireland. Wader Study Group Bulletin 44: 43-46. Cramp S. & K.E.L. Simmons (Eds.) 1983. Handbook of the birds of Europe, the Middle East and North Africa: the birds of the Western Palearctic. Vol.3, Waders to Gulls. Oxford University Press, Oxford. Elbourne R.F. & A.J. Baker. 2007. DNA barcoding correctly identifies genera and species in a large shorebird clade. (poster). In Canadian Barcode of Life Science Symposium 2007. (www.bolnet.ca/scientific_conference _2007.php; accessed 01/01/2009). Equipa Atlas. 2008. Atlas das Aves Nidificantes em Portugal, 1999-2005. Instituto da Conservação da Natureza e da Biodiversidade, Sociedade Portuguesa para o Estudo das Aves, Parque Natural da Madeira e Secretaria Regional do Ambiente e do Mar. Assírio & Alvim. Lisboa. Jiguet F. 2004. Décisions récentes prises par la Commission de l’Avifaune Française. Ornithos 11: 230-245. Knox A.G., Collinson J.M., Parkin D.T., Sangster G. & L. Svensson. 2008. Taxonomic recommendations for British birds: Fifth report. Ibis 150: 833-835. Mayr E. 1963. Animal Species and Evolution. Harvard University Press. Cambridge, MA. Miller E.H. 1996. Acoustic differentiation and speciation in shorebirds. Pp. 241-257 in Ecology and Evolution of Acoustic Communication in Birds (Kroodsma D. E. & Miller E. H., Eds.). Comstock/Cornell University Press. Ithaca. New York. Newton I. 2003. The speciation and biogeography of birds. Elsevier Science Ltd. London, UK. Pearson S.F. & S. Rohwer. 2000. Asymmetries in male aggression across an avian hybrid zone. Behavioral Ecology 11: 93-101. Pereira C. 2008. As Narcejas Atlânticas. Análise de aves caçadas nos Açores (época de caça de 2007-2008). Calibre 12 199:18-23. Rodrigues T. & D. Gonçalves 2008. Wilson's Snipe at Azores. WI/IUCN-WSSG Newsletter 34: 32-34. Zink R.M., Rohwer S.A., Andreev A.V. & D.L. Dittmann 1995. Trans-Beringia comparisons of mitochondrial DNA differentiation in birds. Condor 97: 639-649.

WI/IUCN-WSSG Newsletter n°35 December 2009
58
RReecceenntt WWooooddccoocckk aanndd SSnniippee ppuubbll iiccaatt iioonnss DURANT D., TICHIT M., K ERNÉÏS E. & H. FRITZ . 2008. Management of agricultural wet grasslands for breeding waders: integrating ecological and livestock system perspectives – a review. Biodiversity Conservation17: 2275-2295. DOI 10.1007/s10531-007-9310-3 FERRAND Y., GOSSMANN F., BASTAT C. & M. G UÉNÉZAN . 2008. Monitoring of the wintering and breeding Woodcock populations in France. Revista Catalana d’Ornithologia 24 : 44-52. FERRAND Y & F. GOSSMANN. 2009. Ageing and sexing series 5: Ageing and sexing the Eurasian Woodcock Scolopax rusticola. Wader Study Group Bull. 116(2): 75-79. HOODLESS A.N., LANG D., AEBISCHER N.J. & R.J. FULLER . 2009. Densities and population estimates of breeding Eurasian Woodcock Scolopax rusticola in Britain in 2003. Bird Study 56: 15-25. SMART J., AMAR A., O’BRIEN M., GRICE P. & K. SMITH . 2008. Changing land management of lowland wet grasslands of the UK: impacts on snipe abundance and habitat quality. Animal Conservation11 : 339-351.
OLIVIER G.N. 2007.The Jack Snipe. Lymnocryptes minimus. Ed. OMPO/CICB, Paris, France. 208 p. (In English) Price: 15 euros (postal charges included); special price for WSSG members. It can be ordered to OMPO, 5 Avenue des chasseurs, 75017 Paris, France. Tél. 33 (0)1 44 01 05 10; Fax: 33(0)1 44 01 05 11 Email: [email protected] First monograph on Jack Snipe, this book reviews our knowledge about one of the most difficult species to study.
FERRAND Y. & F. GOSSMANN. 2009. La Bécasse des bois – Histoire naturelle. Effet de lisière-éditeur, Saint-Lucien, France. 224 p. (In French) Price : 58 euros (+ postal charges) It can be ordered from the website: www.effet-de-lisiere.com Monograph on Woodcock, Scolopax rusticola, this book reviews our knowledge about one of the most famous game bird in Europe.