Embed Size (px)
Citation preview

1
News Release
Release date: 8
th September 2011
INTERIM RESULTS FOR THE HALF YEAR TO 31 JULY 2011
Further good progress in a challenging environment
Financial summary Turnover up 7.4% to £8.7bn (10/11: £8.1bn)
Like-for-like sales (ex VAT and fuel) up 2.2% (10/11: 0.9%)
Underlying profit (1)
up 8% to £442m (10/11: £410m)
Profit before tax £449m (10/11: £412m)
Net debt £1,055m (10/11: £849m) after equity retirement of £157m
Gearing of 20% (10/11: 17%)
Interim dividend up 158%, (10% on a pro forma basis), to 3.17p (10/11: 1.23p) reflecting
the previously announced rebalancing of interim and final payments
Operating and strategic highlights Record customer numbers – 11.5m per week
16 ex-Netto stores opened
Flower World acquired
First convenience store trial under way
kiddicare integration proceeding well
Sir Ian Gibson, Non-Executive Chairman, said:
“Against the continuing backdrop of a challenging consumer and economic environment,
Morrisons is reporting another good set of results. Our focus on outstanding fresh food, quality
and value has enabled us to grow market share and deliver solid earnings growth.”
Dalton Philips, Chief Executive, said:
“In a tough economy shoppers are looking for unbeatable value on fresh food, great deals on
national brands and the best prices at the petrol pump. Our “Price Crunch” campaign has
delivered these for our customers throughout the period.
In addition to growing sales and delivering good profit growth, we also made great strides in
developing the business for the future. We have opened our first convenience store, invested
further in our unique production capabilities, increased efficiency across the Group, gained
valuable insights from our trial stores and taken our first steps towards becoming a multichannel
retailer. I am confident we will make further good progress in the second half.”

2
Outlook
As we entered 2011 we expected that the consumer would remain under pressure throughout the
year, and planned our business accordingly. During the first half the trading environment has, as
expected, been challenging and we anticipate it to continue to be so for some time to come.
Despite this, our performance to date, our growing customer base and our ongoing focus on tight
cost control throughout the business, give the Board confidence that we will deliver our
expectations for the year.
Enquiries:
Wm Morrison Supermarkets PLC
Richard Pennycook – Finance Director 0845 611 5000
Niall Addison – Investor Relations Director 07764 624701
Media Relations
Wm Morrison Supermarkets PLC Richard Taylor 0845 611 6912
Julian Bailey 0845 611 5362
Citigate Dewe Rogerson: Simon Rigby 020 7282 2847
Kevin Smith 020 7282 1054

3
Financial overview
This report covers trading for the 26 weeks ended 31 July 2011.
During the period total turnover was £8.7bn, an increase of 7.4% over last year. Excluding fuel,
store turnover was up 4.1%, comprising a like-for-like increase of 2.2% and a contribution of
1.9% from new stores.
Profit before tax was £449m (10/11: £412m).
Underlying profit (1)
increased by 8% to £442m, compared to £410m in the prior period. The
underlying operating margin of 5.2% was level with prior year despite the dilutive impact of
increased and low margin fuel sales within the sales mix.
Operating cash flow of £677m was once again strong with £97m more cash generated than in the
prior period. Overall the Group had a cash outflow of £247m (2)
compared to an inflow of £98m
in the first half of last year. This reflected the planned acceleration in capital expenditure this year
and the implementation of the first phase of the Group‟s previously announced two year equity
retirement of £1bn. During the period £157m was invested in this programme. As a result of
these two factors, the Group‟s net debt grew during the period to £1,055m, an increase of £238m
from the 30 January 2011 position. Gearing increased slightly but remained low at 20%.
The Group continues to maintain a strong balance sheet position. This is securely financed by a
number of long dated bonds and a revolving £1.2bn credit facility at competitive rates, which is
available until 2016. At the period end £494m of this facility remained undrawn.
At our Preliminary Results announcement in March we outlined the Group‟s dividend policy of
maintaining a progressive dividend and increasing payments by a minimum of 10% annually in
each of the three years to 2013/14. In addition we announced that we would increase the interim
proportion of the annual dividend to 30%. The Board is therefore pleased to confirm its intention
to increase the interim dividend by 158%, 10% on a proforma basis, to 3.17 pence per share
(10/11: 1.23p) in line with this policy. This will be paid on 7th November 2011 to shareholders
on the register on 30 September 2011.
The UK grocery retail market
The first half of 2011 saw a continuation of the challenging environment of last year. With a
weak economy, high levels of unemployment, ongoing concerns about the impact of potential
public sector job cuts and continuing pressure on disposable incomes, consumer confidence has
tested the lows seen in the immediate aftermath of the credit crunch.
In addition, a combination of shocks, most particularly the earthquake in Japan and unrest in the
Middle East, resulted in the average oil price being $114 per barrel in the period compared to $79
a year previously. This had a direct effect on consumers at the filling station and through their
energy bills, and an indirect impact of higher costs throughout the grocery supply chain.

4
Food price inflation increased in the period, and with industry like-for-like sales growth at
modest levels, the sector experienced volume declines, despite the continuation of high levels of
promotional activity across the industry. In this difficult situation consumers have naturally been
determined to seek out best value, and have turned, once again, to Morrisons. As a result our
growth was 0.8%(3)
ahead of the grocery market.
Overall market growth in the first half was 4.3%,(3)
whilst the growth in new space was 5%,
leading to a period where industry supply has exceeded consumer demand. We anticipate this
situation continuing throughout 2011 and 2012.
Over the last three years, food expenditure has increased as a proportion of GDP, reversing the
long term trend. We expect this to continue given the sustained and increasing demand for food
from a growing world population, and the inability of food supply to match that demand. Over
the next decade growth in the UK population is expected to accelerate and we expect the previous
trends towards healthy eating and concern for the provenance and quality of food to re-emerge.
All these factors give us confidence that the UK grocery market will continue to offer attractive
growth in the medium to long term.
Trading
For the fifth year in a row Morrisons has outperformed in a highly competitive market whilst
delivering good profit growth. The environment has weighed heavily with consumers and we
have maintained our focus on value. Our offers, including our highly successful “Price Crunch”
campaigns on national brands, our unbeatable deals on fresh food prepared in-house and our
market leading actions to reduce costs at the petrol pumps clearly resonated with our customers.
Our like-for-like store sales growth of 2.2% reflected increasing numbers of customers visiting
our stores. Some of this improvement was due to a review of our opening hours, which resulted
in an extension of hours in many stores from May. Total store sales were up by 4.1% including
the impact of new space, with 16 Netto stores acquired from Asda opening in the period. Overall,
including those visiting our new stores, there was a 3.5% increase in total customers with a
record average of 11.5m visiting our stores each week.
The high cost of oil resulted in consumers paying an average of 18p per litre more at the pumps
than in the previous period, with an average unleaded price per litre of 132p. Overall, this meant
that our customers paid £240m more for their fuel than in the prior year, a significant impact on
their disposable income. Despite this, our leading value proposition and effective Fuel Britannia
promotion attracted record numbers of customers onto our forecourts, resulting in volume growth
of 4%. Overall, like-for-like fuel sales were up 18% in the period.
The market remained highly promotional, and we ensured that Morrisons continued to offer the
broadest range and depth of deals. Whilst some promotions were aimed at giving our customers
affordable treats, such as a very successful focus on party food for the Royal Wedding, most were
designed to offer savings on everyday essentials. Our promotional offers with milk and bread at
50p and fresh fruit and vegetables at 30p, representing the lowest priced staple products in the
country, were extremely popular. Our volume momentum has been ahead of the sector for a
sustained period and has enabled us to invest strongly in value for our customers, both in base
price and in the promotional programme.

5
Strategy update and operating review
In 2010/11 we outlined our goal of making Morrisons “Different and Better Than Ever” and
focused on three areas of strategic delivery:
Driving topline,
Increasing efficiency, and
Capturing growth.
During the period good progress has been made in all areas.
Driving topline
Moving ahead on Fresh
The provision of fresh food at great value is a key point of difference for Morrisons and we look
to use our unique food production capability to extend our lead in this area. We have developed a
“Fresh Lab” in our Kirkstall store, to enable us to test out new ideas, particularly in relation to
broader produce ranges, new methods of display, specialist meat, fish and cheese products and
improved signage. Customer reaction has been particularly positive, and we will be looking to
roll-out aspects of the new offer in 2012.
Optimising our space
We plan to make better use of the space we have in store by rebalancing our existing grocery
range and freeing-up shelf space in the centre aisles. We believe that we can liberate another
750,000 square feet of space which we will use to extend our fresh and homeware offers and
introduce children‟s clothing for the first time. Our first trial store, in Shrewsbury, has been a
success, with sales and margin improvements. Again, we anticipate a roll-out of this initiative
starting in the second quarter of 2012.
Completing National to Nationwide
Under our National to Nationwide programme we will be opening 2.5m square feet of new store
space in the three years to 2013/14, with 600,000 square feet in the current year.
In the period the Group opened 16 new stores which had previously been owned by Netto. At an
average of 8,000 square feet they are much smaller than Morrisons traditional format. Customer
reaction has been very positive and the turnover of these stores has increased significantly under
Morrisons ownership.
We are now operating 12.4m square feet of store space and as planned our programme will add a
further 0.5m square feet to the estate in the second half of the year, including 0.1m square feet of
extensions.
Strengthening our brand
We have created a new team to run our own brand product architecture and during the period
they reviewed 8,000 of our existing own brand products. Encouragingly it was found, through
extensive blind tasting, that, on average, Morrisons product quality was perceived to be the best
of the big 4 supermarkets. However, areas for improvement were identified and are being
actioned, particularly where Morrisons is perceived to lack product range. An example is ready
meals, where we will launch a major range expansion in the third quarter of this year.

6
Enhancing our service culture
Our new “HOT” service initiative, which is designed to improve our customers‟ experience in
store, is on track to roll-out by the end of the year. Over 115,000 colleagues have been trained so
far, and measurable service improvements are being seen.
Increasing efficiency
Driving store productivity We have been using our York store as a “Fresh Working Lab”, designed to improve store
productivity without affecting customer service, with a targeted £100m of productivity gains
across the business. Initiatives trialed include opening our service counters later in the day and
reducing the amount of shelf-stacking taking place during store opening hours. These are among
a number of initiatives which have already been rolled out across our estate and further trials are
in progress. We are on track to deliver against our financial targets for the project.
Revamping our systems
Our six year, £310m investment programme to replace all our IT systems is scheduled to be
completed in 2013/14 and will deliver £100m of annual savings in that year.
During the period we have completed the roll-out of our EPoS till system to around 9,500 tills,
initiated a new product masterfile within our Trading operation and installed a fully integrated
system in three of our manufacturing sites. These projects have all gone well and the roll-out of
other elements will continue intensively.
Tackling indirect procurement
Our plan is to take overhead cost out of our business and reduce capital expenditure through the
centralisation and strengthening of our Group purchasing team and the consolidation of our
supply contracts. In the period we secured a significant reduction in our print costs, and designed
a new “lean build” store which will open in the second half. Build costs will be approximately
25% lower than for a traditional store.
Increasing network efficiency
Our new South West regional distribution centre at Bridgwater will open in October, ahead of the
critical Christmas period and, as planned, will become fully operational in the first quarter of
2012/13. It is on track to deliver its target £20m of savings by 2014/15.
Capturing growth
Production
Having our own production facilities is a key point of difference for Morrisons and an essential
feature in our differentiated position in fresh food and produce. We have ambitious plans to
expand our capability by adding additional facilities to complement our existing product range.
In June we acquired Flower World, one of the leading independent flower importers and
distributors in the UK, for whom we were a major customer. Along with our existing facility in
Holland we now have the capacity to handle all our flower requirements in-house.
We continue to evaluate other areas of production which would fit well into the Morrisons model,
and will open a new Produce pack-house in Bridgwater alongside the regional distribution centre
in 2013.

7
Convenience
The convenience sector is the fastest growing sector of the market and an area in which we
historically had no representation and we therefore planned to open three trial stores this year to
evaluate the potential for a unique Morrisons convenience proposition based around fresh food.
The first of these trial stores, under the “M Local” banner, opened in Ilkley during the period. It
has a broader range of fresh food than competitors, which is supplied from a local large
Morrisons store three or four times per day. Early results have been positive. We have now
opened a second store at Wilmslow and are on track to open our third planned store during the
third quarter.
Moving online – non-food
We have previously announced plans to launch a Morrisons online offer for non-food during
2012, based on the systems used in kiddicare, a business we acquired earlier this year.
kiddicare has now been integrated into the Morrisons family. Kiosks, which enable Morrisons
customers to order kiddicare products online will be installed in 28 of our stores by the end of the
third quarter and will be rolled out further when the concept has been fully tested. We are on
track to launch Morrisons.com next year.
Moving online - food
In March we acquired a stake in FreshDirect to enable us to properly evaluate how we could
develop a profitable food online business for Morrisons. A team is now in New York working
with FreshDirect management. They will be headed by Simon Thompson, who has been
appointed as Managing Director for Morrisons.com for food.
Overall we are making good progress in delivering against all of the initiatives which will enable
us to meet our goal of being “Different and Better Than Ever”.
Corporate Responsibility
We continue to make steady progress on our published Corporate Responsibility commitments.
Emissions reduction has been steady at 12% despite growth in the business and we are on track to
meet our stretching 30% absolute reduction by 2020. We have recently been reaccredited with
the Carbon Trust Standard, having been the first supermarket to achieve this back in 2008. In
addition we are well underway to reach zero waste direct to landfill from stores by 2013. Stores
now routinely recycle over 80% of their waste.
We have strengthened our commitment to responsible sourcing, including initiatives around soy,
palm oil and tuna. Our farming programme will conclude research by the end of the year on free-
range hen health, dairy farm carbon emissions and energy savings.

8
Colleagues
Morrisons is a people business, with over 130,000 colleagues working hard to deliver an
excellent experience for our 11.5 million customers every week. Our focus on developing our
team has never been greater - our apprenticeship programme will see 18,000 colleagues trained
over the course of the year, and by the end of this year, 100,000 colleagues from across the
business will be working towards their QCF level 2 qualifications. We were delighted to be
named Employer of the Year by both Retail Week magazine, and, for the second year running,
The Grocer magazine. These accolades are testament to the hard work of everyone at Morrisons
and their commitment to our customers.
Women on Boards review The Board welcomes the proposals set out by Lord Davies in his Review into Women on Boards.
The Board currently includes two women members, 28% of its total composition. The Board‟s
policy is that female representation should be maintained at not less than 20% and aspires that
this should be higher than 30%. This policy will continue to be considered as part of the
Nomination Committee‟s regular review of the Board‟s composition and skills.
Outlook
As we entered 2011 we expected that the consumer would remain under pressure throughout the
year, and planned our business accordingly. During the first half the trading environment has, as
expected, been challenging and we anticipate it to continue to be so for some time to come.
Despite this, our performance to date, our growing customer base and our ongoing focus on tight
cost control throughout the business, give the Board confidence that we will deliver our
expectations for the year.
Notes (1)
Profit before taxation, property disposals and IAS19 pension interest (2)
Net decrease in cash and cash equivalents, excluding new borrowings and the
repayment of existing facilities (3)
Source: Kantar Worldpanel

9
Wm Morrison Supermarkets PLC
Condensed consolidated financial statements
Consolidated statement of comprehensive income 26 weeks ended 31 July 2011
Note
26 weeks
ended
31 July
2011
£m
26 weeks ended
1 August 2010
£m
52 weeks
ended
30 January 2011
£m
Turnover 2 8,737 8,135 16,479
Cost of sales (8,140) (7,567) (15,331)
Gross profit 597 568 1,148
Other operating income 41 36 80
Administrative expenses (180) (177) (323)
Losses arising on property transactions - - (1)
Operating profit 458 427 904
Finance costs 3 (20) (23) (43)
Finance income 3 11 8 13
Profit before taxation 449 412 874
Taxation 4 (123) (126) (242)
Profit for the period attributable to the owners of the
Company
326 286 632
Other comprehensive income/(expense):
Actuarial gain arising in the pension scheme - - 34
Cash flow hedging movement 9 (11) 3
Tax in relation to components of other comprehensive income (2) 5 (11)
Other comprehensive income/(expense) for the period, net of
tax
7 (6) 26
Total comprehensive income for the period attributable to the
owners of the Company
333 280 658
Earnings per share (pence) 5
- basic 12.44 10.83 23.93
- diluted 12.18 10.65 23.43

10
Consolidated balance sheet
31 July 2011
Restated
(note 7)
31 July 2011 1 August 2010 30 January 2011
Note £m £m £m
Assets
Non-current assets
Goodwill and intangible assets 6 274 7 184
Property, plant and equipment 7 7,677 7,541 7,557
Investment property 250 222 229
Net pension asset 8 51 - 38
Investments 31 - -
Other financial assets 6 - 3
8,289 7,770 8,011
Current assets
Stocks 685 536 638
Debtors 328 219 268
Other financial assets 9 - 4
Cash and cash equivalents 211 241 228
1,233 996 1,138
Liabilities
Current liabilities
Creditors (2,124) (1,831) (1,914)
Other financial liabilities - (58) -
Current tax liabilities (161) (162) (172)
(2,285) (2,051) (2,086)
Non-current liabilities
Other financial liabilities (1,281) (1,032) (1,052)
Deferred tax liabilities 4 (481) (516) (499)
Net pension liabilities 8 - (6) -
Provisions (89) (113) (92)
(1,851) (1,667) (1,643)
Net assets 5,386 5,048 5,420
Shareholders’ equity
Called up share capital 14 261 266 266
Share premium 107 104 107
Capital redemption reserve 11 6 6
Merger reserve 2,578 2,578 2,578
Retained earnings and hedging reserve 2,429 2,094 2,463
Total equity attributable to owners of the Company 5,386 5,048 5,420

11
Consolidated cash flow statement
26 weeks ended 31 July 2011
26 weeks ended
31 July
2011
26 weeks ended
1 August
2010
52 weeks
ended 30 January
2011
Note £m £m £m
Cash flows from operating activities
Cash generated from operations 9 677 580 1,141
Interest paid (9) (11) (52)
Taxation paid (153) (62) (191)
Net cash inflow from operating activities 515 507 898
Cash flows from investing activities
Interest received 3 3 5
Investments (31) - -
Proceeds from the sale of property, plant and equipment - 2 8
Cash outflow from acquisition of businesses 13 (74) (3) (3)
Purchase of property, plant and equipment (254) (236) (494)
Purchase of intangible assets (30) - (98)
Net cash outflow from investing activities (386) (234) (582)
Cash flows from financing activities
Purchase of own shares (157) - -
Proceeds from the issue of ordinary shares - 13 16
New borrowings 706 - 25
Repayment of borrowings (476) (150) (154)
Dividends paid to equity shareholders 12 (219) (188) (220)
Net cash outflow from financing activities (146) (325) (333)
Net decrease in cash and cash equivalents (17) (52) (17)
Cash and cash equivalents at start of period 228 245 245
Cash and cash equivalents at end of period 211 193 228

12
Reconciliation of net cash flow to movement in net debt in the period
26 weeks ended 26 weeks ended 52 weeks ended
31 July 2011 1 August 2010 30 January 2011
Note £m £m £m
Net decrease in cash and cash equivalents (17) (52) (17)
Cash outflow from decrease in debt and lease financing 476 150 154
Cash inflow from increase in loans (706) - (25)
Other non-cash movements 9 (19) (1)
Debt acquired on acquisition of businesses - (4) (4)
Opening net debt (817) (924) (924)
Closing net debt 10 (1,055) (849) (817)

13
Consolidated statement of changes in equity
Attributable to the owners of the Company
Share
capital
£m
Share
premium
£m
Capital
redemption
reserve
£m
Merger
reserve
£m
Hedging
reserve
£m
Retained
earnings
£m
Total
equity
£m
Current half year
At 30 January 2011 266 107 6 2,578 5 2,458 5,420
Profit for the period - - - - - 326 326
Other comprehensive income:
Cash flow hedging movement - - - - 9 - 9
Tax in relation to components of other
comprehensive income - - - - (2) - (2)
Total comprehensive income for the period - - - - 7 326 333
Shares purchased for cancellation (5) - 5 - - (157) (157)
Employees share options schemes:
Share options charge - - - - - 9 9
Dividends - - - - - (219) (219)
Total transactions with owners (5) - 5 - - (367) (367)
At 31 July 2011 261 107 11 2,578 12 2,417 5,386
Prior half year
At 31 January 2010 265 92 6 2,578 3 2,005 4,949
Profit for the period - - - - - 286 286
Other comprehensive income:
Cash flow hedging movement - - - - (11) - (11)
Tax in relation to components of other
comprehensive income - - - - 2 3 5
Total comprehensive income for the period - - - - (9) 289 280
Employees share options schemes:
Share options charge - - - - - (6) (6)
Share options exercised 1 12 - - - - 13
Dividends - - - - - (188) (188)
Total transactions with owners 1 12 - - - (194) (181)
At 1 August 2010 266 104 6 2,578 (6) 2,100 5,048
14
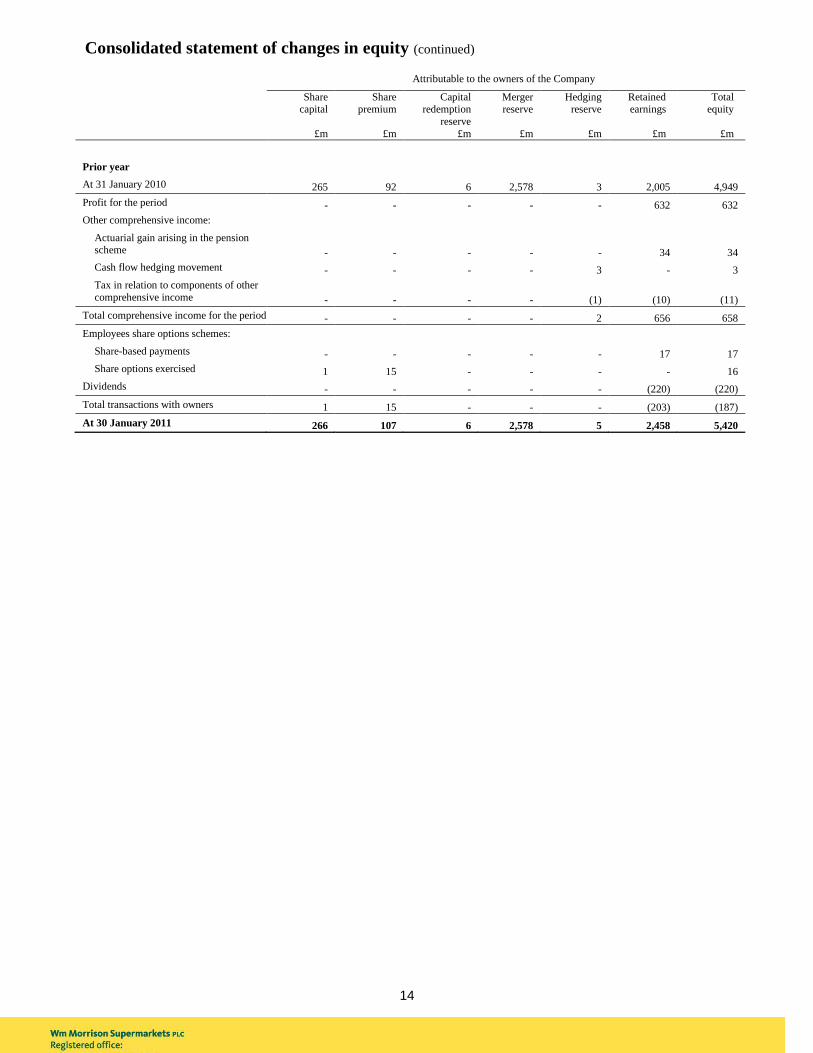
Consolidated statement of changes in equity (continued)
Attributable to the owners of the Company
Share
capital
£m
Share
premium
£m
Capital
redemption
reserve
£m
Merger
reserve
£m
Hedging
reserve
£m
Retained
earnings
£m
Total
equity
£m
Prior year
At 31 January 2010 265 92 6 2,578 3 2,005 4,949
Profit for the period - - - - - 632 632
Other comprehensive income:
Actuarial gain arising in the pension scheme - - - - - 34 34
Cash flow hedging movement - - - - 3 - 3
Tax in relation to components of other
comprehensive income - - - - (1) (10) (11)
Total comprehensive income for the period - - - - 2 656 658
Employees share options schemes:
Share-based payments - - - - - 17 17
Share options exercised 1 15 - - - - 16
Dividends - - - - - (220) (220)
Total transactions with owners 1 15 - - - (203) (187)
At 30 January 2011 266 107 6 2,578 5 2,458 5,420
15
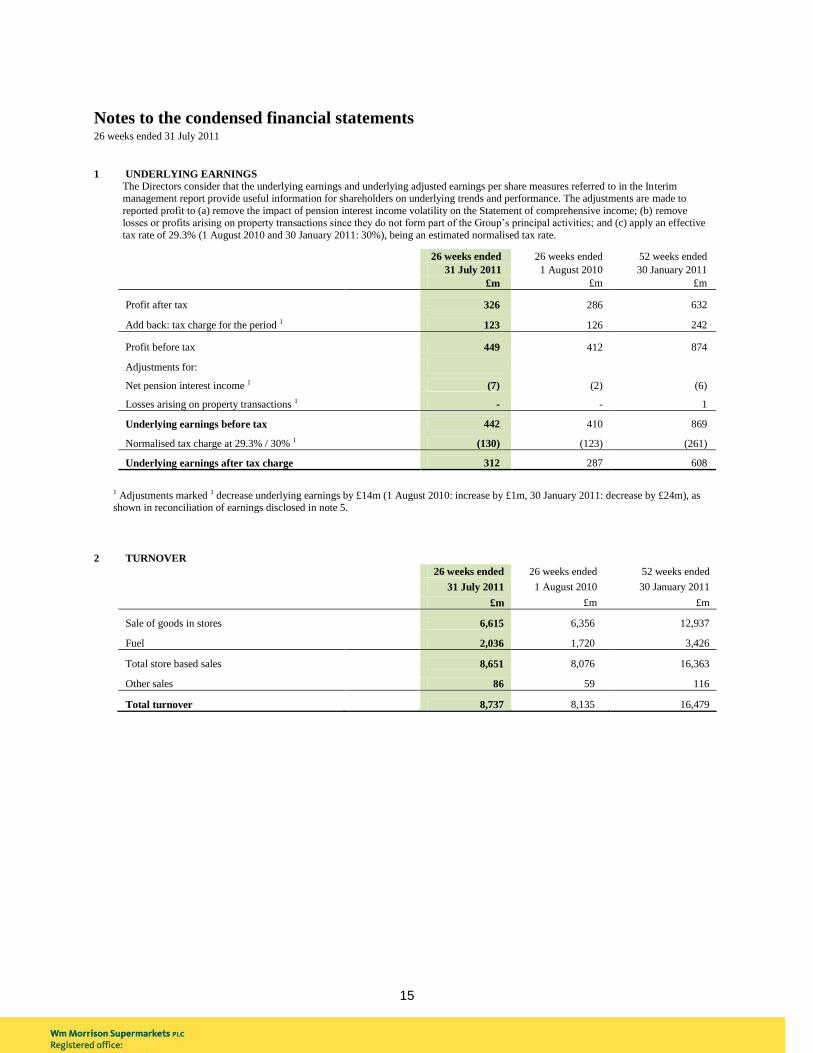
Notes to the condensed financial statements
26 weeks ended 31 July 2011
1 UNDERLYING EARNINGS
The Directors consider that the underlying earnings and underlying adjusted earnings per share measures referred to in the Interim management report provide useful information for shareholders on underlying trends and performance. The adjustments are made to
reported profit to (a) remove the impact of pension interest income volatility on the Statement of comprehensive income; (b) remove losses or profits arising on property transactions since they do not form part of the Group‟s principal activities; and (c) apply an effective
tax rate of 29.3% (1 August 2010 and 30 January 2011: 30%), being an estimated normalised tax rate.
26 weeks ended 26 weeks ended 52 weeks ended
31 July 2011 1 August 2010 30 January 2011
£m £m £m
Profit after tax 326 286 632
Add back: tax charge for the period 1 123 126 242
Profit before tax 449 412 874
Adjustments for:
Net pension interest income 1 (7) (2) (6)
Losses arising on property transactions 1 - - 1
Underlying earnings before tax 442 410 869
Normalised tax charge at 29.3% / 30% 1 (130) (123) (261)
Underlying earnings after tax charge 312 287 608
1 Adjustments marked 1 decrease underlying earnings by £14m (1 August 2010: increase by £1m, 30 January 2011: decrease by £24m), as shown in reconciliation of earnings disclosed in note 5.
2 TURNOVER
26 weeks ended 26 weeks ended 52 weeks ended
31 July 2011 1 August 2010 30 January 2011
£m £m £m
Sale of goods in stores 6,615 6,356 12,937
Fuel 2,036 1,720 3,426
Total store based sales 8,651 8,076 16,363
Other sales 86 59 116
Total turnover 8,737 8,135 16,479

16
Notes to the condensed financial statements (continued) 26 weeks ended 31 July 2011
3 FINANCE COSTS AND INCOME 26 weeks ended 26 weeks ended 52 weeks ended
31 July 2011 1 August 2010 30 January 2011
£m £m £m
Interest payable on short term loans and bank overdrafts (5) (3) (6)
Interest payable on bonds (17) (19) (36)
Interest capitalised 6 3 7
Total interest payable (16) (19) (35)
Fair value movement of derivative instruments - (1) (1)
Other finance costs (4) (3) (7)
Finance costs (20) (23) (43)
Bank interest received 2 2 3
Amortisation of bonds 1 2 3
Other finance income 1 2 1
Pension liability interest cost (63) (60) (120)
Expected return on pension assets 70 62 126
Net pension interest income 7 2 6
Finance income 11 8 13
Net finance costs (9) (15) (30)
4 TAXATION
On 23 March 2011 it was announced that the rate of corporation tax will be reducing from 28% to 23% over a 4 year period. The first reduction to 26% is applicable for the period ending 29 January 2012. A further 1% reduction per year will bring the rate down by 23% by
2015. At 31 July 2011, a reduction to 25% had been substantively enacted.
The tax charged within the interim report has been calculated by applying the effective rate of tax which is expected to apply to the Group
for the period ending 29 January 2012, as permitted by IAS 34 Interim financial reporting. The charge therefore incorporates the
reduction of the deferred tax rate of 25% which has reduced the half-year tax charge by £19m.

17
Notes to the condensed financial statements (continued) 26 weeks ended 31 July 2011
5 EARNINGS PER SHARE
Basic earnings per share are calculated by dividing earnings attributable to ordinary shareholders by the weighted average number of
ordinary shares outstanding during the period, excluding those held by the Group as treasury shares.
For diluted earnings per share, the weighted average number of ordinary shares in issue is adjusted to assume conversion of all
potentially issuable dilutive ordinary shares.
Underlying earnings per share
It is the Directors‟ view that Underlying earnings per share is a fairer reflection of the underlying results of the business.
26 weeks ended 26 weeks ended 52 weeks ended
31 July 2011 1 August 2010 30 January 2011
pence pence pence
Basic Diluted Basic Diluted Basic Diluted
Basic earnings per share 12.44 12.18 10.83 10.65 23.93 23.43
Underlying earnings per share 11.91 11.66 10.86 10.69 23.03 22.54
£m £m £m
Basic Diluted Basic Diluted Basic Diluted
Basic earnings
Earnings attributable to ordinary shareholders 326 326 286 286 632 632
Underlying earnings
Earnings attributable to ordinary shareholders 326 326 286 286 632 632
Adjustments to determine underlying profit (note 1) (14) (14) 1 1 (24) (24)
Underlying earnings attributable to ordinary
shareholders 312 312 287 287 608 608
Millions Millions Millions
Basic Diluted Basic Diluted Basic Diluted
Weighted average number of shares
Ordinary shares in issue/diluted ordinary shares 2,620 2,676 2,642 2,685 2,641 2,697
6 GOODWILL AND INTANGIBLE ASSETS
31 July 2011 1 August 2010 30 January 2011
£m £m £m
Net book value
At beginning of the period 184 - -
Acquisition of businesses (note 13) 63 7 7
Transfer from Plant, property and equipment - - 83
Additions at cost 30 - 98
Interest capitalised 4 - 6
Amortisation (7) - (10)
At end of the period 274 7 184

18
Notes to the condensed financial statements (continued) 26 weeks ended 31 July 2011
7 CAPITAL EXPENDITURE AND COMMITMENTS
a) Property, plant and equipment 31 July 2011
Restated 1 August 2010 30 January 2011
£m £m £m
Net book value
At beginning of the period 7,557 7,439 7,439
Acquisition of businesses (note 13) 11 14 14
Additions at cost 290 236 481
Interest capitalised 2 3 1
Transfers (to)/from investment property (23) 5 16
Transfers to intangible assets - - (83)
Disposals - (2) (9)
Depreciation charge for the period (160) (154) (302)
At end of the period 7,677 7,541 7,557
Leasehold land and buildings have been restated for the comparative period as a result of an amendment to IAS 17 Leases adopted
by the Group in the year to 30 January 2011. At 1 August 2010, the effect is a decrease of £256m to non-current asset lease
prepayments and an increase to closing net book value of leasehold land and buildings of £258m.
b) Investment properties In addition to the depreciation charge above of £160m, £2m (1 August 2010: £2m, 30 January 2011: £7m) is charged on Investment
properties.
Contracts placed for future capital expenditure not provided in the financial statements amount to £160m (1 August 2010: £141m,
30 January 2011: £178m).
8 PENSIONS
There has been no update to the market assumptions used to calculate the defined benefit schemes‟ surplus for the half-yearly report as market conditions at the balance sheet date did not have a significant impact on the assumptions. Post period end conditions in the bond
and equity markets will be considered in the full review of assumptions for the year ending 29 January 2012.

19
Notes to the condensed financial statements (continued)
26 weeks ended 31 July 2011
9 CASH FLOWS FROM OPERATING ACTIVITIES
26 weeks ended
Restated (note 7) 26 weeks ended 52 weeks ended
31 July 2011
£m
1 August 2010 £m
30 January 2011
£m
Profit for the period 326 286 632
Adjustments for:
Taxation 123 126 242
Depreciation 162 157 309
Amortisation 7 - 10
Loss on disposal of property, plant and equipment - - 1
Net finance cost 9 15 30
Other non-cash changes 10 6 16
Excess of contributions over pension service cost (6) (8) (15)
(Increase)/decrease in stocks (43) 41 (61)
Increase in debtors (58) (21) (75)
Increase/(decrease) in creditors and provisions 147 (22) 52
Cash generated from operations 677 580 1,141
10 ANALYSIS OF NET DEBT
31 July 2011 1 August 2010 30 January 2011
£m £m £m
Cash and cash equivalents 211 241 228
Bank overdrafts - (48) -
Cash and cash equivalents per cash flow 211 193 228
Derivative financial instruments 15 - 7
Financial assets 15 - 7
Finance lease obligations - (1) -
Derivative financial instruments - (9) -
Current financial liabilities (excluding bank overdrafts) - (10) -
Bonds (558) (560) (559)
Floating credit facility (706) (450) (475)
Other unsecured loans (10) (12) (11)
Finance lease obligations (7) (10) (7)
Non-current financial liabilities (1,281) (1,032) (1,052)
Net debt (1,055) (849) (817)
On 4 March 2011, the Group concluded a renewal of its revolving credit finance. During the period the Group repaid the previous facility of £475m and
drew down £706m of the new facility.

20
Notes to the condensed financial statements (continued)
26 weeks ended 31 July 2011
11 NON-CURRENT BORROWINGS
At the half year end date the Group has undrawn floating committed borrowing facilities available of £494m (1 August 2010: £650m; 30
January 2011: £625m).
12 DIVIDENDS
26 weeks ended 26 weeks ended 52 weeks ended
31 July 2011 1 August 2010 30 January 2011
£m £m £m
Equity dividends paid in the period 219 188 220
The dividend paid in the period represents the cash payment of the final dividend from the 52 weeks ended 30 January 2011.
The Directors are proposing an interim dividend of 3.17p per share which will be paid on 7 November 2011 to shareholders who are
on the register of members on 30 September 2011. The interim dividend will absorb an estimated £82m of shareholders' funds. This
amount will be charged to retained earnings when paid.
13 BUSINESS COMBINATIONS
IFRS 3 (revised) Business Combinations has been applied to the two acquisitions completed during the period.
On 28 February 2011, the Group acquired the trade and assets of kiddicare.com, a multi-channel online retailer. The total cash
consideration for the purchase was £70m.
Goodwill and intangible assets arising from the acquisition were £60m and other assets acquired were £10m. The intangible assets
acquired are attributable to the brand and IT platform. Goodwill relates to the technological know-how and potential future multi-
channel sales. The acquisition will provide the Group with further expertise in relation to on-line retailing.
On 10 June 2011, the Group acquired 100% of the ordinary share capital of Flower World Limited, a wholesale flower business. This will provide the Group with the capacity to handle all flower requirements in-house. Total consideration (including deferred
consideration) was £6m. Goodwill and intangible assets acquired were £3m and other assets acquired were £3m.
14 SHARE CAPITAL
The Group acquired 54,200,000 of its own shares through purchases in the open market between 10 March 2011 and 29 July 2011. The total amount paid to acquire the shares, net of tax, was £157m and has been deducted from retained earnings within shareholders‟ equity.
The shares purchased represent 2.0% of the ordinary share capital at 31 July 2011. The shares purchased have been cancelled.
15 CONTINGENT LIABILITIES
On 10 August 2011 the Office of Fair Trading (OFT) announced its decision in relation to the Dairy Products investigation commenced in September 2007. It confirmed that Morrisons was not involved in the investigation (as it had announced in April 2010). The OFT
confirmed also that the involvement of Safeway Limited (previously Safeway plc („Safeway‟)) in the investigation related entirely to
activities conducted prior to the acquisition of Safeway by Morrisons.
In that announcement the OFT confirmed the details of fines levied on several retailers and suppliers of dairy products. In the case of
Safeway, the fine was £5.69m. The OFT also confirmed that the fine levied had been reduced from a higher figure by some 35% to reflect Safeway's agreement to an early resolution of this matter.
Additionally, in April 2010 the OFT issued a decision, alleging that the Group was engaged in unlawful practices in relation to retail prices for tobacco products in the UK. The Board considers the OFT‟s stance to be illogical and without foundation and expects that
when the case is considered with proper judicial scrutiny by the Competition Appeals Tribunal, it will be overturned. The Board has not
made a provision for such a liability.

21
Responsibility statement
We confirm that to the best of our knowledge:
the condensed set of financial statements has been prepared in accordance with IAS 34 Interim
Financial Reporting as adopted by the European Union;
the Interim management report includes a fair review of the information required by DTR 4.2.7R
and DTR 4.2.8R of the Disclosure and Transparency Rules.
By order of the Board
7 September 2011
The Board
The Board of Directors that served during the 26 weeks to 31 July 2011 and their respective
responsibilities were:
Sir Ian Gibson – Chairman*
Dalton Philips – Chief Executive Officer
Richard Pennycook – Group Finance Director
Mark Gunter – Group Retail Director
Paul Manduca *
Philip Cox *
Brian Flanagan *
Nigel Robertson *
Penny Hughes *
Johanna Waterous *
* Non-Executive Director
On 9 March 2011, Paul Manduca stepped down from the Board. Mark Gunter and Brian Flanagan both
stepped down from the Board on 9 June 2011.

22
Principal risks and uncertainties
The principal risks and uncertainties set out in Wm Morrison Supermarkets PLC‟s Annual report and
financial statements for the 52 weeks ended 30 January 2011 remain the same for the Half-yearly financial
report 2011/12. Those risks and uncertainties can be summarised as follows:
Operational risks that may affect reputation, market share and financial results:
Business strategy
Product quality and safety
Regulation
Corporate Responsibility
Business interruption
Property
Systems and infrastructure
Colleague engagement and retention
Pensions
Financial risks that may affect financial results or the financial position of the company:
Foreign currency risk
Liquidity risk
Credit risk
More information on the principal risks and how we mitigate those risks can be found on page 20 of the
Annual report and financial statements 2011. You can view the Annual report and financial statements
2011 online on our corporate website, www.morrisons.co.uk/annual report11

23
Accounting policies
Basis of preparation
This Half-yearly financial report 2011/12 is the condensed consolidated financial information of the
Group for the 26 weeks ended 31 July 2011. It has been prepared in accordance with the Disclosure and
Transparency Rules of the UK Financial Services Authority and the requirements of IAS 34 Interim
Financial Reporting as adopted by the European Union.
The Half-yearly financial report 2011/12 was approved by the Board of Directors on 7 September 2011.
The Half-yearly financial report 2011/12 does not constitute financial statements within the meaning of
Section 434 of the Companies Act 2006 and does not include all of the information and disclosures
required for full annual financial statements. It should be read in conjunction with the Annual report and
financial statements for the 52 weeks ended 30 January 2011 which is available either on request from the
Company‟s registered office or to download from www.morrisons.co.uk/annualreport11
The financial information contained in the Half-yearly financial report 2011/12 in respect of the 52 weeks
ended 30 January 2011 has been extracted from the Annual report and financial statements 2011 which
have been filed with the Registrar of Companies. The auditor‟s report on these financial statements was (i)
unqualified, (ii) did not include a reference to any matters to which the auditors drew attention by way of
emphasis without qualifying their report, and (iii) did not contain a statement under Section 498(2) or (3)
of the Companies Act 2006.
The half-yearly results for the current and comparative periods are unaudited.
The auditors have carried out a review of the Half-yearly financial report 2011/12 and their report is set
out below.
Significant accounting policies
The accounting policies applied by the Group in these condensed consolidated financial statements are
consistent with those set out in Wm Morrison Supermarkets PLC Annual report and financial statements
for the 52 weeks ended 30 January 2011.
In preparing the condensed consolidated financial statements, management are required to make
accounting assumptions and estimates. The assumptions and estimation methods were consistent with
those applied to the Annual report and financial statements for the 52 weeks ended 30 January 2011.
The following new standards, amendments to standards and interpretations are mandatory for the first time
for the financial year beginning 31 January 2011, but have no material effect on the Group‟s financial
statements.
IAS 24 Related party disclosures (revised)*
IFRIC 14 IAS 19 Prepayments of a minimum funding requirement (amendment)*
IFRIC 19 Extinguishing financial liabilities with equity instruments *
Improvements to International Financial Reporting Standards 2010 *
*These standards and interpretations have been endorsed by the European Union.

24
Forward looking statements
Certain statements in this half-yearly financial report are forward-looking. Where the half-yearly financial
report includes forward-looking statements, these are made by the Directors in good faith based on the
information available to them at the time of their
approval of this report. Such statements are based on current expectations and are subject to a number of
risks and uncertainties, including both economic and business risk factors, that could cause actual events
or results to differ materially from any expected future events or results referred to in these forward-
looking statements. Unless otherwise required by applicable law, regulation or accounting standard, the
Group undertakes no obligation to update any forward-looking statements whether as a result of new
information, future events or otherwise.

25
Independent review report to Wm Morrison Supermarkets PLC
Introduction We have been engaged by the Company to review the condensed set of financial statements in the Half-
yearly financial report for the 26 weeks ended 31 July 2011 which comprises the consolidated statement
of comprehensive income, the consolidated balance sheet, the consolidated statement of changes in equity,
the consolidated cash flow statement and the related explanatory notes. We have read the other
information contained in the Half-yearly financial report and considered whether it contains any apparent
misstatements or material inconsistencies with the information in the condensed set of financial
statements.
This report is made solely to the Company in accordance with the terms of our engagement to assist the
Company in meeting the requirements of the Disclosure and Transparency Rules (the DTR) of the UK's
Financial Services Authority (the UK FSA). Our review has been undertaken so that we might state to the
Company those matters we are required to state to it in this report and for no other purpose. To the fullest
extent permitted by law, we do not accept or assume responsibility to anyone other than the Company for
our review work, for this report, or for the conclusions we have reached.
Directors' responsibilities The Half-yearly financial report is the responsibility of, and has been approved by, the Directors. The
Directors are responsible for preparing the Half-yearly financial report in accordance with the DTR of the
UK FSA.
The annual financial statements of the Group are prepared in accordance with IFRSs as adopted by the
EU. The condensed set of financial statements included in this Half-yearly financial report has been
prepared in accordance with IAS 34 Interim financial reporting as adopted by the EU.
Our responsibility Our responsibility is to express to the Company a conclusion on the condensed set of financial statements
in the Half-yearly financial report based on our review.
Scope of review We conducted our review in accordance with International Standard on Review Engagements (UK and
Ireland) 2410 Review of interim financial information performed by the independent auditor of the entity
issued by the Auditing Practices Board for use in the UK. A review of interim financial information
consists of making enquiries, primarily of persons responsible for financial and accounting matters, and
applying analytical and other review procedures. A review is substantially less in scope than an audit
conducted in accordance with International Standards on Auditing (UK and Ireland) and consequently
does not enable us to obtain assurance that we would become aware of all significant matters that might be
identified in an audit. Accordingly, we do not express an audit opinion.
Conclusion Based on our review, nothing has come to our attention that causes us to believe that the condensed set of
financial statements in the Half-yearly financial report for the 26 weeks ended 31 July 2011 is not
prepared, in all material respects, in accordance with IAS 34 as adopted by the EU and the DTR of the UK
FSA.
A J Stone
for and on behalf of KPMG Audit Plc Chartered Accountants
1 The Embankment
Neville Street
Leeds, LS1 4DW
7 September 2011