Embed Size (px)
Citation preview

-more-
NEWS RELEASE
Union Pacific Reports Record Second Quarter Results
Second Quarter Diluted Earnings per Share up 37 percent
FOR IMMEDIATE RELEASE
Second Quarter Results
Diluted earnings per share of $1.98 increased 37 percent.
Operating income totaled $2.1 billion, up 5 percent.
Operating ratio of 63.0 percent, up 1.1 points (see footnote 1).
Omaha, Neb., July 19, 2018 – Union Pacific Corporation (NYSE: UNP) today reported
2018 second quarter net income of $1.5 billion, or a second quarter record $1.98 per
diluted share. This compares to $1.2 billion, or $1.45 per diluted share, in the second
quarter 2017.
“Overall, I am pleased with the effort put forth by the entire Union Pacific team;
however, I recognize the results could have been better,” said Lance Fritz, Union Pacific
chairman, president and chief executive officer. “Network performance improved
significantly coming out of the First Quarter, but a tunnel outage and train-crew
shortages created a headwind in June. I am confident we have the right plans in place
to drive improvement in our operations and a better service experience for our
customers.”

-2-
-more-
Second Quarter Summary
Operating revenue of $5.7 billion was up 8 percent in the second quarter 2018
compared to the second quarter 2017. Second quarter carloads increased 4 percent
compared to 2017. Volume increases in industrial and premium more than offset declines
in agricultural products and energy. In addition:
Quarterly freight revenue improved 8 percent compared to the second quarter
2017, as volume growth, increased fuel surcharge revenue, and core pricing gains
were partially offset by negative mix of traffic.
Union Pacific’s 63.0 percent operating ratio increased 1.1 points (see footnote)
compared to the second quarter 2017.
The $2.30 per gallon average quarterly diesel fuel price in the second quarter
2018 was 36 percent higher than the second quarter 2017.
Quarterly train speed, as reported to the Association of American Railroads, was
24.7 mph, 3 percent slower than the second quarter 2017.
Union Pacific’s first half reportable personal injury rate of 0.76 per 200,000
employee hours was flat compared to the first half of 2017.
The Company repurchased 33.2 million shares in the second quarter 2018,
including 19.9 million shares received as part of an accelerated share repurchase
program.
Summary of Second Quarter Freight Revenues
Agricultural Products up 5 percent
Energy up 5 percent
Industrial up 8 percent
Premium up 14 percent

-3-
-more-
2018 Outlook
“Looking to the remainder of the year, we expect the strong business environment
to continue as we regain our productivity momentum and improve the value proposition
for all of our stakeholders,” Fritz said.
Footnote 1: Certain prior period amounts have been adjusted for the retrospective adoption of Accounting Standard Update 2017-07 related to the presentation of the components of net periodic pension and other postretirement benefit costs.
Second Quarter 2018 Earnings Conference Call
Union Pacific will host its second quarter 2018 earnings release presentation live over the
Internet and via teleconference on Thursday, July 19, 2018 at 8:45 a.m. Eastern Time.
The presentation will be webcast live over the internet on Union Pacific’s website at
www.up.com/investor. Alternatively, the webcast can be accessed directly through the
following link. Participants may join the conference call by dialing 877/407-8293 (or for
international participants, 201/689-8349).
ABOUT UNION PACIFIC
Union Pacific Railroad is the principal operating company of Union Pacific Corporation
(NYSE: UNP). One of America's most recognized companies, Union Pacific Railroad
connects 23 states in the western two-thirds of the country by rail, providing a critical link
in the global supply chain. In the past 10 years, 2008-2017, Union Pacific invested
approximately $34 billion in its network and operations to support America's
transportation infrastructure. The railroad's diversified business mix includes Agricultural
Products, Energy, Industrial and Premium. Union Pacific serves many of the fastest-
growing U.S. population centers, operates from all major West Coast and Gulf Coast
ports to eastern gateways, connects with Canada's rail systems and is the only railroad
serving all six major Mexico gateways. Union Pacific provides value to its roughly 10,000
customers by delivering products in a safe, reliable, fuel-efficient and environmentally
responsible manner.
Union Pacific Investor contact: Mike Staffenbeal at 402-544-4227 or [email protected]
Union Pacific Media contact: Raquel Espinoza at 402-544-5034 or [email protected]
Supplemental financial information is attached.
-4-
****
This presentation and related materials contain statements about the Company’s future that are not statements of historical fact, including specifically the statements regarding the Company’s expectations with respect to economic conditions and demand levels and its ability to improve network performance and customer service. These statements are, or will be, forward-looking statements as defined by the Securities Act of 1933 and the Securities Exchange Act of 1934. Forward-looking statements also generally include, without limitation, information or statements regarding: projections, predictions, expectations, estimates or forecasts as to the Company’s and its subsidiaries’ business, financial, and operational results, and future economic performance; and management’s beliefs, expectations, goals, and objectives and other similar expressions concerning matters that are not historical facts.
Forward-looking statements should not be read as a guarantee of future performance or results,
and will not necessarily be accurate indications of the times that, or by which, such performance or results will be achieved. Forward-looking information, including expectations regarding operational and financial improvements and the Company’s future performance or results are subject to risks and uncertainties that could cause actual performance or results to differ materially from those expressed in the statement. Important factors, including risk factors, could affect the Company’s and its subsidiaries’ future results and could cause those results or other outcomes to differ materially from those expressed or implied in the forward-looking statements. Information regarding risk factors and other cautionary information are available in the Company’s Annual Report on Form 10-K for 2017, which was filed with the SEC on February 9, 2018. The Company updates information regarding risk factors if circumstances require such updates in its periodic reports on Form 10-Q and its subsequent Annual Reports on Form 10-K (or such other reports that may be filed with the SEC).
Forward-looking statements speak only as of, and are based only upon information available on,
the date the statements were made. The Company assumes no obligation to update forward-looking information to reflect actual results, changes in assumptions or changes in other factors affecting forward-looking information. If the Company does update one or more forward-looking statements, no inference should be drawn that the Company will make additional updates with respect thereto or with respect to other forward-looking statements. References to our website are provided for convenience and, therefore, information on or available through the website is not, and should not be deemed to be, incorporated by reference herein.
###

1
UNION PACIFIC CORPORATION AND SUBSIDIARY COMPANIES Condensed Consolidated Statements of Income (unaudited)
Millions, Except Per Share Amounts and Percentages, 2nd Quarter Year-to-Date
For the Periods Ended June 30, 2018 2017 % 2018 2017 %
Operating Revenues
Freight revenues $ 5,317 $ 4,906 8 % $ 10,439 $ 9,700 8 %
Other 355 344 3 708 682 4
Total operating revenues 5,672 5,250 8 11,147 10,382 7
Operating Expenses
Compensation and benefits* 1,241 1,204 3 2,514 2,466 2
Fuel 643 434 48 1,232 894 38
Purchased services and materials 630 597 6 1,229 1,163 6
Depreciation 546 525 4 1,089 1,045 4
Equipment and other rents 265 273 (3) 531 549 (3)
Other 248 219 13 514 479 7
Total operating expenses 3,573 3,252 10 7,109 6,596 8
Operating Income 2,099 1,998 5 4,038 3,786 7
Other income* 42 50 (16) - 122 (100)
Interest expense (203) (179) 13 (389) (351) 11
Income before income taxes 1,938 1,869 4 3,649 3,557 3
Income taxes (429) (701) (39) (830) (1,317) (37)
Net Income $ 1,509 $ 1,168 29 % $ 2,819 $ 2,240 26 %
Share and Per Share
Earnings per share - basic $ 1.98 $ 1.45 37 % $ 3.67 $ 2.77 32 %
Earnings per share - diluted $ 1.98 $ 1.45 37 $ 3.65 $ 2.76 32
Weighted average number of shares - basic 760.5 804.1 (5) 768.4 807.8 (5)
Weighted average number of shares - diluted 763.7 807.2 (5) 771.6 811.0 (5)
Dividends declared per share $ 0.73 $ 0.605 21 $ 1.46 $ 1.21 21
Operating Ratio* 63.0% 61.9% 1.1 pts 63.8% 63.5% 0.3 pts
Effective Tax Rate 22.1% 37.5% (15.4) pts 22.7% 37.0% (14.3) pts
* Certain prior period amounts have been adjusted for the retrospective adoption of Accounting Standard Update 2017-07
related to the presentation of the components of net periodic pension and other postretirement benefit costs.

2
UNION PACIFIC CORPORATION AND SUBSIDIARY COMPANIES Freight Revenues Statistics (unaudited)
2nd Quarter Year-to-Date
For the Periods Ended June 30, 2018 2017 % 2018 2017 %
Freight Revenues (Millions)
Agricultural Products $ 1,114 $ 1,064 5 % $ 2,212 $ 2,158 3 %
Energy 1,111 1,057 5 2,284 2,081 10
Industrial 1,437 1,334 8 2,777 2,598 7
Premium 1,655 1,451 14 3,166 2,863 11
Total $ 5,317 $ 4,906 8 % $ 10,439 $ 9,700 8 %
Revenue Carloads (Thousands)
Agricultural Products 285 289 (1) % 564 579 (3) %
Energy 387 391 (1) 806 786 3
Industrial 452 427 6 863 830 4
Premium [a] 1,101 1,038 6 2,117 2,038 4
Total 2,225 2,145 4 % 4,350 4,233 3 %
Average Revenue per Car
Agricultural Products $ 3,903 $ 3,687 6 % $ 3,922 $ 3,728 5 %
Energy 2,874 2,702 6 2,835 2,647 7
Industrial 3,178 3,120 2 3,218 3,130 3
Premium 1,503 1,398 8 1,495 1,405 6
Average $ 2,389 $ 2,287 4 % $ 2,400 $ 2,292 5 %
[a] For intermodal shipments each container or trailer equals one carload.
3
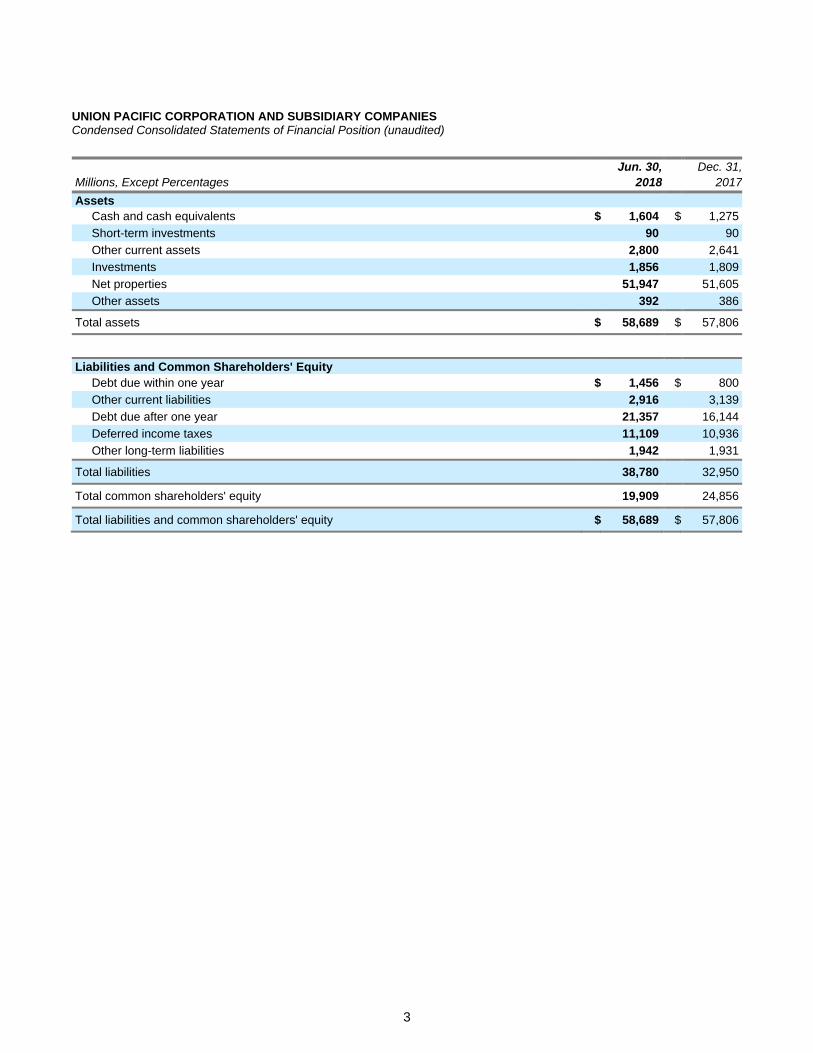
UNION PACIFIC CORPORATION AND SUBSIDIARY COMPANIES Condensed Consolidated Statements of Financial Position (unaudited)
Jun. 30, Dec. 31,
Millions, Except Percentages 2018 2017
Assets
Cash and cash equivalents $ 1,604 $ 1,275
Short-term investments 90 90
Other current assets 2,800 2,641
Investments 1,856 1,809
Net properties 51,947 51,605
Other assets 392 386
Total assets $ 58,689 $ 57,806
Liabilities and Common Shareholders' Equity
Debt due within one year $ 1,456 $ 800
Other current liabilities 2,916 3,139
Debt due after one year 21,357 16,144
Deferred income taxes 11,109 10,936
Other long-term liabilities 1,942 1,931
Total liabilities 38,780 32,950
Total common shareholders' equity 19,909 24,856
Total liabilities and common shareholders' equity $ 58,689 $ 57,806
4
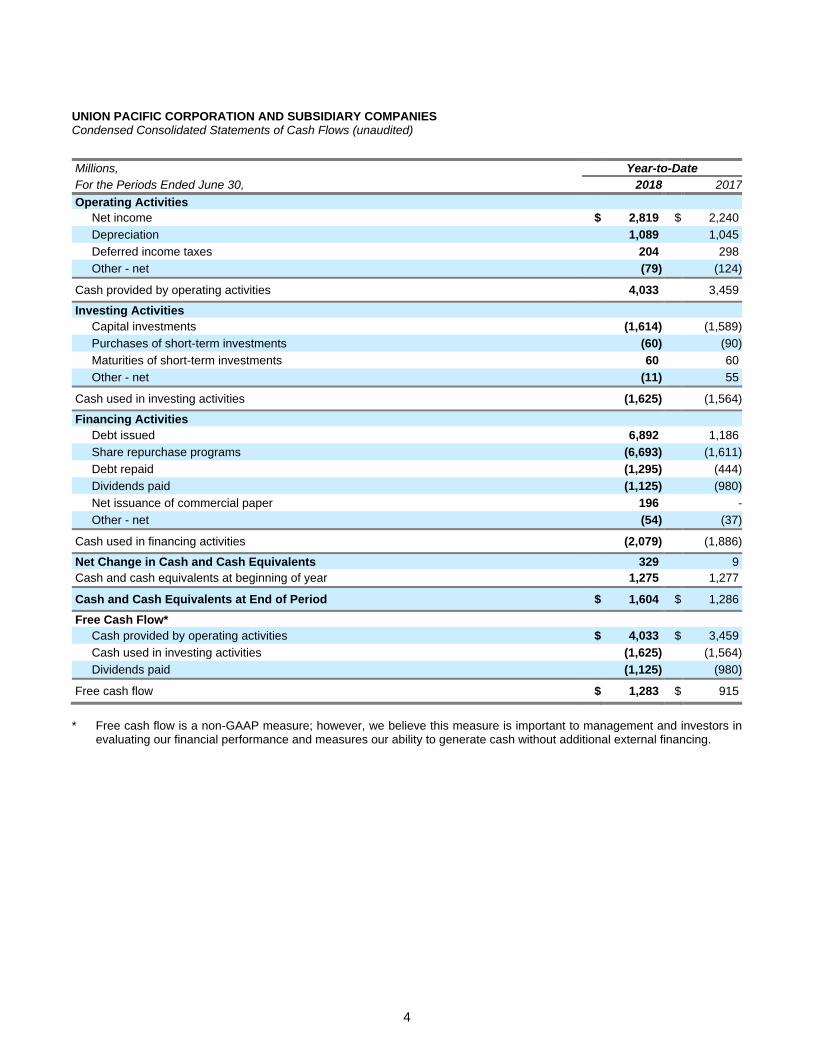
UNION PACIFIC CORPORATION AND SUBSIDIARY COMPANIES Condensed Consolidated Statements of Cash Flows (unaudited)
Millions, Year-to-Date
For the Periods Ended June 30, 2018 2017
Operating Activities
Net income $ 2,819 $ 2,240
Depreciation 1,089 1,045
Deferred income taxes 204 298
Other - net (79) (124)
Cash provided by operating activities 4,033 3,459
Investing Activities
Capital investments (1,614) (1,589)
Purchases of short-term investments (60) (90)
Maturities of short-term investments 60 60
Other - net (11) 55
Cash used in investing activities (1,625) (1,564)
Financing Activities
Debt issued 6,892 1,186
Share repurchase programs (6,693) (1,611)
Debt repaid (1,295) (444)
Dividends paid (1,125) (980)
Net issuance of commercial paper 196 -
Other - net (54) (37)
Cash used in financing activities (2,079) (1,886)
Net Change in Cash and Cash Equivalents 329 9
Cash and cash equivalents at beginning of year 1,275 1,277
Cash and Cash Equivalents at End of Period $ 1,604 $ 1,286
Free Cash Flow*
Cash provided by operating activities $ 4,033 $ 3,459
Cash used in investing activities (1,625) (1,564)
Dividends paid (1,125) (980)
Free cash flow $ 1,283 $ 915
* Free cash flow is a non-GAAP measure; however, we believe this measure is important to management and investors in
evaluating our financial performance and measures our ability to generate cash without additional external financing.

5
UNION PACIFIC CORPORATION AND SUBSIDIARY COMPANIES Operating and Performance Statistics (unaudited)
2nd Quarter Year-to-Date
For the Periods Ended June 30, 2018 2017 % 2018 2017 %
Operating/Performance Statistics
Gross ton-miles (GTMs) (millions) 230,938 222,842 4 % 457,867 441,756 4 %
Employees (average) 42,114 42,256 - 41,925 42,162 (1)
GTMs (millions) per employee 5.48 5.27 4 10.92 10.48 4
Locomotive Fuel Statistics
Average fuel price per gallon consumed $ 2.30 $ 1.69 36 % $ 2.22 $ 1.72 29 %
Fuel consumed in gallons (millions) 270 246 10 537 499 8
Fuel consumption rate* 1.170 1.105 6 1.173 1.130 4
AAR Reported Performance Measures
Average train speed (miles per hour) 24.7 25.4 (3) % 24.8 25.6 (3) %
Average terminal dwell time (hours) 29.5 28.3 4 31.2 29.4 6
Revenue Ton-Miles (Millions)
Agricultural Products 25,908 25,075 3 % 51,081 51,236 - %
Energy 40,002 40,317 (1) 83,964 80,503 4
Industrial 25,750 25,095 3 50,040 49,148 2
Premium 25,976 24,335 7 49,951 48,014 4
Total 117,636 114,822 2 % 235,036 228,901 3 %
* Fuel consumption is computed as follows: gallons of fuel consumed divided by gross ton-miles in thousands.
6
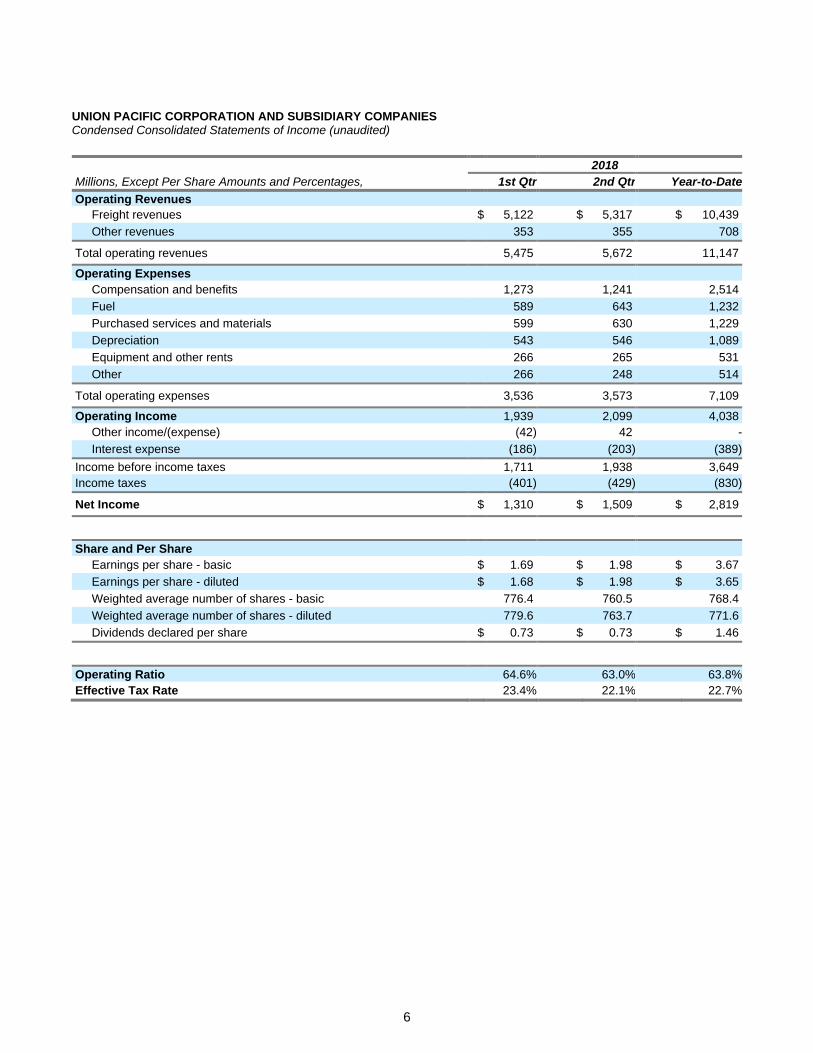
UNION PACIFIC CORPORATION AND SUBSIDIARY COMPANIES Condensed Consolidated Statements of Income (unaudited)
2018
Millions, Except Per Share Amounts and Percentages, 1st Qtr 2nd Qtr Year-to-Date
Operating Revenues
Freight revenues $ 5,122 $ 5,317 $ 10,439
Other revenues 353 355 708
Total operating revenues 5,475 5,672 11,147
Operating Expenses
Compensation and benefits 1,273 1,241 2,514
Fuel 589 643 1,232
Purchased services and materials 599 630 1,229
Depreciation 543 546 1,089
Equipment and other rents 266 265 531
Other 266 248 514
Total operating expenses 3,536 3,573 7,109
Operating Income 1,939 2,099 4,038
Other income/(expense) (42) 42 -
Interest expense (186) (203) (389)
Income before income taxes 1,711 1,938 3,649
Income taxes (401) (429) (830)
Net Income $ 1,310 $ 1,509 $ 2,819
Share and Per Share
Earnings per share - basic $ 1.69 $ 1.98 $ 3.67
Earnings per share - diluted $ 1.68 $ 1.98 $ 3.65
Weighted average number of shares - basic 776.4 760.5 768.4
Weighted average number of shares - diluted 779.6 763.7 771.6
Dividends declared per share $ 0.73 $ 0.73 $ 1.46
Operating Ratio 64.6% 63.0% 63.8%
Effective Tax Rate 23.4% 22.1% 22.7%

7
UNION PACIFIC CORPORATION AND SUBSIDIARY COMPANIES Freight Revenues Statistics (unaudited)
2018
1st Qtr 2nd Qtr Year-to-Date
Freight Revenues (Millions)
Agricultural Products $ 1,098 $ 1,114 $ 2,212
Energy 1,173 1,111 2,284
Industrial 1,340 1,437 2,777
Premium 1,511 1,655 3,166
Total $ 5,122 $ 5,317 $ 10,439
Revenue Carloads (Thousands)
Agricultural Products 279 285 564
Energy 419 387 806
Industrial 411 452 863
Premium [a] 1,016 1,101 2,117
Total 2,125 2,225 4,350
Average Revenue per Car
Agricultural Products $ 3,942 $ 3,903 $ 3,922
Energy 2,799 2,874 2,835
Industrial 3,262 3,178 3,218
Premium 1,487 1,503 1,495
Average $ 2,411 $ 2,389 $ 2,400
[a] For intermodal shipments each container or trailer equals one carload.

8
UNION PACIFIC CORPORATION AND SUBSIDIARY COMPANIES Non-GAAP Measures Reconciliation to GAAP
Adjusted Debt / Adjusted EBITDA*
Millions, Except Ratios Jun. 30, Dec. 31,
for the Twelve Months Ended 2018 2017
Net income $ 11,291 $ 10,712
Less:
Other income 123 245
Add:
Income tax expense/(benefit) (3,567) (3,080)
Depreciation 2,149 2,105
Interest expense 757 719
EBITDA $ 10,507 $ 10,211
Interest on present value of operating leases 89 98
Adjusted EBITDA (a) $ 10,596 $ 10,309
Debt $ 22,813 $ 16,944
Net present value of operating leases 2,073 2,140
Unfunded pension and OPEB, net of taxes of $133 and $238 470 396
Adjusted debt (b) $ 25,356 $ 19,480
Adjusted debt / Adjusted EBITDA (b/a) 2.4 1.9
* Total debt plus net present value of operating leases plus after-tax unfunded pension and OPEB obligation divided by net income less income tax benefit and other income plus depreciation, interest expense, and interest on present value of operating leases. Operating leases were discounted using 4.3% at June 30, 2018, and 4.6% at December 31, 2017. Adjusted debt to adjusted EBITDA (earnings before interest, taxes, depreciation, amortization, and interest on present value of operating leases) is considered a non-GAAP financial measure by SEC Regulation G and Item 10 of SEC Regulation S-K and may not be defined and calculated by other companies in the same manner. We believe this measure is important to management and investors in evaluating the Company’s ability to sustain given debt levels (including leases) with the cash generated from operations. In addition, a comparable measure is used by rating agencies when reviewing the Company’s credit rating. Adjusted debt to Adjusted EBITDA should be considered in addition to, rather than as a substitute for, net income. The table above provides reconciliations from net income to adjusted debt to adjusted EBITDA.