Embed Size (px)
Citation preview

Freeport-McMoRan Copper & Gold Inc. 1
Financial Contacts: Media Contact: Kathleen L. Quirk David P. Joint William L. Collier (602) 366-8016 (504) 582-4203 (504) 582-1750
NEWS RELEASE One North Central Avenue Phoenix, AZ 85004
NYSE: FCX
Freeport-McMoRan Copper & Gold Inc. Reports Third-Quarter and Nine-Month 2007 Results
HIGHLIGHTS
Income from continuing operations applicable to common stock for third-quarter 2007 totaled $763 million, $1.85 per share (including charges to net income of $299 million, $0.67 per share, for special items discussed on page 2), compared with $351 million, $1.67 per share, for the third quarter of 2006 (including net losses of $36 million, $0.16 per share, on debt reductions).
FCX’s consolidated sales from its mines totaled 949 million pounds of copper, 269 thousand ounces of gold and 16 million pounds of molybdenum for third-quarter 2007, and 2.5 billion pounds of copper, 2.1 million ounces of gold and 33 million pounds of molybdenum for the first nine months of 2007.
Full-year 2007 pro forma projected consolidated sales from FCX’s mines, including pre-acquisition Phelps Dodge sales, approximate 3.9 billion pounds of copper, 2.3 million ounces of gold and 68 million pounds of molybdenum, including 875 million pounds of copper, 100 thousand ounces of gold and 18 million pounds of molybdenum for fourth-quarter 2007.
FCX’s operating cash flows totaled $2.2 billion for third-quarter 2007 and $4.9 billion for the first nine months of 2007, including Phelps Dodge’s amounts beginning March 20, 2007. Assuming average prices of $3.50 per pound for copper, $750 per ounce for gold and $30 per pound for molybdenum for the fourth quarter of 2007, operating cash flows would approximate $6.2 billion for 2007, including approximately $1.3 billion for the fourth quarter of 2007.
FCX capital expenditures approximated $466 million for third-quarter 2007 and $1.1 billion for the first nine months of 2007. Capital expenditures are expected to approximate $1.9 billion for 2007.
Total debt approximated $8.7 billion and consolidated cash was $2.4 billion at September 30, 2007, compared with total debt of $9.8 billion and consolidated cash of $2.1 billion at June 30, 2007. Assuming average prices of $3.50 per pound for copper, $750 per ounce for gold and $30 per pound for molybdenum for the fourth quarter of 2007, total debt at year-end 2007 would approximate $7.3 billion and cash would approximate $1.5 billion.
In September 2007, FCX entered into an agreement to sell its international wire and cable business, Phelps Dodge International Corporation (PDIC), for $735 million. FCX expects to use the estimated net proceeds approximating $620 million to repay debt.

Freeport-McMoRan Copper & Gold Inc. 2
PHOENIX, AZ, October 24, 2007 – Freeport-McMoRan Copper & Gold Inc. (NYSE: FCX) reported third-quarter 2007 income from continuing operations applicable to common stock of $763 million, $1.85 per share, compared with $351 million, $1.67 per share, for the third quarter of 2006. For the nine months ended September 30, 2007, FCX reported income from continuing operations applicable to common stock of $2.3 billion, $6.46 per share, compared with $970 million, $4.64 per share, in the 2006 period. FCX’s nine-month 2007 financial and operating results include its wholly owned subsidiary Phelps Dodge’s results following its acquisition by FCX on March 19, 2007.
Results for the 2007 periods included the following special items: Net Income Pre-tax Net Income Per Share (In millions, except per share amounts) Impact Impact Impact Three Months Ended September 30, 2007 Purchase accounting impactsa $ 432 $ 271 $ 0.61 Noncash mark-to-market accounting adjustments
on Phelps Dodge’s copper price programs 44 26 0.06 Net losses on debt reductions 36 31 0.07 Gain on sale of marketable equity securities (47) (29) (0.06)Total special items $ 465 $ 299 $ 0.67 Nine Months Ended September 30, 2007
Purchase accounting impactsa $ 996 $ 624 $ 1.64 Noncash mark-to-market accounting adjustments
on Phelps Dodge’s copper price programs 212 129 0.34 Net losses on debt reductions 171 141 0.37 Gains on sales of marketable equity securities (85) (52) (0.14)Total special items $ 1,294 $ 842 $ 2.21
a. FCX recorded its preliminary allocation of the approximate $26 billion purchase price to Phelps Dodge’s assets and liabilities based on estimated fair values as of March 19, 2007. The charges to cost of sales primarily reflect the increases to property, plant, and equipment and metals inventories (including mill and leach stockpiles) resulting from this preliminary purchase price allocation. (See page 5.) These items do not affect operating cash flows. The purchase price allocation will be revised as valuation analyses are completed.
Third-quarter 2006 results included net losses on debt reductions totaling $43 million ($36 million to net income or $0.16 per share). Results for the first nine months of 2006 included net losses on debt reductions totaling $114 million ($74 million to net income or $0.33 per share), including a $69 million ($37 million to net income or $0.17 per share) loss on the redemption of FCX’s Gold-Denominated Preferred Stock, Series II.
James R. Moffett, Chairman of the Board, and Richard C. Adkerson, Chief Executive Officer, said, “Our third-quarter performance reflects a continuation of positive market conditions for copper, gold and molybdenum and strong operating results at our North American, South American and Indonesian operations. We are optimistic about the outlook to deliver strong volumes of metals which will enable us to generate significant cash flows, invest in attractive development projects, achieve our debt reduction objectives and provide returns to shareholders.”

Freeport-McMoRan Copper & Gold Inc. 3
SUMMARY FINANCIAL AND OPERATING DATA
Third Quarter Nine Months 2007 2006 2007a 2006 Financial Data (in millions, except per share amounts)
Revenues $5,066b $1,636 $12,755b $4,148c Operating income $1,877b, d $735 $5,403b, d $2,006c
Income from continuing operations applicable to common stocke $763b, d, f $351f $2,311b, d, f $970c, f
Net income applicable to common stocke $775b, d, f $351f $2,355b, d, f $970c, f Diluted net income per share of common stockg:
Continuing operations $1.85b, d, f $1.67f $6.46b, d, f $4.64c, f Discontinued operations 0.02 - 0.12 -
Diluted net income per share of common stock $1.87b, d, f $1.67f $6.58b, d, f $4.64c, f Diluted average common shares outstandingg, h 447 221 380 221 Operating cash flows $2,177 $692 $4,927 $1,068 Capital expenditures $466 $68 $1,138 $178
Operating Data – Sales from Mines Copper (millions of recoverable pounds)
FCX’s consolidated share 949 324 2,479 769 Average realized price per pound $3.53b $3.43 $3.43b $3.38
Gold (thousands of recoverable ounces)
FCX’s consolidated share 269 478 2,137 1,228 Average realized price per ounce $692.43 $608.57 $668.80 $540.67c
Molybdenum (millions of recoverable pounds)
FCX’s consolidated share 16 N/A 33 N/A Average realized price per pound $27.89 N/A $26.22 N/A
Note: Disclosures of after-tax amounts throughout this release are calculated by reference to the applicable tax rate. a. Includes Phelps Dodge results beginning March 20, 2007. b. Includes charges for noncash mark-to-market accounting adjustments on copper price protection programs
totaling $44 million ($26 million to net income or $0.06 per share) and a reduction in average realized prices of $0.04 per pound of copper in third-quarter 2007 and $212 million ($129 million to net income or $0.34 per share) and a reduction in average realized prices of $0.08 per pound in the 2007 nine-month period, representing the increase in the mark-to-market liability to fair value of $635 million at September 30, 2007.
c. Includes loss on redemption of FCX’s Gold-Denominated Preferred Stock, Series II totaling $69 million ($37 million to net income or $0.17 per share) and a reduction in average realized prices of $56.40 per ounce for the revenue adjustment relating to the redemption.
d. Includes the purchase accounting impact of the increase in the carrying amount of Phelps Dodge’s property, plant, and equipment and metals inventories totaling $446 million ($281 million to net income or $0.63 per share) in third-quarter 2007 and $1.0 billion ($646 million to net income or $1.70 per share) in the 2007 nine-month period, based on the preliminary purchase price allocation.
e. After preferred dividends. f. Includes net losses on early extinguishment of debt totaling $36 million ($31 million to net income or $0.07 per
share) in third-quarter 2007, $30 million ($29 million to net income or $0.13 per share) in third-quarter 2006, $171 million ($141 million to net income or $0.37 per share) in the 2007 nine-month period and $32 million ($30 million to net income or $0.14 per share) in the 2006 nine-month period for debt prepayments. Also includes gains totaling $47 million ($29 million to net income or $0.06 per share) in third-quarter 2007 and $85 million ($52 million to net income or $0.14 per share) in the 2007 nine-month period on sales of marketable equity securities.

Freeport-McMoRan Copper & Gold Inc. 4
g. Reflects assumed conversion of FCX’s 7% Convertible Senior Notes and 5½% Convertible Perpetual Preferred Stock. Also reflects assumed conversion of FCX’s 6¾% Mandatory Convertible Preferred Stock, which was issued on March 28, 2007. See Note g on page IV.
h. On March 19, 2007, FCX issued 136.9 million common shares to acquire Phelps Dodge. On March 28, 2007, FCX sold 47.15 million common shares. Common shares outstanding on September 30, 2007, totaled 382 million. Assuming conversion of the instruments discussed in Note g above, total potential common shares outstanding would be 444 million at September 30, 2007.
SUMMARY CONTRIBUTION ANALYSIS
FCX’s operating performance, including Phelps Dodge’s results beginning March 20, 2007, and the impact of purchase accounting adjustments, is shown below for the 2007 periods (in millions): Income from Operating Continuing Revenues Income Operations Three Months Ended September 30, 2007 FCX, excluding Phelps Dodge $ 1,260 $ 577 $ 50a
Phelps Dodge resultsb 3,806 1,732 1,047c
Purchase accounting impacts: Inventories and mill and leach stockpiles - (291) (184)Property, plant and equipment - (155) (97)Other - 14 10
Consolidated $ 5,066 $ 1,877 $ 826 Nine Months Ended September 30, 2007
FCX, excluding Phelps Dodge $ 5,082 $ 2,932 $ 1,054a
Phelps Dodge resultsb 7,673 3,467 2,025c
Purchase accounting impacts: Inventories and mill and leach stockpiles - (656) (414)Property, plant and equipment - (369) (232)Other - 29 22
Consolidated $ 12,755 $ 5,403 $ 2,455
a. Includes net losses on early extinguishment of debt totaling $36 million ($31 million to net income or $0.07 per share) in third-quarter 2007 and $171 million ($141 million to net income or $0.37 per share) in the 2007 nine-month period for debt prepayments, including the refinancing of FCX’s term loan. Also includes net interest expense totaling $129 million ($109 million to net income or $0.24 per share) in third-quarter 2007 and $318 million ($270 million to net income or $0.71 per share) in the 2007 nine-month period for new debt used to acquire Phelps Dodge.
b. Includes charges to revenues for noncash mark-to-market accounting adjustments on copper price protection programs totaling $44 million ($26 million to net income or $0.06 per share) in third-quarter 2007 and $212 million ($129 million to net income or $0.34 per share) in the 2007 nine-month period, representing the increase in the mark-to-market liability to fair value of $635 million at September 30, 2007. With the acquisition of Phelps Dodge, FCX assumed Phelps Dodge’s copper hedging contracts for which the price of 486 million pounds of copper to be sold in 2007 is capped at $2.00 per pound. These copper price protection programs will mature at December 31, 2007, and settle in the first quarter of 2008 based on the average LME price for 2007. FCX does not currently intend to enter into similar hedging programs in the future.
c. Includes gains totaling $47 million ($29 million to net income or $0.06 per share) in third-quarter 2007 and $85 million ($52 million to net income or $0.14 per share) in the 2007 nine-month period on sales of marketable equity securities.

Freeport-McMoRan Copper & Gold Inc. 5
Purchase Accounting. During the third quarter of 2007, FCX made adjustments to its preliminary purchase price allocation based on updated valuation models for its mill and leach stockpiles resulting in an approximate $1.0 billion increase in the related estimated fair values. The increase in these fair values resulted in higher net purchase accounting impacts than previous estimates for the third quarter ($446 million pre-tax for third quarter actual compared to $300 million pre-tax in previous estimates). FCX is continuing to work with third-party consultants to assign fair values to all assets acquired and liabilities assumed in the acquisition. Further changes to the preliminary values could be significant and could result in changes to reported interim financial results. A current summary of the preliminary purchase price allocation to the assets and liabilities on March 19, 2007, follows (in billions):
Preliminary Phelps Dodge Purchase Historical Fair Value Price Balances Adjustments Allocation Cash and cash equivalents $ 4.2 $ - $ 4.2 Inventories, including mill and leach stockpiles 0.9 2.8 3.7 Property, plant and equipment 6.0 14.8 20.8 Other assets 3.1 (0.3 ) 2.8 Allocation to goodwill - 6.5 6.5
Total assets 14.2 23.8 38.0 Deferred income taxes (current and long-term) (0.7 ) (6.1 ) (6.8 )Other liabilities (4.1 ) (0.1 ) (4.2 )Minority interests (1.2 ) - (1.2 )Total $ 8.2 $ 17.6 $ 25.8
The following table summarizes the estimated impacts of purchase accounting fair value adjustments on 2007 production costs and depreciation, depletion and amortization expense associated with the increases in the carrying values of Phelps Dodge’s metal inventories, mill and leach stockpiles and property, plant and equipment resulting from the acquisition of Phelps Dodge. These charges do not affect cash flows and are subject to change as FCX completes the final purchase price allocation.
2007 First Second Third Fourth Quarter Quarter Quarter Quarter Total (In millions) Actual Actual Actual Estimate Estimate Production costs $ 96 $ 269 $ 291 $ 100 $ 756 Depreciation, depletion and amortization 28 186 155 200 569 Total $ 124 $ 455 $ 446 $ 300 $ 1,325 Impact on net income $ 79 $ 286 $ 281 $ 189 $ 835
OPERATIONS
Consolidated copper sales of 949 million pounds in the third quarter of 2007 were higher than previous estimates of 900 million pounds reported on July 25, 2007, primarily because of a reduction in inventories resulting from the timing of shipments. Consolidated gold sales of 269,000 ounces in third-quarter 2007 were substantially higher than previous estimates because of mine sequencing at the Grasberg mine in Indonesia. As expected, consolidated gold sales in the 2007 third quarter were lower than the year ago period because of mining a section of lower grade ore. Consolidated unit net cash costs of $1.05 per pound were higher than the year-ago period primarily because of lower volumes at our Indonesian operations and higher costs in North America. Assuming average prices of $3.50 per pound for copper, $750 per ounce for gold and $30 per pound for molybdenum for the fourth quarter of 2007, unit net cash costs for the year 2007 would average approximately $0.75 per pound.

Freeport-McMoRan Copper & Gold Inc. 6
Third Quarter Nine Months 2007 2006 2007 2006 Actual Pro forma Pro forma Pro forma Consolidated Operating Data Copper (millions of recoverable pounds)
Production 911 911 2,958 2,595 Salesa 949 922 2,984 2,599 Average realized price per pound, excluding hedging $3.57 $3.47 $3.41 $3.14
Average realized price per pound, including hedging $3.53 $3.32 $3.34 $2.67
Unit net cash costsb $1.05 $0.77 $0.65 $0.70 Gold (thousands of recoverable ounces)
Production 216 481 2,143 1,319 Salesa 269 510 2,159 1,328 Average realized price per ounce $692.43 $611.94 $666.46 $540.94c
Molybdenum (millions of recoverable pounds) Production 18 16 53 51 Salesa 16 16 50 51 Average realized price per pound $27.89 $22.59 $25.12 $21.59
a. Excludes sales of purchased metal.
b. Reflects weighted average unit net cash costs, net of by-product credits, for all FCX mines. For reconciliations of unit net cash costs per pound by geographic region to production and delivery costs applicable to sales reported in FCX’s consolidated financial statements and pro forma consolidated financial results refer to the schedule, “Product Revenues and Production Costs,” available on our web site, “www.fcx.com.”
c. Includes a reduction of approximately $52 per ounce for a loss on redemption of FCX’s Gold-Denominated Preferred Stock, Series II.
North American Mining. FCX operates five open-pit copper mining complexes in North America (Morenci, Bagdad and Sierrita in Arizona and Chino and Tyrone in New Mexico) and conducts primary molybdenum mining operations at the Henderson mine in Colorado. By-product molybdenum is produced at Sierrita, Bagdad, Chino and Morenci. In addition, a new copper mining complex is under construction at Safford, Arizona, and FCX is assessing the restart of the Climax primary molybdenum mine in Colorado. All of these mining operations are wholly owned, except for Morenci. FCX records its 85 percent joint venture interest in Morenci using the proportionate consolidation method. The North American copper mining operations are operated in an integrated fashion and have long-lived reserves with significant additional development potential. Third Quarter Nine Months
Consolidated 2007 2006 2007 2006 North American Mining Operations Actual Pro forma Pro forma Pro forma
Copper (millions of recoverable pounds) Production 357 322 993 976 Salesa 376 303 1,016 970 Average realized price per pound:
Excluding hedging $3.48 $3.48 $3.29 $3.00 Including hedgingb $3.37 $3.00 $3.06 $1.75
Molybdenum (millions of recoverable pounds) Production 18 16 53 51 Salesa 16 16 50 51 Average realized price per pound $27.89 $22.59 $25.12 $21.59
a. Excludes sales of purchased metal.
b. Includes impact of hedging losses related to copper price protection programs.
Freeport-McMoRan Copper & Gold Inc. 7
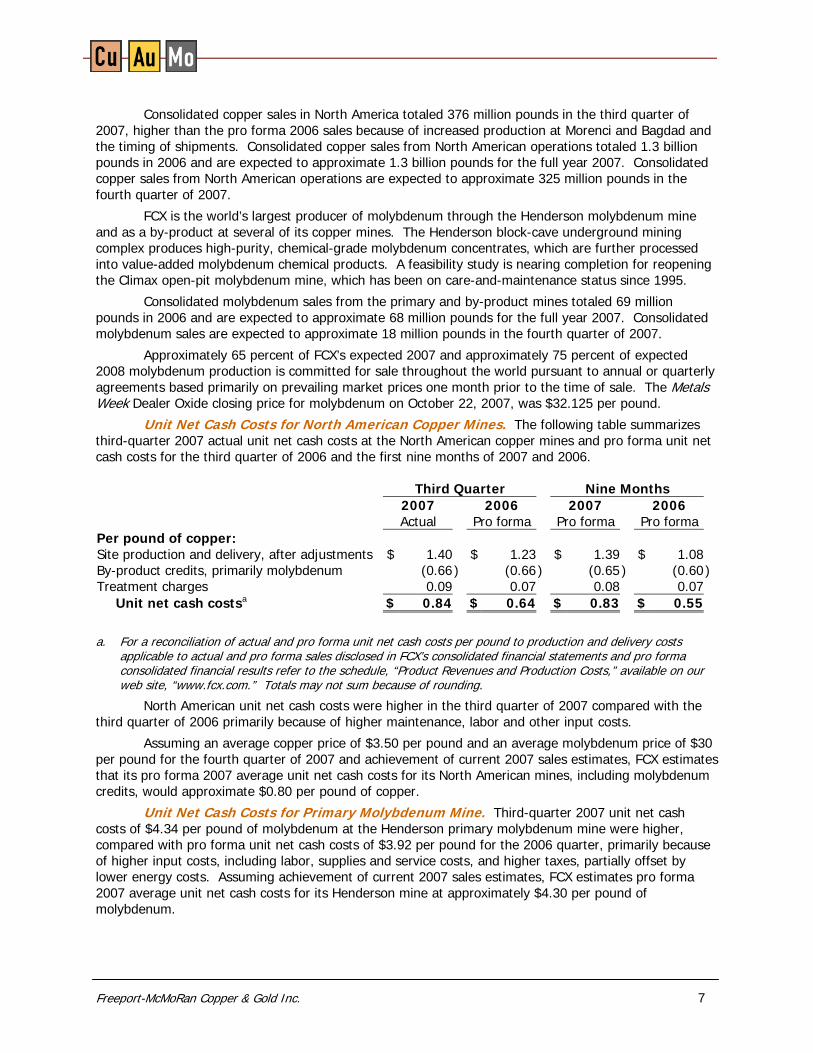
Consolidated copper sales in North America totaled 376 million pounds in the third quarter of 2007, higher than the pro forma 2006 sales because of increased production at Morenci and Bagdad and the timing of shipments. Consolidated copper sales from North American operations totaled 1.3 billion pounds in 2006 and are expected to approximate 1.3 billion pounds for the full year 2007. Consolidated copper sales from North American operations are expected to approximate 325 million pounds in the fourth quarter of 2007.
FCX is the world’s largest producer of molybdenum through the Henderson molybdenum mine and as a by-product at several of its copper mines. The Henderson block-cave underground mining complex produces high-purity, chemical-grade molybdenum concentrates, which are further processed into value-added molybdenum chemical products. A feasibility study is nearing completion for reopening the Climax open-pit molybdenum mine, which has been on care-and-maintenance status since 1995.
Consolidated molybdenum sales from the primary and by-product mines totaled 69 million pounds in 2006 and are expected to approximate 68 million pounds for the full year 2007. Consolidated molybdenum sales are expected to approximate 18 million pounds in the fourth quarter of 2007.
Approximately 65 percent of FCX’s expected 2007 and approximately 75 percent of expected 2008 molybdenum production is committed for sale throughout the world pursuant to annual or quarterly agreements based primarily on prevailing market prices one month prior to the time of sale. The Metals Week Dealer Oxide closing price for molybdenum on October 22, 2007, was $32.125 per pound.
Unit Net Cash Costs for North American Copper Mines. The following table summarizes third-quarter 2007 actual unit net cash costs at the North American copper mines and pro forma unit net cash costs for the third quarter of 2006 and the first nine months of 2007 and 2006.
Third Quarter Nine Months 2007 2006 2007 2006 Actual Pro forma Pro forma Pro forma Per pound of copper: Site production and delivery, after adjustments $ 1.40 $ 1.23 $ 1.39 $ 1.08 By-product credits, primarily molybdenum (0.66 ) (0.66 ) (0.65 ) (0.60 ) Treatment charges 0.09 0.07 0.08 0.07
Unit net cash costsa $ 0.84 $ 0.64 $ 0.83 $ 0.55 a. For a reconciliation of actual and pro forma unit net cash costs per pound to production and delivery costs
applicable to actual and pro forma sales disclosed in FCX’s consolidated financial statements and pro forma consolidated financial results refer to the schedule, “Product Revenues and Production Costs,” available on our web site, “www.fcx.com.” Totals may not sum because of rounding.
North American unit net cash costs were higher in the third quarter of 2007 compared with the third quarter of 2006 primarily because of higher maintenance, labor and other input costs.
Assuming an average copper price of $3.50 per pound and an average molybdenum price of $30 per pound for the fourth quarter of 2007 and achievement of current 2007 sales estimates, FCX estimates that its pro forma 2007 average unit net cash costs for its North American mines, including molybdenum credits, would approximate $0.80 per pound of copper.
Unit Net Cash Costs for Primary Molybdenum Mine. Third-quarter 2007 unit net cash costs of $4.34 per pound of molybdenum at the Henderson primary molybdenum mine were higher, compared with pro forma unit net cash costs of $3.92 per pound for the 2006 quarter, primarily because of higher input costs, including labor, supplies and service costs, and higher taxes, partially offset by lower energy costs. Assuming achievement of current 2007 sales estimates, FCX estimates pro forma 2007 average unit net cash costs for its Henderson mine at approximately $4.30 per pound of molybdenum.

Freeport-McMoRan Copper & Gold Inc. 8
South American Mining. FCX operates four copper mines in South America – Candelaria, Ojos del Salado and El Abra in Chile and Cerro Verde in Peru. These operations are consolidated in FCX’s financial statements, with outside ownership reported as minority interests.
FCX owns 80 percent of the Candelaria and Ojos del Salado mining complexes, which include the Candelaria open-pit and underground mines and the Ojos del Salado underground mines. These mines use certain common processing facilities to produce copper concentrates. FCX owns a 51 percent interest in El Abra, an open-pit mine producing electrowon copper cathodes. FCX owns a 53.6 percent equity interest in Cerro Verde, an open-pit mine producing both electrowon copper cathodes and copper concentrates. Cerro Verde recently completed a $900 million expansion project to process sulfide ore reserves through a new concentrator. The new concentrator reached full capacity in mid-2007 and averaged 104,700 metric tons of ore per day in the third quarter.
Third Quarter Nine Months Consolidated 2007 2006 2007 2006
South American Mining Operations Actual Pro forma Pro forma Pro forma
Copper (millions of recoverable pounds): Production 377 281 1,022 853 Sales 376 295 1,020 860 Average realized price per pound $3.63 $3.52 $3.48 $3.08
Gold (thousands of recoverable ounces): Production 31 27 83 86 Sales 31 27 84 85 Average realized price per ounce $679.30 $672.59 $666.94 $545.88
South American copper sales in the third quarter of 2007 were higher than in the third quarter of 2006 primarily reflecting higher production from Cerro Verde’s new concentrator (see page 11), partly offset by lower production at El Abra. Consolidated copper sales totaled 1.1 billion pounds from South American operations in 2006 and are expected to approximate 1.4 billion pounds for the full year 2007. Consolidated copper sales volumes from South American operations are expected to total 385 million pounds in the fourth quarter of 2007. The projected increases for full-year 2007, compared with full-year 2006, include incremental production from the new Cerro Verde concentrator.
Unit Net Cash Costs. The following table summarizes third-quarter 2007 actual unit net cash costs at the South American copper mines and pro forma unit net cash costs for the third quarter of 2006 and the first nine months of 2007 and 2006.
Third Quarter Nine Months 2007 2006 2007 2006 Actual Pro forma Pro forma Pro forma Per pound of copper: Site production and delivery, after adjustments $ 0.98 $ 0.87 $ 0.89 $ 0.77 By-product credits, primarily gold (0.09 ) (0.07 ) (0.08 ) (0.08 ) Treatment charges 0.24 0.20 0.21 0.18
Unit net cash costsa $ 1.14 $ 1.00 $ 1.02 $ 0.87
a. For a reconciliation of actual and pro forma unit net cash costs per pound to production and delivery costs applicable to actual and pro forma sales disclosed in FCX’s consolidated financial statements and pro forma consolidated financial results refer to the schedule, “Product Revenues and Production Costs,” available on our web site, “www.fcx.com.” Totals may not sum because of rounding.
South American unit net cash costs were higher in the third quarter of 2007 compared with the third quarter of 2006 primarily because of costs associated with Cerro Verde’s voluntary contribution program and higher energy, maintenance and other costs, partly offset by higher volumes. During the quarter, FCX agreed to the 5-year voluntary contribution program in Peru, resulting in a $33 million charge, $0.09 per pound, including $23 million, $0.06 per pound, related to production prior to the third quarter of 2007. The contribution in future periods is expected to be 3.75 percent of Cerro Verde profits. These amounts are not tax deductible.

Freeport-McMoRan Copper & Gold Inc. 9
Assuming achievement of current 2007 sales estimates, FCX estimates that its pro forma annual 2007 average unit net cash costs for its South American mines, including gold credits, would approximate $1.00 per pound of copper.
Indonesian Mining. Through its 90.6 percent owned subsidiary PT Freeport Indonesia (PT-FI), FCX operates the world’s largest copper and gold mine in terms of reserves at its Grasberg operations in Papua, Indonesia. After mining a high-grade section of the Grasberg open pit during the first half of 2007, PT-FI mined in a relatively low-grade section in the third quarter of 2007. Therefore, PT-FI reported lower third-quarter 2007 sales volumes compared with the third quarter of 2006. Gold volumes were higher than previous estimates primarily because of changes in the timing of access to higher grade ore in the Grasberg open pit.
Consolidated Third Quarter Nine Months Indonesian Mining Operations 2007 2006 2007 2006
Copper (millions of recoverable pounds): Production 177 308 943 766 Sales 197 324 948 769 Average realized price per pound $3.63 $3.43 $3.48 $3.38
Gold (thousands of recoverable ounces): Production 182 449 2,051 1,218 Sales 234 478 2,061 1,228 Average realized price per ounce $694.95 $608.57 $668.47 $540.67a
a. Amount was $597.07 per ounce before a loss on redemption of FCX’s Gold-Denominated Preferred Stock, Series II.
FCX’s consolidated share of annual sales from Indonesia in 2007 is projected to approximate 1.1 billion pounds of copper and over 2.1 million ounces of gold, in excess of 100,000 ounces higher than previous estimates because of higher ore grades. At the Grasberg mine, the sequencing in mining areas with varying ore grades causes fluctuations in the timing of ore production, resulting in varying quarterly and annual sales of copper and gold. PT-FI expects to be mining in a relatively low-grade section of the Grasberg open pit in the fourth quarter of 2007 and in the first half of 2008. As a result, fourth-quarter 2007 projected sales volumes, totaling approximately 165 million pounds of copper and 70 thousand ounces of gold, reflect the processing of lower ore grades.
Unit Net Cash Costs. PT-FI’s unit net cash costs, including gold and silver credits, averaged $1.30 per pound of copper during the third quarter of 2007, compared with $0.70 per pound in the 2006 quarter. The higher unit net cash costs in the 2007 quarter compared with the 2006 quarter reflect the significantly lower copper and gold volumes, partly offset by higher gold prices. Unit site production and delivery costs will vary with fluctuations in production volumes because of the primarily fixed nature of PT-FI’s cost structure. Because the majority of PT-FI’s costs are fixed, unit costs vary with the volumes sold and the price of gold, and therefore are currently projected to be significantly higher during the second half of 2007 than the average net cash credits of $0.25 per pound in the first half of the year.
Third Quarter Nine Months 2007 2006 2007 2006 Per pound of copper: Site production and delivery, after adjustments $ 1.76 $ 1.10 $ 1.10 $ 1.17 Gold and silver credits (0.90) (0.95) (1.50) (1.02) Treatment charges 0.34 0.44 0.35 0.43 Royalties 0.10 0.11 0.12 0.11
Unit net cash costsa $ 1.30 $ 0.70 $ 0.07 $ 0.69 a. For a reconciliation of unit net cash costs per pound to production and delivery costs applicable to sales reported
in FCX’s consolidated financial statements refer to the schedule, “Product Revenues and Production Costs,” available on our web site, “www.fcx.com.”
Freeport-McMoRan Copper & Gold Inc. 10
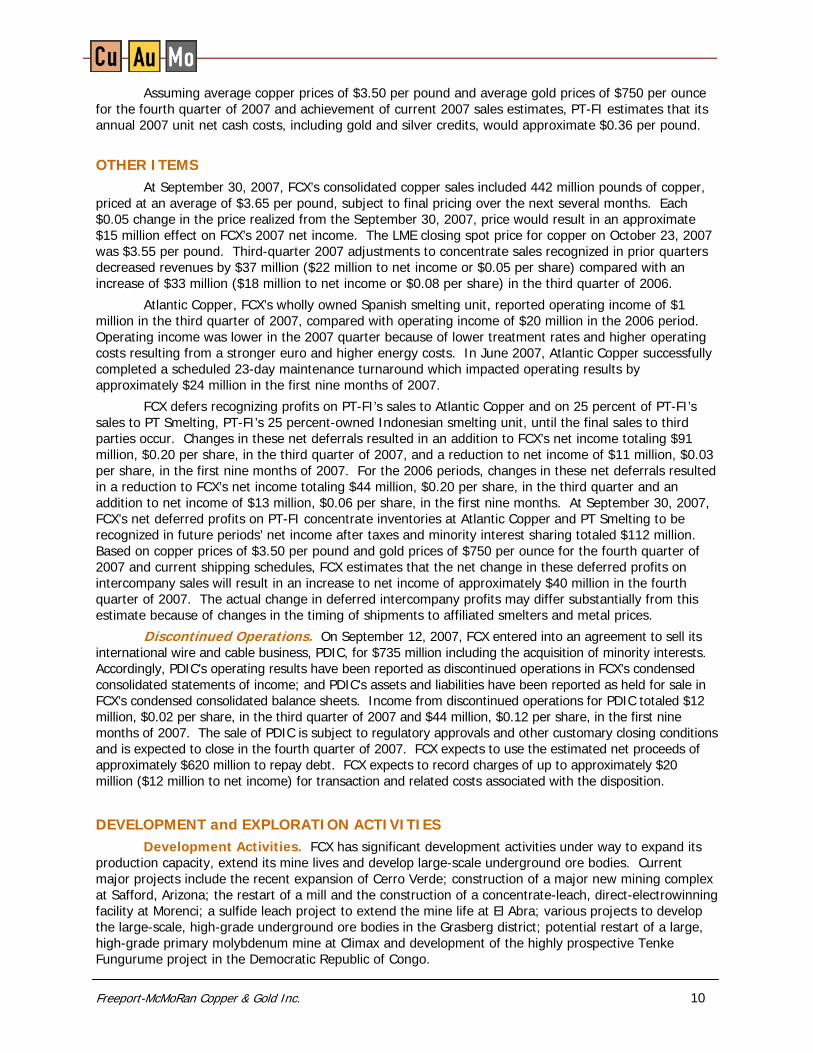
Assuming average copper prices of $3.50 per pound and average gold prices of $750 per ounce for the fourth quarter of 2007 and achievement of current 2007 sales estimates, PT-FI estimates that its annual 2007 unit net cash costs, including gold and silver credits, would approximate $0.36 per pound.
OTHER ITEMS At September 30, 2007, FCX’s consolidated copper sales included 442 million pounds of copper,
priced at an average of $3.65 per pound, subject to final pricing over the next several months. Each $0.05 change in the price realized from the September 30, 2007, price would result in an approximate $15 million effect on FCX’s 2007 net income. The LME closing spot price for copper on October 23, 2007 was $3.55 per pound. Third-quarter 2007 adjustments to concentrate sales recognized in prior quarters decreased revenues by $37 million ($22 million to net income or $0.05 per share) compared with an increase of $33 million ($18 million to net income or $0.08 per share) in the third quarter of 2006.
Atlantic Copper, FCX’s wholly owned Spanish smelting unit, reported operating income of $1 million in the third quarter of 2007, compared with operating income of $20 million in the 2006 period. Operating income was lower in the 2007 quarter because of lower treatment rates and higher operating costs resulting from a stronger euro and higher energy costs. In June 2007, Atlantic Copper successfully completed a scheduled 23-day maintenance turnaround which impacted operating results by approximately $24 million in the first nine months of 2007.
FCX defers recognizing profits on PT-FI’s sales to Atlantic Copper and on 25 percent of PT-FI’s sales to PT Smelting, PT-FI’s 25 percent-owned Indonesian smelting unit, until the final sales to third parties occur. Changes in these net deferrals resulted in an addition to FCX’s net income totaling $91 million, $0.20 per share, in the third quarter of 2007, and a reduction to net income of $11 million, $0.03 per share, in the first nine months of 2007. For the 2006 periods, changes in these net deferrals resulted in a reduction to FCX’s net income totaling $44 million, $0.20 per share, in the third quarter and an addition to net income of $13 million, $0.06 per share, in the first nine months. At September 30, 2007, FCX’s net deferred profits on PT-FI concentrate inventories at Atlantic Copper and PT Smelting to be recognized in future periods’ net income after taxes and minority interest sharing totaled $112 million. Based on copper prices of $3.50 per pound and gold prices of $750 per ounce for the fourth quarter of 2007 and current shipping schedules, FCX estimates that the net change in these deferred profits on intercompany sales will result in an increase to net income of approximately $40 million in the fourth quarter of 2007. The actual change in deferred intercompany profits may differ substantially from this estimate because of changes in the timing of shipments to affiliated smelters and metal prices.
Discontinued Operations. On September 12, 2007, FCX entered into an agreement to sell its international wire and cable business, PDIC, for $735 million including the acquisition of minority interests. Accordingly, PDIC’s operating results have been reported as discontinued operations in FCX’s condensed consolidated statements of income; and PDIC’s assets and liabilities have been reported as held for sale in FCX’s condensed consolidated balance sheets. Income from discontinued operations for PDIC totaled $12 million, $0.02 per share, in the third quarter of 2007 and $44 million, $0.12 per share, in the first nine months of 2007. The sale of PDIC is subject to regulatory approvals and other customary closing conditions and is expected to close in the fourth quarter of 2007. FCX expects to use the estimated net proceeds of approximately $620 million to repay debt. FCX expects to record charges of up to approximately $20 million ($12 million to net income) for transaction and related costs associated with the disposition.
DEVELOPMENT and EXPLORATION ACTIVITIES Development Activities. FCX has significant development activities under way to expand its
production capacity, extend its mine lives and develop large-scale underground ore bodies. Current major projects include the recent expansion of Cerro Verde; construction of a major new mining complex at Safford, Arizona; the restart of a mill and the construction of a concentrate-leach, direct-electrowinning facility at Morenci; a sulfide leach project to extend the mine life at El Abra; various projects to develop the large-scale, high-grade underground ore bodies in the Grasberg district; potential restart of a large, high-grade primary molybdenum mine at Climax and development of the highly prospective Tenke Fungurume project in the Democratic Republic of Congo.

Freeport-McMoRan Copper & Gold Inc. 11
In addition to the projects currently under way, FCX is undertaking a review of its assets to evaluate the potential for incremental expansion opportunities associated with existing ore bodies.
North America. Construction of the concentrate-leach, direct electrowinning facility at Morenci is essentially complete and the facility is currently being commissioned. This project uses FCX’s proprietary medium-temperature, pressure-leaching and direct-electrowinning technology which will enhance cost savings by processing concentrate on-site instead of shipping concentrate to smelters for treatment. With the recent restart of the mill, this project is designed to add 115 million pounds of copper per year. The overall project required a total capital investment of approximately $250 million.
The Safford copper mine will produce ore from two open-pit mines located in southeastern Arizona and includes a solution extraction/electrowinning facility. Construction commenced in August 2006 and is nearing completion. First production is expected in late 2007, with ramp-up to full production of approximately 240 million pounds per year in the first half of 2008. The total capital investment for this project approximates $625 million. FCX believes there is significant additional exploration and development potential in this district, including the Lone Star project.
FCX is in the final stages of evaluating the restart of the Climax mine near Leadville, Colorado. Climax is believed to be the largest, highest grade and lowest cost undeveloped molybdenum ore body in the world. The initial project would involve the restart of open pit mining and the construction of a new mill. Annual production would approximate 30 million pounds of molybdenum at estimated cash costs approximating $3.50 per pound. Capital costs estimates for the initial project approximate $500 million and the facilities could be in operation by 2010. Long lead time equipment has been ordered and a final investment decision is expected by year-end 2007. The evaluation is expected to confirm the restart as an attractive economic project. The project is designed to enable the consideration of further large scale expansion and FCX will consider a second phase of the Climax project which could potentially double annual molybdenum production.
South America. Cerro Verde’s recently completed $900 million mill expansion project to process sulfide ore reserves through a new concentrator is performing well. In June 2007, the mill reached design capacity of 108,000 metric tons of ore per day and averaged 104,700 metric tons per day in the third quarter. With the completion of the expansion, copper production at Cerro Verde is expected to approximate 650 million pounds per year (approximately 348 million pounds per year for FCX’s share). In addition, the expansion is expected to produce an average of approximately 8 million pounds of molybdenum per year (approximately 4 million pounds per year for FCX’s share) for the next five years.
At the end of 2006, a feasibility study was completed to evaluate the development of the large sulfide deposit at El Abra. This project would extend the mine life by nine years and copper production from the sulfides is targeted to begin in 2010. The existing facilities at El Abra would be used to process the additional reserves, minimizing capital spending requirements. Total initial capital for the project is approximately $450 million, the majority of which will be spent between 2008 and 2011. In March 2007, an environmental impact study associated with the sulfide project was submitted to Chilean authorities.
Indonesia. PT-FI has several projects in progress throughout the Grasberg District, including developing its large-scale underground ore bodies located beneath and adjacent to the Grasberg open pit. The Deep Ore Zone (DOZ) 50,000 metric tons of ore per day expansion is complete with third-quarter rates averaging 55,600 metric tons per day. A further expansion to 80,000 metric tons per day is under way with completion targeted by 2010. Other projects include the development of the high-grade Big Gossan mine, expected to ramp-up to full production of 7,000 metric tons per day in late 2010, the continued development of the Common Infrastructure project, which will provide access to the Grasberg underground ore body, the Kucing Liar ore body and future development of the mineralized areas below the DOZ mine.
Africa. FCX holds an effective 57.75 percent interest in the Tenke Fungurume copper/cobalt mining concessions in the Katanga province of the Democratic Republic of Congo. FCX is the operator of the project. The initial project at Tenke Fungurume is based on ore reserves of 103 million metric tons with ore grades of 2.1 percent copper and 0.3 percent cobalt. Based on the current mine plan, ore grades for the first ten years are expected to average 4.6 percent copper and 0.4 percent cobalt. Construction of this high potential project is in progress.
Freeport-McMoRan Copper & Gold Inc. 12
Operations are targeted to commence in 2009, with average annual production of approximately 250 million pounds of copper and approximately 18 million pounds of cobalt for the first 10 years. Based on the feasibility study, which assumes a long-term cobalt price of $12 per pound, life-of-mine unit net cash costs after by-product credits are estimated to be a net credit of $0.19 per pound of copper.
FCX is responsible for funding 70 percent of project development costs. The project’s estimated capital cost of $900 million increased from the previous estimate of $650 million primarily reflecting various inflationary pressures and scope changes. Capital cost estimates will continue to be reviewed. Approximately $157 million in capital costs have been incurred through September 30, 2007.
Exploration Activities. FCX is conducting exploration activities near its existing mines and in other high potential areas around the world. Aggregate exploration expenditures in 2007 are expected to approximate $135 million.
FCX’s exploration efforts in North America include drilling within the Safford district of the Lone Star deposit, located approximately four miles from the ore body currently under development, as well as targets in the Morenci and Bagdad districts. FCX is also conducting exploration activities near the Henderson ore body. In South America, exploration is ongoing in and around the Cerro Verde and Candelaria/Ojos del Salado deposits. In Africa, FCX is actively pursuing targets outside of the area of initial development at Tenke Fungurume. The number of drill rigs operating on these and other programs near the company’s minesites increased from 26 at the end of March 2007 to 39 currently.
PT-FI’s 2007 exploration efforts in Indonesia will continue to test extensions of the Deep Grasberg and Kucing Liar mine complex and to evaluate targets in the area between the Ertsberg East and Grasberg mineral systems from the new Common Infrastructure tunnels. Initial drill results from the Common Infrastructure tunnel are positive and additional drilling is in process. FCX continues its efforts to resume exploration activities in certain prospective areas in Papua, outside Block A (the Grasberg contract area). CASH and DEBT
At September 30, 2007, FCX had consolidated cash of $2.4 billion and net cash available to the parent company of $1.6 billion as shown below (in billions):
September 30, 2007 Cash from United States operations $ 0.1 Cash from international operations 2.3
Total consolidated cash 2.4 Less minority interests’ share (0.6)
Cash, net of minority interests’ share 1.8 Withholding tax if distributed (0.2) Net cash available to parent company $ 1.6
At September 30, 2007, FCX had $8.7 billion in debt, including $7.6 billion in acquisition debt, $0.7 billion in Phelps Dodge debt assumed in the transaction and $0.4 billion of previously existing FCX debt. The following table summarizes FCX’s debt transactions since June 30, 2007 (in billions):
Total debt at June 30, 2007 $ 9.8 Repayments:
Term loans, net (0.9) Other (0.2)
Total debt at September 30, 2007 $ 8.7
As discussed above, FCX anticipates proceeds net of taxes and transaction expenses of approximately $620 million for the sale of PDIC and will use proceeds from this sale to reduce debt further. Since completion of the Phelps Dodge transaction on March 19, 2007, FCX has repaid a total of $8.9 billion in debt, including $8.4 billion of an original $10 billion term loan.

Freeport-McMoRan Copper & Gold Inc. 13
OUTLOOK FCX’s pro forma consolidated sales volumes for 2007, including pre-acquisition Phelps Dodge sales,
are currently projected to approximate 3.9 billion pounds of copper, 2.3 million ounces of gold and 68 million pounds of molybdenum. Projected sales volumes for the fourth quarter of 2007 approximate 875 million pounds of copper, 100 thousand ounces of gold and 18 million pounds of molybdenum. The achievement of FCX’s sales estimates will be dependent, among other factors, on the achievement of targeted mining rates and expansion plans, the successful operation of production facilities, the impact of weather conditions and other factors.
Using estimated sales volumes for the fourth quarter of 2007 and assuming average prices of $3.50 per pound of copper, $750 per ounce of gold and $30 per pound of molybdenum in the fourth quarter of 2007, FCX’s consolidated operating cash flows would approximate $6.2 billion in 2007, including approximately $1.3 billion projected in the fourth quarter of 2007. Each $0.20 per pound change in copper prices in the fourth quarter would affect 2007 cash flows by approximately $140 million. FCX’s capital expenditures for 2007 are currently estimated to approximate $1.9 billion.
FCX expects to generate cash flows during 2007 significantly greater than its capital expenditures, minority interests distributions, dividends and other cash requirements. Assuming average prices of $3.50 per pound of copper, $750 per ounce of gold and $30 per pound of molybdenum in the balance of the year, and assuming excess cash is applied to reduce debt, total debt at year-end 2007 would approximate $7.3 billion and consolidated cash would approximate $1.5 billion. Based on these assumptions, FCX’s term debt (which had a $1.55 billion balance at September 30, 2007) would be substantially repaid by year-end 2007.
FINANCIAL POLICY FCX has a long track record for maximizing shareholder values through pursuing development
projects with high rates of return and returning cash to shareholders through common stock dividends and share purchases. FCX’s common stock annual dividend of $1.25 per share totals approximately $475 million per year. Preferred dividends total approximately $255 million per year.
Following the significant increase in debt associated with the acquisition of Phelps Dodge, FCX placed a high priority on debt reduction. As a result of the $5.6 billion of net proceeds from the issuance of common stock and 6¾% mandatory convertible preferred stock in March 2007 and positive performance of its operations, FCX has achieved meaningful debt reduction since the Phelps Dodge acquisition. The continuation of the positive performance of FCX’s operations would enable the company to reduce its debt further and to consider additional returns to shareholders. FCX’s management and its Board of Directors review the company’s financial policy on an ongoing basis. There are 12.2 million shares remaining under FCX’s Board-authorized 20-million share open market purchase program.
FCX is a leading international mining company with headquarters in Phoenix, Arizona. FCX operates large, long-lived, geographically diverse assets with significant proven and probable reserves of copper, gold and molybdenum. FCX has a dynamic portfolio of operating, expansion and growth projects in the copper industry and is the world’s largest producer of molybdenum. The company's portfolio of assets include the Grasberg mining complex, the world's largest copper and gold mine in terms of reserves, significant mining operations in the Americas, including the large scale Morenci/Safford minerals district in North America and the Cerro Verde and El Abra operations in South America, and the potential world-class Tenke Fungurume development project in the Democratic Republic of Congo. Additional information about FCX is available on our web site at www.fcx.com.

Freeport-McMoRan Copper & Gold Inc. 14
Cautionary Statement and Regulation G Disclosure: This press release contains forward-looking statements in which we discuss factors we believe may affect our performance in the future. Forward-looking statements are all statements other than historical facts, such as statements regarding projected ore grades and milling rates, projected sales volumes, projected unit net cash costs, projected operating cash flows, projected capital expenditures, the impact of copper, gold and molybdenum price changes, the impact of changes in deferred intercompany profits on earnings, projected debt and cash balances, projected sale of PDIC, and the impact of purchase accounting, including on production costs and depreciation, depletion and amortization expenses. Accuracy of the forward-looking statements depends on assumptions about events that change over time and is thus susceptible to periodic change based on actual experience and new developments. FCX cautions readers that it assumes no obligation to update or publicly release any revisions to the forward-looking statements in this press release and, except to the extent required by applicable law, does not intend to update or otherwise revise the forward-looking statements more frequently than quarterly. Additionally, important factors that might cause future results to differ from these projections include mine sequencing, production rates, industry risks, commodity prices, political risks, weather-related risks, labor relations, currency translation risks and other factors described in FCX's Quarterly Report on Form 10-Q for the three months ended March 31, 2007, filed with the Securities and Exchange Commission (SEC).
This press release also contains certain financial measures such as unit net cash costs per pound of copper and unit net cash costs per pound of molybdenum. As required by SEC Regulation G, reconciliations of these measures to amounts reported in FCX’s consolidated financial statements are available on our web site, “www.fcx.com.”
A copy of this press release is available on our web site, “www.fcx.com.” A conference call with securities analysts about third-quarter 2007 results is scheduled for today at 10:00 a.m. EDT. The conference call will be broadcast on the Internet along with slides. Interested parties may listen to the webcast live and view the slides by accessing “www.fcx.com.” A replay of the webcast will be available through Friday, November 16, 2007.
# # #

I
FREEPORT-McMoRan COPPER & GOLD INC. SELECTED OPERATING DATA
Three Months Ended September 30,
COPPER, Pro Formaa Production Sales
(millions of recoverable pounds) 2007 2006 2007 2006 MINED COPPER (FCX’s net interest in %)
North America Morenci (85%) 187
b 176
b 202
b 173
b
Bagdad (100%) 58 41 58 36 Sierrita (100%) 41 40 44 34 Chino (100%) 49 41 51 41 Tyrone (100%) 12 17 15 16 Miami (100%) 6 5 6 1 Tohono (100%) 1 1 - 1 Manufacturing and other (100%) 3 1 - 1
Total North America 357 322 376 303 South America Candelaria/Ojos del Salado (80%) 118 105 118 110 Cerro Verde (53.6%) 171 54 174 53 El Abra (51%) 88 122 84 132
Total South America 377 281 376 295 Indonesia Grasberg (90.6%) 177
c 308
c 197
c 324
c
Consolidated 911 911 949 922 Less minority participants’ share 163 135 164 142
Net 748 776 785 780
Consolidated sales from mines 949 922 Purchased copper 167 195
Total consolidated sales 1,116 1,117
Average realized price per pound Excluding hedging $3.57 $3.47 Including hedging $3.53
d $3.32
d
GOLD, Pro Forma
a
(thousands of recoverable ounces) MINED GOLD (FCX’s net interest in %) North America (100%) 3
b 5
b 4
b 5
b
South America (80%) 31 27 31 27 Indonesia (90.6%) 182
c 449
c 234
c 478
c
Consolidated 216 481 269 510 Less minority participants’ shares 24 47 28 51 Net 192 434 241 459
Consolidated sales from mines 269 510 Purchased gold 2 3
Total consolidated sales 271 513
Average realized price per ounce $692.43 $611.94 MOLYBDENUM, Pro Forma
a
(millions of recoverable pounds) MINED MOLYBDENUM (FCX’s net interest in %) North America
Henderson (100%) 10 9 N/A N/A By-product (100%) 8 7 N/A N/A
Consolidated 18 16 16 16 Purchased molybdenum 2 3 Total consolidated sales 18 19
Average realized price per pound $27.89 $22.59
a. The third-quarter 2006 data include Phelps Dodge’s pre-acquisition results for comparative purposes only. b. Amounts are net of Morenci’s joint venture partner’s 15 percent interest. c. Amounts are net of Grasberg’s joint venture partner’s interest, which varies in accordance with the terms of the joint venture agreement. d. Includes reductions of $0.04 per pound for third-quarter 2007 and $0.15 per pound for third-quarter 2006 for mark-to-market accounting
adjustments on copper price protection programs.

II
FREEPORT-McMoRan COPPER & GOLD INC. SELECTED OPERATING DATA
(continued)
Nine Months Ended September 30,
COPPER, Pro Formaa Production Sales
(millions of recoverable pounds) 2007 2006 2007 2006 MINED COPPER (FCX’s net interest in %)
North America Morenci (85%) 528
b 515
b 534
b 512
b
Bagdad (100%) 151 119 151 119 Sierrita (100%) 113 122 121 121 Chino (100%) 134 144 137 144 Tyrone (100%) 36 49 40 48 Miami (100%) 15 15 19 14 Tohono (100%) 3 4 2 4 Manufacturing and other (100%) 13 8 12 8
Total North America 993 c 976 1,016
c 970
South America Candelaria/Ojos del Salado (80%) 326 330 330 330 Cerro Verde (53.6%) 425 156 419 154 El Abra (51%) 271 367 271 376
Total South America 1,022 c 853 1,020
c 860
Indonesia Grasberg (90.6%) 943
d 766
d 948
d 769
d
Consolidated 2,958 2,595 2,984 2,599 Less minority participants’ share 484 390 482 394
Net 2,474 2,205 2,502 2,205
Consolidated sales from mines 2,984 2,599 Purchased copper 524 609
Total consolidated sales 3,508 3,208
Average realized price per pound Excluding hedging $3.41 $3.14 Including hedging $3.34
e $2.67
e
GOLD, Pro Forma
a
(thousands of recoverable ounces) MINED GOLD (FCX’s net interest in %)
North America (100%) 9 b 15
b 14
b 15
b
South America (80%) 83 f 86 84
f 85
Indonesia (90.6%) 2,051 d 1,218
d 2,061
d 1,228
d
Consolidated 2,143 1,319 2,159 1,328 Less minority participants’ shares 209 131 210 133 Net 1,934 1,188 1,949 1,195
Consolidated sales from mines 2,159 1,328 Purchased gold 6 11
Total consolidated sales 2,165 1,339
Average realized price per ounce $666.46 $540.94 g
MOLYBDENUM, Pro Forma
a
(millions of recoverable pounds) MINED MOLYBDENUM (FCX’s net interest in %)
North America Henderson (100%) 30 28 N/A N/A By-product (100%) 23 23 N/A N/A
Consolidated 53 h 51 50
h 51
Purchased molybdenum 7 7 Total consolidated sales 57 58
Average realized price per pound $25.12 $21.59 a. Includes Phelps Dodge’s pre-acquisition results for comparative purposes only. b. Amounts are net of Morenci’s joint venture partner’s 15 percent interest. c. Includes North American copper production of 258 million pounds and sales of 283 million pounds and South American copper production of 259
million pounds and sales of 222 million pounds for Phelps Dodge’s pre-acquisition results. d. Amounts are net of Grasberg’s joint venture partner’s interest, which varies in accordance with the terms of the joint venture agreement. e. Includes reductions of $0.07 per pound for the 2007 nine-month period and $0.47 per pound for the 2006 nine-month period for mark-to-market
accounting adjustments on copper price protection programs. f. Includes gold production of 21 thousand ounces and sales of 18 thousand ounces for Phelps Dodge’s pre-acquisition results. g. Includes a reduction of approximately $52 per ounce for a loss on redemption of FCX’s Gold-Denominated Preferred Stock, Series II. h. Includes molybdenum production of 14 million pounds and sales of 17 million pounds for Phelps Dodge’s pre-acquisition results.

III
FREEPORT-McMoRan COPPER & GOLD INC. SELECTED OPERATING DATA
(continued)
Three Months Ended Nine Months Ended
September 30, September 30,
Statistical Data from Mining Operations, 100%a 2007 2006 2007 2006
North America (copper and molybdenum mines) Copper Mines
Solution Extraction/Electrowinning (SX/EW) Operations Leach ore placed in stockpiles (metric tons per day) 797,600 772,600 739,800 816,900 Average copper ore grade (%) 0.21 0.32 0.25 0.30 Copper production (millions of recoverable pounds) 216 223 637 675
Mill Operations
Ore milled (metric tons per day) 226,400 203,100 221,000 194,800 Average ore grade (%)
Copper 0.36 0.33 0.34 0.33 Molybdenum 0.03 0.02 0.02 0.02
Production (millions of recoverable pounds) Copper 141 99 356 301 Molybdenum 8 7 23 23
Primary Molybdenum Mine
Ore milled (metric tons per day) 22,300 19,500 24,000 22,000 Average molybdenum ore grade (%) 0.25 0.25 0.23 0.23 Molybdenum production (millions of recoverable pounds) 10 9 30 28
South America (copper mines) SX/EW Operations
Leach ore placed in stockpiles (metric tons per day) 286,700 265,600 289,300 257,500 Average copper ore grade (%) 0.45 0.42 0.42 0.45 Copper production (millions of recoverable pounds) 139 176 430 523
Mill Operations Ore milled (metric tons per day) 181,400 69,300 163,700 64,300 Average copper ore grade (%) 0.76 0.81 0.72 0.88 Copper production (millions of recoverable pounds) 238 105 592 330
Indonesia (copper mine) Mill Operations
Ore milled (metric tons per day) 198,600 230,100 213,900 223,600 Average ore grade
Copper (%) 0.58 0.85 0.88 0.76 Gold (grams per metric ton) 0.70 0.83 1.47 0.81
Recovery rates (%) Copper 89.1 85.9 90.9 84.3 Gold 83.0 80.5 87.4 79.4
Copper (millions of recoverable pounds) Production 194 325 984 831 Sales 214 343 989 834
Gold (thousands of recoverable ounces) Production 327 456 2,362 1,253 Sales 383 487 2,371 1,267
a. Includes Phelps Dodge pre-acquisition results for comparative purposes only.

IV
FREEPORT-McMoRan COPPER & GOLD INC. CONDENSED CONSOLIDATED STATEMENTS OF INCOME (Unaudited)
Three Months Ended Nine Months Ended September 30, September 30,
2007 2006 2007a 2006
(In Millions, Except Per Share Amounts) Revenues
b $ 5,066 $ 1,636 $ 12,755 $ 4,148
Cost of sales: Production and delivery 2,662
c 792 6,105
c 1,875
Depreciation, depletion and amortization 356c 60 846
c 147
Total cost of sales 3,018 852 6,951 2,022 Exploration and research expenses 40 4 87 9 Selling, general and administrative expenses 131
d 45 314
d 111
Total costs and expenses 3,189 901 7,352 2,142
Operating income 1,877 735 5,403 2,006 Interest expense, net (155) (18) (386) (62) Losses on early extinguishment and conversion of debt, net (36) (30) (171) (32) Gains on sales of assets 47
e 21 85
e 30
Other income, net 48 6 110 17 Equity in affiliated companies’ net earnings 5 2 17 7
Income from continuing operations before income taxes and minority interests 1,786 716 5,058 1,966
Provision for income taxes (653) (304) (1,875) (836) Minority interests in net income of consolidated subsidiaries (307) (46) (728) (115)
Income from continuing operations 826 366 2,455 1,015 Income from discontinued operations (net of taxes of $5 million
in three-month period and $20 million in nine-month period) 12f - 44
f -
Preferred dividends (63) (15) (144) (45)
Net income applicable to common stock $ 775 $ 351 $ 2,355 $ 970
Basic net income per share of common stock: Continuing operations $2.00 $1.85 $7.06 $5.14 Discontinued operations 0.03
f - 0.13
f -
Basic net income per share of common stock $2.03 $1.85 $7.19 $5.14
Diluted net income per share of common stock: Continuing operations $1.85 $1.67 $6.46 $4.64 Discontinued operations 0.02
f - 0.12
f -
Diluted net income per share of common stockg $1.87 $1.67 $6.58 $4.64
Average common shares outstanding:
Basic 382h 190 327
h 189
Dilutedg 447 221 380 221
Dividends paid per share of common stock $0.3125 $1.0625 $0.9375 $2.9375
a. Includes Phelps Dodge results beginning March 20, 2007. b. Includes positive (negative) adjustments to prior period concentrate sales totaling $(37) million in the 2007 quarter, $33
million in the 2006 quarter, $90 million in the 2007 nine-month period and $139 million in the 2006 nine-month period. In addition, charges for mark-to-market accounting adjustments for losses on copper price protection program totaled $44 million in the 2007 quarter and $212 million in the 2007 nine-month period. The 2006 nine-month period also includes a $69 million loss on the mandatory redemption of FCX’s Gold-Denominated Preferred Stock, Series II.
c. Includes impact of purchase accounting adjustments related to the Phelps Dodge acquisition, which increased production costs by $277 million in the 2007 quarter and $627 million in the 2007 nine-month period and increased depreciation, depletion and amortization by $155 million in the 2007 quarter and $369 million in the 2007 nine-month period.
d. Includes additional costs relating to the acquisition of Phelps Dodge totaling $69 million in the 2007 quarter and $137 million in the 2007 nine-month period. Also includes stock-based compensation costs related to second-quarter 2007 stock option grants totaling $9 million in the 2007 quarter and $33 million in the 2007 nine-month period.
e. Represents gains on sales of marketable equity securities. f. Relates to the operations of PDIC, which FCX entered into an agreement to sell on September 12, 2007. g. Reflects assumed conversion of FCX’s 7% Convertible Senior Notes and 5½% Convertible Perpetual Preferred Stock,
resulting in the exclusion of interest expense totaling less than $0.1 million in the 2007 quarter, $3 million in the 2006 quarter, $0.2 million in the 2007 nine-month period and $13 million in the 2006 nine-month period and dividends totaling $15 million in each of the third quarters of 2007 and 2006 and $45 million in each of the nine-month periods of 2007 and 2006. The 2007 periods also include assumed conversion of FCX’s 6¾% Mandatory Convertible Preferred Stock, of which FCX sold 28.75 million shares on March 28, 2007, reflecting exclusion of dividends totaling $48 million for the 2007 quarter and $99 million for the 2007 nine-month period. The assumed conversions reflect the inclusion of 62 million common shares in the 2007 quarter, 30 million common shares in the 2006 quarter, 50 million common shares in the 2007 nine-month period and 31 million common shares in the 2006 nine-month period.
h. On March 19, 2007, FCX issued 136.9 million shares to acquire Phelps Dodge; and on March 28, 2007, FCX sold 47.15 million common shares in a public offering.

V
FREEPORT-McMoRan COPPER & GOLD INC. CONDENSED CONSOLIDATED BALANCE SHEETS (Unaudited)
September 30, December 31, 2007 2006 (In Millions) ASSETS Current assets:
Cash and cash equivalents $ 2,377 $ 907 Accounts receivable 2,165 486 Inventories 2,135 724 Mill and leach stockpiles 614 - Prepaid expenses, restricted cash and other 152 34 Assets held for sale 1,231
a -
Total current assets 8,674 2,151 Property, plant, equipment and development costs, net 24,020 3,099 Trust assets 609 - Long-term mill and leach stockpiles 1,099 - Goodwill 6,332
b -
Other assets 655 140
Total assets $ 41,389 $ 5,390
LIABILITIES AND STOCKHOLDERS’ EQUITY Current liabilities:
Accounts payable and accrued liabilities $ 2,695 $ 789 Accrued income taxes 815 165 Copper price protection program 635 - Current portion of long-term debt and short-term borrowings 67 19 Liabilities related to assets held for sale 472
a -
Total current liabilities 4,684 973 Long-term debt, less current portion:
Senior notes 6,953 620 Term loan 1,550 - Project financing, equipment loans and other 162 41
Total long-term debt, less current portion 8,665 661 Deferred income taxes 6,816 800 Other liabilities and deferred credits 1,492 298
Total liabilities 21,657 2,732 Minority interests 1,699 213 Stockholders’ equity:
5½% Convertible perpetual preferred stock 1,100 1,100 6¾% Mandatory convertible preferred stock 2,875 - Common stock 50 31 Capital in excess of par value 13,359 2,668 Retained earnings 3,474 1,415 Accumulated other comprehensive loss (1 ) (20 ) Common stock held in treasury (2,824 ) (2,749 )
Total stockholders’ equity 18,033 2,445
Total liabilities and stockholders’ equity $ 41,389 $ 5,390
a. Represents the assets and liabilities of PDIC. b. Second-quarter and third-quarter 2007 adjustments to the preliminary fair values assigned to the assets
acquired and the liabilities assumed from Phelps Dodge and adjustments to the purchase price resulted in a $0.9 billion reduction in goodwill. Additional adjustments, which could be significant, are expected in future periods until FCX finalizes its valuation of the assets acquired and liabilities assumed.

VI
FREEPORT-McMoRan COPPER & GOLD INC. CONDENSED CONSOLIDATED STATEMENTS OF CASH FLOWS (Unaudited)
Nine Months Ended September 30,
2007a 2006
(In Millions) Cash flow from operating activities:
Net income $ 2,499 $ 1,015 Adjustments to reconcile net income to net cash provided by
operating activities: Unrealized losses on copper price protection program 212 - Depreciation, depletion and amortization 864 147 Minority interests in net income of consolidated subsidiaries 738 115 Noncash compensation and benefits 143 51 Losses on early extinguishment and conversion of debt, net 171 32 Gains on sales of assets (85 ) (30 ) Deferred income taxes (279 ) 13 Other 21 25 (Increases) decreases in working capital, excluding amounts
acquired from Phelps Dodge: Accounts receivable (299 ) 131 Inventories 358 (182 ) Prepaid expenses, restricted cash and other - (24 ) Accounts payable and accrued liabilities 369 (77 ) Accrued income taxes 215 (148 ) Net cash provided by operating activities 4,927 1,068
Cash flow from investing activities: Acquisition of Phelps Dodge, net of cash acquired (13,907 ) - Phelps Dodge capital expenditures (834 ) - PT Freeport Indonesia capital expenditures (273 ) (165 ) Other capital expenditures (31 ) (13 ) Sale of assets and other 79 31
Net cash used in investing activities (14,966 ) (147 ) Cash flow from financing activities:
Proceeds from term loans under bank credit facility 12,450 - Repayments of term loans under bank credit facility (10,900 ) - Net proceeds from sales of senior notes 5,880 - Net proceeds from sale of 6¾% mandatory convertible preferred stock 2,803 - Net proceeds from sale of common stock 2,816 - Proceeds from other debt 412 125 Repayments of other debt (752 ) (322 ) Purchases of FCX common shares - (100 ) Cash dividends paid: Common stock (301 ) (559 ) Preferred stock (112 ) (45 ) Minority interests (440 )
b (114 )
b
Net (payments for) proceeds from exercised stock options (15 ) 14 Excess tax benefit from exercised stock options 9 21 Bank credit facilities fees and other (250 ) (6 )
Net cash provided by (used in) financing activities 11,600 (986 )
Cash included in assets held for sale (91 ) -
Net increase (decrease) in cash and cash equivalents 1,470 (65 ) Cash and cash equivalents at beginning of year 907 764
Cash and cash equivalents at end of period $ 2,377 $ 699
a. Includes Phelps Dodge results beginning March 20, 2007. b. Represents minority interests’ share of dividends.
VII
FREEPORT-McMoRan COPPER & GOLD INC. PRO FORMA FINANCIAL DATA (Unaudited)
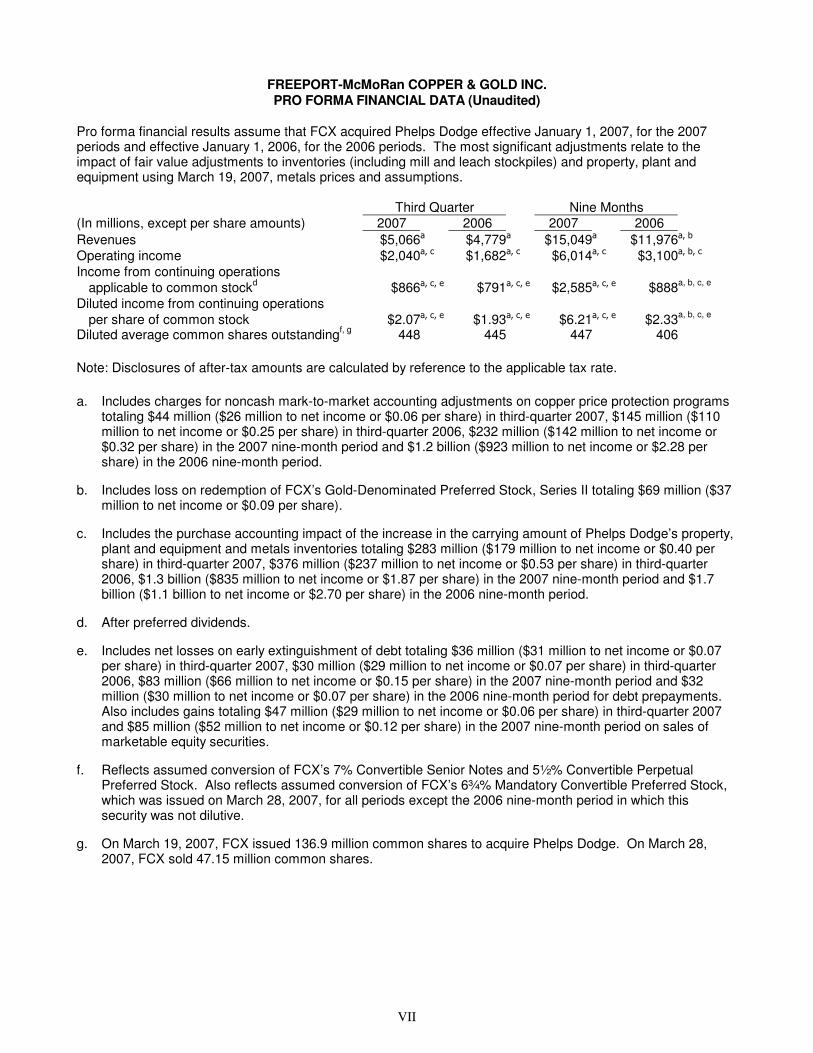
Pro forma financial results assume that FCX acquired Phelps Dodge effective January 1, 2007, for the 2007 periods and effective January 1, 2006, for the 2006 periods. The most significant adjustments relate to the impact of fair value adjustments to inventories (including mill and leach stockpiles) and property, plant and equipment using March 19, 2007, metals prices and assumptions.
Third Quarter Nine Months (In millions, except per share amounts) 2007 2006 2007 2006 Revenues $5,066a $4,779a $15,049a $11,976a, b
Operating income $2,040a, c $1,682a, c $6,014a, c $3,100a, b, c
Income from continuing operations applicable to common stockd $866a, c, e $791a, c, e $2,585a, c, e $888a, b, c, e
Diluted income from continuing operations per share of common stock $2.07a, c, e $1.93a, c, e $6.21a, c, e $2.33a, b, c, e
Diluted average common shares outstandingf, g 448 445 447 406
Note: Disclosures of after-tax amounts are calculated by reference to the applicable tax rate.
a. Includes charges for noncash mark-to-market accounting adjustments on copper price protection programs totaling $44 million ($26 million to net income or $0.06 per share) in third-quarter 2007, $145 million ($110 million to net income or $0.25 per share) in third-quarter 2006, $232 million ($142 million to net income or $0.32 per share) in the 2007 nine-month period and $1.2 billion ($923 million to net income or $2.28 per share) in the 2006 nine-month period.
b. Includes loss on redemption of FCX’s Gold-Denominated Preferred Stock, Series II totaling $69 million ($37 million to net income or $0.09 per share).
c. Includes the purchase accounting impact of the increase in the carrying amount of Phelps Dodge’s property, plant and equipment and metals inventories totaling $283 million ($179 million to net income or $0.40 per share) in third-quarter 2007, $376 million ($237 million to net income or $0.53 per share) in third-quarter 2006, $1.3 billion ($835 million to net income or $1.87 per share) in the 2007 nine-month period and $1.7 billion ($1.1 billion to net income or $2.70 per share) in the 2006 nine-month period.
d. After preferred dividends.
e. Includes net losses on early extinguishment of debt totaling $36 million ($31 million to net income or $0.07 per share) in third-quarter 2007, $30 million ($29 million to net income or $0.07 per share) in third-quarter 2006, $83 million ($66 million to net income or $0.15 per share) in the 2007 nine-month period and $32 million ($30 million to net income or $0.07 per share) in the 2006 nine-month period for debt prepayments. Also includes gains totaling $47 million ($29 million to net income or $0.06 per share) in third-quarter 2007 and $85 million ($52 million to net income or $0.12 per share) in the 2007 nine-month period on sales of marketable equity securities.
f. Reflects assumed conversion of FCX’s 7% Convertible Senior Notes and 5½% Convertible Perpetual Preferred Stock. Also reflects assumed conversion of FCX’s 6¾% Mandatory Convertible Preferred Stock, which was issued on March 28, 2007, for all periods except the 2006 nine-month period in which this security was not dilutive.
g. On March 19, 2007, FCX issued 136.9 million common shares to acquire Phelps Dodge. On March 28, 2007, FCX sold 47.15 million common shares.

VIII
FREEPORT-McMoRan COPPER & GOLD INC. PRODUCT REVENUES AND PRODUCTION COSTS
PRODUCT REVENUES AND UNIT NET CASH COSTS Unit net cash costs per pound of copper and per pound of molybdenum is a measure intended to provide investors with information about the cash generating capacity of FCX’s mining operations expressed on a basis relating to the primary metal product for the respective operations. FCX uses this measure for the same purpose and for monitoring operating performance by its mining operations. This information differs from measures of performance determined in accordance with U.S. generally accepted accounting principles and should not be considered in isolation or as a substitute for measures of performance determined in accordance with U.S. generally accepted accounting principles. This measure is presented by other metals mining companies, although FCX’s measures may not be comparable to similarly titled measures reported by other companies.
FCX presents gross profit per pound of copper using both a “by-product” method and a “co-product” method. FCX uses the by-product method in its presentation of gross profit per pound of copper because (1) the majority of its revenues are copper revenues, (2) it mines ore, which contains copper, gold, molybdenum and other metals, (3) it is not possible to specifically assign all of FCX’s costs to revenues from the copper, gold, and molybdenum and other metals it produces, (4) it is the method used to compare mining operations in certain industry publications and (5) it is the method used by FCX’s management and Board of Directors to monitor its operations. In the co-product method presentations below, costs are allocated to the different products based on their relative revenue values, which will vary to the extent our metals sales volumes and realized prices change.
In both the by-product and the co-product method calculations below, FCX shows adjustments to copper revenues for prior period open sales as separate line items. Because the copper pricing adjustments do not result from current period sales, FCX has reflected these separately from revenues on current period sales. Noncash and nonrecurring costs consist of items such as stock-based compensation costs, write-offs of equipment or unusual charges. They are removed from site production and delivery costs in the calculation of unit net cash costs. In addition, costs resulting from the application of the purchase accounting method are removed. As discussed above, gold, molybdenum and other metal revenues, excluding any impacts from redemption of the gold- and silver-denominated preferred stocks, are reflected as credits against site production and delivery costs in the by-product method. Presentations under both methods are shown below together with reconciliations to amounts reported in FCX’s consolidated financial statements or pro forma consolidated financial results.

IX
FREEPORT-McMoRan COPPER & GOLD INC. PRODUCT REVENUES AND PRODUCTION COSTS
(continued)
North America Mining Product Revenues and Production Costs and Unit Net Cash Costs
Three Months Ended September 30, 2007 By-Product Co-Product Method
(In Millions) Method Copper Molybdenum a Other b Total
Revenues, after adjustments shown below $ 1,320 $ 1,320 $ 245 $ 14 $ 1,579
Site production and delivery, before net noncash and nonrecurring costs shown below 528 459 75 6 540
By-product credits (247 ) - - - -Treatment charges 33 33 - - 33
Net cash costs 314 492 75 6 573Depreciation and amortization 69 62 7 1 69Noncash and nonrecurring costs, net 5 5 - - 5
Total costs 388 559 82 7 648Revenue adjustments, primarily for pricing
on prior period open sales and hedging (56 ) (56 ) - - (56 )Idle facility and other non-inventoriable costs (8 ) (8 ) - - (8 )Gross profit $ 867 $ 697 $ 163 $ 7 $ 867
Consolidated sales
Copper (in million pounds) 376 376 Molybdenum (in million pounds) 8
Gross profit per pound of copper and molybdenum:
Revenues, after adjustments shown below $ 3.51 $ 3.51 $ 31.80
Site production and delivery, before net noncash and nonrecurring costs shown below 1.40 1.22 9.69
By-product credits (0.66 ) - - Treatment charges 0.09 0.09 -
Unit net cash costs 0.84 1.31 9.69 Depreciation and amortization 0.18 0.16 0.95 Noncash and nonrecurring costs, net 0.01 0.01 0.02
Total unit costs 1.03 1.49 10.66 Revenue adjustments, primarily for pricing
on prior period open sales and hedging (0.15 ) (0.15 ) - Idle facility and other non-inventoriable costs (0.02 ) (0.02 ) - Gross profit per pound $ 2.31 $ 1.85 $ 21.14
Reconciliation to Amounts Reported
Production Depreciation and and
(In Millions) Revenues Delivery Amortization Totals presented above $ 1,579 $ 540 $ 69 Net noncash and nonrecurring costs
per above N/A 5 N/A Treatment charges per above N/A 33 N/A Revenue adjustments, primarily for pricing
on prior period open sales and hedging per above (56 ) N/A N/A
Other North America operations 1,488 1,413 22 Purchase accounting impact N/A 174 115 Total North American mining operations 3,011 2,165 206 Eliminations and other 2,055 497 150 As reported in FCX’s consolidated
financial statements $ 5,066 $ 2,662 $ 356
a. Molybdenum by-product credits reflect volumes produced at market-based pricing and also include tolling revenues at Sierrita.
b. Includes gold and silver.

X
FREEPORT-McMoRan COPPER & GOLD INC. PRODUCT REVENUES AND PRODUCTION COSTS
(continued)
North America Mining Product Revenues and Production Costs and Unit Net Cash Costs (Pro Forma)
Three Months Ended September 30, 2006 By-Product Co-Product Method
(In Millions) Method Copper Molybdenum a Other b Total
Revenues, after adjustments shown below $ 1,024 $ 1,024 $ 198 $ 12 $ 1,234
Site production and delivery, before net noncash and nonrecurring costs shown below 369 310 65 5 380
By-product credits (199 ) - - - -Treatment charges 22 21 - 1 22
Net cash costs 192 331 65 6 402Depreciation and amortization 33 29 4 - 33Noncash and nonrecurring costs, net 5 5 - - 5
Total costs 230 365 69 6 440Revenue adjustments, primarily for pricing
on prior period open sales and hedging (123 ) (123 ) - - (123 )Idle facility and other non-inventoriable costs (7 ) (7 ) - - (7 )Gross profit $ 664 $ 529 $ 129 $ 6 $ 664
Consolidated sales
Copper (in million pounds) 302 302 Molybdenum (in million pounds) 7
Gross profit per pound of copper and molybdenum:
Revenues, after adjustments shown below $ 3.40 $ 3.40 $ 25.39
Site production and delivery, before net noncash and nonrecurring costs shown below 1.23 1.03 8.29
By-product credits (0.66 ) - - Treatment charges 0.07 0.07 -
Unit net cash costs 0.64 1.10 8.29 Depreciation and amortization 0.11 0.10 0.52 Noncash and nonrecurring costs, net 0.02 0.01 0.02
Total unit costs 0.77 1.21 8.83 Revenue adjustments, primarily for pricing
on prior period open sales and hedging (0.41 ) (0.41 ) - Idle facility and other non-inventoriable costs (0.02 ) (0.02 ) - Gross profit per pound $ 2.20 $ 1.76 $ 16.56
Reconciliation to Amounts Reported
Production Depreciation and and
(In Millions) Revenues Delivery Amortization Totals presented above $ 1,234 $ 380 $ 33 Net noncash and nonrecurring costs
per above N/A 5 N/A Treatment charges per above N/A 22 N/A Revenue adjustments, primarily for pricing
on prior period open sales and hedging per above (123 ) N/A N/A
Purchase accounting impact N/A 223 159 Eliminations and other 3,668 1,999 134 As reported in FCX’s pro forma
consolidated financial results $ 4,779 $ 2,629 $ 326
a. Molybdenum by-product credits reflect volumes produced at market-based pricing and also include tolling revenues at Sierrita.
b. Includes gold and silver.

XI
FREEPORT-McMoRan COPPER & GOLD INC. PRODUCT REVENUES AND PRODUCTION COSTS
(continued)
North America Mining Product Revenues and Production Costs and Unit Net Cash Costs (Pro Forma)
Nine Months Ended September 30, 2007 By-Product Co-Product Method
(In Millions) Method Copper Molybdenum a Other b Total
Revenues, after adjustments shown below $ 3,206 $ 3,206 $ 658 $ 43 $ 3,907
Site production and delivery, before net noncash and nonrecurring costs shown below 1,398 1,204 226 19 1,449
By-product credits (650 ) - - - -Treatment charges 85 83 - 2 85
Net cash costs 833 1,287 226 20 1,534Depreciation and amortization 142 120 22 1 142Noncash and nonrecurring costs, net 16 15 1 - 16
Total costs 991 1,422 249 21 1,692Revenue adjustments, primarily for pricing
on prior period open sales and hedging (135 ) (135 ) - - (135 )Idle facility and other non-inventoriable costs (26 ) (26 ) - - (26 )Gross profit $ 2,054 $ 1,623 $ 409 $ 22 $ 2,054
Consolidated sales
Copper (in million pounds) 1,004 1,004 Molybdenum (in million pounds) 23
Gross profit per pound of copper and molybdenum:
Revenues, after adjustments shown below $ 3.19 $ 3.19 $ 28.57
Site production and delivery, before net noncash and nonrecurring costs shown below 1.39 1.20 9.83
By-product credits (0.65 ) - - Treatment charges 0.08 0.08 -
Unit net cash costs 0.83 1.28 9.83 Depreciation and amortization 0.14 0.12 0.94 Noncash and nonrecurring costs, net 0.02 0.02 0.03
Total unit costs 0.99 1.42 10.80 Revenue adjustments, primarily for pricing
on prior period open sales and hedging (0.13 ) (0.13 ) - Idle facility and other non-inventoriable costs (0.03 ) (0.03 ) - Gross profit per pound $ 2.05 $ 1.62 $ 17.77
Reconciliation to Amounts Reported
Production Depreciation and and
(In Millions) Revenues Delivery Amortization Totals presented above $ 3,907 $ 1,449 $ 142 Net noncash and nonrecurring costs
per above N/A 16 N/A Treatment charges per above N/A 85 N/A Revenue adjustments, primarily for pricing
on prior period open sales and hedging per above (135 ) N/A N/A
Purchase accounting impact N/A 188 126 Eliminations and other 11,277 5,768 800 As reported in FCX’s pro forma
consolidated financial results $ 15,049 $ 7,506 $ 1,068
a. Molybdenum by-product credits reflect volumes produced at market-based pricing and also include tolling revenues at Sierrita.
b. Includes gold and silver.

XII
FREEPORT-McMoRan COPPER & GOLD INC. PRODUCT REVENUES AND PRODUCTION COSTS
(continued)
North America Mining Product Revenues and Production Costs and Unit Net Cash Costs (Pro Forma)
Nine Months Ended September 30, 2006 By-Product Co-Product Method
(In Millions) Method Copper Molybdenum a Other b Total
Revenues, after adjustments shown below $ 3,025 $ 3,025 $ 576 $ 34 $ 3,635
Site production and delivery, before net noncash and nonrecurring costs shown below 1,041 823 229 20 1,072
By-product credits (579 ) - - - -Treatment charges 66 63 - 3 66
Net cash costs 528 886 229 23 1,138Depreciation and amortization 104 85 18 1 104Noncash and nonrecurring costs, net 15 14 1 - 15
Total costs 647 985 248 24 1,257Revenue adjustments, primarily for pricing
on prior period open sales and hedging (1,351 ) (1,351 ) - - (1,351 )Idle facility and other non-inventoriable costs (20 ) (20 ) - - (20 )Gross profit $ 1,007 $ 669 $ 328 $ 10 $ 1,007
Consolidated sales
Copper (in million pounds) 962 962 Molybdenum (in million pounds) 23
Gross profit per pound of copper and molybdenum:
Revenues, after adjustments shown below $ 3.15 $ 3.15 $ 24.48
Site production and delivery, before net noncash and nonrecurring costs shown below 1.08 0.86 9.75
By-product credits (0.60 ) - - Treatment charges 0.07 0.07 -
Unit net cash costs 0.55 0.92 9.75 Depreciation and amortization 0.11 0.09 0.75 Noncash and nonrecurring costs, net 0.01 0.01 0.03
Total unit costs 0.67 1.02 10.53 Revenue adjustments, primarily for pricing
on prior period open sales and hedging (1.41 ) (1.41 ) - Idle facility and other non-inventoriable costs (0.02 ) (0.02 ) - Gross profit per pound $ 1.05 $ 0.70 $ 13.95
Reconciliation to Amounts Reported
Production Depreciation and and
(In Millions) Revenues Delivery Amortization Totals presented above $ 3,635 $ 1,072 $ 104 Net noncash and nonrecurring costs
per above N/A 15 N/A Treatment charges per above N/A 66 N/A Revenue adjustments, primarily for pricing
on prior period open sales and hedging per above (1,351 ) N/A N/A
Purchase accounting impact N/A 1,281 481 Eliminations and other 9,692 5,126 358 As reported in FCX’s pro forma
consolidated financial results $ 11,976 $ 7,560 $ 943
a. Molybdenum by-product credits reflect volumes produced at market-based pricing and also include tolling revenues at Sierrita.
b. Includes gold and silver.

XIII
FREEPORT-McMoRan COPPER & GOLD INC. PRODUCT REVENUES AND PRODUCTION COSTS
(continued)
Primary Molybdenum (Henderson) Product Revenues and Production Costs and Unit Net Cash Costs (Pro Forma)a
Three Months Ended Nine Months Ended September 30, September 30,
(In Millions) 2007 2006 2007 2006
Revenues, after adjustments shown below $ 278 $ 200 $ 741 $ 607
Site production and delivery, before net noncash and nonrecurring costs shown below 43 34 123 101Net cash costs 43 34 123 101
Depreciation and amortization 9 8 25 25Noncash and nonrecurring costs, net - - - 1
Total costs 52 43 149 126Gross profitb $ 226 $ 157 $ 592 $ 481
Consolidated sales Molybdenum (in million pounds) 10 9 30 28
Gross profit per pound of molybdenum:
Revenues, after adjustments shown below $ 28.22 $ 22.77 $ 25.22 $ 21.76
Site production and delivery, before net noncash and nonrecurring costs shown below 4.34 3.92 4.20 3.60Unit net cash costs 4.34 3.92 4.20 3.60
Depreciation and amortization 0.87 0.93 0.85 0.90Noncash and nonrecurring costs, net 0.02 0.02 0.02 0.02
Total unit costs 5.22 4.87 5.07 4.52Gross profit per pound $ 23.00 $ 17.90 $ 20.15 $ 17.24
Reconciliation to Amounts Reported (In Millions) Production Depreciation
and and Three Months Ended September 30, 2007 Revenues Delivery Amortization Totals presented above $ 278 $ 43 $ 9 Purchase accounting impact N/A 40 9 Other molybdenum operations 241 297 4 Primary molybdenum segment 519 380 22 Eliminations and other 4,547 2,282 334 As reported in FCX’s consolidated
financial statements $ 5,066 $ 2,662 $ 356
Three Months Ended September 30, 2006 Totals presented above $ 200 $ 34 $ 8 Purchase accounting impact N/A 223 159 Eliminations and other 4,579 2,372 159 As reported in FCX’s pro forma
consolidated financial results $ 4,779 $ 2,629 $ 326
Nine Months Ended September 30, 2007 Totals presented above $ 741 $ 123 $ 25 Purchase accounting impact N/A 188 126 Eliminations and other 14,308 7,195 917 As reported in FCX’s pro forma
consolidated financial results $ 15,049 $ 7,506 $ 1,068
Nine Months Ended September 30, 2006 Totals presented above $ 607 $ 101 $ 25 Purchase accounting impact N/A 1,281 481 Eliminations and other 11,369 6,178 437 As reported in FCX’s pro forma
consolidated financial results $ 11,976 $ 7,560 $ 943
a. Amounts for the three months ended September 30, 2007, are actual financial results.b. Gross profit reflects sales of Henderson products based on volumes produced at market-based pricing. On a consolidated
basis, the Primary Molybdenum segment includes profits on sales as they are made to third parties and realizations based on actual contract terms.
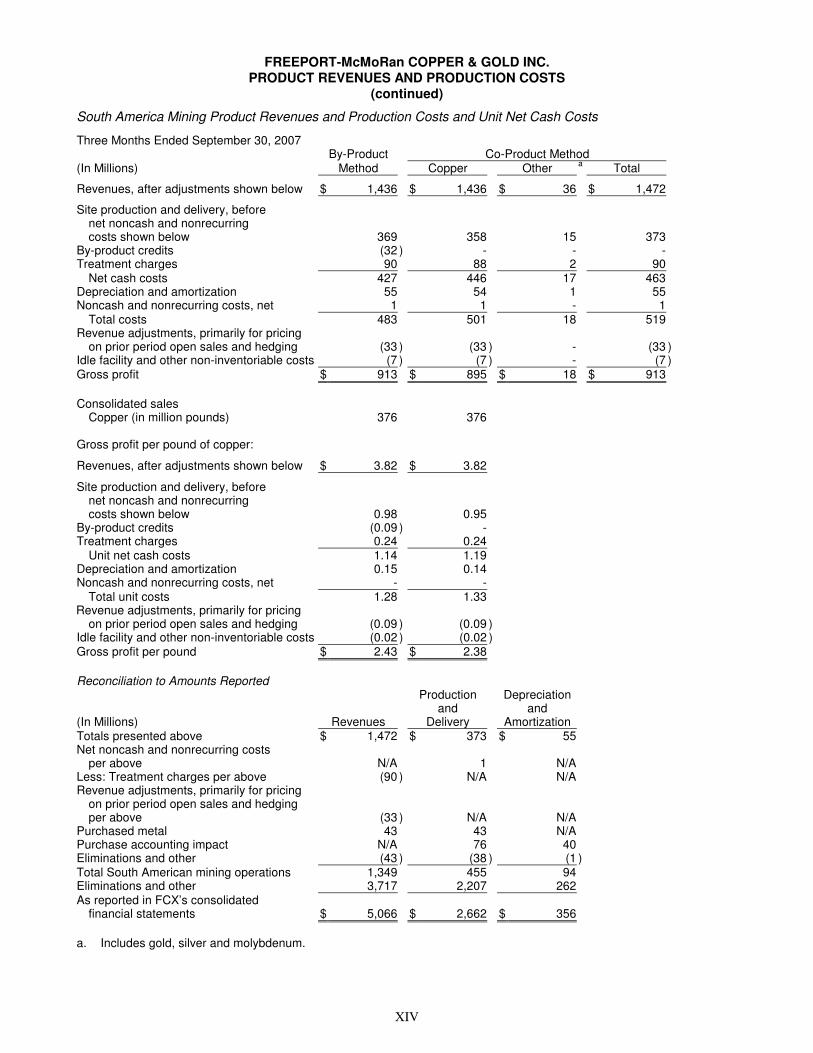
XIV
FREEPORT-McMoRan COPPER & GOLD INC. PRODUCT REVENUES AND PRODUCTION COSTS
(continued)
South America Mining Product Revenues and Production Costs and Unit Net Cash Costs
Three Months Ended September 30, 2007 By-Product Co-Product Method
(In Millions) Method Copper Other a Total
Revenues, after adjustments shown below $ 1,436 $ 1,436 $ 36 $ 1,472
Site production and delivery, before net noncash and nonrecurring costs shown below 369 358 15 373
By-product credits (32 ) - - -Treatment charges 90 88 2 90
Net cash costs 427 446 17 463Depreciation and amortization 55 54 1 55Noncash and nonrecurring costs, net 1 1 - 1
Total costs 483 501 18 519Revenue adjustments, primarily for pricing
on prior period open sales and hedging (33 ) (33 ) - (33 )Idle facility and other non-inventoriable costs (7 ) (7 ) - (7 )Gross profit $ 913 $ 895 $ 18 $ 913
Consolidated sales
Copper (in million pounds) 376 376
Gross profit per pound of copper:
Revenues, after adjustments shown below $ 3.82 $ 3.82
Site production and delivery, before net noncash and nonrecurring costs shown below 0.98 0.95
By-product credits (0.09 ) - Treatment charges 0.24 0.24
Unit net cash costs 1.14 1.19 Depreciation and amortization 0.15 0.14 Noncash and nonrecurring costs, net - -
Total unit costs 1.28 1.33 Revenue adjustments, primarily for pricing
on prior period open sales and hedging (0.09 ) (0.09 ) Idle facility and other non-inventoriable costs (0.02 ) (0.02 ) Gross profit per pound $ 2.43 $ 2.38
Reconciliation to Amounts Reported
Production Depreciation and and
(In Millions) Revenues Delivery Amortization Totals presented above $ 1,472 $ 373 $ 55 Net noncash and nonrecurring costs
per above N/A 1 N/A Less: Treatment charges per above (90 ) N/A N/A Revenue adjustments, primarily for pricing
on prior period open sales and hedging per above (33 ) N/A N/A
Purchased metal 43 43 N/A Purchase accounting impact N/A 76 40 Eliminations and other (43 ) (38 ) (1 )Total South American mining operations 1,349 455 94 Eliminations and other 3,717 2,207 262 As reported in FCX’s consolidated
financial statements $ 5,066 $ 2,662 $ 356
a. Includes gold, silver and molybdenum.

XV
FREEPORT-McMoRan COPPER & GOLD INC. PRODUCT REVENUES AND PRODUCTION COSTS
(continued)
South America Mining Product Revenues and Production Costs and Unit Net Cash Costs (Pro Forma)
Three Months Ended September 30, 2006 By-Product Co-Product Method
(In Millions) Method Copper Other a Total
Revenues, after adjustments shown below $ 1,038 $ 1,038 $ 22 $ 1,060
Site production and delivery, before net noncash and nonrecurring costs shown below 257 251 6 257
By-product credits (22 ) - - -Treatment charges 59 57 2 59
Net cash costs 294 308 8 316Depreciation and amortization 51 50 1 51Noncash and nonrecurring costs, net 1 1 - 1
Total costs 346 359 9 368Revenue adjustments, primarily for pricing
on prior period open sales and hedging 8 8 - 8Idle facility and other non-inventoriable costs (6 ) (6 ) - (6 )Gross profit $ 694 $ 681 $ 13 $ 694
Consolidated sales
Copper (in million pounds) 295 295
Gross profit per pound of copper:
Revenues, after adjustments shown below $ 3.52 $ 3.52
Site production and delivery, before net noncash and nonrecurring costs shown below 0.87 0.85
By-product credits (0.07 ) - Treatment charges 0.20 0.19
Unit net cash costs 1.00 1.04 Depreciation and amortization 0.17 0.17 Noncash and nonrecurring costs, net - -
Total unit costs 1.17 1.22 Revenue adjustments, primarily for pricing
on prior period open sales and hedging 0.03 0.03 Idle facility and other non-inventoriable costs (0.02 ) (0.02 ) Gross profit per pound $ 2.36 $ 2.31
Reconciliation to Amounts Reported
Production Depreciation and and
(In Millions) Revenues Delivery Amortization Totals presented above $ 1,060 $ 257 $ 51 Net noncash and nonrecurring costs
per above N/A 1 N/A Less: Treatment charges per above (59 ) N/A N/A Revenue adjustments, primarily for pricing
on prior period open sales and hedging per above 8 N/A N/A
Purchased metal 59 59 N/A Purchase accounting impact N/A 223 159 Eliminations and other 3,711 2,089 116 As reported in FCX’s pro forma
consolidated financial statements $ 4,779 $ 2,629 $ 326
a. Includes gold and silver.

XVI
FREEPORT-McMoRan COPPER & GOLD INC. PRODUCT REVENUES AND PRODUCTION COSTS
(continued)
South America Mining Product Revenues and Production Costs and Unit Net Cash Costs (Pro Forma)
Nine Months Ended September 30, 2007 By-Product Co-Product Method
(In Millions) Method Copper Other a Total
Revenues, after adjustments shown below $ 3,543 $ 3,543 $ 86 $ 3,629
Site production and delivery, before net noncash and nonrecurring costs shown below 903 876 34 910
By-product credits (79 ) - - -Treatment charges 216 211 5 216
Net cash costs 1,040 1,087 39 1,126Depreciation and amortization 160 157 3 160Noncash and nonrecurring costs, net 2 2 - 2
Total costs 1,202 1,246 42 1,288Revenue adjustments, primarily for pricing
on prior period open sales and hedging 18 18 - 18Idle facility and other non-inventoriable costs (21 ) (20 ) (1 ) (21 )Gross profit $ 2,338 $ 2,295 $ 43 $ 2,338
Consolidated sales
Copper (in million pounds) 1,020 1,020
Gross profit per pound of copper:
Revenues, after adjustments shown below $ 3.47 $ 3.47
Site production and delivery, before net noncash and nonrecurring costs shown below 0.89 0.86
By-product credits (0.08 ) - Treatment charges 0.21 0.21
Unit net cash costs 1.02 1.07 Depreciation and amortization 0.16 0.15 Noncash and nonrecurring costs, net - -
Total unit costs 1.18 1.22 Revenue adjustments, primarily for pricing
on prior period open sales and hedging 0.02 0.02 Idle facility and other non-inventoriable costs (0.02 ) (0.02 ) Gross profit per pound $ 2.29 $ 2.25
Reconciliation to Amounts Reported
Production Depreciation and and
(In Millions) Revenues Delivery Amortization Totals presented above $ 3,629 $ 910 $ 160 Net noncash and nonrecurring costs
per above N/A 2 N/A Less: Treatment charges per above (216 ) N/A N/A Revenue adjustments, primarily for pricing
on prior period open sales and hedging per above 18 N/A N/A
Purchased metal 191 191 N/A Purchase accounting impact N/A 188 126 Eliminations and other 11,427 6,215 782 As reported in FCX’s pro forma
consolidated financial statements $ 15,049 $ 7,506 $ 1,068
a. Includes gold, silver and molybdenum.

XVII
FREEPORT-McMoRan COPPER & GOLD INC. PRODUCT REVENUES AND PRODUCTION COSTS
(continued)
South America Mining Product Revenues and Production Costs and Unit Net Cash Costs (Pro Forma)
Nine Months Ended September 30, 2006 By-Product Co-Product Method
(In Millions) Method Copper Other a Total
Revenues, after adjustments shown below $ 2,789 $ 2,789 $ 72 $ 2,861
Site production and delivery, before net noncash and nonrecurring costs shown below 660 642 18 660
By-product credits (72 ) - - -Treatment charges 159 155 4 159
Net cash costs 747 797 22 819Depreciation and amortization 147 145 2 147Noncash and nonrecurring costs, net 1 1 - 1
Total costs 896 943 25 968Revenue adjustments, primarily for pricing
on prior period open sales and hedging (47 ) (38 ) (9 ) (47 )Idle facility and other non-inventoriable costs (15 ) (15 ) - (15 )Gross profit $ 1,831 $ 1,793 $ 38 $ 1,831
Consolidated sales Copper (in million pounds) 860 860
Gross profit per pound of copper:
Revenues, after adjustments shown below $ 3.24 $ 3.24
Site production and delivery, before net noncash and nonrecurring costs shown below 0.77 0.75
By-product credits (0.08 ) - Treatment charges 0.18 0.18
Unit net cash costs 0.87 0.93 Depreciation and amortization 0.17 0.17 Noncash and nonrecurring costs, net - -
Total unit costs 1.04 1.10 Revenue adjustments, primarily for pricing
on prior period open sales and hedging (0.05 ) (0.04 ) Idle facility and other non-inventoriable costs (0.02 ) (0.02 ) Gross profit per pound $ 2.13 $ 2.09
Reconciliation to Amounts Reported
Production Depreciation and and
(In Millions) Revenues Delivery Amortization Totals presented above $ 2,861 $ 660 $ 147 Net noncash and nonrecurring costs
per above N/A 1 N/A Less: Treatment charges per above (159 ) N/A N/A Revenue adjustments, primarily for pricing
on prior period open sales and hedging per above (47 ) N/A N/A
Purchased metal 185 185 N/A Purchase accounting impact N/A 1,281 481 Eliminations and other 9,136 5,433 315 As reported in FCX’s pro forma
consolidated financial statements $ 11,976 $ 7,560 $ 943
a. Includes gold and silver.
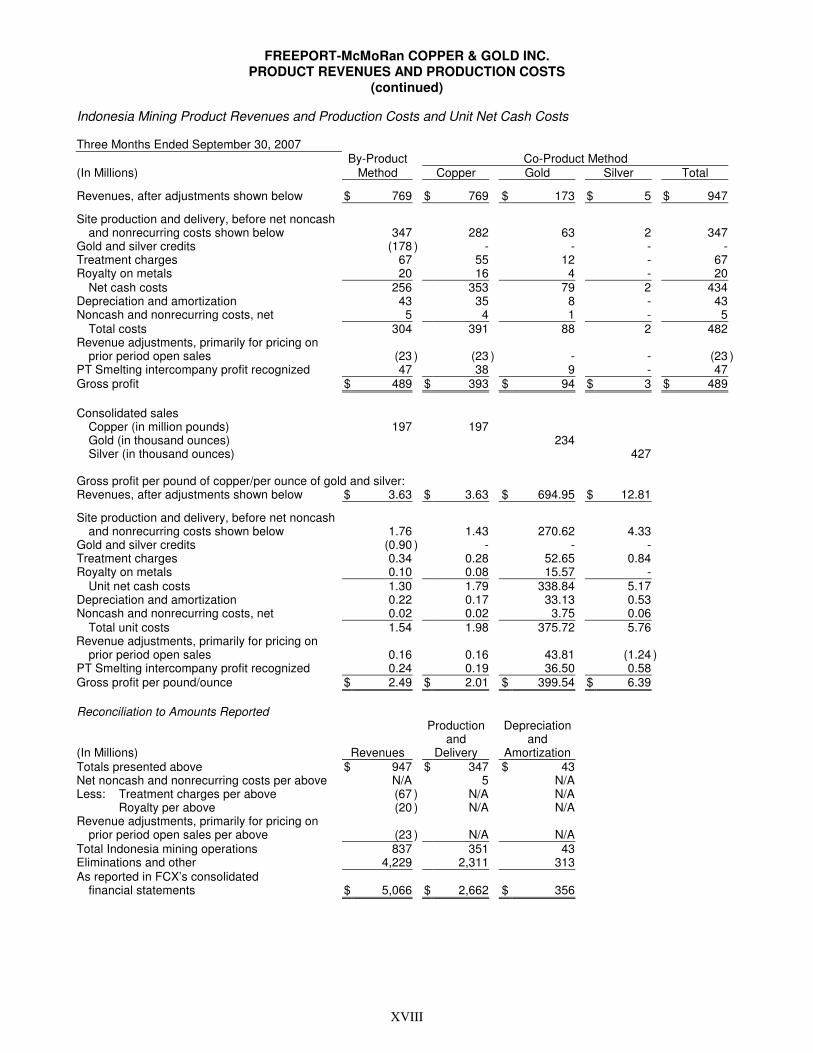
XVIII
FREEPORT-McMoRan COPPER & GOLD INC. PRODUCT REVENUES AND PRODUCTION COSTS
(continued)
Indonesia Mining Product Revenues and Production Costs and Unit Net Cash Costs
Three Months Ended September 30, 2007 By-Product Co-Product Method
(In Millions) Method Copper Gold Silver Total
Revenues, after adjustments shown below $ 769 $ 769 $ 173 $ 5 $ 947
Site production and delivery, before net noncash and nonrecurring costs shown below 347 282 63 2 347
Gold and silver credits (178 ) - - - -Treatment charges 67 55 12 - 67Royalty on metals 20 16 4 - 20
Net cash costs 256 353 79 2 434Depreciation and amortization 43 35 8 - 43Noncash and nonrecurring costs, net 5 4 1 - 5
Total costs 304 391 88 2 482Revenue adjustments, primarily for pricing on
prior period open sales (23 ) (23 ) - - (23 )PT Smelting intercompany profit recognized 47 38 9 - 47Gross profit $ 489 $ 393 $ 94 $ 3 $ 489
Consolidated sales
Copper (in million pounds) 197 197 Gold (in thousand ounces) 234 Silver (in thousand ounces) 427
Gross profit per pound of copper/per ounce of gold and silver: Revenues, after adjustments shown below $ 3.63 $ 3.63 $ 694.95 $ 12.81
Site production and delivery, before net noncash and nonrecurring costs shown below 1.76 1.43 270.62 4.33
Gold and silver credits (0.90 ) - - - Treatment charges 0.34 0.28 52.65 0.84 Royalty on metals 0.10 0.08 15.57 -
Unit net cash costs 1.30 1.79 338.84 5.17 Depreciation and amortization 0.22 0.17 33.13 0.53 Noncash and nonrecurring costs, net 0.02 0.02 3.75 0.06
Total unit costs 1.54 1.98 375.72 5.76 Revenue adjustments, primarily for pricing on
prior period open sales 0.16 0.16 43.81 (1.24 )PT Smelting intercompany profit recognized 0.24 0.19 36.50 0.58 Gross profit per pound/ounce $ 2.49 $ 2.01 $ 399.54 $ 6.39
Reconciliation to Amounts Reported
Production Depreciation and and
(In Millions) Revenues Delivery Amortization Totals presented above $ 947 $ 347 $ 43 Net noncash and nonrecurring costs per above N/A 5 N/A Less: Treatment charges per above (67 ) N/A N/A
Royalty per above (20 ) N/A N/A Revenue adjustments, primarily for pricing on
prior period open sales per above (23 ) N/A N/A Total Indonesia mining operations 837 351 43 Eliminations and other 4,229 2,311 313 As reported in FCX’s consolidated
financial statements $ 5,066 $ 2,662 $ 356

XIX
FREEPORT-McMoRan COPPER & GOLD INC. PRODUCT REVENUES AND PRODUCTION COSTS
(continued)
Indonesia Mining Product Revenues and Production Costs and Unit Net Cash Costs
Three Months Ended September 30, 2006 By-Product Co-Product Method
(In Millions) Method Copper Gold Silver Total
Revenues, after adjustments shown below $ 1,097 $ 1,097 $ 295 $ 13 $ 1,404
Site production and delivery, before net noncash and nonrecurring costs shown below 355 277 75 3 355
Gold and silver credits (307 ) - - - -Treatment charges 141 110 30 1 141Royalty on metals 37 29 8 - 37
Net cash costs 226 416 112 5 533Depreciation and amortization 50 39 10 1 50Noncash and nonrecurring costs, net 9 7 2 - 9
Total costs 285 462 124 6 592Revenue adjustments, primarily for pricing on
prior period open sales and silver hedging 37 50 - (13 ) 37PT Smelting intercompany profit elimination (20 ) (16 ) (4 ) - (20 )Gross profit $ 829 $ 669 $ 166 $ (6 ) $ 829
Consolidated sales
Copper (in million pounds) 324 324 Gold (in thousand ounces) 478 Silver (in thousand ounces) 1,096
Gross profit per pound of copper/per ounce of gold and silver: Revenues, after adjustments shown below $ 3.43 $ 3.43 $ 608.57 $ 5.25
Site production and delivery, before net noncash and nonrecurring costs shown below 1.10 0.86 155.90 2.91
Gold and silver credits (0.95 ) - - - Treatment charges 0.44 0.34 62.19 1.16 Royalty on metals 0.11 0.09 16.24 0.30
Unit net cash costs 0.70 1.29 234.33 4.37 Depreciation and amortization 0.15 0.12 21.94 0.41 Noncash and nonrecurring costs, net 0.03 0.02 3.75 0.07
Total unit costs 0.88 1.43 260.02 4.85 Revenue adjustments, primarily for pricing on
prior period open sales 0.07 0.12 8.11 (5.84 )PT Smelting intercompany profit elimination (0.06 ) (0.05 ) (8.94 ) (0.17 )Gross profit per pound/ounce $ 2.56 $ 2.07 $ 347.72 $ (5.61 )
Reconciliation to Amounts Reported
Production Depreciation And And
(In Millions) Revenues Delivery Amortization Totals presented above $ 1,404 $ 355 $ 50 Net noncash and nonrecurring costs per above N/A 9 N/A Less: Treatment charges per above (141 ) N/A N/A
Royalty per above (37 ) N/A N/A Revenue adjustments, primarily for pricing on
prior period open sales and hedging per above 37 N/A N/A Total Indonesia mining operations 1,262 363 50 Eliminations and other 374 429 10 As reported in FCX’s consolidated
financial statements $ 1,636 $ 792 $ 60

XX
FREEPORT-McMoRan COPPER & GOLD INC. PRODUCT REVENUES AND PRODUCTION COSTS
(continued)
Indonesia Mining Product Revenues and Production Costs and Unit Net Cash Costs
Nine Months Ended September 30, 2007 By-Product Co-Product Method
(In Millions) Method Copper Gold Silver Total
Revenues, after adjustments shown below $ 3,325 $ 3,325 $ 1,380 $ 41 $ 4,746
Site production and delivery, before net noncash and nonrecurring costs shown below 1,040 729 302 9 1,040
Gold and silver credits (1,421 ) - - - -Treatment charges 332 232 97 3 332Royalty on metals 117 82 34 1 117
Net cash costs 68 1,043 433 13 1,489Depreciation and amortization 158 111 46 1 158Noncash and nonrecurring costs, net 24 17 7 - 24
Total costs 250 1,171 486 14 1,671Revenue adjustments, primarily for pricing on
prior period open sales 11 11 - - 11PT Smelting intercompany profit recognized 11 8 3 - 11Gross profit $ 3,097 $ 2,173 $ 897 $ 27 $ 3,097
Consolidated sales
Copper (in million pounds) 948 948 Gold (in thousand ounces) 2,061 Silver (in thousand ounces) 3,121
Gross profit per pound of copper/per ounce of gold and silver: Revenues, after adjustments shown below $ 3.48 $ 3.48 $ 668.47 $ 13.04
Site production and delivery, before net noncash and nonrecurring costs shown below 1.10 0.77 146.73 2.86
Gold and silver credits (1.50 ) - - - Treatment charges 0.35 0.24 46.84 0.91 Royalty on metals 0.12 0.09 16.55 0.32
Unit net cash costs 0.07 1.10 210.12 4.09 Depreciation and amortization 0.17 0.11 22.21 0.43 Noncash and nonrecurring costs, net 0.03 0.02 3.43 0.07
Total unit costs 0.27 1.23 235.76 4.59 Revenue adjustments, primarily for pricing on
prior period open sales 0.04 0.04 1.19 - PT Smelting intercompany profit recognized 0.01 0.01 1.56 0.03 Gross profit per pound/ounce $ 3.27 $ 2.29 $ 435.46 $ 8.48
Reconciliation to Amounts Reported
Production Depreciation and and
(In Millions) Revenues Delivery Amortization Totals presented above $ 4,746 $ 1,040 $ 158 Net noncash and nonrecurring costs per above N/A 24 N/A Less: Treatment charges per above (332 ) N/A N/A
Royalty per above (117 ) N/A N/A Revenue adjustments, primarily for pricing on
prior period open sales per above 11 N/A N/A Total Indonesia mining operations 4,308 1,064 158 Eliminations and other 8,447 5,041 688 As reported in FCX’s consolidated
financial statements $ 12,755 $ 6,105 $ 846

XXI
FREEPORT-McMoRan COPPER & GOLD INC. PRODUCT REVENUES AND PRODUCTION COSTS
(continued)
Indonesia Mining Product Revenues and Production Costs and Unit Net Cash Costs
Nine Months Ended September 30, 2006 By-Product Co-Product Method
(In Millions) Method Copper Gold Silver Total
Revenues, after adjustments shown below $ 2,607 $ 2,607 $ 753 $ 31 $ 3,391
Site production and delivery, before net noncash and nonrecurring costs shown below 901 692 200 8 901
Gold and silver credits (784 ) - - - -Treatment charges 332 256 74 3 332Royalty on metals 80 61 18 1 80
Net cash costs 529 1,009 292 12 1,313Depreciation and amortization 118 90 26 1 118Noncash and nonrecurring costs, net 31 24 7 - 31
Total costs 677 1,123 325 13 1,461Revenue adjustments, primarily for pricing on
prior period open sales and gold/silver hedging 115 a 197 (69 ) (13 ) 115PT Smelting intercompany profit elimination (7 ) (6 ) (1 ) - (7 )Gross profit $ 2,038 $ 1,675 $ 358 $ 4 $ 2,038
Consolidated sales
Copper (in million pounds) 769 769 Gold (in thousand ounces) 1,228 Silver (in thousand ounces) 2,638
Gross profit per pound of copper/per ounce of gold and silver: Revenues, after adjustments shown below $ 3.38 $ 3.38 $ 540.67 b $ 6.58
Site production and delivery, before net noncash and nonrecurring costs shown below 1.17 0.90 162.88 3.13
Gold and silver credits (1.02 ) - - - Treatment charges 0.43 0.33 60.11 1.16 Royalty on metals 0.11 0.08 14.44 0.28
Unit net cash costs 0.69 1.31 237.43 4.57 Depreciation and amortization 0.15 0.12 21.27 0.41 Noncash and nonrecurring costs, net 0.04 0.03 5.54 0.11
Total unit costs 0.88 1.46 264.24 5.09 Revenue adjustments, primarily for pricing on
prior period open sales 0.16 a 0.27 16.42 0.20 PT Smelting intercompany profit elimination (0.01 ) (0.01 ) (1.33 ) (0.03 )Gross profit per pound/ounce $ 2.65 $ 2.18 $ 291.52 $ 1.66
Reconciliation to Amounts Reported
Production Depreciation And And
(In Millions) Revenues Delivery Amortization Totals presented above $ 3,391 $ 901 $ 118 Net noncash and nonrecurring costs per above N/A 31 N/A Less: Treatment charges per above (332 ) N/A N/A
Royalty per above (80 ) N/A N/A Revenue adjustments, primarily for pricing on
prior period open sales and hedging per above 115 N/A N/A Total Indonesia mining operations 3,094 931 118 Eliminations and other 1,054 944 29 As reported in FCX’s consolidated
financial statements $ 4,148 $ 1,875 $ 147
a. Includes a $69 million or $0.16 per pound loss on the redemption of FCX’s Gold-Denominated Preferred Stock, Series II.
b. Amount was $597.07 per ounce before the loss on the redemption of FCX’s Gold-Denominated Preferred Stock, Series II.
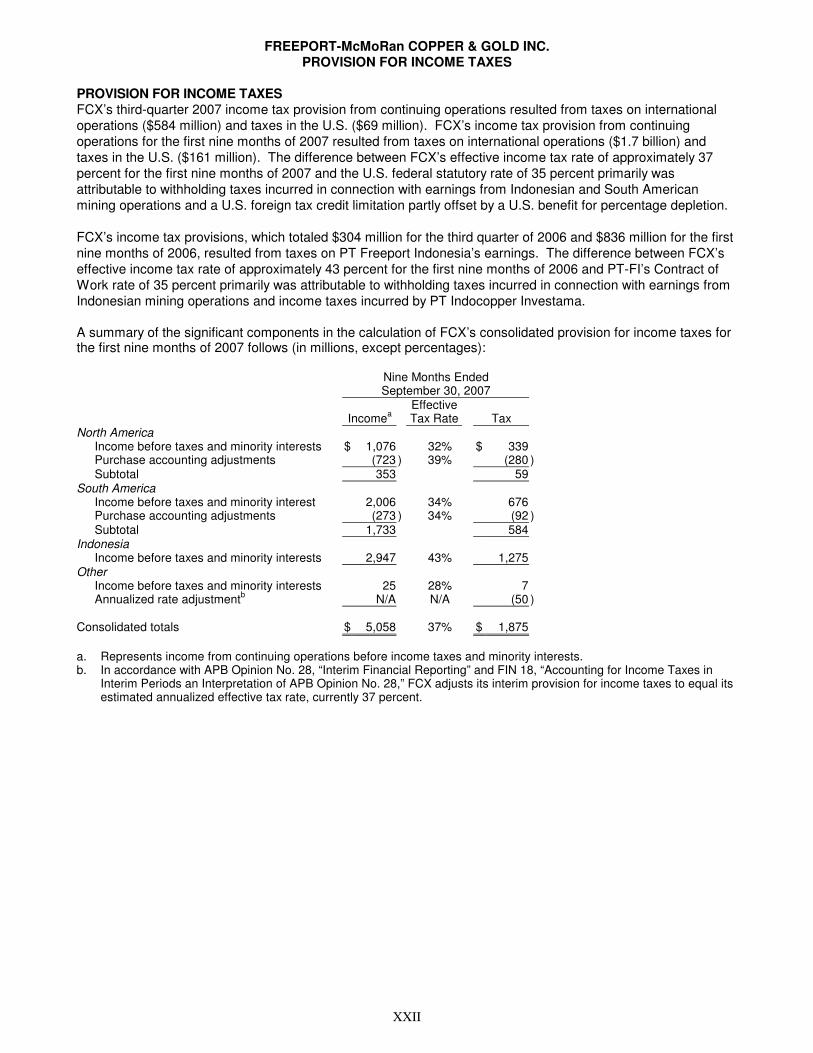
XXII
FREEPORT-McMoRan COPPER & GOLD INC. PROVISION FOR INCOME TAXES
PROVISION FOR INCOME TAXES FCX’s third-quarter 2007 income tax provision from continuing operations resulted from taxes on international operations ($584 million) and taxes in the U.S. ($69 million). FCX’s income tax provision from continuing operations for the first nine months of 2007 resulted from taxes on international operations ($1.7 billion) and taxes in the U.S. ($161 million). The difference between FCX’s effective income tax rate of approximately 37 percent for the first nine months of 2007 and the U.S. federal statutory rate of 35 percent primarily was attributable to withholding taxes incurred in connection with earnings from Indonesian and South American mining operations and a U.S. foreign tax credit limitation partly offset by a U.S. benefit for percentage depletion.
FCX’s income tax provisions, which totaled $304 million for the third quarter of 2006 and $836 million for the first nine months of 2006, resulted from taxes on PT Freeport Indonesia’s earnings. The difference between FCX’s effective income tax rate of approximately 43 percent for the first nine months of 2006 and PT-FI’s Contract of Work rate of 35 percent primarily was attributable to withholding taxes incurred in connection with earnings from Indonesian mining operations and income taxes incurred by PT Indocopper Investama.
A summary of the significant components in the calculation of FCX’s consolidated provision for income taxes for the first nine months of 2007 follows (in millions, except percentages):
Nine Months Ended September 30, 2007
Effective Incomea Tax Rate Tax
North AmericaIncome before taxes and minority interests $ 1,076 32% $ 339Purchase accounting adjustments (723 ) 39% (280 )Subtotal 353 59
South AmericaIncome before taxes and minority interest 2,006 34% 676Purchase accounting adjustments (273 ) 34% (92 )Subtotal 1,733 584
IndonesiaIncome before taxes and minority interests 2,947 43% 1,275
OtherIncome before taxes and minority interests 25 28% 7Annualized rate adjustmentb N/A N/A (50 )
Consolidated totals $ 5,058 37% $ 1,875
a. Represents income from continuing operations before income taxes and minority interests. b. In accordance with APB Opinion No. 28, “Interim Financial Reporting” and FIN 18, “Accounting for Income Taxes in
Interim Periods an Interpretation of APB Opinion No. 28,” FCX adjusts its interim provision for income taxes to equal its estimated annualized effective tax rate, currently 37 percent.

XXIII
FREEPORT-McMoRan COPPER & GOLD INC. BUSINESS SEGMENTS
FCX’s business consists of three primary operating divisions – North American mining, South American mining and Indonesian mining. Following is a discussion of the reportable segments included in these operating divisions, as well as FCX’s other reportable segment – Atlantic Copper. FCX continues to evaluate reportable segments in conjunction with its review of the management reporting structure following the acquisition of Phelps Dodge, and as a result, the following reportable segments may change when FCX finalizes its analysis.
On September 12, 2007, FCX entered into an agreement to sell its international wire and cable business, PDIC, for $735 million. Accordingly, PDIC’s operating results have been reported as discontinued operations in FCX’s condensed consolidated statements of income; and PDIC’s assets and liabilities have been reported as held for sale in FCX’s condensed consolidated balance sheets. PDIC is no longer a reportable segment of FCX in the following business segment tables for the three and nine-month periods ended September 30, 2007.
North American Mining. North American mining comprises copper operations from mining through rod production, molybdenum operations from mining through conversion to chemical and metallurgical products, and the marketing and sale of both products. The North American mining operating division includes one reportable copper production segment (Morenci), and also includes as reportable segments Manufacturing and Primary Molybdenum. Other North American mining operations not considered reportable segments include FCX’s other southwestern U.S. copper mines – Bagdad, Sierrita, Chino, Cobre, Tyrone, Miami, Bisbee and Tohono. In addition to copper, the Bagdad, Sierrita and Chino mines produce molybdenum, gold, silver and rhenium. Other North American mining operations also include the Safford project, which is currently under development; a sales company, which functions as an agent to purchase and sell copper from the North American mines and the Manufacturing segment and also purchases and sells any copper not sold by the South American mines to third parties; and other ancillary operations.
South American Mining. South American mining includes one reportable copper production segment (Cerro Verde). Other South American mining operations not considered reportable segments include FCX’s other South American copper mines – Candelaria, Ojos del Salado and El Abra.
Indonesian Mining. Indonesian mining includes PT Freeport Indonesia’s Grasberg copper and gold mining operations and PT Puncakjaya Power’s power generating operations (after eliminations with PT Freeport Indonesia).
Atlantic Copper Smelting & Refining. Atlantic Copper, FCX’s wholly owned smelting unit in Spain, smelts and refines copper concentrates and markets refined copper and precious metals in slimes.
Other. Intersegment sales by the Indonesian and South American mines are based upon arms-length prices at the time of the sale. Intersegment sales by any individual mine may not be reflective of the actual prices ultimately realized because of a variety of factors, including additional processing, timing of sales to unaffiliated customers and transportation premiums.
In addition to the allocation of revenues, FCX allocates certain operating costs, expenses and capital to the operating divisions and individual segments that may not be reflective of market conditions. FCX does not allocate all costs and expenses applicable to a mine or operation from the operating division or corporate offices. Accordingly, the following segment information reflects management determinations that may not be indicative of actual financial performance of each operating division or segment as if it was an independent entity.

XX
IV
FR
EE
PO
RT
-McM
oR
an C
OP
PE
R &
GO
LD
INC
. B
US
INE
SS
SE
GM
EN
TS
(c
on
tin
ued
)
(In
Mill
ions
) N
orth
Am
eric
a S
outh
Am
eric
a In
done
sia
Oth
er
Tot
al
Oth
er
Tot
al
Atla
ntic
P
rimar
y N
orth
N
orth
S
outh
S
outh
C
oppe
r C
orpo
rate
, M
anuf
ac-
Mol
yb-
Am
eric
anA
mer
ican
Cer
ro
Am
eric
anA
mer
ican
Sm
eltin
g O
ther
&
FC
X
Th
ree
Mo
nth
s E
nd
ed S
epte
mb
er 3
0, 2
007
Mor
enci
tu
ring
denu
m
Min
ing
Min
ing
Ver
deM
inin
g M
inin
g G
rasb
erg
& R
efin
ing
Elim
inat
ions
Tot
al
Rev
enue
s:
U
naffi
liate
d cu
stom
ers
$49
1,72
651
971
33,
007
339
460
799
570
a68
82
5,06
6In
ters
egm
ent
63
261
-(6
89)
426
328
755
026
7-
(821
)-
Pro
duct
ion
and
deliv
eryb
37
21,
765
380
(352
)2,
165
199
256
455
351
674
(983
)2,
662
Dep
reci
atio
n, d
eple
tion
and
amor
tizat
ionb
91
622
8720
641
5394
438
535
6E
xplo
ratio
n an
d re
sear
ch e
xpen
ses
-
-1
23
--
--
-37
40S
ellin
g, g
ener
al a
nd a
dmin
istr
ativ
e ex
pens
es
-
-4
37
--
-44
575
131
Ope
ratin
g in
com
eb $
218
1611
2c
284
630
362
438
800
399
147
1,87
7In
tere
st e
xpen
se, n
et
$-
2-
-2
3-
33
614
115
5E
quity
in a
ffilia
ted
com
pani
es’ n
et e
arni
ngs
$-
--
--
--
--
-5
5P
rovi
sion
for
inco
me
taxe
s $
--
--
-12
114
326
414
1-
248
653
Min
ority
inte
rest
s in
net
inco
me
of
co
nsol
idat
ed s
ubsi
diar
ies
$-
--
--
133
136
269
--
3830
7T
otal
ass
ets
at S
epte
mbe
r 30
, 200
7 $
4,78
078
71,
944
9,39
016
,901
5,37
85,
267
10,6
453,
968
1,10
48,
771
d41
,389
Cap
ital e
xpen
ditu
res
$81
38
154
246
1316
2998
1083
e46
6
Th
ree
Mo
nth
s E
nd
ed S
ept.
30,
200
6R
even
ues:
Una
ffilia
ted
cust
omer
s $
--
--
--
--
1,02
1a
613
21,
636
Inte
rseg
men
t
--
--
--
--
241
-(2
41)
-P
rodu
ctio
n an
d de
liver
y
--
--
--
--
363
581
(152
)79
2D
epre
ciat
ion,
dep
letio
n an
d am
ortiz
atio
n
--
--
--
--
508
260
Exp
lora
tion
and
rese
arch
exp
ense
s
--
--
--
--
--
44
Sel
ling,
gen
eral
and
adm
inis
trat
ive
expe
nses
--
--
--
--
364
545
Ope
ratin
g in
com
e $
--
--
--
--
813
20(9
8)
735
Inte
rest
exp
ense
, net
$
--
--
--
--
17
1018
Equ
ity in
affi
liate
d co
mpa
nies
’ net
ear
ning
s $
--
--
--
--
--
22
Pro
visi
on fo
r in
com
e ta
xes
$-
--
--
--
-27
1-
3330
4M
inor
ity in
tere
sts
in n
et in
com
e of
cons
olid
ated
sub
sidi
arie
s $
--
--
--
--
--
4646
Tot
al a
sset
s at
Sep
tem
ber
30, 2
006
$-
--
--
--
-3,
940
1,04
529
55,
280
Cap
ital e
xpen
ditu
res
$-
--
--
--
-61
7-
68
a.
Incl
udes
PT
Fre
epor
t Ind
ones
ia’s
sal
es to
PT
Sm
eltin
g to
talin
g $3
53 m
illio
n in
third
-qua
rter
200
7 an
d $4
58 m
illio
n in
third
-qua
rter
200
6.
b.
Thi
rd-q
uart
er 2
007
oper
atin
g in
com
e in
clud
es p
urch
ase
acco
untin
g ad
just
men
ts p
rimar
ily a
ssoc
iate
d w
ith th
e im
pact
s of
the
incr
ease
s in
the
carr
ying
val
ues
of P
help
s D
odge
’s m
etal
s in
vent
orie
s an
d st
ockp
iles
and
prop
erty
, pla
nt a
nd e
quip
men
t. F
ollo
win
g pr
ovid
es th
e im
pact
of t
hese
adj
ustm
ents
on
FC
X’s
seg
men
ts a
nd o
pera
ting
divi
sion
s fo
r th
ird-q
uart
er 2
007:
Pro
duct
ion
and
deliv
ery
$10
4-
4030
174
4234
76N
/AN
/A27
277
Dep
reci
atio
n, d
eple
tion
and
amor
tizat
ion
58
-9
4811
521
1940
N/A
N/A
-15
5P
urch
ase
acco
untin
g ad
just
men
ts
$16
2-
4978
289
6353
116
N/A
N/A
2743
2
c.
Thi
rd-q
uart
er 2
007
oper
atin
g in
com
e fo
r P
rimar
y M
olyb
denu
m in
clud
ed a
$14
mill
ion
loss
prim
arily
res
ultin
g fr
om th
e di
ffere
nce
betw
een
raw
mat
eria
l pur
chas
es a
nd a
vera
ge c
ontr
actu
al s
ellin
g pr
ices
, and
was
als
o ne
t of a
$44
mill
ion
inte
rcom
pany
pro
fit e
limin
atio
n as
soci
ated
with
pur
chas
es a
nd s
ales
bet
wee
n H
ende
rson
and
oth
er m
olyb
denu
m c
onve
rsio
n fa
cilit
ies.
Pro
fits
are
defe
rred
un
til s
ales
are
mad
e to
third
par
ties.
d.
Incl
udes
tota
l ass
ets
of $
1.2
billi
on a
t Sep
tem
ber
30, 2
007,
rel
ated
to th
e di
scon
tinue
d op
erat
ions
of P
DIC
whi
ch F
CX
ent
ered
into
an
agre
emen
t to
sell
on S
epte
mbe
r 12
, 200
7.
e.
Incl
udes
cap
ital e
xpen
ditu
res
of $
7 m
illio
n fo
r th
ird-q
uart
er 2
007
rela
ted
to th
e di
scon
tinue
d op
erat
ions
of P
DIC
.

XX
V
FR
EE
PO
RT
-McM
oR
an C
OP
PE
R &
GO
LD
INC
. B
US
INE
SS
SE
GM
EN
TS
(c
on
tin
ued
)
(In
Mill
ions
) N
orth
Am
eric
a S
outh
Am
eric
a In
done
sia
Oth
er
Tot
al
Oth
er
Tot
al
Atla
ntic
P
rimar
y N
orth
N
orth
S
outh
S
outh
C
oppe
r C
orpo
rate
, M
anuf
ac-
Mol
yb-
Am
eric
anA
mer
ican
Cer
ro
Am
eric
anA
mer
ican
Sm
eltin
g O
ther
&
FC
X
Nin
e M
on
ths
En
ded
Sep
tem
ber
30,
200
7M
oren
ci
turin
g de
num
M
inin
g M
inin
g V
erde
Min
ing
Min
ing
Gra
sber
g&
Ref
inin
gE
limin
atio
nsT
otal
R
even
ues:
Una
ffilia
ted
cust
omer
s $
723,
760
1,03
41,
139
6,00
551
01,
158
1,66
83,
317
a1,
761
412
,755
Inte
rseg
men
t
1,17
211
9-
(1,2
83)
865
851
71,
175
991
-(2
,174
)-
Pro
duct
ion
and
deliv
eryb
70
53,
836
838
(780
)4,
599
343
531
874
1,06
41,
709
(2,1
41)
6,10
5D
epre
ciat
ion,
dep
letio
n an
d am
ortiz
atio
nb
165
1247
164
388
8517
325
815
827
1584
6E
xplo
ratio
n an
d re
sear
ch e
xpen
ses
-
-1
56
--
--
-81
87S
ellin
g, g
ener
al a
nd a
dmin
istr
ativ
e ex
pens
es
-
-9
615
--
-13
315
151
314
Ope
ratin
g in
com
e (lo
ss)b
$37
431
139
c46
11,
005
740
971
1,71
12,
953
10(2
76)
5,40
3In
tere
st e
xpen
se, n
et
$-
3-
-3
7(1
)6
1020
347
386
Equ
ity in
affi
liate
d co
mpa
nies
’ net
ear
ning
s $
--
-1
1-
--
--
1617
Pro
visi
on fo
r in
com
e ta
xes
$-
--
--
266
318
584
1,03
7-
254
1,87
5M
inor
ity in
tere
sts
in n
et in
com
e of
cons
olid
ated
sub
sidi
arie
s $
--
--
-25
928
354
2-
-18
672
8C
apita
l exp
endi
ture
s $
156
821
415
600
3134
6527
331
169
d1,
138
Nin
e M
on
ths
En
ded
Sep
t. 3
0, 2
006
Rev
enue
s:
U
naffi
liate
d cu
stom
ers
$-
--
--
--
-2,
421
a1,
722
54,
148
Inte
rseg
men
t
--
--
--
--
673
-(6
73)
-P
rodu
ctio
n an
d de
liver
y
--
--
--
--
931
1,63
3(6
89)
1,87
5D
epre
ciat
ion,
dep
letio
n an
d am
ortiz
atio
n
--
--
--
--
118
236
147
Exp
lora
tion
and
rese
arch
exp
ense
s
--
--
--
--
--
99
Sel
ling,
gen
eral
and
adm
inis
trat
ive
expe
nses
--
--
--
--
174
11(7
4)
111
Ope
ratin
g in
com
e $
--
--
--
--
1,87
155
802,
006
Inte
rest
exp
ense
, net
$
--
--
--
--
617
3962
Equ
ity in
affi
liate
d co
mpa
nies
’ net
ear
ning
s $
--
--
--
--
--
77
Pro
visi
on fo
r in
com
e ta
xes
$-
--
--
--
-65
3-
183
836
Min
ority
inte
rest
s in
net
inco
me
of
co
nsol
idat
ed s
ubsi
diar
ies
$-
--
--
--
--
-11
511
5C
apita
l exp
endi
ture
s $
--
--
--
--
165
13-
178
a.
Incl
udes
PT
Fre
epor
t Ind
ones
ia’s
sal
es to
PT
Sm
eltin
g to
talin
g $1
.6 b
illio
n fo
r th
e fir
st n
ine
mon
ths
of 2
007
and
$1.1
bill
ion
for
the
first
nin
e m
onth
s of
200
6.
b.
Ope
ratin
g in
com
e fo
r th
e fir
st n
ine
mon
ths
of 2
007
incl
udes
pur
chas
e ac
coun
ting
adju
stm
ents
prim
arily
ass
ocia
ted
with
the
impa
cts
of in
crea
ses
in th
e ca
rryi
ng v
alue
s of
Phe
lps
Dod
ge’s
met
als
inve
ntor
ies
and
stoc
kpile
s an
d pr
oper
ty, p
lant
and
equ
ipm
ent.
Fol
low
ing
prov
ides
the
impa
ct o
f the
se a
djus
tmen
ts o
n F
CX
’s s
egm
ents
and
ope
ratin
g di
visi
ons
for
the
first
nin
e m
onth
s of
200
7:
Pro
duct
ion
and
deliv
ery
$18
8-
120
165
473
6280
142
N/A
N/A
1262
7D
epre
ciat
ion,
dep
letio
n an
d am
ortiz
atio
n
121
-21
9623
842
8913
1N
/AN
/A-
369
Pur
chas
e ac
coun
ting
adju
stm
ents
$
309
-14
126
171
110
416
927
3N
/AN
/A12
996
c.
Ope
ratin
g in
com
e fo
r P
rimar
y M
olyb
denu
m fo
r th
e fir
st n
ine
mon
ths
of 2
007
incl
uded
a $
67 m
illio
n lo
ss p
rimar
ily r
esul
ting
from
the
diffe
renc
e be
twee
n ra
w m
ater
ial p
urch
ases
and
ave
rage
co
ntra
ctua
l sel
ling
pric
es, a
nd w
as a
lso
net o
f a $
93 m
illio
n in
terc
ompa
ny p
rofit
elim
inat
ion
asso
ciat
ed w
ith p
urch
ases
and
sal
es b
etw
een
Hen
ders
on a
nd o
ther
mol
ybde
num
con
vers
ion
faci
litie
s.
Pro
fits
are
defe
rred
unt
il sa
les
are
mad
e to
third
par
ties.
d.
Incl
udes
cap
ital e
xpen
ditu
res
of $
13 m
illio
n fo
r th
e fir
st n
ine
mon
ths
of 2
007
rela
ted
to th
e di
scon
tinue
d op
erat
ions
of P
DIC
whi
ch F
CX
ent
ered
into
an
agre
emen
t to
sell
on S
epte
mbe
r 12
, 200
7.