Embed Size (px)
Citation preview
ASTROBIOLOGYVolume 6, Number 5, 2006© Mary Ann Liebert, Inc.
News & Views
Findings of the Mars Special Regions Science Analysis Group
THE MEPAG SPECIAL REGIONS–SCIENCE ANALYSIS GROUP
677
EXECUTIVE SUMMARY
Introduction and approach
Current planetary protection (PP) protectionpolicy designates a categorization IVc for space-craft potentially entering into a “special region”of Mars that requires specific constraints onspacecraft development and operations.
National Aeronautics and Space Administra-tion (NASA) requested that Mars ExplorationProgram Analysis Group (MEPAG) charter a Spe-cial Regions–Science Analysis Group (SR-SAG) todevelop a quantitative clarification of the defini-tion of “special region” that can be used to dis-tinguish between regions that are “special” and“non-special” and a preliminary analysis of spe-cific environments that should be considered“special” and “non-special.”
The SR-SAG used the following general ap-proach: Clarify the terms in the existing Commit-tee on Space Research (COSPAR) definition; es-tablish temporal and spatial boundary conditionsfor the analysis; identify applicable threshold con-ditions for propagation; evaluate the distributionof the identified threshold conditions on Mars; an-alyze on a case-by-case basis those purported ge-ological environments on Mars that could poten-tially exceed the biological threshold conditions;and, furthermore, describe conceptually the possi-bility for spacecraft-induced conditions that couldexceed the threshold levels for propagation.
The following represent the results of the SR-SAG study in which “special regions” are morepractically defined, including a comprehensivedistillation of our current understanding of thelimits of terrestrial life and their relationship torelevant martian conditions. An analytical ap-
Members of the Mars Exploration Program Analysis Group (MEPAG) Special Regions–Science Analysis Group are:David Beaty, co-chair (Mars Program Office, Jet Propulsion Laboratory/California Institute of Technology, Pasadena,California), Karen Buxbaum, co-chair (Mars Program Office, Jet Propulsion Laboratory/California Institute of Tech-nology, Pasadena, California), Michael Meyer, co-chair (NASA Headquarters, Washington, D.C.), Nadine Barlow(Northern Arizona University, Flagstaff, Arizona), William Boynton (University of Arizona, Tucson, Arizona), Ben-ton Clark (Lockheed Martin Space Systems, Denver, Colorado), Jody Deming (University of Washington, Seattle,Washington), Peter T. Doran (University of Illinois at Chicago, Illinois), Kenneth Edgett (Malin Space Science Sys-tems, San Diego, California), Steven Hancock (Foils Engineering, Fremont, California), James Head (Brown Univer-sity, Providence, Rhode Island), Michael Hecht (Jet Propulsion Laboratory/California Institute of Technology,Pasadena, California), Victoria Hipkin (Canadian Space Agency, Saint-Hubert, Quebec, Canada), Thomas Kieft (NewMexico Institute of Mining & Technology, Socorro, New Mexico), Rocco Mancinelli (SETI Institute, Mountain View,California), Eric McDonald (Desert Research Institute, Reno, Nevada), Christopher McKay (Ames Research Center,Moffett Field, California), Michael Mellon (University of Colorado, Boulder, Colorado), Horton Newsom (Universityof New Mexico, Albuquerque, New Mexico), Gian Ori (International Research School of Planetary Sciences, Pescara,Italy), David Paige (University of California, Los Angeles, California), Andrew C. Schuerger (University of Florida,Kennedy Space Center, Florida), Mitchell Sogin (Marine Biological Laboratory, Woods Hole, Massachusetts), J. An-drew Spry (Jet Propulsion Laboratory/California Institute of Technology, Pasadena, California), Andrew Steele(Carnegie Institute of Washington, Washington, D.C.), Kenneth Tanaka (U.S. Geological Survey, Flagstaff, Arizona),Mary Voytek (U.S. Geological Survey, Reston, Virginia).
proach is presented to consider special regionswith current and future improvements in our un-derstanding. The specific findings of the SR-SAGreported in the executive summary are in bold.
Definition
The existing definition of “special region” (fromCOSPAR, 2005; NASA, 2005) is “ . . . a regionwithin which terrestrial organisms are likely topropagate, or a region which is interpreted to havea high potential for the existence of extant martianlife forms. Given current understanding, this ap-plies to regions where liquid water is present ormay occur.” The SR-SAG determined that, to pro-ceed with identifying special regions, some wordsneeded clarification. The word propagate is takento mean reproduction (not just growth or disper-sal). Also, the focus on the word “likely” is takento apply to the probability of specific geologicalconditions during a certain time period and not toprobability of growth of terrestrial organisms.While the report does concentrate on the salientparameters of forward contamination and martianenvironmental conditions, it does not address thesecond clause of the definition concerning proba-bility of martian life, as there is no information.
The study limited itself to special regions thatmay exist on Mars and to environmental condi-tions that may exist within the next 100 years, aperiod reasonably within our predictive capabil-ities and within which astronauts are expected tobe on the surface of Mars. The SR-SAG also con-sidered only the upper 5 m of the Red Planet asthe maximum depth that current spacecraft couldaccess as a consequence of failure during entry,descent, and landing. Environments deeper than5 m were also considered important as possiblehabitats for life and targets for future exploration.However, in the absence of specific informationabout the subsurface environment and the oper-ational approach of any future robotic platformto access the deep subsurface, the SR-SAG rec-ommended that such cases should be analyzedon a case-by-case basis.
Limits to microbial life
The approach of the study group was to findany terrestrial representative that demonstratedthe ability to reproduce under the worst envi-ronmental conditions. Although many factorsmay limit microbial growth and reproduction,the known overriding environmental constraints
on Mars are low temperature and aridity, and asurface that is bathed in ultraviolet (UV) andgalactic cosmic radiation.
Life on Earth has been able to survive ex-tremely low temperatures, but for this study, thefigure of merit is the ability to reproduce. An ex-tensive review of the literature on low tempera-ture metabolic/reproductive studies reveals thatan exponential decrease in microbial metabolismenables long-term survival maintenance or per-haps growth. However, experiments and polarenvironments themselves have failed to show mi-crobial reproduction at temperatures below�15°C. For this reason, with margin added, atemperature threshold of �20°C is proposed foruse when considering special regions.
Although many terrestrial microorganisms cansurvive extreme desiccation, they all share the ab-solute requirement for liquid water to grow andreproduce. Various measures are used to quan-tify the availability of liquid water to biologicalsystems, but the one that was used to integratebiology and geology for this analysis was wateractivity (aw). Pure water has an aw of 1.0, and thevalue decreases with increasing solute concen-tration and with decreasing relative humidity.Some example aw values are: seawater � 0.98, sat-urated NaCl � 0.75, ice at �40°C � 0.67. For thisapplication, aw has the advantage in that it is aquantity that can be derived and measured, andapplied across multiple length scales in equilib-rium. The lowest known aw that allows microbialgrowth is for a yeast in an 83% (wt/vol) sucrosesolution where aw � 0.62. Based on currentknowledge, terrestrial organisms are not knownto be able to reproduce at an aw below 0.62; withmargin, an activity threshold of 0.5 is proposedfor use when considering special regions.
Water on Mars
Water on Mars in best analyzed in two broadclassifications: the portions of Mars that are at orclose to thermodynamic equilibrium and thosethat are in long-term disequilibrium.
In considering martian equilibrium conditions,the repeatability of thermal inertia results fromdata set to data set suggests that numerical ther-modynamic models are generally accurate to bet-ter than a few degrees during most seasons andare even more accurate on an annual average.Comparison between Mars Odyssey Gamma RaySpectrometer (GRS) measurements and theoreti-
MEPAG SPECIAL REGIONS SCIENCE ANALYSIS GROUP678
cal models of ice stability based on these samethermodynamic numerical models demonstratesexcellent agreement between theory and obser-vation. A critically important value of models isthat they have predictive value down to spatialscales much finer than that achievable by obser-vational data, and so, though there are macro-scopic processes that can produce distinct depar-tures from equilibrium, the scale tends to be localto regional, not microscopic.
Where ice is in vapor-diffusive exchange withthe atmosphere, the equilibrium temperature (thefrost point) is at about �75°C on contemporaryMars. Ice is not stable with respect to sublimationin places where diurnal or seasonal temperaturefluctuations significantly exceed �75°C. Thus,Mars’ ample supply of near-surface water is stub-bornly sequestered in solid form at temperaturesbelow the frost point, either on the polar caps orin vast high-latitude, subsurface deposits. Whilethe surface of Mars at many low-latitude loca-tions may exceed 0°C in the peak of the day, thetemperature 10–20 cm below those surfaces re-mains perpetually below �40°C. Were liquid toform at a higher surface temperature, it would betransported in a matter of minutes or hours to therelatively cold region just below the surface, andeventually to a permanent polar or subpolarreservoir by evaporation and condensation. Thus,persistent liquid water at or near the martian sur-face requires a significant departure from the gen-eral planetary setting in the form of either long-term disequilibria (such as geothermal sources)or short-term disequilibria (an impactor).
The equilibrium aw of martian regolith can becalculated as a function of temperature, using amean absolute humidity of 0.8 �bar and as-suming equilibrium with the atmosphere. Inwarm regolith, aw is literally orders of magni-tude too small to support life. The aw ap-proaches unity at the frost point, but at ex-tremely low temperatures. If, however, there isa significant barrier to equilibration with the at-mosphere, there is a possibility of much higherabsolute humidity and, therefore, significantlyhigher aw at warmer temperatures. Desert crustshave been proposed as a potential mechanismto provide a diffusion barrier, and were con-sidered in this study. Although crusts on Marshave been observed at the past landing sites,and other crust types are hypothetically possi-ble elsewhere, experience with desert crustson Earth shows that the effect of a semiper-
meable crust is to retard, not prevent, theachievement of equilibrium.
Where the surface and shallow subsurfaceof Mars are at or close to thermodynamic equi-librium with the atmosphere (using time-av-eraged, rather than instantaneous, equilib-rium), temperature and aw in the martianshallow subsurface are considerably below thethreshold conditions for propagation of ter-restrial life. The effects of thin films andsolute freezing point depression are includedwithin the aw.
An extensive literature speculates on mecha-nisms to form liquid water on Mars at differenttimes in the past and under different climate con-ditions (e.g., Farmer, 1976; Clow, 1987; Carr,1996), and common to all of them is the explicitunderstanding that present-day equilibrium con-ditions do not support the persistence of liquidwater at the surface. Uncertainty exists as towhether previous conditions were persistent orepisodic, with some attributing conditions to bepunctuated, due to impact effects, and others en-visioning longer-term stable early climates. Morerecently, orbital forcing has been recognized as afactor that drives climate change, with 50,000years being the shortest climate cycle affectinglatitudinal precipitation.
The SR-SAG considered possible environmentsin long-term disequilibrium, where water andtemperature were in equilibrium under condi-tions at an earlier time, but for which conditionshave changed, and do not hold for the present.Geological deposits might survive for 104–107
years by virtue of giving up their water veryslowly. The SR-SAG examined several potentialsites for long-term disequilibrium, either theoret-ical or actually observed, such as gullies, mid-lat-itude features of purported snow/ice deposits,remnant glacial deposits, craters, volcanoes, slopestreaks, recent outflow channels, possible hy-drothermal vents, low-latitude ground ice, andpolar caps.
• Some—though certainly not all—gullies andgully-forming regions might be sites at whichliquid water comes to the surface within thenext 100 years. At present, there are no knowncriteria by which a prediction can be made asto which—if any—of the tens of thousands ofgullies on Mars could become active—andwhether the fluid involved is indeed water—during this century.
MEPAG SPECIAL REGIONS SCIENCE ANALYSIS GROUP 679
• Because some of the “pasted-on”–type man-tle has a spatial, and possibly a genetic, rela-tionship to gullies (which in turn are ero-sional features possibly related to water), the“pasted-on” mantle may be a special region.The mid-latitude mantle, however, is thoughtto be desiccated, with low potential for thepossibility of transient liquid water in mod-ern times. Because the “pasted-on” mantleand some kinds of gullies may have a geneticrelationship, the mantle is interpreted to havea significant potential for modern liquid wa-ter.
• No craters with the combination of size andyouthfulness to retain enough heat to exceedthe temperature threshold for propagationhave been identified on Mars to date.
• We do not have evidence for volcanic rockson Mars of an age young enough to retainenough heat to qualify as a modern specialregion or suggest a place of modern volcanicor hydrothermal activity.
• Despite a deliberate and systematic searchspanning several years, no evidence has beenfound for the existence of thermal anomaliescapable of producing near-surface liquid wa-ter.
• The martian polar caps are too cold to be nat-urally occurring special regions in the presentorientation of the planet.
The SR-SAG proposes that martian regionsmay be categorized as non-special if the temper-ature will remain below �20°C or the aw will re-main below 0.5 for a period of 100 years afterspacecraft arrival. All other regions on Mars aredesignated as either special or uncertain. An un-certain region is treated as special until it is
shown to be otherwise. The SR-SAG found no re-gions to be special, but found uncertainty withthe gully and possibly related “pasted-on” man-tle regions. In this context, the SR-SAG has listedMars environments that may be “special” andclassified those that have observed features prob-ably associated with water, those that have a non-zero probability of being associated with water,and those areas that, if found, would have a highprobability of being associated with water.
A map has been developed that provides gen-eralized guidelines for the distribution of areasof concern that may be treated as special re-gions.
It should be noted that, even in a region de-termined to be “non-special,” it is possible that aspacecraft could create an environment thatmeets the definition of “special” or “uncertain.”It is possible for spacecraft to induce conditionsthat could exceed for some time the thresholdconditions for biological propagation, even whenthe ambient conditions were “not special” beforethe spacecraft arrived. Whether a special regionis induced or not depends on the configurationof the spacecraft, where it is sent, and what itdoes. This possibility is best evaluated on a case-by-case basis.
In summary, within the upper 5 m most ofMars is either too cold or too dry to support thepropagation of terrestrial life. However, there areregions that are in disequilibrium, naturally or in-duced, and could be classified as “special” or, ifenough uncertainty exists, could not be declaredas “non-special.”
Key Words: • Mars • Extremophile microor-ganism • Habitability • Planetary protection •Water activity • Special region
MEPAG SPECIAL REGIONS SCIENCE ANALYSIS GROUP680
Table of Contents
Executive Summary 677
1. Introduction 6821A. “Special Regions”—History and the Current Problem 6821B. This Study 6821C. How Does This Study Extend the Results of PREVCOM? 6831D. Future Steps 683
2. Approach 683
3. Clarification of the Existing Special Region Definition 684
4. Boundaries for the Present Analysis 6844A. Time Frame 6844B. Maximum Depth of Penetration by an Impacting Spacecraft 685
5. Implications from Microbiology 6875A. Introduction 6875B. Lower Temperature Threshold 6885C. Water Activity Threshold 6895D. Other Possible Limits to Terrestrial Life 6925E. Discussion 692
6. Water on Modern Mars 6936A. The Distribution of Water Where It Is at Equilibrium 6936B. Possible Secondary Factors That Affect a General Thermodynamic Model 695
6B-i. The Possible Effect of Diurnal and Seasonal Heating/Cooling 6956B-ii. The Possible Effect of Recharge from Subsurface Water Reservoirs 6966B-iii. The Possible Effect of Unfrozen Thin Films of Water 6976B-iv. The Possible Effect of Semipermeable Crusts 698
6C. Calculation of Water Activity on Modern Mars 699
7. Mars Environments in Thermodynamic Disequilibrium 7007A. Introduction 7007B. Gullies 7007C. Mid-Latitude Geomorphic Features That May Indicate Deposits of Snow/Ice 7037D. Glacial Deposits 7077E. Craters 7097F. Young Volcanics 7117G. Slope Streaks 7147H. Recent Outflow Channels? 7167I. The Nondiscovery of Geothermal Vents 7167J. The Possibility of Low-Latitude Ground Ice 7177K. The Polar Caps 718
8. Revision of the Special Region Definition and Guidelines 719
9. Discussion of Naturally Occurring Special Regions 7209A. Risk Acceptability 7209B. Special Regions on Mars Within the Temporal and Spatial Limits of This Analysis 721
10. Discussion of Spacecraft-Induced Special Regions 723
11. Appendix (Derivation of Fig. 22) 724
12. Acknowledgments 725
13. Abbreviations 725
14. References 725
MEPAG SPECIAL REGIONS SCIENCE ANALYSIS GROUP 681
1. INTRODUCTION
1A. “Special Regions”—History and theCurrent Problem
IN 2002, COSPAR INTRODUCED the term “specialregion” as a part of Mars PP policy. Prior to
2002, PP-related requirements for spacecraft go-ing to the martian surface consisted of two cate-gories that were distinguished by the purpose ofthe mission:
• IVa. Landers without extant life detection in-vestigations
• IVb. Landers with extant life detection investi-gations
By 2002, however, exploration results [primar-ily from the Mars Global Surveyor (MGS) orbiter,and soon after confirmed by Mars Odyssey]strongly suggested that some parts of Mars mightbe more likely than others to attract interest forextant life investigations and, potentially, morevulnerable to the effects of Earth-sourced biolog-ical contamination. This led to the introduction ofthe concept of “special regions,” which are envi-ronments on Mars that need a high degree of pro-tection independent of the mission purpose.
In April 2002, a COSPAR planetary protectionworkshop formulated a draft definition of “spe-cial region” and proposed that a new mission cat-egorization, Category IVc, be established for mis-sions that come (or might come) into contact withthem. This proposal was presented to COSPARat its 2002 meeting, and was formally adoptedshortly afterwards (http://www.cosparhq.org/scistr/PPPolicy.htm). NASA followed up by in-corporating the special regions concept into itspolicy by means of modification of NASA Pro-cedural Requirements 8020.12C Planetary Protec-tion Provisions for Robotic Extraterrestrial Missions,which was issued in 2005.
In 2005, a National Research Council (NRC)committee (referred to as NRC PREVCOM) com-pleted a NASA-requested detailed 2-year studyentitled Preventing the Forward Contamination ofMars (NRC, 2006). [NRC PREVCOM was a com-mittee of the National Research Council (of theNational Academies of Science) that, at NASA’srequest, examined PP measures for Mars. Subse-quent to accepting its statement of task, an NRCcommittee operates independently of its sponsor-ing agency.] In their analysis of “special regions,”
NRC PREVCOM found that, in using the currentspecial region definition, “there is at this time in-sufficient data to distinguish with confidence “spe-cial regions” from regions that are not special.”They also raised an important issue of scale—“Mars exhibits significant horizontal and spatialdiversity on km to cm spatial scales,” but some of the relevant observational data have a spatialresolution no better than �3 � 105 km2. NRC PREVCOM recommended an interim policy inwhich all of Mars is considered a “special region.”
For further information on PP policy and his-tory related to Mars, the interested reader is re-ferred to excellent recent reviews by DeVincenziet al. (1998) and NRC (2006).
1B. This Study
Purpose. At the November 2005 MEPAG meet-ing, NASA requested that MEPAG prepare acommunity-based analysis of the definition of“special region” and, if possible, propose clarifi-cations that make the definition more useful formission planning and PP implementation.MEPAG in turn chartered the SR-SAG and gaveit the following assignment:
• Propose, if it is possible to reach consensus, aquantitative clarification of the definition of“special region” that can be used in a practicalway to distinguish between regions on Mars thatare “special,” “non-special,” and “uncertain.”
• Prepare a preliminary analysis, in text form, ofthe kinds of martian environments that should
MEPAG SPECIAL REGIONS SCIENCE ANALYSIS GROUP682
DEFINITION #1.
Existing definition of “special region” (fromCOSPAR, 2005; NASA, 2005):
“ . . . a region within which terrestrial or-ganisms are likely to propate, or a regionwhich is interpreted to have a high poten-tial for the existence of extant martian lifeforms. Given current understanding, thisapplies to regions where liquid water is pre-sent or may occur. Specific examples includebut are not limited to:
a) Subsurface access in an area and to adepth where the presence of liquid wa-ter is probable
b) Penetration into the polar capsc) Areas of hydrothermal activity”
be considered “special” and “non-special.” Ifpossible, also represent this in map form.
Methodology. The SR-SAG consisted of 27 mem-bers with scientific backgrounds in various as-pects of microbial survival, physics, geology, andPP. The group included three members who alsoserved as part of NRC PREVCOM. The SAG metby means of weekly teleconferences (with severalsubgroups working in parallel) in December 2005and January 2006, along with extensive e-mail ex-change. From February 6 to 8, a 3-day Special Re-gions Workshop was held in Long Beach, CA, tointegrate results.
1C. How Does This Study Extend theResults of PREVCOM?
We consider the present study to be an exten-sion of the work of the NRC’s PREVCOM Com-mittee (NRC, 2006). Given the phrasing ofCOSPAR’s definition of special regions and, moreimportantly, the “specific examples” listed, NRCPREVCOM brought forward their recommenda-tion that “until measurements are made that per-mit confident distinctions to be drawn betweenregions that are special on Mars and those thatare not, NASA should treat all direct contactmissions as category IVs” [missions to specialregions, for which they recommended specificbiological cleanliness requirements]. NRCPREVCOM worked with the existing definitionand elected not to recommend modifications orqualifications to COSPAR’s language. [The NRCPREVCOM’s Statement of Task included the lan-guage that “to the maximum possible extent, therecommendations should be developed to becompatible with an implementation that woulduse the regulatory framework for planetary pro-tection currently in use by NASA and the Com-mittee on Space Research (COSPAR).” The fullNRC PREVCOM statement of task is given on pp.vii–viii, NRC PREVCOM (2006).] They advisedthat the community should endeavor to expandcurrent understanding through measurement andanalysis in order “to permit confident distinctionsto be drawn.” This led to the purpose of the SR-SAG, which was to consider the COSPAR de-finition and propose necessary and appropriateclarifications, qualifications, and extensions thatwould allow an improved ability to recognize spe-cial regions (and to allow different people to reachthe same interpretation of the definition).
NRC PREVCOM was explicit in its advice thatthe Mars Program should pursue measurementsto define special regions. While this study recog-nizes that models carry uncertainty and mea-surements will be forthcoming in the course ofexploration, we have extended currently avail-able information through the use of very conser-vative models and analysis.
1D. Future Steps
Our knowledge about Mars and the limits oflife on Earth will continue to evolve in the com-ing years. While the analysis reported here hasattempted to make conservative assumptions andadd additional margins to proposed thresholds,the SR-SAG anticipates that findings reportedhere may be reviewed and, if necessary, updatedseveral years from now unless sudden discover-ies require an earlier revision.
2. APPROACH
The charge to the SR-SAG was to prepare acommunity-based analysis of the definition of“special region” and propose clarificationsand/or guidelines that make the definition lessambiguous and more practical. The SR-SAG usedthe following general approach:
1. Consider the terms in the existing COSPARdefinition and clarify as needed.
2. Establish temporal and spatial boundary con-ditions for analysis.
3. Identify applicable threshold conditions forpropagation of terrestrial organisms.
4. Evaluate the distribution of the identifiedthreshold conditions on Mars, using both dataand models, as appropriate.
5. Analyze on a case-by-case basis those geolog-ical environments (including those that are hy-pothetical) on Mars that could (or would ifthey existed) potentially exceed the biologicalthreshold conditions.
6. Describe conceptually the possibility for space-craft-induced conditions that could exceed thethreshold levels for propagation; and proposean approach to respond to this possibility.
A comment about the scientific literature pertain-ing to water on Mars. There is a very large, and
MEPAG SPECIAL REGIONS SCIENCE ANALYSIS GROUP 683
what appears at first glance to be conflicting, lit-erature relating to water on Mars. This has cre-ated a certain confusion in the community. How-ever, the conclusions of many of the papers in theliterature have qualifications that involve time orcircumstances. To facilitate interpretation of theliterature and the application of it to specifics ofthe special region question, the SR-SAG found itnecessary to start from first principles to deriveits own understanding of the potential for wateron Mars during the time period of interest. Thishas given SR-SAG a context for assimilating andintegrating the many relevant details in the liter-ature.
3. CLARIFICATION OF THE EXISTINGSPECIAL REGION DEFINITION
The special region definition (above, DEFINI-TION #1) consists of two parts: (1) a definingstatement that consists of two clauses and (2) adescription of where, under the current inter-pretation, special regions may occur. The SR-SAG concludes that the first part is still useful,as long as some of the terms are clarified. Thesecond half needs to be revised and extendedwith an updated statement of “current under-standing.”
The first clause of the defining statement in-cludes the following words, which need clarifi-cation:
• Propagate. The verb “propagate” has two mean-ings, for which the respective synonyms are“reproduce” and “spread.” For the purpose ofthis analysis, we have assumed the formermeaning only. Although there has been exten-sive discussion that a biological contaminationevent requires both reproduction and disper-sion to create a problem for future explorers, amore conservative position is that reproduc-tion alone is sufficient to create questions, andthis was taken as the point of departure for thisstudy.
• Likely. It is assumed for the purpose of thisanalysis that the probability of growth of ter-restrial organisms under all martian environ-mental conditions cannot be accurately deter-mined. However, the probability that specifiedgeological conditions exist within a certaintime period can be estimated, in some casesquantitatively.
The second clause in the defining statementpertains to possible martian life forms and theirlikely locations. Because there is no informationon martian life forms, the hardiest Earth organ-isms are used as a proxy. However, the clause re-mains as part of the definition since, in the future,our understanding of potential martian life maychange and affect the parameters that define spe-cial regions. As a consequence, the SR-SAG analy-sis and this report concentrate on the forwardcontamination of Mars with live organisms fromEarth. The focus here is on identification of partsof the martian environment in which viable ter-restrial organisms would be unable to propagate,and establishment of an objective description ofsuch areas so that appropriate planning and im-plementation for PP can occur.
4. BOUNDARIES FOR THE PRESENT ANALYSIS
The analysis of martian special regions re-quired certain boundary conditions to be estab-lished as a basis for study. One significant bound-ary condition was the time frame to be used inthe identification of special regions. Another wasa spatial boundary (depth) to be applied to thisanalysis. Discussion of these two key bound-aries—time and depth—is presented below.
4A. Time frame
With respect to special regions, timeframe is-sues can be viewed in three ways—how long toavoid special regions, how long do special re-gions exist, or how long until they may exist. Cur-rent PP standards proscribe atmospheric entry byany Mars orbiter for a 50-year period if spacecraftassembly has not incorporated explicit protocolsfor bioburden reduction beyond assembly in aclass 100,000 cleanroom. This time span was se-lected toward the beginning of Mars exploration,when it was envisioned that the pace of Mars ex-ploration would be quicker than it has been. Be-cause of the technical challenges of accomplish-ing successful Mars missions, their high cost, andthe transition from a “space race” to the moremeasured pace of international space coopera-tion, fewer than 20 missions have been launched,and only about a third of those were successfullyimplemented in the 3 decades since the earlyViking missions. Furthermore, from recent or-
MEPAG SPECIAL REGIONS SCIENCE ANALYSIS GROUP684
biter and rover missions it has become recognizedthat Mars is far more diverse than earlier explo-rations had indicated, with a very large numberof scientific sites now identified for future explo-ration. Many cognizant researchers now antici-pate that the period of biological exploration willspan the current century, and this study makesno explicit assumptions about the length of theexploration period.
Based on input from the NASA Planetary Pro-tection Officer, this study used a 100-year timeframe over which the existence of martian specialregions would be considered and could be en-countered by any given mission. This figure wasaccepted as a premise for the SR-SAG analysis. Itallowed for the analysis of martian environmentsto take into account past and present climate, butnot to extend to the distant future of climate changedriven by obliquity cycles on Mars. It included con-sideration of current naturally occurring special re-gions, the possibility that a region could become aspecial region within the next 100 years (from thedate of a mission’s arrival) due to a natural event(e.g., eruption of a volcano), and the time scale forspacecraft-induced special regions.
How might the environmental conditions onMars over approximately the next 100–200 yearsdiffer from those of today? The primary factorthat controls long-term climate change on Marsis the variation in the planetary obliquity (the tiltof its spin axis with respect to its orbital plane)with time. The martian obliquity has varied be-tween 15° and 35° during the last 5 million years,with a periodicity of about 120,000 years (Laskaret al., 2004). This variation is widely regarded tohave been responsible for major climate varia-tions in the past (e.g., Jakosky and Carr, 1985;Haberle et al., 2003; Head et al., 2003a, 2005,2006a,b; Mischna et al., 2003; Mischna andRichardson, 2005; Forget et al., 2006). For exam-ple, when the obliquity is greater than about 30°,the annually averaged saturation vapor pressureat the martian poles is greater than at the equa-tor, a condition that drives a major redistributionof both water and CO2 on a planetary scale. Atpresent, Mars has a tilt of 25.2° and is abouthalfway through one of these obliquity cycles,though it is presently in a quiescent period of verylittle obliquity change. This means that 100 yearsfrom now the martian obliquity will be only mar-ginally higher than at present, which is not of sig-nificance for long-term climate change (Naka-mura and Tajika, 2003).
The south polar cap does appear to be able tochange within a 100-year time scale. There are ob-servations that show changes in the CO2 ice coverfrom one year to another (Malin et al., 2001;Thomas et al., 2005) and changes on the decadetime scale in the outline of the cap (or equiva-lently the degree of CO2 ice cover). Observationshave also shown that water ice is exposed wherethe CO2 ice is disappearing (Titus et al., 2003; Bib-ring et al., 2004). In addition, there are less directinferences from the water vapor seasonal behav-ior over many decades that have suggested thesame type of behavior but possibly with more ex-treme results (e.g., the entire CO2 cap potentiallydisappearing in some years). From a stabilitystandpoint, there is no reason why the CO2 icecannot come and go, possibly on the decade tocentury time scale (see Jakosky et al., 2005a,b).Whether and how this might affect climatic con-ditions elsewhere on Mars is not known. How-ever, we do not have evidence that these southpolar CO2 effects are causing significant changesin the planetary distribution of water.
The SR-SAG consensus is that the martian cli-mate 100 years (and 1,000 years) from now willlikely be essentially the same as it is today.
4B. Maximum Depth of Penetration by anImpacting Spacecraft
While PP concerns itself with all of Mars (sur-face and subsurface), not all of Mars is accessibleto contamination by robotic spacecraft. Thus, apractical analysis of special regions must take intoconsideration the part of the surface and shallowsubsurface that is vulnerable to contamination.For all missions, aside from planned operations,there is the possibility of accidental subsurface ac-cess as a result of hard impact (i.e., a crash). Therecan also be access to the subsurface as a result ofintentional hard impact (e.g., end of mission dis-posal of hardware or hard landing of entry, de-scent, and landing hardware). To address theseissues, it is possible to analyze impact scenariosand physical conditions at Mars to put bounds onthe possible contamination depth.
The depth of penetration of a crashing space-craft is a function of the following parameters: theangle of impact, the impact velocity, the mass of
MEPAG SPECIAL REGIONS SCIENCE ANALYSIS GROUP 685
PREMISE. A 100-year time span may be usedto assess the potential for special regions thatmay be encountered by any given mission.
the impacting object, and the strength and den-sity of the geological material being impacted. Allof these parameters will vary from mission tomission. The impact velocity is dependent on theentry velocity (at the top of the atmosphere) andthe ballistic coefficient, which determines howmuch the spacecraft will be slowed by the mar-tian atmosphere. Spacecraft sent to Mars in thefuture will have a range of ballistic coefficients,and entry velocity will be different for eachlaunch opportunity and will also depend on thechoice of trajectory. The penetration depth de-pends on whether the mass of the spacecraft staystogether or breaks up as it passes through the at-mosphere. The impact angle in a failure scenariowould depend on when control of the trajectorywere lost. Finally, the martian surface consists ofa mixture of outcrop (of both igneous and sedi-mentary rocks), regolith, accumulated wind-blown dust, and polar cap material, all of whichcould have been cemented by ice and/or miner-als and would influence the penetration depth.
The depth of impact can be estimated withcrater scaling laws. For impact into dry granularregolith, the following fit to dry sand impact datais suitable (Holsapple, 1993):
V � 0.14 (1700/�) M0.83 U1.02/G0.51
where V is crater volume in m3, � is the regolithdensity in kg/m3, M is the impacting mass in kg,U is the velocity in km/s, and G is the strengthof gravity relative to Earth (about 0.38). The term(1700/�) has been included to extend the originalmodel to densities other than the nominal sanddensity of 1,700 kg/m3.
For impacts into icy material the followingweak rock fit is used (Holsapple, 1993):
V � 0.009 (2100/�) M U1.65
Again, the model has been extended with a densitydependence. This model is intended for impactsinto targets with strengths averaging about 7.6 MPaover large areas. The laboratory strength of frozensoils and ice are on the order of 20 MPa at �25°C(Lee et al., 2002), and higher at lower temperatures,so even allowing for a reduction in strength due tosize effects, this model may overestimate cratersizes to some extent. This is appropriate for the pur-pose of estimating maximum depths.
It remains to specify how the crater depth anddiameter are related to the volume. The assump-
tion will be made that the crater is a paraboloidwith a depth-to-diameter ratio of 1/4. This is atypical ratio for the maximum transient dimen-sions of a simple crater. It should approximatelyagree with the final ratio of an icy crater, but thefinal crater in dry granular material would beshallower. The volume of a paraboloid withdepth H and diameter D is V � � H D2/8, andthe assumption H/D � 1/4 leads to the depth be-ing H � 0.54 V1/3.
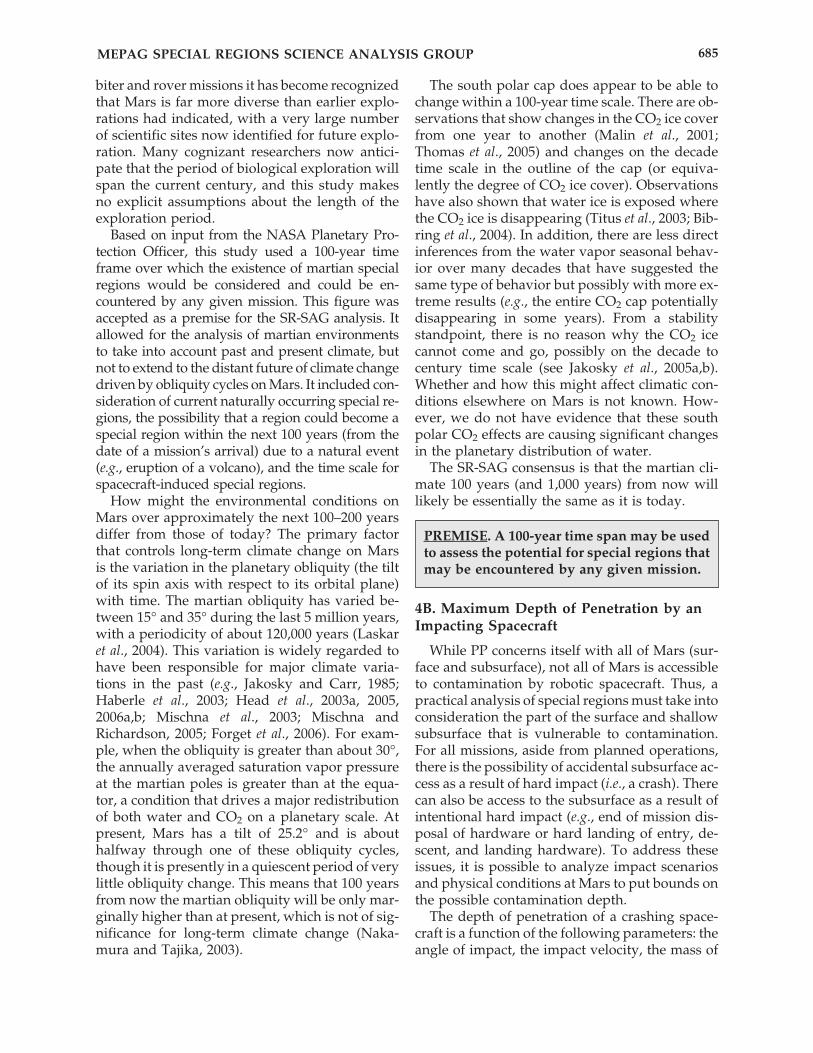
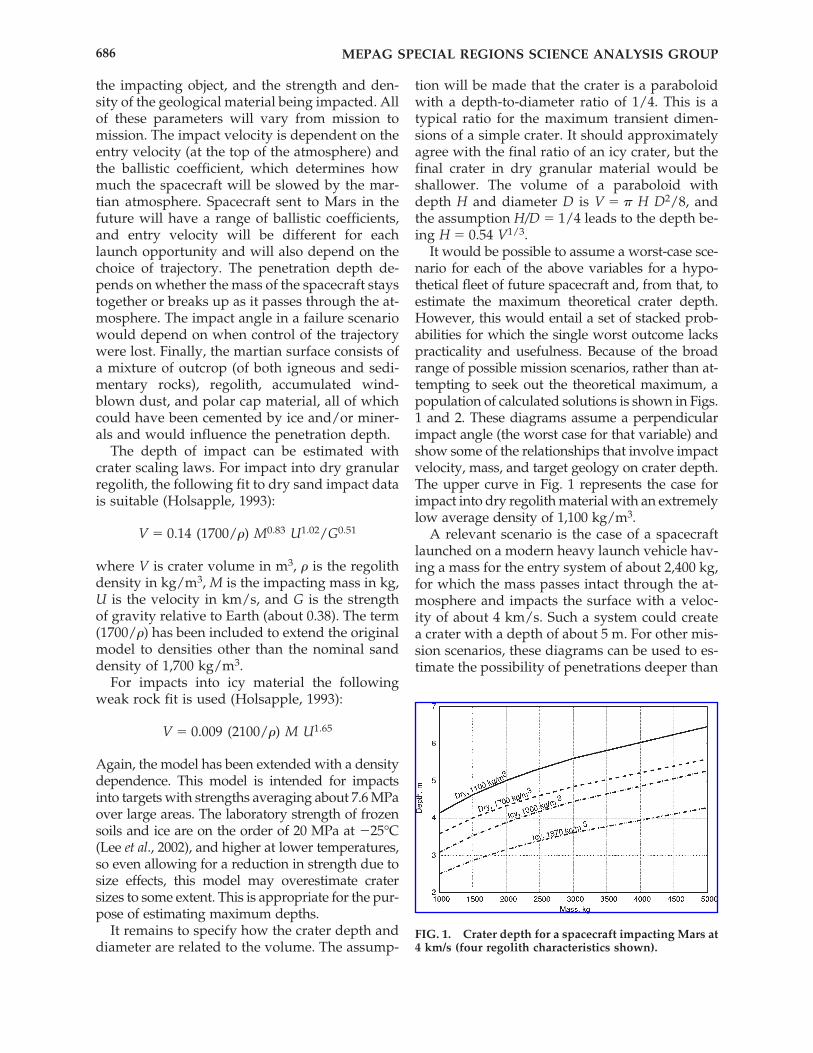
It would be possible to assume a worst-case sce-nario for each of the above variables for a hypo-thetical fleet of future spacecraft and, from that, toestimate the maximum theoretical crater depth.However, this would entail a set of stacked prob-abilities for which the single worst outcome lackspracticality and usefulness. Because of the broadrange of possible mission scenarios, rather than at-tempting to seek out the theoretical maximum, apopulation of calculated solutions is shown in Figs.1 and 2. These diagrams assume a perpendicularimpact angle (the worst case for that variable) andshow some of the relationships that involve impactvelocity, mass, and target geology on crater depth.The upper curve in Fig. 1 represents the case forimpact into dry regolith material with an extremelylow average density of 1,100 kg/m3.
A relevant scenario is the case of a spacecraftlaunched on a modern heavy launch vehicle hav-ing a mass for the entry system of about 2,400 kg,for which the mass passes intact through the at-mosphere and impacts the surface with a veloc-ity of about 4 km/s. Such a system could createa crater with a depth of about 5 m. For other mis-sion scenarios, these diagrams can be used to es-timate the possibility of penetrations deeper than
MEPAG SPECIAL REGIONS SCIENCE ANALYSIS GROUP686
FIG. 1. Crater depth for a spacecraft impacting Mars at4 km/s (four regolith characteristics shown).
5 m. For example, a hypothetical 5,000 kg space-craft (larger than we can currently land at Mars)impacting at 4 km/s would have an estimatedmaximum penetration depth of about 6.5 m.
In the future, we can expect innovative missionconcepts to incorporate deliberate access of thedeep subsurface through hard impacts, innovativedrills, or melt probes. For these, it will be necessaryto analyze the possibility of deliberate access intonaturally occurring special regions as a result ofplanned exploration into the deeper martian sub-surface. In addition, entry systems at some time inthe future will certainly be configured with differ-ent masses and ballistic coefficients (e.g., to fit inthe launch vehicle fairing), or might arrive at Marson trajectories with higher atmospheric entry ve-locities. For these systems, either detailed analysisof atmospheric deceleration can be performed orconservative simplifying assumptions can be used(e.g., no atmosphere) to evaluate impact scenariosand possible consequences.
5. IMPLICATIONS FROMMICROBIOLOGY
5A. Introduction
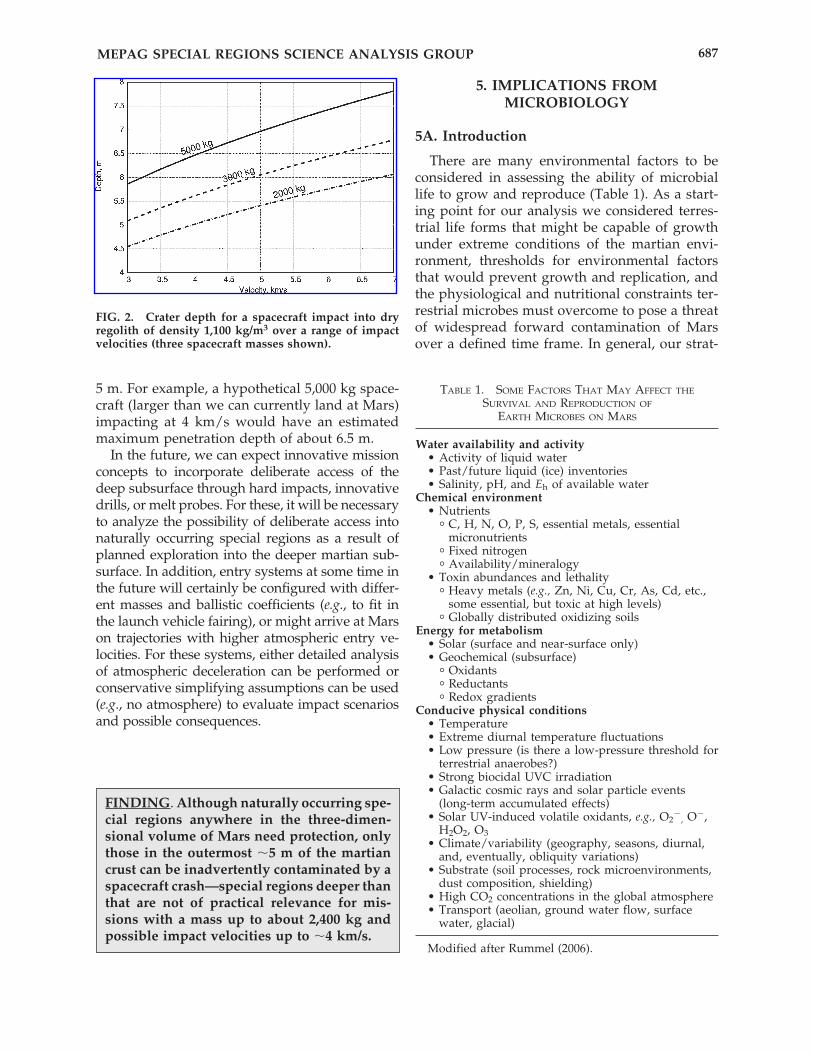
There are many environmental factors to beconsidered in assessing the ability of microbiallife to grow and reproduce (Table 1). As a start-ing point for our analysis we considered terres-trial life forms that might be capable of growthunder extreme conditions of the martian envi-ronment, thresholds for environmental factorsthat would prevent growth and replication, andthe physiological and nutritional constraints ter-restrial microbes must overcome to pose a threatof widespread forward contamination of Marsover a defined time frame. In general, our strat-
MEPAG SPECIAL REGIONS SCIENCE ANALYSIS GROUP 687
FIG. 2. Crater depth for a spacecraft impact into dryregolith of density 1,100 kg/m3 over a range of impactvelocities (three spacecraft masses shown).
FINDING. Although naturally occurring spe-cial regions anywhere in the three-dimen-sional volume of Mars need protection, onlythose in the outermost �5 m of the martiancrust can be inadvertently contaminated by aspacecraft crash—special regions deeper thanthat are not of practical relevance for mis-sions with a mass up to about 2,400 kg andpossible impact velocities up to �4 km/s.
TABLE 1. SOME FACTORS THAT MAY AFFECT THE
SURVIVAL AND REPRODUCTION OF
EARTH MICROBES ON MARS
Water availability and activity• Activity of liquid water• Past/future liquid (ice) inventories• Salinity, pH, and Eh of available water
Chemical environment• Nutrients
� C, H, N, O, P, S, essential metals, essentialmicronutrients
� Fixed nitrogen� Availability/mineralogy
• Toxin abundances and lethality� Heavy metals (e.g., Zn, Ni, Cu, Cr, As, Cd, etc.,
some essential, but toxic at high levels)� Globally distributed oxidizing soils
Energy for metabolism• Solar (surface and near-surface only)• Geochemical (subsurface)
� Oxidants� Reductants� Redox gradients
Conducive physical conditions• Temperature• Extreme diurnal temperature fluctuations• Low pressure (is there a low-pressure threshold for
terrestrial anaerobes?)• Strong biocidal UVC irradiation• Galactic cosmic rays and solar particle events
(long-term accumulated effects)• Solar UV-induced volatile oxidants, e.g., O2
�, O�,
H2O2, O3• Climate/variability (geography, seasons, diurnal,
and, eventually, obliquity variations)• Substrate (soil processes, rock microenvironments,
dust composition, shielding)• High CO2 concentrations in the global atmosphere• Transport (aeolian, ground water flow, surface
water, glacial)
Modified after Rummel (2006).
egy has been to find any terrestrial representative(no matter where it is from) that demonstrates theworst-case scenario. We are not assigning anyspecial Mars or spacecraft relevance to any ofthese organisms or situations, though we are doc-umenting observations that suggest the metabolicor physiological possibility of reproduction.
The Mars environment is extremely cold anddry, and the surface is bathed in UV radiationduring the daytime and significantly influencedby galactic cosmic radiation at all times. BecauseMars is cold, but not always, and extremely dry,but perhaps not everywhere, the concept of “spe-cial region” describes those places where envi-ronmental conditions might be compatible withmicrobial propagation. The special-region con-cept allows mission planners to address the re-quirements of PP in regions on Mars where ter-restrial Earth organisms might survive andproliferate.
5B. Lower Temperature Threshold
It is well documented that microorganisms onEarth live at temperatures well below the freezingpoint of pure water, e.g., inside glacial and sea iceand permafrost. This is possible because certainimpurities such as mineral acids or salts can re-duce the freezing point of water. These impuritiescan prevent freezing of intergranular veins in iceand thin films in permafrost, and permit transportof nutrients to and waste products from microbes.Furthermore, from viability and survival studies,we know that some cells can resist freezing. Sur-vival strategies include synthesis of stress proteins,reduction in cell size, dormancy, sporulation,adaptive modifications to their cellular compo-nents (e.g., changes in their fatty acid and phos-pholipids composition), or an alteration in the“structured” water in their cytoplasm (Russell,1992; Thieringer et al., 1998). These and other adap-tations allow them to operate more efficiently thanmesophilic organisms at low temperatures. Tem-perature influences growth rates and cell replica-tion by affecting the conformation of cellularmacromolecules and other cellular constituents,which in turn control substrate acquisition and de-termine the rates of enzymes reactions and me-tabolism (Russell et al., 1990). The relationship be-tween temperature and reaction rate (k) can bedescribed by an Arrhenius equation:
k � Ae�Ea/RT
where Ea is the activation energy, A is a constant,R is the universal gas constant, and T is absolutetemperature. The activation energy for most en-zymes is usually on the order of 420 kJ/mol. There-fore, although reactions rates would fall consider-ably with a drop in temperature, there is nothermodynamic restriction on growth at low tem-peratures. Although thermodynamics predictssome metabolic activity at low temperatures, thelower temperature limit for cell division is proba-bly set by freezing of the internal solution of thecell rather than reduction in enzymatic activity atlow temperature. Therefore, we chose an empiri-cal rather than theoretical approach to setting alower temperature limit to cell replication.
In developing a rationale for setting a lowertemperature threshold, we evaluated publishedreports of microbial activity that provide directand/or indirect evidence that microorganismssurvive or thrive at temperatures below �5°C.The studies we evaluated fell into three groups:direct measurements of cell replication, measure-ments of metabolic activity, and indirect mea-surements of inferred microbial activity (e.g., N2Oproduction in ice cores). Based on a proposal byMorita (1997), metabolic studies were categorizedfurther into those providing evidence of (1) survival metabolism, i.e., the extremely weak me-tabolism of immobile, probably dormant com-munities; (2) maintenance metabolism of com-munities with access to nutrients, which are freeto move but are still below thresholds for growth;or (3) actual growth and cell division that leadsto propagation. The metabolic activity measured,the methods used, the temperature limits, and thecategories of the responses are listed in Table 2.In addition, several studies have inferred micro-bial activity below �20°C from anomalous con-centrations or stable isotope signatures of prod-ucts of microbial metabolism. For example,Sowers (2001) proposed nitrification as the likelyexplanation for peak concentrations of N2O andhigh �15N and low �18O of N2O in Lake Vostokice core from the penultimate glacial maximum,about 140,000 years ago. Price and Sowers (2004)estimated that the rates of biomass turnover at�40°C correspond to 10 turnovers of cellular car-bon per billion years. Table 2 is not exhaustive,but is representative of a broad and diverse lit-erature on biological activity at low temperatures.
To summarize these data, many groups havedemonstrated some metabolic activity (using var-ious measures and by various techniques) at tem-
MEPAG SPECIAL REGIONS SCIENCE ANALYSIS GROUP688
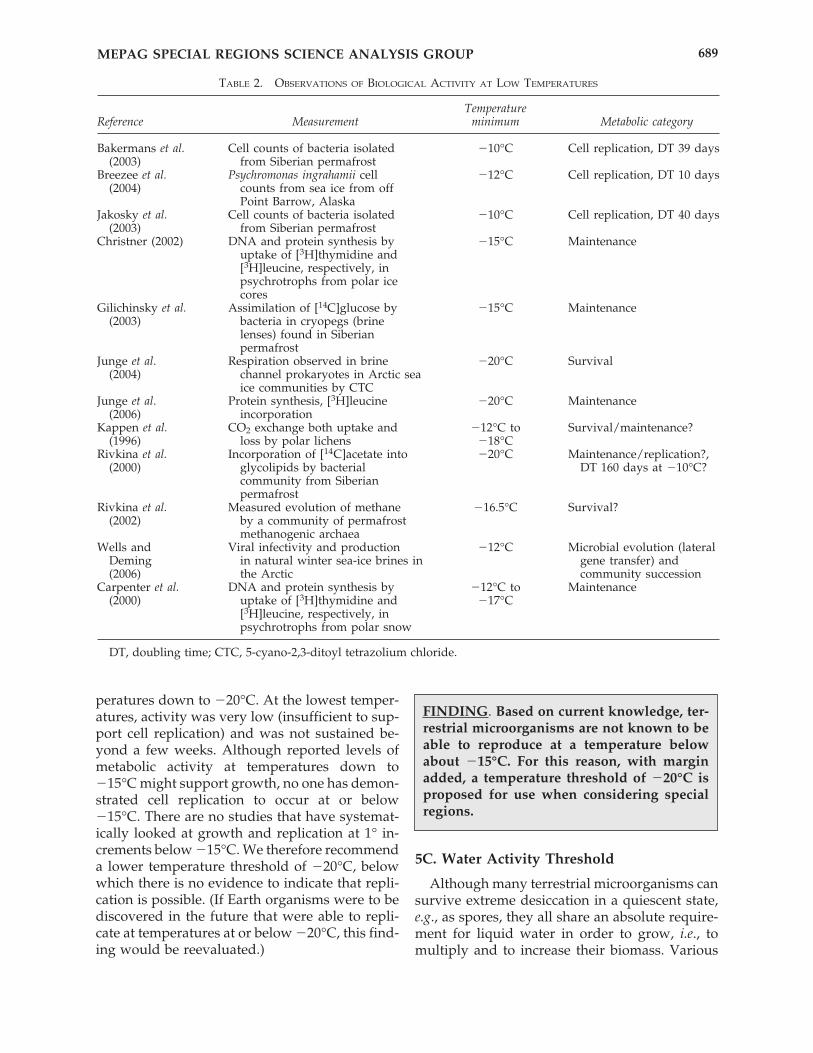
peratures down to �20°C. At the lowest temper-atures, activity was very low (insufficient to sup-port cell replication) and was not sustained be-yond a few weeks. Although reported levels ofmetabolic activity at temperatures down to�15°C might support growth, no one has demon-strated cell replication to occur at or below�15°C. There are no studies that have systemat-ically looked at growth and replication at 1° in-crements below �15°C. We therefore recommenda lower temperature threshold of �20°C, belowwhich there is no evidence to indicate that repli-cation is possible. (If Earth organisms were to bediscovered in the future that were able to repli-cate at temperatures at or below �20°C, this find-ing would be reevaluated.)
5C. Water Activity Threshold
Although many terrestrial microorganisms cansurvive extreme desiccation in a quiescent state,e.g., as spores, they all share an absolute require-ment for liquid water in order to grow, i.e., tomultiply and to increase their biomass. Various
MEPAG SPECIAL REGIONS SCIENCE ANALYSIS GROUP 689
TABLE 2. OBSERVATIONS OF BIOLOGICAL ACTIVITY AT LOW TEMPERATURES
TemperatureReference Measurement minimum Metabolic category
Bakermans et al. Cell counts of bacteria isolated �10°C Cell replication, DT 39 days(2003) from Siberian permafrost
Breezee et al. Psychromonas ingrahamii cell �12°C Cell replication, DT 10 days(2004) counts from sea ice from off
Point Barrow, AlaskaJakosky et al. Cell counts of bacteria isolated �10°C Cell replication, DT 40 days
(2003) from Siberian permafrostChristner (2002) DNA and protein synthesis by �15°C Maintenance
uptake of [3H]thymidine and[3H]leucine, respectively, inpsychrotrophs from polar icecores
Gilichinsky et al. Assimilation of [14C]glucose by �15°C Maintenance(2003) bacteria in cryopegs (brine
lenses) found in Siberianpermafrost
Junge et al. Respiration observed in brine �20°C Survival(2004) channel prokaryotes in Arctic sea
ice communities by CTCJunge et al. Protein synthesis, [3H]leucine �20°C Maintenance
(2006) incorporationKappen et al. CO2 exchange both uptake and �12°C to Survival/maintenance?
(1996) loss by polar lichens �18°CRivkina et al. Incorporation of [14C]acetate into �20°C Maintenance/replication?,
(2000) glycolipids by bacterial DT 160 days at �10°C?community from Siberianpermafrost
Rivkina et al. Measured evolution of methane �16.5°C Survival?(2002) by a community of permafrost
methanogenic archaeaWells and Viral infectivity and production �12°C Microbial evolution (lateral
Deming in natural winter sea-ice brines in gene transfer) and(2006) the Arctic community succession
Carpenter et al. DNA and protein synthesis by �12°C to Maintenance(2000) uptake of [3H]thymidine and �17°C
[3H]leucine, respectively, inpsychrotrophs from polar snow
DT, doubling time; CTC, 5-cyano-2,3-ditoyl tetrazolium chloride.
FINDING. Based on current knowledge, ter-restrial microorganisms are not known to beable to reproduce at a temperature belowabout �15°C. For this reason, with marginadded, a temperature threshold of �20°C isproposed for use when considering specialregions.
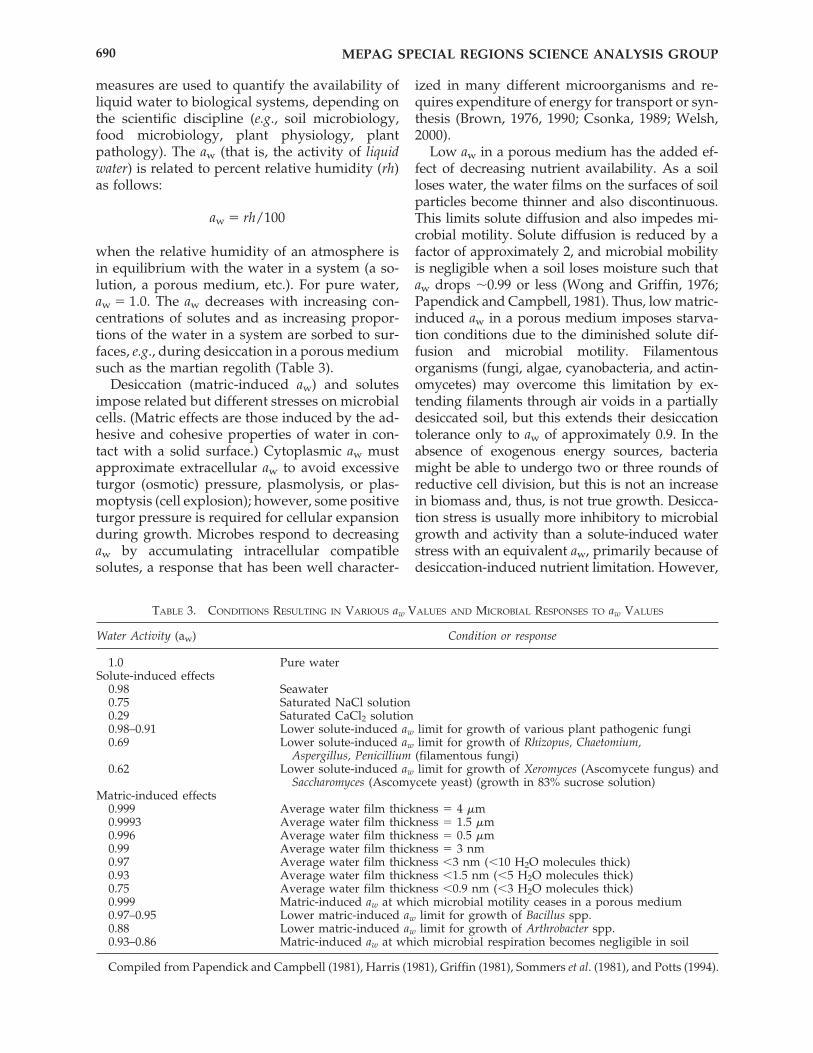
measures are used to quantify the availability ofliquid water to biological systems, depending onthe scientific discipline (e.g., soil microbiology,food microbiology, plant physiology, plantpathology). The aw (that is, the activity of liquidwater) is related to percent relative humidity (rh)as follows:
aw � rh/100
when the relative humidity of an atmosphere isin equilibrium with the water in a system (a so-lution, a porous medium, etc.). For pure water,aw � 1.0. The aw decreases with increasing con-centrations of solutes and as increasing propor-tions of the water in a system are sorbed to sur-faces, e.g., during desiccation in a porous mediumsuch as the martian regolith (Table 3).
Desiccation (matric-induced aw) and solutesimpose related but different stresses on microbialcells. (Matric effects are those induced by the ad-hesive and cohesive properties of water in con-tact with a solid surface.) Cytoplasmic aw mustapproximate extracellular aw to avoid excessiveturgor (osmotic) pressure, plasmolysis, or plas-moptysis (cell explosion); however, some positiveturgor pressure is required for cellular expansionduring growth. Microbes respond to decreasingaw by accumulating intracellular compatiblesolutes, a response that has been well character-
ized in many different microorganisms and re-quires expenditure of energy for transport or syn-thesis (Brown, 1976, 1990; Csonka, 1989; Welsh,2000).
Low aw in a porous medium has the added ef-fect of decreasing nutrient availability. As a soilloses water, the water films on the surfaces of soilparticles become thinner and also discontinuous.This limits solute diffusion and also impedes mi-crobial motility. Solute diffusion is reduced by afactor of approximately 2, and microbial mobilityis negligible when a soil loses moisture such thataw drops �0.99 or less (Wong and Griffin, 1976;Papendick and Campbell, 1981). Thus, low matric-induced aw in a porous medium imposes starva-tion conditions due to the diminished solute dif-fusion and microbial motility. Filamentousorganisms (fungi, algae, cyanobacteria, and actin-omycetes) may overcome this limitation by ex-tending filaments through air voids in a partiallydesiccated soil, but this extends their desiccationtolerance only to aw of approximately 0.9. In theabsence of exogenous energy sources, bacteriamight be able to undergo two or three rounds ofreductive cell division, but this is not an increasein biomass and, thus, is not true growth. Desicca-tion stress is usually more inhibitory to microbialgrowth and activity than a solute-induced waterstress with an equivalent aw, primarily because ofdesiccation-induced nutrient limitation. However,
MEPAG SPECIAL REGIONS SCIENCE ANALYSIS GROUP690
TABLE 3. CONDITIONS RESULTING IN VARIOUS aw VALUES AND MICROBIAL RESPONSES TO aw VALUES
Water Activity (aw) Condition or response
1.0 Pure waterSolute-induced effects
0.98 Seawater0.75 Saturated NaCl solution0.29 Saturated CaCl2 solution0.98–0.91 Lower solute-induced aw limit for growth of various plant pathogenic fungi0.69 Lower solute-induced aw limit for growth of Rhizopus, Chaetomium,
Aspergillus, Penicillium (filamentous fungi)0.62 Lower solute-induced aw limit for growth of Xeromyces (Ascomycete fungus) and
Saccharomyces (Ascomycete yeast) (growth in 83% sucrose solution)Matric-induced effects
0.999 Average water film thickness � 4 �m0.9993 Average water film thickness � 1.5 �m0.996 Average water film thickness � 0.5 �m0.99 Average water film thickness � 3 nm0.97 Average water film thickness �3 nm (�10 H2O molecules thick)0.93 Average water film thickness �1.5 nm (�5 H2O molecules thick)0.75 Average water film thickness �0.9 nm (�3 H2O molecules thick)0.999 Matric-induced aw at which microbial motility ceases in a porous medium0.97–0.95 Lower matric-induced aw limit for growth of Bacillus spp.0.88 Lower matric-induced aw limit for growth of Arthrobacter spp.0.93–0.86 Matric-induced aw at which microbial respiration becomes negligible in soil
Compiled from Papendick and Campbell (1981), Harris (1981), Griffin (1981), Sommers et al. (1981), and Potts (1994).
specific solutes may be toxic to microbes, e.g.,sodium ions are inhibitory to some degree to allmicrobes if they accumulate intracellularly.
There is no doubt that the majority of hyper-saline environments on Earth harbor significantpopulations of microorganisms (for a recent sum-mary, see Grant, 2004). However, values of aw donot generally fall much below 0.75, the limitingvalue obtainable at the saturation point of NaCl(5.2 M). Halophilic microbes (including membersof the Bacteria, Archaea, and Eukarya) can un-questionably propagate in saturated NaCl solu-tions (aw � 0.75). Although the presence of organ-isms in concentrated brines of other salts with awlower than 0.75 has been observed, there are ques-tions with regard to the nature of their life cyclesand where and how they reproduce and grow.
For example, microbial communities have beenreported in Don Juan Pond in Antarctica, a smallunfrozen Antarctic lake dominated by very largeconcentrations of CaCl2 during the winter. Totaldissolved salts may exceed 47% (wt/vol), and theaw value is recorded at 0.45 (Siegel et al., 1979).However, there has been dispute over the evi-dence for microbial colonization of this site(Horowitz et al., 1972), and the prevailing opin-ion is that life is unlikely to exist at this aw value(Grant, 2004). The algal mat communities developduring the summer in melt water at the marginsof the pond, which is essentially fresh water, andhow this community relates to the low-activitywinter brine is uncertain. As summarized byGrant (2004), “this particular site is long overduefor a re-examination using direct molecular tech-nologies.” Another example is the MgCl2 andKCl-rich Dead Sea brine (aw �0.67). However, themicrobes in this brine are likely survivors frombrief intervals of growth that follow dilution withfresh water (Aharon Oren, personal communica-tion). A third example is the deep anoxic basinsin the Mediterranean, where the water is nearlysaturated with MgCl2 (5.0 M, aw �0.3) (van derWielen et al., 2005). The presence of microbes inthis brine is indicated by 16S ribosomal RNAgenes and some enzymatic activity. However,there is no direct evidence of reproduction orgrowth in the brine—the DNA and enzymescould ultimately be derived from microbes thatgrew in overlying water with much lower salin-ity rather than in the highly concentrated brine.
The lowest solute-induced aw for which well-documented growth has been shown is 0.62. Thisis the case of xerophilic fungi growing in highlyconcentrated (83% wt/vol) sucrose solutions
(Harris, 1981). Sucrose solutions as microbialhabitats are more relevant to food microbiologythan to naturally occurring environments such asbrines or soils. Nonetheless, this value of awserves as a useful benchmark.
The lowest matric-induced aw that allows mi-crobial proliferation is dictated by solute diffusionand the availability of nutrients in solution. Thelowest matric-induced aw enabling growth of bac-teria in culture is approximately 0.88. More im-portantly, the aw at which microbial respiration be-comes negligible as a soil loses moisture isapproximately 0.86–0.93 (Sommers et al., 1981).Soil respiration is a culture-independent measureand, thus, serves as a good indicator of the meta-bolic capabilities of all soil microbes. The actual awat which microbial proliferation ceases is, in alllikelihood, higher than this in that soil microbescan respire by endogenous metabolism under con-ditions that are too dry for cell proliferation.
Water in contact with ice deserves special at-tention. The aw of pure liquid water at any tem-perature is 1.0 and is not temperature-dependent.However, the aw of ice is temperature-dependentand declines from 1.0 as temperature decreases.The aw of ice is equal to the water vapor pressureover ice divided by the water pressure over pureliquid water. Thus, at T � 0°C, aw of ice � 1.0; atT � �20°C, aw � 0.82; at T � �40°C, aw � 0.67;and so forth. Note that relative humidity meters(e.g., Vaisala humicap sensors) read aw, and so arelative humidity meter placed in an atmospherein equilibrium over pure ice at �40°C will read67%.
The aw of any solution in equilibrium with icewill be equal to the aw of the ice and does not de-pend on which molecules are in solution or theirquantity (Koop, 2002). Physically, the solutionwill gain or lose water until the aw is equal be-tween the solid phase (ice) and the liquid phase(the solution). This allows the aw of ice-rich re-gions on Mars to be predicted solely from a mea-surement of temperature. Similarly, the eutectictemperature of any solution can be predictedsince that is the temperature at which the aw ofice is equal to the aw of the saturated solution.
MEPAG SPECIAL REGIONS SCIENCE ANALYSIS GROUP 691
FINDING. Based on current knowledge, ter-restrial organisms are not known to be ableto reproduce at an aw below 0.62; with mar-gin, an activity threshold of 0.5 is proposedfor use when considering special regions.
5D. Other Possible Limits to Terrestrial Life
SR-SAG concluded that a number of factors(some listed in Table 1, some not) contribute to areduction in the probability of propagation, butfor none except temperature and water activity isit possible at the present time to define practicalthreshold criteria that would apply to all terres-trial microbes.
The nutritional requirements for terrestrial mi-croorganisms on Mars were considered to be keyfactors in limiting the proliferation of microor-ganisms on Mars. Terrestrial microorganisms re-quire exogenous sources of nutrients, and acces-sible organic and/or inorganic nutrients inmartian regolith have not been demonstrated(Biemann et al., 1977; Biemann and Lavoie, 1979).Although terrestrial chemoautotrophs do not re-quire organic nutrients, they do require exoge-nous nutrient and energy sources, not all of whichcan be obtained in gaseous form. The diurnaltemperature fluctuations shorten durations attemperatures above the minimum required forgrowth and require organisms to be capable ofsurviving repeated exposure to eutectic freezing.Both elicit a stress response that diverts resourcestoward repair of cell damage rather than cell di-vision. The strong biocidal UVC irradiation onMars helps to further constrain the proliferationof terrestrial microorganisms on Mars by two keyprocesses: (a) UVC irradiation can quickly reducethe viability of sun-exposed bioloads on space-craft surfaces, and (b) UVC irradiation will likelyreduce long-distance dispersal of the remainingviable bioloads by imposing a highly lethal non-ionizing radiation environment on the dispersedmicroorganisms. [The UV irradiation on Mars issignificantly higher in the UVC region (190–280nm) than on Earth because of a generally thinneratmosphere and the lack of an extensive ozonelayer (Kuhn and Atreya, 1979; Appelbaum andFlood, 1990; Cockell et al., 2000; Patel et al., 2002).On Earth, the ozone layer attenuates all UV irra-diation below 290–300 nm, i.e., no UVC wave-lengths reach the Earth’s surface. The presence ofUVC irradiation on Mars creates an environmentat the surface that exhibits a total UV flux(200–400 nm) that is up to three orders of mag-nitude more biocidal than on Earth (Cockell et al.,2000; Patel et al., 2002). Recent models suggestthat the high UVC flux on Mars can act to reducethe viability of some sun-exposed microbial cellson spacecraft surfaces by greater than six orders
of magnitude in as short a time as a few tens ofminutes to no more than several hours (Schuergeret al., 2003, 2006; Newcombe et al., 2005). In ad-dition, the downwelling UVC will penetrate pits,cracks, and other microscopic topographical fea-tures on spacecraft materials, resulting in some ofthe more sheltered microorganisms becoming in-active in reasonably short periods of time(Schuerger et al., 2005). However, the biocidal ef-fects of UVC cannot reach deeply embedded bi-oloads, cannot penetrate UV-absorbing materials,and cannot affect bioloads on internal compo-nents of spacecraft.] For organisms near or at thesurface, long-term exposure to galactic cosmicrays and solar particle events will certainly in-crease lethality and reduce viability.
None of these secondary factors has been ade-quately measured or modeled for the martiansurface or near-subsurface to allow us to setthresholds about their effect on survival, growth,and proliferation of microorganisms on Mars.However, all combine to lower the likelihood thatEarth organisms will be able to propagate or evenspread at the surface while remaining viable.
5E. Discussion
We conclude that thresholds for temperature(�20°C) and aw (0.5) define conditions belowwhich Earth organisms will not grow or replicate.Such conditions that might exist on Mars mustactually exceed both of these parameters for pe-riods of time sufficient to allow growth and celldivision to occur. We consider these to be veryconservative values. Cell division has never beenobserved below sustained temperatures of�12°C, and 0.5 aw is much lower than the mini-mum value for matric-induced aw values that al-low for microbial propagation in terrestrial envi-ronments. This value is more conservative
MEPAG SPECIAL REGIONS SCIENCE ANALYSIS GROUP692
FINDING. Despite knowledge that UV irra-diation at the surface of Mars is significantlyhigher than on Earth, UV effects have notbeen adequately modeled for the martiansurface or near-subsurface to allow us to setthresholds about their effects on growth andproliferation of microorganisms on Mars.However, UV may be considered as a factorthat limits the spread of viable Earth organ-isms.
(lower) than the lowest solute-induced aw knownto be compatible with growth: the unusual caseof yeasts growing in a concentrated solution ofsugar. Modeling studies predict that long-termconditions exceeding these thresholds will notpersist long enough to permit cell division cycles,which may require weeks to years for comple-tion.
Although it is impossible to assign with cer-tainty values for probability of growth of an Earthorganism on Mars, we can be confident that as-signment of “special region” requires that condi-tions exceed minimal temperature and aw param-eters defined above. In addition, the litany ofenvironmental stressors discussed above furtherreduces the likelihood of propagation of terres-trial organisms.
6. WATER ON MODERN MARS
Water on Mars is best analyzed in two broad,distinct classifications: the parts of Mars that areat or close to thermodynamic equilibrium andthose that are in long-term disequilibrium.
6A. The Distribution of Water Where It Isat Equilibrium
Introduction. Numerical thermodynamic mod-els of martian surface and subsurface tempera-tures have been successfully used for decades toexamine the physical nature of the surface layer(e.g., Kieffer et al., 1977) and the behavior of sub-surface volatiles (e.g., Leighton and Murray,1966). The repeatability of thermal inertia resultsfrom data set to data set (e.g., Jakosky et al., 2000)indicates that these models are generally accurateto better than a few degrees during most seasonsand even more accurate on an annual average.
The absolute humidity (i.e., the partial pressureof water) varies with time and location on Mars,but it seldom climbs much above 0.8 �bar. Rela-tive humidity is the ratio of this partial pressureto the saturation vapor pressure of the air or re-
golith, which is a function of temperature, vary-ing exponentially with 1/T. Over the large tem-perature extremes of a martian day, the relativehumidity may go to 100% at night as frost is de-posited and fall to very low values in the warmthof the day, but the absolute humidity will varyvery little. Where ice is in equilibrium with theobserved atmospheric water vapor pressure onmodern Mars (i.e., when it is at the frost point),it will have a temperature of about �75°C (Mel-lon et al., 2004). This means that, where there isvapor diffusive equilibrium with the atmosphere,ice is unstable with respect to sublimation at tem-peratures above �75°C, and water vapor is un-stable with respect to freezing at temperatures be-low that.
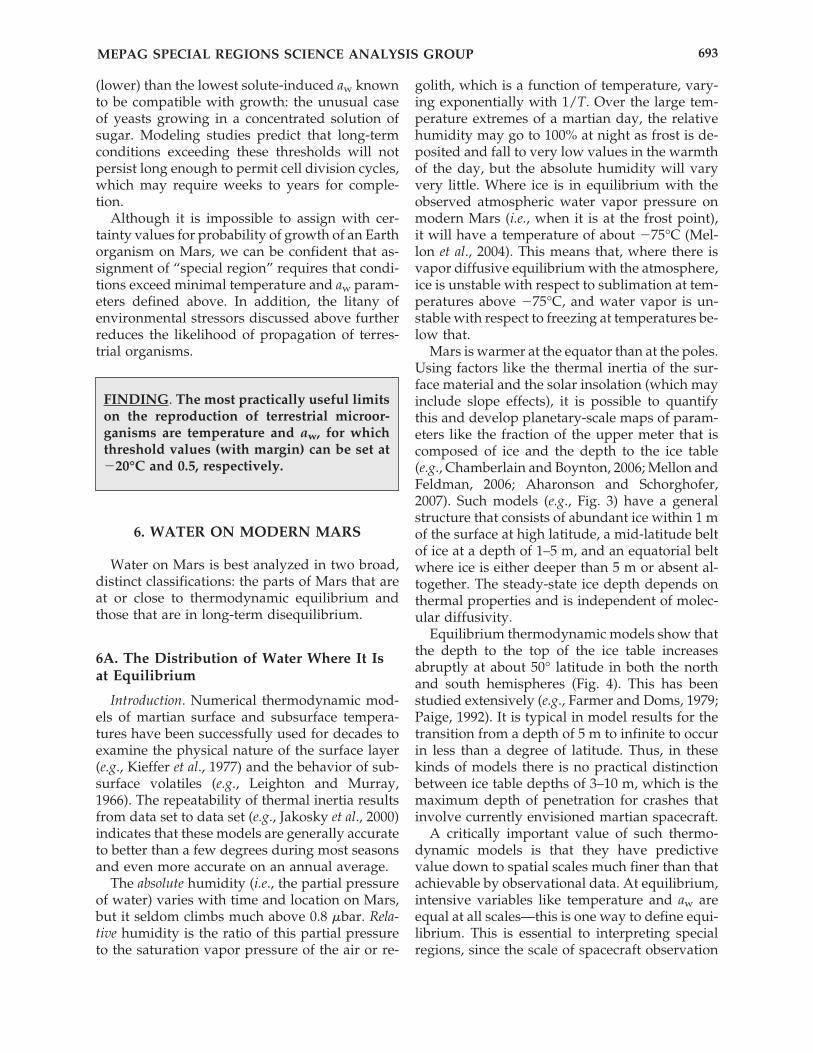
Mars is warmer at the equator than at the poles.Using factors like the thermal inertia of the sur-face material and the solar insolation (which mayinclude slope effects), it is possible to quantifythis and develop planetary-scale maps of param-eters like the fraction of the upper meter that iscomposed of ice and the depth to the ice table(e.g., Chamberlain and Boynton, 2006; Mellon andFeldman, 2006; Aharonson and Schorghofer,2007). Such models (e.g., Fig. 3) have a generalstructure that consists of abundant ice within 1 mof the surface at high latitude, a mid-latitude beltof ice at a depth of 1–5 m, and an equatorial beltwhere ice is either deeper than 5 m or absent al-together. The steady-state ice depth depends onthermal properties and is independent of molec-ular diffusivity.
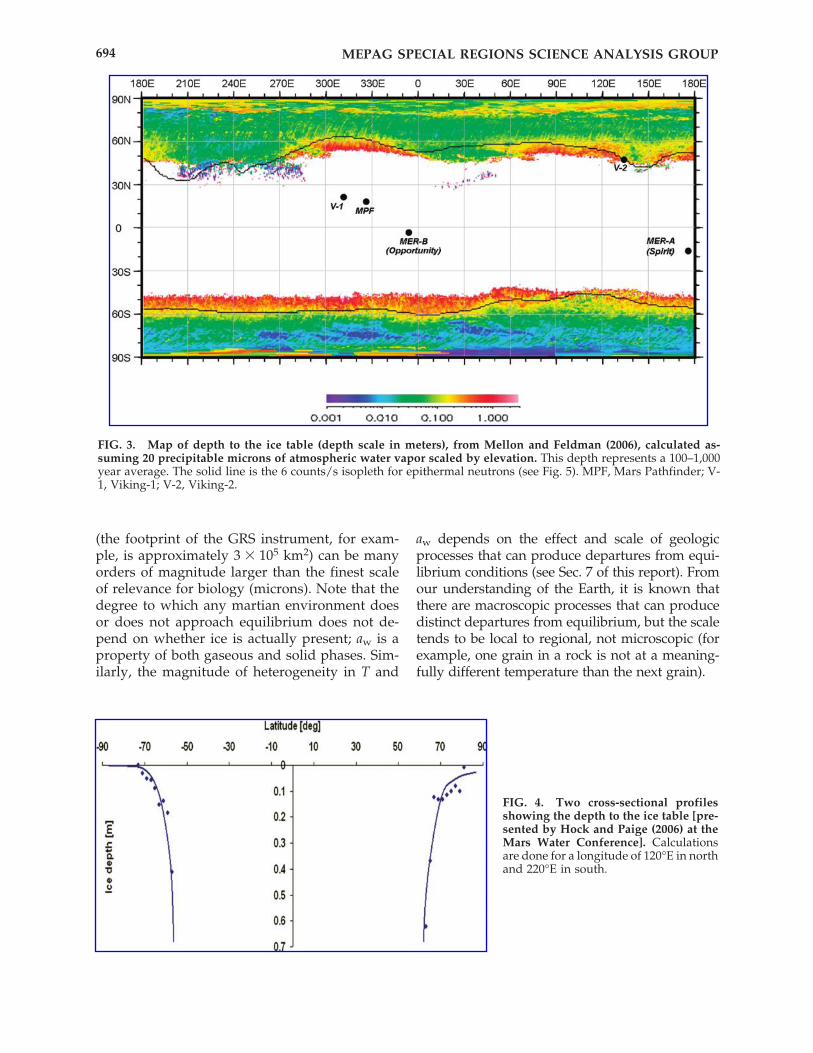
Equilibrium thermodynamic models show thatthe depth to the top of the ice table increasesabruptly at about 50° latitude in both the northand south hemispheres (Fig. 4). This has beenstudied extensively (e.g., Farmer and Doms, 1979;Paige, 1992). It is typical in model results for thetransition from a depth of 5 m to infinite to occurin less than a degree of latitude. Thus, in thesekinds of models there is no practical distinctionbetween ice table depths of 3–10 m, which is themaximum depth of penetration for crashes thatinvolve currently envisioned martian spacecraft.
A critically important value of such thermo-dynamic models is that they have predictivevalue down to spatial scales much finer than thatachievable by observational data. At equilibrium,intensive variables like temperature and aw areequal at all scales—this is one way to define equi-librium. This is essential to interpreting specialregions, since the scale of spacecraft observation
MEPAG SPECIAL REGIONS SCIENCE ANALYSIS GROUP 693
FINDING. The most practically useful limitson the reproduction of terrestrial microor-ganisms are temperature and aw, for whichthreshold values (with margin) can be set at�20°C and 0.5, respectively.
(the footprint of the GRS instrument, for exam-ple, is approximately 3 � 105 km2) can be manyorders of magnitude larger than the finest scaleof relevance for biology (microns). Note that thedegree to which any martian environment doesor does not approach equilibrium does not de-pend on whether ice is actually present; aw is aproperty of both gaseous and solid phases. Sim-ilarly, the magnitude of heterogeneity in T and
aw depends on the effect and scale of geologicprocesses that can produce departures from equi-librium conditions (see Sec. 7 of this report). Fromour understanding of the Earth, it is known thatthere are macroscopic processes that can producedistinct departures from equilibrium, but the scaletends to be local to regional, not microscopic (forexample, one grain in a rock is not at a meaning-fully different temperature than the next grain).
MEPAG SPECIAL REGIONS SCIENCE ANALYSIS GROUP694
FIG. 3. Map of depth to the ice table (depth scale in meters), from Mellon and Feldman (2006), calculated as-suming 20 precipitable microns of atmospheric water vapor scaled by elevation. This depth represents a 100–1,000year average. The solid line is the 6 counts/s isopleth for epithermal neutrons (see Fig. 5). MPF, Mars Pathfinder; V-1, Viking-1; V-2, Viking-2.
FIG. 4. Two cross-sectional profilesshowing the depth to the ice table [pre-sented by Hock and Paige (2006) at theMars Water Conference]. Calculationsare done for a longitude of 120°E in northand 220°E in south.
Is an equilibrium model consistent with observeddata? The strong general agreement between mod-els of ground temperature and ground ice and ob-servations of temperature and hydrogen suggeststhat such numerical simulations capture the majorportion of the relevant physical processes that con-trol these phenomena. These models are based onwell-known physical processes of solar heat, radi-ation, conduction, etc. They have been validatedby analytic solutions and by the general consis-tency with spacecraft observations (includingplanets other than Mars). The errors in these mod-els tend to be related to missing or oversimplifiedsecondary physics. For example, emissivity varia-tions from one region to another due to changesin mineralogy can affect the kinetic surface tem-perature and are usually not included in numeri-cal simulations. The magnitude of these errors canbe as much as a few degrees.
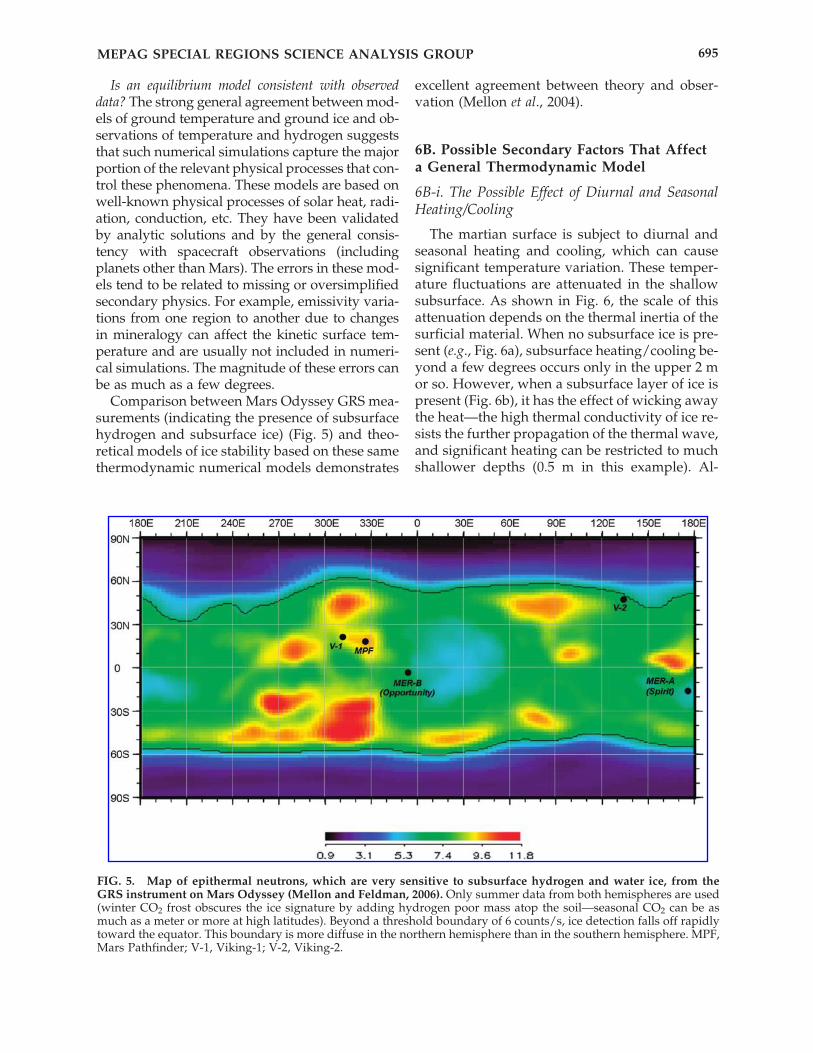
Comparison between Mars Odyssey GRS mea-surements (indicating the presence of subsurfacehydrogen and subsurface ice) (Fig. 5) and theo-retical models of ice stability based on these samethermodynamic numerical models demonstrates
excellent agreement between theory and obser-vation (Mellon et al., 2004).
6B. Possible Secondary Factors That Affecta General Thermodynamic Model
6B-i. The Possible Effect of Diurnal and SeasonalHeating/Cooling
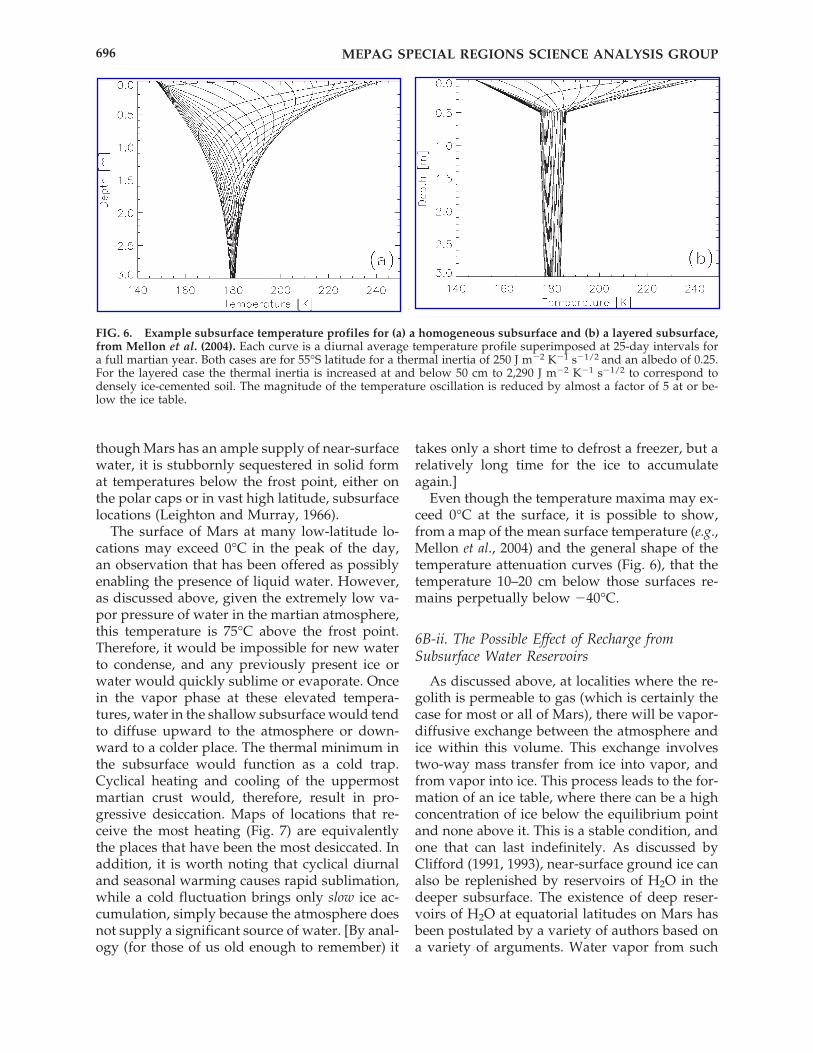
The martian surface is subject to diurnal andseasonal heating and cooling, which can causesignificant temperature variation. These temper-ature fluctuations are attenuated in the shallowsubsurface. As shown in Fig. 6, the scale of thisattenuation depends on the thermal inertia of thesurficial material. When no subsurface ice is pre-sent (e.g., Fig. 6a), subsurface heating/cooling be-yond a few degrees occurs only in the upper 2 mor so. However, when a subsurface layer of ice ispresent (Fig. 6b), it has the effect of wicking awaythe heat—the high thermal conductivity of ice re-sists the further propagation of the thermal wave,and significant heating can be restricted to muchshallower depths (0.5 m in this example). Al-
MEPAG SPECIAL REGIONS SCIENCE ANALYSIS GROUP 695
FIG. 5. Map of epithermal neutrons, which are very sensitive to subsurface hydrogen and water ice, from theGRS instrument on Mars Odyssey (Mellon and Feldman, 2006). Only summer data from both hemispheres are used(winter CO2 frost obscures the ice signature by adding hydrogen poor mass atop the soil—seasonal CO2 can be asmuch as a meter or more at high latitudes). Beyond a threshold boundary of 6 counts/s, ice detection falls off rapidlytoward the equator. This boundary is more diffuse in the northern hemisphere than in the southern hemisphere. MPF,Mars Pathfinder; V-1, Viking-1; V-2, Viking-2.
though Mars has an ample supply of near-surfacewater, it is stubbornly sequestered in solid format temperatures below the frost point, either onthe polar caps or in vast high latitude, subsurfacelocations (Leighton and Murray, 1966).
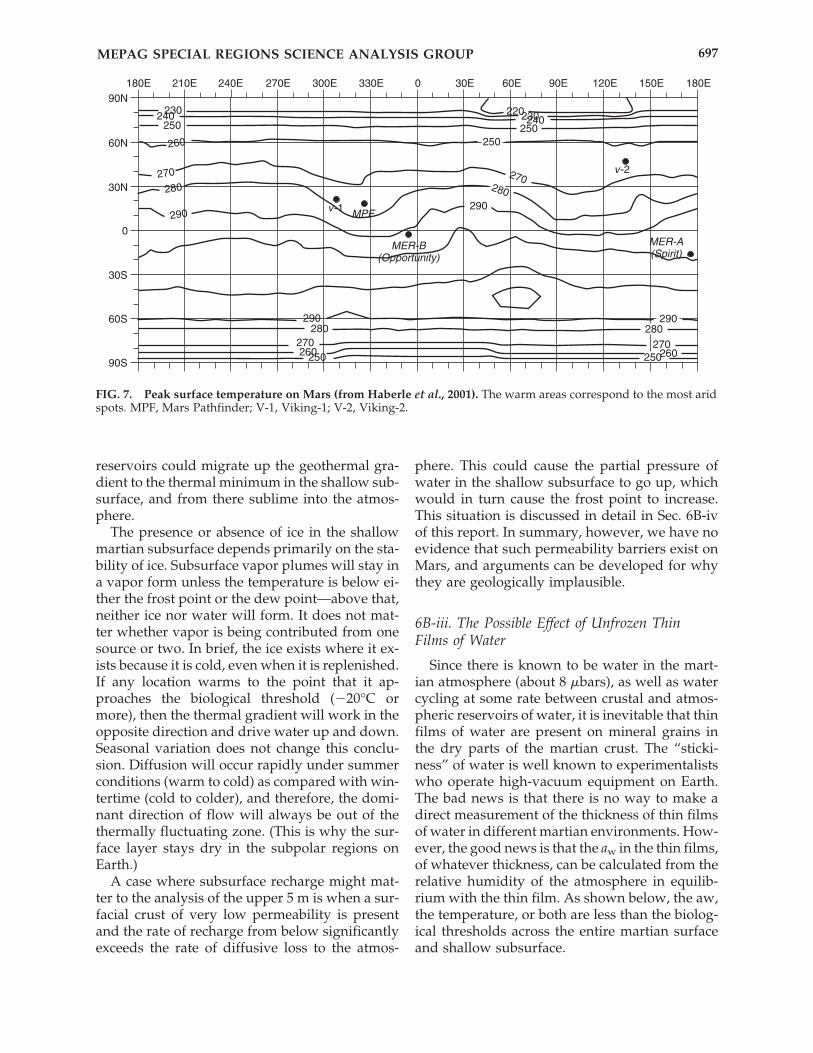
The surface of Mars at many low-latitude lo-cations may exceed 0°C in the peak of the day,an observation that has been offered as possiblyenabling the presence of liquid water. However,as discussed above, given the extremely low va-por pressure of water in the martian atmosphere,this temperature is 75°C above the frost point.Therefore, it would be impossible for new waterto condense, and any previously present ice orwater would quickly sublime or evaporate. Oncein the vapor phase at these elevated tempera-tures, water in the shallow subsurface would tendto diffuse upward to the atmosphere or down-ward to a colder place. The thermal minimum inthe subsurface would function as a cold trap.Cyclical heating and cooling of the uppermostmartian crust would, therefore, result in pro-gressive desiccation. Maps of locations that re-ceive the most heating (Fig. 7) are equivalentlythe places that have been the most desiccated. Inaddition, it is worth noting that cyclical diurnaland seasonal warming causes rapid sublimation,while a cold fluctuation brings only slow ice ac-cumulation, simply because the atmosphere doesnot supply a significant source of water. [By anal-ogy (for those of us old enough to remember) it
takes only a short time to defrost a freezer, but arelatively long time for the ice to accumulateagain.]
Even though the temperature maxima may ex-ceed 0°C at the surface, it is possible to show,from a map of the mean surface temperature (e.g.,Mellon et al., 2004) and the general shape of thetemperature attenuation curves (Fig. 6), that thetemperature 10–20 cm below those surfaces re-mains perpetually below �40°C.
6B-ii. The Possible Effect of Recharge fromSubsurface Water Reservoirs
As discussed above, at localities where the re-golith is permeable to gas (which is certainly thecase for most or all of Mars), there will be vapor-diffusive exchange between the atmosphere andice within this volume. This exchange involvestwo-way mass transfer from ice into vapor, andfrom vapor into ice. This process leads to the for-mation of an ice table, where there can be a highconcentration of ice below the equilibrium pointand none above it. This is a stable condition, andone that can last indefinitely. As discussed byClifford (1991, 1993), near-surface ground ice canalso be replenished by reservoirs of H2O in thedeeper subsurface. The existence of deep reser-voirs of H2O at equatorial latitudes on Mars hasbeen postulated by a variety of authors based ona variety of arguments. Water vapor from such
MEPAG SPECIAL REGIONS SCIENCE ANALYSIS GROUP696
FIG. 6. Example subsurface temperature profiles for (a) a homogeneous subsurface and (b) a layered subsurface,from Mellon et al. (2004). Each curve is a diurnal average temperature profile superimposed at 25-day intervals fora full martian year. Both cases are for 55°S latitude for a thermal inertia of 250 J m�2 K�1 s�1/2 and an albedo of 0.25.For the layered case the thermal inertia is increased at and below 50 cm to 2,290 J m�2 K�1 s�1/2 to correspond todensely ice-cemented soil. The magnitude of the temperature oscillation is reduced by almost a factor of 5 at or be-low the ice table.
reservoirs could migrate up the geothermal gra-dient to the thermal minimum in the shallow sub-surface, and from there sublime into the atmos-phere.
The presence or absence of ice in the shallowmartian subsurface depends primarily on the sta-bility of ice. Subsurface vapor plumes will stay ina vapor form unless the temperature is below ei-ther the frost point or the dew point—above that,neither ice nor water will form. It does not mat-ter whether vapor is being contributed from onesource or two. In brief, the ice exists where it ex-ists because it is cold, even when it is replenished.If any location warms to the point that it ap-proaches the biological threshold (�20°C ormore), then the thermal gradient will work in theopposite direction and drive water up and down.Seasonal variation does not change this conclu-sion. Diffusion will occur rapidly under summerconditions (warm to cold) as compared with win-tertime (cold to colder), and therefore, the domi-nant direction of flow will always be out of thethermally fluctuating zone. (This is why the sur-face layer stays dry in the subpolar regions onEarth.)
A case where subsurface recharge might mat-ter to the analysis of the upper 5 m is when a sur-facial crust of very low permeability is presentand the rate of recharge from below significantlyexceeds the rate of diffusive loss to the atmos-
phere. This could cause the partial pressure ofwater in the shallow subsurface to go up, whichwould in turn cause the frost point to increase.This situation is discussed in detail in Sec. 6B-ivof this report. In summary, however, we have noevidence that such permeability barriers exist onMars, and arguments can be developed for whythey are geologically implausible.
6B-iii. The Possible Effect of Unfrozen ThinFilms of Water
Since there is known to be water in the mart-ian atmosphere (about 8 �bars), as well as watercycling at some rate between crustal and atmos-pheric reservoirs of water, it is inevitable that thinfilms of water are present on mineral grains inthe dry parts of the martian crust. The “sticki-ness” of water is well known to experimentalistswho operate high-vacuum equipment on Earth.The bad news is that there is no way to make adirect measurement of the thickness of thin filmsof water in different martian environments. How-ever, the good news is that the aw in the thin films,of whatever thickness, can be calculated from therelative humidity of the atmosphere in equilib-rium with the thin film. As shown below, the aw,the temperature, or both are less than the biolog-ical thresholds across the entire martian surfaceand shallow subsurface.
MEPAG SPECIAL REGIONS SCIENCE ANALYSIS GROUP 697
290290
250240230
180E90N
60N
30N
0
30S
60S
90S
210E 240E 270E 300E 330E 0 30E 60E 90E 120E 150E 180E
290
280270
260
290
250240
220230
250
v-2
v-1
MER-A(Spirit)
MPF
MER-B(Opportunity)
280280
280
270
270270260260 250250
FIG. 7. Peak surface temperature on Mars (from Haberle et al., 2001). The warm areas correspond to the most aridspots. MPF, Mars Pathfinder; V-1, Viking-1; V-2, Viking-2.
6B-iv. The Possible Effect of Semipermeable Crusts
On Earth, soil crusts can provide a significantpermeability barrier, through which the rate offluid flow can be lower than the rates of resup-ply or fluid loss on either side of the barrier. Insuch cases, water can be trapped in a transientway, even when it is out of equilibrium with theatmosphere.
Observed crusts on Mars. Crusts are common atthe martian landing sites visited through 2005. Ob-servations to date show them to be relatively weakand friable. Viking “duricrusts” at Chryse Planitia(Viking-1) were readily broken by digging action,and those at Utopia Planitia (Viking-2) were dis-aggregated simply by shaking them in the acqui-sition scoop (Clark et al., 1982). Many crusted ma-terials have been seen at both Mars ExplorationRover (MER) landing sites, but all seem to be eas-ily broken as the wheels pass over them (Richteret al., 2004; L. Richter et al., manuscript in prepa-ration). To date, no examples of high-strengthcrusts have been discovered at any of the five land-ing sites. Although we have no data on the per-meability of any of these crusts due to their fri-ability, discontinuous nature, and porosity, theydo not appear to be particularly impermeable.
Terrestrial analogs. Since other types of crustsmight exist elsewhere on Mars, some of whichmay be less permeable, it is important to considerother kinds of crusts known from terrestrial ex-perience. Surface crusts associated with soils onEarth are classified as biological, chemical, orphysical (Soil Survey Staff, 1999):
• Biological crusts are composed of mosaics ofcyanobacteria, green algae, lichens, mosses, mi-crofungi, and other bacteria (Belnap et al., 2001).
• Chemical crusts are largely formed where watercontaining dissolved salts, commonly carbon-ate, sulfate, and chlorides, accumulates in shal-low depressions allowing evaporation and pre-cipitation at the surface. Common settings forchemical crust include dry lakebeds or sabkas.Salt crust may also form at the soil surface fromcapillary rise of salt-rich soil moisture.
• Physical crusts primarily result from the for-mation of aggregates from a reconstituted,reaggregated, or reorganized layer of mineralparticles. Common types include structural(e.g., raindrop impact), depositional (surface
flooding), freeze-thaw, and vesicular. Aggre-gates can range from �10�2 to 102 mm in di-ameter, with the larger aggregates due to theformation of soil structure.
• Another type of soil crust is the strongly ce-mented subsoil layer where the soil matrix hasbeen cemented by the extensive accumulation ofcarbonate, salt, and silica (e.g., duricrust, caliche).
Common attributes among all types of surfacecrust is that they generally enhance surface seal-ing, provide surface stability, limit wind and wa-ter erosion, increase aggregation of binding of soilparticles, and are commonly �10 cm thick.
The best terrestrial crust-forming analog for themartian surface is, perhaps, a type of physicalcrust referred to as vesicular crust, which is com-mon to desert regions on Earth. This is associatedwith reg soils or desert pavements, features ubiq-uitous to nearly all arid deserts (McFadden et al.,1998). Vesicular crusts typically underlie a singlesurface layer of cobbles or gravel. Desert crustsare primarily derived from the long-term accu-mulation of aeolian dust (particle diameters �0.1mm) and require 103–105 years to form (McDon-ald et al., 1995). The density of this type of crustranges from about 1.5 to 1.9 g/cm3, and they arecommonly 3–10 cm thick (McDonald, 1994).
Permeability of desert crust. The measured satu-rated hydraulic conductivity of desert crust typ-ically ranges from 0.75 to 0.5 cm/h. Actual con-ductivity is typically lower than that measured atsaturated conditions because of trapped airwithin the crust (McDonald et al., 1996; McDon-ald, 2002; Young et al., 2004; Meadows et al., 2005).Terrestrial desert crusts are not completely im-permeable because a wide range of processes, pri-marily dispersive stress and tensional release, re-sult in the formation of voids, pores, and fracturesthat prevent the continuous sealing of the soil ma-trix. Even the most cemented layers (e.g., caliche,duricrust) always have fractures that limit thehorizontal and vertical extent of cementation andsealing. Although the formation of crust fracturesis exacerbated by biological processes (e.g., rootpropagation), dispersive or tension stress is firstrequired to promote development of fractures.On the surface of Mars, processes such as freeze-thaw, formation of ice, and ground shaking dueto seismic activity and meteorite impact are likelyto enhance formation and propagation of frac-tures in crusted materials.
MEPAG SPECIAL REGIONS SCIENCE ANALYSIS GROUP698
Episodic retention of moisture beneath desertcrust on Earth has been observed to happen whenthe rate of water recharge (on Earth, primarily viarain) exceeds the rate of water loss (i.e., vapor lossthrough the crust). For example, measurementsin soil beneath physical crusts in hyperariddeserts show that the crust enhances moisture re-tention and leads to a lower soil temperature(�3–6°C) relative to soils that lack physical crusts,typically for a period of several months (E.V. Mc-Donald, personal communication, 2006). How-ever, such anomalies are dynamic and typicallydecay on a time scale of a year.
For such cases, the mean rate of diffusive gainwill, in time, equal the mean rate of diffusive loss,and equilibrium will be attained (although bothrates will be lower than when crust is absent). Al-though other crust-related processes may be dis-covered in the future, SR-SAG concludes that, towithin its standard of confidence, this is not anenvironment that will lead to the presence of liq-uid water.
6C. Calculation of Water Activity onModern Mars
Persistent liquid water at or near the martian sur-face thus requires a significant departure from thegeneral planetary setting in the form of either long-term disequilibria (caused either by geothermalsources of heat and water or by vestigial sourcesfrom prior climates that have survived for 104–107
years by virtue of giving up their water very slowly)or short-term disequilibria (from the influence of aspacecraft on a cold, icy site or a transient eventsuch as a meteorite impact). If any surface or shal-low subsurface location on Mars were to warm tothe biological threshold (�20°C or more), then theheating would drive water up (to the atmosphere)and down (to a colder place). Seasonal variationdoes not change this conclusion. Diffusion will oc-cur rapidly under summer conditions (warm tocold) as compared with wintertime (cold to colder),and, therefore, the dominant direction of flow willalways be out of the thermally fluctuating zone.
This is the reason why, on Earth, we observe thatthe surface layer stays dry in the subpolar regions.
On Earth, life can exist and propagate in soilswe might casually consider “dry,” often surviv-ing on thin films of water in capillaries or at grainboundaries. The aw was introduced in the previ-ous section as a quantitative measure of dryness,and an aw threshold was established below whichterrestrial life is not known to be able to repro-duce. The aw, a measure of availability of water,is defined as the relative humidity in the pores ofthe soil (although expressed as a decimal fractionrather than a percentage). At a microscopic level,it is typically surface tension associated with theconcave geometry of water or ice droplets thatholds vapor pressure below nominal saturation,which results in aw values less than unity. Alter-natively, salt content can lower the saturation va-por pressure as well as the melting point. The awis thus a proxy for the specific physics andbioavailability of thin films of water needed formicrobe propagation, and obviates the need toconsider specific soil properties or the presenceof brines. Moreover, if soil is in equilibrium withthe surrounding atmosphere, then aw can be de-termined directly from the atmospheric relativehumidity. In a single, easily determined parame-ter, we can capture the detailed microscopic in-teractions of microbes, water, and soil.
Figure 8 shows the equilibrium aw of martiansoil as a function of temperature, derived by as-suming the absolute humidity to be 0.8 �bar, inequilibrium with the atmosphere. In warm soil,aw is literally orders of magnitude too small tosupport life—there simply is not enough water todampen the soil sufficiently. The aw approachesunity at the frost point, but at a temperature fartoo low to support life. The box in the upper cor-ner of Fig. 8 delineates the conditions underwhich terrestrial life could propagate, far fromthe water equilibrium.
MEPAG SPECIAL REGIONS SCIENCE ANALYSIS GROUP 699
FINDING. Although soil crusts on Mars havebeen observed at the past landing sites, andother crust types are hypothetically possibleelsewhere, experience with desert crusts onEarth shows that the effect of a semiperme-able crust is to retard, not prevent, theachievement of equilibrium.
FINDING. Where the surface and shallowsubsurface of Mars are at or close to thermo-dynamic equilibrium with the atmosphere(using time-averaged, rather than instanta-neous, equilibrium), temperature and aw inthe martian shallow subsurface are consider-ably below the threshold conditions for prop-agation of terrestrial life. The effects of thinfilms and solute freezing point depressionare included within the aw.
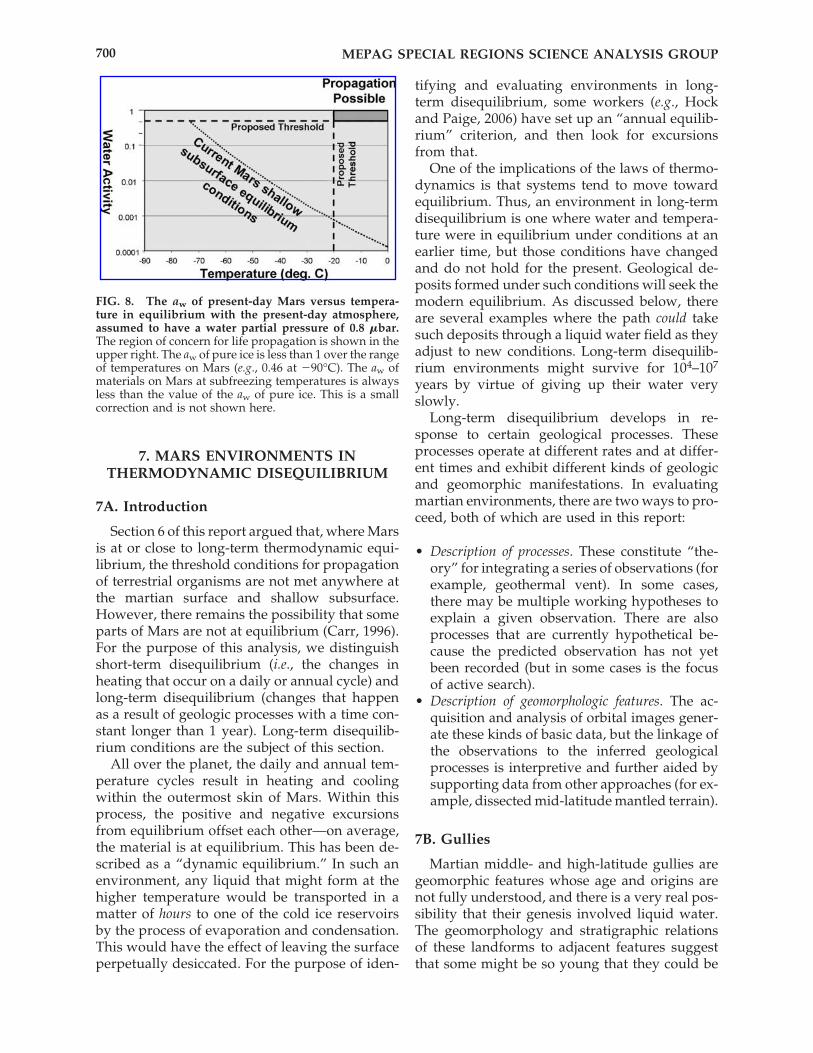
7. MARS ENVIRONMENTS INTHERMODYNAMIC DISEQUILIBRIUM
7A. Introduction
Section 6 of this report argued that, where Marsis at or close to long-term thermodynamic equi-librium, the threshold conditions for propagationof terrestrial organisms are not met anywhere atthe martian surface and shallow subsurface.However, there remains the possibility that someparts of Mars are not at equilibrium (Carr, 1996).For the purpose of this analysis, we distinguishshort-term disequilibrium (i.e., the changes inheating that occur on a daily or annual cycle) andlong-term disequilibrium (changes that happenas a result of geologic processes with a time con-stant longer than 1 year). Long-term disequilib-rium conditions are the subject of this section.
All over the planet, the daily and annual tem-perature cycles result in heating and coolingwithin the outermost skin of Mars. Within thisprocess, the positive and negative excursionsfrom equilibrium offset each other—on average,the material is at equilibrium. This has been de-scribed as a “dynamic equilibrium.” In such anenvironment, any liquid that might form at thehigher temperature would be transported in amatter of hours to one of the cold ice reservoirsby the process of evaporation and condensation.This would have the effect of leaving the surfaceperpetually desiccated. For the purpose of iden-
tifying and evaluating environments in long-term disequilibrium, some workers (e.g., Hockand Paige, 2006) have set up an “annual equilib-rium” criterion, and then look for excursionsfrom that.
One of the implications of the laws of thermo-dynamics is that systems tend to move towardequilibrium. Thus, an environment in long-termdisequilibrium is one where water and tempera-ture were in equilibrium under conditions at anearlier time, but those conditions have changedand do not hold for the present. Geological de-posits formed under such conditions will seek themodern equilibrium. As discussed below, thereare several examples where the path could takesuch deposits through a liquid water field as theyadjust to new conditions. Long-term disequilib-rium environments might survive for 104–107
years by virtue of giving up their water veryslowly.
Long-term disequilibrium develops in re-sponse to certain geological processes. Theseprocesses operate at different rates and at differ-ent times and exhibit different kinds of geologicand geomorphic manifestations. In evaluatingmartian environments, there are two ways to pro-ceed, both of which are used in this report:
• Description of processes. These constitute “the-ory” for integrating a series of observations (forexample, geothermal vent). In some cases,there may be multiple working hypotheses toexplain a given observation. There are alsoprocesses that are currently hypothetical be-cause the predicted observation has not yetbeen recorded (but in some cases is the focusof active search).
• Description of geomorphologic features. The ac-quisition and analysis of orbital images gener-ate these kinds of basic data, but the linkage ofthe observations to the inferred geologicalprocesses is interpretive and further aided bysupporting data from other approaches (for ex-ample, dissected mid-latitude mantled terrain).
7B. Gullies
Martian middle- and high-latitude gullies aregeomorphic features whose age and origins arenot fully understood, and there is a very real pos-sibility that their genesis involved liquid water.The geomorphology and stratigraphic relationsof these landforms to adjacent features suggestthat some might be so young that they could be
MEPAG SPECIAL REGIONS SCIENCE ANALYSIS GROUP700
FIG. 8. The aw of present-day Mars versus tempera-ture in equilibrium with the present-day atmosphere,assumed to have a water partial pressure of 0.8 �bar.The region of concern for life propagation is shown in theupper right. The aw of pure ice is less than 1 over the rangeof temperatures on Mars (e.g., 0.46 at �90°C). The aw ofmaterials on Mars at subfreezing temperatures is alwaysless than the value of the aw of pure ice. This is a smallcorrection and is not shown here.
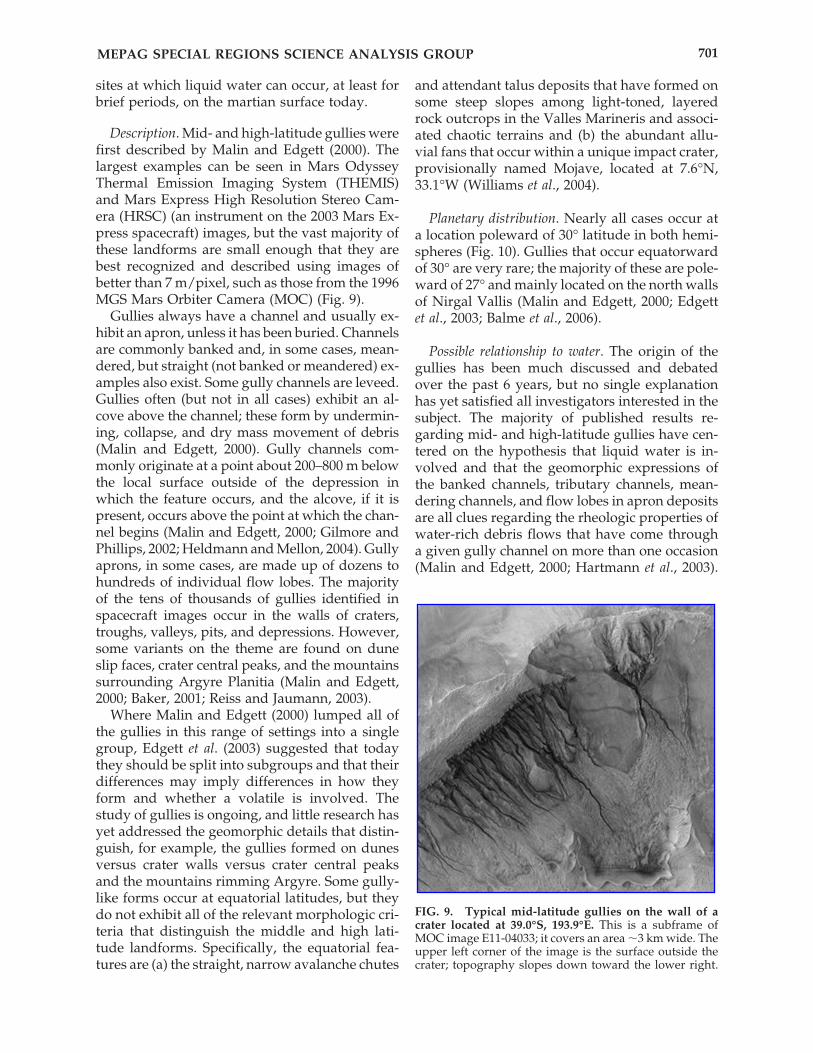
sites at which liquid water can occur, at least forbrief periods, on the martian surface today.
Description. Mid- and high-latitude gullies werefirst described by Malin and Edgett (2000). Thelargest examples can be seen in Mars OdysseyThermal Emission Imaging System (THEMIS)and Mars Express High Resolution Stereo Cam-era (HRSC) (an instrument on the 2003 Mars Ex-press spacecraft) images, but the vast majority ofthese landforms are small enough that they arebest recognized and described using images ofbetter than 7 m/pixel, such as those from the 1996MGS Mars Orbiter Camera (MOC) (Fig. 9).
Gullies always have a channel and usually ex-hibit an apron, unless it has been buried. Channelsare commonly banked and, in some cases, mean-dered, but straight (not banked or meandered) ex-amples also exist. Some gully channels are leveed.Gullies often (but not in all cases) exhibit an al-cove above the channel; these form by undermin-ing, collapse, and dry mass movement of debris(Malin and Edgett, 2000). Gully channels com-monly originate at a point about 200–800 m belowthe local surface outside of the depression inwhich the feature occurs, and the alcove, if it ispresent, occurs above the point at which the chan-nel begins (Malin and Edgett, 2000; Gilmore andPhillips, 2002; Heldmann and Mellon, 2004). Gullyaprons, in some cases, are made up of dozens tohundreds of individual flow lobes. The majorityof the tens of thousands of gullies identified inspacecraft images occur in the walls of craters,troughs, valleys, pits, and depressions. However,some variants on the theme are found on duneslip faces, crater central peaks, and the mountainssurrounding Argyre Planitia (Malin and Edgett,2000; Baker, 2001; Reiss and Jaumann, 2003).
Where Malin and Edgett (2000) lumped all ofthe gullies in this range of settings into a singlegroup, Edgett et al. (2003) suggested that todaythey should be split into subgroups and that theirdifferences may imply differences in how theyform and whether a volatile is involved. Thestudy of gullies is ongoing, and little research hasyet addressed the geomorphic details that distin-guish, for example, the gullies formed on dunesversus crater walls versus crater central peaksand the mountains rimming Argyre. Some gully-like forms occur at equatorial latitudes, but theydo not exhibit all of the relevant morphologic cri-teria that distinguish the middle and high lati-tude landforms. Specifically, the equatorial fea-tures are (a) the straight, narrow avalanche chutes
and attendant talus deposits that have formed onsome steep slopes among light-toned, layeredrock outcrops in the Valles Marineris and associ-ated chaotic terrains and (b) the abundant allu-vial fans that occur within a unique impact crater,provisionally named Mojave, located at 7.6°N,33.1°W (Williams et al., 2004).
Planetary distribution. Nearly all cases occur ata location poleward of 30° latitude in both hemi-spheres (Fig. 10). Gullies that occur equatorwardof 30° are very rare; the majority of these are pole-ward of 27° and mainly located on the north wallsof Nirgal Vallis (Malin and Edgett, 2000; Edgettet al., 2003; Balme et al., 2006).
Possible relationship to water. The origin of thegullies has been much discussed and debatedover the past 6 years, but no single explanationhas yet satisfied all investigators interested in thesubject. The majority of published results re-garding mid- and high-latitude gullies have cen-tered on the hypothesis that liquid water is in-volved and that the geomorphic expressions ofthe banked channels, tributary channels, mean-dering channels, and flow lobes in apron depositsare all clues regarding the rheologic properties ofwater-rich debris flows that have come througha given gully channel on more than one occasion(Malin and Edgett, 2000; Hartmann et al., 2003).
MEPAG SPECIAL REGIONS SCIENCE ANALYSIS GROUP 701
FIG. 9. Typical mid-latitude gullies on the wall of acrater located at 39.0°S, 193.9°E. This is a subframe ofMOC image E11-04033; it covers an area �3 km wide. Theupper left corner of the image is the surface outside thecrater; topography slopes down toward the lower right.
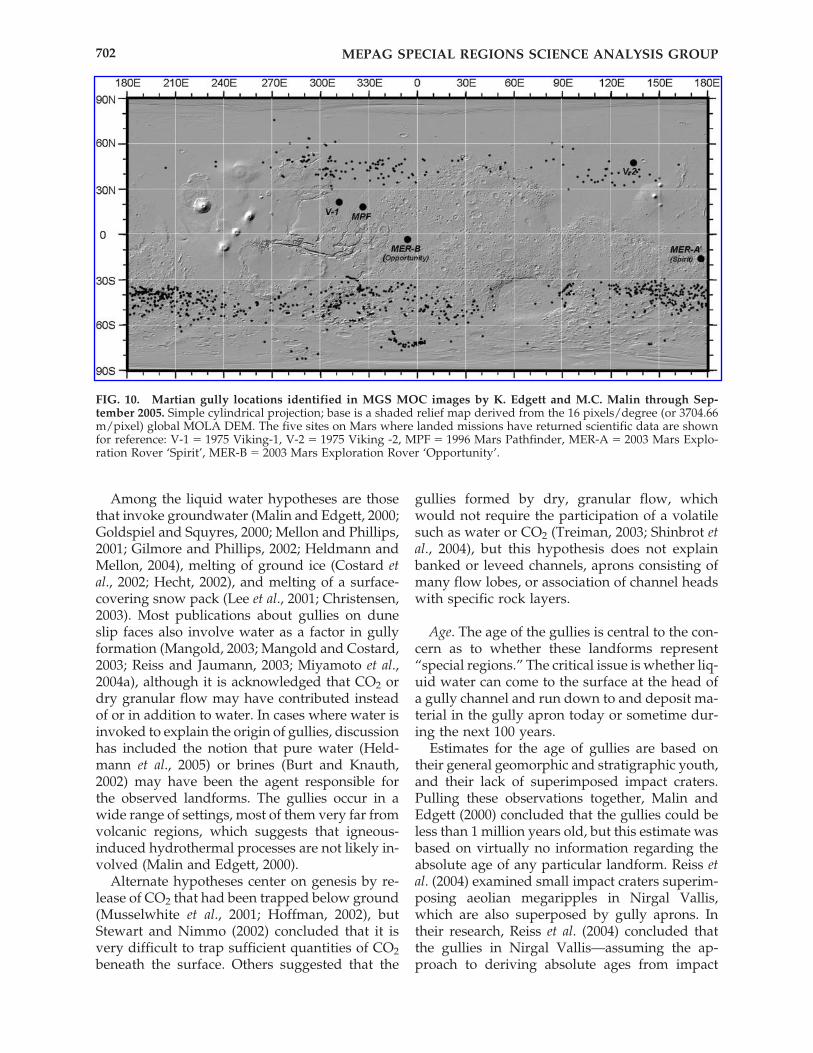
Among the liquid water hypotheses are thosethat invoke groundwater (Malin and Edgett, 2000;Goldspiel and Squyres, 2000; Mellon and Phillips,2001; Gilmore and Phillips, 2002; Heldmann andMellon, 2004), melting of ground ice (Costard etal., 2002; Hecht, 2002), and melting of a surface-covering snow pack (Lee et al., 2001; Christensen,2003). Most publications about gullies on duneslip faces also involve water as a factor in gullyformation (Mangold, 2003; Mangold and Costard,2003; Reiss and Jaumann, 2003; Miyamoto et al.,2004a), although it is acknowledged that CO2 ordry granular flow may have contributed insteadof or in addition to water. In cases where water isinvoked to explain the origin of gullies, discussionhas included the notion that pure water (Held-mann et al., 2005) or brines (Burt and Knauth,2002) may have been the agent responsible for the observed landforms. The gullies occur in awide range of settings, most of them very far fromvolcanic regions, which suggests that igneous-induced hydrothermal processes are not likely in-volved (Malin and Edgett, 2000).
Alternate hypotheses center on genesis by re-lease of CO2 that had been trapped below ground(Musselwhite et al., 2001; Hoffman, 2002), butStewart and Nimmo (2002) concluded that it isvery difficult to trap sufficient quantities of CO2beneath the surface. Others suggested that the
gullies formed by dry, granular flow, whichwould not require the participation of a volatilesuch as water or CO2 (Treiman, 2003; Shinbrot etal., 2004), but this hypothesis does not explainbanked or leveed channels, aprons consisting ofmany flow lobes, or association of channel headswith specific rock layers.
Age. The age of the gullies is central to the con-cern as to whether these landforms represent“special regions.” The critical issue is whether liq-uid water can come to the surface at the head ofa gully channel and run down to and deposit ma-terial in the gully apron today or sometime dur-ing the next 100 years.
Estimates for the age of gullies are based ontheir general geomorphic and stratigraphic youth,and their lack of superimposed impact craters.Pulling these observations together, Malin andEdgett (2000) concluded that the gullies could beless than 1 million years old, but this estimate wasbased on virtually no information regarding theabsolute age of any particular landform. Reiss etal. (2004) examined small impact craters superim-posing aeolian megaripples in Nirgal Vallis,which are also superposed by gully aprons. Intheir research, Reiss et al. (2004) concluded thatthe gullies in Nirgal Vallis—assuming the ap-proach to deriving absolute ages from impact
MEPAG SPECIAL REGIONS SCIENCE ANALYSIS GROUP702
FIG. 10. Martian gully locations identified in MGS MOC images by K. Edgett and M.C. Malin through Sep-tember 2005. Simple cylindrical projection; base is a shaded relief map derived from the 16 pixels/degree (or 3704.66m/pixel) global MOLA DEM. The five sites on Mars where landed missions have returned scientific data are shownfor reference: V-1 � 1975 Viking-1, V-2 � 1975 Viking -2, MPF � 1996 Mars Pathfinder, MER-A � 2003 Mars Explo-ration Rover ‘Spirit’, MER-B � 2003 Mars Exploration Rover ‘Opportunity’.
crater size-frequency distributions provides quan-tities that approach the true age of features onMars—must be younger than 3 million years andmight even be younger than 300,000 years in age.Other investigators have focused on the role ofobliquity excursions and whether gullies mightonly be active under different temperature andpressure conditions than exist today (e.g., Costardet al., 2002; Christensen, 2003; Bermann et al.,2005). However, the work of Heldmann et al.(2005) argued that modern pressure and temper-ature conditions are a better fit when the mea-sured run-out distances of gully channel/aproncomplexes are considered, which suggests that thegullies are episodically active today.
The small sampling of gullies available in MGSMOC images at the time Malin and Edgett (2000)published their results suggested that all gulliesare quite young relative to the martian geologictime scale. Among that small sample, gully chan-nels and aprons were seen to cut or superposelandforms that are otherwise considered to be rel-atively young, such as aeolian dunes, aeolianmegaripples, and patterned ground similar tothat found in terrestrial periglacial settings. Fur-thermore, some gullies have dark floors, whichindicates that dust does not settle and persist onthese surfaces for periods longer than a martianseason. The absence of dust on dark channelfloors might be attributed to aeolian redistribu-tion on a sandy surface or to recent movement of material through the gully channel by non-aeolian processes (e.g., runoff of a liquid).
MGS MOC has continued to collect new im-ages of gullies, almost daily, since 2000, so thesample is much larger today. In the larger sam-ple very good examples of gully aprons and chan-nels that have been cut by fissures and faults, pep-pered with small impact craters, or superimposedby windblown sand have now been recognized(Edgett et al., 2003). However, these “old” gullyexamples are in the minority, and in most caseswhere craters superpose the gully surfaces, mul-tiple craters occur, which suggests that they aresecondary to a larger impact that happened else-where. In other words, the number of craters onthe landforms associated with a gully is not nec-essarily a good indicator of age.
The MOC team has recently (http://www.msss.com/mars_images/moc/2005/09/20/dunegullies/) described a case in which repeated imag-ing by MOC revealed the formation of a new gullyon a sand dune slip face (Hellespontus region,west of the Hellas basin). The gullies formed
sometime between 17 July 2002 and 27 April 2005(Malin and Edgett, 2005). The setting of this gully(a sand dune field on the floor of a crater) is dis-tinctly different from that of the mid-latitude gul-lies that form on crater walls, and strongly sug-gests that there is more than one gully-formingprocess. Further observation of Mars is clearlyneeded. The fact that the Hellespontus gully-forming event occurred during the current decadeshows that it is possible that some material canflow through at least some gully systems in themodern era, but it also raises a flag that asks: is itpossible for new gullies to form at a locationwhere no gully was observed before?
There are no obvious geomorphic criteria thatcan be used to predict which gullies might be-come active in this century. MGS MOC is cur-rently being used to monitor the hundreds ofgully sites (tens of thousands of individual gul-lies) to look for additional evidence of change, in-cluding features that might indicate whether wa-ter is present and/or has flowed down therelevant slopes in recent years. Features beingsought include new gullies, or channels within apreexisting gully complex, and gullies in whichbright material—perhaps ice or salts—has ap-peared. Other than the fact that gullies are re-stricted to certain kinds of slopes, we do not havea means of predicting where a gully may form ina location where one did not previously exist.Thus, for the purpose of PP, concern should ex-tend to gully-forming regions, not just to the spe-cific preexisting features. The scale of these re-gions, however, is as yet undefined.
7C. Mid-Latitude Geomorphic Features ThatMay Indicate Deposits of Snow/Ice
The middle martian latitudes exhibit a varietyof surficial geomorphic features that suggest tosome investigators that ice-bearing materials
MEPAG SPECIAL REGIONS SCIENCE ANALYSIS GROUP 703
FINDING. Some—although, certainly, notall—gullies and gully-forming regions mightbe sites at which liquid water comes to thesurface within the next 100 years. At present,there are no known criteria by which a pre-diction can be made as to which—if any—ofthe tens of thousands of gullies on Marscould become active during this century, orwhether a new gully might form where thereisn’t one today.
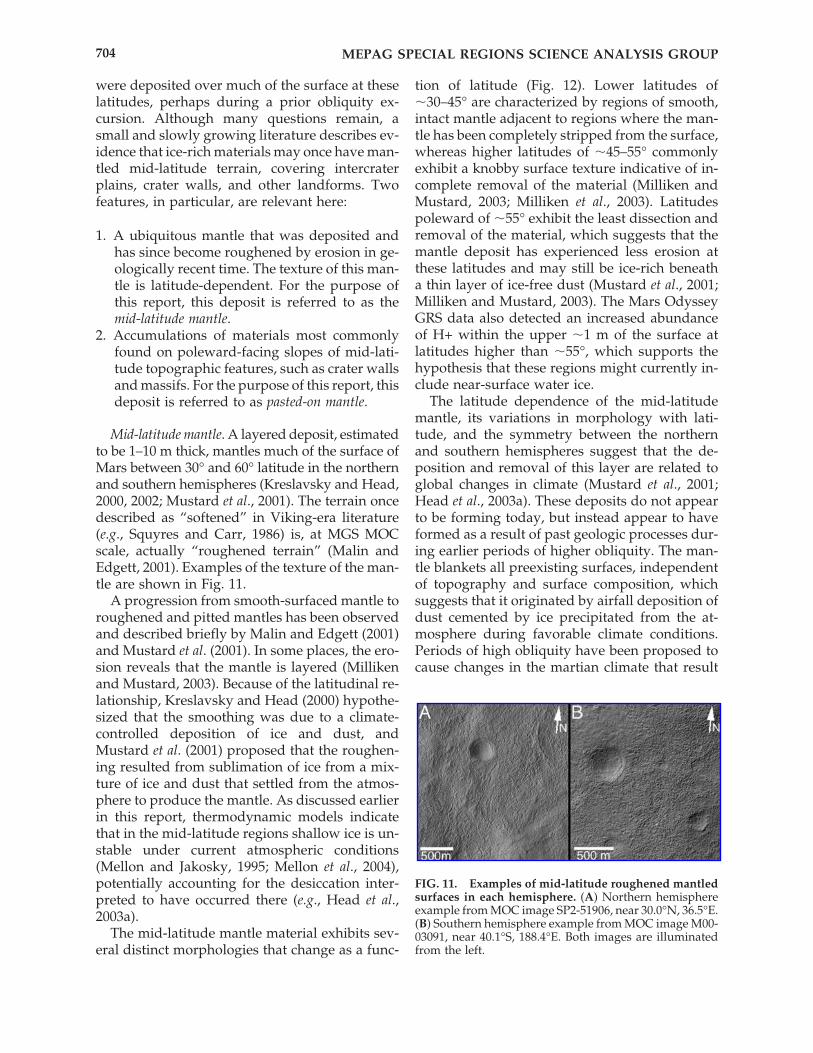
were deposited over much of the surface at theselatitudes, perhaps during a prior obliquity ex-cursion. Although many questions remain, asmall and slowly growing literature describes ev-idence that ice-rich materials may once have man-tled mid-latitude terrain, covering intercraterplains, crater walls, and other landforms. Twofeatures, in particular, are relevant here:
1. A ubiquitous mantle that was deposited andhas since become roughened by erosion in ge-ologically recent time. The texture of this man-tle is latitude-dependent. For the purpose ofthis report, this deposit is referred to as themid-latitude mantle.
2. Accumulations of materials most commonlyfound on poleward-facing slopes of mid-lati-tude topographic features, such as crater wallsand massifs. For the purpose of this report, thisdeposit is referred to as pasted-on mantle.
Mid-latitude mantle. A layered deposit, estimatedto be 1–10 m thick, mantles much of the surface ofMars between 30° and 60° latitude in the northernand southern hemispheres (Kreslavsky and Head,2000, 2002; Mustard et al., 2001). The terrain oncedescribed as “softened” in Viking-era literature(e.g., Squyres and Carr, 1986) is, at MGS MOCscale, actually “roughened terrain” (Malin andEdgett, 2001). Examples of the texture of the man-tle are shown in Fig. 11.
A progression from smooth-surfaced mantle toroughened and pitted mantles has been observedand described briefly by Malin and Edgett (2001)and Mustard et al. (2001). In some places, the ero-sion reveals that the mantle is layered (Millikenand Mustard, 2003). Because of the latitudinal re-lationship, Kreslavsky and Head (2000) hypothe-sized that the smoothing was due to a climate-controlled deposition of ice and dust, andMustard et al. (2001) proposed that the roughen-ing resulted from sublimation of ice from a mix-ture of ice and dust that settled from the atmos-phere to produce the mantle. As discussed earlierin this report, thermodynamic models indicatethat in the mid-latitude regions shallow ice is un-stable under current atmospheric conditions(Mellon and Jakosky, 1995; Mellon et al., 2004),potentially accounting for the desiccation inter-preted to have occurred there (e.g., Head et al.,2003a).
The mid-latitude mantle material exhibits sev-eral distinct morphologies that change as a func-
tion of latitude (Fig. 12). Lower latitudes of�30–45° are characterized by regions of smooth,intact mantle adjacent to regions where the man-tle has been completely stripped from the surface,whereas higher latitudes of �45–55° commonlyexhibit a knobby surface texture indicative of in-complete removal of the material (Milliken andMustard, 2003; Milliken et al., 2003). Latitudespoleward of �55° exhibit the least dissection andremoval of the material, which suggests that themantle deposit has experienced less erosion atthese latitudes and may still be ice-rich beneatha thin layer of ice-free dust (Mustard et al., 2001;Milliken and Mustard, 2003). The Mars OdysseyGRS data also detected an increased abundanceof H+ within the upper �1 m of the surface atlatitudes higher than �55°, which supports thehypothesis that these regions might currently in-clude near-surface water ice.
The latitude dependence of the mid-latitudemantle, its variations in morphology with lati-tude, and the symmetry between the northernand southern hemispheres suggest that the de-position and removal of this layer are related toglobal changes in climate (Mustard et al., 2001;Head et al., 2003a). These deposits do not appearto be forming today, but instead appear to haveformed as a result of past geologic processes dur-ing earlier periods of higher obliquity. The man-tle blankets all preexisting surfaces, independentof topography and surface composition, whichsuggests that it originated by airfall deposition ofdust cemented by ice precipitated from the at-mosphere during favorable climate conditions.Periods of high obliquity have been proposed tocause changes in the martian climate that result
MEPAG SPECIAL REGIONS SCIENCE ANALYSIS GROUP704
FIG. 11. Examples of mid-latitude roughened mantledsurfaces in each hemisphere. (A) Northern hemisphereexample from MOC image SP2-51906, near 30.0°N, 36.5°E.(B) Southern hemisphere example from MOC image M00-03091, near 40.1°S, 188.4°E. Both images are illuminatedfrom the left.
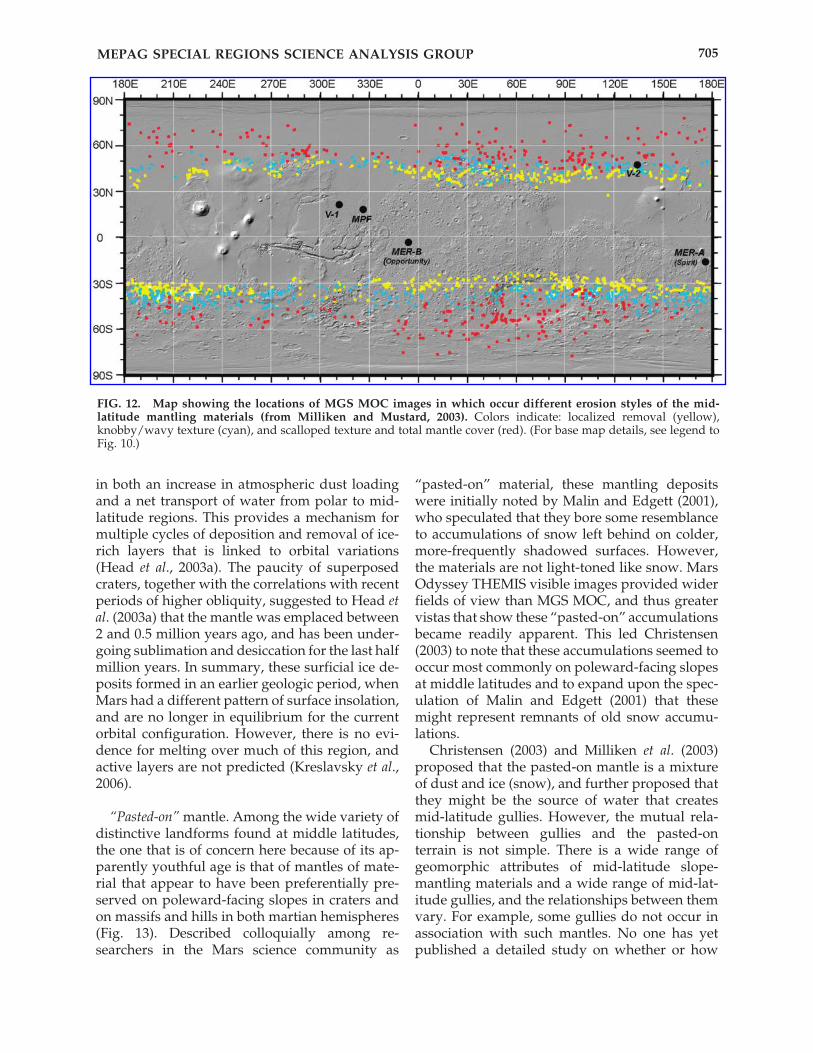
in both an increase in atmospheric dust loadingand a net transport of water from polar to mid-latitude regions. This provides a mechanism formultiple cycles of deposition and removal of ice-rich layers that is linked to orbital variations(Head et al., 2003a). The paucity of superposedcraters, together with the correlations with recentperiods of higher obliquity, suggested to Head etal. (2003a) that the mantle was emplaced between2 and 0.5 million years ago, and has been under-going sublimation and desiccation for the last halfmillion years. In summary, these surficial ice de-posits formed in an earlier geologic period, whenMars had a different pattern of surface insolation,and are no longer in equilibrium for the currentorbital configuration. However, there is no evi-dence for melting over much of this region, andactive layers are not predicted (Kreslavsky et al.,2006).
“Pasted-on” mantle. Among the wide variety ofdistinctive landforms found at middle latitudes,the one that is of concern here because of its ap-parently youthful age is that of mantles of mate-rial that appear to have been preferentially pre-served on poleward-facing slopes in craters andon massifs and hills in both martian hemispheres(Fig. 13). Described colloquially among re-searchers in the Mars science community as
“pasted-on” material, these mantling depositswere initially noted by Malin and Edgett (2001),who speculated that they bore some resemblanceto accumulations of snow left behind on colder,more-frequently shadowed surfaces. However,the materials are not light-toned like snow. MarsOdyssey THEMIS visible images provided widerfields of view than MGS MOC, and thus greatervistas that show these “pasted-on” accumulationsbecame readily apparent. This led Christensen(2003) to note that these accumulations seemed tooccur most commonly on poleward-facing slopesat middle latitudes and to expand upon the spec-ulation of Malin and Edgett (2001) that thesemight represent remnants of old snow accumu-lations.
Christensen (2003) and Milliken et al. (2003)proposed that the pasted-on mantle is a mixtureof dust and ice (snow), and further proposed thatthey might be the source of water that createsmid-latitude gullies. However, the mutual rela-tionship between gullies and the pasted-on terrain is not simple. There is a wide range of geomorphic attributes of mid-latitude slope-mantling materials and a wide range of mid-lat-itude gullies, and the relationships between themvary. For example, some gullies do not occur inassociation with such mantles. No one has yetpublished a detailed study on whether or how
MEPAG SPECIAL REGIONS SCIENCE ANALYSIS GROUP 705
FIG. 12. Map showing the locations of MGS MOC images in which occur different erosion styles of the mid-latitude mantling materials (from Milliken and Mustard, 2003). Colors indicate: localized removal (yellow),knobby/wavy texture (cyan), and scalloped texture and total mantle cover (red). (For base map details, see legend toFig. 10.)
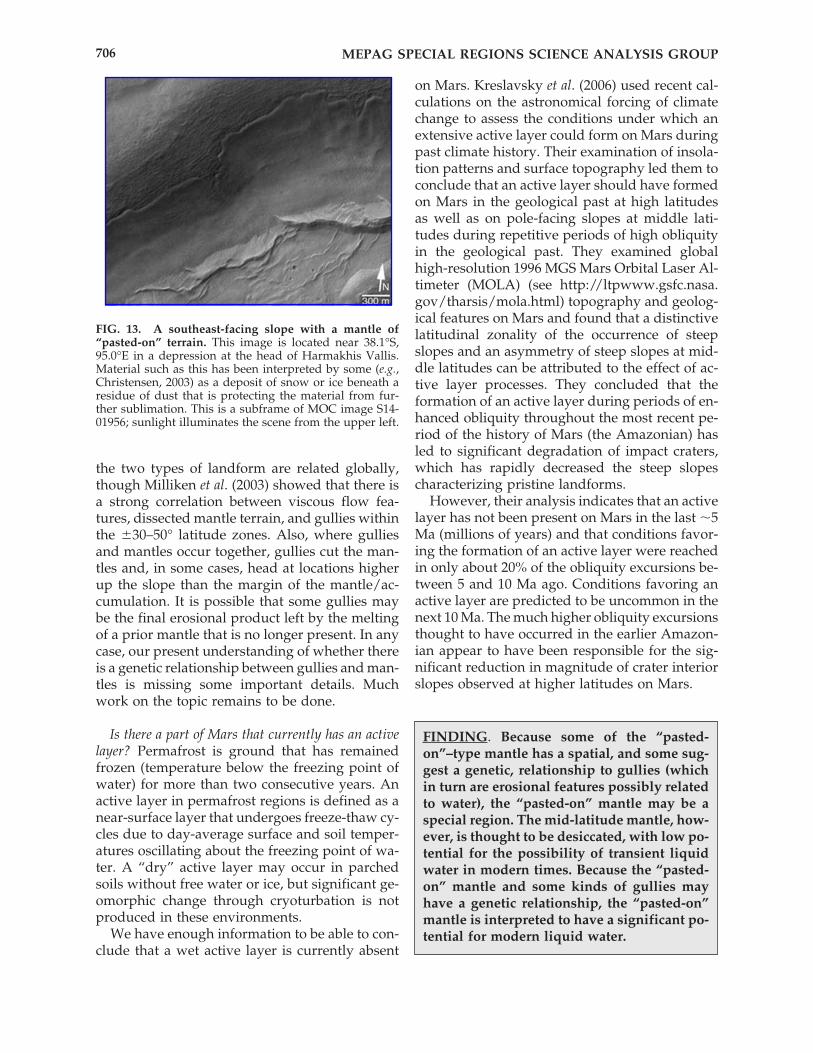
the two types of landform are related globally,though Milliken et al. (2003) showed that there isa strong correlation between viscous flow fea-tures, dissected mantle terrain, and gullies withinthe �30–50° latitude zones. Also, where gulliesand mantles occur together, gullies cut the man-tles and, in some cases, head at locations higherup the slope than the margin of the mantle/ac-cumulation. It is possible that some gullies maybe the final erosional product left by the meltingof a prior mantle that is no longer present. In anycase, our present understanding of whether thereis a genetic relationship between gullies and man-tles is missing some important details. Muchwork on the topic remains to be done.
Is there a part of Mars that currently has an activelayer? Permafrost is ground that has remainedfrozen (temperature below the freezing point ofwater) for more than two consecutive years. Anactive layer in permafrost regions is defined as anear-surface layer that undergoes freeze-thaw cy-cles due to day-average surface and soil temper-atures oscillating about the freezing point of wa-ter. A “dry” active layer may occur in parchedsoils without free water or ice, but significant ge-omorphic change through cryoturbation is notproduced in these environments.
We have enough information to be able to con-clude that a wet active layer is currently absent
on Mars. Kreslavsky et al. (2006) used recent cal-culations on the astronomical forcing of climatechange to assess the conditions under which anextensive active layer could form on Mars duringpast climate history. Their examination of insola-tion patterns and surface topography led them toconclude that an active layer should have formedon Mars in the geological past at high latitudesas well as on pole-facing slopes at middle lati-tudes during repetitive periods of high obliquityin the geological past. They examined globalhigh-resolution 1996 MGS Mars Orbital Laser Al-timeter (MOLA) (see http://ltpwww.gsfc.nasa.gov/tharsis/mola.html) topography and geolog-ical features on Mars and found that a distinctivelatitudinal zonality of the occurrence of steepslopes and an asymmetry of steep slopes at mid-dle latitudes can be attributed to the effect of ac-tive layer processes. They concluded that theformation of an active layer during periods of en-hanced obliquity throughout the most recent pe-riod of the history of Mars (the Amazonian) hasled to significant degradation of impact craters,which has rapidly decreased the steep slopescharacterizing pristine landforms.
However, their analysis indicates that an activelayer has not been present on Mars in the last �5Ma (millions of years) and that conditions favor-ing the formation of an active layer were reachedin only about 20% of the obliquity excursions be-tween 5 and 10 Ma ago. Conditions favoring anactive layer are predicted to be uncommon in thenext 10 Ma. The much higher obliquity excursionsthought to have occurred in the earlier Amazon-ian appear to have been responsible for the sig-nificant reduction in magnitude of crater interiorslopes observed at higher latitudes on Mars.
MEPAG SPECIAL REGIONS SCIENCE ANALYSIS GROUP706
FIG. 13. A southeast-facing slope with a mantle of“pasted-on” terrain. This image is located near 38.1°S,95.0°E in a depression at the head of Harmakhis Vallis.Material such as this has been interpreted by some (e.g.,Christensen, 2003) as a deposit of snow or ice beneath aresidue of dust that is protecting the material from fur-ther sublimation. This is a subframe of MOC image S14-01956; sunlight illuminates the scene from the upper left.
FINDING. Because some of the “pasted-on”–type mantle has a spatial, and some sug-gest a genetic, relationship to gullies (whichin turn are erosional features possibly relatedto water), the “pasted-on” mantle may be aspecial region. The mid-latitude mantle, how-ever, is thought to be desiccated, with low po-tential for the possibility of transient liquidwater in modern times. Because the “pasted-on” mantle and some kinds of gullies mayhave a genetic relationship, the “pasted-on”mantle is interpreted to have a significant po-tential for modern liquid water.
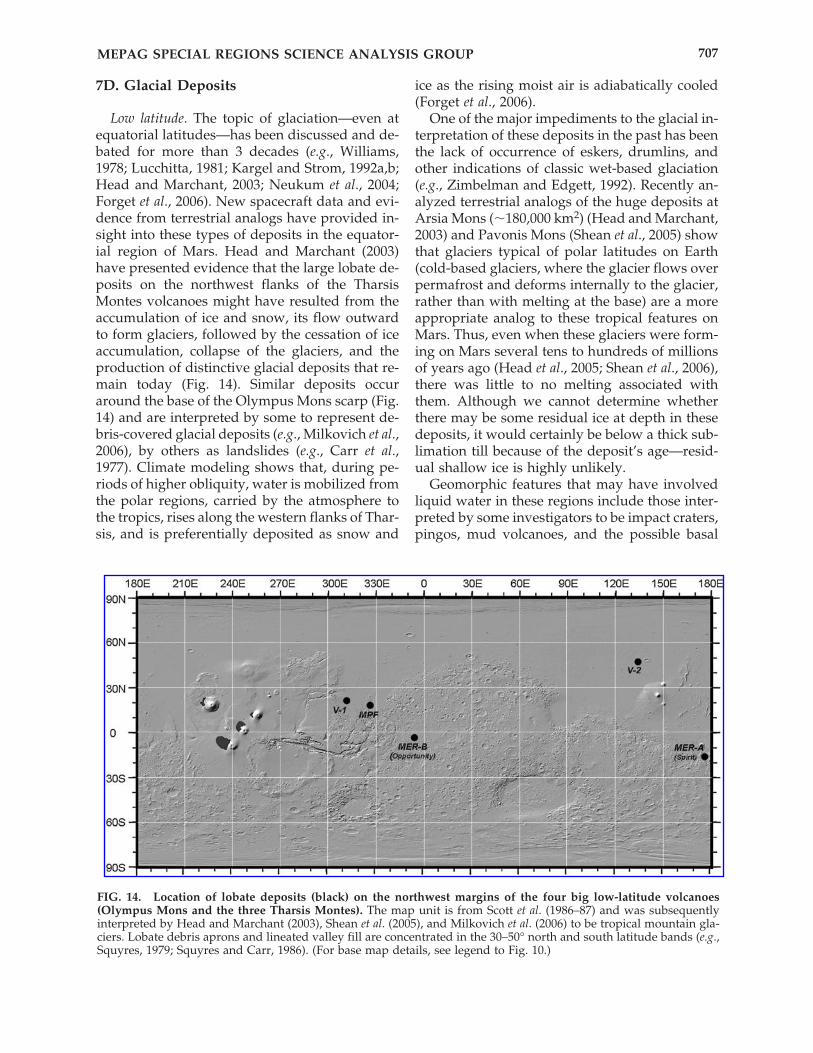
7D. Glacial Deposits
Low latitude. The topic of glaciation—even atequatorial latitudes—has been discussed and de-bated for more than 3 decades (e.g., Williams,1978; Lucchitta, 1981; Kargel and Strom, 1992a,b;Head and Marchant, 2003; Neukum et al., 2004;Forget et al., 2006). New spacecraft data and evi-dence from terrestrial analogs have provided in-sight into these types of deposits in the equator-ial region of Mars. Head and Marchant (2003)have presented evidence that the large lobate de-posits on the northwest flanks of the TharsisMontes volcanoes might have resulted from theaccumulation of ice and snow, its flow outwardto form glaciers, followed by the cessation of iceaccumulation, collapse of the glaciers, and theproduction of distinctive glacial deposits that re-main today (Fig. 14). Similar deposits occuraround the base of the Olympus Mons scarp (Fig.14) and are interpreted by some to represent de-bris-covered glacial deposits (e.g., Milkovich et al.,2006), by others as landslides (e.g., Carr et al.,1977). Climate modeling shows that, during pe-riods of higher obliquity, water is mobilized fromthe polar regions, carried by the atmosphere tothe tropics, rises along the western flanks of Thar-sis, and is preferentially deposited as snow and
ice as the rising moist air is adiabatically cooled(Forget et al., 2006).
One of the major impediments to the glacial in-terpretation of these deposits in the past has beenthe lack of occurrence of eskers, drumlins, andother indications of classic wet-based glaciation(e.g., Zimbelman and Edgett, 1992). Recently an-alyzed terrestrial analogs of the huge deposits atArsia Mons (�180,000 km2) (Head and Marchant,2003) and Pavonis Mons (Shean et al., 2005) showthat glaciers typical of polar latitudes on Earth(cold-based glaciers, where the glacier flows overpermafrost and deforms internally to the glacier,rather than with melting at the base) are a moreappropriate analog to these tropical features onMars. Thus, even when these glaciers were form-ing on Mars several tens to hundreds of millionsof years ago (Head et al., 2005; Shean et al., 2006),there was little to no melting associated withthem. Although we cannot determine whetherthere may be some residual ice at depth in thesedeposits, it would certainly be below a thick sub-limation till because of the deposit’s age—resid-ual shallow ice is highly unlikely.
Geomorphic features that may have involvedliquid water in these regions include those inter-preted by some investigators to be impact craters,pingos, mud volcanoes, and the possible basal
MEPAG SPECIAL REGIONS SCIENCE ANALYSIS GROUP 707
FIG. 14. Location of lobate deposits (black) on the northwest margins of the four big low-latitude volcanoes(Olympus Mons and the three Tharsis Montes). The map unit is from Scott et al. (1986–87) and was subsequentlyinterpreted by Head and Marchant (2003), Shean et al. (2005), and Milkovich et al. (2006) to be tropical mountain gla-ciers. Lobate debris aprons and lineated valley fill are concentrated in the 30–50° north and south latitude bands (e.g.,Squyres, 1979; Squyres and Carr, 1986). (For base map details, see legend to Fig. 10.)
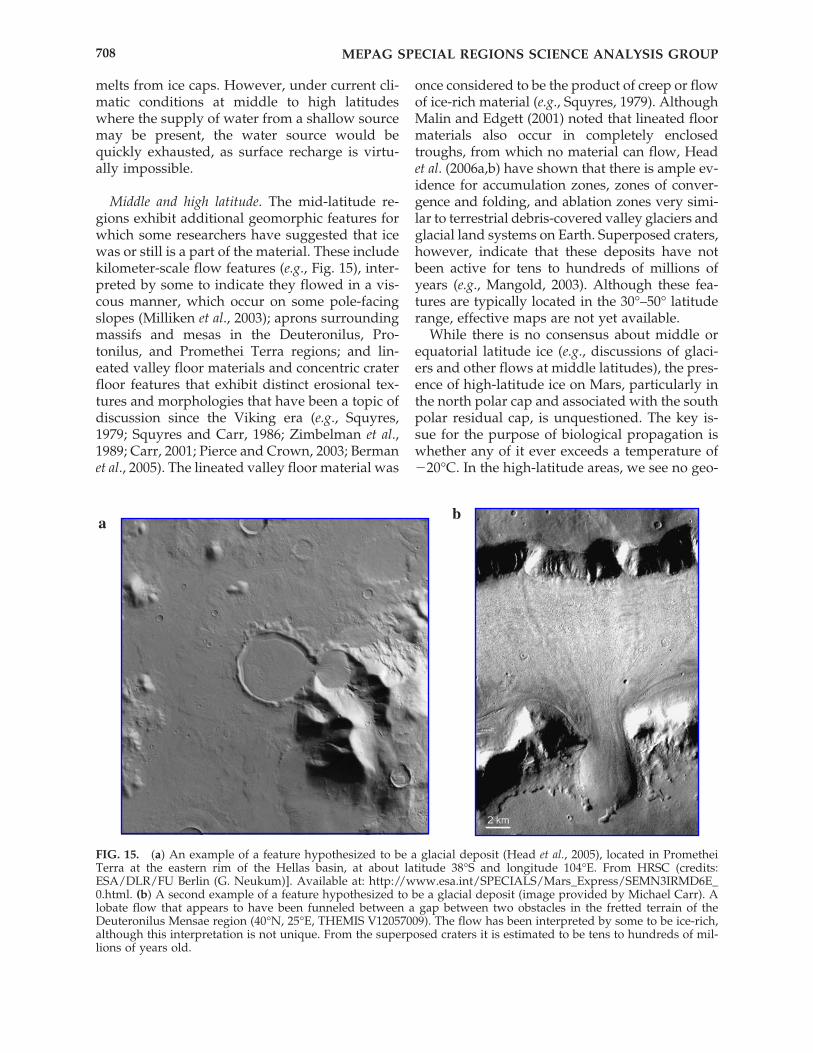
melts from ice caps. However, under current cli-matic conditions at middle to high latitudeswhere the supply of water from a shallow sourcemay be present, the water source would bequickly exhausted, as surface recharge is virtu-ally impossible.
Middle and high latitude. The mid-latitude re-gions exhibit additional geomorphic features forwhich some researchers have suggested that icewas or still is a part of the material. These includekilometer-scale flow features (e.g., Fig. 15), inter-preted by some to indicate they flowed in a vis-cous manner, which occur on some pole-facingslopes (Milliken et al., 2003); aprons surroundingmassifs and mesas in the Deuteronilus, Pro-tonilus, and Promethei Terra regions; and lin-eated valley floor materials and concentric craterfloor features that exhibit distinct erosional tex-tures and morphologies that have been a topic ofdiscussion since the Viking era (e.g., Squyres,1979; Squyres and Carr, 1986; Zimbelman et al.,1989; Carr, 2001; Pierce and Crown, 2003; Bermanet al., 2005). The lineated valley floor material was
once considered to be the product of creep or flowof ice-rich material (e.g., Squyres, 1979). AlthoughMalin and Edgett (2001) noted that lineated floormaterials also occur in completely enclosedtroughs, from which no material can flow, Headet al. (2006a,b) have shown that there is ample ev-idence for accumulation zones, zones of conver-gence and folding, and ablation zones very simi-lar to terrestrial debris-covered valley glaciers andglacial land systems on Earth. Superposed craters,however, indicate that these deposits have notbeen active for tens to hundreds of millions ofyears (e.g., Mangold, 2003). Although these fea-tures are typically located in the 30°–50° latituderange, effective maps are not yet available.
While there is no consensus about middle orequatorial latitude ice (e.g., discussions of glaci-ers and other flows at middle latitudes), the pres-ence of high-latitude ice on Mars, particularly inthe north polar cap and associated with the southpolar residual cap, is unquestioned. The key is-sue for the purpose of biological propagation iswhether any of it ever exceeds a temperature of�20°C. In the high-latitude areas, we see no geo-
MEPAG SPECIAL REGIONS SCIENCE ANALYSIS GROUP708
FIG. 15. (a) An example of a feature hypothesized to be a glacial deposit (Head et al., 2005), located in PrometheiTerra at the eastern rim of the Hellas basin, at about latitude 38°S and longitude 104°E. From HRSC (credits:ESA/DLR/FU Berlin (G. Neukum)]. Available at: http://www.esa.int/SPECIALS/Mars_Express/SEMN3IRMD6E_0.html. (b) A second example of a feature hypothesized to be a glacial deposit (image provided by Michael Carr). Alobate flow that appears to have been funneled between a gap between two obstacles in the fretted terrain of theDeuteronilus Mensae region (40°N, 25°E, THEMIS V12057009). The flow has been interpreted by some to be ice-rich,although this interpretation is not unique. From the superposed craters it is estimated to be tens to hundreds of mil-lions of years old.
ab
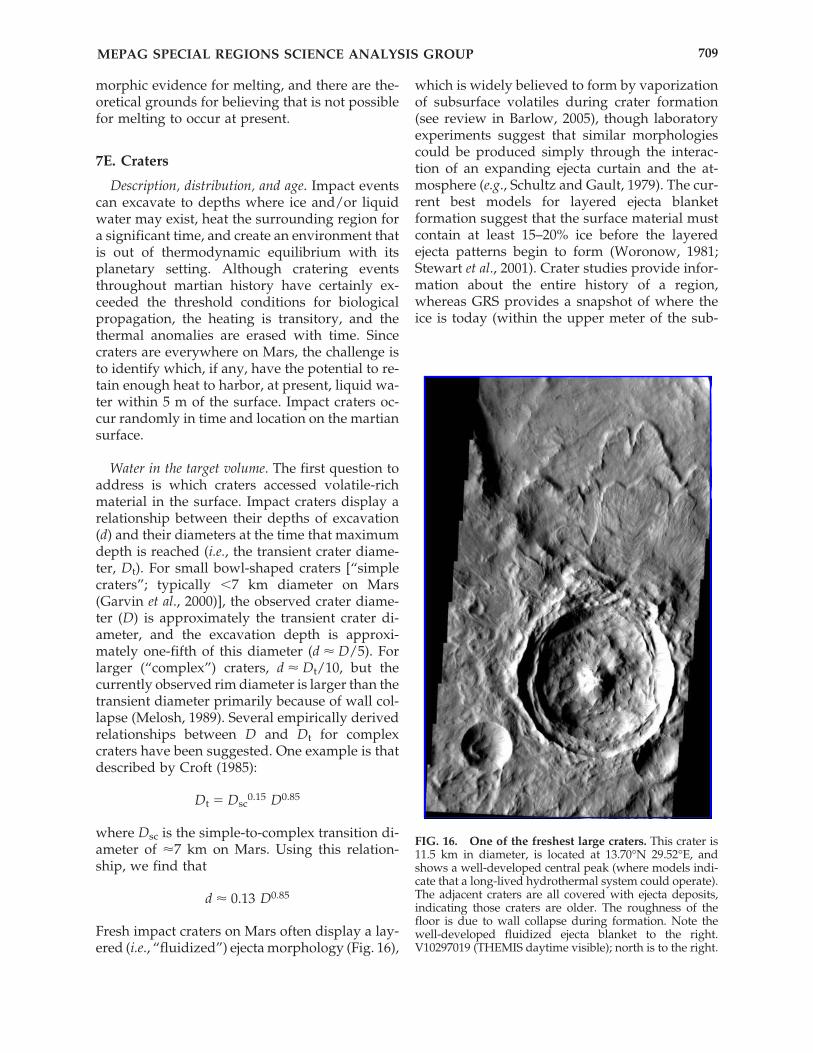
morphic evidence for melting, and there are the-oretical grounds for believing that is not possiblefor melting to occur at present.
7E. Craters
Description, distribution, and age. Impact eventscan excavate to depths where ice and/or liquidwater may exist, heat the surrounding region fora significant time, and create an environment thatis out of thermodynamic equilibrium with itsplanetary setting. Although cratering eventsthroughout martian history have certainly ex-ceeded the threshold conditions for biologicalpropagation, the heating is transitory, and thethermal anomalies are erased with time. Sincecraters are everywhere on Mars, the challenge isto identify which, if any, have the potential to re-tain enough heat to harbor, at present, liquid wa-ter within 5 m of the surface. Impact craters oc-cur randomly in time and location on the martiansurface.
Water in the target volume. The first question toaddress is which craters accessed volatile-richmaterial in the surface. Impact craters display arelationship between their depths of excavation(d) and their diameters at the time that maximumdepth is reached (i.e., the transient crater diame-ter, Dt). For small bowl-shaped craters [“simplecraters”; typically �7 km diameter on Mars(Garvin et al., 2000)], the observed crater diame-ter (D) is approximately the transient crater di-ameter, and the excavation depth is approxi-mately one-fifth of this diameter (d � D/5). Forlarger (“complex”) craters, d � Dt/10, but thecurrently observed rim diameter is larger than thetransient diameter primarily because of wall col-lapse (Melosh, 1989). Several empirically derivedrelationships between D and Dt for complexcraters have been suggested. One example is thatdescribed by Croft (1985):
Dt � Dsc0.15 D0.85
where Dsc is the simple-to-complex transition di-ameter of �7 km on Mars. Using this relation-ship, we find that
d � 0.13 D0.85
Fresh impact craters on Mars often display a lay-ered (i.e., “fluidized”) ejecta morphology (Fig. 16),
which is widely believed to form by vaporizationof subsurface volatiles during crater formation(see review in Barlow, 2005), though laboratoryexperiments suggest that similar morphologiescould be produced simply through the interac-tion of an expanding ejecta curtain and the at-mosphere (e.g., Schultz and Gault, 1979). The cur-rent best models for layered ejecta blanketformation suggest that the surface material mustcontain at least 15–20% ice before the layeredejecta patterns begin to form (Woronow, 1981;Stewart et al., 2001). Crater studies provide infor-mation about the entire history of a region,whereas GRS provides a snapshot of where theice is today (within the upper meter of the sub-
MEPAG SPECIAL REGIONS SCIENCE ANALYSIS GROUP 709
FIG. 16. One of the freshest large craters. This crater is11.5 km in diameter, is located at 13.70°N 29.52°E, andshows a well-developed central peak (where models indi-cate that a long-lived hydrothermal system could operate).The adjacent craters are all covered with ejecta deposits,indicating those craters are older. The roughness of thefloor is due to wall collapse during formation. Note thewell-developed fluidized ejecta blanket to the right.V10297019 (THEMIS daytime visible); north is to the right.
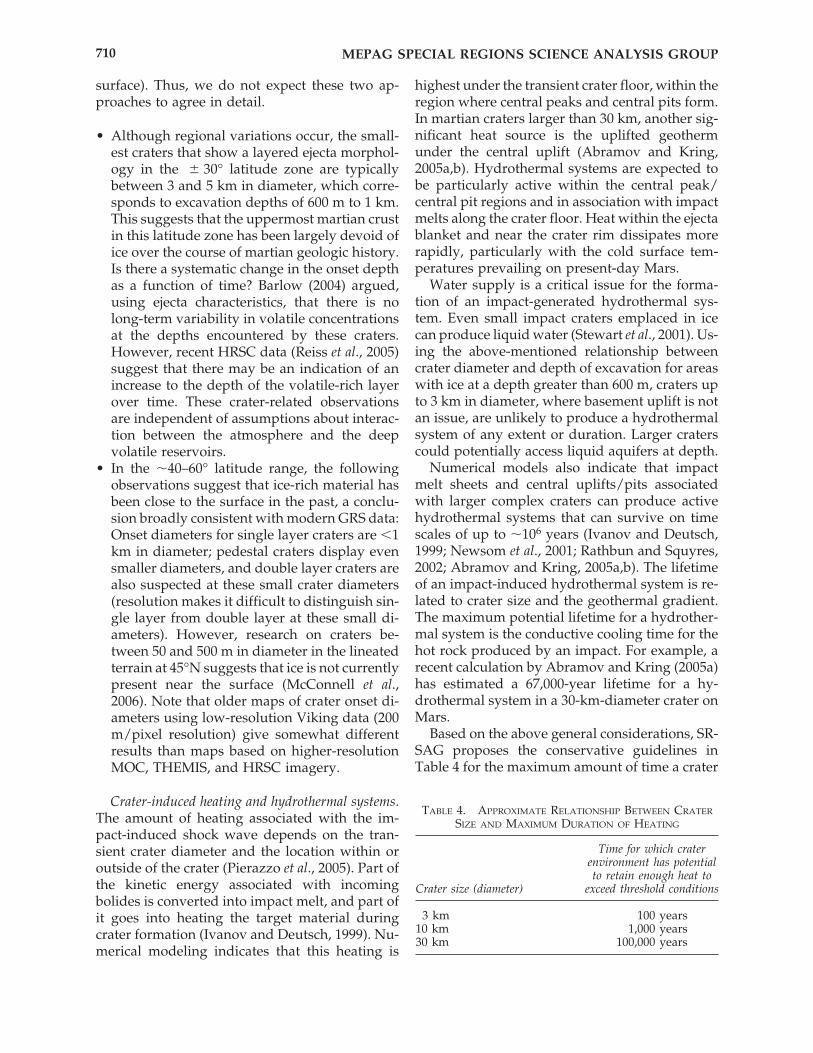
surface). Thus, we do not expect these two ap-proaches to agree in detail.
• Although regional variations occur, the small-est craters that show a layered ejecta morphol-ogy in the � 30° latitude zone are typically between 3 and 5 km in diameter, which corre-sponds to excavation depths of 600 m to 1 km.This suggests that the uppermost martian crustin this latitude zone has been largely devoid ofice over the course of martian geologic history.Is there a systematic change in the onset depthas a function of time? Barlow (2004) argued,using ejecta characteristics, that there is nolong-term variability in volatile concentrationsat the depths encountered by these craters.However, recent HRSC data (Reiss et al., 2005)suggest that there may be an indication of anincrease to the depth of the volatile-rich layerover time. These crater-related observationsare independent of assumptions about interac-tion between the atmosphere and the deepvolatile reservoirs.
• In the �40–60° latitude range, the followingobservations suggest that ice-rich material hasbeen close to the surface in the past, a conclu-sion broadly consistent with modern GRS data:Onset diameters for single layer craters are �1km in diameter; pedestal craters display evensmaller diameters, and double layer craters arealso suspected at these small crater diameters(resolution makes it difficult to distinguish sin-gle layer from double layer at these small di-ameters). However, research on craters be-tween 50 and 500 m in diameter in the lineatedterrain at 45°N suggests that ice is not currentlypresent near the surface (McConnell et al.,2006). Note that older maps of crater onset di-ameters using low-resolution Viking data (200m/pixel resolution) give somewhat differentresults than maps based on higher-resolutionMOC, THEMIS, and HRSC imagery.
Crater-induced heating and hydrothermal systems.The amount of heating associated with the im-pact-induced shock wave depends on the tran-sient crater diameter and the location within oroutside of the crater (Pierazzo et al., 2005). Part ofthe kinetic energy associated with incomingbolides is converted into impact melt, and part ofit goes into heating the target material duringcrater formation (Ivanov and Deutsch, 1999). Nu-merical modeling indicates that this heating is
highest under the transient crater floor, within theregion where central peaks and central pits form.In martian craters larger than 30 km, another sig-nificant heat source is the uplifted geotherm under the central uplift (Abramov and Kring,2005a,b). Hydrothermal systems are expected tobe particularly active within the central peak/central pit regions and in association with impactmelts along the crater floor. Heat within the ejectablanket and near the crater rim dissipates morerapidly, particularly with the cold surface tem-peratures prevailing on present-day Mars.
Water supply is a critical issue for the forma-tion of an impact-generated hydrothermal sys-tem. Even small impact craters emplaced in icecan produce liquid water (Stewart et al., 2001). Us-ing the above-mentioned relationship betweencrater diameter and depth of excavation for areaswith ice at a depth greater than 600 m, craters upto 3 km in diameter, where basement uplift is notan issue, are unlikely to produce a hydrothermalsystem of any extent or duration. Larger craterscould potentially access liquid aquifers at depth.
Numerical models also indicate that impactmelt sheets and central uplifts/pits associatedwith larger complex craters can produce activehydrothermal systems that can survive on timescales of up to �106 years (Ivanov and Deutsch,1999; Newsom et al., 2001; Rathbun and Squyres,2002; Abramov and Kring, 2005a,b). The lifetimeof an impact-induced hydrothermal system is re-lated to crater size and the geothermal gradient.The maximum potential lifetime for a hydrother-mal system is the conductive cooling time for thehot rock produced by an impact. For example, arecent calculation by Abramov and Kring (2005a)has estimated a 67,000-year lifetime for a hy-drothermal system in a 30-km-diameter crater onMars.
Based on the above general considerations, SR-SAG proposes the conservative guidelines inTable 4 for the maximum amount of time a crater
MEPAG SPECIAL REGIONS SCIENCE ANALYSIS GROUP710
TABLE 4. APPROXIMATE RELATIONSHIP BETWEEN CRATER
SIZE AND MAXIMUM DURATION OF HEATING
Time for which craterenvironment has potentialto retain enough heat to
Crater size (diameter) exceed threshold conditions
3 km 100 years10 km 1,000 years30 km 100,000 years
environment has the potential to retain enoughheat in the shallow martian subsurface to exceedthe threshold conditions for microbial propaga-tion, assuming a supply of water is available. Ingeneral, the thermal lifetimes for craters smallerthan 3 km in diameter are too short to be signif-icant for the purpose of special region analysis.In addition, very young and fresh craters largerthan 30 km in diameter have not been identified(Table 5).
Cratering frequency. A 10-km-diameter crater isexpected to form on Earth approximately every105 years (Morrison et al., 1994). The impact rateon Mars is considered to be �1.3 times higherthan the terrestrial impact rate because of Mars’proximity to the asteroid belt, but the impact en-ergy will be less because the typical asteroid im-pact velocity is 8.6 km/s on Mars compared with�17 km/s on Earth. Adjusting the terrestrial im-pact probability plot for Mars suggests that one40-km-diameter crater could be expected to formapproximately every million years on Mars, anda 10-km-diameter crater would statistically formevery �30,000 years. Thus, although the proba-bility is very low that a crater of sufficient sizehas formed recently enough to retain an activehydrothermal system to the present, there is asmall chance that such a crater exists.
Identification of the most recent large craters.Young craters can be identified by the followingcharacteristics:
1. Sharp rim and crater depth approximatelyequal to those values expected for a pristinecrater of equivalent size.
2. No superposed features on either the crater orits ejecta blanket. Such superposed features
would include dunes, floor deposits, tec-tonic/fluvial features, or small impact craters.
3. Ejecta blanket and interior morphologies thatare sharp and well preserved.
4. The crater and its ejecta blanket displayingthermally distinct signatures in daytimeand/or nighttime infrared views.
Very few impact craters �5 km in diameter dis-play these characteristics. Table 5 lists northernhemisphere craters identified from MOC, MOLA,and THEMIS analysis, which appear to be amongthe freshest craters on the planet (from data ofMalin and Edgett, 2001; Smith et al., 2001; Chris-tensen et al., 2004; interpretation by Barlow, 2004).These craters have a similar rating of extremelyfresh using the criteria listed above. It should benote that none of these craters is named, and thislist will clearly keep growing as our explorationof Mars proceeds. We do not have precise waysof dating craters on Mars; however, the approxi-mate age can be estimated from the degree ofdegradation of the crater morphology (Barlow,2004). Based on this kind of analysis, we do nothave reason to believe that any of the craters inTable 5 are as young as the limits specified inTable 4.
7F. Young Volcanics
Description and distribution. Volcanism or mag-matic intrusion may be capable of generating spe-
MEPAG SPECIAL REGIONS SCIENCE ANALYSIS GROUP 711
TABLE 5. FRESHEST LARGE CRATERS IN THE NORTHERN HEMISPHERE OF MARS IDENTIFIED TO DATE
Latitude (N) Longitude (E) Diameter (km) Central structure Ejectaa
7.03 117.19 18.0 Central peak MLERSRd7.16 174.41 9.6 Floor pit MLERS8.93 43.82 10.9 Summit pit MLERS
12.10 169.24 5.9 Summit pit SLERS13.70 29.52 11.5 Central peak MLERS16.95 141.70 13.6 Floor pit MLERSRd19.51 141.18 9.2 Floor pit MLERS20.01 246.68 7.9 None SLERSRd23.19 207.76 28.3 Central peak MLERSRd
aEjecta classifications from Barlow et al. (2000).
FINDING. No craters with the combinationof size and youthfulness to retain enoughheat to exceed the temperature threshold forpropagation have been identified on Mars todate.
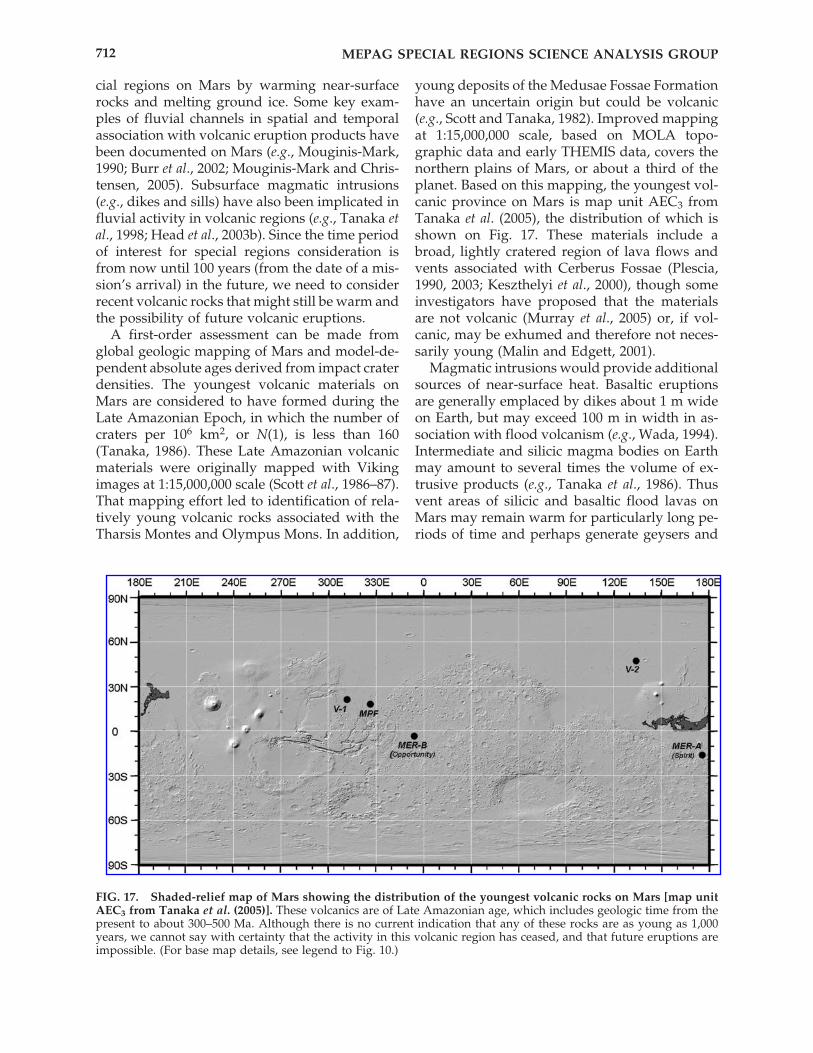
cial regions on Mars by warming near-surfacerocks and melting ground ice. Some key exam-ples of fluvial channels in spatial and temporalassociation with volcanic eruption products havebeen documented on Mars (e.g., Mouginis-Mark,1990; Burr et al., 2002; Mouginis-Mark and Chris-tensen, 2005). Subsurface magmatic intrusions(e.g., dikes and sills) have also been implicated influvial activity in volcanic regions (e.g., Tanaka etal., 1998; Head et al., 2003b). Since the time periodof interest for special regions consideration isfrom now until 100 years (from the date of a mis-sion’s arrival) in the future, we need to considerrecent volcanic rocks that might still be warm andthe possibility of future volcanic eruptions.
A first-order assessment can be made fromglobal geologic mapping of Mars and model-de-pendent absolute ages derived from impact craterdensities. The youngest volcanic materials onMars are considered to have formed during theLate Amazonian Epoch, in which the number ofcraters per 106 km2, or N(1), is less than 160(Tanaka, 1986). These Late Amazonian volcanicmaterials were originally mapped with Vikingimages at 1:15,000,000 scale (Scott et al., 1986–87).That mapping effort led to identification of rela-tively young volcanic rocks associated with theTharsis Montes and Olympus Mons. In addition,
young deposits of the Medusae Fossae Formationhave an uncertain origin but could be volcanic(e.g., Scott and Tanaka, 1982). Improved mappingat 1:15,000,000 scale, based on MOLA topo-graphic data and early THEMIS data, covers thenorthern plains of Mars, or about a third of theplanet. Based on this mapping, the youngest vol-canic province on Mars is map unit AEC3 fromTanaka et al. (2005), the distribution of which isshown on Fig. 17. These materials include abroad, lightly cratered region of lava flows andvents associated with Cerberus Fossae (Plescia,1990, 2003; Keszthelyi et al., 2000), though someinvestigators have proposed that the materialsare not volcanic (Murray et al., 2005) or, if vol-canic, may be exhumed and therefore not neces-sarily young (Malin and Edgett, 2001).
Magmatic intrusions would provide additionalsources of near-surface heat. Basaltic eruptionsare generally emplaced by dikes about 1 m wideon Earth, but may exceed 100 m in width in as-sociation with flood volcanism (e.g., Wada, 1994).Intermediate and silicic magma bodies on Earthmay amount to several times the volume of ex-trusive products (e.g., Tanaka et al., 1986). Thusvent areas of silicic and basaltic flood lavas onMars may remain warm for particularly long pe-riods of time and perhaps generate geysers and
MEPAG SPECIAL REGIONS SCIENCE ANALYSIS GROUP712
FIG. 17. Shaded-relief map of Mars showing the distribution of the youngest volcanic rocks on Mars [map unitAEC3 from Tanaka et al. (2005)]. These volcanics are of Late Amazonian age, which includes geologic time from thepresent to about 300–500 Ma. Although there is no current indication that any of these rocks are as young as 1,000years, we cannot say with certainty that the activity in this volcanic region has ceased, and that future eruptions areimpossible. (For base map details, see legend to Fig. 10.)
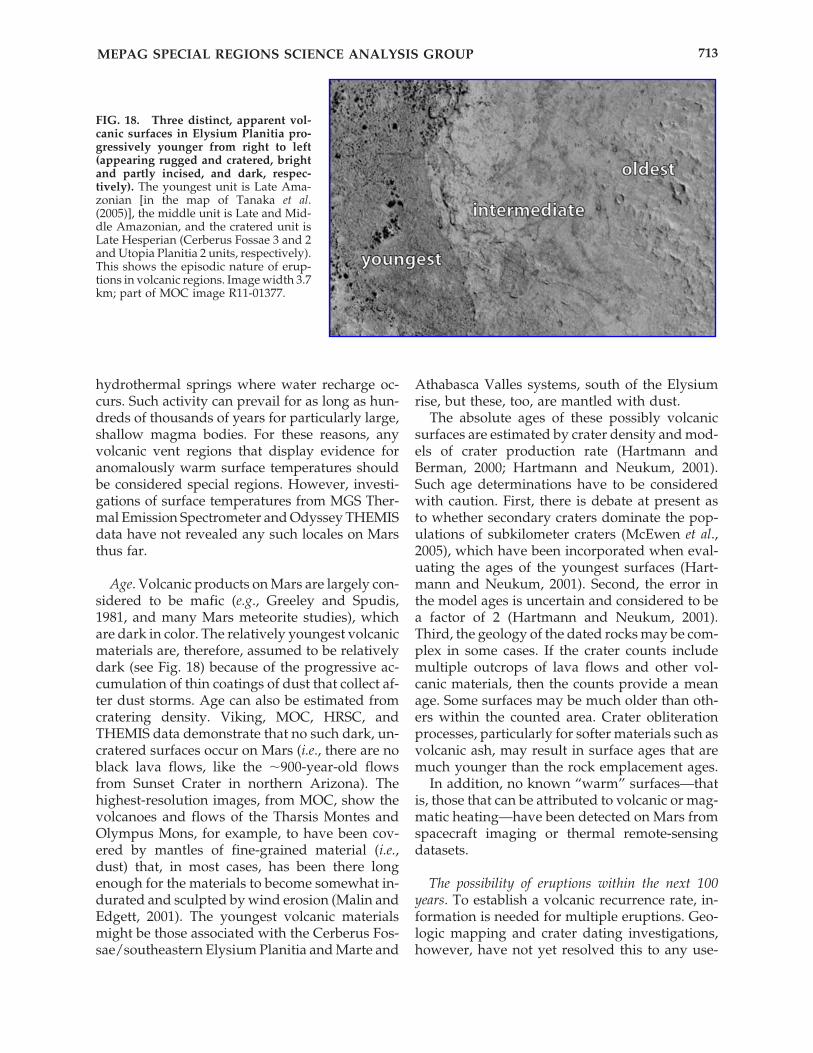
hydrothermal springs where water recharge oc-curs. Such activity can prevail for as long as hun-dreds of thousands of years for particularly large,shallow magma bodies. For these reasons, anyvolcanic vent regions that display evidence foranomalously warm surface temperatures shouldbe considered special regions. However, investi-gations of surface temperatures from MGS Ther-mal Emission Spectrometer and Odyssey THEMISdata have not revealed any such locales on Marsthus far.
Age. Volcanic products on Mars are largely con-sidered to be mafic (e.g., Greeley and Spudis,1981, and many Mars meteorite studies), whichare dark in color. The relatively youngest volcanicmaterials are, therefore, assumed to be relativelydark (see Fig. 18) because of the progressive ac-cumulation of thin coatings of dust that collect af-ter dust storms. Age can also be estimated fromcratering density. Viking, MOC, HRSC, andTHEMIS data demonstrate that no such dark, un-cratered surfaces occur on Mars (i.e., there are noblack lava flows, like the �900-year-old flowsfrom Sunset Crater in northern Arizona). Thehighest-resolution images, from MOC, show thevolcanoes and flows of the Tharsis Montes andOlympus Mons, for example, to have been cov-ered by mantles of fine-grained material (i.e.,dust) that, in most cases, has been there longenough for the materials to become somewhat in-durated and sculpted by wind erosion (Malin andEdgett, 2001). The youngest volcanic materialsmight be those associated with the Cerberus Fos-sae/southeastern Elysium Planitia and Marte and
Athabasca Valles systems, south of the Elysiumrise, but these, too, are mantled with dust.
The absolute ages of these possibly volcanicsurfaces are estimated by crater density and mod-els of crater production rate (Hartmann andBerman, 2000; Hartmann and Neukum, 2001).Such age determinations have to be consideredwith caution. First, there is debate at present asto whether secondary craters dominate the pop-ulations of subkilometer craters (McEwen et al.,2005), which have been incorporated when eval-uating the ages of the youngest surfaces (Hart-mann and Neukum, 2001). Second, the error inthe model ages is uncertain and considered to bea factor of 2 (Hartmann and Neukum, 2001).Third, the geology of the dated rocks may be com-plex in some cases. If the crater counts includemultiple outcrops of lava flows and other vol-canic materials, then the counts provide a meanage. Some surfaces may be much older than oth-ers within the counted area. Crater obliterationprocesses, particularly for softer materials such asvolcanic ash, may result in surface ages that aremuch younger than the rock emplacement ages.
In addition, no known “warm” surfaces—thatis, those that can be attributed to volcanic or mag-matic heating—have been detected on Mars fromspacecraft imaging or thermal remote-sensingdatasets.
The possibility of eruptions within the next 100years. To establish a volcanic recurrence rate, in-formation is needed for multiple eruptions. Geo-logic mapping and crater dating investigations,however, have not yet resolved this to any use-
MEPAG SPECIAL REGIONS SCIENCE ANALYSIS GROUP 713
FIG. 18. Three distinct, apparent vol-canic surfaces in Elysium Planitia pro-gressively younger from right to left(appearing rugged and cratered, brightand partly incised, and dark, respec-tively). The youngest unit is Late Ama-zonian [in the map of Tanaka et al.(2005)], the middle unit is Late and Mid-dle Amazonian, and the cratered unit isLate Hesperian (Cerberus Fossae 3 and 2and Utopia Planitia 2 units, respectively).This shows the episodic nature of erup-tions in volcanic regions. Image width 3.7km; part of MOC image R11-01377.
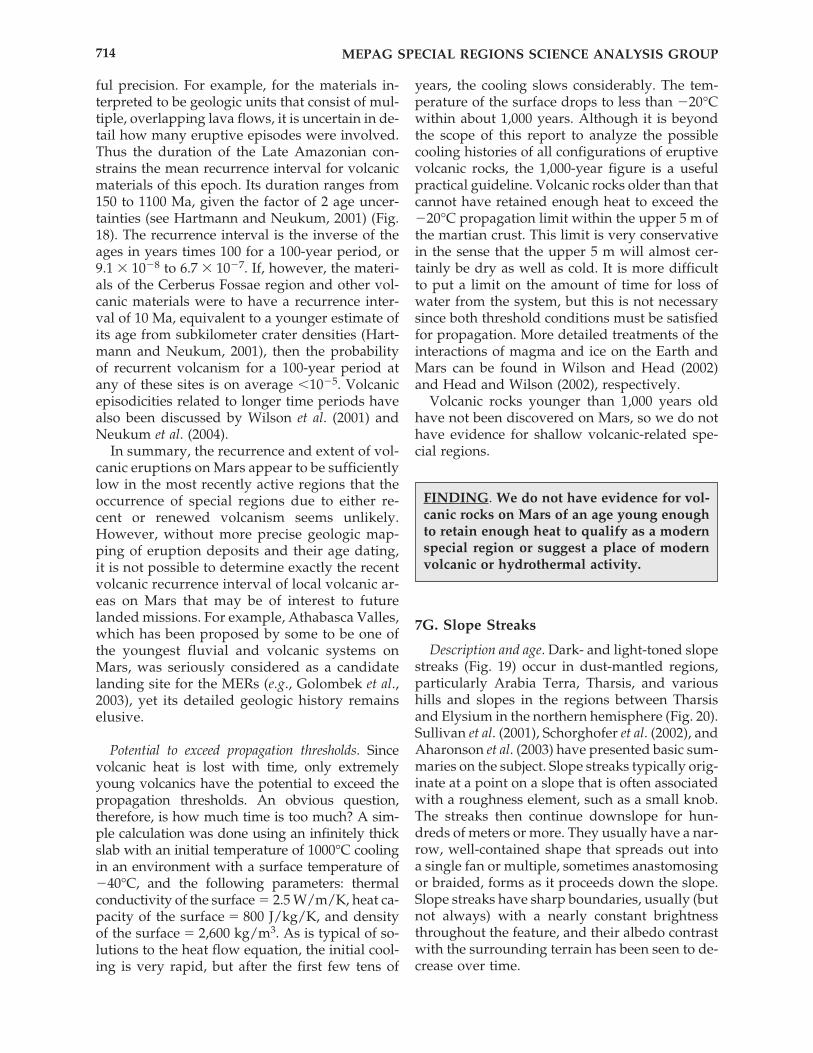
ful precision. For example, for the materials in-terpreted to be geologic units that consist of mul-tiple, overlapping lava flows, it is uncertain in de-tail how many eruptive episodes were involved.Thus the duration of the Late Amazonian con-strains the mean recurrence interval for volcanicmaterials of this epoch. Its duration ranges from150 to 1100 Ma, given the factor of 2 age uncer-tainties (see Hartmann and Neukum, 2001) (Fig.18). The recurrence interval is the inverse of theages in years times 100 for a 100-year period, or9.1 � 10�8 to 6.7 � 10�7. If, however, the materi-als of the Cerberus Fossae region and other vol-canic materials were to have a recurrence inter-val of 10 Ma, equivalent to a younger estimate ofits age from subkilometer crater densities (Hart-mann and Neukum, 2001), then the probability of recurrent volcanism for a 100-year period atany of these sites is on average �10�5. Volcanicepisodicities related to longer time periods havealso been discussed by Wilson et al. (2001) andNeukum et al. (2004).
In summary, the recurrence and extent of vol-canic eruptions on Mars appear to be sufficientlylow in the most recently active regions that theoccurrence of special regions due to either re-cent or renewed volcanism seems unlikely.However, without more precise geologic map-ping of eruption deposits and their age dating,it is not possible to determine exactly the recentvolcanic recurrence interval of local volcanic ar-eas on Mars that may be of interest to futurelanded missions. For example, Athabasca Valles,which has been proposed by some to be one ofthe youngest fluvial and volcanic systems onMars, was seriously considered as a candidatelanding site for the MERs (e.g., Golombek et al.,2003), yet its detailed geologic history remainselusive.
Potential to exceed propagation thresholds. Sincevolcanic heat is lost with time, only extremelyyoung volcanics have the potential to exceed thepropagation thresholds. An obvious question,therefore, is how much time is too much? A sim-ple calculation was done using an infinitely thickslab with an initial temperature of 1000°C coolingin an environment with a surface temperature of�40°C, and the following parameters: thermalconductivity of the surface � 2.5 W/m/K, heat ca-pacity of the surface � 800 J/kg/K, and densityof the surface � 2,600 kg/m3. As is typical of so-lutions to the heat flow equation, the initial cool-ing is very rapid, but after the first few tens of
years, the cooling slows considerably. The tem-perature of the surface drops to less than �20°Cwithin about 1,000 years. Although it is beyondthe scope of this report to analyze the possiblecooling histories of all configurations of eruptivevolcanic rocks, the 1,000-year figure is a usefulpractical guideline. Volcanic rocks older than thatcannot have retained enough heat to exceed the�20°C propagation limit within the upper 5 m ofthe martian crust. This limit is very conservativein the sense that the upper 5 m will almost cer-tainly be dry as well as cold. It is more difficultto put a limit on the amount of time for loss ofwater from the system, but this is not necessarysince both threshold conditions must be satisfiedfor propagation. More detailed treatments of theinteractions of magma and ice on the Earth andMars can be found in Wilson and Head (2002)and Head and Wilson (2002), respectively.
Volcanic rocks younger than 1,000 years oldhave not been discovered on Mars, so we do nothave evidence for shallow volcanic-related spe-cial regions.
7G. Slope Streaks
Description and age. Dark- and light-toned slopestreaks (Fig. 19) occur in dust-mantled regions,particularly Arabia Terra, Tharsis, and varioushills and slopes in the regions between Tharsisand Elysium in the northern hemisphere (Fig. 20).Sullivan et al. (2001), Schorghofer et al. (2002), andAharonson et al. (2003) have presented basic sum-maries on the subject. Slope streaks typically orig-inate at a point on a slope that is often associatedwith a roughness element, such as a small knob.The streaks then continue downslope for hun-dreds of meters or more. They usually have a nar-row, well-contained shape that spreads out intoa single fan or multiple, sometimes anastomosingor braided, forms as it proceeds down the slope.Slope streaks have sharp boundaries, usually (butnot always) with a nearly constant brightnessthroughout the feature, and their albedo contrastwith the surrounding terrain has been seen to de-crease over time.
MEPAG SPECIAL REGIONS SCIENCE ANALYSIS GROUP714
FINDING. We do not have evidence for vol-canic rocks on Mars of an age young enoughto retain enough heat to qualify as a modernspecial region or suggest a place of modernvolcanic or hydrothermal activity.
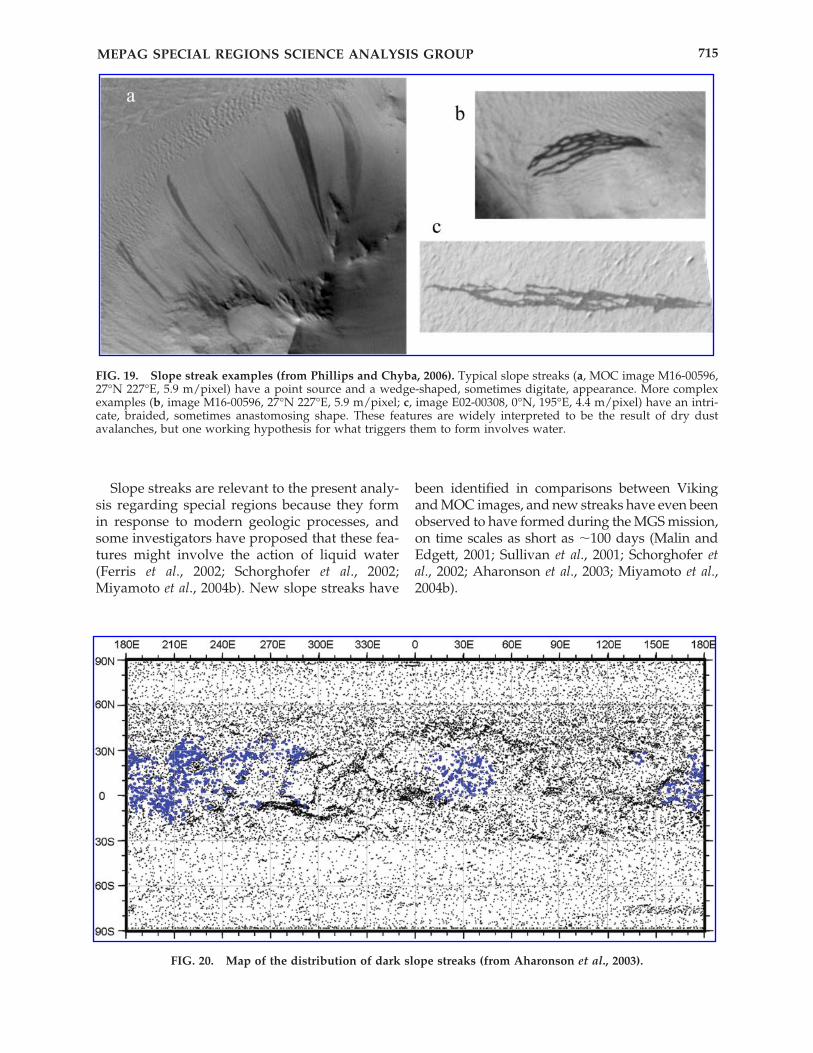
Slope streaks are relevant to the present analy-sis regarding special regions because they formin response to modern geologic processes, andsome investigators have proposed that these fea-tures might involve the action of liquid water(Ferris et al., 2002; Schorghofer et al., 2002;Miyamoto et al., 2004b). New slope streaks have
been identified in comparisons between Vikingand MOC images, and new streaks have even beenobserved to have formed during the MGS mission,on time scales as short as �100 days (Malin andEdgett, 2001; Sullivan et al., 2001; Schorghofer etal., 2002; Aharonson et al., 2003; Miyamoto et al.,2004b).
MEPAG SPECIAL REGIONS SCIENCE ANALYSIS GROUP 715
FIG. 19. Slope streak examples (from Phillips and Chyba, 2006). Typical slope streaks (a, MOC image M16-00596,27°N 227°E, 5.9 m/pixel) have a point source and a wedge-shaped, sometimes digitate, appearance. More complexexamples (b, image M16-00596, 27°N 227°E, 5.9 m/pixel; c, image E02-00308, 0°N, 195°E, 4.4 m/pixel) have an intri-cate, braided, sometimes anastomosing shape. These features are widely interpreted to be the result of dry dustavalanches, but one working hypothesis for what triggers them to form involves water.
FIG. 20. Map of the distribution of dark slope streaks (from Aharonson et al., 2003).
Possible relationship to water. There are two cur-rent working hypotheses for their formationmechanism:
• The dry models suggest that the streaks formthrough dust movement. In the dry process,oversteepening slopes caused by air fall de-posits of dry dust eventually collapse, forminga dust avalanche (Williams, 1991; Sullivan etal., 2001; Miyamoto et al., 2004b). In support ofthe dry model is that all light and dark slopestreaks occur in low thermal inertia areas man-tled by accumulations of dust thick enough tobe evident as such in MGS MOC images.
• The second class of models involves water,but the role of water varies between models.Early models such as that of Ferguson andLucchitta (1984) suggested that the darkstreaks could be stains on the surface pro-duced by wet, briny debris flows. These flowscould form when a slope intersected anaquifer, allowing the periodic release of fluidfrom a wet subsurface layer. Schorghofer etal. (2002) suggested that water could lubricateavalanches, or the sublimation of near-sur-face ice could trigger mass movements. Fer-ris et al. (2002) proposed a model involvinggroundwater springs that infiltrate and satu-rate the surface, creating the dark streaks.Miyamoto et al. (2004b) concluded that thestreaks are not debris flows, but could noteliminate the possibility that water is in-volved in the streak-forming process.
Despite the various hypotheses in the litera-ture, two key observations indicate that wind isa controlling factor for at least some slopestreaks: (1) examples have been seen where dustdevil tracks turn into a slope streak once a craterrim has been crossed; and (2) a population ofslope streaks is clearly emplaced preferentiallyon west-facing slopes (Baratoux et al., 2006)—thiscorrelates with wind direction. The abundance ofslope streaks decreases sharply at about 33°N,and they are absent at higher latitude. Baratouxet al. (2006) interpreted this as an indication thatpoleward of 33°, the ubiquitous dust is ice-ce-mented and, thus, not amenable to flow, whereasequatorward of 33° the dust is desiccated andflows easily. For these reasons, it is unlikely thatsubstantial quantities of liquid water are in-volved in slope streak formation. There is, how-ever, an open question on the role of trace
amounts of transient H2O in triggering thesedust avalanches, for example, by changing cohe-sion or porosity of the dust matrix.
7H. Recent Outflow Channels?
Description and age. One of the prominent as-pects of martian geology is the evidence for an-cient outflow channels. Could the process thatcreated them continue to the present era? Theyoungest such feature that has been dated isAthabasca Valles (10°N, 157°E)—Burr et al. (2002)have given the age of the latest flood at Athabascaas 2–8 million years. Some other channels nearbyare only slightly older. Furthermore, there arealso some young channels just to the southeast ofOlympus Mons (Mouginis-Mark, 1990) thatBasilevsky et al. (2006) have dated at 20 millionyears. These examples indicate the presence ofdeep groundwater (or ice) that might haveepisodically erupted to the surface along faults(or caused by dikes). Although this type of fea-ture may have continued to form until the geo-logically recent past, we do not have evidencethat any are active today or have reason to pre-dict that any will be active within the next 100years.
7I. The Nondiscovery of Geothermal Vents
An important objective of the THEMIS infraredinvestigation on Mars Odyssey has been thesearch for temperature anomalies produced bysurface cooling or heating due to near-surface liq-uid water or ice, or hydrothermal or volcanic ac-tivity. THEMIS has mapped virtually all of Marsat night in the infrared at 100 m/pixel resolutionand observed portions of the surface a secondtime up to 1 Mars year later. An analysis has beenperformed of all of these images to search formaximum temperatures greater than those ex-pected from rocks or bedrock alone (220K), andno example has been found in any image of a tem-perature that requires an internal heat source(P.R. Christensen, personal communication,2006).
The THEMIS database has also been searchedfor spatial patterns that might indicate evapora-tive cooling associated with near-surface water orrecent volcanic activity or hydrothermal heating.The THEMIS nighttime images exhibit very highspatial variability owing to variations in surfaceproperties such as rock layers, exposed bedrock,and sand and granule dunes (P.R. Christensen,
MEPAG SPECIAL REGIONS SCIENCE ANALYSIS GROUP716
personal communication, 2006). These thermalvariations greatly complicate the search foranomalous patterns associated with subsurfacewater. To overcome the effects of these surfacetemperature complexities, a search for seasonalchanges in surface temperature was undertakenin an effort to isolate changes due to dynamicheating or cooling processes from those due tothermophysical properties. This process involvedthe use of histogram adjustments of the overlap-ping portions of two images to remove the addi-tional complicating temperature changes pro-duced by the 2-h variation in local time of theOdyssey orbit, and by the differences in seasonbetween the different observations. In addition,numerous image pairs have been converted tothermal inertia using the THEMIS Standard Ther-mal Model as a quantitative means to remove thetime of day and seasonal effects. To date, no sig-nificant changes have been detected, but thisanalysis will continue throughout the Odysseyextended missions. Based on the analysis thus far,there is no evidence in the THEMIS thermal im-ages for the existence of near-surface liquid wa-ter or ice that is close enough to the surface to becapable of producing measurable thermal anom-alies.
The MGS MOC investigation has also ad-dressed this issue by focusing on imaging of rel-atively young volcanic and impact landforms,and searching for evidence that activity is occur-ring today—such as eruption, production offlows (mud or lava), and the like. No such fea-tures have been found in MOC or other orbiterimages.
7J. The Possibility of Low-Latitude Ground Ice
The Mars Odyssey GRS data (Fig. 5) clearly re-flect high-latitude ice in the vicinity of both poles,but also some significant positive equatorialanomalies in places like Arabia Terra. A numberof authors have concluded, in large part based on
the instability of ice within a meter of the surface(the volume within which the GRS instrumentcan detect ice), that these anomalies are related tohydrated minerals (e.g., Basilevsky et al., 2003).For example, the high hydrogen level in low lat-itudes is entirely consistent with the observationsof hydrated minerals found by MER and byOMEGA (the visible and infrared mineralogicalmapping spectrometer on Mars Express), andthere is no evidence of layering of hydrogen inthe low-latitude anomalies.
However, there has also been some discus-sion of the possibility that these anomalies rep-resent low-latitude ground ice. For example, ithas been suggested that, when the south polarcap has exposed water ice, the water vapor con-tent of the martian atmosphere could climb andmight make ground ice stable to low latitudes(e.g., Jakosky et al., 2005a,b). It may be possiblefor ice to be emplaced onto the surface or intothe top meter during these episodes. While theice is not stable today, it has been suggested thatice that had been previously deposited mightstill exist in a transient state while in the processof disappearing.
However, diffusion processes that control po-tential ice deposition in the equatorial regolithare thought to occur on 100–5,000 year timescales (Feldman et al., 2005). If the time scale ofuncovered polar water ice is shorter than 100years, it is difficult for significant amounts ofwater ice to accumulate. Polar cap exposure onlonger time scales, such as would result fromorbital oscillations, might result in higher con-centrations of equatorial ground ice, but alsowould result in a different distribution of high-latitude ground ice than is observed today (Mel-lon et al., 2004). In addition, “transient” icewould be stable and in equilibrium with the at-mosphere only in regions and depths wheresubsurface temperatures are typically below thenew frost point (for even a 10-fold increase inatmospheric water the new frost point wouldonly be 212K). Subsequent replenishment of theCO2 cap on the south polar region and subse-quent reduction of atmospheric water vaporwould result in removal of now unstable ice bysublimation on the same time scale as its em-placement. Thus, presently observed equatorialconcentrations of hydrogen are more likely tobe the result of one or more hydrated mineralsand not due to transient water ice (Feldman etal., 2005).
MEPAG SPECIAL REGIONS SCIENCE ANALYSIS GROUP 717
FINDING. Despite a deliberate and system-atic search spanning several years, no evi-dence has been found for the existence ofthermal anomalies capable of producingnear-surface liquid water.
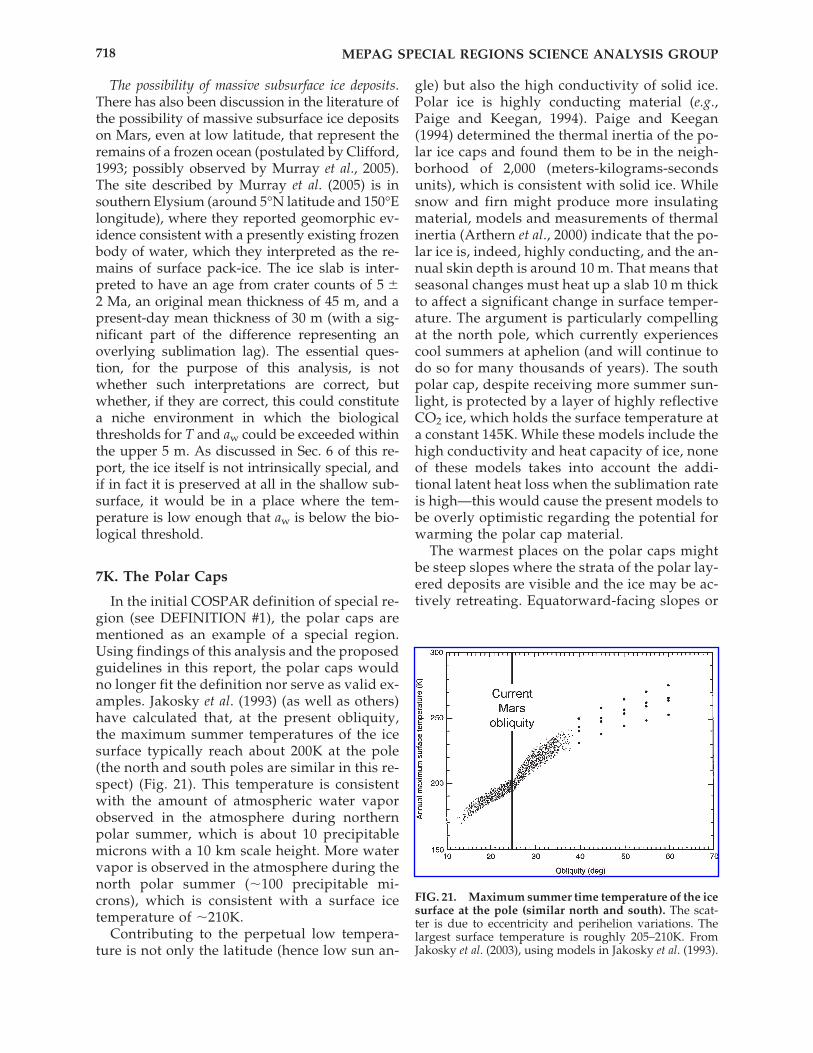
The possibility of massive subsurface ice deposits.There has also been discussion in the literature ofthe possibility of massive subsurface ice depositson Mars, even at low latitude, that represent theremains of a frozen ocean (postulated by Clifford,1993; possibly observed by Murray et al., 2005).The site described by Murray et al. (2005) is insouthern Elysium (around 5°N latitude and 150°Elongitude), where they reported geomorphic ev-idence consistent with a presently existing frozenbody of water, which they interpreted as the re-mains of surface pack-ice. The ice slab is inter-preted to have an age from crater counts of 5 �2 Ma, an original mean thickness of 45 m, and apresent-day mean thickness of 30 m (with a sig-nificant part of the difference representing anoverlying sublimation lag). The essential ques-tion, for the purpose of this analysis, is notwhether such interpretations are correct, butwhether, if they are correct, this could constitutea niche environment in which the biologicalthresholds for T and aw could be exceeded withinthe upper 5 m. As discussed in Sec. 6 of this re-port, the ice itself is not intrinsically special, andif in fact it is preserved at all in the shallow sub-surface, it would be in a place where the tem-perature is low enough that aw is below the bio-logical threshold.
7K. The Polar Caps
In the initial COSPAR definition of special re-gion (see DEFINITION #1), the polar caps arementioned as an example of a special region.Using findings of this analysis and the proposedguidelines in this report, the polar caps wouldno longer fit the definition nor serve as valid ex-amples. Jakosky et al. (1993) (as well as others)have calculated that, at the present obliquity,the maximum summer temperatures of the icesurface typically reach about 200K at the pole(the north and south poles are similar in this re-spect) (Fig. 21). This temperature is consistentwith the amount of atmospheric water vaporobserved in the atmosphere during northernpolar summer, which is about 10 precipitablemicrons with a 10 km scale height. More watervapor is observed in the atmosphere during thenorth polar summer (�100 precipitable mi-crons), which is consistent with a surface icetemperature of �210K.
Contributing to the perpetual low tempera-ture is not only the latitude (hence low sun an-
gle) but also the high conductivity of solid ice.Polar ice is highly conducting material (e.g.,Paige and Keegan, 1994). Paige and Keegan(1994) determined the thermal inertia of the po-lar ice caps and found them to be in the neigh-borhood of 2,000 (meters-kilograms-secondsunits), which is consistent with solid ice. Whilesnow and firn might produce more insulatingmaterial, models and measurements of thermalinertia (Arthern et al., 2000) indicate that the po-lar ice is, indeed, highly conducting, and the an-nual skin depth is around 10 m. That means thatseasonal changes must heat up a slab 10 m thickto affect a significant change in surface temper-ature. The argument is particularly compellingat the north pole, which currently experiencescool summers at aphelion (and will continue todo so for many thousands of years). The southpolar cap, despite receiving more summer sun-light, is protected by a layer of highly reflectiveCO2 ice, which holds the surface temperature ata constant 145K. While these models include thehigh conductivity and heat capacity of ice, noneof these models takes into account the addi-tional latent heat loss when the sublimation rateis high—this would cause the present models tobe overly optimistic regarding the potential forwarming the polar cap material.
The warmest places on the polar caps mightbe steep slopes where the strata of the polar lay-ered deposits are visible and the ice may be ac-tively retreating. Equatorward-facing slopes or
MEPAG SPECIAL REGIONS SCIENCE ANALYSIS GROUP718
FIG. 21. Maximum summer time temperature of the icesurface at the pole (similar north and south). The scat-ter is due to eccentricity and perihelion variations. Thelargest surface temperature is roughly 205–210K. FromJakosky et al. (2003), using models in Jakosky et al. (1993).
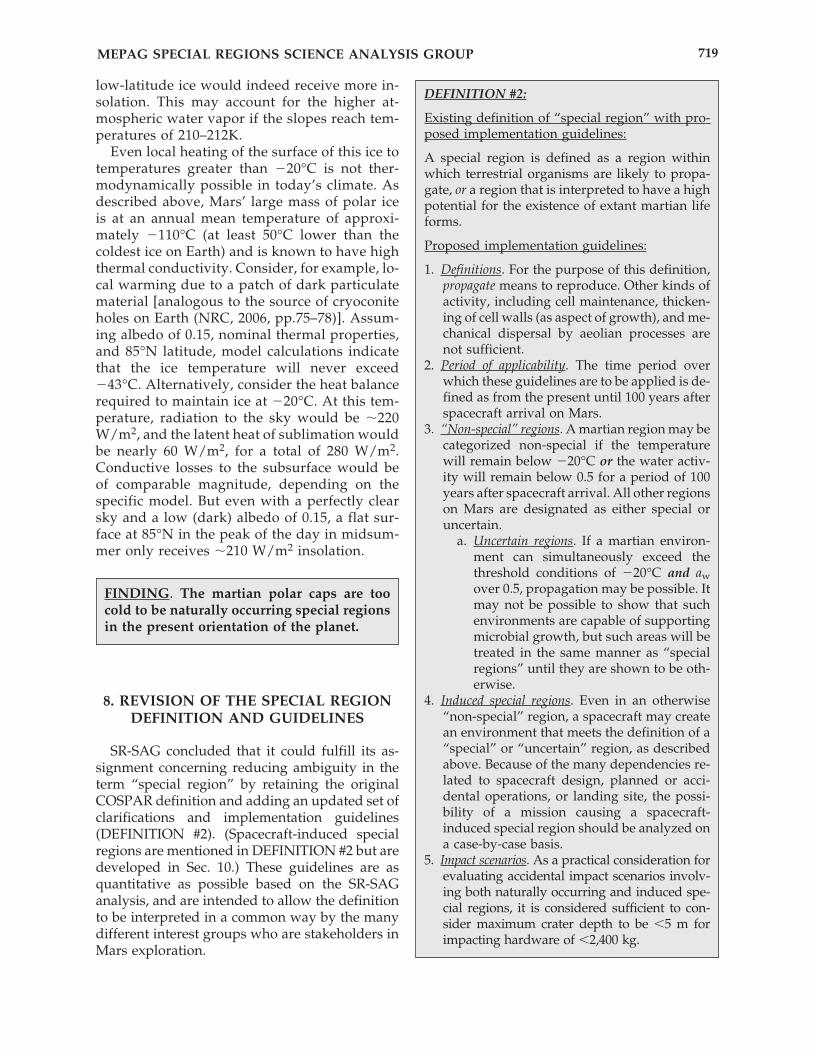
low-latitude ice would indeed receive more in-solation. This may account for the higher at-mospheric water vapor if the slopes reach tem-peratures of 210–212K.
Even local heating of the surface of this ice totemperatures greater than �20°C is not ther-modynamically possible in today’s climate. Asdescribed above, Mars’ large mass of polar iceis at an annual mean temperature of approxi-mately �110°C (at least 50°C lower than thecoldest ice on Earth) and is known to have highthermal conductivity. Consider, for example, lo-cal warming due to a patch of dark particulatematerial [analogous to the source of cryoconiteholes on Earth (NRC, 2006, pp.75–78)]. Assum-ing albedo of 0.15, nominal thermal properties,and 85°N latitude, model calculations indicatethat the ice temperature will never exceed�43°C. Alternatively, consider the heat balancerequired to maintain ice at �20°C. At this tem-perature, radiation to the sky would be �220W/m2, and the latent heat of sublimation wouldbe nearly 60 W/m2, for a total of 280 W/m2.Conductive losses to the subsurface would beof comparable magnitude, depending on thespecific model. But even with a perfectly clearsky and a low (dark) albedo of 0.15, a flat sur-face at 85°N in the peak of the day in midsum-mer only receives �210 W/m2 insolation.
8. REVISION OF THE SPECIAL REGIONDEFINITION AND GUIDELINES
SR-SAG concluded that it could fulfill its as-signment concerning reducing ambiguity in theterm “special region” by retaining the originalCOSPAR definition and adding an updated set ofclarifications and implementation guidelines(DEFINITION #2). (Spacecraft-induced specialregions are mentioned in DEFINITION #2 but aredeveloped in Sec. 10.) These guidelines are asquantitative as possible based on the SR-SAGanalysis, and are intended to allow the definitionto be interpreted in a common way by the manydifferent interest groups who are stakeholders inMars exploration.
MEPAG SPECIAL REGIONS SCIENCE ANALYSIS GROUP 719
FINDING. The martian polar caps are toocold to be naturally occurring special regionsin the present orientation of the planet.
DEFINITION #2:
Existing definition of “special region” with pro-posed implementation guidelines:
A special region is defined as a region withinwhich terrestrial organisms are likely to propa-gate, or a region that is interpreted to have a highpotential for the existence of extant martian lifeforms.
Proposed implementation guidelines:
1. Definitions. For the purpose of this definition,propagate means to reproduce. Other kinds ofactivity, including cell maintenance, thicken-ing of cell walls (as aspect of growth), and me-chanical dispersal by aeolian processes arenot sufficient.
2. Period of applicability. The time period overwhich these guidelines are to be applied is de-fined as from the present until 100 years afterspacecraft arrival on Mars.
3. “Non-special” regions. A martian region may becategorized non-special if the temperaturewill remain below �20°C or the water activ-ity will remain below 0.5 for a period of 100years after spacecraft arrival. All other regionson Mars are designated as either special oruncertain.
a. Uncertain regions. If a martian environ-ment can simultaneously exceed thethreshold conditions of �20°C and awover 0.5, propagation may be possible. Itmay not be possible to show that suchenvironments are capable of supportingmicrobial growth, but such areas will betreated in the same manner as “specialregions” until they are shown to be oth-erwise.
4. Induced special regions. Even in an otherwise“non-special” region, a spacecraft may createan environment that meets the definition of a“special” or “uncertain” region, as describedabove. Because of the many dependencies re-lated to spacecraft design, planned or acci-dental operations, or landing site, the possi-bility of a mission causing a spacecraft-induced special region should be analyzed ona case-by-case basis.
5. Impact scenarios. As a practical consideration forevaluating accidental impact scenarios involv-ing both naturally occurring and induced spe-cial regions, it is considered sufficient to con-sider maximum crater depth to be �5 m forimpacting hardware of �2,400 kg.
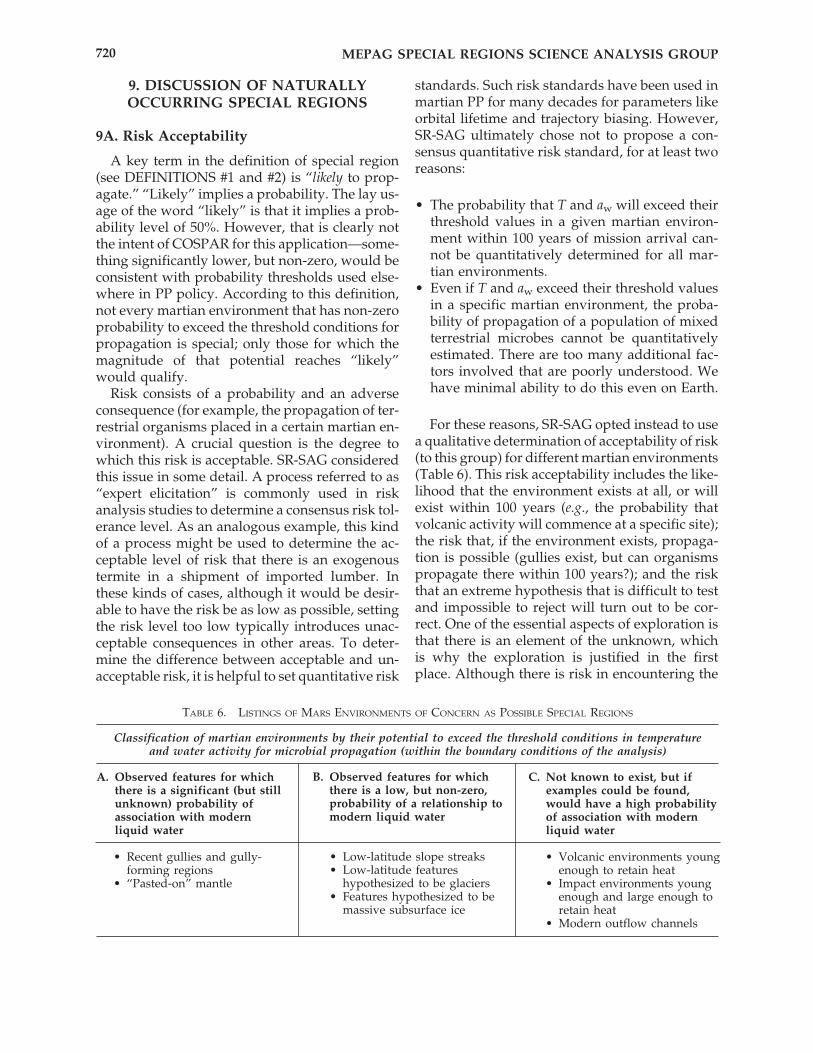
9. DISCUSSION OF NATURALLYOCCURRING SPECIAL REGIONS
9A. Risk Acceptability
A key term in the definition of special region(see DEFINITIONS #1 and #2) is “likely to prop-agate.” “Likely” implies a probability. The lay us-age of the word “likely” is that it implies a prob-ability level of 50%. However, that is clearly notthe intent of COSPAR for this application—some-thing significantly lower, but non-zero, would beconsistent with probability thresholds used else-where in PP policy. According to this definition,not every martian environment that has non-zeroprobability to exceed the threshold conditions forpropagation is special; only those for which themagnitude of that potential reaches “likely”would qualify.
Risk consists of a probability and an adverseconsequence (for example, the propagation of ter-restrial organisms placed in a certain martian en-vironment). A crucial question is the degree towhich this risk is acceptable. SR-SAG consideredthis issue in some detail. A process referred to as“expert elicitation” is commonly used in riskanalysis studies to determine a consensus risk tol-erance level. As an analogous example, this kindof a process might be used to determine the ac-ceptable level of risk that there is an exogenoustermite in a shipment of imported lumber. Inthese kinds of cases, although it would be desir-able to have the risk be as low as possible, settingthe risk level too low typically introduces unac-ceptable consequences in other areas. To deter-mine the difference between acceptable and un-acceptable risk, it is helpful to set quantitative risk
standards. Such risk standards have been used inmartian PP for many decades for parameters likeorbital lifetime and trajectory biasing. However,SR-SAG ultimately chose not to propose a con-sensus quantitative risk standard, for at least tworeasons:
• The probability that T and aw will exceed theirthreshold values in a given martian environ-ment within 100 years of mission arrival can-not be quantitatively determined for all mar-tian environments.
• Even if T and aw exceed their threshold valuesin a specific martian environment, the proba-bility of propagation of a population of mixedterrestrial microbes cannot be quantitativelyestimated. There are too many additional fac-tors involved that are poorly understood. Wehave minimal ability to do this even on Earth.
For these reasons, SR-SAG opted instead to usea qualitative determination of acceptability of risk(to this group) for different martian environments(Table 6). This risk acceptability includes the like-lihood that the environment exists at all, or willexist within 100 years (e.g., the probability thatvolcanic activity will commence at a specific site);the risk that, if the environment exists, propaga-tion is possible (gullies exist, but can organismspropagate there within 100 years?); and the riskthat an extreme hypothesis that is difficult to testand impossible to reject will turn out to be cor-rect. One of the essential aspects of exploration isthat there is an element of the unknown, whichis why the exploration is justified in the firstplace. Although there is risk in encountering the
MEPAG SPECIAL REGIONS SCIENCE ANALYSIS GROUP720
TABLE 6. LISTINGS OF MARS ENVIRONMENTS OF CONCERN AS POSSIBLE SPECIAL REGIONS
Classification of martian environments by their potential to exceed the threshold conditions in temperature and water activity for microbial propagation (within the boundary conditions of the analysis)
A. Observed features for whichthere is a significant (but stillunknown) probability ofassociation with modernliquid water
• Recent gullies and gully-forming regions
• “Pasted-on” mantle
B. Observed features for whichthere is a low, but non-zero,probability of a relationship tomodern liquid water
• Low-latitude slope streaks• Low-latitude features
hypothesized to be glaciers• Features hypothesized to be
massive subsurface ice
C. Not known to exist, but ifexamples could be found,would have a high probabilityof association with modernliquid water
• Volcanic environments youngenough to retain heat
• Impact environments youngenough and large enough toretain heat
• Modern outflow channels
unknown, we have learned from our experienceon Earth that, as scientific knowledge progres-sively increases, it is possible to develop strate-gies for carrying out exploration activity in a rel-atively safe (though not risk-free) way.
It is important to point out that the composi-tion of the SR-SAG team was chosen to be repre-sentative of the Mars scientific exploration com-munity. The team is entirely composed of Marsscientists, who are intensely interested in the fu-ture exploration of Mars. Although the judg-ments embodied in Table 6 describe SR-SAG’scomfort zone, there are clearly members of thecommunity who are both more and less conser-vative than this consensus position. The same istrue of other stakeholders in Mars exploration,and SR-SAG makes no representation regardingtheir views. Should a more conservative risk pos-ture be desired, there are several implementationoptions available, including sterilizing all space-craft sent to Mars, sterilizing spacecraft sent tocertain places on Mars, placing certain places onMars off-limits, and not flying spacecraft to Marsat all.
9B. Special Regions on Mars Within the Temporal and Spatial Limits of This Analysis
Environments that definitely exceed the thresholdconditions. SR-SAG cannot identify any regions onMars in which the threshold conditions for prop-agation are exceeded at the present time.
Environments of concern. Using the guidelinesdescribed in this document (DEFINITION #2),there are martian environments (based on un-derstanding as of April 2006) that might exceedthe threshold conditions for propagation of ter-restrial organisms. They are summarized in Table6. Of these, only the pasted-on mantle and thegully-forming regions are thought to be of highenough concern for exceeding the threshold con-ditions during the next 100 years that the SR-SAGbelieves they should be treated as special regionsfor the purposes of PP.
Gullies and pasted-on mantle of concern herewere formed at the same latitudes and on slopeswhere insolation conditions might (though this,too, is highly uncertain and inconclusive) be con-ducive to their development. The relationship be-tween gullies and pasted-on mantle is complex—
there might be more than one type of each, andthey may have asynchronous, or no, relationship.These are clearly an area for future research atten-tion. The following relationships are worth noting:
• There is a very real possibility that the gullieswere formed by the action of liquid water, andthe possibility (though less-well documentedand studied as of the present time) that“pasted-on” mantle provided that water (atleast in some cases).
• The gullies and pasted-on mantle both occur atmiddle latitudes.
Map distribution. Based on the analysis above,several boundaries of primary significance to in-terpreting the possible presence of special regionson Mars can be shown in map format (Fig. 22)(for additional details on the construction of thismap, see Appendix).
• BOUNDARY A: The 6 counts/s isopleth (us-ing summer data only) from the GRS instru-ment (Fig. 5).
• BOUNDARY B: The most equatorward posi-tion of the limit of ice stability at a depth of 5m, using the three planetary-scale thermody-namic models presented at the Mars WaterConference in February 2006. Each of thesemodels uses somewhat different methodologyand somewhat different input parameters, sothe derived results are somewhat different (al-though they are all based on the same physics).The SR-SAG is not in a position to judge which,if any, of these models is correct. However,they all have the same general form, with anequatorial belt where none of them shows thatice is stable within 5 m of the surface, northand south polar zones where all of them agreethere is continuous ice within 1 m of the sur-face, and an intermediate zone where ice is dis-continuous or within 1–5 m of the martian sur-face. For the purpose of Fig. 22, the equatorialand polar zones were mapped only where allthree models agreed; thus, the mid-latitudezone also incorporates all of the model-depen-dent uncertainty.
• BOUNDARY C: The observed distribution ofgullies and mid-latitude mantles has a rela-tively well-defined equatorward limit (seeFigs. 10 and 12). The map distribution of theroughened mantles of Mustard et al. (2001) is
MEPAG SPECIAL REGIONS SCIENCE ANALYSIS GROUP 721
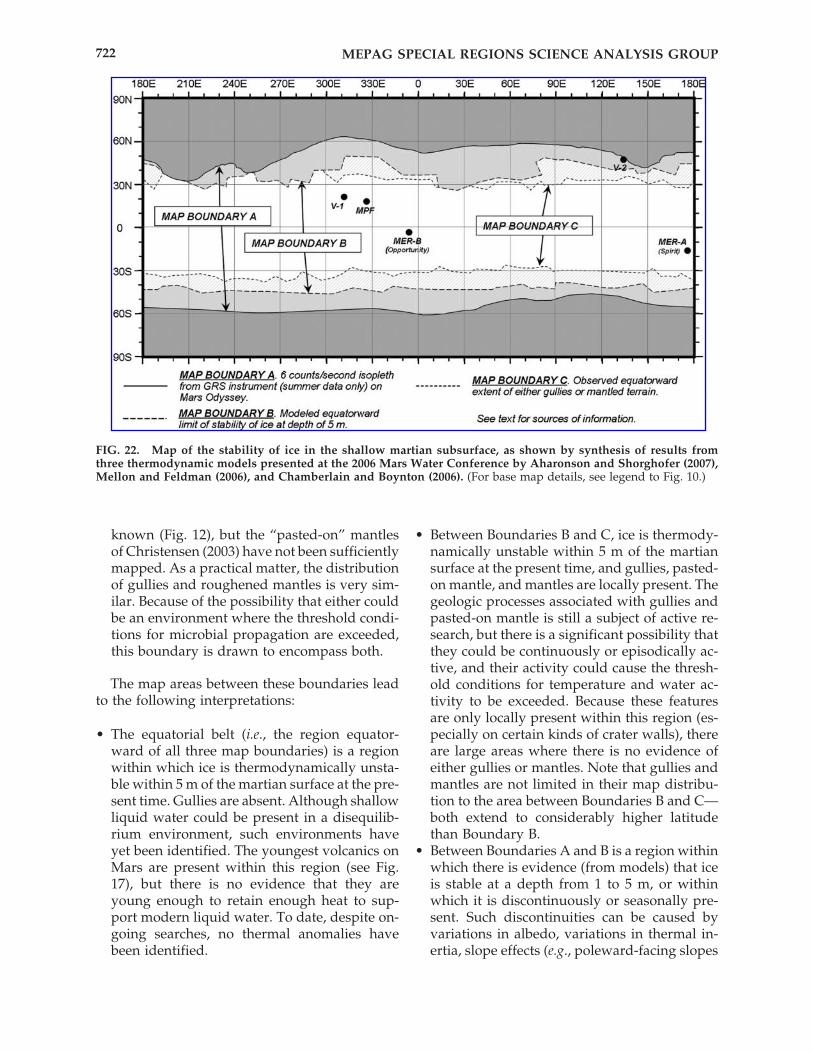
known (Fig. 12), but the “pasted-on” mantlesof Christensen (2003) have not been sufficientlymapped. As a practical matter, the distributionof gullies and roughened mantles is very sim-ilar. Because of the possibility that either couldbe an environment where the threshold condi-tions for microbial propagation are exceeded,this boundary is drawn to encompass both.
The map areas between these boundaries leadto the following interpretations:
• The equatorial belt (i.e., the region equator-ward of all three map boundaries) is a regionwithin which ice is thermodynamically unsta-ble within 5 m of the martian surface at the pre-sent time. Gullies are absent. Although shallowliquid water could be present in a disequilib-rium environment, such environments haveyet been identified. The youngest volcanics onMars are present within this region (see Fig.17), but there is no evidence that they areyoung enough to retain enough heat to sup-port modern liquid water. To date, despite on-going searches, no thermal anomalies havebeen identified.
• Between Boundaries B and C, ice is thermody-namically unstable within 5 m of the martiansurface at the present time, and gullies, pasted-on mantle, and mantles are locally present. Thegeologic processes associated with gullies andpasted-on mantle is still a subject of active re-search, but there is a significant possibility thatthey could be continuously or episodically ac-tive, and their activity could cause the thresh-old conditions for temperature and water ac-tivity to be exceeded. Because these featuresare only locally present within this region (es-pecially on certain kinds of crater walls), thereare large areas where there is no evidence ofeither gullies or mantles. Note that gullies andmantles are not limited in their map distribu-tion to the area between Boundaries B and C—both extend to considerably higher latitudethan Boundary B.
• Between Boundaries A and B is a region withinwhich there is evidence (from models) that iceis stable at a depth from 1 to 5 m, or withinwhich it is discontinuously or seasonally pre-sent. Such discontinuities can be caused byvariations in albedo, variations in thermal in-ertia, slope effects (e.g., poleward-facing slopes
MEPAG SPECIAL REGIONS SCIENCE ANALYSIS GROUP722
FIG. 22. Map of the stability of ice in the shallow martian subsurface, as shown by synthesis of results fromthree thermodynamic models presented at the 2006 Mars Water Conference by Aharonson and Shorghofer (2007),Mellon and Feldman (2006), and Chamberlain and Boynton (2006). (For base map details, see legend to Fig. 10.)
get less sun that equatorward-facing slopes).The longitudinal variation in the position ofBoundary B is primarily related to variationsin thermal inertia of the martian near-surfacematerials. The worst-case crash scenarioswithin this region are potentially capable ofpenetrating to ice.
• The area poleward of Boundary A representsthe polar regions, where the GRS data havebeen interpreted to show essentially continu-ous shallow frozen ground and ice caps at eachpole. It is too cold for naturally occurring liq-uid water at any time during the year.
10. DISCUSSION OF SPACECRAFT-INDUCED SPECIAL REGIONS
The analysis and discussion to this point havefocused on identification of naturally occurringenvironments on Mars within which terrestriallife forms might be able to propagate. To com-plete the analysis, consideration was given towhether the arrival of a spacecraft could inducea special region on Mars even when one did notexist at the landing site beforehand. Spacecraftare capable of generating heat and carrying liq-uid water, both of which could have an effect onthe threshold conditions for propagation. Mostimportantly, in regions where there is (or may be)ice present, it is conceivable that local heatingwould result in the formation of liquid water forsome amount of time. If conditions were createdthat exceeded the temperature and water activitythresholds for significant periods, replication ofspacecraft-borne terrestrial bioburden could notbe ruled out.
A series of representative scenarios for differ-ent mission types, including orbiters, landers/rovers, balloons, and drill missions were consid-ered, for both nominal and non-nominal (crash)scenarios. Also considered were different opera-tional factors: descent engine exhaust plumes,power/heat sources, roving into special regions,on-surface activities [e.g., sampling (scoops, drills,rock abrasion tools, melt probes)] and burn-up/break-up scenarios for discarded descenthardware.
The complexity of considering all the potentialscenarios with respect to induced special regionsled to the conclusion that general categorizationis not possible or practicable. The recommenda-tion, therefore, is that analysis of spacecraft-in-
duced special regions for Mars missions shouldbe done on a case-by-case basis, with mission pro-ject teams being required to produce somethingequivalent to a “Mars environmental impact as-sessment” as part of the early stage mission plan-ning. (Such an analysis may form part of the sup-port documentation for the mission certificationrequest.)
The use of radioisotope thermal generators onspacecraft will necessitate an extended analysis,since they can act as a perennial heat source, cre-ating temperatures local to the radioisotope ther-mal generator above the threshold temperaturecondition. In the case of a non-nominal landing,resulting in the co-location of near-surface ice, anradioisotope thermal generator, and contami-nated spacecraft parts, it would be possible tohave a disequilibrium condition for manymonths, exceeding the proposed threshold con-ditions for propagation of terrestrial organisms.
A key factor in the assessment of spacecraft-in-duced environmental changes is the minimumduration for the conditions to be above the thresh-olds before qualifying as a special region and,therefore, a PP concern. At one extreme, the pres-sure or friction associated with sampling, for ex-ample with a scoop, may cause melting of ice inthe time frame of seconds or less. At the other ex-treme, longer-duration increases in temperatureassociated with spacecraft activity can be pre-dicted, for example, deliberate or accidental con-tact of a perennial heat source with the surface.In this scenario, the local ice will act as a heat sink,dissipating heat rapidly, but there may be alonger period of time (up to years) where the tem-perature and/or aw thresholds are exceeded.
It is recognized that microbial propagation isnot an instantaneous process—a finite amount oftime above the temperature and aw thresholds isnecessary for the mechanics of biological propa-gation to take place. As an example, food spoilagein a refrigerator demonstrates that microbes areactive at low temperatures but are slow growing,with the amount of time for spoilage dependenton temperature. Unfortunately, for the analysisof growth rates pertinent to spacecraft-inducedspecial regions, there are not the same volumeand quality of data to draw from as for the analy-sis of the temperature and aw thresholds pre-sented in Sec. 5 above, and while there are abun-dant data on growth responses of organisms totemperature, little is available in the range of in-terest to this problem. It was possible, however,
MEPAG SPECIAL REGIONS SCIENCE ANALYSIS GROUP 723
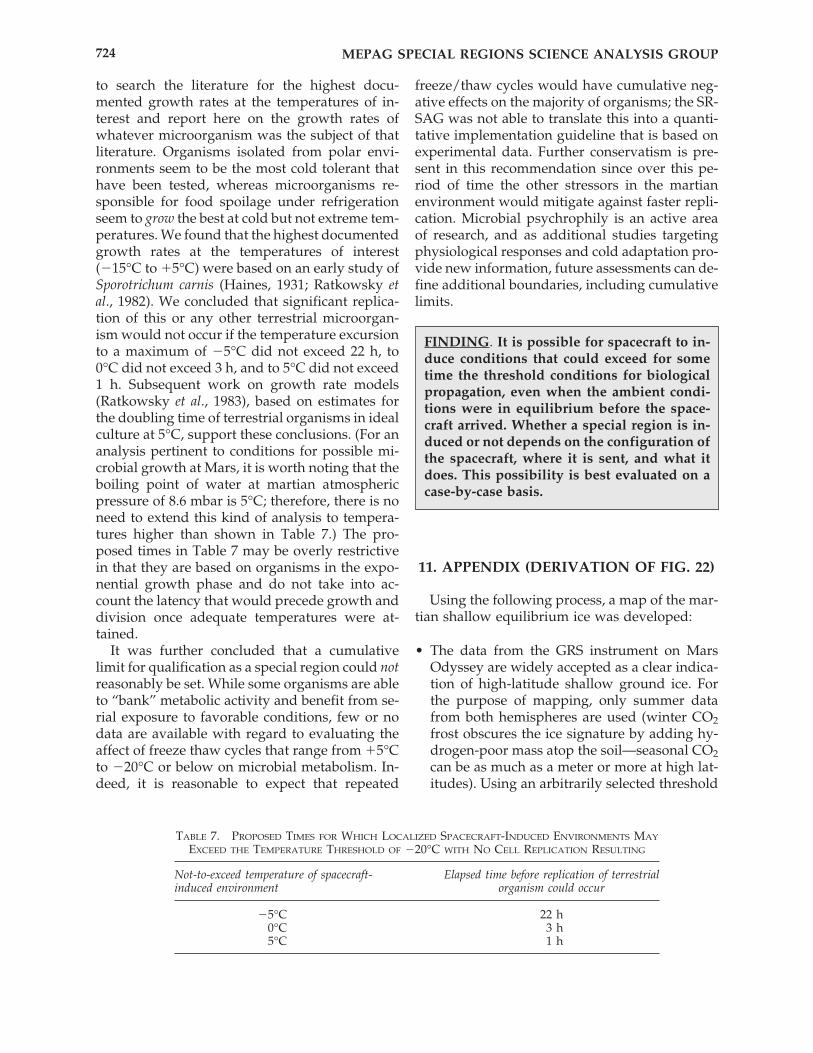
to search the literature for the highest docu-mented growth rates at the temperatures of in-terest and report here on the growth rates ofwhatever microorganism was the subject of thatliterature. Organisms isolated from polar envi-ronments seem to be the most cold tolerant thathave been tested, whereas microorganisms re-sponsible for food spoilage under refrigerationseem to grow the best at cold but not extreme tem-peratures. We found that the highest documentedgrowth rates at the temperatures of interest(�15°C to �5°C) were based on an early study ofSporotrichum carnis (Haines, 1931; Ratkowsky etal., 1982). We concluded that significant replica-tion of this or any other terrestrial microorgan-ism would not occur if the temperature excursionto a maximum of �5°C did not exceed 22 h, to0°C did not exceed 3 h, and to 5°C did not exceed1 h. Subsequent work on growth rate models(Ratkowsky et al., 1983), based on estimates forthe doubling time of terrestrial organisms in idealculture at 5°C, support these conclusions. (For ananalysis pertinent to conditions for possible mi-crobial growth at Mars, it is worth noting that theboiling point of water at martian atmosphericpressure of 8.6 mbar is 5°C; therefore, there is noneed to extend this kind of analysis to tempera-tures higher than shown in Table 7.) The pro-posed times in Table 7 may be overly restrictivein that they are based on organisms in the expo-nential growth phase and do not take into ac-count the latency that would precede growth anddivision once adequate temperatures were at-tained.
It was further concluded that a cumulativelimit for qualification as a special region could notreasonably be set. While some organisms are ableto “bank” metabolic activity and benefit from se-rial exposure to favorable conditions, few or nodata are available with regard to evaluating theaffect of freeze thaw cycles that range from �5°Cto �20°C or below on microbial metabolism. In-deed, it is reasonable to expect that repeated
freeze/thaw cycles would have cumulative neg-ative effects on the majority of organisms; the SR-SAG was not able to translate this into a quanti-tative implementation guideline that is based onexperimental data. Further conservatism is pre-sent in this recommendation since over this pe-riod of time the other stressors in the martian environment would mitigate against faster repli-cation. Microbial psychrophily is an active areaof research, and as additional studies targetingphysiological responses and cold adaptation pro-vide new information, future assessments can de-fine additional boundaries, including cumulativelimits.
11. APPENDIX (DERIVATION OF FIG. 22)
Using the following process, a map of the mar-tian shallow equilibrium ice was developed:
• The data from the GRS instrument on MarsOdyssey are widely accepted as a clear indica-tion of high-latitude shallow ground ice. Forthe purpose of mapping, only summer datafrom both hemispheres are used (winter CO2frost obscures the ice signature by adding hy-drogen-poor mass atop the soil—seasonal CO2can be as much as a meter or more at high lat-itudes). Using an arbitrarily selected threshold
MEPAG SPECIAL REGIONS SCIENCE ANALYSIS GROUP724
TABLE 7. PROPOSED TIMES FOR WHICH LOCALIZED SPACECRAFT-INDUCED ENVIRONMENTS MAY
EXCEED THE TEMPERATURE THRESHOLD OF �20°C WITH NO CELL REPLICATION RESULTING
Not-to-exceed temperature of spacecraft- Elapsed time before replication of terrestrialinduced environment organism could occur
�5°C 22 h0°C 3 h5°C 1 h
FINDING. It is possible for spacecraft to in-duce conditions that could exceed for sometime the threshold conditions for biologicalpropagation, even when the ambient condi-tions were in equilibrium before the space-craft arrived. Whether a special region is in-duced or not depends on the configuration ofthe spacecraft, where it is sent, and what itdoes. This possibility is best evaluated on acase-by-case basis.
value of 6 counts/s, the region of permanentshallow ground ice can be shown. Note thatpoleward of that boundary, there are fewerthan 6 counts/s (the epithermal neutrons godown as hydrogen goes up) and that the posi-tion of the 6 counts/s threshold value shouldbe considered blurred on a 600 km scale be-cause of the GRS neutron footprint.
• Several equilibrium thermodynamic modelsfor Mars have been calculated at a planetaryscale. These models predict the distribution ofice equatorward of the GRS 6 counts/s thresh-old. Because the GRS cannot detect deeper thanabout a meter, this gives us a way to model theice distribution to deeper depths. At the 2006Mars Water Conference (http://es.ucsc.edu/~fnimmo/website/mars2006.html), the mod-els developed by three independent researchteams (Chamberlain and Boynton, 2006; Mel-lon and Feldman, 2006; Aharonson andSchorghofer, 2007) were presented. Thesemodels use somewhat different methodologyand inputs, but the results have a very similarstructure. In each case, there is a north andsouth mid-latitude belt that can be thought ofas discontinuous ice, and/or a zone of ice lessdetectable by GRS because of its depth, alongwith an equatorial belt with no near-surfaceice. The position of the mid-latitude belts issomewhat different in the three models. To al-low for appropriate conservatism, a boundarywas drawn (Boundary B on Fig. 22) that en-compasses the most equatorward indication ofice in any of the models. Thus, Boundary B alsoincorporates model-dependent uncertainty.
• Equilibrium thermodynamic models show thatthe depth to the top of the ice table increasesabruptly at about the position of the dashedline. This has been studied extensively (e.g.,Farmer and Doms, 1979; Paige, 1992). It is typ-ical in model results for the transition from 5m to infinite to occur in less than 1° of latitude.In order to further represent appropriate con-servatism, the north and south dashed lineswere each shifted 1° of latitude towards theequator, so as to encompass possible ice within5 m of the surface.
12. ACKNOWLEDGMENTS
Early drafts of this report were presented attwo conferences/workshops, and the discussions
at those meetings helped clarify many issues: TheMars Water Workshop (February 23–24, 2006, atAmes Research Center) and the Mars PlanetaryProtection Working Group (March 2–3, 2006, atAmes Research Center). The following Mars sci-entists contributed data or ideas to this analysis:Oded Aharonson (California Institute of Tech-nology), Ralph Milliken (Brown University), Cyn-thia Phillips (SETI Institute), Aaron Zent (AmesResearch Center), Matt Chamberlain (PlanetaryScience Institute), Michael Carr (U.S. GeologicalSurvey, Retired), Aharon Oren (Hebrew Univer-sity of Jerusalem), Phil Christensen (Arizona StateUniversity), and Bruce Jakosky (University ofColorado, Boulder). Valuable review commentswere received from Margaret Race, Deneb Kar-entz, Pericles Stabekis, John Rummel, GerhardKminek, Christopher Chyba, Steve Clifford, andMichael Carr. Although the reviewers listed pro-vided many constructive comments and sugges-tions, they were not asked to endorse the con-clusions or recommendations of the final report.
13. ABBREVIATIONS
aw, water activity; COSPAR, Committee onSpace Research; GRS, Gamma Ray Spectrometer;HRSC, High Resolution Stereo Camera; Ma, agein millions of years; MEPAG, Mars ExplorationProgram Analysis Group; MER, Mars Explora-tion Rover; MGS, Mars Global Surveyor; MOC,Mars Orbiter Camera; MOLA, Mars OrbitalLaser Altimeter; NASA, National Aeronauticsand Space Administration; NRC, National Re-search Council; PP, planetary protection; SR-SAG, Special Regions–Science Advisory Group;THEMIS, Thermal Emissions Imaging System;UV, ultraviolet.
14. REFERENCES
Abramov, O. and Kring, D.A. (2005a) Impact-induced hy-drothermal activity on early Mars. J. Geophys. Res. 110,doi:10.1029/2005JE002453.
Abramov, O. and Kring, D.A. (2005) Numerical modelingof an impact-induced hydrothermal system at the Sud-bury crater. J. Geophys. Res. Planets 109 (E10), E10007.
Aharonson, O. and Schorghofer, N. (2007) Subsurface iceon Mars with rough topography. J. Geophys. Res. (inpress).
Aharonson, O., Schorghofer, N., and Gerstell, M.F. (2003)Slope streak formation and dust deposition rates on
MEPAG SPECIAL REGIONS SCIENCE ANALYSIS GROUP 725
Mars. J. Geophys. Res. 108 (E12), 5138, doi:10.1029/2003JE002123.
Appelbaum, J. and Flood, D.J. (1990) Solar radiation onMars. Solar Energy 45, 353–363.
Arthern, R.J., Winebrenner, D.P., and Waddington, E.D.(2000) Densification of water ice deposits on the resid-ual north polar cap of Mars. Icarus 144, 367–381.
Baker, V.R. (2001) Water and the martian landscape. Na-ture 412, 228–236, doi:10.1038/35084172.
Bakermans, C., Tsapin, A.I., Souza-Egipsy, V., Gilichin-sky, D.A., and Nealson, K.H. (2003) Reproduction andmetabolism at �10°C of bacteria isolated from Siberianpermafrost. Environ. Microbiol. 5, 321–326.
Balme, M., Mangold, N., Baratoux, D., Costard, F., Gos-selin, M., Masson, P., Pinet, P., and Neukum, G. (2006)Orientation and distribution of recent gullies in thesouthern hemisphere of Mars: observations from HighResolution Stereo Camera/Mars Express (HRSC/MEX)and Mars Orbiter Camera/Mars Global Surveyor(MGS/MOC) data. J. Geophys. Res. 111, E05001, doi:10.1029/2005JE002607.
Baratoux, D., Mangold, N., Forget, F., Cord, A., Pinet, P.,Daydou, Y., Jehl, A., Masson, P., Neukum, G., and theHRSC Co-investigator Team (2006) The role of thewind-transported dust in slope streaks activity: evi-dence from the HRSC data. Icarus 183, 30–45.
Barlow, N.G. (2004) Martian subsurface volatile concentra-tions as a function of time: clues from layered ejectacraters. Geophys. Res. Lett. 31, doi:10.1029/2003GL019075.
Barlow, N.G. (2005) A review of Martian impact craterejecta structures and their implications for target prop-erties. In Geological Society of America Special Paper 384:Large Meteorite Impacts III, edited by T. Kenkmann, F.Hörz, and A. Deutsch, Geological Society of America,Boulder, CO, pp. 433–442.
Barlow, N.G., Boyce, J.M., Costard, F.M., Craddock, R.A.,Garvin, J.B., Sakimoto, S.E.H., Kuzmin, R.O., Roddy,D.J., and Soderblom, L.A. (2000) Standardizing thenomenclature of martian impact crater ejecta mor-phologies. J. Geophys. Res. 105, 26733–26738.
Basilevsky, A.T., Litvak, M.L., Mitrofanov, I.G., Boynton,W.V., Saunders, R.S., and Head, J.W. (2003) Search fortraces of chemically bound water in the martian sur-face layer based on HEND measurements onboard the2001 Mars Odyssey Spacecraft. Solar System Res. 37,387–397, doi:10.1023/A:1026022912786. Available at:http://dx.doi.org/10.1023/A:1026022912786.
Basilevsky, A.T., Werner, S., Neukum, G., van Gasselt, S.,Head, J.W., and Ivanov, B.A. (2006) Potential life habi-tat at the eastern flank of the Olympus Mons seen inMEX HRSC and MGS MOC images of Mars [abstract1179]. In 37th Lunar and Planetary Science Conference Ab-stracts, LPI Contribution No. 1303, Lunar and PlanetaryInstitute, Houston.
Belnap, J., Kaltenecker, J.H., Rosentreter, R., Williams, J.,Leonard, S., and Eldridge, D. (2001) Biological Soil Crusts:Ecology and Management, Technical Reference 1730-2, De-partment of the Interior, Washington, DC, p. 118.
Berman, D.C., Hartmann, W.K., Crown, D.A., and Baker,V.R. (2005) The role of arcuate ridges and gullies in the
degradation of craters in the Newton Basin region ofMars. Icarus 178, 465–486, doi:10.1016/j.icarus/2005.05.011.
Bibring, J.-P., Langevin, Y., Poulet, F., Gendrin, A.,Gondet, B., Berthé, M., Soufflot, A., Drossart, P.,Combes, M., Bellucci, G., Moroz, V., Mangold, N.,Schmitt, B., and the OMEGA Team (2004) Perennial wa-ter ice identified in the south polar cap of Mars. Nature428, 627–630, doi:10.1038/nature02461.
Biemann, K. and Lavoie, J.M. (1979) Some final conclu-sions and supporting experiments related to the searchfor organic compounds on the surface of Mars. J. Geo-phys. Res. 84, 8385–8390.
Biemann, K., Oro, J., Toulmin, P., III, Orgel, L.E., Nier,A.O., Anderson, D.M., Simmonds, P.G., Flory, D., Diaz,A.V., Rushneck, D.R., Biller, J.E., and Lafleur, A.L.(1977) The search for organic substances and inorganicvolatile compounds in the surface of Mars. J. Geophys.Res. 82, 4641–4657.
Breezee, J., Cady, N., and Staley, J.T. (2004) Subfreezinggrowth of the sea ice bacterium. Psychromonas ingra-hamii. Microb. Ecol. 47, 300–304.
Brown, A.D. (1976) Microbial water stress. Bacteriol. Rev.40, 803–846.
Brown, A.D. (1990) Microbial Water Stress: Physiology, Prin-ciples and Perspectives, John Wiley and Sons, Chichester,UK.
Burr, D.M., Grier, J.A., McEwen, A.S., and Keszthelyi, L.P.(2002) Repeated aqueous flooding from the CerberusFossae: evidence for very recently extant, deep ground-water on Mars. Icarus 159, 53–73.
Burt, D.M. and Knauth, L.P. (2002) Eutectic brines onMars: origin and possible relation to young seepage fea-tures. Icarus 158, 267–271, doi:10.1006/icar.2002.6866.
Carpenter, E.J., Lin, S., and Capone, D.G. (2000) Bacterialactivity in South Pole snow. Appl. Environ. Microbiol. 66,4514–4517.
Carr, M.H. (1996) Water on Mars, Oxford University Press,New York, 229 pp.
Carr, M.H. (2001) Mars Global Surveyor observations ofMartian fretted terrain. J. Geophys. Res. 106(E10), 23571–23594.
Carr, M.H., Greeley, R., Blasius, K.R., Guest, J.E., andMurray, J.B. (1977) Some martian volcanic features asviewed from the Viking orbiters. J. Geophys. Res. 82,3985–4015.
Chamberlain, M.A. and Boynton, W.V. (2006) Responseof Martian ground ice to orbit-induced climate change[abstract]. Posted February 2006 in Mars Water Work-shop, February 23–24, 2006. Available at: http://es.ucsc.edu/~fnimmo/website/mars2006.html.
Christensen, P.R. (2003) Formation of recent martian gul-lies through melting of extensive water-rich snow de-posits. Nature 422, 45–48, doi:10.1038/nature01436.
Christensen, P.R., Jakosky, B.M., Kieffer, H.H., Malin,M.C., McSween, H.Y., Jr., Nealson, K., Mehall, G.L., Sil-verman, S.H., Ferry, S., Caplinger, M., and Ravine, M.(2004) The Thermal Emission Imaging System(THEMIS) for the Mars 2001 Odyssey Mission. SpaceSci. Rev. 110, 85–130.
MEPAG SPECIAL REGIONS SCIENCE ANALYSIS GROUP726
Christner, B.C. (2002) Incorporation of DNA and proteinprecursors into macromolecules by bacteria at �15°C.Appl. Environ. Microbiol. 68, 6435–6438.
Clark, B.C., Baird, A.K., Weldon, R.J., Tsusaki, D.M., Schnabel, L., and Candelaria, M.P. (1982) Chemicalcomposition of martian fines. J. Geophys. Res. 87, 10059–10067.
Clifford, S.M. (1991) The role of thermal vapor diffusionin the subsurface hydrological evolution of Mars. Geo-phys. Res. Lett. 18, 2055–2058.
Clifford, S.M. (1993) A model for the hydrologic and cli-matic behavior of water on Mars. J. Geophys. Res. 98,10973–11016.
Clow, G.D. (1987) Generation of liquid water on Marsthrough the melting of a dusty snowpack. Icarus 72,95–127.
Cockell, C.S., Catling, D.C., Davis, W.L., Snook, K., Kep-ner, R.L., Lee, P., and McKay, C.P. (2000) The ultravio-let environment of Mars: biological implications past,present, and future. Icarus 146, 343–359.
COSPAR (2005) COSPAR Planetary Protection Policy (20October 2002; amended 24 March 2005). Available at:http://www.cosparhq.org/scistr/PPPolicy.htm.
Costard, F., Forget, F., Mangold, N., and Peulvast, J.P.(2002) Formation of recent martian debris flows bymelting of near-surface ground ice at high obiquity. Sci-ence 295, 110–113, doi:10.1126/science.1066698.
Croft, S.K. (1985) The scaling of complex craters. J. Geo-phys. Res. 90, C828–C842.
Csonka, L.N. (1989) Physiological and genetic responsesof bacteria to osmotic stress. Microbiol. Rev. 53, 121–147.
DeVincenzi, D.L., Race, M.S., and Klein, J.P. (1998) Plan-etary protection, sample return missions and Mars ex-ploration: history, status, and future needs. J. Geophys.Res. 103, 28577–28585.
Edgett, K.S., Malin, M.C., Williams, R.M.E., and Davis,S.D. (2003) Polar- and middle-latitude martian gullies:a view from MGS MOC after 2 Mars years in the map-ping orbit [abstract 1038]. In 34th Lunar and PlanetaryScience Conference Abstracts, LPI Contribution No. 1156,Lunar and Planetary Institute, Houston.
Farmer, C.B. (1976) Liquid water on Mars. Icarus 28,279–289.
Farmer, C.B. and Doms, P.E. (1979) Global and seasonalvariation of water vapor on Mars and the implicationsfor permafrost. J. Geophys. Res. 84, 2881–2888.
Feldman, W.C., Mellon, M.T., Nelli, S., Murphy, J.R., Mau-rice, S., and Gasnault, O. (2005) Time scales for dis-charge of near-equatorial WEH on Mars: implicationsfor a recent climate change [abstract P34A-06]. EosTrans. AGU 86(52), Fall Meet. Suppl.
Ferguson, H.M. and Lucchitta, B.K. (1984) Dark streakson talus slopes, Mars [abstract]. In Reports of the Plane-tary Geology Program 1983, NASA Technical Memoran-dum TM-86246, NASA, Washington, DC, pp. 188–190.
Ferris, J.C., Dohm, J.M., Baker, V.R., and Maddock, T., III(2002) Dark slope streaks on Mars: are aqueousprocesses involved? Geophys. Res. Lett. 29, doi:10.1029/2002GL014936.
Forget, F., Haberle, R.M., Montmessin, F., Levrard, B., and
Head, J.W. (2006) Formation of glaciers on Mars by at-mospheric precipitation at high obliquity. Science 311,368–371, doi:10.1126/science.1120335.
Garvin, J.B., Sakimoto, S.E.H., Frawley, J.J., and Schnet-zler, C. (2000) North polar region craterforms on Mars:geometric characteristics from the Mars Orbiter LaserAltimeter. Icarus 144, 329–352.
Gilichinsky, D., Rivkina, E., Shcherbakova, V., Lauri-navichus, K., and Tiedje, J. (2003) Supercooled waterbrines within permafrost—an unknown ecologicalniche for microorganisms: a model for astrobiology. As-trobiology 3, 331–341.
Gilmore, M.S. and Phillips, E.L. (2002) Role of aquicludesin formation of martian gullies. Geology 30, 1107–1110,doi:10.1130/0091-7613(2002)030�1107:ROAIFO�2.0.CO;2.
Goldspiel, J.M. and Squyres, S.W. (2000) Groundwatersapping and valley formation on Mars. Icarus 148,176–192.
Golombek, M.P., Grant, J.A., Parker, T.J., Kass, D.M.,Crisp, J.A., Squyres, S.W., Haldemann, A.F.C., Adler,M., Lee, W., Bridges, N.T., Arvidson, R.E., Carr, M.H.,Kirk, R.L., Knocke, P.C., Roncoli, R.B., Weitz, C.M.,Schofield, J.T., Zurek, R.W., Christensen, P.R., Ferga-son, R.L., Anderson, F.S., and Rice, J.W., Jr. (2003) Se-lection of the Mars Exploration Rover landing sites. J.Geophys. Res. 108(E12), 8072, doi:10.1029/2003JE002074.
Grant, W.D. (2004) Life at low water activity. Philos. Trans.R. Soc. Lond. Biol. 359, 1249–1267.
Greeley, R. and Spudis, P.D. (1981) Volcanism on Mars.Rev. Geophys. Space Physics 19, 13–41.
Griffin, D.M. (1981) Water potential as a selective factorin the microbial ecology of soils. In Water Potential Re-lations in Soil Microbiology, edited by J.F. Parr and W.R.Gardner, Soil Science Society of America, Madison, WI,pp. 119–140.
Haberle, R.M., McKay, C.P., Schaeffer, J., Cabrol, N.A.,Grin, E.A., Zent, A.P., and Quinn, R. (2001) On the pos-sibility of liquid water on present-day Mars. J. Geophys.Res. 106, 23317–23326.
Haberle, R.M., Murphy, J.R., and Schaeffer, J. (2003) Or-bital change experiments with a Mars general circula-tion model. Icarus 161, 66–89.
Haines, R.B. (1931) The influence of temperature on therate of growth of Sporotrichum carnis from �10 to 30°C.J. Exp. Biol. 8, 379–388.
Harris, R.F. (1981) The effect of water potential on mi-crobial growth and activity. In Water Potential Relationsin Soil Microbiology, edited by J.F. Parr and W.R. Gard-ner, Soil Science Society of America, Madison, WI, pp.23–95.
Hartmann, W.K. and Berman, D.C. (2000) Elysium Plani-tia lava flows: crater count chronology and geologicalimplications. J. Geophys. Res. 105, 15011–15026.
Hartmann, W.K. and Neukum, G. (2001) Crateringchronology and the evolution of Mars. Space Sci. Rev.96, 165–194.
Hartmann, W.K., Thorsteinsson, T., and Sigurdson, F.(2003) Martian hillside gullies and Icelandic analogs.Icarus 162, 259–277, doi:10.1016/S0019-1035(02)00065-9.
MEPAG SPECIAL REGIONS SCIENCE ANALYSIS GROUP 727
Head, J.W. and Marchant, D.R. (2003) Cold-based moun-tain glaciers on Mars: Western Arsia Mons. Geology 37,641–644.
Head, J.W. and Wilson, L. (2002) Mars: a review and syn-thesis of general environments and geological settingsof magma-H2O interactions. In Geological Society SpecialPublication 202: Volcano-Ice Interaction on Earth and Mars,edited by J.L. Smellie and M.G. Chapman, GeologicalSociety, London, pp. 27–57.
Head, J.W., Mustard, J.F., Kreslavsky, M.A., Milliken, R.E.and Marchant, D.R. (2003a) Recent ice ages on Mars.Nature 426, pp. 797–802, doi:10.1038/nature02114.
Head, J.W., Wilson, L., and Mitchell, K.L. (2003b) Gener-ation of recent massive water floods at Cerberus Fos-sae, Mars by dike emplacement, cryospheric cracking,and confined aquifer groundwater release. Geophys.Res. Lett. 30, doi:10.1029/2003GL017135.
Head, J.W., Neukum, G., Jaumann, R., Hiesinger, H.,Hauber, E., Carr, M., Masson, P., Foing, B., Hoffmann,H., Kreslavsky, M., Werner, S., Milkovich, S., van Gas-selt, S., and the HRSC Co-Investigator Team (2005)Tropical to mid-latitude snow and ice accumulation,flow and glaciation on Mars. Nature 434, 346–351.
Head, J.W., Nahm, A.L., Marchant, D.R., and Neukum,G. (2006a) Modification of the dichotomy boundary onMars by Amazonian mid-latitude regional glaciation.Geophys. Res. Lett. 33, doi:10.1029/2005GL024360.
Head, J.W., Marchant, D.R., Agnew, M.C., Fassett, C.I.,and Kreslavsky, M.A. (2006b) Extensive valley glacierdeposits in the northern mid-latitudes of Mars: evi-dence for Late Amazonian obliquity-driven climatechange. Earth Planet. Sci. Lett. 241, 663–671.
Hecht, M.H. (2002) Metastability of liquid water on Mars.Icarus 156, 373–386.
Heldmann, J.L. and Mellon, M.T. (2004) Observations ofmartian gullies and constraints on potential formationmechanisms. Icarus 168, 285–304, doi:10.1016/j.Icarus.2003.11.024.
Heldmann, J.L., Toon, O.B., Pollard, W.H., Mellon, M.T.,Pitlick, J., McKay, C.P., and Andersen, D.T. (2005) For-mation of martian gullies by the action of liquid waterflowing under current martian environmental conditions.J. Geophys. Res. 110, E05004, doi:10.1029/2004JE002261.
Hock, A.N. and Paige, D.A. (2006) Ground ice temperatureson Mars-implications for habitability [abstract]. PostedFebruary 2006 in Mars Water Workshop February 23–24,2006. Available at: http://es.ucsc.edu/~fnimmo/website/mars2006.html.
Hoffman, N. (2002) Active polar gullies on Mars and therole of carbon dioxide. Astrobiology 2, 313–323.
Holsapple, K.A. (1993) The scaling of impact processes inplanetary sciences. Annu. Rev. Earth Planet. Sci. 21,333–373.
Horowitz, N.H., Cameron, R.E., and Hubbard, J.S. (1972)Microbiology of the dry valleys of Antarctica. Science176, 242–245.
Ivanov, B.A. and Deutsch, A. (1999) Sudbury impactevent; cratering mechanics and thermal history. In Geo-logical Society of America Special Publication 339: LargeMeteorite Impacts and Planetary Evolution; II, edited by
B.O. Dressler and V.L. Sharpton, Geological Society ofAmerica, Boulder, CO, pp. 389–397.
Jakosky, B.M. and Carr, M.H. (1985) Possible precipita-tion of ice at low latitudes of Mars during period ofhigh obliquity. Nature 315, 559–561.
Jakosky, B.M., Henderson, B.G., and Mellon, M.T. (1993)The Mars water cycle at other epochs: recent history ofthe polar caps and layered terrain. Icarus 102, 286–297.
Jakosky, B.M., Mellon, M.T., Kieffer, H.H., Christensen,P.R., Varnes, E.S., and Lee, S.W. (2000) The thermal in-ertia of Mars from the Mars Global Surveyor ThermalEmission Spectrometer. J. Geophys. Res. 105, 9643–9652.
Jakosky, B.M., Nealson, K.H., Bakermans, C., Ley, R.E.,and Mellon, M.T. (2003) Subfreezing activity of mi-croorganisms and the potential habitability of Mars’ po-lar regions. Astrobiology 3, 343–350.
Jakosky, B.M., Mellon, M.T., Varnes, E.S., Feldman, W.C.,Boynton, W.V., and Haberle, R.M. (2005a) Mars low-latitude neutron distribution: possible remnant near-surface water ice and a mechanism for its recent em-placement. Icarus 175, 58–67.
Jakosky, B.M., Haberle, R.M., and Arvidson, R.E. (2005b)The changing picture of volatiles and climate on Mars.Science 310, 1439–1440.
Junge, K., Eicken, H., and Deming, J.W. (2004) Bacterialactivity at �2 to �20°C in Arctic wintertime sea ice.Appl. Environ. Microbiol. 70, 550–557.
Junge, K., Eicken, H., Swanson, B., and Deming, J.W. (2006)Bacterial incorporation of leucine into protein down to�20°C with evidence for potential activity in subeutec-tic saline ice formations. Cryobiology 52, 417–429.
Kappen, L., Schroeter, B., Scheidegger, C., Sommerkorn,M., and Hestmark, G. (1996) Cold resistance and meta-bolic activity of lichens below 0°C. Adv. Space Res. 18,119–128.
Kargel, J.S. and Strom, R.G. (1992a) Glacial geomorphicevidence for a late climatic change on Mars. In Work-shop on the Martian Surface and Atmosphere Through Time,Technical Report 92-02, Lunar and Planetary Institute,Houston, pp. 82–83.
Kargel, J.S. and Strom, R.G. (1992b) Ancient glaciation onMars. Geology 20, 3–7.
Keszthelyi, L., McEwen, A.S., and Thordarson, T. (2000)Terrestrial analogs and thermal models for martianflood lavas. J. Geophys. Res. 105, 15027–15049.
Kieffer, H.H., Martin, T.Z., Peterfreund, A.R., Jakosky,B.M., Miner, E.D., and Palluconi, F.D. (1977) Thermaland albedo mapping of Mars during the Viking pri-mary mission. J. Geophys. Res. 82, 4249–4291.
Koop, T. (2002) The water activity of aqueous solutions inequiibrium with ice. Bull. Chem. Soc. Jpn. 75, 2587–2588.
Kreslavsky, M.A. and Head, J.W. (2000) Kilometer-scaleroughness of Mars: results from MOLA data analysis.J. Geophys. Res. 105, 26695–26712.
Kreslavsky, M.A. and Head, J.W. (2002) Fate of outflowchannel effluents in the northern lowlands of Mars: theVastitas Borealis Formation as a sublimation residuefrom frozen ponded bodies of water. J. Geophys. Res.107, doi:10.1029/2001JE001831.
Kreslavsky, M.A., Head, J.W., and Marchant, D.R. (2006)
MEPAG SPECIAL REGIONS SCIENCE ANALYSIS GROUP728
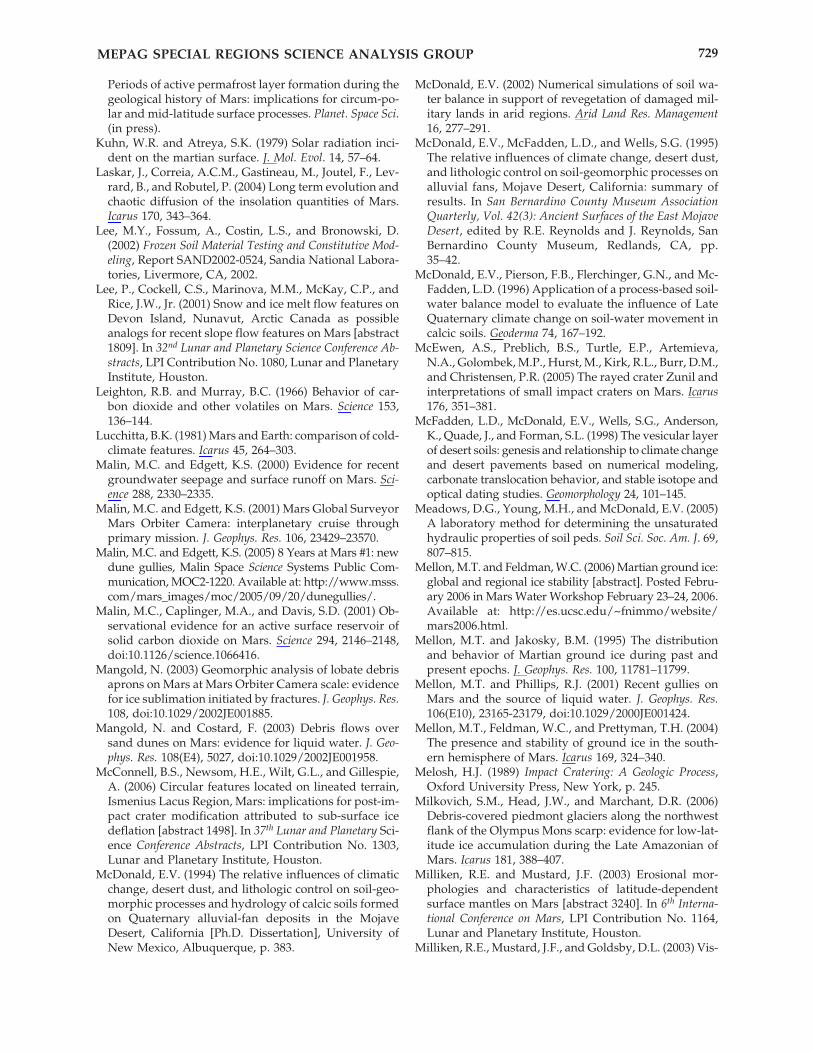
Periods of active permafrost layer formation during thegeological history of Mars: implications for circum-po-lar and mid-latitude surface processes. Planet. Space Sci.(in press).
Kuhn, W.R. and Atreya, S.K. (1979) Solar radiation inci-dent on the martian surface. J. Mol. Evol. 14, 57–64.
Laskar, J., Correia, A.C.M., Gastineau, M., Joutel, F., Lev-rard, B., and Robutel, P. (2004) Long term evolution andchaotic diffusion of the insolation quantities of Mars.Icarus 170, 343–364.
Lee, M.Y., Fossum, A., Costin, L.S., and Bronowski, D.(2002) Frozen Soil Material Testing and Constitutive Mod-eling, Report SAND2002-0524, Sandia National Labora-tories, Livermore, CA, 2002.
Lee, P., Cockell, C.S., Marinova, M.M., McKay, C.P., andRice, J.W., Jr. (2001) Snow and ice melt flow features onDevon Island, Nunavut, Arctic Canada as possibleanalogs for recent slope flow features on Mars [abstract1809]. In 32nd Lunar and Planetary Science Conference Ab-stracts, LPI Contribution No. 1080, Lunar and PlanetaryInstitute, Houston.
Leighton, R.B. and Murray, B.C. (1966) Behavior of car-bon dioxide and other volatiles on Mars. Science 153,136–144.
Lucchitta, B.K. (1981) Mars and Earth: comparison of cold-climate features. Icarus 45, 264–303.
Malin, M.C. and Edgett, K.S. (2000) Evidence for recentgroundwater seepage and surface runoff on Mars. Sci-ence 288, 2330–2335.
Malin, M.C. and Edgett, K.S. (2001) Mars Global SurveyorMars Orbiter Camera: interplanetary cruise throughprimary mission. J. Geophys. Res. 106, 23429–23570.
Malin, M.C. and Edgett, K.S. (2005) 8 Years at Mars #1: newdune gullies, Malin Space Science Systems Public Com-munication, MOC2-1220. Available at: http://www.msss.com/mars_images/moc/2005/09/20/dunegullies/.
Malin, M.C., Caplinger, M.A., and Davis, S.D. (2001) Ob-servational evidence for an active surface reservoir ofsolid carbon dioxide on Mars. Science 294, 2146–2148,doi:10.1126/science.1066416.
Mangold, N. (2003) Geomorphic analysis of lobate debrisaprons on Mars at Mars Orbiter Camera scale: evidencefor ice sublimation initiated by fractures. J. Geophys. Res.108, doi:10.1029/2002JE001885.
Mangold, N. and Costard, F. (2003) Debris flows oversand dunes on Mars: evidence for liquid water. J. Geo-phys. Res. 108(E4), 5027, doi:10.1029/2002JE001958.
McConnell, B.S., Newsom, H.E., Wilt, G.L., and Gillespie,A. (2006) Circular features located on lineated terrain,Ismenius Lacus Region, Mars: implications for post-im-pact crater modification attributed to sub-surface icedeflation [abstract 1498]. In 37th Lunar and Planetary Sci-ence Conference Abstracts, LPI Contribution No. 1303,Lunar and Planetary Institute, Houston.
McDonald, E.V. (1994) The relative influences of climaticchange, desert dust, and lithologic control on soil-geo-morphic processes and hydrology of calcic soils formedon Quaternary alluvial-fan deposits in the MojaveDesert, California [Ph.D. Dissertation], University ofNew Mexico, Albuquerque, p. 383.
McDonald, E.V. (2002) Numerical simulations of soil wa-ter balance in support of revegetation of damaged mil-itary lands in arid regions. Arid Land Res. Management16, 277–291.
McDonald, E.V., McFadden, L.D., and Wells, S.G. (1995)The relative influences of climate change, desert dust,and lithologic control on soil-geomorphic processes onalluvial fans, Mojave Desert, California: summary ofresults. In San Bernardino County Museum AssociationQuarterly, Vol. 42(3): Ancient Surfaces of the East MojaveDesert, edited by R.E. Reynolds and J. Reynolds, SanBernardino County Museum, Redlands, CA, pp.35–42.
McDonald, E.V., Pierson, F.B., Flerchinger, G.N., and Mc-Fadden, L.D. (1996) Application of a process-based soil-water balance model to evaluate the influence of LateQuaternary climate change on soil-water movement incalcic soils. Geoderma 74, 167–192.
McEwen, A.S., Preblich, B.S., Turtle, E.P., Artemieva,N.A., Golombek, M.P., Hurst, M., Kirk, R.L., Burr, D.M.,and Christensen, P.R. (2005) The rayed crater Zunil andinterpretations of small impact craters on Mars. Icarus176, 351–381.
McFadden, L.D., McDonald, E.V., Wells, S.G., Anderson,K., Quade, J., and Forman, S.L. (1998) The vesicular layerof desert soils: genesis and relationship to climate changeand desert pavements based on numerical modeling,carbonate translocation behavior, and stable isotope andoptical dating studies. Geomorphology 24, 101–145.
Meadows, D.G., Young, M.H., and McDonald, E.V. (2005)A laboratory method for determining the unsaturatedhydraulic properties of soil peds. Soil Sci. Soc. Am. J. 69,807–815.
Mellon, M.T. and Feldman, W.C. (2006) Martian ground ice:global and regional ice stability [abstract]. Posted Febru-ary 2006 in Mars Water Workshop February 23–24, 2006.Available at: http://es.ucsc.edu/~fnimmo/website/mars2006.html.
Mellon, M.T. and Jakosky, B.M. (1995) The distributionand behavior of Martian ground ice during past andpresent epochs. J. Geophys. Res. 100, 11781–11799.
Mellon, M.T. and Phillips, R.J. (2001) Recent gullies onMars and the source of liquid water. J. Geophys. Res.106(E10), 23165-23179, doi:10.1029/2000JE001424.
Mellon, M.T., Feldman, W.C., and Prettyman, T.H. (2004)The presence and stability of ground ice in the south-ern hemisphere of Mars. Icarus 169, 324–340.
Melosh, H.J. (1989) Impact Cratering: A Geologic Process,Oxford University Press, New York, p. 245.
Milkovich, S.M., Head, J.W., and Marchant, D.R. (2006)Debris-covered piedmont glaciers along the northwestflank of the Olympus Mons scarp: evidence for low-lat-itude ice accumulation during the Late Amazonian ofMars. Icarus 181, 388–407.
Milliken, R.E. and Mustard, J.F. (2003) Erosional mor-phologies and characteristics of latitude-dependentsurface mantles on Mars [abstract 3240]. In 6th Interna-tional Conference on Mars, LPI Contribution No. 1164,Lunar and Planetary Institute, Houston.
Milliken, R.E., Mustard, J.F., and Goldsby, D.L. (2003) Vis-
MEPAG SPECIAL REGIONS SCIENCE ANALYSIS GROUP 729
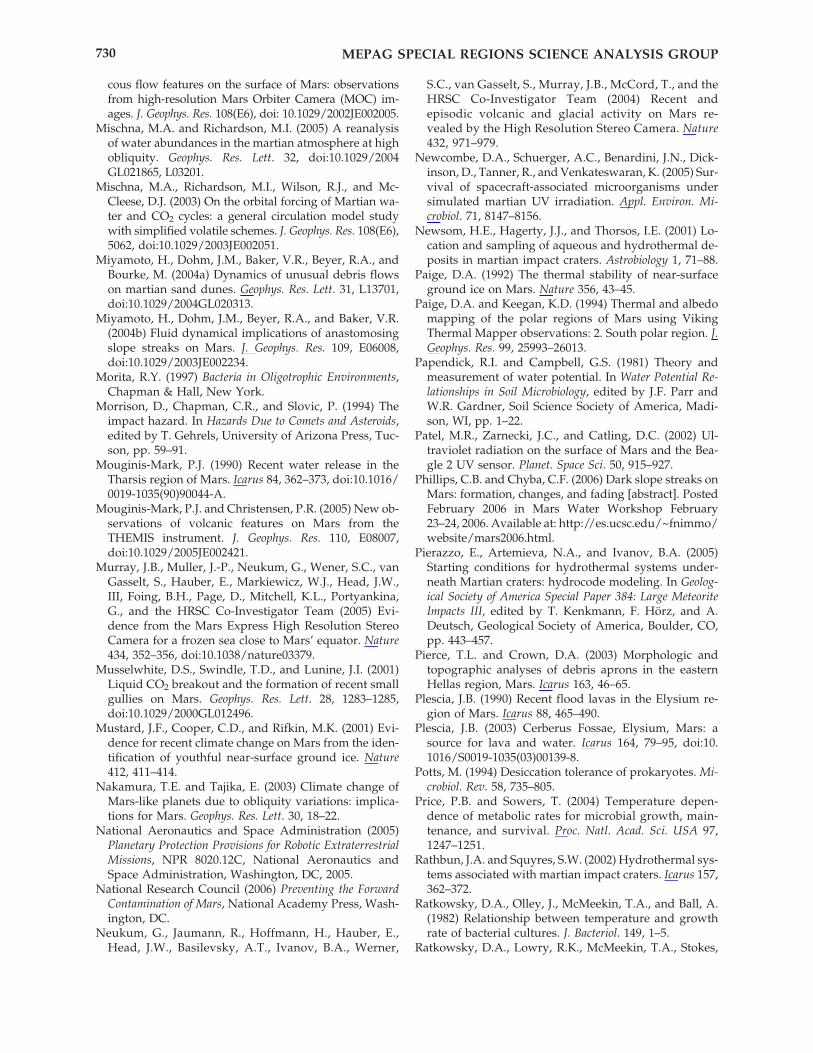
cous flow features on the surface of Mars: observationsfrom high-resolution Mars Orbiter Camera (MOC) im-ages. J. Geophys. Res. 108(E6), doi: 10.1029/2002JE002005.
Mischna, M.A. and Richardson, M.I. (2005) A reanalysisof water abundances in the martian atmosphere at highobliquity. Geophys. Res. Lett. 32, doi:10.1029/2004GL021865, L03201.
Mischna, M.A., Richardson, M.I., Wilson, R.J., and Mc-Cleese, D.J. (2003) On the orbital forcing of Martian wa-ter and CO2 cycles: a general circulation model studywith simplified volatile schemes. J. Geophys. Res. 108(E6),5062, doi:10.1029/2003JE002051.
Miyamoto, H., Dohm, J.M., Baker, V.R., Beyer, R.A., andBourke, M. (2004a) Dynamics of unusual debris flowson martian sand dunes. Geophys. Res. Lett. 31, L13701,doi:10.1029/2004GL020313.
Miyamoto, H., Dohm, J.M., Beyer, R.A., and Baker, V.R.(2004b) Fluid dynamical implications of anastomosingslope streaks on Mars. J. Geophys. Res. 109, E06008,doi:10.1029/2003JE002234.
Morita, R.Y. (1997) Bacteria in Oligotrophic Environments,Chapman & Hall, New York.
Morrison, D., Chapman, C.R., and Slovic, P. (1994) Theimpact hazard. In Hazards Due to Comets and Asteroids,edited by T. Gehrels, University of Arizona Press, Tuc-son, pp. 59–91.
Mouginis-Mark, P.J. (1990) Recent water release in theTharsis region of Mars. Icarus 84, 362–373, doi:10.1016/0019-1035(90)90044-A.
Mouginis-Mark, P.J. and Christensen, P.R. (2005) New ob-servations of volcanic features on Mars from theTHEMIS instrument. J. Geophys. Res. 110, E08007,doi:10.1029/2005JE002421.
Murray, J.B., Muller, J.-P., Neukum, G., Wener, S.C., vanGasselt, S., Hauber, E., Markiewicz, W.J., Head, J.W.,III, Foing, B.H., Page, D., Mitchell, K.L., Portyankina,G., and the HRSC Co-Investigator Team (2005) Evi-dence from the Mars Express High Resolution StereoCamera for a frozen sea close to Mars’ equator. Nature434, 352–356, doi:10.1038/nature03379.
Musselwhite, D.S., Swindle, T.D., and Lunine, J.I. (2001)Liquid CO2 breakout and the formation of recent smallgullies on Mars. Geophys. Res. Lett. 28, 1283–1285,doi:10.1029/2000GL012496.
Mustard, J.F., Cooper, C.D., and Rifkin, M.K. (2001) Evi-dence for recent climate change on Mars from the iden-tification of youthful near-surface ground ice. Nature412, 411–414.
Nakamura, T.E. and Tajika, E. (2003) Climate change ofMars-like planets due to obliquity variations: implica-tions for Mars. Geophys. Res. Lett. 30, 18–22.
National Aeronautics and Space Administration (2005)Planetary Protection Provisions for Robotic ExtraterrestrialMissions, NPR 8020.12C, National Aeronautics andSpace Administration, Washington, DC, 2005.
National Research Council (2006) Preventing the ForwardContamination of Mars, National Academy Press, Wash-ington, DC.
Neukum, G., Jaumann, R., Hoffmann, H., Hauber, E.,Head, J.W., Basilevsky, A.T., Ivanov, B.A., Werner,
S.C., van Gasselt, S., Murray, J.B., McCord, T., and theHRSC Co-Investigator Team (2004) Recent andepisodic volcanic and glacial activity on Mars re-vealed by the High Resolution Stereo Camera. Nature432, 971–979.
Newcombe, D.A., Schuerger, A.C., Benardini, J.N., Dick-inson, D., Tanner, R., and Venkateswaran, K. (2005) Sur-vival of spacecraft-associated microorganisms undersimulated martian UV irradiation. Appl. Environ. Mi-crobiol. 71, 8147–8156.
Newsom, H.E., Hagerty, J.J., and Thorsos, I.E. (2001) Lo-cation and sampling of aqueous and hydrothermal de-posits in martian impact craters. Astrobiology 1, 71–88.
Paige, D.A. (1992) The thermal stability of near-surfaceground ice on Mars. Nature 356, 43–45.
Paige, D.A. and Keegan, K.D. (1994) Thermal and albedomapping of the polar regions of Mars using VikingThermal Mapper observations: 2. South polar region. J.Geophys. Res. 99, 25993–26013.
Papendick, R.I. and Campbell, G.S. (1981) Theory andmeasurement of water potential. In Water Potential Re-lationships in Soil Microbiology, edited by J.F. Parr andW.R. Gardner, Soil Science Society of America, Madi-son, WI, pp. 1–22.
Patel, M.R., Zarnecki, J.C., and Catling, D.C. (2002) Ul-traviolet radiation on the surface of Mars and the Bea-gle 2 UV sensor. Planet. Space Sci. 50, 915–927.
Phillips, C.B. and Chyba, C.F. (2006) Dark slope streaks onMars: formation, changes, and fading [abstract]. PostedFebruary 2006 in Mars Water Workshop February23–24, 2006. Available at: http://es.ucsc.edu/~fnimmo/website/mars2006.html.
Pierazzo, E., Artemieva, N.A., and Ivanov, B.A. (2005)Starting conditions for hydrothermal systems under-neath Martian craters: hydrocode modeling. In Geolog-ical Society of America Special Paper 384: Large MeteoriteImpacts III, edited by T. Kenkmann, F. Hörz, and A.Deutsch, Geological Society of America, Boulder, CO,pp. 443–457.
Pierce, T.L. and Crown, D.A. (2003) Morphologic andtopographic analyses of debris aprons in the easternHellas region, Mars. Icarus 163, 46–65.
Plescia, J.B. (1990) Recent flood lavas in the Elysium re-gion of Mars. Icarus 88, 465–490.
Plescia, J.B. (2003) Cerberus Fossae, Elysium, Mars: asource for lava and water. Icarus 164, 79–95, doi:10.1016/S0019-1035(03)00139-8.
Potts, M. (1994) Desiccation tolerance of prokaryotes. Mi-crobiol. Rev. 58, 735–805.
Price, P.B. and Sowers, T. (2004) Temperature depen-dence of metabolic rates for microbial growth, main-tenance, and survival. Proc. Natl. Acad. Sci. USA 97,1247–1251.
Rathbun, J.A. and Squyres, S.W. (2002) Hydrothermal sys-tems associated with martian impact craters. Icarus 157,362–372.
Ratkowsky, D.A., Olley, J., McMeekin, T.A., and Ball, A.(1982) Relationship between temperature and growthrate of bacterial cultures. J. Bacteriol. 149, 1–5.
Ratkowsky, D.A., Lowry, R.K., McMeekin, T.A., Stokes,
MEPAG SPECIAL REGIONS SCIENCE ANALYSIS GROUP730
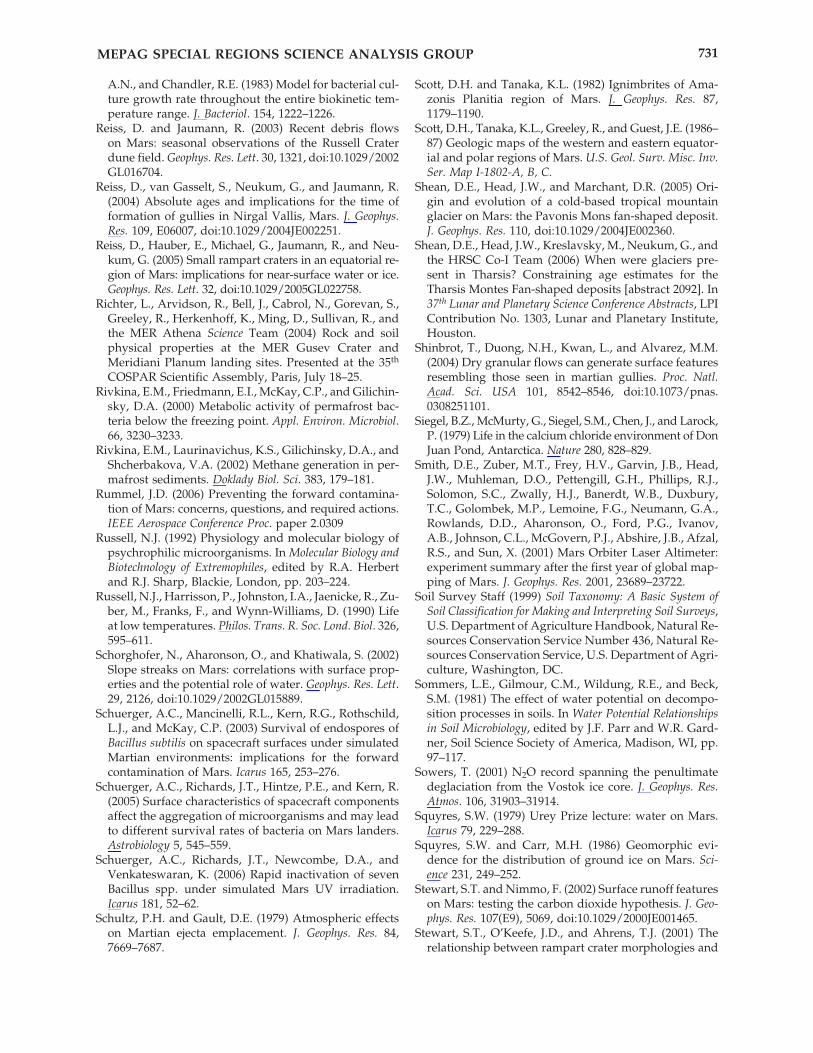
A.N., and Chandler, R.E. (1983) Model for bacterial cul-ture growth rate throughout the entire biokinetic tem-perature range. J. Bacteriol. 154, 1222–1226.
Reiss, D. and Jaumann, R. (2003) Recent debris flows on Mars: seasonal observations of the Russell Craterdune field. Geophys. Res. Lett. 30, 1321, doi:10.1029/2002GL016704.
Reiss, D., van Gasselt, S., Neukum, G., and Jaumann, R.(2004) Absolute ages and implications for the time offormation of gullies in Nirgal Vallis, Mars. J. Geophys.Res. 109, E06007, doi:10.1029/2004JE002251.
Reiss, D., Hauber, E., Michael, G., Jaumann, R., and Neu-kum, G. (2005) Small rampart craters in an equatorial re-gion of Mars: implications for near-surface water or ice.Geophys. Res. Lett. 32, doi:10.1029/2005GL022758.
Richter, L., Arvidson, R., Bell, J., Cabrol, N., Gorevan, S.,Greeley, R., Herkenhoff, K., Ming, D., Sullivan, R., andthe MER Athena Science Team (2004) Rock and soilphysical properties at the MER Gusev Crater andMeridiani Planum landing sites. Presented at the 35th
COSPAR Scientific Assembly, Paris, July 18–25.Rivkina, E.M., Friedmann, E.I., McKay, C.P., and Gilichin-
sky, D.A. (2000) Metabolic activity of permafrost bac-teria below the freezing point. Appl. Environ. Microbiol.66, 3230–3233.
Rivkina, E.M., Laurinavichus, K.S., Gilichinsky, D.A., andShcherbakova, V.A. (2002) Methane generation in per-mafrost sediments. Doklady Biol. Sci. 383, 179–181.
Rummel, J.D. (2006) Preventing the forward contamina-tion of Mars: concerns, questions, and required actions.IEEE Aerospace Conference Proc. paper 2.0309
Russell, N.J. (1992) Physiology and molecular biology ofpsychrophilic microorganisms. In Molecular Biology andBiotechnology of Extremophiles, edited by R.A. Herbertand R.J. Sharp, Blackie, London, pp. 203–224.
Russell, N.J., Harrisson, P., Johnston, I.A., Jaenicke, R., Zu-ber, M., Franks, F., and Wynn-Williams, D. (1990) Lifeat low temperatures. Philos. Trans. R. Soc. Lond. Biol. 326,595–611.
Schorghofer, N., Aharonson, O., and Khatiwala, S. (2002)Slope streaks on Mars: correlations with surface prop-erties and the potential role of water. Geophys. Res. Lett.29, 2126, doi:10.1029/2002GL015889.
Schuerger, A.C., Mancinelli, R.L., Kern, R.G., Rothschild,L.J., and McKay, C.P. (2003) Survival of endospores ofBacillus subtilis on spacecraft surfaces under simulatedMartian environments: implications for the forwardcontamination of Mars. Icarus 165, 253–276.
Schuerger, A.C., Richards, J.T., Hintze, P.E., and Kern, R.(2005) Surface characteristics of spacecraft componentsaffect the aggregation of microorganisms and may leadto different survival rates of bacteria on Mars landers.Astrobiology 5, 545–559.
Schuerger, A.C., Richards, J.T., Newcombe, D.A., andVenkateswaran, K. (2006) Rapid inactivation of sevenBacillus spp. under simulated Mars UV irradiation.Icarus 181, 52–62.
Schultz, P.H. and Gault, D.E. (1979) Atmospheric effectson Martian ejecta emplacement. J. Geophys. Res. 84,7669–7687.
Scott, D.H. and Tanaka, K.L. (1982) Ignimbrites of Ama-zonis Planitia region of Mars. J. Geophys. Res. 87,1179–1190.
Scott, D.H., Tanaka, K.L., Greeley, R., and Guest, J.E. (1986–87) Geologic maps of the western and eastern equator-ial and polar regions of Mars. U.S. Geol. Surv. Misc. Inv.Ser. Map I-1802-A, B, C.
Shean, D.E., Head, J.W., and Marchant, D.R. (2005) Ori-gin and evolution of a cold-based tropical mountainglacier on Mars: the Pavonis Mons fan-shaped deposit.J. Geophys. Res. 110, doi:10.1029/2004JE002360.
Shean, D.E., Head, J.W., Kreslavsky, M., Neukum, G., andthe HRSC Co-I Team (2006) When were glaciers pre-sent in Tharsis? Constraining age estimates for theTharsis Montes Fan-shaped deposits [abstract 2092]. In37th Lunar and Planetary Science Conference Abstracts, LPIContribution No. 1303, Lunar and Planetary Institute,Houston.
Shinbrot, T., Duong, N.H., Kwan, L., and Alvarez, M.M.(2004) Dry granular flows can generate surface featuresresembling those seen in martian gullies. Proc. Natl.Acad. Sci. USA 101, 8542–8546, doi:10.1073/pnas.0308251101.
Siegel, B.Z., McMurty, G., Siegel, S.M., Chen, J., and Larock,P. (1979) Life in the calcium chloride environment of DonJuan Pond, Antarctica. Nature 280, 828–829.
Smith, D.E., Zuber, M.T., Frey, H.V., Garvin, J.B., Head,J.W., Muhleman, D.O., Pettengill, G.H., Phillips, R.J.,Solomon, S.C., Zwally, H.J., Banerdt, W.B., Duxbury,T.C., Golombek, M.P., Lemoine, F.G., Neumann, G.A.,Rowlands, D.D., Aharonson, O., Ford, P.G., Ivanov,A.B., Johnson, C.L., McGovern, P.J., Abshire, J.B., Afzal,R.S., and Sun, X. (2001) Mars Orbiter Laser Altimeter:experiment summary after the first year of global map-ping of Mars. J. Geophys. Res. 2001, 23689–23722.
Soil Survey Staff (1999) Soil Taxonomy: A Basic System ofSoil Classification for Making and Interpreting Soil Surveys,U.S. Department of Agriculture Handbook, Natural Re-sources Conservation Service Number 436, Natural Re-sources Conservation Service, U.S. Department of Agri-culture, Washington, DC.
Sommers, L.E., Gilmour, C.M., Wildung, R.E., and Beck,S.M. (1981) The effect of water potential on decompo-sition processes in soils. In Water Potential Relationshipsin Soil Microbiology, edited by J.F. Parr and W.R. Gard-ner, Soil Science Society of America, Madison, WI, pp.97–117.
Sowers, T. (2001) N2O record spanning the penultimatedeglaciation from the Vostok ice core. J. Geophys. Res.Atmos. 106, 31903–31914.
Squyres, S.W. (1979) Urey Prize lecture: water on Mars.Icarus 79, 229–288.
Squyres, S.W. and Carr, M.H. (1986) Geomorphic evi-dence for the distribution of ground ice on Mars. Sci-ence 231, 249–252.
Stewart, S.T. and Nimmo, F. (2002) Surface runoff featureson Mars: testing the carbon dioxide hypothesis. J. Geo-phys. Res. 107(E9), 5069, doi:10.1029/2000JE001465.
Stewart, S.T., O’Keefe, J.D., and Ahrens, T.J. (2001) Therelationship between rampart crater morphologies and
MEPAG SPECIAL REGIONS SCIENCE ANALYSIS GROUP 731
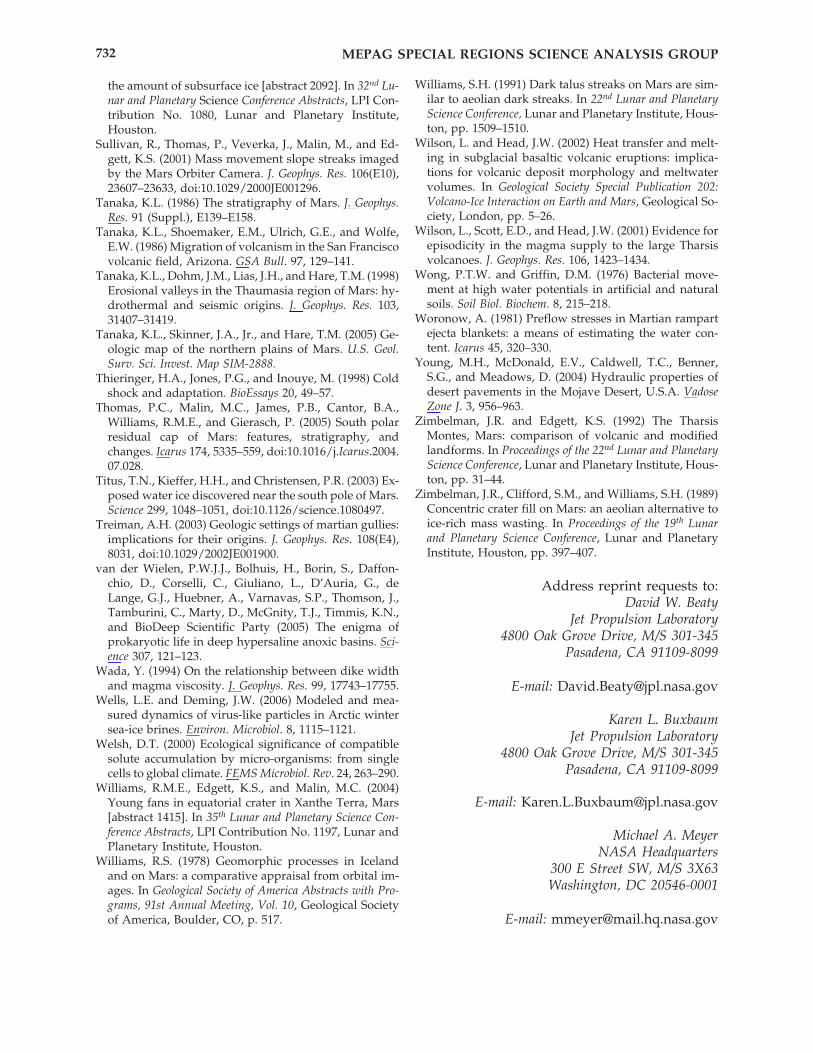
the amount of subsurface ice [abstract 2092]. In 32nd Lu-nar and Planetary Science Conference Abstracts, LPI Con-tribution No. 1080, Lunar and Planetary Institute,Houston.
Sullivan, R., Thomas, P., Veverka, J., Malin, M., and Ed-gett, K.S. (2001) Mass movement slope streaks imagedby the Mars Orbiter Camera. J. Geophys. Res. 106(E10),23607–23633, doi:10.1029/2000JE001296.
Tanaka, K.L. (1986) The stratigraphy of Mars. J. Geophys.Res. 91 (Suppl.), E139–E158.
Tanaka, K.L., Shoemaker, E.M., Ulrich, G.E., and Wolfe,E.W. (1986) Migration of volcanism in the San Franciscovolcanic field, Arizona. GSA Bull. 97, 129–141.
Tanaka, K.L., Dohm, J.M., Lias, J.H., and Hare, T.M. (1998)Erosional valleys in the Thaumasia region of Mars: hy-drothermal and seismic origins. J. Geophys. Res. 103,31407–31419.
Tanaka, K.L., Skinner, J.A., Jr., and Hare, T.M. (2005) Ge-ologic map of the northern plains of Mars. U.S. Geol.Surv. Sci. Invest. Map SIM-2888.
Thieringer, H.A., Jones, P.G., and Inouye, M. (1998) Coldshock and adaptation. BioEssays 20, 49–57.
Thomas, P.C., Malin, M.C., James, P.B., Cantor, B.A.,Williams, R.M.E., and Gierasch, P. (2005) South polarresidual cap of Mars: features, stratigraphy, andchanges. Icarus 174, 5335–559, doi:10.1016/j.Icarus.2004.07.028.
Titus, T.N., Kieffer, H.H., and Christensen, P.R. (2003) Ex-posed water ice discovered near the south pole of Mars.Science 299, 1048–1051, doi:10.1126/science.1080497.
Treiman, A.H. (2003) Geologic settings of martian gullies:implications for their origins. J. Geophys. Res. 108(E4),8031, doi:10.1029/2002JE001900.
van der Wielen, P.W.J.J., Bolhuis, H., Borin, S., Daffon-chio, D., Corselli, C., Giuliano, L., D’Auria, G., deLange, G.J., Huebner, A., Varnavas, S.P., Thomson, J.,Tamburini, C., Marty, D., McGnity, T.J., Timmis, K.N.,and BioDeep Scientific Party (2005) The enigma ofprokaryotic life in deep hypersaline anoxic basins. Sci-ence 307, 121–123.
Wada, Y. (1994) On the relationship between dike widthand magma viscosity. J. Geophys. Res. 99, 17743–17755.
Wells, L.E. and Deming, J.W. (2006) Modeled and mea-sured dynamics of virus-like particles in Arctic wintersea-ice brines. Environ. Microbiol. 8, 1115–1121.
Welsh, D.T. (2000) Ecological significance of compatiblesolute accumulation by micro-organisms: from singlecells to global climate. FEMS Microbiol. Rev. 24, 263–290.
Williams, R.M.E., Edgett, K.S., and Malin, M.C. (2004)Young fans in equatorial crater in Xanthe Terra, Mars[abstract 1415]. In 35th Lunar and Planetary Science Con-ference Abstracts, LPI Contribution No. 1197, Lunar andPlanetary Institute, Houston.
Williams, R.S. (1978) Geomorphic processes in Icelandand on Mars: a comparative appraisal from orbital im-ages. In Geological Society of America Abstracts with Pro-grams, 91st Annual Meeting, Vol. 10, Geological Societyof America, Boulder, CO, p. 517.
Williams, S.H. (1991) Dark talus streaks on Mars are sim-ilar to aeolian dark streaks. In 22nd Lunar and PlanetaryScience Conference, Lunar and Planetary Institute, Hous-ton, pp. 1509–1510.
Wilson, L. and Head, J.W. (2002) Heat transfer and melt-ing in subglacial basaltic volcanic eruptions: implica-tions for volcanic deposit morphology and meltwatervolumes. In Geological Society Special Publication 202:Volcano-Ice Interaction on Earth and Mars, Geological So-ciety, London, pp. 5–26.
Wilson, L., Scott, E.D., and Head, J.W. (2001) Evidence forepisodicity in the magma supply to the large Tharsisvolcanoes. J. Geophys. Res. 106, 1423–1434.
Wong, P.T.W. and Griffin, D.M. (1976) Bacterial move-ment at high water potentials in artificial and naturalsoils. Soil Biol. Biochem. 8, 215–218.
Woronow, A. (1981) Preflow stresses in Martian rampartejecta blankets: a means of estimating the water con-tent. Icarus 45, 320–330.
Young, M.H., McDonald, E.V., Caldwell, T.C., Benner,S.G., and Meadows, D. (2004) Hydraulic properties ofdesert pavements in the Mojave Desert, U.S.A. VadoseZone J. 3, 956–963.
Zimbelman, J.R. and Edgett, K.S. (1992) The TharsisMontes, Mars: comparison of volcanic and modifiedlandforms. In Proceedings of the 22nd Lunar and PlanetaryScience Conference, Lunar and Planetary Institute, Hous-ton, pp. 31–44.
Zimbelman, J.R., Clifford, S.M., and Williams, S.H. (1989)Concentric crater fill on Mars: an aeolian alternative toice-rich mass wasting. In Proceedings of the 19th Lunarand Planetary Science Conference, Lunar and PlanetaryInstitute, Houston, pp. 397–407.
Address reprint requests to:David W. Beaty
Jet Propulsion Laboratory4800 Oak Grove Drive, M/S 301-345
Pasadena, CA 91109-8099
E-mail: [email protected]
Karen L. BuxbaumJet Propulsion Laboratory
4800 Oak Grove Drive, M/S 301-345Pasadena, CA 91109-8099
E-mail: [email protected]
Michael A. MeyerNASA Headquarters
300 E Street SW, M/S 3X63Washington, DC 20546-0001
E-mail: [email protected]
MEPAG SPECIAL REGIONS SCIENCE ANALYSIS GROUP732
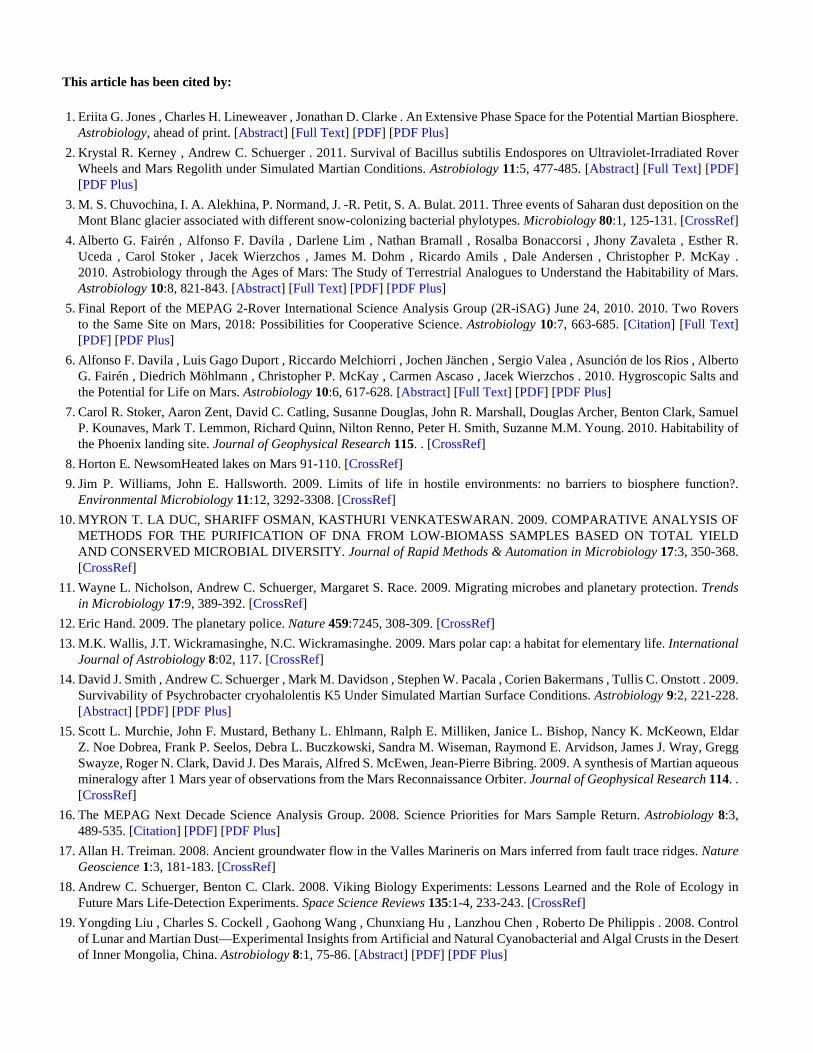
This article has been cited by:
1. Eriita G. Jones , Charles H. Lineweaver , Jonathan D. Clarke . An Extensive Phase Space for the Potential Martian Biosphere.Astrobiology, ahead of print. [Abstract] [Full Text] [PDF] [PDF Plus]
2. Krystal R. Kerney , Andrew C. Schuerger . 2011. Survival of Bacillus subtilis Endospores on Ultraviolet-Irradiated RoverWheels and Mars Regolith under Simulated Martian Conditions. Astrobiology 11:5, 477-485. [Abstract] [Full Text] [PDF][PDF Plus]
3. M. S. Chuvochina, I. A. Alekhina, P. Normand, J. -R. Petit, S. A. Bulat. 2011. Three events of Saharan dust deposition on theMont Blanc glacier associated with different snow-colonizing bacterial phylotypes. Microbiology 80:1, 125-131. [CrossRef]
4. Alberto G. Fairén , Alfonso F. Davila , Darlene Lim , Nathan Bramall , Rosalba Bonaccorsi , Jhony Zavaleta , Esther R.Uceda , Carol Stoker , Jacek Wierzchos , James M. Dohm , Ricardo Amils , Dale Andersen , Christopher P. McKay .2010. Astrobiology through the Ages of Mars: The Study of Terrestrial Analogues to Understand the Habitability of Mars.Astrobiology 10:8, 821-843. [Abstract] [Full Text] [PDF] [PDF Plus]
5. Final Report of the MEPAG 2-Rover International Science Analysis Group (2R-iSAG) June 24, 2010. 2010. Two Roversto the Same Site on Mars, 2018: Possibilities for Cooperative Science. Astrobiology 10:7, 663-685. [Citation] [Full Text][PDF] [PDF Plus]
6. Alfonso F. Davila , Luis Gago Duport , Riccardo Melchiorri , Jochen Jänchen , Sergio Valea , Asunción de los Rios , AlbertoG. Fairén , Diedrich Möhlmann , Christopher P. McKay , Carmen Ascaso , Jacek Wierzchos . 2010. Hygroscopic Salts andthe Potential for Life on Mars. Astrobiology 10:6, 617-628. [Abstract] [Full Text] [PDF] [PDF Plus]
7. Carol R. Stoker, Aaron Zent, David C. Catling, Susanne Douglas, John R. Marshall, Douglas Archer, Benton Clark, SamuelP. Kounaves, Mark T. Lemmon, Richard Quinn, Nilton Renno, Peter H. Smith, Suzanne M.M. Young. 2010. Habitability ofthe Phoenix landing site. Journal of Geophysical Research 115. . [CrossRef]
8. Horton E. NewsomHeated lakes on Mars 91-110. [CrossRef]
9. Jim P. Williams, John E. Hallsworth. 2009. Limits of life in hostile environments: no barriers to biosphere function?.Environmental Microbiology 11:12, 3292-3308. [CrossRef]
10. MYRON T. LA DUC, SHARIFF OSMAN, KASTHURI VENKATESWARAN. 2009. COMPARATIVE ANALYSIS OFMETHODS FOR THE PURIFICATION OF DNA FROM LOW-BIOMASS SAMPLES BASED ON TOTAL YIELDAND CONSERVED MICROBIAL DIVERSITY. Journal of Rapid Methods & Automation in Microbiology 17:3, 350-368.[CrossRef]
11. Wayne L. Nicholson, Andrew C. Schuerger, Margaret S. Race. 2009. Migrating microbes and planetary protection. Trendsin Microbiology 17:9, 389-392. [CrossRef]
12. Eric Hand. 2009. The planetary police. Nature 459:7245, 308-309. [CrossRef]
13. M.K. Wallis, J.T. Wickramasinghe, N.C. Wickramasinghe. 2009. Mars polar cap: a habitat for elementary life. InternationalJournal of Astrobiology 8:02, 117. [CrossRef]
14. David J. Smith , Andrew C. Schuerger , Mark M. Davidson , Stephen W. Pacala , Corien Bakermans , Tullis C. Onstott . 2009.Survivability of Psychrobacter cryohalolentis K5 Under Simulated Martian Surface Conditions. Astrobiology 9:2, 221-228.[Abstract] [PDF] [PDF Plus]
15. Scott L. Murchie, John F. Mustard, Bethany L. Ehlmann, Ralph E. Milliken, Janice L. Bishop, Nancy K. McKeown, EldarZ. Noe Dobrea, Frank P. Seelos, Debra L. Buczkowski, Sandra M. Wiseman, Raymond E. Arvidson, James J. Wray, GreggSwayze, Roger N. Clark, David J. Des Marais, Alfred S. McEwen, Jean-Pierre Bibring. 2009. A synthesis of Martian aqueousmineralogy after 1 Mars year of observations from the Mars Reconnaissance Orbiter. Journal of Geophysical Research 114. .[CrossRef]
16. The MEPAG Next Decade Science Analysis Group. 2008. Science Priorities for Mars Sample Return. Astrobiology 8:3,489-535. [Citation] [PDF] [PDF Plus]
17. Allan H. Treiman. 2008. Ancient groundwater flow in the Valles Marineris on Mars inferred from fault trace ridges. NatureGeoscience 1:3, 181-183. [CrossRef]
18. Andrew C. Schuerger, Benton C. Clark. 2008. Viking Biology Experiments: Lessons Learned and the Role of Ecology inFuture Mars Life-Detection Experiments. Space Science Reviews 135:1-4, 233-243. [CrossRef]
19. Yongding Liu , Charles S. Cockell , Gaohong Wang , Chunxiang Hu , Lanzhou Chen , Roberto De Philippis . 2008. Controlof Lunar and Martian Dust—Experimental Insights from Artificial and Natural Cyanobacterial and Algal Crusts in the Desertof Inner Mongolia, China. Astrobiology 8:1, 75-86. [Abstract] [PDF] [PDF Plus]

20. Luther W. Beegle , Michael G. Wilson , Fernando Abilleira , James F. Jordan , Gregory R. Wilson . 2007. A Concept forNASA's Mars 2016 Astrobiology Field Laboratory. Astrobiology 7:4, 545-577. [Abstract] [PDF] [PDF Plus]
21. Steven M. Jepsen , John C. Priscu , Robert E. Grimm , Mark A. Bullock . 2007. The Potential for Lithoautotrophic Life onMars: Application to Shallow Interfacial Water Environments. Astrobiology 7:2, 342-354. [Abstract] [PDF] [PDF Plus]
22. Irina A. Alekhina, Dominique Marie, Jean Robert Petit, Valery V. Lukin, Vladimir M. Zubkov, Sergey A. Bulat. 2007.Molecular analysis of bacterial diversity in kerosene-based drilling fluid from the deep ice borehole at Vostok, East Antarctica.FEMS Microbiology Ecology 59:2, 289-299. [CrossRef]