Embed Size (px)
Citation preview
Prepared by Beef + Lamb New Zealand and the Meat Industry Association
New Zealand Sheep and Beef Sector BARRIERS TO INTERNATIONAL TRADE
2020/21
Representation of the Red Meat SectorBeef + Lamb New Zealand (B+LNZ) and the Meat Industry Association of New Zealand (MIA), together represent the views of the New Zealand red meat sector, including farmers, processors, marketers and exporters and are the interface between the sector and government on red meat issues.
Beef + Lamb New Zealand
Beef + Lamb New Zealand (B+LNZ) is the farmer-owned organisation representing New Zealand’s sheep and beef farmers. It is the organisation with the legal mandate to speak on behalf of New Zealand sheep and beef farmers. B+LNZ is funded under the Commodity Levies Act 1990 through a levy paid by producers on all cattle and sheep commercially slaughtered in New Zealand. B+LNZ’s purpose is to provide insights and actions that drive tangible impact for farmers.
B+LNZ represents around 9,200 commercial farming businesses, creating around 35,000 jobs (waged, salaried and self-employment) in the sheep and beef sector. Around three quarters of pastoral land and just under a third of New Zealand’s total land area is used for sheep and beef farming.
B+LNZ’s visionSustainable and profitable farmers, thriving farming communities, valued by New Zealanders.
B+LNZ’s priorities • Supporting farming excellence • Championing the sector • Increasing market returns.
Meat Industry Association
The MIA is the voluntary trade association representing New Zealand meat processors, marketers and exporters. It is an incorporated society (owned by members) that comprises companies supplying 99 percent of New Zealand beef and sheep meat exports.
The MIA:• Provides a collective voice for New Zealand's red meat processors,
marketers and exporters on policy formation on economic, trade, market access, industrial relations, compliance costs, environmental, animal welfare, technical and regulatory issues facing the industry
• Plays an important role in maintaining and opening up access to overseas markets including by working with government to remove NTBs and developing relationships with international counterparts
• Provides a number of whole-of- industry services such as contracting with Approved Halal Organisations for halal certification and managing the halal slaughterperson recruitment process for the meat industry
• Facilitates a number of whole-of-industry innovation and research and development initiatives.
MIA’s MissionTo provide leadership, tools and a strong and credible voice to help ensure a vibrant and profitable red meat industry.
New Zealand Sheep and Beef Sector BARRIERS TO INTERNATIONAL TRADE
2020/21
Source of data: Compiled by B+LNZ / MIA from Statistics New Zealand (via Global Trade Atlas) and the World Trade Organisation Tariff Download Facility
Prepared by
and
Disclaimer We accept no liability for any content contained in this document. We do not guarantee the accuracy, integrity, or quality of content. We endeavour to ensure that the information in this document is accurate and current, and do not accept liability for any error or omission. We note that we were unable to source tariff and non-tariff information for certain markets. Please note that applied tariff rates were used to calculate tariffs payable. We accept no legal liability whatsoever arising from, or connected to, the use of any material contained in this document. Unless otherwise stated, all statistics are year-end 31 December. The statistics in this document have been compiled by B+LNZ and MIA from Statistics New Zealand, through Global Trade Atlas. A variety of units of measure have been used. We recommend that users:
• exercise their own skill and care with respect to their use of the information
• carefully evaluate the accuracy, currency, completeness, and relevance of the material in this document for their purposes.
This document is not a substitute for independent professional advice and users should obtain any appropriate professional advice relevant to their particular circumstances.
Beef + Lamb New Zealand Limited Level 4, 154 Featherston Street Wellington Chambers Wellington 6011
Contacts Dave Harrison General Manager Policy & Advocacy +64 27 248 3510
Nicholas Jolly Trade Policy Advisor +64 27 279 3909
Meat Industry Association Level 5, 154 Featherston Street Wellington Chambers Wellington 6011 Contact Esther Guy-Meakin Senior Manager Strategy, Trade Policy and Advocacy +64 27 710 0605 [email protected]
Contents
1. Foreword .................................................................................................................................................... 5 2. An introduction to the red meat sector .................................................................................................. 7 3. Developments over the last two years ................................................................................................. 14
3.1 Summary of changes in the last two years .......................................................................... 14 3.2 Introduction.............................................................................................................................. 14 3.3 Trade wins for the sector over the last two years ............................................................... 14 3.4 Tariff Reductions ..................................................................................................................... 15 3.5 Non-tariff barriers .................................................................................................................... 16 3.6 COVID-19 and the impact on the red meat sector ............................................................... 17 3.7 Market Access Developments ............................................................................................... 19 3.8 Other Trade Policy Developments......................................................................................... 22
4. Summary of red meat and co-product exports by product and market ........................................... 25 4.1 Summary of exports by product – Year ending 31 December ........................................... 25 4.2 Summary of exports by market ............................................................................................. 26
5. Summary of tariff and non-tariff barriers to trade ............................................................................... 29 5.1 Summary of tariff barriers ...................................................................................................... 29 5.2 Summary of non-tariff barriers .............................................................................................. 32 5.3 Generic barriers occurring in multiple markets ................................................................... 33
6. Trade and tariffs by product .................................................................................................................. 40 6.1 Beef ........................................................................................................................................... 40 6.2 Chilled beef .............................................................................................................................. 40 6.3 Frozen beef .............................................................................................................................. 42 6.4 Sheepmeat ............................................................................................................................... 44 6.5 Co-products ............................................................................................................................. 48
7. Trade, tariffs, and non-tariff barriers by market .................................................................................. 62 7.1 Australia ................................................................................................................................... 62 7.2 Canada ...................................................................................................................................... 64 7.3 China ......................................................................................................................................... 66 7.4 Chinese Taipei (Taiwan) ......................................................................................................... 70 7.5 Egypt ......................................................................................................................................... 72 7.6 European Union (includes EU27) .......................................................................................... 74 7.7 Fiji ............................................................................................................................................. 77 7.8 French Polynesia ..................................................................................................................... 79 7.9 GCC (Bahrain, Kuwait, Oman, Qatar, Saudi Arabia, and the United Arab Emirates) ....... 81 7.10 Hong Kong ............................................................................................................................... 84 7.11 India .......................................................................................................................................... 86 7.12 Indonesia .................................................................................................................................. 88 7.13 Japan ........................................................................................................................................ 91 7.14 Jordan ....................................................................................................................................... 93 7.15 South Korea ............................................................................................................................. 95
Barriers to International Trade 2020/21 4
1. FOREWORD
4 Barriers to International Trade 2020/21
Barriers to International Trade 2020/21 5
1. Foreword Beef + Lamb New Zealand (B+LNZ) and the Meat Industry Association (MIA) are pleased to publish our biennial “Barriers to International Trade” report.
Exports are the lifeblood of the New Zealand sheep and beef sector (“the sector”) and the wider New Zealand economy. Approximately 94 percent of all New Zealand’s sheepmeat production and 87 percent of our beef production is exported. In 2020 these exports were worth $9.5 billion (including wool) making our sector New Zealand’s second largest goods exporter.
The sector’s export successes directly contribute to $4.6 billion in household income in New Zealand, and as a result of the jobs our exports create, the sector accounts for 4.7 percent of national employment. Not only does the sector contribute to the livelihoods of those kiwis working for our sector, but as a mainly regional employer our sector is an important part of the social and economic fabric of our rural communities.
While COVID-19 presented unprecedented challenges, it also served as a helpful reminder of the social and economic contribution our sector makes. Our workers were designated essential through the Level 4 lockdown and we took that responsibility very seriously. The ability of our sector to continue to operate, keep our 92,000 workforce employed and support economic recovery is a source of great pride.
We are proud of what we do and of our contribution to the well-being and prosperity of New Zealand, but we know that there is more to do. We are continuously looking to improve our productivity, our production systems, and our environmental practices.
The 2020 Red Meat Sector Strategy recognises the aspiration for continual improvement and refreshes our goals for a vibrant and profitable New Zealand sheep and beef sector that excels for our people, animals, and environment. The strategy establishes the critical priorities that B+LNZ and the MIA will work on together with industry partners bringing together the whole of the value chain from the farm to the market in order to deliver on our vision: “Growing sustainable value together”.
The strategy was launched at a critical time for our sector. As the world emerges from this pandemic, we must look to leverage off our competitive advantage and make the most of the opportunities that are presented. COVID-19 has been challenging but it has also allowed us to prove to ourselves and New Zealand that we have the resilience, agility, and innovation to not only weather the pandemic but to thrive as we look to a post-COVID-19 world.
The industry’s response to COVID-19 allowed the sector to deliver a phenomenal result despite the enormous disruption – 2020 was a record year for exports. It wasn’t easy but we’ve taken from it important lessons:
• New Zealand’s robust regulatory framework for food safety and its disciplines provided a strong platform for our industry to manage the crisis in a very uncertain environment;
• Strong relationships between sector bodies, the processing companies and also with the New Zealand Government enabled timely communication and discussion, and a collaborative, consistent whole-of-sector response;
• Our diverse export markets and deep relationships and understanding across supply chains bolstered our resilience during the COVID-19 crisis. New Zealand’s network of FTAs and the trade architecture New Zealand has in place played an important part in ensuring our exporters had options; and
• Healthy, sustainable, safe food will always be in high demand, especially during a crisis. Our natural production system, commitment to sustainability, food safety credentials and pasture raised, hormone-free/antibiotics free red meat are our real point of difference and a competitive advantage.
Consequently, this report also comes at a critical time. As we look ahead to economic recovery we need, more than ever, open and free trade. We need a strong multi-lateral trading system that provides a level playing field, with robust rules that can be brought to account. We need a renewed and creative effort to resolving non-tariff barriers and we need to continue to work collaboratively between government and industry to deliver for New Zealand and New Zealanders who rely on exports for their jobs, livelihoods, and communities.
Andrew Morrison Chairman and Farmer Elected Director Beef + Lamb New Zealand Ltd
John Loughlin Chairman Meat Industry Association of New Zealand
5Barriers to International Trade 2020/21
Barriers to International Trade 2020/21 6
2. AN INTRODUCTION TO THE RED MEAT SECTOR
The New Zealand sheep and beef sector is a vital driver of the New Zealand economy and prosperity. The sheep and beef sector is the second largest goods export sector, accounting for 4.7 percent of total national employment and contributing $4.6 billion in household income.
New Zealand’s economic recovery post COVID-19 will rely heavily on the success of our agricultural exports. Agriculture is often politically sensitive and trade in agricultural products tends to be highly protected.
Given the negative impacts of COVID-19 on agricultural production globally, the risks of protectionism are higher. To succeed in the current complex trading environment and weather the storm of rising protectionism, our sector needs secure access to a multiplicity of existing and future markets.
The removal of tariffs and non-tariff barriers (NTBs) improves the economics of our exports in a highly competitive market driven by global supply and demand.
The sector is also investing in its future through the development of the Taste Pure Nature origin brand, which provides a platform for marketing New Zealand’s red meat to the world and telling our story.
1
2
3
4
5
Summary
6 Barriers to International Trade 2020/21
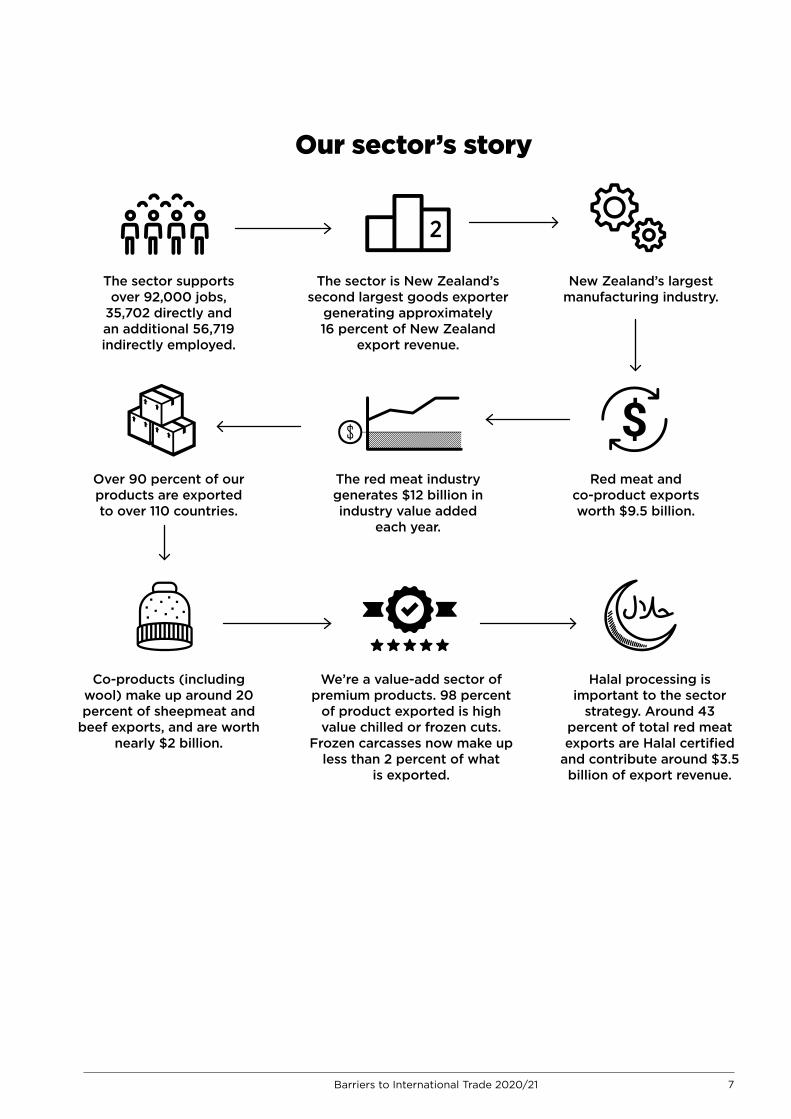
The sector supports over 92,000 jobs,
35,702 directly and an additional 56,719 indirectly employed.
Red meat and co-product exports worth $9.5 billion.
Co-products (including wool) make up around 20 percent of sheepmeat and
beef exports, and are worth nearly $2 billion.
We’re a value-add sector of premium products. 98 percent
of product exported is high value chilled or frozen cuts.
Frozen carcasses now make up less than 2 percent of what
is exported.
Halal processing is important to the sector
strategy. Around 43 percent of total red meat exports are Halal certified
and contribute around $3.5 billion of export revenue.
The red meat industry generates $12 billion in industry value added
each year.
The sector is New Zealand’s second largest goods exporter
generating approximately 16 percent of New Zealand
export revenue.
New Zealand’s largest manufacturing industry.
Over 90 percent of our products are exported to over 110 countries.
Our sector’s story
7Barriers to International Trade 2020/21
Barriers to International Trade 2020/21 8
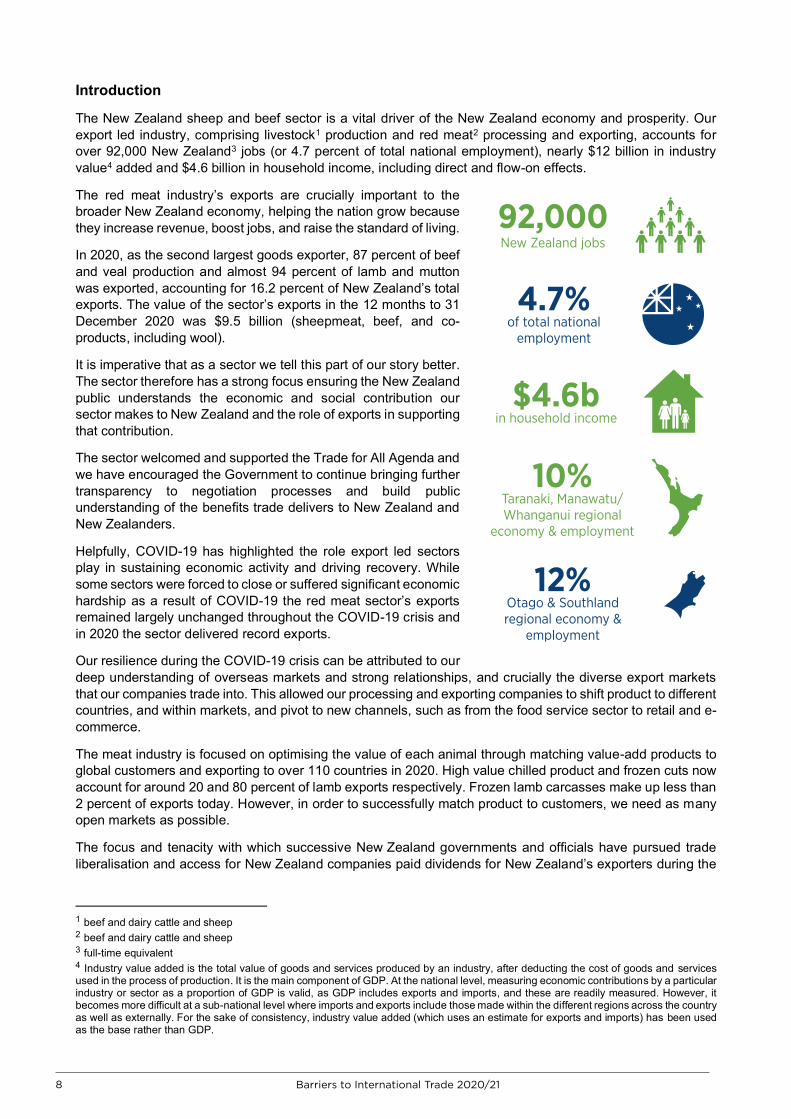
Introduction The New Zealand sheep and beef sector is a vital driver of the New Zealand economy and prosperity. Our export led industry, comprising livestock1 production and red meat2 processing and exporting, accounts for over 92,000 New Zealand3 jobs (or 4.7 percent of total national employment), nearly $12 billion in industry value4 added and $4.6 billion in household income, including direct and flow-on effects.
The red meat industry’s exports are crucially important to the broader New Zealand economy, helping the nation grow because they increase revenue, boost jobs, and raise the standard of living.
In 2020, as the second largest goods exporter, 87 percent of beef and veal production and almost 94 percent of lamb and mutton was exported, accounting for 16.2 percent of New Zealand’s total exports. The value of the sector’s exports in the 12 months to 31 December 2020 was $9.5 billion (sheepmeat, beef, and co-products, including wool).
It is imperative that as a sector we tell this part of our story better. The sector therefore has a strong focus ensuring the New Zealand public understands the economic and social contribution our sector makes to New Zealand and the role of exports in supporting that contribution.
The sector welcomed and supported the Trade for All Agenda and we have encouraged the Government to continue bringing further transparency to negotiation processes and build public understanding of the benefits trade delivers to New Zealand and New Zealanders.
Helpfully, COVID-19 has highlighted the role export led sectors play in sustaining economic activity and driving recovery. While some sectors were forced to close or suffered significant economic hardship as a result of COVID-19 the red meat sector’s exports remained largely unchanged throughout the COVID-19 crisis and in 2020 the sector delivered record exports.
Our resilience during the COVID-19 crisis can be attributed to our deep understanding of overseas markets and strong relationships, and crucially the diverse export markets that our companies trade into. This allowed our processing and exporting companies to shift product to different countries, and within markets, and pivot to new channels, such as from the food service sector to retail and e-commerce.
The meat industry is focused on optimising the value of each animal through matching value-add products to global customers and exporting to over 110 countries in 2020. High value chilled product and frozen cuts now account for around 20 and 80 percent of lamb exports respectively. Frozen lamb carcasses make up less than 2 percent of exports today. However, in order to successfully match product to customers, we need as many open markets as possible.
The focus and tenacity with which successive New Zealand governments and officials have pursued trade liberalisation and access for New Zealand companies paid dividends for New Zealand’s exporters during the
1 beef and dairy cattle and sheep 2 beef and dairy cattle and sheep 3 full-time equivalent 4 Industry value added is the total value of goods and services produced by an industry, after deducting the cost of goods and services used in the process of production. It is the main component of GDP. At the national level, measuring economic contributions by a particular industry or sector as a proportion of GDP is valid, as GDP includes exports and imports, and these are readily measured. However, it becomes more difficult at a sub-national level where imports and exports include those made within the different regions across the country as well as externally. For the sake of consistency, industry value added (which uses an estimate for exports and imports) has been used as the base rather than GDP.
92,000 New Zealand jobs
$4.6b in household income
12% Otago & Southland regional economy &
employment
10% Taranaki, Manawatu/Whanganui regional
economy & employment
4.7% of total national
employment
8 Barriers to International Trade 2020/21
Barriers to International Trade 2020/21 9
COVID-19 crisis. It has reinforced the value of a diverse market access strategy and the benefits New Zealand’s agriculture exports delivers to New Zealand.
In a post-COVID-19 world, the sector has an opportunity to leverage our natural production advantage, our focus on environmental and sustainability improvements and our international savvy. International food consultancy firm Gira forecasts that worldwide meat consumption will increase by nearly nine percent over the next four years. While the largest increases are forecast to be in the consumption of pork and poultry meat, consumption of beef and sheepmeat are also forecast to increase. This will sustain demand for New Zealand sheepmeat and beef exports.
To support the sector’s efforts to leverage these opportunities we need to ensure the Government continues to push back against protectionism, resolve non-tariff barriers (NTBs) and secure access to a multiplicity of existing and future markets.
The role of trade policy
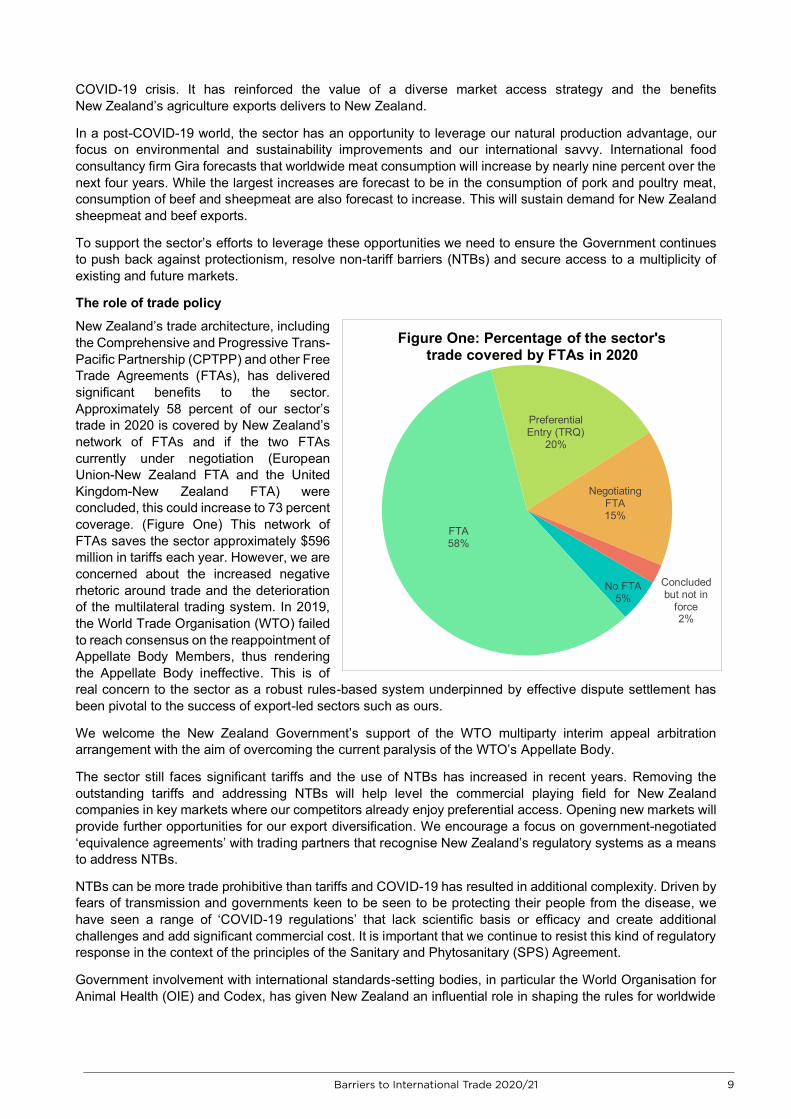
New Zealand’s trade architecture, including the Comprehensive and Progressive Trans-Pacific Partnership (CPTPP) and other Free Trade Agreements (FTAs), has delivered significant benefits to the sector. Approximately 58 percent of our sector’s trade in 2020 is covered by New Zealand’s network of FTAs and if the two FTAs currently under negotiation (European Union-New Zealand FTA and the United Kingdom-New Zealand FTA) were concluded, this could increase to 73 percent coverage. (Figure One) This network of FTAs saves the sector approximately $596 million in tariffs each year. However, we are concerned about the increased negative rhetoric around trade and the deterioration of the multilateral trading system. In 2019, the World Trade Organisation (WTO) failed to reach consensus on the reappointment of Appellate Body Members, thus rendering the Appellate Body ineffective. This is of real concern to the sector as a robust rules-based system underpinned by effective dispute settlement has been pivotal to the success of export-led sectors such as ours.
We welcome the New Zealand Government’s support of the WTO multiparty interim appeal arbitration arrangement with the aim of overcoming the current paralysis of the WTO’s Appellate Body.
The sector still faces significant tariffs and the use of NTBs has increased in recent years. Removing the outstanding tariffs and addressing NTBs will help level the commercial playing field for New Zealand companies in key markets where our competitors already enjoy preferential access. Opening new markets will provide further opportunities for our export diversification. We encourage a focus on government-negotiated ‘equivalence agreements’ with trading partners that recognise New Zealand’s regulatory systems as a means to address NTBs.
NTBs can be more trade prohibitive than tariffs and COVID-19 has resulted in additional complexity. Driven by fears of transmission and governments keen to be seen to be protecting their people from the disease, we have seen a range of ‘COVID-19 regulations’ that lack scientific basis or efficacy and create additional challenges and add significant commercial cost. It is important that we continue to resist this kind of regulatory response in the context of the principles of the Sanitary and Phytosanitary (SPS) Agreement.
Government involvement with international standards-setting bodies, in particular the World Organisation for Animal Health (OIE) and Codex, has given New Zealand an influential role in shaping the rules for worldwide
No FTA5%
FTA58%
Preferential Entry (TRQ)
20%
Negotiating FTA15%
Concluded but not in
force2%
Figure One: Percentage of the sector's trade covered by FTAs in 2020
9Barriers to International Trade 2020/21
Barriers to International Trade 2020/21 10
trade in animal products. It also supports the development of science and risk-based international standards. It is vital the Government continues to invest in this work.
Halal processing is a cornerstone of the New Zealand meat industry business model. Some 49 out of 55 processing plants approved for export are listed by the Ministry for Primary Industries (MPI) to undertake halal processing and more than 90 percent of the sheep and cattle are processed according to halal requirements. This gives companies the flexibility to export cuts from nearly every carcass to both Muslim and non-Muslim customers around the world.
Halal processing in New Zealand is underpinned by a robust halal regulatory framework administered by MPI. This helps to provide assurances to importing countries and certainty for industry about the halal requirements that must be met while also adhering to New Zealand’s high animal welfare standards. Furthermore, as the halal processing requirements vary from country to country, it provides a solid basis for MPI to negotiate the equivalence of the New Zealand standards with the importing requirements.
We appreciate the partnership with MPI to ensure this regulatory framework continues to provide assurance for our trading partners, while providing opportunities for our companies.
How does trade policy fit with the sector’s strategy?
Our sector operates in an increasingly complex and dynamic context. In 2020, the sector launched a refreshed strategy that acknowledged the new operating context. The strategy established long-term goals and a plan for the next five years to successfully identify and unlock market opportunities, while continuously improving our sustainability, productivity, and prosperity.
Since the first Red Meat Sector Strategy was adopted in 2011, cooperation has continued to grow and expand into new areas, fostering a strong collaborative spirit in our sector. By partnering across the supply chain on the most important challenges and opportunities for our sector we have been able to create value for all sector participants, as well as our consumers, communities, and country.
Market access is an important priority over the next five years as we seek to accelerate progress and grow sustainable value together. Maintaining and improving trade access to our key markets such as China, the European Union, North America, and the United Kingdom will remain important, as will identifying potential new markets.
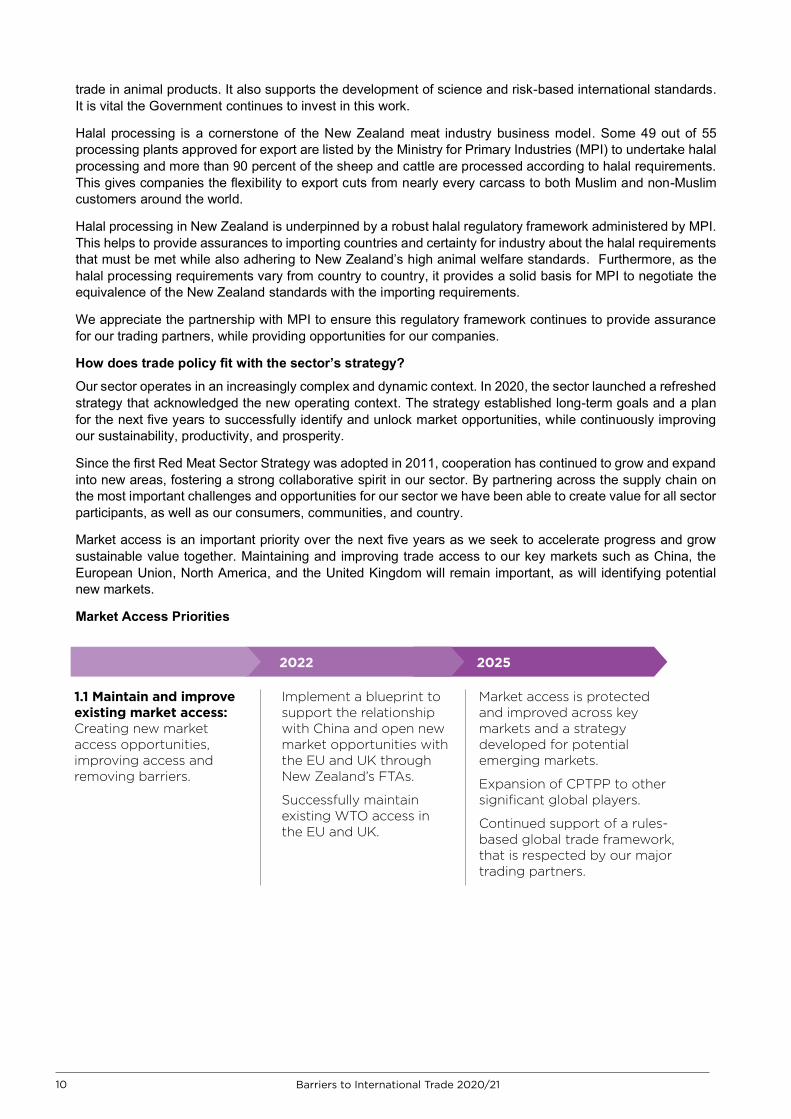
Market Access Priorities
2022 2025
1.1 Maintain and improve existing market access: Creating new market access opportunities, improving access and removing barriers.
Implement a blueprint to support the relationship with China and open new market opportunities with the EU and UK through New Zealand’s FTAs.
Successfully maintain existing WTO access in the EU and UK.
Market access is protected and improved across key markets and a strategy developed for potential emerging markets.
Expansion of CPTPP to other significant global players.
Continued support of a rules-based global trade framework, that is respected by our major trading partners.
10 Barriers to International Trade 2020/21
Barriers to International Trade 2020/21 11
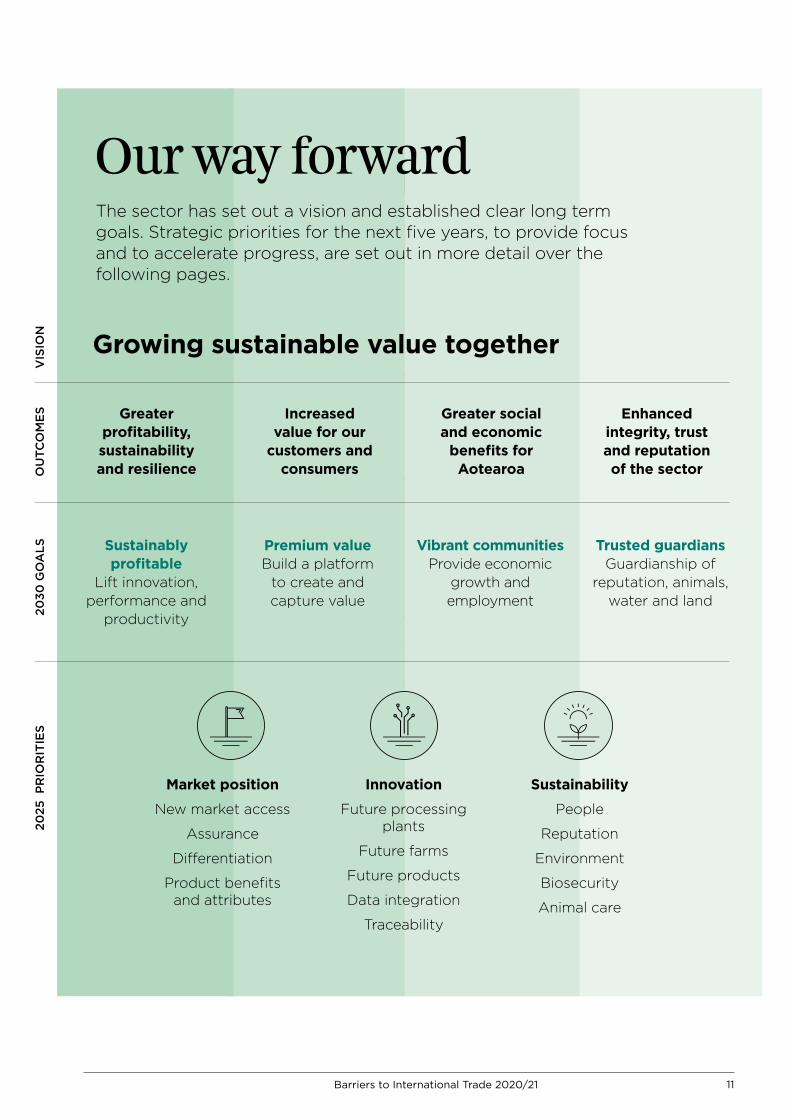
Growing sustainable value together
Sustainably profitable
Lift innovation, performance and
productivity
Market position
New market access
Assurance
Differentiation
Product benefits and attributes
Trusted guardians Guardianship of
reputation, animals, water and land
Vibrant communities Provide economic
growth and employment
Premium value Build a platform
to create and capture value
Greater profitability, sustainability and resilience
Increased value for our
customers and consumers
Greater social and economic
benefits for Aotearoa
Enhanced integrity, trust and reputation of the sectorO
UTC
OM
ES
2030
GO
ALS
2025
PR
IOR
ITIE
S
Our way forward The sector has set out a vision and established clear long term goals. Strategic priorities for the next five years, to provide focus and to accelerate progress, are set out in more detail over the following pages.
VIS
ION
Sustainability
People
Reputation
Environment
Biosecurity
Animal care
Innovation
Future processing plants
Future farms
Future products
Data integration
Traceability
11Barriers to International Trade 2020/21
Barriers to International Trade 2020/21 12
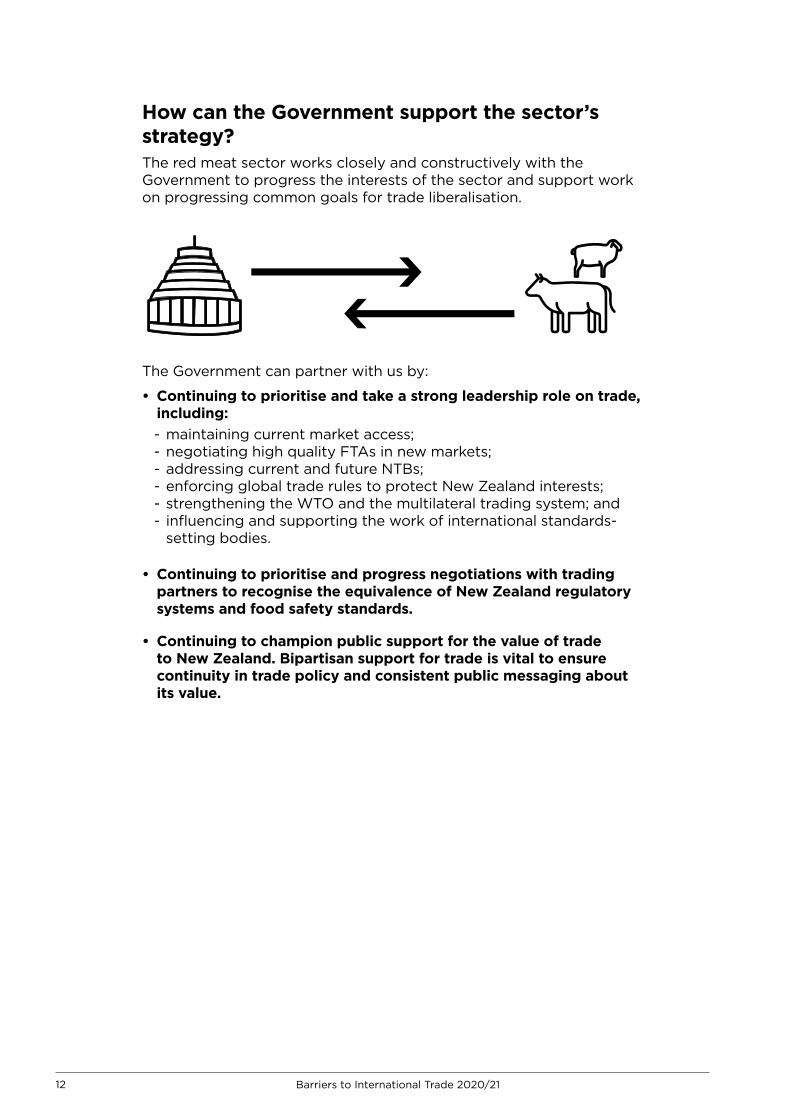
How can the Government support the sector’s strategy?The red meat sector works closely and constructively with the Government to progress the interests of the sector and support work on progressing common goals for trade liberalisation.
The Government can partner with us by:
• Continuing to prioritise and take a strong leadership role on trade, including:- maintaining current market access; - negotiating high quality FTAs in new markets; - addressing current and future NTBs;- enforcing global trade rules to protect New Zealand interests;- strengthening the WTO and the multilateral trading system; and- influencing and supporting the work of international standards-
setting bodies.
• Continuing to prioritise and progress negotiations with trading partners to recognise the equivalence of New Zealand regulatory systems and food safety standards.
• Continuing to champion public support for the value of trade to New Zealand. Bipartisan support for trade is vital to ensure continuity in trade policy and consistent public messaging about its value.
12 Barriers to International Trade 2020/21
Barriers to International Trade 2020/21 13
3. DEVELOPMENTS OVER THE LAST TWO YEARS
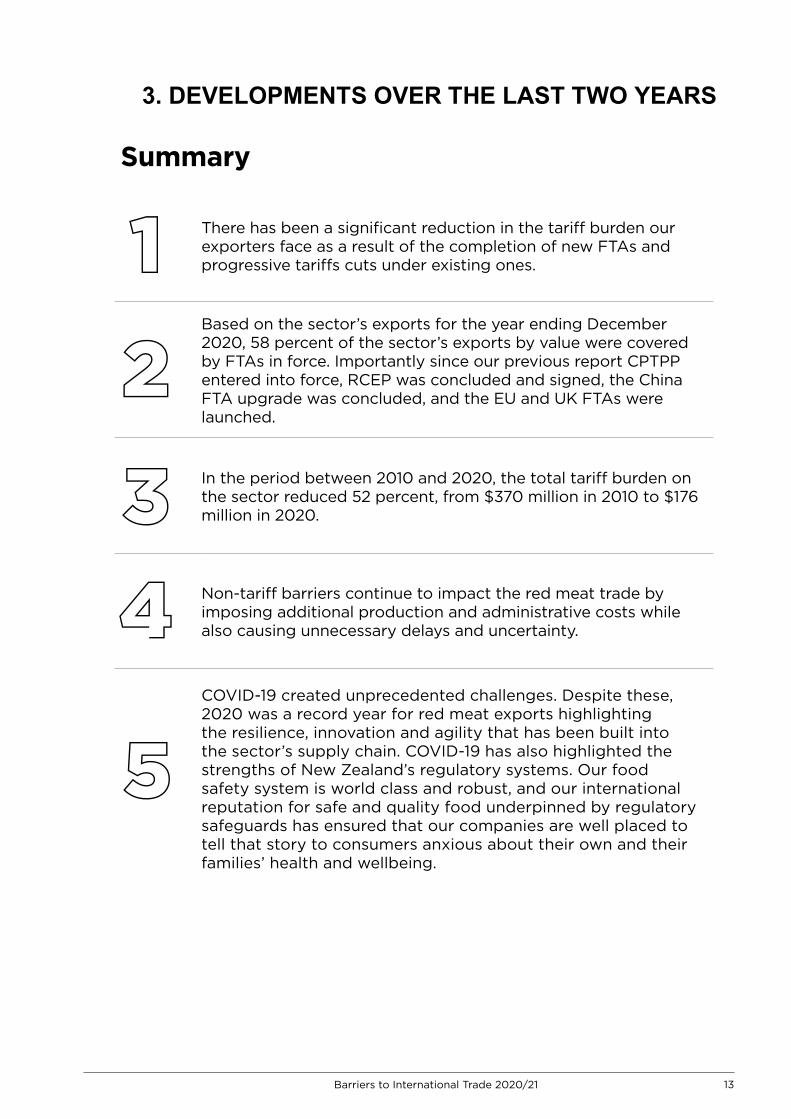
There has been a significant reduction in the tariff burden our exporters face as a result of the completion of new FTAs and progressive tariffs cuts under existing ones.
Based on the sector’s exports for the year ending December 2020, 58 percent of the sector’s exports by value were covered by FTAs in force. Importantly since our previous report CPTPP entered into force, RCEP was concluded and signed, the China FTA upgrade was concluded, and the EU and UK FTAs were launched.
In the period between 2010 and 2020, the total tariff burden on the sector reduced 52 percent, from $370 million in 2010 to $176 million in 2020.
Non-tariff barriers continue to impact the red meat trade by imposing additional production and administrative costs while also causing unnecessary delays and uncertainty.
COVID-19 created unprecedented challenges. Despite these, 2020 was a record year for red meat exports highlighting the resilience, innovation and agility that has been built into the sector’s supply chain. COVID-19 has also highlighted the strengths of New Zealand’s regulatory systems. Our food safety system is world class and robust, and our international reputation for safe and quality food underpinned by regulatory safeguards has ensured that our companies are well placed to tell that story to consumers anxious about their own and their families’ health and wellbeing.
1
2
3
4
5
Summary
13Barriers to International Trade 2020/21
Barriers to International Trade 2020/21 14
3. Developments over the last two years 3.1 Summary of changes in the last two years
Note that the 2019/2020 report sees the addition of petfood as a category to the report. This has come about as it is one of the fastest growing consumer goods categories and provides a high value revenue stream for product that would otherwise have been diverted into lower value product lines.
3.2 Introduction
The success of the sector relies on its ability to extract the maximum value from every part of the animal. To do this, the sector needs as many markets open as possible in order to export to the market that provides maximum returns for a particular cut or co-product. The Government’s efforts on market access are therefore of vital importance to the sector.
This report provides a readily accessible source of information on the trade barriers that impact significantly on the sector’s export trade. We acknowledge there are some gaps in the report. For example, the report does not cover all trade barriers in all of the approximately 110 countries with which the sector trades, but rather seeks to identify those markets where there are significant gains to be made in reducing the costs that place the sector’s products at a disadvantage compared with domestic production or similar products from our competitors.
While the report makes every attempt to provide correct and precise information, the opacity of some markets’ tariff regimes makes it difficult to fully understand the value of tariffs paid. This report is compiled using data pulled from the Global Trade Atlas website, which uses Statistics New Zealand data and uses tariff information from the WTO tariff download facility.
3.3 Trade wins for the sector over the last two years
In the two years since our last report, there has been a significant reduction in the tariff burden our exporters face as a result of the completion of new FTAs and progressive tariffs cuts under existing ones.
Important milestones since the previous report are:
• The Comprehensive and Progressive Trans-Pacific Partnership (CPTPP) entering into force; • FTA negotiations with the European Union launching and making good progress; • FTA negotiations with the United Kingdom launching and making good progress; • Signing of the Regional Comprehensive Economic Partnership (RCEP); and • The China FTA upgrade concluded.
Based on the sector’s exports for the year ending 31 December 2020, 58 percent of the sector’s exports by value were covered by FTAs in force. Other preferential trade agreements such as the Tariff Rate Quotas (TRQs) for sheepmeat and beef with the European Union and beef with the United States provide access at lower or zero tariff rates. While TRQs provide some relief from tariffs, trade is still restricted by small quotas, or high in-quota-tariff-rates. Once the European Union and United Kingdom negotiations have concluded, a significant proportion of New Zealand’s red meat trade will be covered by an FTA.
The last two years have presented a challenging trade environment for exporters. United States trade policy under President Trump created uncertainty as trade tensions escalated and the United States sought to move away from the multi-lateral institutions such as the WTO that smaller economies like New Zealand rely so much on. Compounding political and trade uncertainty, the drawn-out Brexit process loomed over exporters as dates continually shifted and the European Union and the United Kingdom struggled to come to a deal between themselves. The ongoing discussion with the European Union and the United Kingdom at the WTO about the future of New Zealand’s quotas continues to be a source of consternation for the sector.
The spread of COVID-19 across in the globe at the start of 2020 bought unprecedented disruption. The sector was not an exception to the disruption and challenges COVID-19 foisted on exporters. Supply chains and shipping schedules have been significantly impacted, and while consumer demand for red meat remained
58 percent of the sector’s exports by value were covered
by FTAs in force.
14 Barriers to International Trade 2020/21
Barriers to International Trade 2020/21 15
strong, the types of products in demand changed as lockdowns around the world closed the food service industry. An important part of the sector’s strategy and product mix, companies had to think quickly and innovatively and utilise their close relationships in order to repurpose product destined for food service and ensure they took advantage of trends in retail, such as e-commerce.
Despite the challenging environment over the past two years, there have been some major achievements, including gradual tariff reductions thanks to FTAs, securing additional market access, and launching new initiatives that will bring benefits to the sector. Additionally, the last two years has seen some significant trade and political developments in key markets that have presented both challenges and opportunities. Below we provide a summary of these developments.
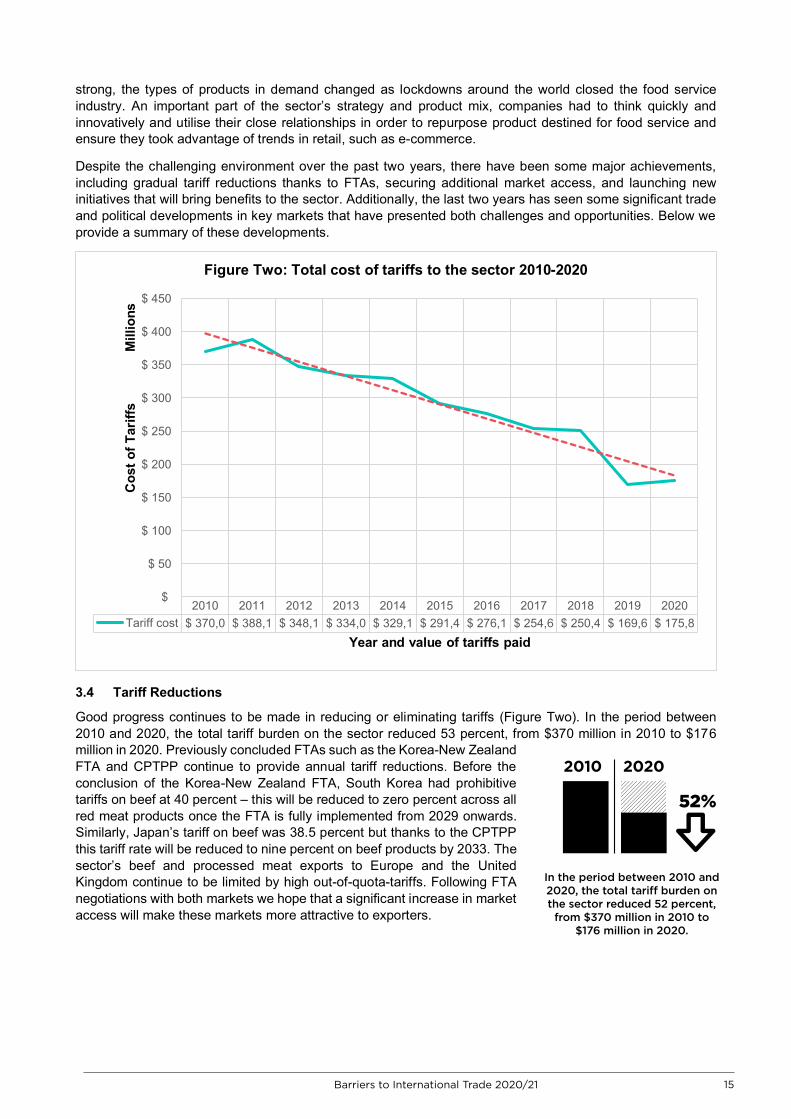
3.4 Tariff Reductions
Good progress continues to be made in reducing or eliminating tariffs (Figure Two). In the period between 2010 and 2020, the total tariff burden on the sector reduced 53 percent, from $370 million in 2010 to $176 million in 2020. Previously concluded FTAs such as the Korea-New Zealand FTA and CPTPP continue to provide annual tariff reductions. Before the conclusion of the Korea-New Zealand FTA, South Korea had prohibitive tariffs on beef at 40 percent – this will be reduced to zero percent across all red meat products once the FTA is fully implemented from 2029 onwards. Similarly, Japan’s tariff on beef was 38.5 percent but thanks to the CPTPP this tariff rate will be reduced to nine percent on beef products by 2033. The sector’s beef and processed meat exports to Europe and the United Kingdom continue to be limited by high out-of-quota-tariffs. Following FTA negotiations with both markets we hope that a significant increase in market access will make these markets more attractive to exporters.
2010 2011 2012 2013 2014 2015 2016 2017 2018 2019 2020Tariff cost $ 370,0 $ 388,1 $ 348,1 $ 334,0 $ 329,1 $ 291,4 $ 276,1 $ 254,6 $ 250,4 $ 169,6 $ 175,8
$
$ 50
$ 100
$ 150
$ 200
$ 250
$ 300
$ 350
$ 400
$ 450
Cos
t of T
ariff
sM
illio
ns
Year and value of tariffs paid
Figure Two: Total cost of tariffs to the sector 2010-2020
In the period between 2010 and 2020, the total tariff burden on the sector reduced 52 percent,
from $370 million in 2010 to $176 million in 2020.
2010
52%
2020
15Barriers to International Trade 2020/21
Barriers to International Trade 2020/21 16
Both the European Union and the United Kingdom are high value, sophisticated markets where consumers are seeking out more “natural” products of a high-quality. Enhanced market access will allow companies to respond to this growing demand, exporting sought after product to where that demand exists. Additionally, the advantage of counter seasonal production will allow consumers to have product available 365 days a year, and enjoy “best in season” which is also important when trying to grow a product category.
This complementarity also helps to maintain market stability and supports maintaining price levels that benefit producers in both the United Kingdom and New Zealand.
Tariffs in South East Asian countries have almost all been eliminated as a result of full implementation of AANZFTA. In 2020, many of these were already at low levels, of five percent or below. From 2021 onwards there will only be a small number of product lines that have tariffs remaining in these markets, all others will be at zero.
In 2020 alone, the sector saved over $596 million in duties due to FTAs. In addition, and not included in the graph above, the sector also saved over $1 billion in duties as a result of WTO access, especially due to country-specific tariff rate quotas (CSTQs) with the European Union and the United States.
But more needs to be done. Last year (2020) the sector still faced an estimated tariff burden of $176 million.
It should be noted that tariffs are paid by the importer at the point of entry and depending on the competitive situation in that market, the importer and/or end consumer would likely retain part of the benefit of lowered/removed tariffs. However, lowering/removing these tariff costs improves the competitiveness of the sector’s products, which can lead to increases in trade and income for the New Zealand industry that are greater than the tariff costs reflected in this section.
Tariffs into some countries are very high, which act as a significant deterrent to exporting to those markets. This is the case with respect to the European Union. New Zealand has very limited quota access into the European Union, especially for beef. Outside of these quotas, limited trade takes place because the out-of-quota tariff rate is 41-171 percent. Similarly, the tariff on New Zealand’s exports of sheepmeat into India is 30 percent and this is inhibiting the sector’s growth in the market.
The industry has responded to changing demand from consumers and businesses for new and more sophisticated products such as further processed meat products and prepared meals. It is also moving into other value-add products such as blood products for use in pharmaceutical production. However, these products often face high tariffs and other significant barriers into some markets. It is important to the industry that such products can be competitively positioned by the removal of excessive tariffs and NTBs.
3.5 Non-tariff barriers
Non-tariff barriers continue to impact the red meat trade by imposing additional production and administrative costs while also causing unnecessary delays and uncertainty. As tariff rates drop through the implementation of trade agreements, the importance of addressing NTB’s has become more significant. These barriers are often grounded in non-science-based technical, religious, or labelling requirements that add significant cost to production or distribution and are likely to disadvantage imported product compared to domestically produced goods. While the intent may not be to impede trade, such measures can have effects ranging from introducing uncertainty, risk, and additional cost, to preventing or stopping trade.
To address NTBs, it is essential that the Ministry of Foreign Affairs and Trade (MFAT) and MPI are adequately staffed to respond quickly, effectively, and sensitively when such issues arise. In fields such as sanitary standards, product inspection and assurance, storage, and labelling, it is desirable that the Government is pro-active in seeking agreement by importing countries to mutually recognise New Zealand procedures or establish equivalence to ensure regulatory objectives are met in an effective and cost-efficient way and the risk of trade disruption is minimised.
In 2020 the sector saved over $596 million in duties due to FTAs.
In 2020 the sector still faced an estimated tariff burden of $176 million.
16 Barriers to International Trade 2020/21
Barriers to International Trade 2020/21 17
Equally important is for the Government to look to the future and ensure it has the right resources and strategies to anticipate and stop potential trade barriers before they arise. Multi-disciplinary staff resources, a well targeted government off-shore footprint and the development of robust science-based international standards are just some of the strategies the government should look to in seeking to future proof this area. We strongly encourage the New Zealand Government to take a leadership role in international standard setting bodies such as Codex Alimentarius.
We have welcomed the establishment of dedicated teams within MFAT to tackle NTBs, the resources that have been developed specifically over the years to support companies facing issues, and forums such as the Strategic Directions Group which allow the sector a direct channel of communication for issues as they arise.
Arguably the most valuable outcome the Government could pursue for the sector would be gaining recognition of MPI’s assurance systems by all major markets. If successful (particularly in concert with enforcing accepted international standards such as those established by Codex) this would bring significant benefits for the sector. We encourage officials to view existing negotiations and agreements as vehicles to address both tariffs and NTBs and to seek commercially meaningful outcomes such as equivalence of assurance systems.
New Zealand has over 130 years experience as an exporter of meat and meat-related products. We export to over 110 countries and meet a wide range of regulatory and consumer requirements on a daily basis. This has been made possible by having an innovative and resilient industry, a robust, world-class regulatory system and government officials who are skilled, tenacious, and effective in pursuing access to markets on the most favourable terms possible. To ensure that we continue to realise the highest possible returns from our export markets for sheepmeat, beef and associated co-products we cannot afford to relax our efforts.
3.6 COVID-19 and the impact on the red meat sector The outbreak of COVID-19 changed everything for everyone, including the red meat sector. Supply chains experienced unprecedented disruption due to congestion at ports, and disruption to air and sea freight and distribution networks in market (including, for example, trucking and cold storage). Additionally, while demand for red meat remained strong, as lockdown measures globally largely closed the food service industry (a significant channel for our most valuable cuts) the nature of consumer demand changed. Companies were agile and innovative in their response, repurposing and redirecting product to different markets and embracing new channels to market such as e-commerce.
In an already politically tense environment initial reactions by countries leaned towards protectionism, anxious about food security and the transmission of COVID-19. The sector appreciated the work and leadership the Government demonstrated at the time, and since, to avoid a global protectionist movement, and in seeking commitments from trading partners to keep supply chains open and pursuing initiatives to ensure trade could continue.
Despite these challenges the sector has come through the pandemic remarkably well, 2020 was a record year for exports highlighting the resilience, innovation and agility that has been built into the sector’s supply chain.
While the sector has not been subject to significant NTBs as a result of COVID-19 there has been regulatory creep where governments are seeking to contain the virus, and in some cases companies have been subject to additional customs checks as a result of concerns about transmission.
COVID-19 has highlighted the strengths of New Zealand’s regulatory systems. Our food safety system is world class and robust, and our international reputation for safe and quality food underpinned by regulatory safeguards has ensured our companies are well placed to tell that story to consumers anxious about their own and their families’ health and wellbeing.
Additionally, the Government’s successful response to COVID-19 has also been a point of difference and strength for New Zealand companies seeking to push back on any additional layers of regulation required by trading partners.
As New Zealand and the world begin to emerge from the pandemic response, we are all looking to post-COVID-19 recovery and how we not only recover but thrive. The sector is very conscious of the opportunities and the challenges in this respect. The Red Meat Sector Strategy 2020 looks to position the sector to respond to those opportunities and challenges and grow sustainable value for New Zealand.
17Barriers to International Trade 2020/21
Barriers to International Trade 2020/21 18
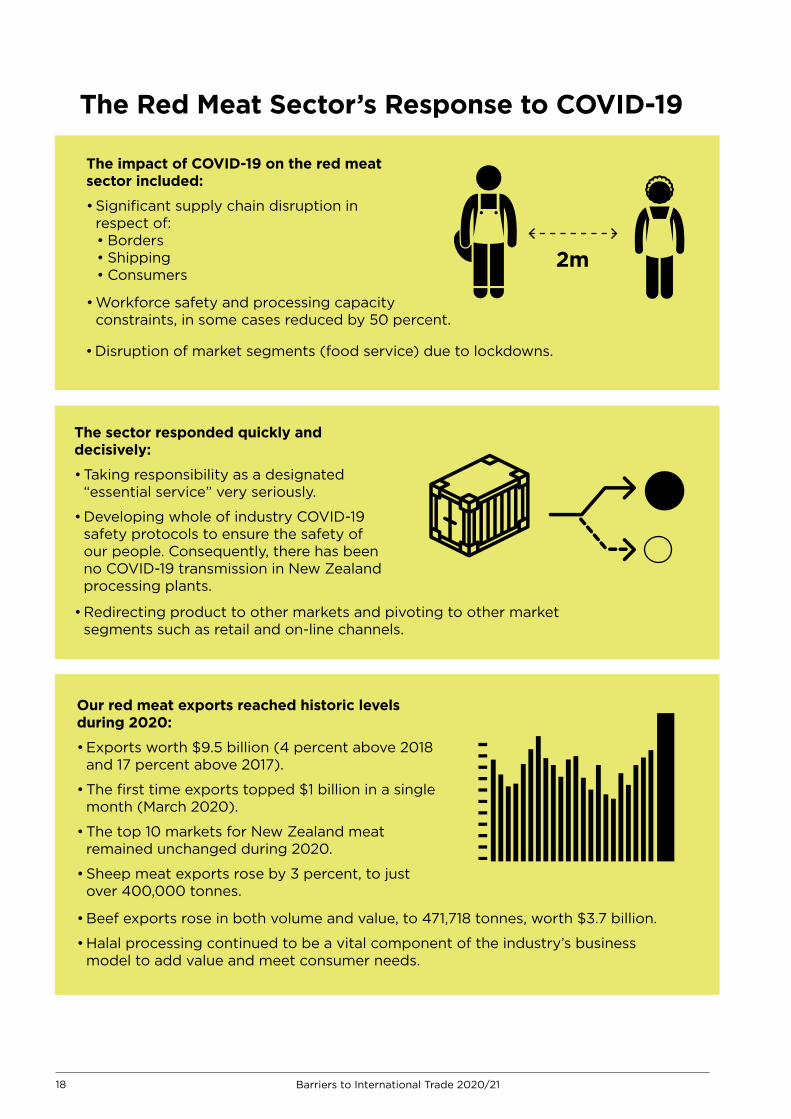
The Red Meat Sector’s Response to COVID-19
The impact of COVID-19 on the red meat sector included:
• Significant supply chain disruption in respect of:• Borders• Shipping• Consumers
The sector responded quickly and decisively:
• Taking responsibility as a designated “essential service” very seriously.
• Developing whole of industry COVID-19 safety protocols to ensure the safety of our people. Consequently, there has been no COVID-19 transmission in New Zealand processing plants.
Our red meat exports reached historic levels during 2020:
• Exports worth $9.5 billion (4 percent above 2018 and 17 percent above 2017).
• The first time exports topped $1 billion in a single month (March 2020).
• The top 10 markets for New Zealand meat remained unchanged during 2020.
• Sheep meat exports rose by 3 percent, to just over 400,000 tonnes.
2m
• Beef exports rose in both volume and value, to 471,718 tonnes, worth $3.7 billion.
• Halal processing continued to be a vital component of the industry’s business model to add value and meet consumer needs.
• Redirecting product to other markets and pivoting to other market segments such as retail and on-line channels.
• Disruption of market segments (food service) due to lockdowns.
• Workforce safety and processing capacity constraints, in some cases reduced by 50 percent.
18 Barriers to International Trade 2020/21
Barriers to International Trade 2020/21 19
3.7 Market Access Developments
3.7.1 Comprehensive and Progressive Agreement for Trans-Pacific Partnership (CPTPP)
The sector welcomed the signing and subsequent entry into force of the CPTPP in December 2018. Annual tariff cuts since 1 January 2019 have continued to deliver savings for our sector. Since the agreement came into force, the sector has saved nearly $56 million, mainly on beef and offal exports to Japan but also on processed meats, petfood and sheepmeat exports to Canada and Mexico.
In January 2021, the United Kingdom made a formal request to accede to the CPTPP. The sector welcomed this development but also made clear our expectation that any new members wishing to join the agreement will need to meet the ambitious, comprehensive, and high-quality outcomes expected of CPTPP partners, including on red meat and other agricultural products.
3.7.2 Regional Comprehensive Economic Partnership (RCEP)
The sector welcomed the signing of the RCEP trade agreement in November 2020. Although disappointing that the agreement does not include India, the agreement will help to deepen cooperation and strengthen trade in the region. This region accounts for around 50 percent of the sector’s global trade.
Through AANZFTA, tariffs on New Zealand red meat exports are already relatively low, however, RCEP did result in some tariff reductions on exports to Indonesia. These reductions were all from five percent to zero and will happen either at entry into force or will be phased out over a 15-year time frame.
We remain hopeful that India will eventually join RCEP to help turbocharge the gains from the agreement. India presents major opportunities for New Zealand meat exporters, given its forecast population growth and an expanding middle-class keen to access high-quality food.
3.7.3 China Trade with China
Exports to China have continued to rise, with China briefly overtaking the United States as our largest destination for beef as a result of African Swine Fever (ASF). While beef exports from New Zealand to China have tripled in the last three years, New Zealand’s main competitors (Brazil, Australia, Argentina, and Uruguay) have also seen beef exports to China rise by a similar amount.
This increase in demand has been due to ASF decimating China’s pig population and reducing domestic pork supply by at least 20 million tonnes in 2020.
This has had a huge impact on global meat trade over the last two years. While some of the protein shortfall has been met by increased domestic production of other species, particularly poultry, imports of meat have also dramatically increased. In 2020, China imported 9.9 million tonnes of meat (beef, sheepmeat, pork and chicken). This was more than double the volume than was imported in 2018 and was the equivalent to China importing 27,000 tonnes of meat every day during 2020.
Prior to ASF, the retail prices for beef and sheepmeat were significantly higher than pork. While ASF has pushed up the price of all protein in China the largest increase has been in pork prices, and the price premium for sheepmeat and beef over pork has been somewhat reduced.
China has been taking significant steps to bring the ASF outbreak under control, including large scale construction of commercial pork production facilities with strict biosecurity protocols. When these come into full production over the next few years it is possible that the current levels of beef consumption will decline as consumers switch back to pork as the cheaper protein. However, the timing of the domestic pork production recovery is still uncertain, and there have been suggestions that higher beef consumption may continue as consumers have had greater exposure to it over the last few years.
Phase One of the United States - China trade deal was signed at the beginning of 2020 with the agreement containing provisions for United States access to the Chinese beef market to be significantly improved. The agreement would have allowed all plants approved by the FDA for beef production to export to China, with China promising to review the ban on beef produced with HGPs within a year. This would have given the United States some of the best access into China of any producer and would likely have caused significant
19Barriers to International Trade 2020/21
Barriers to International Trade 2020/21 20
changes in the North Asian (China, South Korea, and Japan) beef trade. However, as long as the other conditions of the Phase One deal have not been met and the United States - China trade tensions continues it is unlikely that United States beef exports to China are going to greatly expand anytime soon as United States beef exports to China are subject to tariffs of between 12 and 25 percent.
The FTA Upgrade
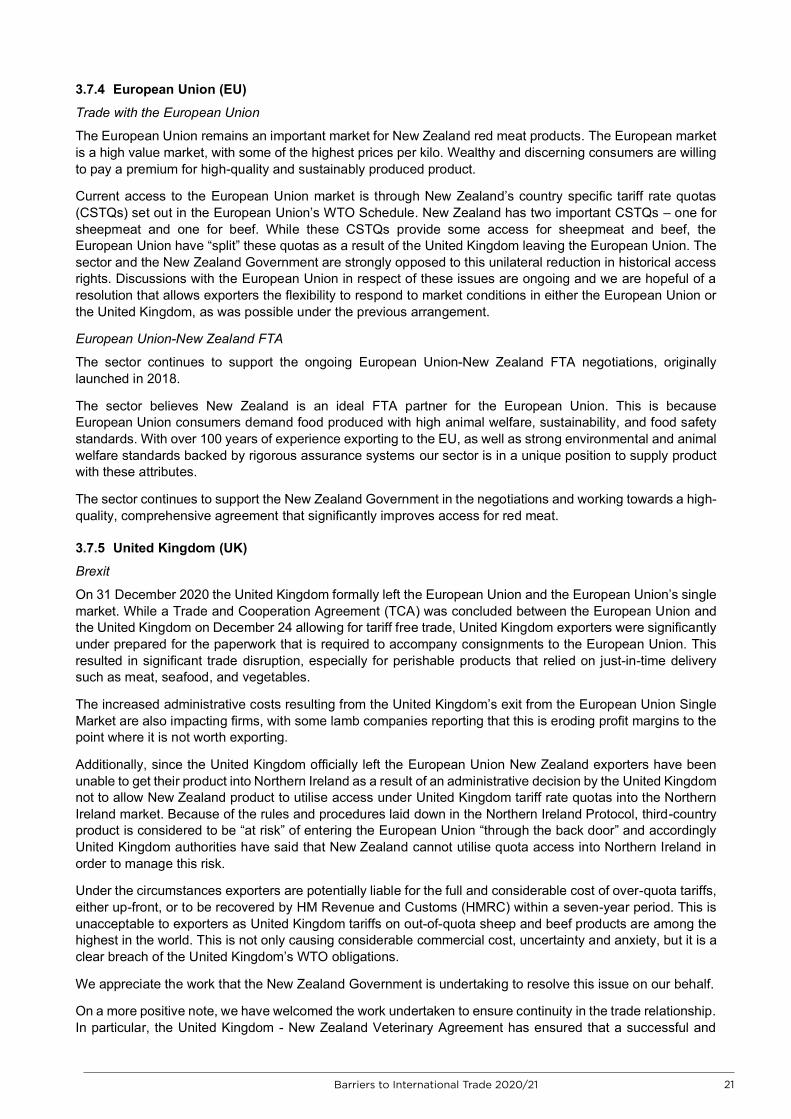
China is now the sector’s largest market with exports worth over $3.4 billion in 2020. The New Zealand-China FTA, which came into force in 2008, has played a major part in growing the Chinese market with tariffs on sheepmeat, beef and associated co-products going to zero on 1 January 2017 (excluding wool). In 2020 alone, the sector saved over $475 million worth of tariffs on exports to China. China continues to be a significant market for a wide range of New Zealand sheepmeat, beef, and associated co-products.
In January 2021 New Zealand and China announced that they had signed an upgrade of the FTA. The upgrade will improve upon the FTA’s existing commitments and adds to the 2008 Agreement in a number areas including, importantly for our sector, technical barriers to trade, customs procedures and cooperation. Trade facilitation provisions will simplify export procedures, remove a level of administration, paperwork and reduce compliance costs for red meat exporters. We anticipate a reduction in the time our exporters spend waiting for goods to clear customs, enhanced transparency, and predictability for businesses.
The FTA upgrade will also allow for the self-declaration of origin. Currently, exporters need a certification of origin from the Chambers of Commerce. It also includes provisions for expedited clearance of perishable goods with clearance times through the border within six hours of arrival. There will also be improvements on arrangements for products transiting through other countries.
0
500
1,000
1,500
2,000
2,500
3,000
3,500
4,000
4,500
NZD
$M
illio
ns
Year
Figure Three: New Zealand Red Meat Sector Exports to China 2001-2020
Chilled Beef Frozen Beef Frozen Sheepmeat Chilled Sheepmeat Offals Co-Products Wool
20 Barriers to International Trade 2020/21
Barriers to International Trade 2020/21 21
3.7.4 European Union (EU) Trade with the European Union
The European Union remains an important market for New Zealand red meat products. The European market is a high value market, with some of the highest prices per kilo. Wealthy and discerning consumers are willing to pay a premium for high-quality and sustainably produced product.
Current access to the European Union market is through New Zealand’s country specific tariff rate quotas (CSTQs) set out in the European Union’s WTO Schedule. New Zealand has two important CSTQs – one for sheepmeat and one for beef. While these CSTQs provide some access for sheepmeat and beef, the European Union have “split” these quotas as a result of the United Kingdom leaving the European Union. The sector and the New Zealand Government are strongly opposed to this unilateral reduction in historical access rights. Discussions with the European Union in respect of these issues are ongoing and we are hopeful of a resolution that allows exporters the flexibility to respond to market conditions in either the European Union or the United Kingdom, as was possible under the previous arrangement.
European Union-New Zealand FTA
The sector continues to support the ongoing European Union-New Zealand FTA negotiations, originally launched in 2018.
The sector believes New Zealand is an ideal FTA partner for the European Union. This is because European Union consumers demand food produced with high animal welfare, sustainability, and food safety standards. With over 100 years of experience exporting to the EU, as well as strong environmental and animal welfare standards backed by rigorous assurance systems our sector is in a unique position to supply product with these attributes.
The sector continues to support the New Zealand Government in the negotiations and working towards a high-quality, comprehensive agreement that significantly improves access for red meat.
3.7.5 United Kingdom (UK)
Brexit
On 31 December 2020 the United Kingdom formally left the European Union and the European Union’s single market. While a Trade and Cooperation Agreement (TCA) was concluded between the European Union and the United Kingdom on December 24 allowing for tariff free trade, United Kingdom exporters were significantly under prepared for the paperwork that is required to accompany consignments to the European Union. This resulted in significant trade disruption, especially for perishable products that relied on just-in-time delivery such as meat, seafood, and vegetables.
The increased administrative costs resulting from the United Kingdom’s exit from the European Union Single Market are also impacting firms, with some lamb companies reporting that this is eroding profit margins to the point where it is not worth exporting.
Additionally, since the United Kingdom officially left the European Union New Zealand exporters have been unable to get their product into Northern Ireland as a result of an administrative decision by the United Kingdom not to allow New Zealand product to utilise access under United Kingdom tariff rate quotas into the Northern Ireland market. Because of the rules and procedures laid down in the Northern Ireland Protocol, third-country product is considered to be “at risk” of entering the European Union “through the back door” and accordingly United Kingdom authorities have said that New Zealand cannot utilise quota access into Northern Ireland in order to manage this risk.
Under the circumstances exporters are potentially liable for the full and considerable cost of over-quota tariffs, either up-front, or to be recovered by HM Revenue and Customs (HMRC) within a seven-year period. This is unacceptable to exporters as United Kingdom tariffs on out-of-quota sheep and beef products are among the highest in the world. This is not only causing considerable commercial cost, uncertainty and anxiety, but it is a clear breach of the United Kingdom’s WTO obligations.
We appreciate the work that the New Zealand Government is undertaking to resolve this issue on our behalf.
On a more positive note, we have welcomed the work undertaken to ensure continuity in the trade relationship. In particular, the United Kingdom - New Zealand Veterinary Agreement has ensured that a successful and
21Barriers to International Trade 2020/21
Barriers to International Trade 2020/21 22
important framework that existed with the European Union was able to be carried over into the relationship with the United Kingdom post Brexit.
United Kingdom-New Zealand FTA
The sector welcomed the launch of the United Kingdom - New Zealand FTA negotiations in June 2020. The United Kingdom is an important market for New Zealand’s high value lamb exports and has good potential for beef and processed meats. The FTA is an opportunity to strengthen our bilateral relationship and generate additional export revenue for the country.
The United Kingdom was New Zealand’s third largest red meat and co-product market by individual country in 2020, behind China and the United States. The United Kingdom was also New Zealand’s largest market for chilled lamb in 2020, worth over $184 million and making up nearly 24 percent of total chilled lamb exports.
The sector’s red meat exports complement seasonal production in the United Kingdom so that customers can buy high-quality red meat all year around. Trade with New Zealand ensures there is lamb available on shelves at Easter and Christmas when British farmers aren’t producing. With mutual ambitions to grow the lamb category, it is strategically important to ensure product remains on the shelf all year round.
3.7.6 United States of America (United States) Joe Biden’s election to President of the United States is already resulting in significant changes to foreign and domestic policy from the Trump administration’s approach. While the sector is hopeful that the United States will return to the CPTPP, we recognise that there is ongoing domestic public concern about the effect of trade on employment and the economy. Additionally, the ongoing COVID-19 pandemic is likely to hold the focus of the new administration for the short term.
We welcomed the Biden administration’s reassertion of American global leadership and commitment to multilateral cooperation. The sector is hopeful that this will translate to a reengagement with the WTO that allows the reform it needs to strengthen and enhance a valuable multilateral institution.
3.8 Other Trade Policy Developments
3.8.1 E-commerce/Digital Trade E-commerce is a field that continues to grow and is only forecast to increase in importance, including for the agriculture and food and beverage sectors. COVID-19 encouraged online shopping and saw significant increases in the amount of food that was purchased online. E-commerce covers a wide range of issues, from selling product online through to e-certification and verification. While this represents opportunities for New Zealand exporters to reduce the hassle of paper certification and extract more value by getting closer to the end consumer, there are also risks that it puts increasingly onerous costs on exporters to comply with and verify that product is meeting requirements.
The Digital Economy and Partnership Agreement (DEPA) was signed by New Zealand, Chile and Singapore in June 2020 and entered into force for New Zealand and Singapore on 7 January 2021. The DEPA contains provisions on the use of technology to facilitate trade, including through paperless trading, faster customs procedures, and the growth of e-payments. These provisions support and facilitate trade and the reduction in NTBs the sector commonly encounters.
3.8.2 Sustainability and Trade
Trade and the environment are increasingly becoming interlinked. As part of the Trade for All Agenda, the sector supported more robust and ambitious outcomes on trade and the environment.
Consequently, we have also supported the launch of the Agreement on Climate Change, Trade and Sustainability (ACCTS) although we caution against eco-labelling provisions inadvertently creating NTBs.
3.9 Looking further ahead The sector is supportive of the government’s current FTA and market access agenda, which covers the sector’s current priority markets. We have benefited significantly from the negotiation of FTAs; however, the sector is always looking at potential in markets that have not been traditional partners or that could be further strengthened.
22 Barriers to International Trade 2020/21
Barriers to International Trade 2020/21 23
The international trade environment is becoming more challenging and for a trading nation such as New Zealand which is a significant agriculture exporter, the impacts of protectionism could be significant if we do not have risk mitigation strategies in place. Having access to a diverse trade portfolio makes an important contribution to the export sector’s resilience. Looking at current trade, 58 percent of the sector's exports are covered by FTA’s where tariffs have reduced or are in the process of reducing. What this doesn’t consider is where trade is limited due to tariffs, quotas, or non-tariff barriers. It is therefore important that the sector does not rest on its laurels and continues to look to the future. It will be important to anticipate where future demand will come from and ensure that the sector is well placed to meet that demand.
Over the past 30 years the sector has seen demand shift from European and North American markets to North and South-East Asia. While it is expected that these markets will continue to be major destinations for the sector’s products, social, economic, and cultural factors are all likely to impact demand for red meat around the world. The sector urges the New Zealand Government to continue supporting the sector through new and continued FTA negotiations. The sector is undertaking work to identify where new opportunities may lie. Additionally, consideration is also being given to what new approaches or trade models may unlock markets in a commercially meaningful way.
23Barriers to International Trade 2020/21
Barriers to International Trade 2020/21 24
4. SUMMARY OF RED MEAT AND CO-PRODUCT EXPORTS BY PRODUCT AND MARKET
Summary
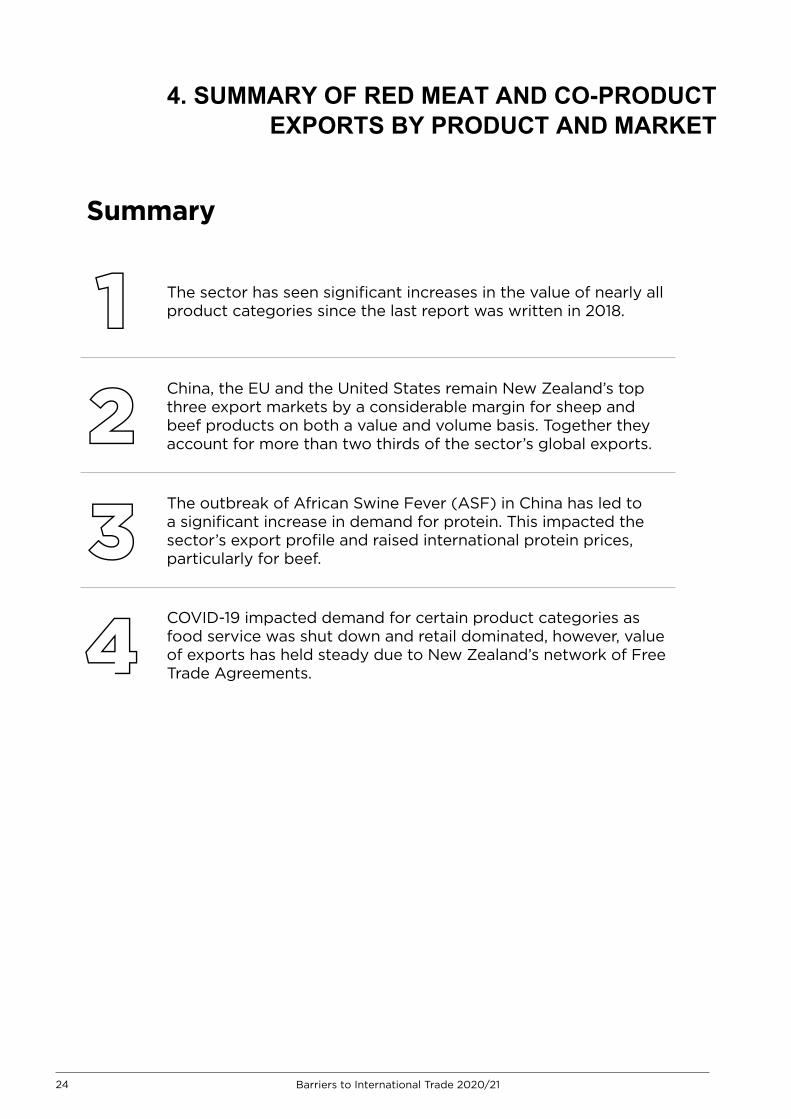
The sector has seen significant increases in the value of nearly all product categories since the last report was written in 2018.
China, the EU and the United States remain New Zealand’s top three export markets by a considerable margin for sheep and beef products on both a value and volume basis. Together they account for more than two thirds of the sector’s global exports.
The outbreak of African Swine Fever (ASF) in China has led to a significant increase in demand for protein. This impacted the sector’s export profile and raised international protein prices, particularly for beef.
COVID-19 impacted demand for certain product categories as food service was shut down and retail dominated, however, value of exports has held steady due to New Zealand’s network of Free Trade Agreements.
1
2
3
4
24 Barriers to International Trade 2020/21
Barriers to International Trade 2020/21 25
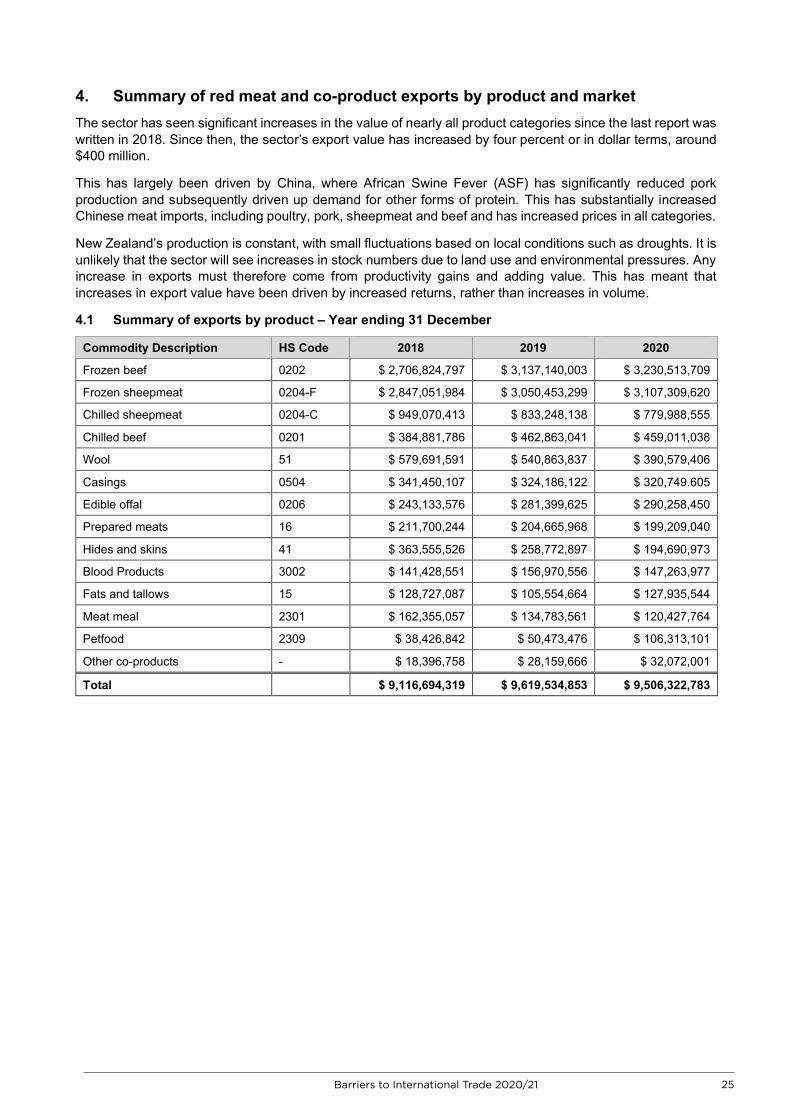
4. Summary of red meat and co-product exports by product and market The sector has seen significant increases in the value of nearly all product categories since the last report was written in 2018. Since then, the sector’s export value has increased by four percent or in dollar terms, around $400 million.
This has largely been driven by China, where African Swine Fever (ASF) has significantly reduced pork production and subsequently driven up demand for other forms of protein. This has substantially increased Chinese meat imports, including poultry, pork, sheepmeat and beef and has increased prices in all categories.
New Zealand’s production is constant, with small fluctuations based on local conditions such as droughts. It is unlikely that the sector will see increases in stock numbers due to land use and environmental pressures. Any increase in exports must therefore come from productivity gains and adding value. This has meant that increases in export value have been driven by increased returns, rather than increases in volume.
4.1 Summary of exports by product – Year ending 31 December
Commodity Description HS Code 2018 2019 2020
Frozen beef 0202 $ 2,706,824,797 $ 3,137,140,003 $ 3,230,513,709
Frozen sheepmeat 0204-F $ 2,847,051,984 $ 3,050,453,299 $ 3,107,309,620
Chilled sheepmeat 0204-C $ 949,070,413 $ 833,248,138 $ 779,988,555
Chilled beef 0201 $ 384,881,786 $ 462,863,041 $ 459,011,038
Wool 51 $ 579,691,591 $ 540,863,837 $ 390,579,406
Casings 0504 $ 341,450,107 $ 324,186,122 $ 320,749.605
Edible offal 0206 $ 243,133,576 $ 281,399,625 $ 290,258,450
Prepared meats 16 $ 211,700,244 $ 204,665,968 $ 199,209,040
Hides and skins 41 $ 363,555,526 $ 258,772,897 $ 194,690,973
Blood Products 3002 $ 141,428,551 $ 156,970,556 $ 147,263,977
Fats and tallows 15 $ 128,727,087 $ 105,554,664 $ 127,935,544
Meat meal 2301 $ 162,355,057 $ 134,783,561 $ 120,427,764
Petfood 2309 $ 38,426,842 $ 50,473,476 $ 106,313,101
Other co-products - $ 18,396,758 $ 28,159,666 $ 32,072,001
Total $ 9,116,694,319 $ 9,619,534,853 $ 9,506,322,783
25Barriers to International Trade 2020/21
Barriers to International Trade 2020/21 26
4.2 Summary of exports by market
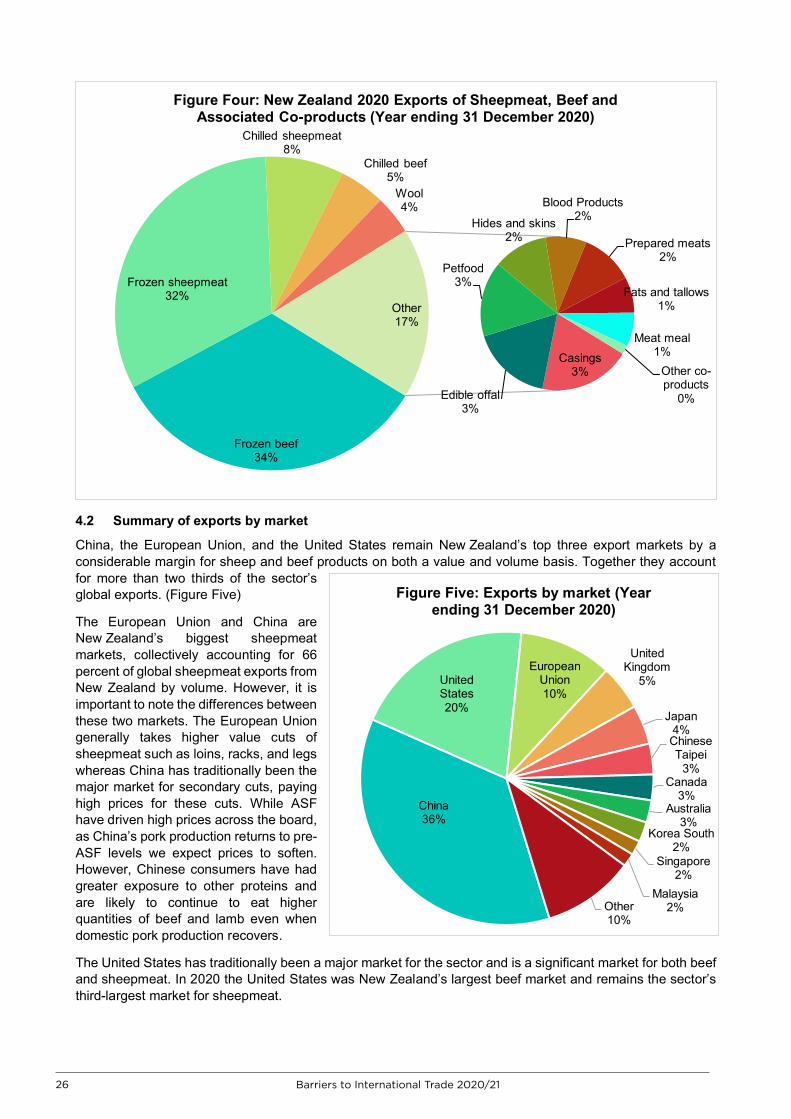
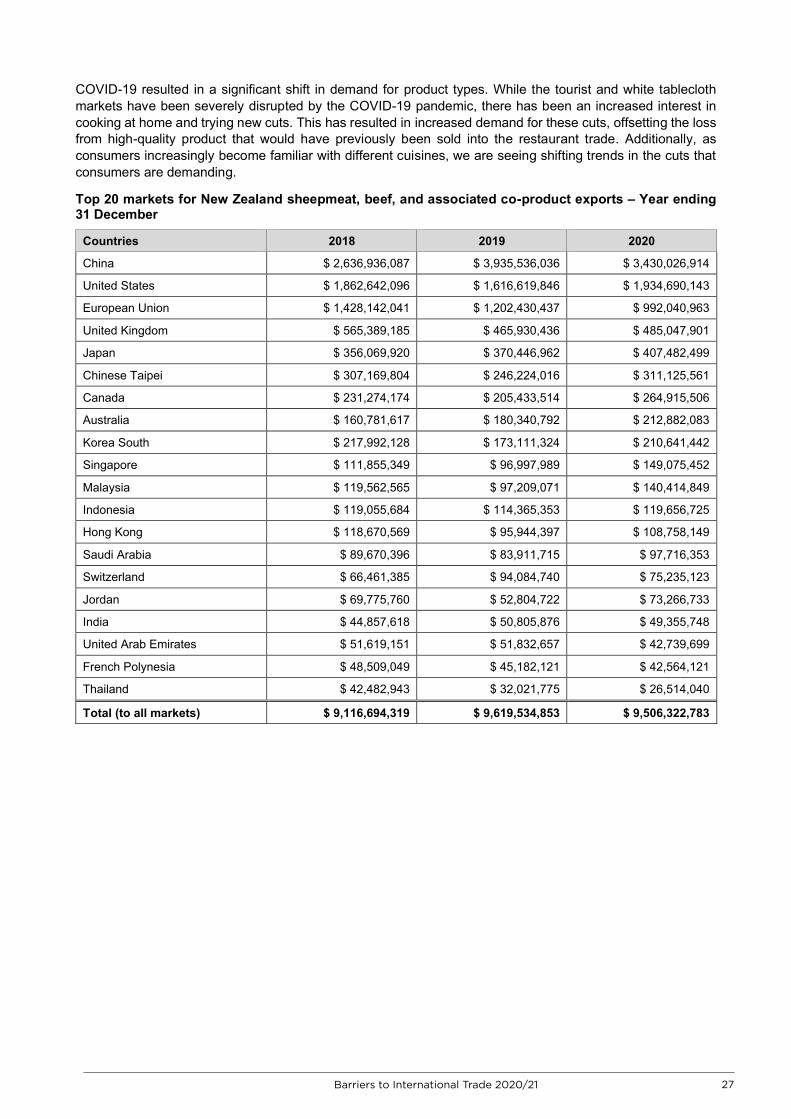
China, the European Union, and the United States remain New Zealand’s top three export markets by a considerable margin for sheep and beef products on both a value and volume basis. Together they account for more than two thirds of the sector’s global exports. (Figure Five)
The European Union and China are New Zealand’s biggest sheepmeat markets, collectively accounting for 66 percent of global sheepmeat exports from New Zealand by volume. However, it is important to note the differences between these two markets. The European Union generally takes higher value cuts of sheepmeat such as loins, racks, and legs whereas China has traditionally been the major market for secondary cuts, paying high prices for these cuts. While ASF have driven high prices across the board, as China’s pork production returns to pre-ASF levels we expect prices to soften. However, Chinese consumers have had greater exposure to other proteins and are likely to continue to eat higher quantities of beef and lamb even when domestic pork production recovers.
The United States has traditionally been a major market for the sector and is a significant market for both beef and sheepmeat. In 2020 the United States was New Zealand’s largest beef market and remains the sector’s third-largest market for sheepmeat.
Frozen beef34%
Frozen sheepmeat32%
Chilled sheepmeat8%
Chilled beef5%
Wool4%
Casings3%
Edible offal3%
Petfood3%
Hides and skins2%
Blood Products 2%
Prepared meats2%
Fats and tallows1%
Meat meal1%
Other co-products
0%
Other17%
Figure Four: New Zealand 2020 Exports of Sheepmeat, Beef and Associated Co-products (Year ending 31 December 2020)
China36%
United States20%
European Union10%
United Kingdom
5%
Japan4%Chinese Taipei
3%Canada
3%Australia
3%Korea South
2%Singapore
2%Malaysia
2%Other10%
Figure Five: Exports by market (Year ending 31 December 2020)
26 Barriers to International Trade 2020/21
Barriers to International Trade 2020/21 27
COVID-19 resulted in a significant shift in demand for product types. While the tourist and white tablecloth markets have been severely disrupted by the COVID-19 pandemic, there has been an increased interest in cooking at home and trying new cuts. This has resulted in increased demand for these cuts, offsetting the loss from high-quality product that would have previously been sold into the restaurant trade. Additionally, as consumers increasingly become familiar with different cuisines, we are seeing shifting trends in the cuts that consumers are demanding.
Top 20 markets for New Zealand sheepmeat, beef, and associated co-product exports – Year ending 31 December
Countries 2018 2019 2020
China $ 2,636,936,087 $ 3,935,536,036 $ 3,430,026,914
United States $ 1,862,642,096 $ 1,616,619,846 $ 1,934,690,143
European Union $ 1,428,142,041 $ 1,202,430,437 $ 992,040,963
United Kingdom $ 565,389,185 $ 465,930,436 $ 485,047,901
Japan $ 356,069,920 $ 370,446,962 $ 407,482,499
Chinese Taipei $ 307,169,804 $ 246,224,016 $ 311,125,561
Canada $ 231,274,174 $ 205,433,514 $ 264,915,506
Australia $ 160,781,617 $ 180,340,792 $ 212,882,083
Korea South $ 217,992,128 $ 173,111,324 $ 210,641,442
Singapore $ 111,855,349 $ 96,997,989 $ 149,075,452
Malaysia $ 119,562,565 $ 97,209,071 $ 140,414,849
Indonesia $ 119,055,684 $ 114,365,353 $ 119,656,725
Hong Kong $ 118,670,569 $ 95,944,397 $ 108,758,149
Saudi Arabia $ 89,670,396 $ 83,911,715 $ 97,716,353
Switzerland $ 66,461,385 $ 94,084,740 $ 75,235,123
Jordan $ 69,775,760 $ 52,804,722 $ 73,266,733
India $ 44,857,618 $ 50,805,876 $ 49,355,748
United Arab Emirates $ 51,619,151 $ 51,832,657 $ 42,739,699
French Polynesia $ 48,509,049 $ 45,182,121 $ 42,564,121
Thailand $ 42,482,943 $ 32,021,775 $ 26,514,040
Total (to all markets) $ 9,116,694,319 $ 9,619,534,853 $ 9,506,322,783
27Barriers to International Trade 2020/21
28 Barriers to International Trade 2018/19
5. SUMMARY OF BARRIERS AND NON-TARIFF BARRIERS TO TRADE
Summary
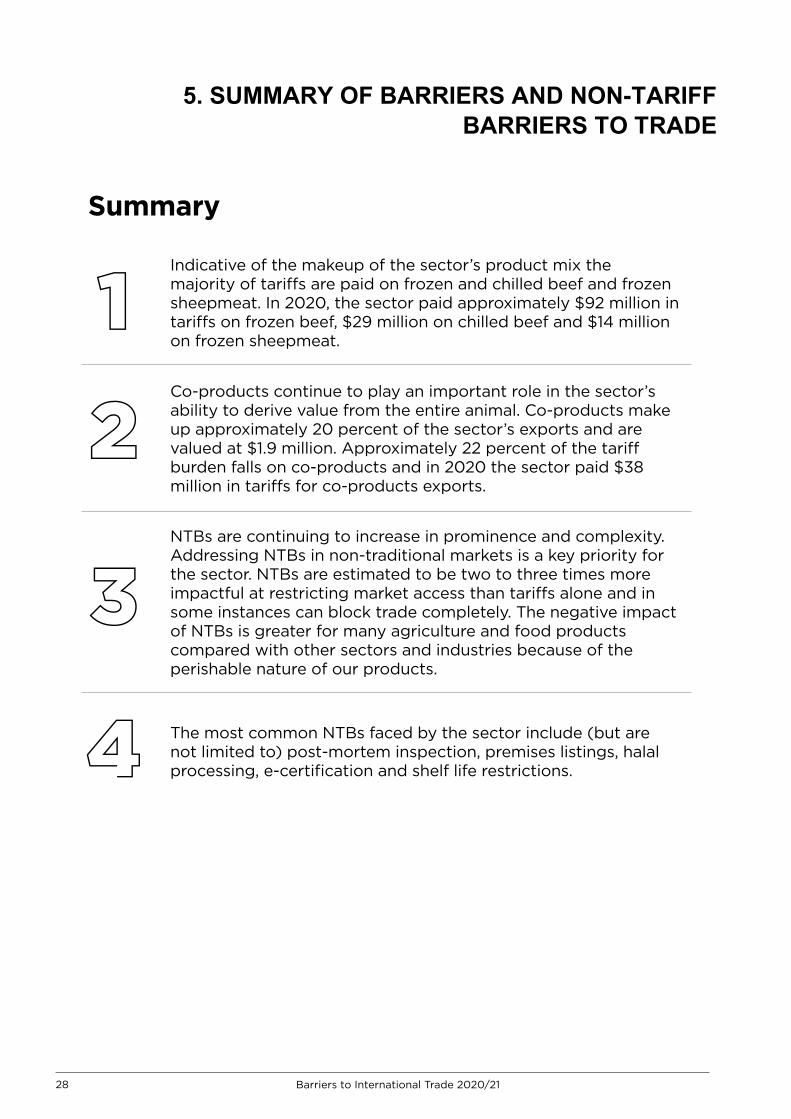
Indicative of the makeup of the sector’s product mix the majority of tariffs are paid on frozen and chilled beef and frozen sheepmeat. In 2020, the sector paid approximately $92 million in tariffs on frozen beef, $29 million on chilled beef and $14 million on frozen sheepmeat.
Co-products continue to play an important role in the sector’s ability to derive value from the entire animal. Co-products make up approximately 20 percent of the sector’s exports and are valued at $1.9 million. Approximately 22 percent of the tariff burden falls on co-products and in 2020 the sector paid $38 million in tariffs for co-products exports.
NTBs are continuing to increase in prominence and complexity. Addressing NTBs in non-traditional markets is a key priority for the sector. NTBs are estimated to be two to three times more impactful at restricting market access than tariffs alone and in some instances can block trade completely. The negative impact of NTBs is greater for many agriculture and food products compared with other sectors and industries because of the perishable nature of our products.
The most common NTBs faced by the sector include (but are not limited to) post-mortem inspection, premises listings, halal processing, e-certification and shelf life restrictions.
1
2
3
4
28 Barriers to International Trade 2020/21
29 Barriers to International Trade 2018/19
5. Summary of tariff and non-tariff barriers to trade 5.1 Summary of tariff barriers
Globally agriculture is one of the industries most protected from international competition as there are a number of protectionist measures sheltering domestic farmers from international prices. New Zealand producers by contrast are not subsidised or protected. The most commonly used and most widely talked about is the imposition of tariffs on imports. This report aims to quantify the cost of tariffs for the sector, but it is important to note that this is just one of the protectionist measures used. The tariff costs calculated for the sector do not take account of other NTBs which are hard to quantify and are often costlier than tariffs. This report also does not consider the impact that domestic subsidies for production within the importing country have on New Zealand’s exports.
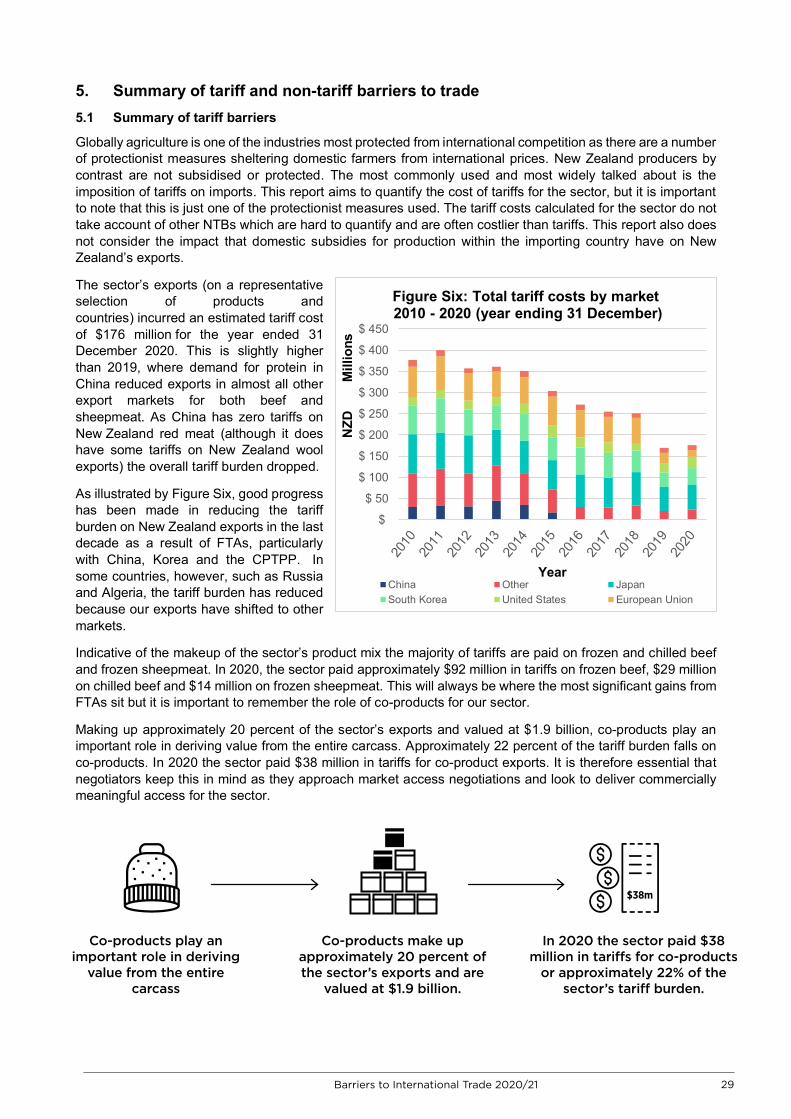
The sector’s exports (on a representative selection of products and countries) incurred an estimated tariff cost of $176 million for the year ended 31 December 2020. This is slightly higher than 2019, where demand for protein in China reduced exports in almost all other export markets for both beef and sheepmeat. As China has zero tariffs on New Zealand red meat (although it does have some tariffs on New Zealand wool exports) the overall tariff burden dropped.
As illustrated by Figure Six, good progress has been made in reducing the tariff burden on New Zealand exports in the last decade as a result of FTAs, particularly with China, Korea and the CPTPP. In some countries, however, such as Russia and Algeria, the tariff burden has reduced because our exports have shifted to other markets.
Indicative of the makeup of the sector’s product mix the majority of tariffs are paid on frozen and chilled beef and frozen sheepmeat. In 2020, the sector paid approximately $92 million in tariffs on frozen beef, $29 million on chilled beef and $14 million on frozen sheepmeat. This will always be where the most significant gains from FTAs sit but it is important to remember the role of co-products for our sector.
Making up approximately 20 percent of the sector’s exports and valued at $1.9 billion, co-products play an important role in deriving value from the entire carcass. Approximately 22 percent of the tariff burden falls on co-products. In 2020 the sector paid $38 million in tariffs for co-product exports. It is therefore essential that negotiators keep this in mind as they approach market access negotiations and look to deliver commercially meaningful access for the sector.
$
$ 50
$ 100
$ 150
$ 200
$ 250
$ 300
$ 350
$ 400
$ 450N
ZDM
illio
ns
Year
Figure Six: Total tariff costs by market2010 - 2020 (year ending 31 December)
China Other JapanSouth Korea United States European Union
Co-products play an important role in deriving
value from the entire carcass
Co-products make up approximately 20 percent of the sector’s exports and are
valued at $1.9 billion.
In 2020 the sector paid $38 million in tariffs for co-products
or approximately 22% of the sector’s tariff burden.
$38m
29Barriers to International Trade 2020/21
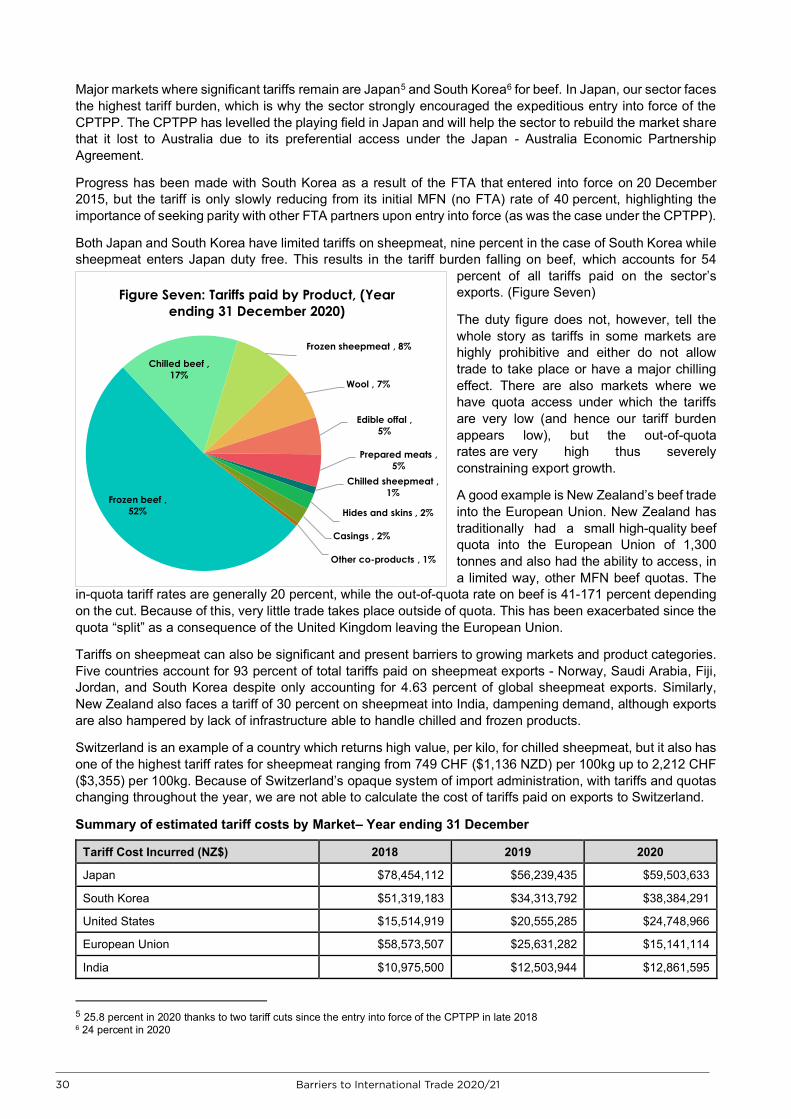
30 Barriers to International Trade 2018/19
Major markets where significant tariffs remain are Japan5 and South Korea6 for beef. In Japan, our sector faces the highest tariff burden, which is why the sector strongly encouraged the expeditious entry into force of the CPTPP. The CPTPP has levelled the playing field in Japan and will help the sector to rebuild the market share that it lost to Australia due to its preferential access under the Japan - Australia Economic Partnership Agreement.
Progress has been made with South Korea as a result of the FTA that entered into force on 20 December 2015, but the tariff is only slowly reducing from its initial MFN (no FTA) rate of 40 percent, highlighting the importance of seeking parity with other FTA partners upon entry into force (as was the case under the CPTPP).
Both Japan and South Korea have limited tariffs on sheepmeat, nine percent in the case of South Korea while sheepmeat enters Japan duty free. This results in the tariff burden falling on beef, which accounts for 54
percent of all tariffs paid on the sector’s exports. (Figure Seven)
The duty figure does not, however, tell the whole story as tariffs in some markets are highly prohibitive and either do not allow trade to take place or have a major chilling effect. There are also markets where we have quota access under which the tariffs are very low (and hence our tariff burden appears low), but the out-of-quota rates are very high thus severely constraining export growth.
A good example is New Zealand’s beef trade into the European Union. New Zealand has traditionally had a small high-quality beef quota into the European Union of 1,300 tonnes and also had the ability to access, in a limited way, other MFN beef quotas. The
in-quota tariff rates are generally 20 percent, while the out-of-quota rate on beef is 41-171 percent depending on the cut. Because of this, very little trade takes place outside of quota. This has been exacerbated since the quota “split” as a consequence of the United Kingdom leaving the European Union.
Tariffs on sheepmeat can also be significant and present barriers to growing markets and product categories. Five countries account for 93 percent of total tariffs paid on sheepmeat exports - Norway, Saudi Arabia, Fiji, Jordan, and South Korea despite only accounting for 4.63 percent of global sheepmeat exports. Similarly, New Zealand also faces a tariff of 30 percent on sheepmeat into India, dampening demand, although exports are also hampered by lack of infrastructure able to handle chilled and frozen products.
Switzerland is an example of a country which returns high value, per kilo, for chilled sheepmeat, but it also has one of the highest tariff rates for sheepmeat ranging from 749 CHF ($1,136 NZD) per 100kg up to 2,212 CHF ($3,355) per 100kg. Because of Switzerland’s opaque system of import administration, with tariffs and quotas changing throughout the year, we are not able to calculate the cost of tariffs paid on exports to Switzerland.
Summary of estimated tariff costs by Market– Year ending 31 December
Tariff Cost Incurred (NZ$) 2018 2019 2020
Japan $78,454,112 $56,239,435 $59,503,633
South Korea $51,319,183 $34,313,792 $38,384,291
United States $15,514,919 $20,555,285 $24,748,966
European Union $58,573,507 $25,631,282 $15,141,114
India $10,975,500 $12,503,944 $12,861,595
5 25.8 percent in 2020 thanks to two tariff cuts since the entry into force of the CPTPP in late 2018 6 24 percent in 2020
Frozen beef54%
Chilled beef14%
Frozen sheepmeat
11% Wool6%
Edible offal4%
Prepared meats
4%
Chilled sheepmeat
3%Hides and
skins2%
Casings2%
Other co-products
0%
Figure Seven: Tariffs paid by product, (Year ending 31 December 2020)
Frozen beef , 52%
Chilled beef , 17%
Frozen sheepmeat , 8%
Wool , 7%
Edible offal , 5%
Prepared meats , 5%
Chilled sheepmeat , 1%
Hides and skins , 2%
Casings , 2%
Other co-products , 1%
Figure Seven: Tariffs paid by Product, (Year ending 31 December 2020)
30 Barriers to International Trade 2020/21
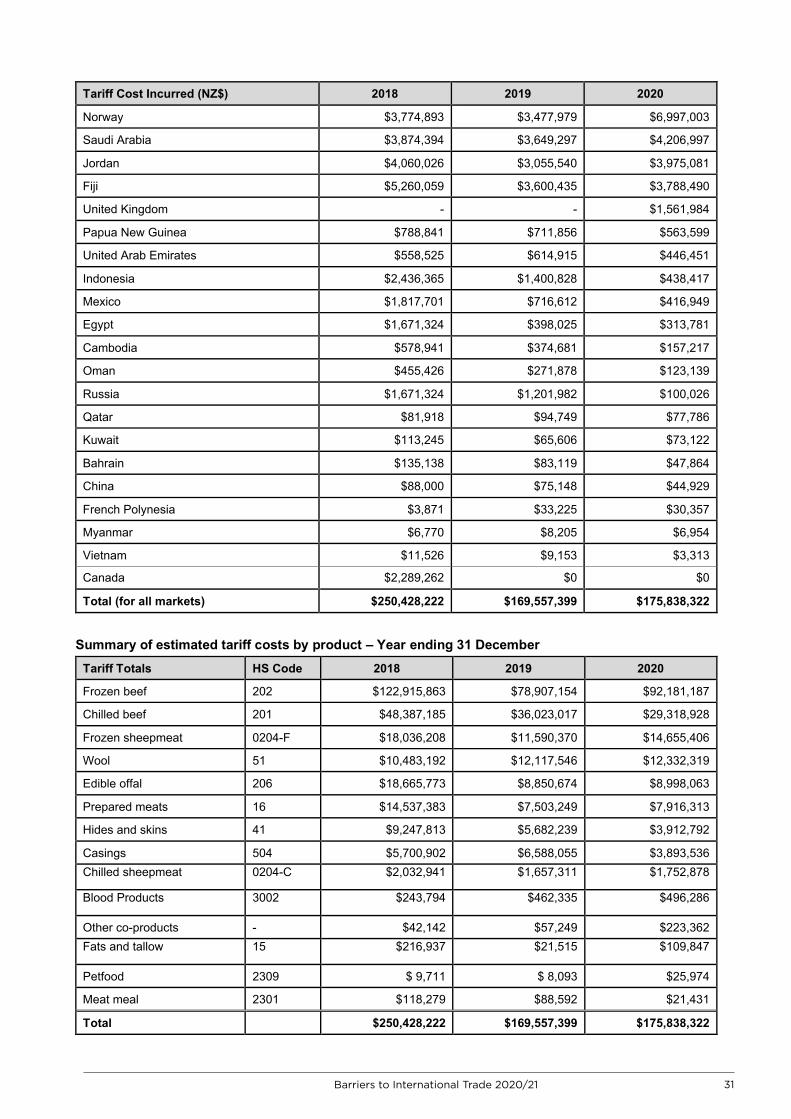
31 Barriers to International Trade 2018/19
Tariff Cost Incurred (NZ$) 2018 2019 2020
Norway $3,774,893 $3,477,979 $6,997,003
Saudi Arabia $3,874,394 $3,649,297 $4,206,997
Jordan $4,060,026 $3,055,540 $3,975,081
Fiji $5,260,059 $3,600,435 $3,788,490
United Kingdom - - $1,561,984
Papua New Guinea $788,841 $711,856 $563,599
United Arab Emirates $558,525 $614,915 $446,451
Indonesia $2,436,365 $1,400,828 $438,417
Mexico $1,817,701 $716,612 $416,949
Egypt $1,671,324 $398,025 $313,781
Cambodia $578,941 $374,681 $157,217
Oman $455,426 $271,878 $123,139
Russia $1,671,324 $1,201,982 $100,026
Qatar $81,918 $94,749 $77,786
Kuwait $113,245 $65,606 $73,122
Bahrain $135,138 $83,119 $47,864
China $88,000 $75,148 $44,929
French Polynesia $3,871 $33,225 $30,357
Myanmar $6,770 $8,205 $6,954
Vietnam $11,526 $9,153 $3,313
Canada $2,289,262 $0 $0
Total (for all markets) $250,428,222 $169,557,399 $175,838,322
Summary of estimated tariff costs by product – Year ending 31 December
Tariff Totals HS Code 2018 2019 2020
Frozen beef 202 $122,915,863 $78,907,154 $92,181,187
Chilled beef 201 $48,387,185 $36,023,017 $29,318,928
Frozen sheepmeat 0204-F $18,036,208 $11,590,370 $14,655,406
Wool 51 $10,483,192 $12,117,546 $12,332,319
Edible offal 206 $18,665,773 $8,850,674 $8,998,063
Prepared meats 16 $14,537,383 $7,503,249 $7,916,313
Hides and skins 41 $9,247,813 $5,682,239 $3,912,792
Casings 504 $5,700,902 $6,588,055 $3,893,536 Chilled sheepmeat 0204-C $2,032,941 $1,657,311 $1,752,878
Blood Products 3002 $243,794 $462,335 $496,286
Other co-products - $42,142 $57,249 $223,362 Fats and tallow 15 $216,937 $21,515 $109,847
Petfood 2309 $ 9,711 $ 8,093 $25,974
Meat meal 2301 $118,279 $88,592 $21,431
Total $250,428,222 $169,557,399 $175,838,322
31Barriers to International Trade 2020/21
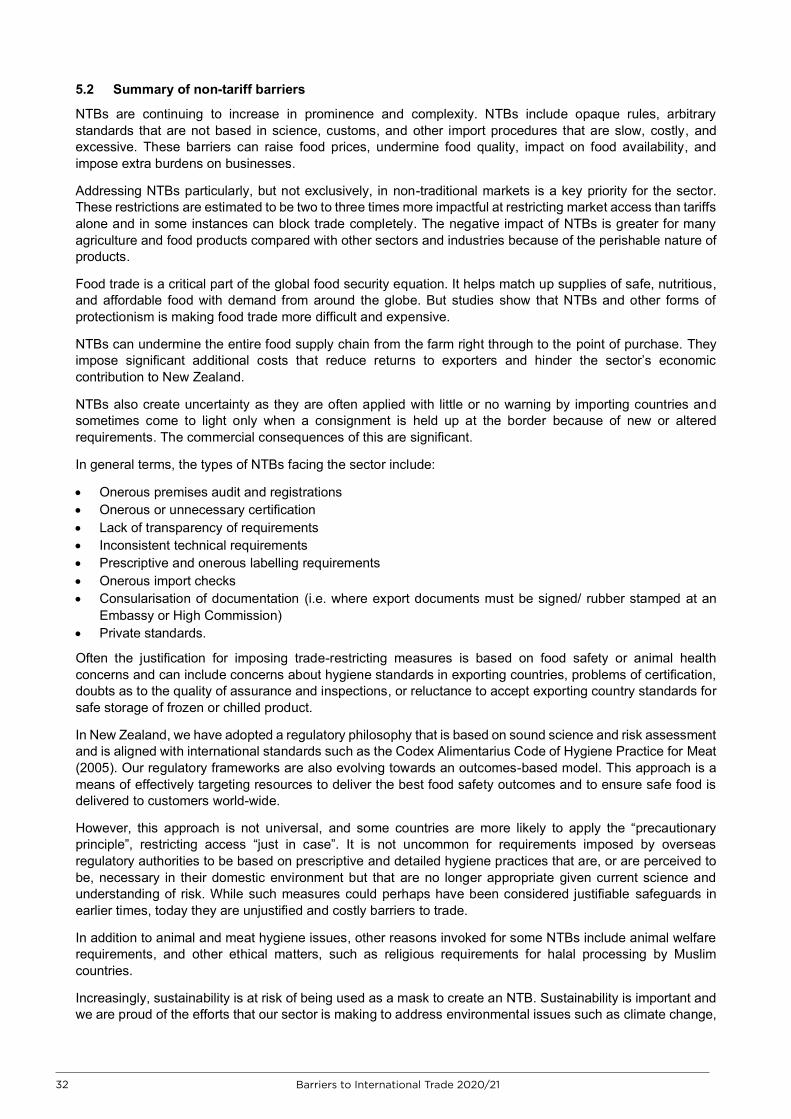
32 Barriers to International Trade 2018/19
5.2 Summary of non-tariff barriers
NTBs are continuing to increase in prominence and complexity. NTBs include opaque rules, arbitrary standards that are not based in science, customs, and other import procedures that are slow, costly, and excessive. These barriers can raise food prices, undermine food quality, impact on food availability, and impose extra burdens on businesses.
Addressing NTBs particularly, but not exclusively, in non-traditional markets is a key priority for the sector. These restrictions are estimated to be two to three times more impactful at restricting market access than tariffs alone and in some instances can block trade completely. The negative impact of NTBs is greater for many agriculture and food products compared with other sectors and industries because of the perishable nature of products.
Food trade is a critical part of the global food security equation. It helps match up supplies of safe, nutritious, and affordable food with demand from around the globe. But studies show that NTBs and other forms of protectionism is making food trade more difficult and expensive.
NTBs can undermine the entire food supply chain from the farm right through to the point of purchase. They impose significant additional costs that reduce returns to exporters and hinder the sector’s economic contribution to New Zealand.
NTBs also create uncertainty as they are often applied with little or no warning by importing countries and sometimes come to light only when a consignment is held up at the border because of new or altered requirements. The commercial consequences of this are significant.
In general terms, the types of NTBs facing the sector include:
• Onerous premises audit and registrations • Onerous or unnecessary certification • Lack of transparency of requirements • Inconsistent technical requirements • Prescriptive and onerous labelling requirements • Onerous import checks • Consularisation of documentation (i.e. where export documents must be signed/ rubber stamped at an
Embassy or High Commission) • Private standards.
Often the justification for imposing trade-restricting measures is based on food safety or animal health concerns and can include concerns about hygiene standards in exporting countries, problems of certification, doubts as to the quality of assurance and inspections, or reluctance to accept exporting country standards for safe storage of frozen or chilled product.
In New Zealand, we have adopted a regulatory philosophy that is based on sound science and risk assessment and is aligned with international standards such as the Codex Alimentarius Code of Hygiene Practice for Meat (2005). Our regulatory frameworks are also evolving towards an outcomes-based model. This approach is a means of effectively targeting resources to deliver the best food safety outcomes and to ensure safe food is delivered to customers world-wide.
However, this approach is not universal, and some countries are more likely to apply the “precautionary principle”, restricting access “just in case”. It is not uncommon for requirements imposed by overseas regulatory authorities to be based on prescriptive and detailed hygiene practices that are, or are perceived to be, necessary in their domestic environment but that are no longer appropriate given current science and understanding of risk. While such measures could perhaps have been considered justifiable safeguards in earlier times, today they are unjustified and costly barriers to trade.
In addition to animal and meat hygiene issues, other reasons invoked for some NTBs include animal welfare requirements, and other ethical matters, such as religious requirements for halal processing by Muslim countries.
Increasingly, sustainability is at risk of being used as a mask to create an NTB. Sustainability is important and we are proud of the efforts that our sector is making to address environmental issues such as climate change,
32 Barriers to International Trade 2020/21
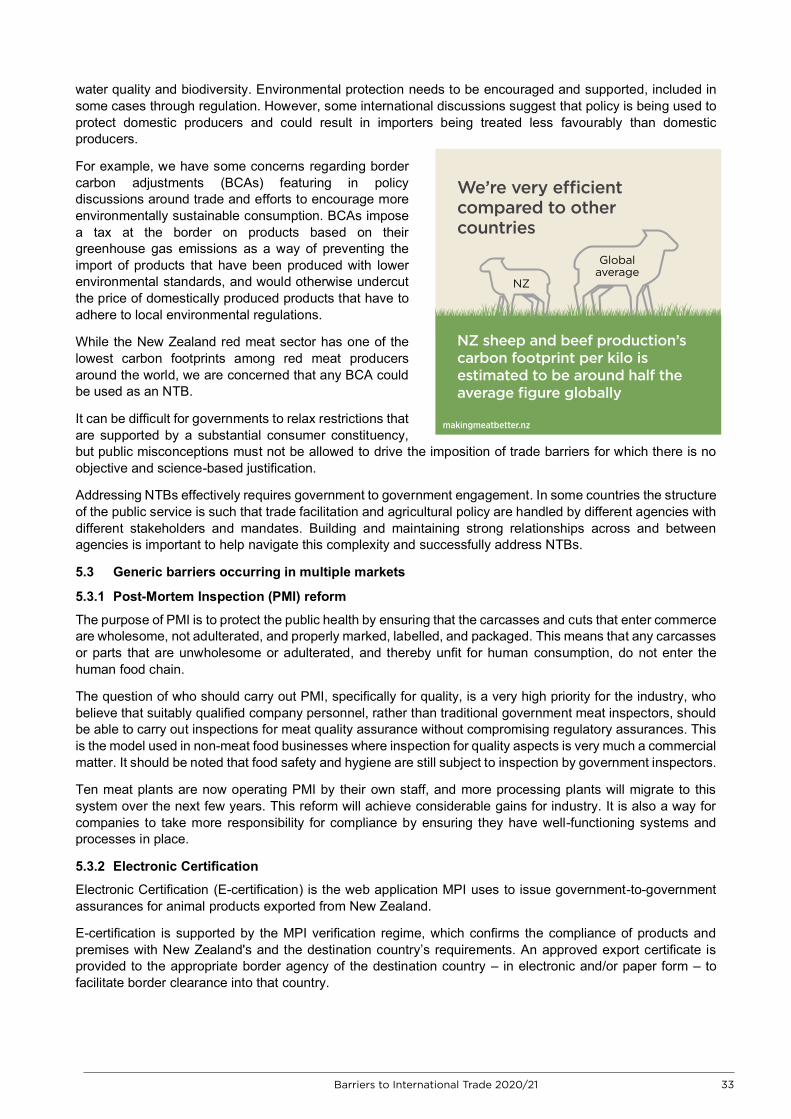
33 Barriers to International Trade 2018/19
water quality and biodiversity. Environmental protection needs to be encouraged and supported, included in some cases through regulation. However, some international discussions suggest that policy is being used to protect domestic producers and could result in importers being treated less favourably than domestic producers.
For example, we have some concerns regarding border carbon adjustments (BCAs) featuring in policy discussions around trade and efforts to encourage more environmentally sustainable consumption. BCAs impose a tax at the border on products based on their greenhouse gas emissions as a way of preventing the import of products that have been produced with lower environmental standards, and would otherwise undercut the price of domestically produced products that have to adhere to local environmental regulations.
While the New Zealand red meat sector has one of the lowest carbon footprints among red meat producers around the world, we are concerned that any BCA could be used as an NTB.
It can be difficult for governments to relax restrictions that are supported by a substantial consumer constituency, but public misconceptions must not be allowed to drive the imposition of trade barriers for which there is no objective and science-based justification.
Addressing NTBs effectively requires government to government engagement. In some countries the structure of the public service is such that trade facilitation and agricultural policy are handled by different agencies with different stakeholders and mandates. Building and maintaining strong relationships across and between agencies is important to help navigate this complexity and successfully address NTBs.
5.3 Generic barriers occurring in multiple markets
5.3.1 Post-Mortem Inspection (PMI) reform
The purpose of PMI is to protect the public health by ensuring that the carcasses and cuts that enter commerce are wholesome, not adulterated, and properly marked, labelled, and packaged. This means that any carcasses or parts that are unwholesome or adulterated, and thereby unfit for human consumption, do not enter the human food chain.
The question of who should carry out PMI, specifically for quality, is a very high priority for the industry, who believe that suitably qualified company personnel, rather than traditional government meat inspectors, should be able to carry out inspections for meat quality assurance without compromising regulatory assurances. This is the model used in non-meat food businesses where inspection for quality aspects is very much a commercial matter. It should be noted that food safety and hygiene are still subject to inspection by government inspectors.
Ten meat plants are now operating PMI by their own staff, and more processing plants will migrate to this system over the next few years. This reform will achieve considerable gains for industry. It is also a way for companies to take more responsibility for compliance by ensuring they have well-functioning systems and processes in place.
5.3.2 Electronic Certification
Electronic Certification (E-certification) is the web application MPI uses to issue government-to-government assurances for animal products exported from New Zealand.
E-certification is supported by the MPI verification regime, which confirms the compliance of products and premises with New Zealand's and the destination country’s requirements. An approved export certificate is provided to the appropriate border agency of the destination country – in electronic and/or paper form – to facilitate border clearance into that country.
NZ sheep and beef production’s carbon footprint per kilo is estimated to be around half the average figure globally
Global average
NZ
We’re very efficient compared to other countries
makingmeatbetter.nz
33Barriers to International Trade 2020/21
34 Barriers to International Trade 2018/19
MPI has been negotiating with regulatory authorities in our export markets to gain acceptance of paperless certification. Industry supports this because it would streamline the certification process, reduce overall costs, reduce handling delays, and minimise the risk of fraudulent activity.
The COVID-19 pandemic and health requirements that it bought into focus have accelerated the uptake of e-certification. While some progress has been made, it has been slow in several markets due in part to technical issues and/or a lack of confidence in the integrity of e-certification. Industry encourages MPI to continue to focus on negotiating the use of e-certification in as many countries as possible and welcomes the work already done with several ASEAN countries to achieve this goal.
5.3.3 Approval and Listing of establishments (premises) Animal protein is considered a high-risk product category in trade terms internationally. This is due to the relatively high risk of disease and foodborne illness, particularly in raw products. To manage this risk, regulatory authorities in most importing countries require that meat be produced in an approved establishment. For an establishment to be approved and/or listed, it must fulfil criteria imposed by the importing country’s regulatory authority. While in principle this is a legitimate approach to managing a high-risk product, issues arise with the criteria that forms the basis of this process as well as with the frequency, timeliness and costs associated with such audits.
Often the criteria that must be fulfilled for an establishment to be approved and/or listed are set by the importing country and reflect its domestic practices and needs. As such, the criteria may not accommodate different but equally legitimate approaches to addressing the risks that reflect more developed or sophisticated industry practices. This adds complexity and uncertainty of how highly prescriptive importing country criteria would be applied to New Zealand establishments, which tend to operate under an outcomes-based regulatory system.
Furthermore, some importing countries still require that all establishments seeking to export must undergo a successful audit visit from the importing country regulatory authorities prior to listing, along with periodic review visits. Such a requirement is onerous and costly. It is not unusual for audits to be subject to delays on the grounds of unavailability of staff to travel to New Zealand for the audit. There are also issues with the cost of audits, with importing countries requiring New Zealand to cover the full cost of the audit visit, which can be high (sometimes up to $100,000) as some audit visits run over several weeks with multiple audit teams and potentially even more than one auditing agency: for instance, a ministry responsible for meat hygiene and (in the case of predominantly Muslim countries) a religious authority.
The industry has also experienced situations where audit visits appeared to be going well but plants were delisted overnight with no explanation or opportunity to take remedial action if such was necessary. The effect is that exports are blocked overnight and there is a great deal of uncertainty including for product that is awaiting clearance at a port, is on the water to that destination or is being processed and packaged for a customer in that market.
There are also delays and uncertainties following an audit, particularly while an audit report is prepared by the importing country’s regulatory authority and any issues are addressed with MPI and the New Zealand industry. During this time, establishments without approval and/or listing are unable to export to that country and there is no clarity around the timeframes for resolving issues. This has commercial implications in that companies could be locked out of potentially lucrative markets or may be at a commercial disadvantage vis-à-vis their competitors that are approved and/or listed.
The industry’s preferred position is that if an audit is required, it should be an audit of the New Zealand system rather than of individual premises. Once the importing country approves the New Zealand system, MPI should be able to list plants based on objective criteria negotiated between the two countries. In other words, achieving “systems recognition” with importing countries should be a medium-to long-term priority of the Government, and a negotiating objective in any trade agreement.
5.3.4 Halal processing
Muslim consumers around the world require meat products to comply with the religious requirement that meat be halal (‘wholesome’). In the case of predominantly Islamic countries halal compliance generally falls under the authority of an Islamic ministry or institution. Halal requires, among other things, that meat must come from permitted species, and that the animal is alive (though it can be unconscious, i.e. stunned, which
43% of total exports were
Halal certified in 2019/20
34 Barriers to International Trade 2020/21
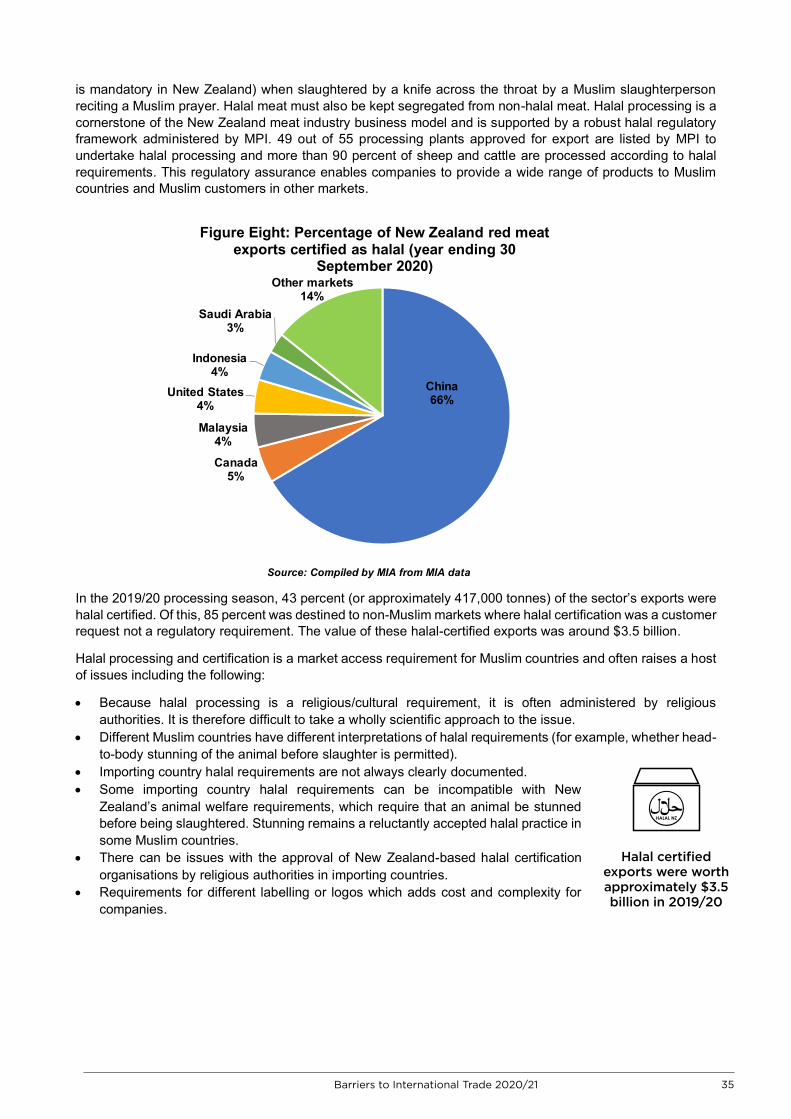
35 Barriers to International Trade 2018/19
is mandatory in New Zealand) when slaughtered by a knife across the throat by a Muslim slaughterperson reciting a Muslim prayer. Halal meat must also be kept segregated from non-halal meat. Halal processing is a cornerstone of the New Zealand meat industry business model and is supported by a robust halal regulatory framework administered by MPI. 49 out of 55 processing plants approved for export are listed by MPI to undertake halal processing and more than 90 percent of sheep and cattle are processed according to halal requirements. This regulatory assurance enables companies to provide a wide range of products to Muslim countries and Muslim customers in other markets.
Source: Compiled by MIA from MIA data
In the 2019/20 processing season, 43 percent (or approximately 417,000 tonnes) of the sector’s exports were halal certified. Of this, 85 percent was destined to non-Muslim markets where halal certification was a customer request not a regulatory requirement. The value of these halal-certified exports was around $3.5 billion.
Halal processing and certification is a market access requirement for Muslim countries and often raises a host of issues including the following:
• Because halal processing is a religious/cultural requirement, it is often administered by religious authorities. It is therefore difficult to take a wholly scientific approach to the issue.
• Different Muslim countries have different interpretations of halal requirements (for example, whether head-to-body stunning of the animal before slaughter is permitted).
• Importing country halal requirements are not always clearly documented. • Some importing country halal requirements can be incompatible with New
Zealand’s animal welfare requirements, which require that an animal be stunned before being slaughtered. Stunning remains a reluctantly accepted halal practice in some Muslim countries.
• There can be issues with the approval of New Zealand-based halal certification organisations by religious authorities in importing countries.
• Requirements for different labelling or logos which adds cost and complexity for companies.
China66%
Canada5%
Malaysia4%
United States4%
Indonesia4%
Saudi Arabia3%
Other markets14%
Figure Eight: Percentage of New Zealand red meat exports certified as halal (year ending 30
September 2020)
Halal certified exports were worth approximately $3.5 billion in 2019/20
35Barriers to International Trade 2020/21
36 Barriers to International Trade 2018/19
The meat industry has been undertaking halal processing for around 40 years, with Islamic organisations based in New Zealand contracted to the industry for halal audits and certification.
In response to growing indications that many importing countries wanted to deal with the Government on halal matters, in 2010 MIA approached the Government with a request that a regulatory framework for the New Zealand halal system be established. As a result, the Government promulgated the Animal Products Notice: General Export Requirements for Halal Animal Material and Halal Animal Products (Halal Notice) which, among other things, sets out requirements that must be met by establishments undertaking halal processing, by the halal slaughterperson in these plants, and by the agencies that provide audit and certification for halal meat. The Halal Notice was recently updated to provide more clarity around the roles and responsibilities of each participant in the halal system and to strengthen some of the regulatory requirements. The industry is supportive of this framework as it creates a solid foundation for a competitive advantage in international markets.
Having government involvement in halal processing has helped to provide assurances to importing countries, and certainty for industry about the halal requirements that must be met. However, due to the different institutions and interpretations in different Islamic countries, the industry still faces halal-related market access issues in a number of markets.
The industry is strongly supportive of the approach taken by the Government to generate more certainty for New Zealand producers of halal meat, but it could be refined further. The ideal end-state for halal certification will be having satisfactory internationally recognised halal standards that align with the New Zealand framework and are implemented using the expertise of New Zealand Islamic bodies. We encourage the Government to prioritise Halal mutual recognition arrangements as part of government-to-government negotiations.
While most of the halal related challenges stem from overseas market access requirements, the industry is also facing some domestic constraints which are putting significant pressure on halal processing and have the potential to act as a domestic barrier to export.
A key requirement under the Halal Notice is for halal slaughter to be undertaken by a suitably qualified Muslim. The industry needs approximately 240 halal slaughterpersons (which represents around one percent of the total industry workforce). Each year, the MIA runs a national recruitment drive to recruit suitable New Zealand resident halal slaughterpersons. Typically, this results in approximately 100 New Zealand resident halal slaughterpersons being recruited each year. To supplement this, MIA prepares an annual “Approval in Principle” application to Immigration New Zealand to enable overseas recruitment. This exposes the industry to significant commercial risk as the process is resource-intensive and provides no certainty of access to an essential labour force requirement. The package of changes to immigration policy announced by the Government in September 2019 raises serious concerns as it has the potential to further constrain the industry’s ability to access sufficient migrant workers, thereby creating further uncertainty and challenges for the sector.
Not only is this a labour issue, but the inability to recruit halal slaughterpersons is also an export barrier. Halal products are an integral part of the meat industry’s export strategy and value-add. While halal slaughterers make up just one percent of the industry workforce, they directly contribute to around $3.5 billion of value-add halal certified meat products. It is therefore imperative to commercial success and also export-dollar returns to New Zealand that the industry can recruit and retain halal slaughterers, domestically in the first instance but also from overseas where domestic recruitment is not possible. The meat industry would like the Government to ensure that immigration policy is developed to better reflect the genuine needs of the industry in this area. This would include putting halal slaughterpersons on any skills shortage list, establishing a small special halal immigration programme or finding other practical solutions (for example under FTAs) to provide a secure pathway to source necessary halal workers from overseas.
5.3.5 Shelf-life restrictions
There is a trend towards overseas markets imposing shelf-life restrictions on frozen meat products. Typically, overseas authorities are specifying shelf-life requirements of a maximum of 12 months. This is at odds with New Zealand’s approach to longer shelf-life for frozen product, typically 24 months or more. The practical
90% of animals are processed
as Halal
36 Barriers to International Trade 2020/21
37 Barriers to International Trade 2018/19
implication of these restrictions is that it limits the flexibility of how product is stored, when it is exported and how it is distributed in market.
New Zealand’s shelf-life parameters have been developed based on strong scientific research. There is robust scientific evidence to support that there are no food safety issues associated with longer shelf-life of frozen product and in this context, the restrictions are creating an unjustified trade barrier. From a quality perspective, a longer shelf-life has limited implications. Industry has prepared data to support longer shelf-life of product that can be provided to overseas authorities and requests that the Government continues to challenge non-food safety and non-science-based shelf-life restrictions in export markets.
Some overseas markets, particularly in the Middle East, also impose mandatory shelf-life limits for chilled meat. The shelf-life of New Zealand chilled meat (up to 120 days for beef) is significantly higher than some of these mandatory limits, and the sector would like to see the mandatory limits removed and flexibility allowed for exporters to apply their own validated shelf-life claims.
5.3.6 Approved methods of boning
The hygienic objectives of post slaughter carcass and product management are to minimise contamination and, to restrict subsequent microbiological proliferation by the judicious use of refrigeration. There are three approved boning/refrigeration methods in New Zealand by which carcass and product surfaces of microbiological concern can be hygienically and promptly reduced to 7°C or less. Hot boning and warm boning are two alternative methods to traditional cold boning.
There are several advantages of hot boning and warm boning over cold boning, namely: reduced energy consumption makes it more environmentally friendly; reduced occupational health and safety problems for workers as a result of fewer repetitive strain injuries, and problems associated with cutting hardened fat; and reducing drying moisture loss.
Studies have shown that hot boning is not detrimental to the microbiological integrity of bovine meat when correct product refrigeration and effective sanitation techniques are practised. The meat industry has a reputation, supported by National Microbiological Database (NMD) data, of producing meat with low microbiological contamination. The bacterial load on frozen beef produced from alternative hot and warm boning processes is no worse than that from traditional cold boning, and as verified by the data is shown to be generally superior.
It is worth noting that the industry consistently places high priority on hygienic management of product during processing to ensure that warm and hot boned meat are processed under conditions that will produce microbiologically safe products. Since the introduction of hot and warm boning almost 25 years ago, New Zealand has exported millions of tonnes of meat to the world without any food safety incident.
There are overseas markets, however, that are not well versed with the practice of hot and warm boning and have raised concerns with the suitability of these methods over traditional cold boning. The industry is supportive of the Government continuing to provide scientific justification that there is no compromise of hygiene outcomes as a result of hot boning or warm boning of carcasses, and to push back against prescriptive requirements that single out cold boning only.
5.3.7 Consularisation
A number of countries, particularly in the Middle East, require that exportation documents be ‘consularised’ (i.e. authenticated) by that country’s consulate in the exporting country.
Consularisation costs range from $300 to more than $1,000 for a set of documents. As well as the unnecessary additional costs, the process can take considerable time and exporters have experienced delays of up to three weeks in getting documents returned.
Given New Zealand has robust and well-respected border assurance systems and processes, the requirement for consularisation is an unnecessary burden adding to the cost and time of doing business while not providing any additional assurance for the importing country. Some countries did temporarily remove consularisation requirements during 2020 to assist trade, and the sector would like the Government to negotiate with importing countries for the permanent removal of this requirement.
37Barriers to International Trade 2020/21
38 Barriers to International Trade 2018/19
5.3.8 Private standards
While NTBs are understood primarily as regulatory measures, the compliance burden of meeting private standards may have similar impacts. Private standards are those developed by specific companies or non-governmental organisations (e.g. global retailers or multinational corporations) to set requirements for products or production processes. Compliance with these standards is voluntary, but companies who do not comply may find themselves excluded from markets or global value chains.
Research has found that private enterprises are making faster progress towards global standards than the initiatives of governments and world or regional organisations. While this can have some benefits, the potential downside is when industry standards do not align with government or societal interests and act as a further obstacle to trade. The most common concern with private standards is that they often lack transparency and may be more burdensome and costly to comply with than relevant international standards. Because the private entities that develop these standards are not subject to WTO disciplines, there is little scope to challenge unjustified standards and to seek redress.
There has been a significant rise in new kinds of product labels in recent years as consumers demand more information related to their social and environmental concerns. One example is the use of carbon footprint labels as a tool to assist consumers to identify low emission food products. Many of these labels are based on voluntary private standards. While the objective of enabling consumer choice is legitimate, the issue is that the standards and methodologies underpinning these schemes often vary. This creates confusion, complexity and cost of business and has the potential to cause significant challenges for producers worldwide.
38 Barriers to International Trade 2020/21
Barriers to International Trade 2020/21 39
6. TRADE AND TARIFFS BY PRODUCT
Beef is the sector’s largest export product by volume but second behind sheepmeat by value. Chilled and frozen beef exports combined in 2020 were over $3.6 billion and represented nearly 40 percent of the sector’s exports by value. Overall, New Zealand exported beef to 76 countries in 2020.
New Zealand is a relatively small producer of beef but is significant exporter – seventh largest exporter in the world and exporting between 80 and 90 percent. This is more than any other beef-producing nation in the world.
Chilled beef exports accounted for $459 million worth of trade for the year ending 31 December 2020 and have been increasing steadily over the last few years, reinforcing the sector’s shift towards chilled product to maximise returns.
Traditionally, the United States has been New Zealand’s largest market for frozen beef by volume and value, however, in 2019 China overtook the United States. However, the United States returned as the sector’s top market for frozen beef in 2020, accounting for nearly 40 percent of total frozen beef exports from New Zealand, by volume and value, and worth over $1.2 billion worth of exports for the year ending 31 December 2020.
New Zealand is the second largest exporter of sheepmeat in the world. Total sheepmeat exports in 2020 were almost $3.9 billion, of which over $3.1 billion was frozen and $780 million chilled. Sheepmeat is the sector’s largest and most widely exported product, with exports to 90 countries in 2020.
1
2
3
4
5
Summary
39Barriers to International Trade 2020/21
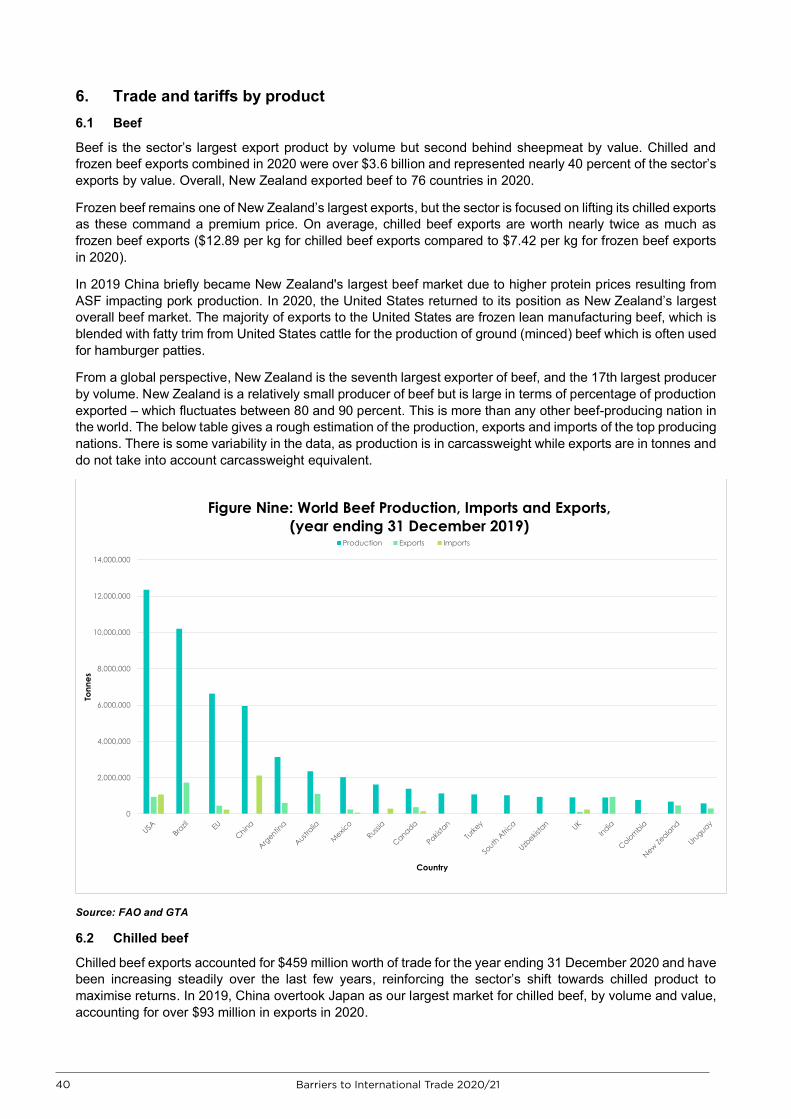
Barriers to International Trade 2020/21 40
6. Trade and tariffs by product 6.1 Beef
Beef is the sector’s largest export product by volume but second behind sheepmeat by value. Chilled and frozen beef exports combined in 2020 were over $3.6 billion and represented nearly 40 percent of the sector’s exports by value. Overall, New Zealand exported beef to 76 countries in 2020.
Frozen beef remains one of New Zealand’s largest exports, but the sector is focused on lifting its chilled exports as these command a premium price. On average, chilled beef exports are worth nearly twice as much as frozen beef exports ($12.89 per kg for chilled beef exports compared to $7.42 per kg for frozen beef exports in 2020).
In 2019 China briefly became New Zealand's largest beef market due to higher protein prices resulting from ASF impacting pork production. In 2020, the United States returned to its position as New Zealand’s largest overall beef market. The majority of exports to the United States are frozen lean manufacturing beef, which is blended with fatty trim from United States cattle for the production of ground (minced) beef which is often used for hamburger patties.
From a global perspective, New Zealand is the seventh largest exporter of beef, and the 17th largest producer by volume. New Zealand is a relatively small producer of beef but is large in terms of percentage of production exported – which fluctuates between 80 and 90 percent. This is more than any other beef-producing nation in the world. The below table gives a rough estimation of the production, exports and imports of the top producing nations. There is some variability in the data, as production is in carcassweight while exports are in tonnes and do not take into account carcassweight equivalent.
Source: FAO and GTA
6.2 Chilled beef
Chilled beef exports accounted for $459 million worth of trade for the year ending 31 December 2020 and have been increasing steadily over the last few years, reinforcing the sector’s shift towards chilled product to maximise returns. In 2019, China overtook Japan as our largest market for chilled beef, by volume and value, accounting for over $93 million in exports in 2020.
0
2,000,000
4,000,000
6,000,000
8,000,000
10,000,000
12,000,000
14,000,000
Tonn
es
Country
Figure Nine: World Beef Production, Imports and Exports, (year ending 31 December 2019)
Production Exports Imports
40 Barriers to International Trade 2020/21
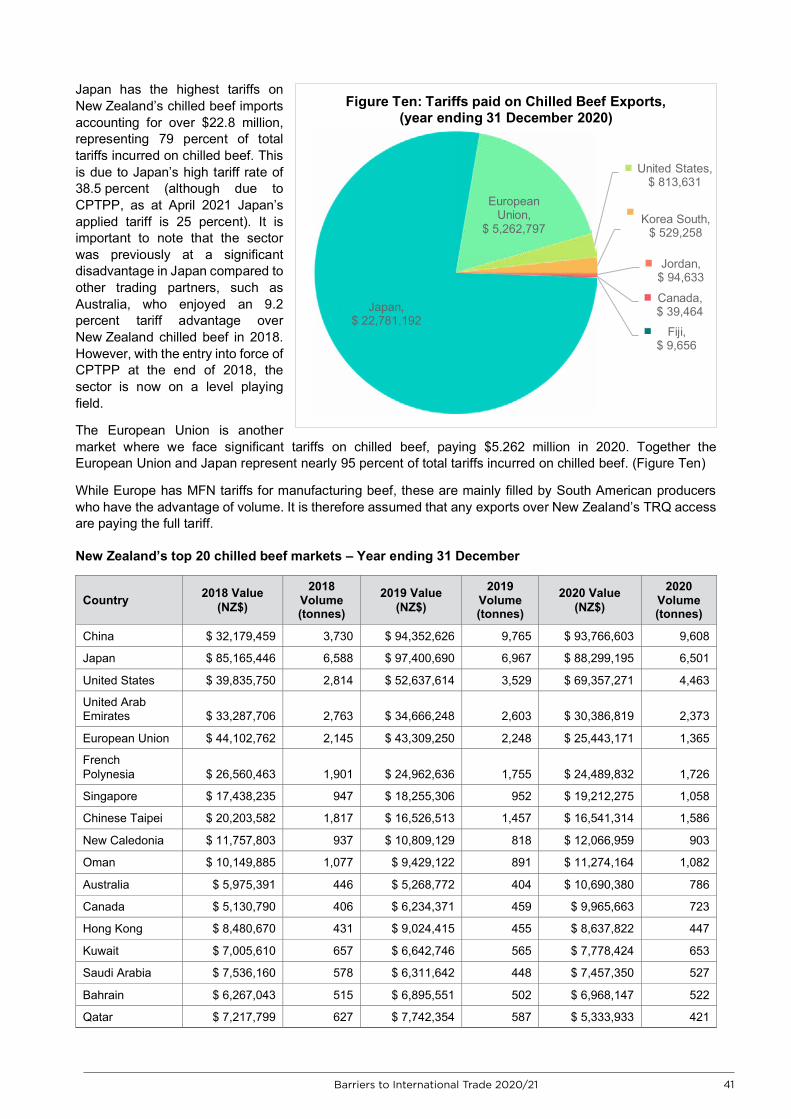
Barriers to International Trade 2020/21 41
Japan has the highest tariffs on New Zealand’s chilled beef imports accounting for over $22.8 million, representing 79 percent of total tariffs incurred on chilled beef. This is due to Japan’s high tariff rate of 38.5 percent (although due to CPTPP, as at April 2021 Japan’s applied tariff is 25 percent). It is important to note that the sector was previously at a significant disadvantage in Japan compared to other trading partners, such as Australia, who enjoyed an 9.2 percent tariff advantage over New Zealand chilled beef in 2018. However, with the entry into force of CPTPP at the end of 2018, the sector is now on a level playing field.
The European Union is another market where we face significant tariffs on chilled beef, paying $5.262 million in 2020. Together the European Union and Japan represent nearly 95 percent of total tariffs incurred on chilled beef. (Figure Ten)
While Europe has MFN tariffs for manufacturing beef, these are mainly filled by South American producers who have the advantage of volume. It is therefore assumed that any exports over New Zealand’s TRQ access are paying the full tariff.
New Zealand’s top 20 chilled beef markets – Year ending 31 December
Country 2018 Value (NZ$)
2018 Volume (tonnes)
2019 Value (NZ$)
2019 Volume (tonnes)
2020 Value (NZ$)
2020 Volume (tonnes)
China $ 32,179,459 3,730 $ 94,352,626 9,765 $ 93,766,603 9,608
Japan $ 85,165,446 6,588 $ 97,400,690 6,967 $ 88,299,195 6,501
United States $ 39,835,750 2,814 $ 52,637,614 3,529 $ 69,357,271 4,463
United Arab Emirates $ 33,287,706 2,763 $ 34,666,248 2,603 $ 30,386,819 2,373
European Union $ 44,102,762 2,145 $ 43,309,250 2,248 $ 25,443,171 1,365
French Polynesia $ 26,560,463 1,901 $ 24,962,636 1,755 $ 24,489,832 1,726
Singapore $ 17,438,235 947 $ 18,255,306 952 $ 19,212,275 1,058
Chinese Taipei $ 20,203,582 1,817 $ 16,526,513 1,457 $ 16,541,314 1,586
New Caledonia $ 11,757,803 937 $ 10,809,129 818 $ 12,066,959 903
Oman $ 10,149,885 1,077 $ 9,429,122 891 $ 11,274,164 1,082
Australia $ 5,975,391 446 $ 5,268,772 404 $ 10,690,380 786
Canada $ 5,130,790 406 $ 6,234,371 459 $ 9,965,663 723
Hong Kong $ 8,480,670 431 $ 9,024,415 455 $ 8,637,822 447
Kuwait $ 7,005,610 657 $ 6,642,746 565 $ 7,778,424 653
Saudi Arabia $ 7,536,160 578 $ 6,311,642 448 $ 7,457,350 527
Bahrain $ 6,267,043 515 $ 6,895,551 502 $ 6,968,147 522
Qatar $ 7,217,799 627 $ 7,742,354 587 $ 5,333,933 421
Japan, $ 22,781,192
European Union,
$ 5,262,797
United States, $ 813,631
Korea South, $ 529,258
Jordan, $ 94,633
Canada, $ 39,464
Fiji, $ 9,656
Figure Ten: Tariffs paid on Chilled Beef Exports, (year ending 31 December 2020)
41Barriers to International Trade 2020/21
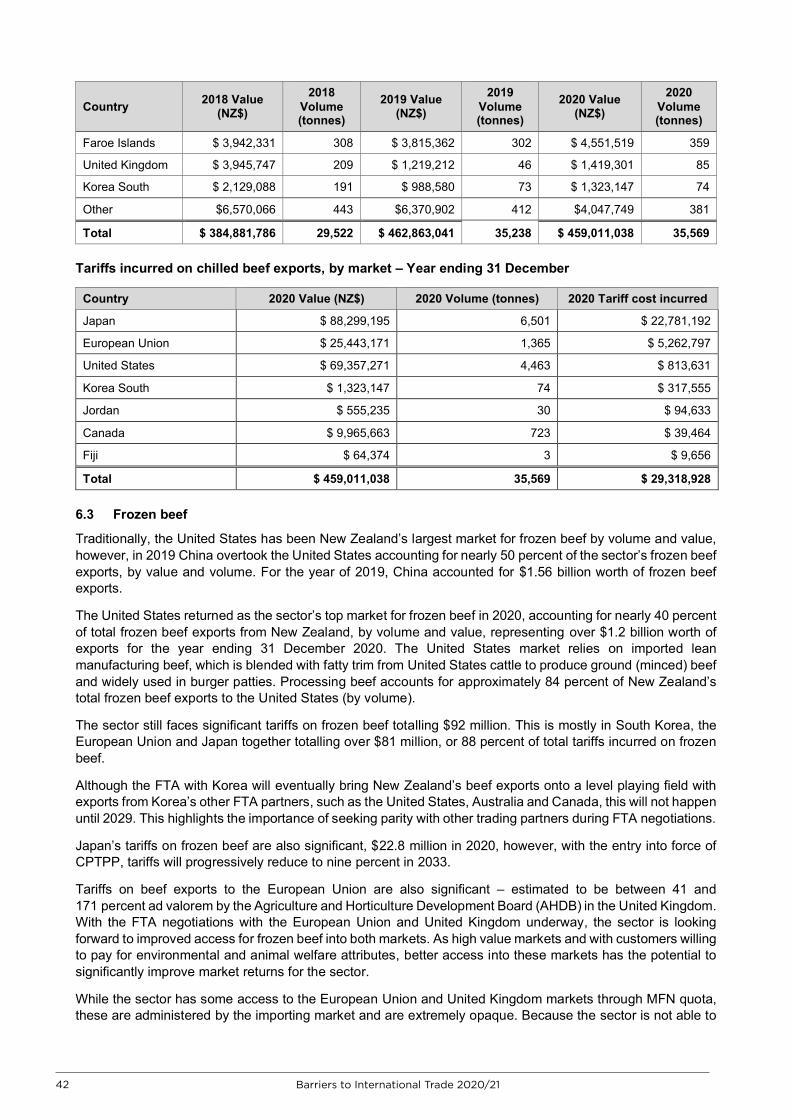
Barriers to International Trade 2020/21 42
Country 2018 Value (NZ$)
2018 Volume (tonnes)
2019 Value (NZ$)
2019 Volume (tonnes)
2020 Value (NZ$)
2020 Volume (tonnes)
Faroe Islands $ 3,942,331 308 $ 3,815,362 302 $ 4,551,519 359
United Kingdom $ 3,945,747 209 $ 1,219,212 46 $ 1,419,301 85
Korea South $ 2,129,088 191 $ 988,580 73 $ 1,323,147 74
Other $6,570,066 443 $6,370,902 412 $4,047,749 381
Total $ 384,881,786 29,522 $ 462,863,041 35,238 $ 459,011,038 35,569
Tariffs incurred on chilled beef exports, by market – Year ending 31 December
Country 2020 Value (NZ$) 2020 Volume (tonnes) 2020 Tariff cost incurred
Japan $ 88,299,195 6,501 $ 22,781,192
European Union $ 25,443,171 1,365 $ 5,262,797
United States $ 69,357,271 4,463 $ 813,631
Korea South $ 1,323,147 74 $ 317,555
Jordan $ 555,235 30 $ 94,633
Canada $ 9,965,663 723 $ 39,464
Fiji $ 64,374 3 $ 9,656
Total $ 459,011,038 35,569 $ 29,318,928
6.3 Frozen beef
Traditionally, the United States has been New Zealand’s largest market for frozen beef by volume and value, however, in 2019 China overtook the United States accounting for nearly 50 percent of the sector’s frozen beef exports, by value and volume. For the year of 2019, China accounted for $1.56 billion worth of frozen beef exports.
The United States returned as the sector’s top market for frozen beef in 2020, accounting for nearly 40 percent of total frozen beef exports from New Zealand, by volume and value, representing over $1.2 billion worth of exports for the year ending 31 December 2020. The United States market relies on imported lean manufacturing beef, which is blended with fatty trim from United States cattle to produce ground (minced) beef and widely used in burger patties. Processing beef accounts for approximately 84 percent of New Zealand’s total frozen beef exports to the United States (by volume).
The sector still faces significant tariffs on frozen beef totalling $92 million. This is mostly in South Korea, the European Union and Japan together totalling over $81 million, or 88 percent of total tariffs incurred on frozen beef.
Although the FTA with Korea will eventually bring New Zealand’s beef exports onto a level playing field with exports from Korea’s other FTA partners, such as the United States, Australia and Canada, this will not happen until 2029. This highlights the importance of seeking parity with other trading partners during FTA negotiations.
Japan’s tariffs on frozen beef are also significant, $22.8 million in 2020, however, with the entry into force of CPTPP, tariffs will progressively reduce to nine percent in 2033.
Tariffs on beef exports to the European Union are also significant – estimated to be between 41 and 171 percent ad valorem by the Agriculture and Horticulture Development Board (AHDB) in the United Kingdom. With the FTA negotiations with the European Union and United Kingdom underway, the sector is looking forward to improved access for frozen beef into both markets. As high value markets and with customers willing to pay for environmental and animal welfare attributes, better access into these markets has the potential to significantly improve market returns for the sector.
While the sector has some access to the European Union and United Kingdom markets through MFN quota, these are administered by the importing market and are extremely opaque. Because the sector is not able to
42 Barriers to International Trade 2020/21
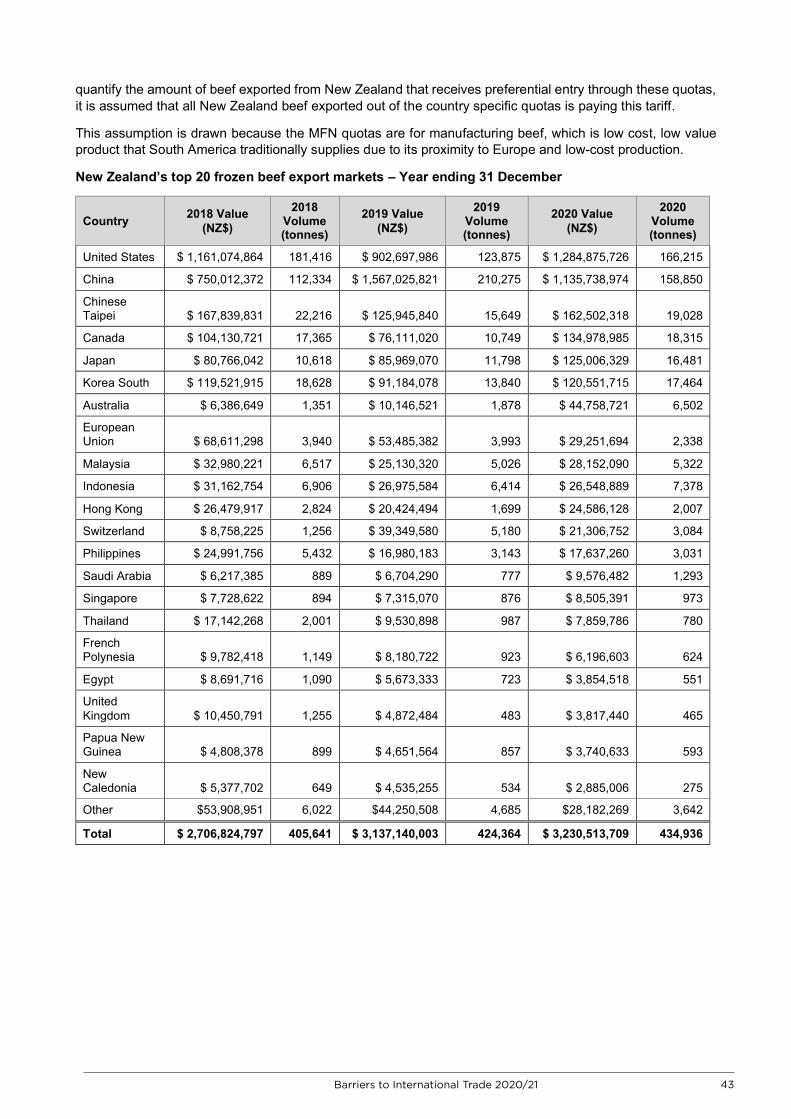
Barriers to International Trade 2020/21 43
quantify the amount of beef exported from New Zealand that receives preferential entry through these quotas, it is assumed that all New Zealand beef exported out of the country specific quotas is paying this tariff.
This assumption is drawn because the MFN quotas are for manufacturing beef, which is low cost, low value product that South America traditionally supplies due to its proximity to Europe and low-cost production.
New Zealand’s top 20 frozen beef export markets – Year ending 31 December
Country 2018 Value (NZ$)
2018 Volume (tonnes)
2019 Value (NZ$)
2019 Volume (tonnes)
2020 Value (NZ$)
2020 Volume (tonnes)
United States $ 1,161,074,864 181,416 $ 902,697,986 123,875 $ 1,284,875,726 166,215
China $ 750,012,372 112,334 $ 1,567,025,821 210,275 $ 1,135,738,974 158,850
Chinese Taipei $ 167,839,831 22,216 $ 125,945,840 15,649 $ 162,502,318 19,028
Canada $ 104,130,721 17,365 $ 76,111,020 10,749 $ 134,978,985 18,315
Japan $ 80,766,042 10,618 $ 85,969,070 11,798 $ 125,006,329 16,481
Korea South $ 119,521,915 18,628 $ 91,184,078 13,840 $ 120,551,715 17,464
Australia $ 6,386,649 1,351 $ 10,146,521 1,878 $ 44,758,721 6,502
European Union $ 68,611,298 3,940 $ 53,485,382 3,993 $ 29,251,694 2,338
Malaysia $ 32,980,221 6,517 $ 25,130,320 5,026 $ 28,152,090 5,322
Indonesia $ 31,162,754 6,906 $ 26,975,584 6,414 $ 26,548,889 7,378
Hong Kong $ 26,479,917 2,824 $ 20,424,494 1,699 $ 24,586,128 2,007
Switzerland $ 8,758,225 1,256 $ 39,349,580 5,180 $ 21,306,752 3,084
Philippines $ 24,991,756 5,432 $ 16,980,183 3,143 $ 17,637,260 3,031
Saudi Arabia $ 6,217,385 889 $ 6,704,290 777 $ 9,576,482 1,293
Singapore $ 7,728,622 894 $ 7,315,070 876 $ 8,505,391 973
Thailand $ 17,142,268 2,001 $ 9,530,898 987 $ 7,859,786 780
French Polynesia $ 9,782,418 1,149 $ 8,180,722 923 $ 6,196,603 624
Egypt $ 8,691,716 1,090 $ 5,673,333 723 $ 3,854,518 551
United Kingdom $ 10,450,791 1,255 $ 4,872,484 483 $ 3,817,440 465
Papua New Guinea $ 4,808,378 899 $ 4,651,564 857 $ 3,740,633 593
New Caledonia $ 5,377,702 649 $ 4,535,255 534 $ 2,885,006 275
Other $53,908,951 6,022 $44,250,508 4,685 $28,182,269 3,642
Total $ 2,706,824,797 405,641 $ 3,137,140,003 424,364 $ 3,230,513,709 434,936
43Barriers to International Trade 2020/21
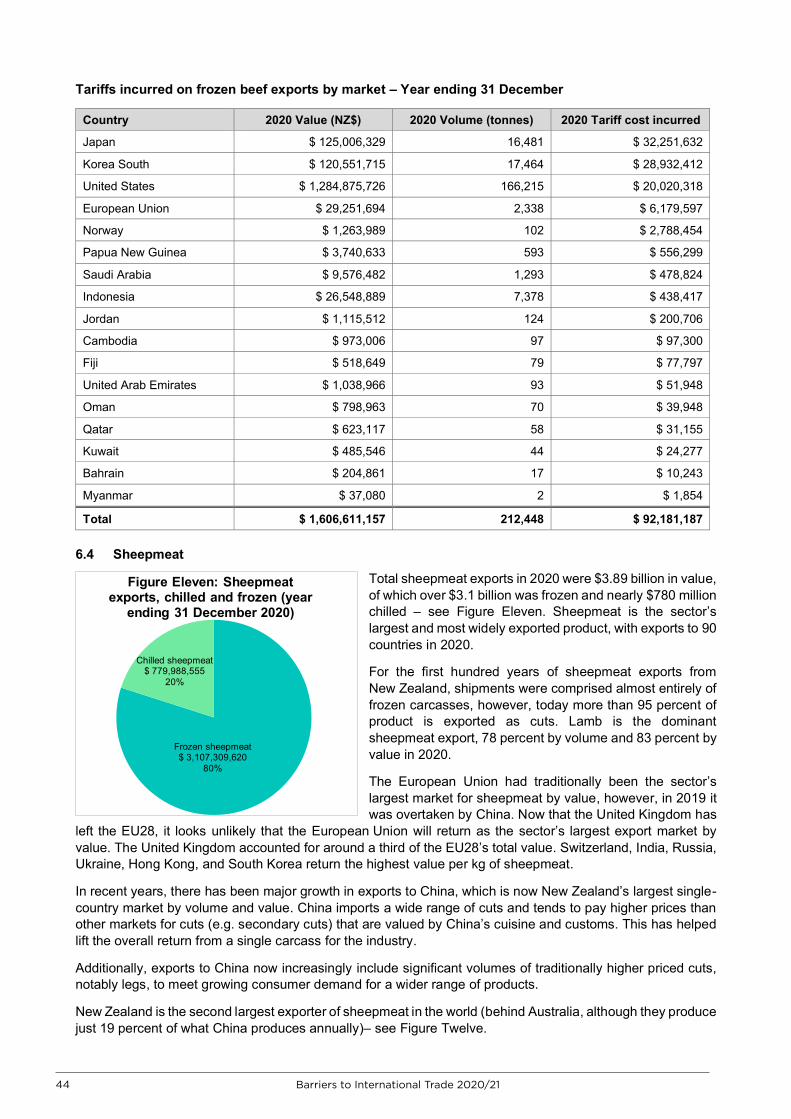
Barriers to International Trade 2020/21 44
Tariffs incurred on frozen beef exports by market – Year ending 31 December
Country 2020 Value (NZ$) 2020 Volume (tonnes) 2020 Tariff cost incurred
Japan $ 125,006,329 16,481 $ 32,251,632
Korea South $ 120,551,715 17,464 $ 28,932,412
United States $ 1,284,875,726 166,215 $ 20,020,318
European Union $ 29,251,694 2,338 $ 6,179,597
Norway $ 1,263,989 102 $ 2,788,454
Papua New Guinea $ 3,740,633 593 $ 556,299
Saudi Arabia $ 9,576,482 1,293 $ 478,824
Indonesia $ 26,548,889 7,378 $ 438,417
Jordan $ 1,115,512 124 $ 200,706
Cambodia $ 973,006 97 $ 97,300
Fiji $ 518,649 79 $ 77,797
United Arab Emirates $ 1,038,966 93 $ 51,948
Oman $ 798,963 70 $ 39,948
Qatar $ 623,117 58 $ 31,155
Kuwait $ 485,546 44 $ 24,277
Bahrain $ 204,861 17 $ 10,243
Myanmar $ 37,080 2 $ 1,854
Total $ 1,606,611,157 212,448 $ 92,181,187
6.4 Sheepmeat
Total sheepmeat exports in 2020 were $3.89 billion in value, of which over $3.1 billion was frozen and nearly $780 million chilled – see Figure Eleven. Sheepmeat is the sector’s largest and most widely exported product, with exports to 90 countries in 2020.
For the first hundred years of sheepmeat exports from New Zealand, shipments were comprised almost entirely of frozen carcasses, however, today more than 95 percent of product is exported as cuts. Lamb is the dominant sheepmeat export, 78 percent by volume and 83 percent by value in 2020.
The European Union had traditionally been the sector’s largest market for sheepmeat by value, however, in 2019 it was overtaken by China. Now that the United Kingdom has
left the EU28, it looks unlikely that the European Union will return as the sector’s largest export market by value. The United Kingdom accounted for around a third of the EU28’s total value. Switzerland, India, Russia, Ukraine, Hong Kong, and South Korea return the highest value per kg of sheepmeat.
In recent years, there has been major growth in exports to China, which is now New Zealand’s largest single-country market by volume and value. China imports a wide range of cuts and tends to pay higher prices than other markets for cuts (e.g. secondary cuts) that are valued by China’s cuisine and customs. This has helped lift the overall return from a single carcass for the industry.
Additionally, exports to China now increasingly include significant volumes of traditionally higher priced cuts, notably legs, to meet growing consumer demand for a wider range of products.
New Zealand is the second largest exporter of sheepmeat in the world (behind Australia, although they produce just 19 percent of what China produces annually)– see Figure Twelve.
Frozen sheepmeat$ 3,107,309,620
80%
Chilled sheepmeat$ 779,988,555
20%
Figure Eleven: Sheepmeat exports, chilled and frozen (year
ending 31 December 2020)
44 Barriers to International Trade 2020/21
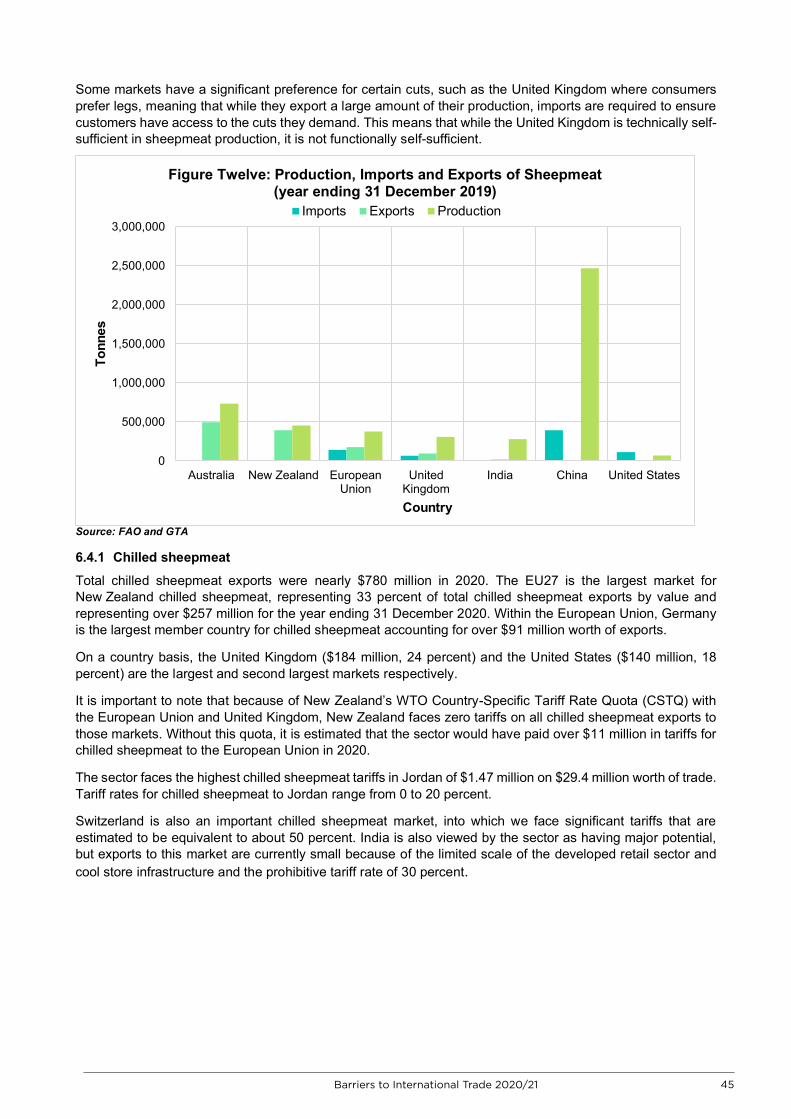
Barriers to International Trade 2020/21 45
Some markets have a significant preference for certain cuts, such as the United Kingdom where consumers prefer legs, meaning that while they export a large amount of their production, imports are required to ensure customers have access to the cuts they demand. This means that while the United Kingdom is technically self-sufficient in sheepmeat production, it is not functionally self-sufficient.
Source: FAO and GTA
6.4.1 Chilled sheepmeat
Total chilled sheepmeat exports were nearly $780 million in 2020. The EU27 is the largest market for New Zealand chilled sheepmeat, representing 33 percent of total chilled sheepmeat exports by value and representing over $257 million for the year ending 31 December 2020. Within the European Union, Germany is the largest member country for chilled sheepmeat accounting for over $91 million worth of exports.
On a country basis, the United Kingdom ($184 million, 24 percent) and the United States ($140 million, 18 percent) are the largest and second largest markets respectively.
It is important to note that because of New Zealand’s WTO Country-Specific Tariff Rate Quota (CSTQ) with the European Union and United Kingdom, New Zealand faces zero tariffs on all chilled sheepmeat exports to those markets. Without this quota, it is estimated that the sector would have paid over $11 million in tariffs for chilled sheepmeat to the European Union in 2020.
The sector faces the highest chilled sheepmeat tariffs in Jordan of $1.47 million on $29.4 million worth of trade. Tariff rates for chilled sheepmeat to Jordan range from 0 to 20 percent.
Switzerland is also an important chilled sheepmeat market, into which we face significant tariffs that are estimated to be equivalent to about 50 percent. India is also viewed by the sector as having major potential, but exports to this market are currently small because of the limited scale of the developed retail sector and cool store infrastructure and the prohibitive tariff rate of 30 percent.
0
500,000
1,000,000
1,500,000
2,000,000
2,500,000
3,000,000
Australia New Zealand EuropeanUnion
UnitedKingdom
India China United States
Tonn
es
Country
Figure Twelve: Production, Imports and Exports of Sheepmeat (year ending 31 December 2019)
Imports Exports Production
45Barriers to International Trade 2020/21
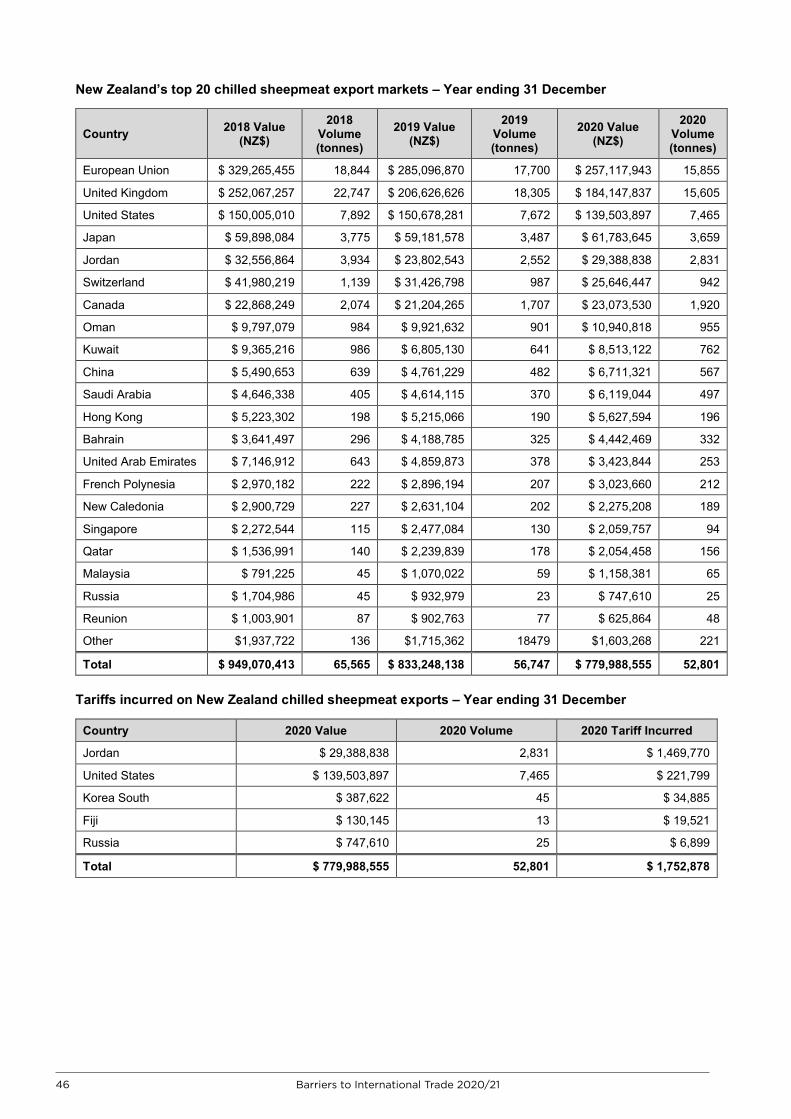
Barriers to International Trade 2020/21 46
New Zealand’s top 20 chilled sheepmeat export markets – Year ending 31 December
Country 2018 Value (NZ$)
2018 Volume (tonnes)
2019 Value (NZ$)
2019 Volume (tonnes)
2020 Value (NZ$)
2020 Volume (tonnes)
European Union $ 329,265,455 18,844 $ 285,096,870 17,700 $ 257,117,943 15,855
United Kingdom $ 252,067,257 22,747 $ 206,626,626 18,305 $ 184,147,837 15,605
United States $ 150,005,010 7,892 $ 150,678,281 7,672 $ 139,503,897 7,465
Japan $ 59,898,084 3,775 $ 59,181,578 3,487 $ 61,783,645 3,659
Jordan $ 32,556,864 3,934 $ 23,802,543 2,552 $ 29,388,838 2,831
Switzerland $ 41,980,219 1,139 $ 31,426,798 987 $ 25,646,447 942
Canada $ 22,868,249 2,074 $ 21,204,265 1,707 $ 23,073,530 1,920
Oman $ 9,797,079 984 $ 9,921,632 901 $ 10,940,818 955
Kuwait $ 9,365,216 986 $ 6,805,130 641 $ 8,513,122 762
China $ 5,490,653 639 $ 4,761,229 482 $ 6,711,321 567
Saudi Arabia $ 4,646,338 405 $ 4,614,115 370 $ 6,119,044 497
Hong Kong $ 5,223,302 198 $ 5,215,066 190 $ 5,627,594 196
Bahrain $ 3,641,497 296 $ 4,188,785 325 $ 4,442,469 332
United Arab Emirates $ 7,146,912 643 $ 4,859,873 378 $ 3,423,844 253
French Polynesia $ 2,970,182 222 $ 2,896,194 207 $ 3,023,660 212
New Caledonia $ 2,900,729 227 $ 2,631,104 202 $ 2,275,208 189
Singapore $ 2,272,544 115 $ 2,477,084 130 $ 2,059,757 94
Qatar $ 1,536,991 140 $ 2,239,839 178 $ 2,054,458 156
Malaysia $ 791,225 45 $ 1,070,022 59 $ 1,158,381 65
Russia $ 1,704,986 45 $ 932,979 23 $ 747,610 25
Reunion $ 1,003,901 87 $ 902,763 77 $ 625,864 48
Other $1,937,722 136 $1,715,362 18479 $1,603,268 221
Total $ 949,070,413 65,565 $ 833,248,138 56,747 $ 779,988,555 52,801
Tariffs incurred on New Zealand chilled sheepmeat exports – Year ending 31 December
Country 2020 Value 2020 Volume 2020 Tariff Incurred
Jordan $ 29,388,838 2,831 $ 1,469,770
United States $ 139,503,897 7,465 $ 221,799
Korea South $ 387,622 45 $ 34,885
Fiji $ 130,145 13 $ 19,521
Russia $ 747,610 25 $ 6,899
Total $ 779,988,555 52,801 $ 1,752,878
46 Barriers to International Trade 2020/21
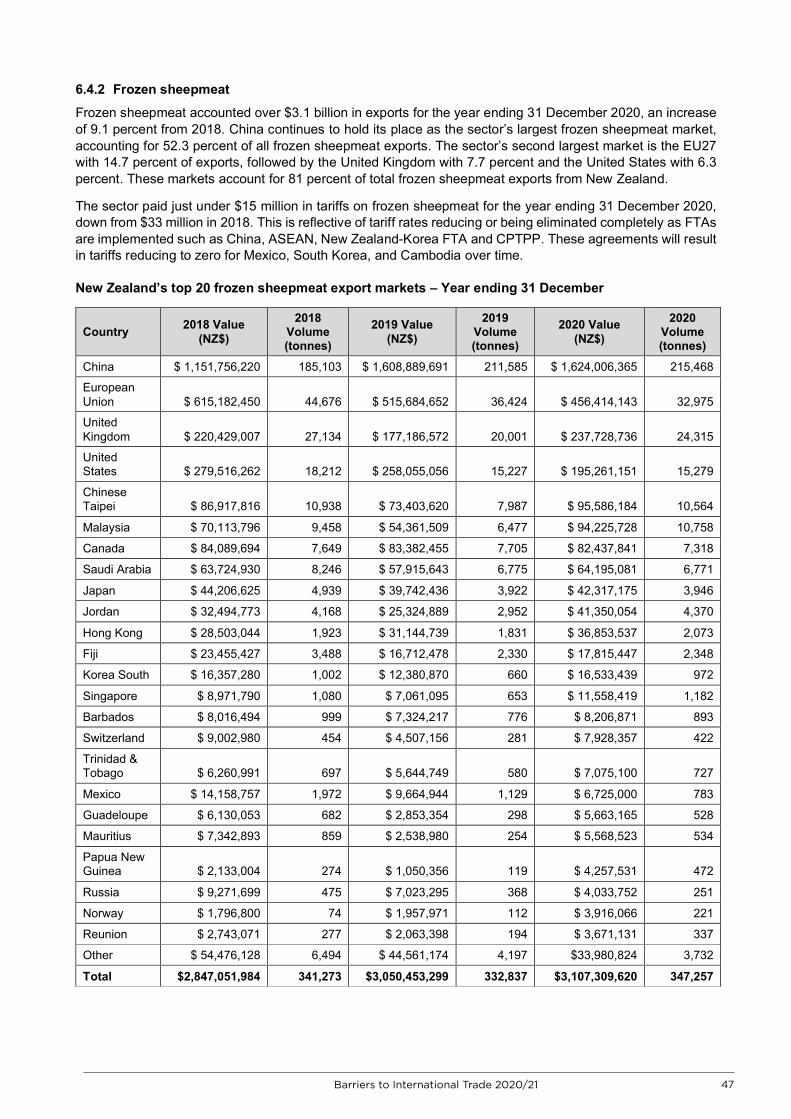
Barriers to International Trade 2020/21 47
6.4.2 Frozen sheepmeat
Frozen sheepmeat accounted over $3.1 billion in exports for the year ending 31 December 2020, an increase of 9.1 percent from 2018. China continues to hold its place as the sector’s largest frozen sheepmeat market, accounting for 52.3 percent of all frozen sheepmeat exports. The sector’s second largest market is the EU27 with 14.7 percent of exports, followed by the United Kingdom with 7.7 percent and the United States with 6.3 percent. These markets account for 81 percent of total frozen sheepmeat exports from New Zealand.
The sector paid just under $15 million in tariffs on frozen sheepmeat for the year ending 31 December 2020, down from $33 million in 2018. This is reflective of tariff rates reducing or being eliminated completely as FTAs are implemented such as China, ASEAN, New Zealand-Korea FTA and CPTPP. These agreements will result in tariffs reducing to zero for Mexico, South Korea, and Cambodia over time.
New Zealand’s top 20 frozen sheepmeat export markets – Year ending 31 December
Country 2018 Value (NZ$)
2018 Volume (tonnes)
2019 Value (NZ$)
2019 Volume (tonnes)
2020 Value (NZ$)
2020 Volume (tonnes)
China $ 1,151,756,220 185,103 $ 1,608,889,691 211,585 $ 1,624,006,365 215,468
European Union $ 615,182,450 44,676 $ 515,684,652 36,424 $ 456,414,143 32,975
United Kingdom $ 220,429,007 27,134 $ 177,186,572 20,001 $ 237,728,736 24,315
United States $ 279,516,262 18,212 $ 258,055,056 15,227 $ 195,261,151 15,279
Chinese Taipei $ 86,917,816 10,938 $ 73,403,620 7,987 $ 95,586,184 10,564
Malaysia $ 70,113,796 9,458 $ 54,361,509 6,477 $ 94,225,728 10,758
Canada $ 84,089,694 7,649 $ 83,382,455 7,705 $ 82,437,841 7,318
Saudi Arabia $ 63,724,930 8,246 $ 57,915,643 6,775 $ 64,195,081 6,771
Japan $ 44,206,625 4,939 $ 39,742,436 3,922 $ 42,317,175 3,946
Jordan $ 32,494,773 4,168 $ 25,324,889 2,952 $ 41,350,054 4,370
Hong Kong $ 28,503,044 1,923 $ 31,144,739 1,831 $ 36,853,537 2,073
Fiji $ 23,455,427 3,488 $ 16,712,478 2,330 $ 17,815,447 2,348
Korea South $ 16,357,280 1,002 $ 12,380,870 660 $ 16,533,439 972
Singapore $ 8,971,790 1,080 $ 7,061,095 653 $ 11,558,419 1,182
Barbados $ 8,016,494 999 $ 7,324,217 776 $ 8,206,871 893
Switzerland $ 9,002,980 454 $ 4,507,156 281 $ 7,928,357 422
Trinidad & Tobago $ 6,260,991 697 $ 5,644,749 580 $ 7,075,100 727
Mexico $ 14,158,757 1,972 $ 9,664,944 1,129 $ 6,725,000 783
Guadeloupe $ 6,130,053 682 $ 2,853,354 298 $ 5,663,165 528
Mauritius $ 7,342,893 859 $ 2,538,980 254 $ 5,568,523 534
Papua New Guinea $ 2,133,004 274 $ 1,050,356 119 $ 4,257,531 472
Russia $ 9,271,699 475 $ 7,023,295 368 $ 4,033,752 251
Norway $ 1,796,800 74 $ 1,957,971 112 $ 3,916,066 221
Reunion $ 2,743,071 277 $ 2,063,398 194 $ 3,671,131 337
Other $ 54,476,128 6,494 $ 44,561,174 4,197 $33,980,824 3,732
Total $2,847,051,984 341,273 $3,050,453,299 332,837 $3,107,309,620 347,257
47Barriers to International Trade 2020/21
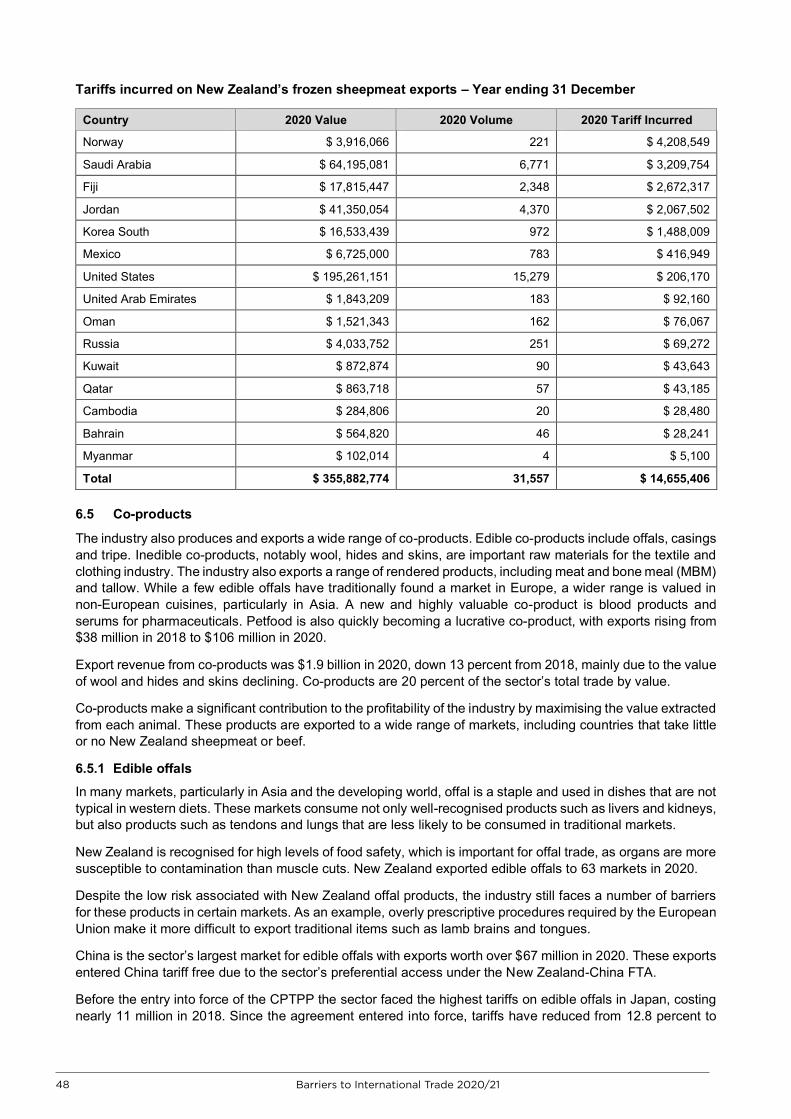
Barriers to International Trade 2020/21 48
Tariffs incurred on New Zealand’s frozen sheepmeat exports – Year ending 31 December
Country 2020 Value 2020 Volume 2020 Tariff Incurred
Norway $ 3,916,066 221 $ 4,208,549
Saudi Arabia $ 64,195,081 6,771 $ 3,209,754
Fiji $ 17,815,447 2,348 $ 2,672,317
Jordan $ 41,350,054 4,370 $ 2,067,502
Korea South $ 16,533,439 972 $ 1,488,009
Mexico $ 6,725,000 783 $ 416,949
United States $ 195,261,151 15,279 $ 206,170
United Arab Emirates $ 1,843,209 183 $ 92,160
Oman $ 1,521,343 162 $ 76,067
Russia $ 4,033,752 251 $ 69,272
Kuwait $ 872,874 90 $ 43,643
Qatar $ 863,718 57 $ 43,185
Cambodia $ 284,806 20 $ 28,480
Bahrain $ 564,820 46 $ 28,241
Myanmar $ 102,014 4 $ 5,100
Total $ 355,882,774 31,557 $ 14,655,406
6.5 Co-products
The industry also produces and exports a wide range of co-products. Edible co-products include offals, casings and tripe. Inedible co-products, notably wool, hides and skins, are important raw materials for the textile and clothing industry. The industry also exports a range of rendered products, including meat and bone meal (MBM) and tallow. While a few edible offals have traditionally found a market in Europe, a wider range is valued in non-European cuisines, particularly in Asia. A new and highly valuable co-product is blood products and serums for pharmaceuticals. Petfood is also quickly becoming a lucrative co-product, with exports rising from $38 million in 2018 to $106 million in 2020.
Export revenue from co-products was $1.9 billion in 2020, down 13 percent from 2018, mainly due to the value of wool and hides and skins declining. Co-products are 20 percent of the sector’s total trade by value.
Co-products make a significant contribution to the profitability of the industry by maximising the value extracted from each animal. These products are exported to a wide range of markets, including countries that take little or no New Zealand sheepmeat or beef.
6.5.1 Edible offals
In many markets, particularly in Asia and the developing world, offal is a staple and used in dishes that are not typical in western diets. These markets consume not only well-recognised products such as livers and kidneys, but also products such as tendons and lungs that are less likely to be consumed in traditional markets.
New Zealand is recognised for high levels of food safety, which is important for offal trade, as organs are more susceptible to contamination than muscle cuts. New Zealand exported edible offals to 63 markets in 2020.
Despite the low risk associated with New Zealand offal products, the industry still faces a number of barriers for these products in certain markets. As an example, overly prescriptive procedures required by the European Union make it more difficult to export traditional items such as lamb brains and tongues.
China is the sector’s largest market for edible offals with exports worth over $67 million in 2020. These exports entered China tariff free due to the sector’s preferential access under the New Zealand-China FTA.
Before the entry into force of the CPTPP the sector faced the highest tariffs on edible offals in Japan, costing nearly 11 million in 2018. Since the agreement entered into force, tariffs have reduced from 12.8 percent to
48 Barriers to International Trade 2020/21
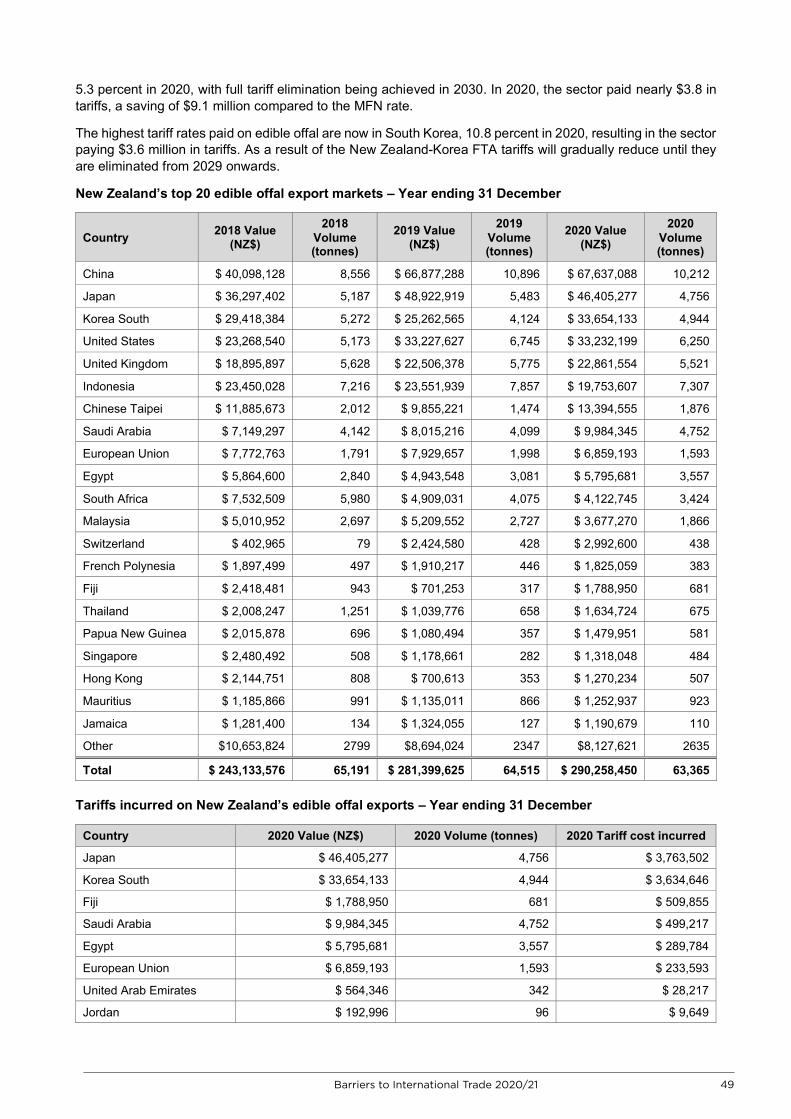
Barriers to International Trade 2020/21 49
5.3 percent in 2020, with full tariff elimination being achieved in 2030. In 2020, the sector paid nearly $3.8 in tariffs, a saving of $9.1 million compared to the MFN rate.
The highest tariff rates paid on edible offal are now in South Korea, 10.8 percent in 2020, resulting in the sector paying $3.6 million in tariffs. As a result of the New Zealand-Korea FTA tariffs will gradually reduce until they are eliminated from 2029 onwards.
New Zealand’s top 20 edible offal export markets – Year ending 31 December
Country 2018 Value (NZ$)
2018 Volume (tonnes)
2019 Value (NZ$)
2019 Volume (tonnes)
2020 Value (NZ$)
2020 Volume (tonnes)
China $ 40,098,128 8,556 $ 66,877,288 10,896 $ 67,637,088 10,212
Japan $ 36,297,402 5,187 $ 48,922,919 5,483 $ 46,405,277 4,756
Korea South $ 29,418,384 5,272 $ 25,262,565 4,124 $ 33,654,133 4,944
United States $ 23,268,540 5,173 $ 33,227,627 6,745 $ 33,232,199 6,250
United Kingdom $ 18,895,897 5,628 $ 22,506,378 5,775 $ 22,861,554 5,521
Indonesia $ 23,450,028 7,216 $ 23,551,939 7,857 $ 19,753,607 7,307
Chinese Taipei $ 11,885,673 2,012 $ 9,855,221 1,474 $ 13,394,555 1,876
Saudi Arabia $ 7,149,297 4,142 $ 8,015,216 4,099 $ 9,984,345 4,752
European Union $ 7,772,763 1,791 $ 7,929,657 1,998 $ 6,859,193 1,593
Egypt $ 5,864,600 2,840 $ 4,943,548 3,081 $ 5,795,681 3,557
South Africa $ 7,532,509 5,980 $ 4,909,031 4,075 $ 4,122,745 3,424
Malaysia $ 5,010,952 2,697 $ 5,209,552 2,727 $ 3,677,270 1,866
Switzerland $ 402,965 79 $ 2,424,580 428 $ 2,992,600 438
French Polynesia $ 1,897,499 497 $ 1,910,217 446 $ 1,825,059 383
Fiji $ 2,418,481 943 $ 701,253 317 $ 1,788,950 681
Thailand $ 2,008,247 1,251 $ 1,039,776 658 $ 1,634,724 675
Papua New Guinea $ 2,015,878 696 $ 1,080,494 357 $ 1,479,951 581
Singapore $ 2,480,492 508 $ 1,178,661 282 $ 1,318,048 484
Hong Kong $ 2,144,751 808 $ 700,613 353 $ 1,270,234 507
Mauritius $ 1,185,866 991 $ 1,135,011 866 $ 1,252,937 923
Jamaica $ 1,281,400 134 $ 1,324,055 127 $ 1,190,679 110
Other $10,653,824 2799 $8,694,024 2347 $8,127,621 2635
Total $ 243,133,576 65,191 $ 281,399,625 64,515 $ 290,258,450 63,365
Tariffs incurred on New Zealand’s edible offal exports – Year ending 31 December
Country 2020 Value (NZ$) 2020 Volume (tonnes) 2020 Tariff cost incurred
Japan $ 46,405,277 4,756 $ 3,763,502
Korea South $ 33,654,133 4,944 $ 3,634,646
Fiji $ 1,788,950 681 $ 509,855
Saudi Arabia $ 9,984,345 4,752 $ 499,217
Egypt $ 5,795,681 3,557 $ 289,784
European Union $ 6,859,193 1,593 $ 233,593
United Arab Emirates $ 564,346 342 $ 28,217
Jordan $ 192,996 96 $ 9,649
49Barriers to International Trade 2020/21
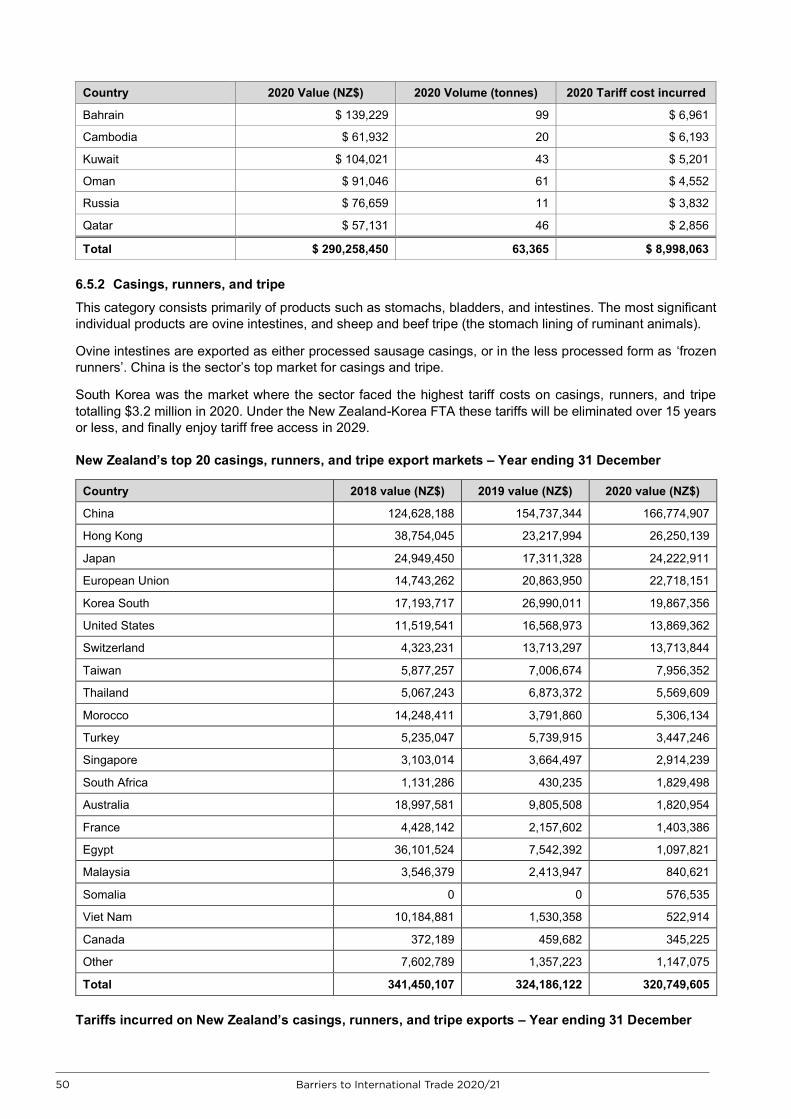
Barriers to International Trade 2020/21 50
Country 2020 Value (NZ$) 2020 Volume (tonnes) 2020 Tariff cost incurred
Bahrain $ 139,229 99 $ 6,961
Cambodia $ 61,932 20 $ 6,193
Kuwait $ 104,021 43 $ 5,201
Oman $ 91,046 61 $ 4,552
Russia $ 76,659 11 $ 3,832
Qatar $ 57,131 46 $ 2,856
Total $ 290,258,450 63,365 $ 8,998,063
6.5.2 Casings, runners, and tripe
This category consists primarily of products such as stomachs, bladders, and intestines. The most significant individual products are ovine intestines, and sheep and beef tripe (the stomach lining of ruminant animals).
Ovine intestines are exported as either processed sausage casings, or in the less processed form as ‘frozen runners’. China is the sector’s top market for casings and tripe.
South Korea was the market where the sector faced the highest tariff costs on casings, runners, and tripe totalling $3.2 million in 2020. Under the New Zealand-Korea FTA these tariffs will be eliminated over 15 years or less, and finally enjoy tariff free access in 2029.
New Zealand’s top 20 casings, runners, and tripe export markets – Year ending 31 December
Country 2018 value (NZ$) 2019 value (NZ$) 2020 value (NZ$)
China 124,628,188 154,737,344 166,774,907
Hong Kong 38,754,045 23,217,994 26,250,139
Japan 24,949,450 17,311,328 24,222,911
European Union 14,743,262 20,863,950 22,718,151
Korea South 17,193,717 26,990,011 19,867,356
United States 11,519,541 16,568,973 13,869,362
Switzerland 4,323,231 13,713,297 13,713,844
Taiwan 5,877,257 7,006,674 7,956,352
Thailand 5,067,243 6,873,372 5,569,609
Morocco 14,248,411 3,791,860 5,306,134
Turkey 5,235,047 5,739,915 3,447,246
Singapore 3,103,014 3,664,497 2,914,239
South Africa 1,131,286 430,235 1,829,498
Australia 18,997,581 9,805,508 1,820,954
France 4,428,142 2,157,602 1,403,386
Egypt 36,101,524 7,542,392 1,097,821
Malaysia 3,546,379 2,413,947 840,621
Somalia 0 0 576,535
Viet Nam 10,184,881 1,530,358 522,914
Canada 372,189 459,682 345,225
Other 7,602,789 1,357,223 1,147,075
Total 341,450,107 324,186,122 320,749,605
Tariffs incurred on New Zealand’s casings, runners, and tripe exports – Year ending 31 December
50 Barriers to International Trade 2020/21
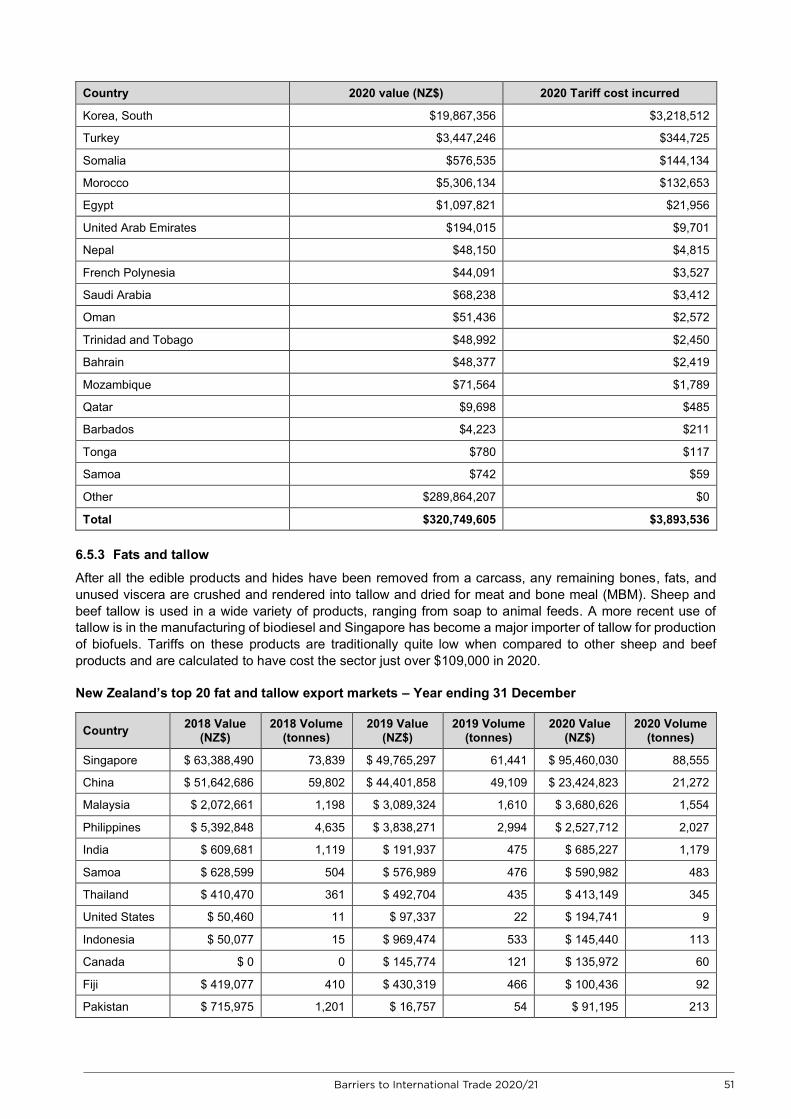
Barriers to International Trade 2020/21 51
Country 2020 value (NZ$) 2020 Tariff cost incurred
Korea, South $19,867,356 $3,218,512
Turkey $3,447,246 $344,725
Somalia $576,535 $144,134
Morocco $5,306,134 $132,653
Egypt $1,097,821 $21,956
United Arab Emirates $194,015 $9,701
Nepal $48,150 $4,815
French Polynesia $44,091 $3,527
Saudi Arabia $68,238 $3,412
Oman $51,436 $2,572
Trinidad and Tobago $48,992 $2,450
Bahrain $48,377 $2,419
Mozambique $71,564 $1,789
Qatar $9,698 $485
Barbados $4,223 $211
Tonga $780 $117
Samoa $742 $59
Other $289,864,207 $0
Total $320,749,605 $3,893,536
6.5.3 Fats and tallow
After all the edible products and hides have been removed from a carcass, any remaining bones, fats, and unused viscera are crushed and rendered into tallow and dried for meat and bone meal (MBM). Sheep and beef tallow is used in a wide variety of products, ranging from soap to animal feeds. A more recent use of tallow is in the manufacturing of biodiesel and Singapore has become a major importer of tallow for production of biofuels. Tariffs on these products are traditionally quite low when compared to other sheep and beef products and are calculated to have cost the sector just over $109,000 in 2020.
New Zealand’s top 20 fat and tallow export markets – Year ending 31 December
Country 2018 Value (NZ$)
2018 Volume (tonnes)
2019 Value (NZ$)
2019 Volume (tonnes)
2020 Value (NZ$)
2020 Volume (tonnes)
Singapore $ 63,388,490 73,839 $ 49,765,297 61,441 $ 95,460,030 88,555
China $ 51,642,686 59,802 $ 44,401,858 49,109 $ 23,424,823 21,272
Malaysia $ 2,072,661 1,198 $ 3,089,324 1,610 $ 3,680,626 1,554
Philippines $ 5,392,848 4,635 $ 3,838,271 2,994 $ 2,527,712 2,027
India $ 609,681 1,119 $ 191,937 475 $ 685,227 1,179
Samoa $ 628,599 504 $ 576,989 476 $ 590,982 483
Thailand $ 410,470 361 $ 492,704 435 $ 413,149 345
United States $ 50,460 11 $ 97,337 22 $ 194,741 9
Indonesia $ 50,077 15 $ 969,474 533 $ 145,440 113
Canada $ 0 0 $ 145,774 121 $ 135,972 60
Fiji $ 419,077 410 $ 430,319 466 $ 100,436 92
Pakistan $ 715,975 1,201 $ 16,757 54 $ 91,195 213
51Barriers to International Trade 2020/21
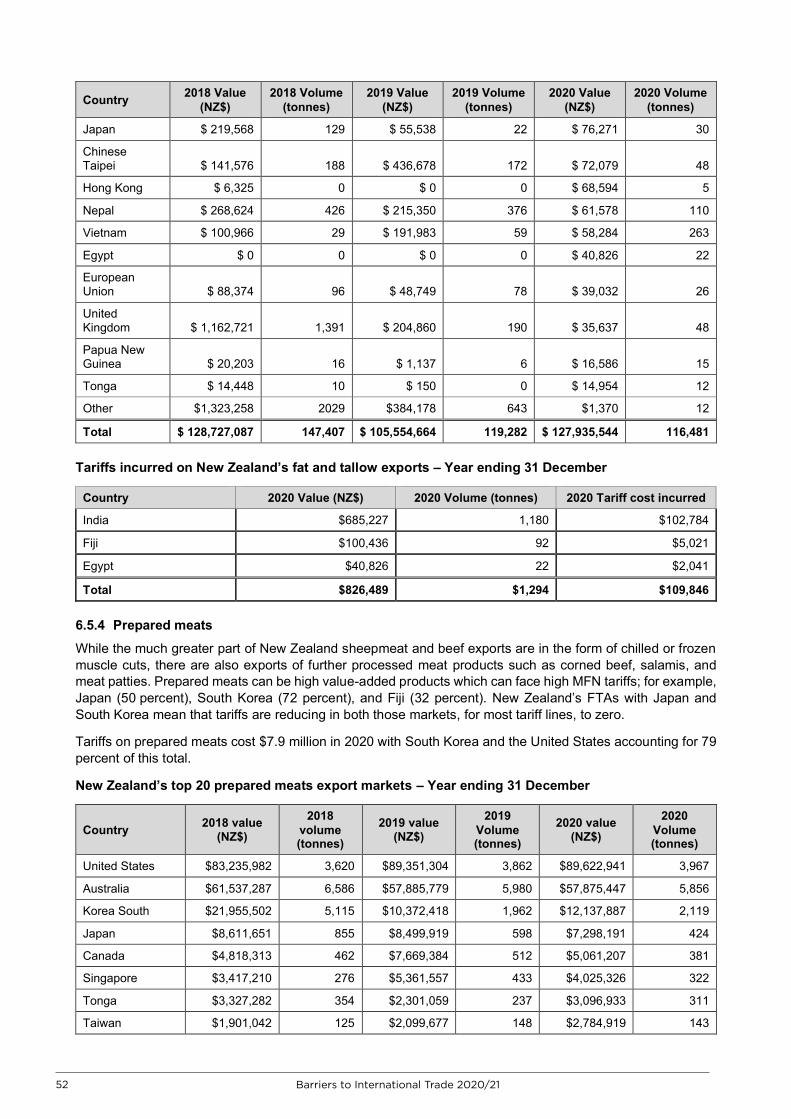
Barriers to International Trade 2020/21 52
Country 2018 Value (NZ$)
2018 Volume (tonnes)
2019 Value (NZ$)
2019 Volume (tonnes)
2020 Value (NZ$)
2020 Volume (tonnes)
Japan $ 219,568 129 $ 55,538 22 $ 76,271 30
Chinese Taipei $ 141,576 188 $ 436,678 172 $ 72,079 48
Hong Kong $ 6,325 0 $ 0 0 $ 68,594 5
Nepal $ 268,624 426 $ 215,350 376 $ 61,578 110
Vietnam $ 100,966 29 $ 191,983 59 $ 58,284 263
Egypt $ 0 0 $ 0 0 $ 40,826 22
European Union $ 88,374 96 $ 48,749 78 $ 39,032 26
United Kingdom $ 1,162,721 1,391 $ 204,860 190 $ 35,637 48
Papua New Guinea $ 20,203 16 $ 1,137 6 $ 16,586 15
Tonga $ 14,448 10 $ 150 0 $ 14,954 12
Other $1,323,258 2029 $384,178 643 $1,370 12
Total $ 128,727,087 147,407 $ 105,554,664 119,282 $ 127,935,544 116,481
Tariffs incurred on New Zealand’s fat and tallow exports – Year ending 31 December
Country 2020 Value (NZ$) 2020 Volume (tonnes) 2020 Tariff cost incurred
India $685,227 1,180 $102,784
Fiji $100,436 92 $5,021
Egypt $40,826 22 $2,041
Total $826,489 $1,294 $109,846 6.5.4 Prepared meats
While the much greater part of New Zealand sheepmeat and beef exports are in the form of chilled or frozen muscle cuts, there are also exports of further processed meat products such as corned beef, salamis, and meat patties. Prepared meats can be high value-added products which can face high MFN tariffs; for example, Japan (50 percent), South Korea (72 percent), and Fiji (32 percent). New Zealand’s FTAs with Japan and South Korea mean that tariffs are reducing in both those markets, for most tariff lines, to zero.
Tariffs on prepared meats cost $7.9 million in 2020 with South Korea and the United States accounting for 79 percent of this total.
New Zealand’s top 20 prepared meats export markets – Year ending 31 December
Country 2018 value (NZ$)
2018 volume (tonnes)
2019 value (NZ$)
2019 Volume (tonnes)
2020 value (NZ$)
2020 Volume (tonnes)
United States $83,235,982 3,620 $89,351,304 3,862 $89,622,941 3,967
Australia $61,537,287 6,586 $57,885,779 5,980 $57,875,447 5,856
Korea South $21,955,502 5,115 $10,372,418 1,962 $12,137,887 2,119
Japan $8,611,651 855 $8,499,919 598 $7,298,191 424
Canada $4,818,313 462 $7,669,384 512 $5,061,207 381
Singapore $3,417,210 276 $5,361,557 433 $4,025,326 322
Tonga $3,327,282 354 $2,301,059 237 $3,096,933 311
Taiwan $1,901,042 125 $2,099,677 148 $2,784,919 143
52 Barriers to International Trade 2020/21
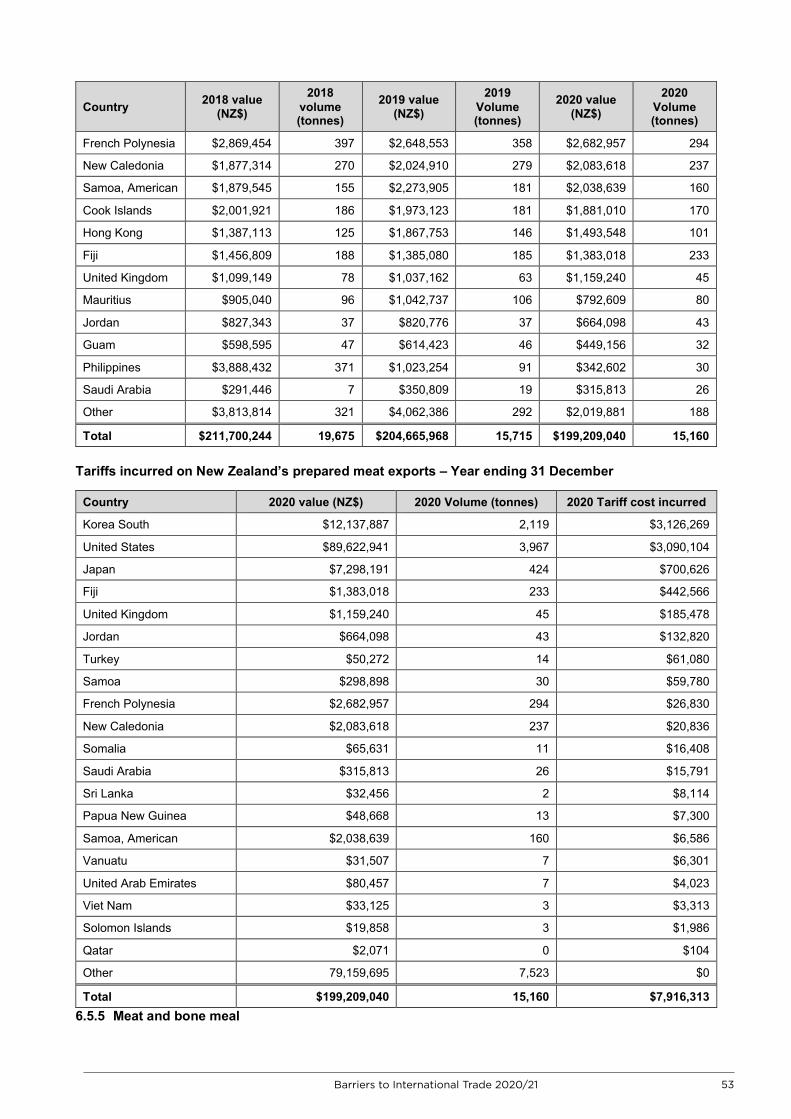
Barriers to International Trade 2020/21 53
Country 2018 value (NZ$)
2018 volume (tonnes)
2019 value (NZ$)
2019 Volume (tonnes)
2020 value (NZ$)
2020 Volume (tonnes)
French Polynesia $2,869,454 397 $2,648,553 358 $2,682,957 294
New Caledonia $1,877,314 270 $2,024,910 279 $2,083,618 237
Samoa, American $1,879,545 155 $2,273,905 181 $2,038,639 160
Cook Islands $2,001,921 186 $1,973,123 181 $1,881,010 170
Hong Kong $1,387,113 125 $1,867,753 146 $1,493,548 101
Fiji $1,456,809 188 $1,385,080 185 $1,383,018 233
United Kingdom $1,099,149 78 $1,037,162 63 $1,159,240 45
Mauritius $905,040 96 $1,042,737 106 $792,609 80
Jordan $827,343 37 $820,776 37 $664,098 43
Guam $598,595 47 $614,423 46 $449,156 32
Philippines $3,888,432 371 $1,023,254 91 $342,602 30
Saudi Arabia $291,446 7 $350,809 19 $315,813 26
Other $3,813,814 321 $4,062,386 292 $2,019,881 188
Total $211,700,244 19,675 $204,665,968 15,715 $199,209,040 15,160
Tariffs incurred on New Zealand’s prepared meat exports – Year ending 31 December
Country 2020 value (NZ$) 2020 Volume (tonnes) 2020 Tariff cost incurred
Korea South $12,137,887 2,119 $3,126,269
United States $89,622,941 3,967 $3,090,104
Japan $7,298,191 424 $700,626
Fiji $1,383,018 233 $442,566
United Kingdom $1,159,240 45 $185,478
Jordan $664,098 43 $132,820
Turkey $50,272 14 $61,080
Samoa $298,898 30 $59,780
French Polynesia $2,682,957 294 $26,830
New Caledonia $2,083,618 237 $20,836
Somalia $65,631 11 $16,408
Saudi Arabia $315,813 26 $15,791
Sri Lanka $32,456 2 $8,114
Papua New Guinea $48,668 13 $7,300
Samoa, American $2,038,639 160 $6,586
Vanuatu $31,507 7 $6,301
United Arab Emirates $80,457 7 $4,023
Viet Nam $33,125 3 $3,313
Solomon Islands $19,858 3 $1,986
Qatar $2,071 0 $104
Other 79,159,695 7,523 $0
Total $199,209,040 15,160 $7,916,313 6.5.5 Meat and bone meal
53Barriers to International Trade 2020/21
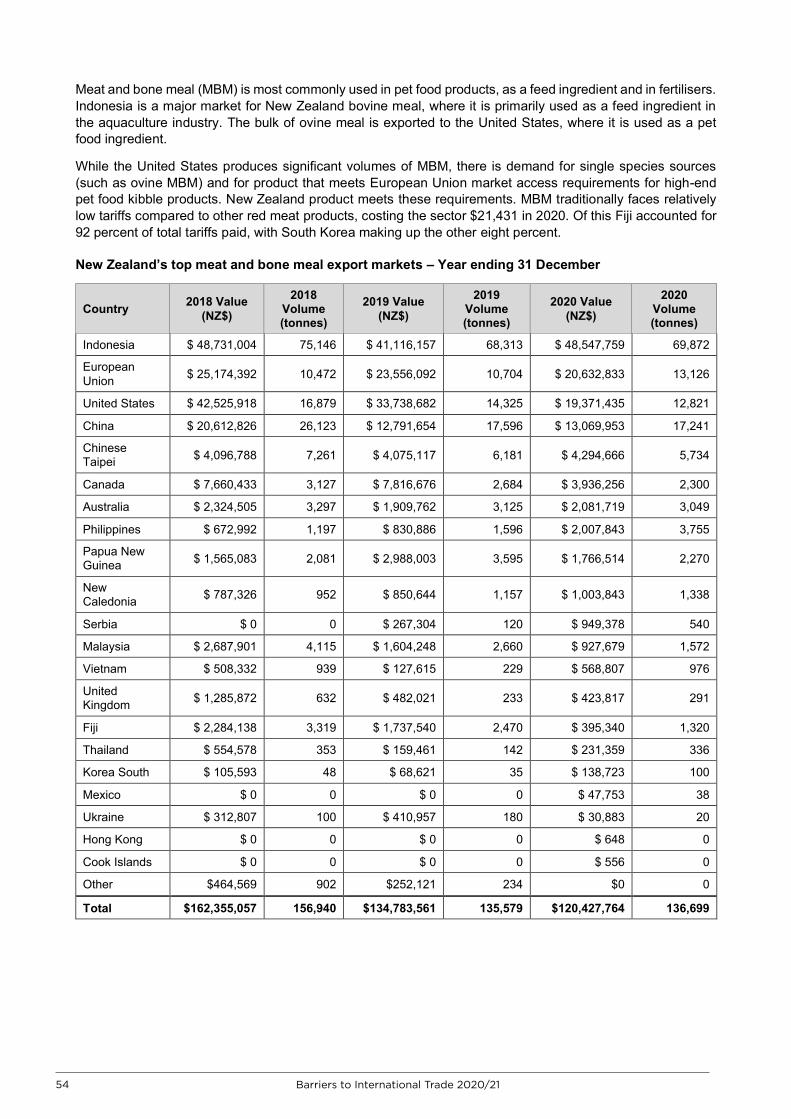
Barriers to International Trade 2020/21 54
Meat and bone meal (MBM) is most commonly used in pet food products, as a feed ingredient and in fertilisers. Indonesia is a major market for New Zealand bovine meal, where it is primarily used as a feed ingredient in the aquaculture industry. The bulk of ovine meal is exported to the United States, where it is used as a pet food ingredient.
While the United States produces significant volumes of MBM, there is demand for single species sources (such as ovine MBM) and for product that meets European Union market access requirements for high-end pet food kibble products. New Zealand product meets these requirements. MBM traditionally faces relatively low tariffs compared to other red meat products, costing the sector $21,431 in 2020. Of this Fiji accounted for 92 percent of total tariffs paid, with South Korea making up the other eight percent.
New Zealand’s top meat and bone meal export markets – Year ending 31 December
Country 2018 Value (NZ$)
2018 Volume (tonnes)
2019 Value (NZ$)
2019 Volume (tonnes)
2020 Value (NZ$)
2020 Volume (tonnes)
Indonesia $ 48,731,004 75,146 $ 41,116,157 68,313 $ 48,547,759 69,872
European Union $ 25,174,392 10,472 $ 23,556,092 10,704 $ 20,632,833 13,126
United States $ 42,525,918 16,879 $ 33,738,682 14,325 $ 19,371,435 12,821
China $ 20,612,826 26,123 $ 12,791,654 17,596 $ 13,069,953 17,241
Chinese Taipei $ 4,096,788 7,261 $ 4,075,117 6,181 $ 4,294,666 5,734
Canada $ 7,660,433 3,127 $ 7,816,676 2,684 $ 3,936,256 2,300
Australia $ 2,324,505 3,297 $ 1,909,762 3,125 $ 2,081,719 3,049
Philippines $ 672,992 1,197 $ 830,886 1,596 $ 2,007,843 3,755
Papua New Guinea $ 1,565,083 2,081 $ 2,988,003 3,595 $ 1,766,514 2,270
New Caledonia $ 787,326 952 $ 850,644 1,157 $ 1,003,843 1,338
Serbia $ 0 0 $ 267,304 120 $ 949,378 540
Malaysia $ 2,687,901 4,115 $ 1,604,248 2,660 $ 927,679 1,572
Vietnam $ 508,332 939 $ 127,615 229 $ 568,807 976
United Kingdom $ 1,285,872 632 $ 482,021 233 $ 423,817 291
Fiji $ 2,284,138 3,319 $ 1,737,540 2,470 $ 395,340 1,320
Thailand $ 554,578 353 $ 159,461 142 $ 231,359 336
Korea South $ 105,593 48 $ 68,621 35 $ 138,723 100
Mexico $ 0 0 $ 0 0 $ 47,753 38
Ukraine $ 312,807 100 $ 410,957 180 $ 30,883 20
Hong Kong $ 0 0 $ 0 0 $ 648 0
Cook Islands $ 0 0 $ 0 0 $ 556 0
Other $464,569 902 $252,121 234 $0 0
Total $162,355,057 156,940 $134,783,561 135,579 $120,427,764 136,699
54 Barriers to International Trade 2020/21
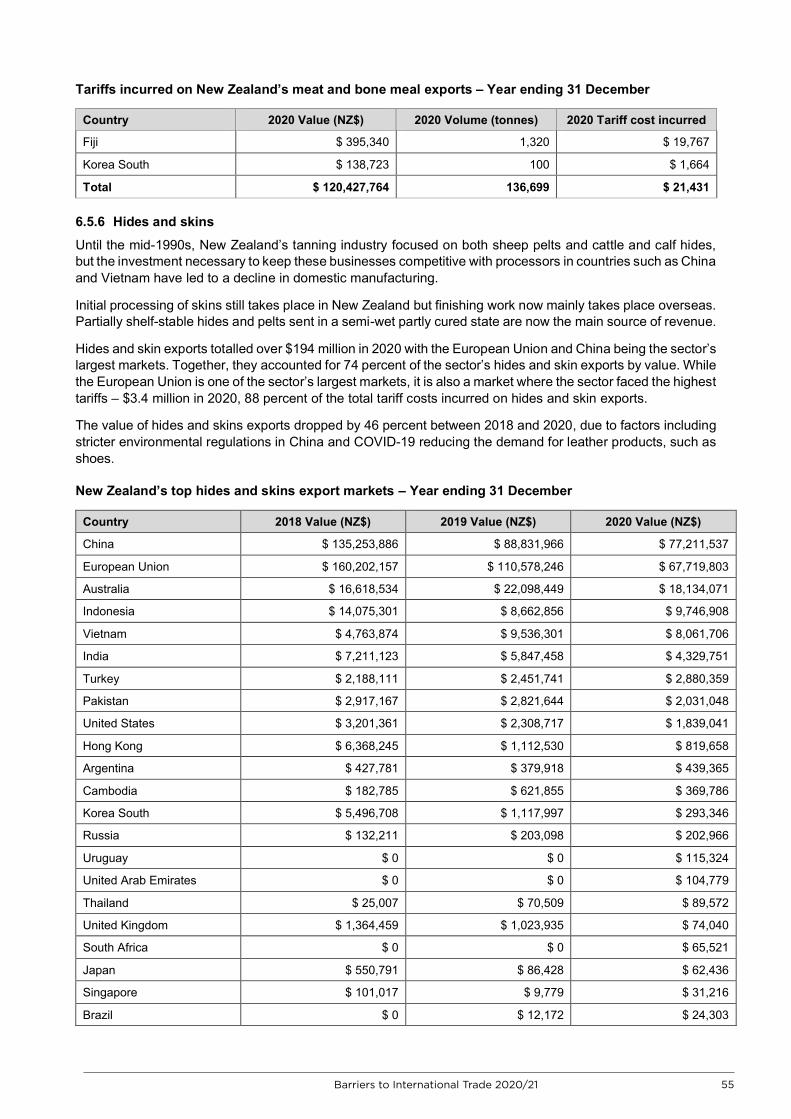
Barriers to International Trade 2020/21 55
Tariffs incurred on New Zealand’s meat and bone meal exports – Year ending 31 December
Country 2020 Value (NZ$) 2020 Volume (tonnes) 2020 Tariff cost incurred
Fiji $ 395,340 1,320 $ 19,767
Korea South $ 138,723 100 $ 1,664
Total $ 120,427,764 136,699 $ 21,431 6.5.6 Hides and skins
Until the mid-1990s, New Zealand’s tanning industry focused on both sheep pelts and cattle and calf hides, but the investment necessary to keep these businesses competitive with processors in countries such as China and Vietnam have led to a decline in domestic manufacturing.
Initial processing of skins still takes place in New Zealand but finishing work now mainly takes place overseas. Partially shelf-stable hides and pelts sent in a semi-wet partly cured state are now the main source of revenue.
Hides and skin exports totalled over $194 million in 2020 with the European Union and China being the sector’s largest markets. Together, they accounted for 74 percent of the sector’s hides and skin exports by value. While the European Union is one of the sector’s largest markets, it is also a market where the sector faced the highest tariffs – $3.4 million in 2020, 88 percent of the total tariff costs incurred on hides and skin exports.
The value of hides and skins exports dropped by 46 percent between 2018 and 2020, due to factors including stricter environmental regulations in China and COVID-19 reducing the demand for leather products, such as shoes.
New Zealand’s top hides and skins export markets – Year ending 31 December
Country 2018 Value (NZ$) 2019 Value (NZ$) 2020 Value (NZ$)
China $ 135,253,886 $ 88,831,966 $ 77,211,537
European Union $ 160,202,157 $ 110,578,246 $ 67,719,803
Australia $ 16,618,534 $ 22,098,449 $ 18,134,071
Indonesia $ 14,075,301 $ 8,662,856 $ 9,746,908
Vietnam $ 4,763,874 $ 9,536,301 $ 8,061,706
India $ 7,211,123 $ 5,847,458 $ 4,329,751
Turkey $ 2,188,111 $ 2,451,741 $ 2,880,359
Pakistan $ 2,917,167 $ 2,821,644 $ 2,031,048
United States $ 3,201,361 $ 2,308,717 $ 1,839,041
Hong Kong $ 6,368,245 $ 1,112,530 $ 819,658
Argentina $ 427,781 $ 379,918 $ 439,365
Cambodia $ 182,785 $ 621,855 $ 369,786
Korea South $ 5,496,708 $ 1,117,997 $ 293,346
Russia $ 132,211 $ 203,098 $ 202,966
Uruguay $ 0 $ 0 $ 115,324
United Arab Emirates $ 0 $ 0 $ 104,779
Thailand $ 25,007 $ 70,509 $ 89,572
United Kingdom $ 1,364,459 $ 1,023,935 $ 74,040
South Africa $ 0 $ 0 $ 65,521
Japan $ 550,791 $ 86,428 $ 62,436
Singapore $ 101,017 $ 9,779 $ 31,216
Brazil $ 0 $ 12,172 $ 24,303
55Barriers to International Trade 2020/21
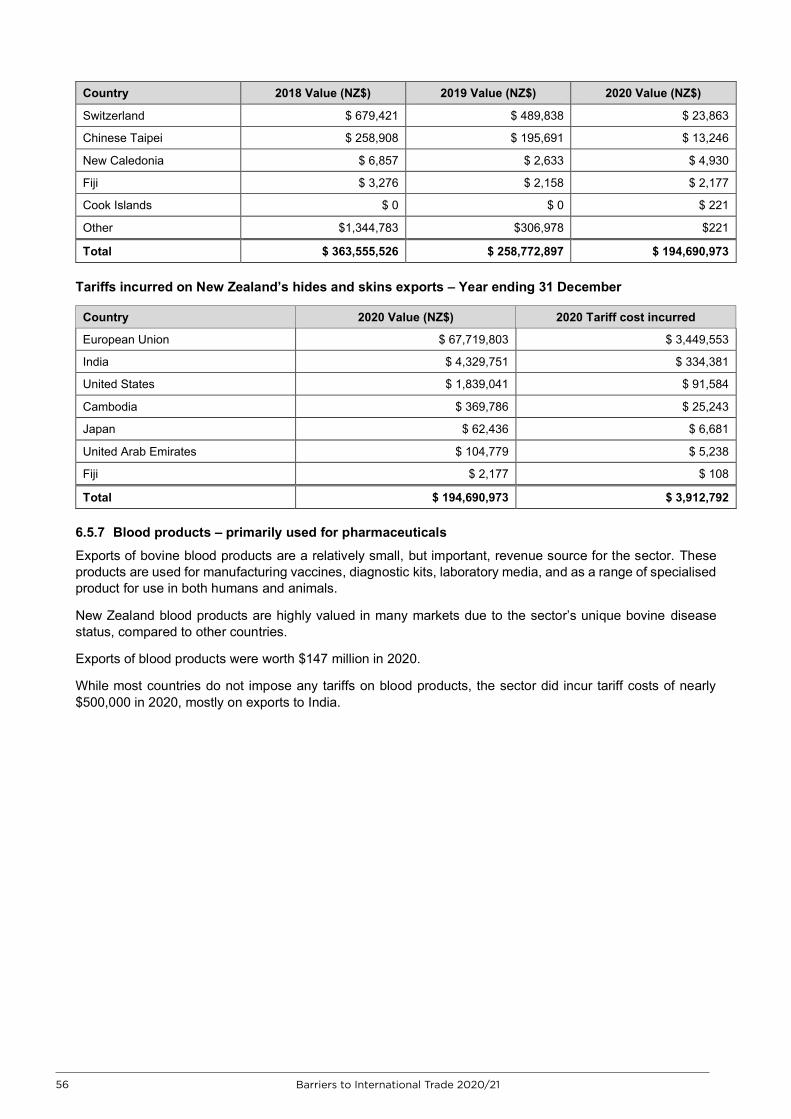
Barriers to International Trade 2020/21 56
Country 2018 Value (NZ$) 2019 Value (NZ$) 2020 Value (NZ$)
Switzerland $ 679,421 $ 489,838 $ 23,863
Chinese Taipei $ 258,908 $ 195,691 $ 13,246
New Caledonia $ 6,857 $ 2,633 $ 4,930
Fiji $ 3,276 $ 2,158 $ 2,177
Cook Islands $ 0 $ 0 $ 221
Other $1,344,783 $306,978 $221
Total $ 363,555,526 $ 258,772,897 $ 194,690,973
Tariffs incurred on New Zealand’s hides and skins exports – Year ending 31 December
Country 2020 Value (NZ$) 2020 Tariff cost incurred
European Union $ 67,719,803 $ 3,449,553
India $ 4,329,751 $ 334,381
United States $ 1,839,041 $ 91,584
Cambodia $ 369,786 $ 25,243
Japan $ 62,436 $ 6,681
United Arab Emirates $ 104,779 $ 5,238
Fiji $ 2,177 $ 108
Total $ 194,690,973 $ 3,912,792 6.5.7 Blood products – primarily used for pharmaceuticals
Exports of bovine blood products are a relatively small, but important, revenue source for the sector. These products are used for manufacturing vaccines, diagnostic kits, laboratory media, and as a range of specialised product for use in both humans and animals.
New Zealand blood products are highly valued in many markets due to the sector’s unique bovine disease status, compared to other countries.
Exports of blood products were worth $147 million in 2020.
While most countries do not impose any tariffs on blood products, the sector did incur tariff costs of nearly $500,000 in 2020, mostly on exports to India.
56 Barriers to International Trade 2020/21
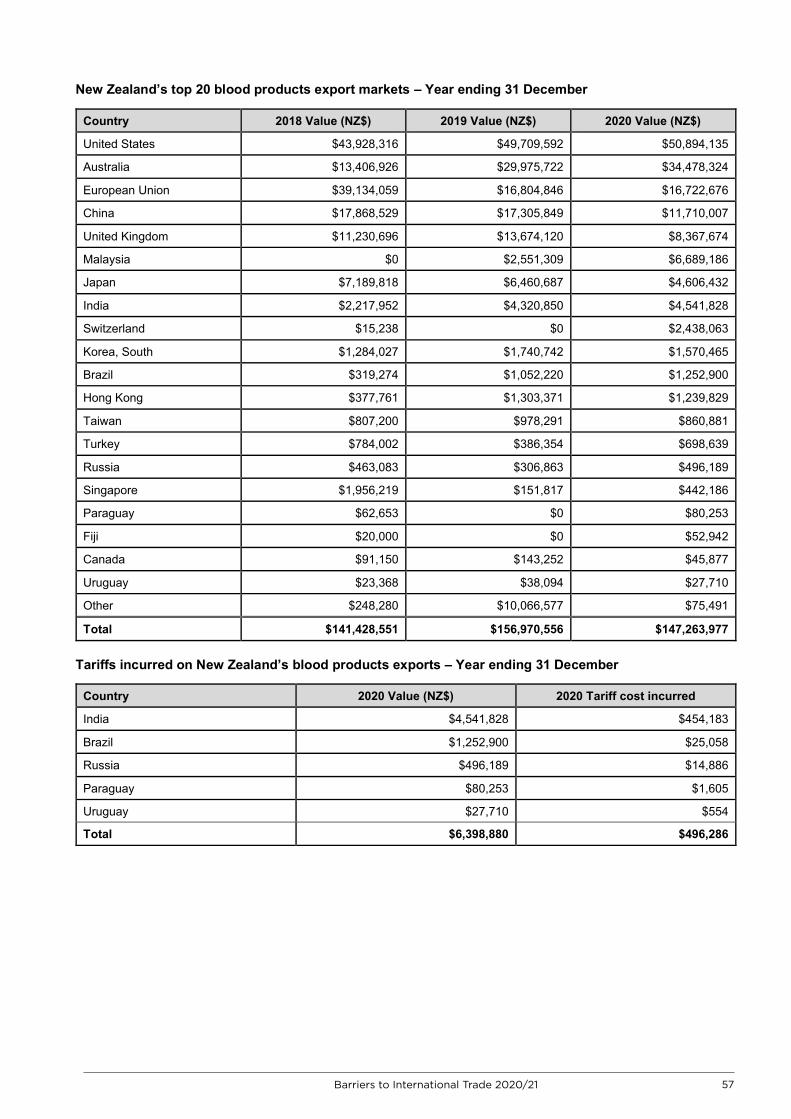
Barriers to International Trade 2020/21 57
New Zealand’s top 20 blood products export markets – Year ending 31 December
Country 2018 Value (NZ$) 2019 Value (NZ$) 2020 Value (NZ$)
United States $43,928,316 $49,709,592 $50,894,135
Australia $13,406,926 $29,975,722 $34,478,324
European Union $39,134,059 $16,804,846 $16,722,676
China $17,868,529 $17,305,849 $11,710,007
United Kingdom $11,230,696 $13,674,120 $8,367,674
Malaysia $0 $2,551,309 $6,689,186
Japan $7,189,818 $6,460,687 $4,606,432
India $2,217,952 $4,320,850 $4,541,828
Switzerland $15,238 $0 $2,438,063
Korea, South $1,284,027 $1,740,742 $1,570,465
Brazil $319,274 $1,052,220 $1,252,900
Hong Kong $377,761 $1,303,371 $1,239,829
Taiwan $807,200 $978,291 $860,881
Turkey $784,002 $386,354 $698,639
Russia $463,083 $306,863 $496,189
Singapore $1,956,219 $151,817 $442,186
Paraguay $62,653 $0 $80,253
Fiji $20,000 $0 $52,942
Canada $91,150 $143,252 $45,877
Uruguay $23,368 $38,094 $27,710
Other $248,280 $10,066,577 $75,491
Total $141,428,551 $156,970,556 $147,263,977 Tariffs incurred on New Zealand’s blood products exports – Year ending 31 December
Country 2020 Value (NZ$) 2020 Tariff cost incurred
India $4,541,828 $454,183
Brazil $1,252,900 $25,058
Russia $496,189 $14,886
Paraguay $80,253 $1,605
Uruguay $27,710 $554
Total $6,398,880 $496,286
57Barriers to International Trade 2020/21
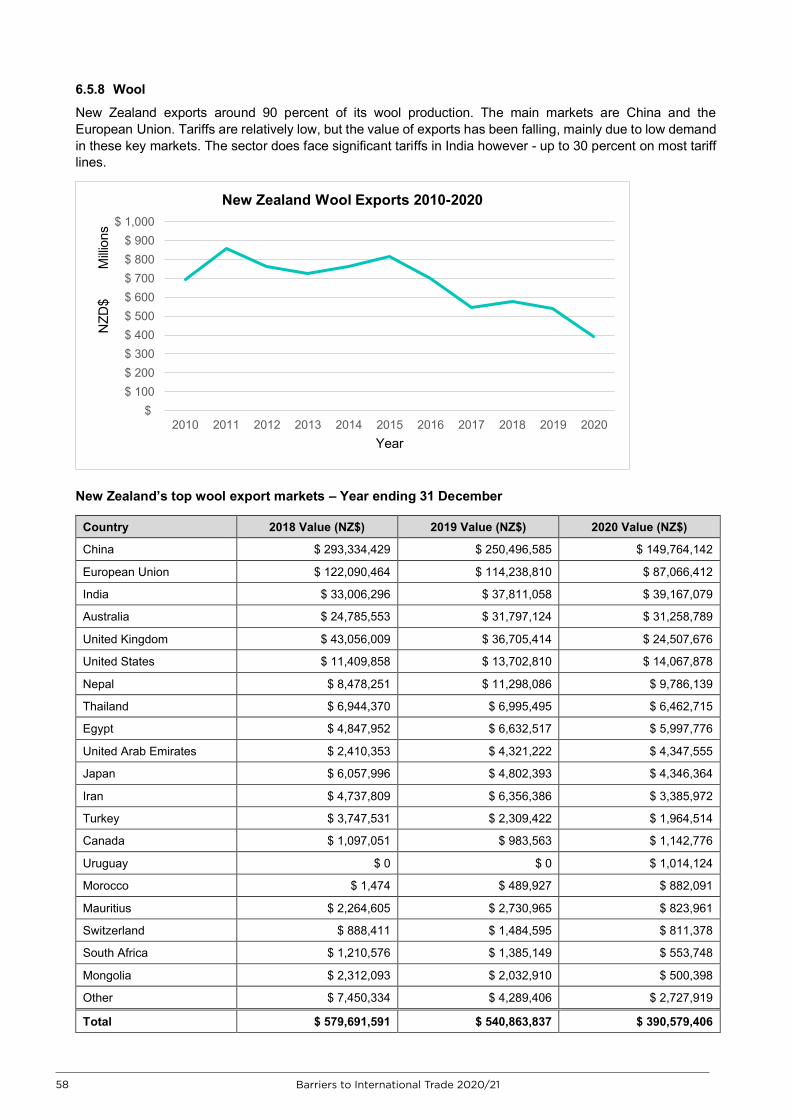
Barriers to International Trade 2020/21 58
6.5.8 Wool
New Zealand exports around 90 percent of its wool production. The main markets are China and the European Union. Tariffs are relatively low, but the value of exports has been falling, mainly due to low demand in these key markets. The sector does face significant tariffs in India however - up to 30 percent on most tariff lines.
New Zealand’s top wool export markets – Year ending 31 December
Country 2018 Value (NZ$) 2019 Value (NZ$) 2020 Value (NZ$)
China $ 293,334,429 $ 250,496,585 $ 149,764,142
European Union $ 122,090,464 $ 114,238,810 $ 87,066,412
India $ 33,006,296 $ 37,811,058 $ 39,167,079
Australia $ 24,785,553 $ 31,797,124 $ 31,258,789
United Kingdom $ 43,056,009 $ 36,705,414 $ 24,507,676
United States $ 11,409,858 $ 13,702,810 $ 14,067,878
Nepal $ 8,478,251 $ 11,298,086 $ 9,786,139
Thailand $ 6,944,370 $ 6,995,495 $ 6,462,715
Egypt $ 4,847,952 $ 6,632,517 $ 5,997,776
United Arab Emirates $ 2,410,353 $ 4,321,222 $ 4,347,555
Japan $ 6,057,996 $ 4,802,393 $ 4,346,364
Iran $ 4,737,809 $ 6,356,386 $ 3,385,972
Turkey $ 3,747,531 $ 2,309,422 $ 1,964,514
Canada $ 1,097,051 $ 983,563 $ 1,142,776
Uruguay $ 0 $ 0 $ 1,014,124
Morocco $ 1,474 $ 489,927 $ 882,091
Mauritius $ 2,264,605 $ 2,730,965 $ 823,961
Switzerland $ 888,411 $ 1,484,595 $ 811,378
South Africa $ 1,210,576 $ 1,385,149 $ 553,748
Mongolia $ 2,312,093 $ 2,032,910 $ 500,398
Other $ 7,450,334 $ 4,289,406 $ 2,727,919
Total $ 579,691,591 $ 540,863,837 $ 390,579,406
$$ 100$ 200$ 300$ 400$ 500$ 600$ 700$ 800$ 900
$ 1,000
2010 2011 2012 2013 2014 2015 2016 2017 2018 2019 2020
NZD
$M
illion
s
Year
New Zealand Wool Exports 2010-2020
58 Barriers to International Trade 2020/21
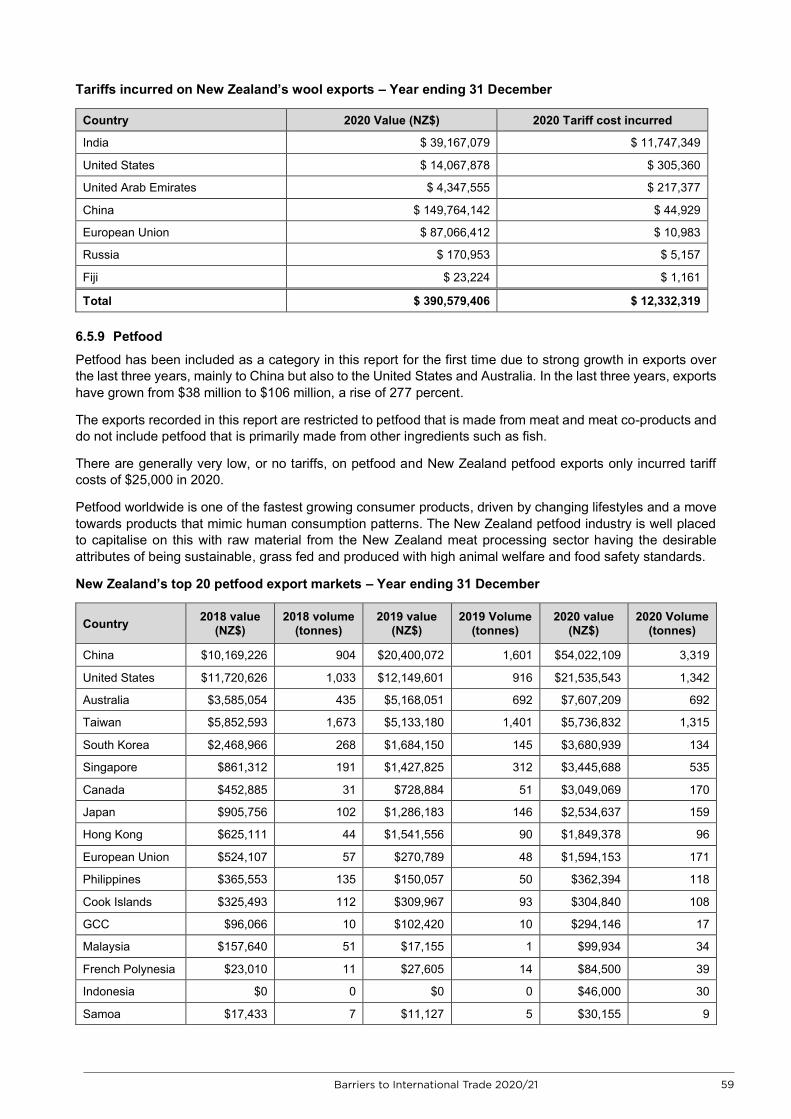
Barriers to International Trade 2020/21 59
Tariffs incurred on New Zealand’s wool exports – Year ending 31 December
Country 2020 Value (NZ$) 2020 Tariff cost incurred
India $ 39,167,079 $ 11,747,349
United States $ 14,067,878 $ 305,360
United Arab Emirates $ 4,347,555 $ 217,377
China $ 149,764,142 $ 44,929
European Union $ 87,066,412 $ 10,983
Russia $ 170,953 $ 5,157
Fiji $ 23,224 $ 1,161
Total $ 390,579,406 $ 12,332,319
6.5.9 Petfood
Petfood has been included as a category in this report for the first time due to strong growth in exports over the last three years, mainly to China but also to the United States and Australia. In the last three years, exports have grown from $38 million to $106 million, a rise of 277 percent.
The exports recorded in this report are restricted to petfood that is made from meat and meat co-products and do not include petfood that is primarily made from other ingredients such as fish.
There are generally very low, or no tariffs, on petfood and New Zealand petfood exports only incurred tariff costs of $25,000 in 2020.
Petfood worldwide is one of the fastest growing consumer products, driven by changing lifestyles and a move towards products that mimic human consumption patterns. The New Zealand petfood industry is well placed to capitalise on this with raw material from the New Zealand meat processing sector having the desirable attributes of being sustainable, grass fed and produced with high animal welfare and food safety standards.
New Zealand’s top 20 petfood export markets – Year ending 31 December
Country 2018 value (NZ$)
2018 volume (tonnes)
2019 value (NZ$)
2019 Volume (tonnes)
2020 value (NZ$)
2020 Volume (tonnes)
China $10,169,226 904 $20,400,072 1,601 $54,022,109 3,319
United States $11,720,626 1,033 $12,149,601 916 $21,535,543 1,342
Australia $3,585,054 435 $5,168,051 692 $7,607,209 692
Taiwan $5,852,593 1,673 $5,133,180 1,401 $5,736,832 1,315
South Korea $2,468,966 268 $1,684,150 145 $3,680,939 134
Singapore $861,312 191 $1,427,825 312 $3,445,688 535
Canada $452,885 31 $728,884 51 $3,049,069 170
Japan $905,756 102 $1,286,183 146 $2,534,637 159
Hong Kong $625,111 44 $1,541,556 90 $1,849,378 96
European Union $524,107 57 $270,789 48 $1,594,153 171
Philippines $365,553 135 $150,057 50 $362,394 118
Cook Islands $325,493 112 $309,967 93 $304,840 108
GCC $96,066 10 $102,420 10 $294,146 17
Malaysia $157,640 51 $17,155 1 $99,934 34
French Polynesia $23,010 11 $27,605 14 $84,500 39
Indonesia $0 0 $0 0 $46,000 30
Samoa $17,433 7 $11,127 5 $30,155 9
59Barriers to International Trade 2020/21
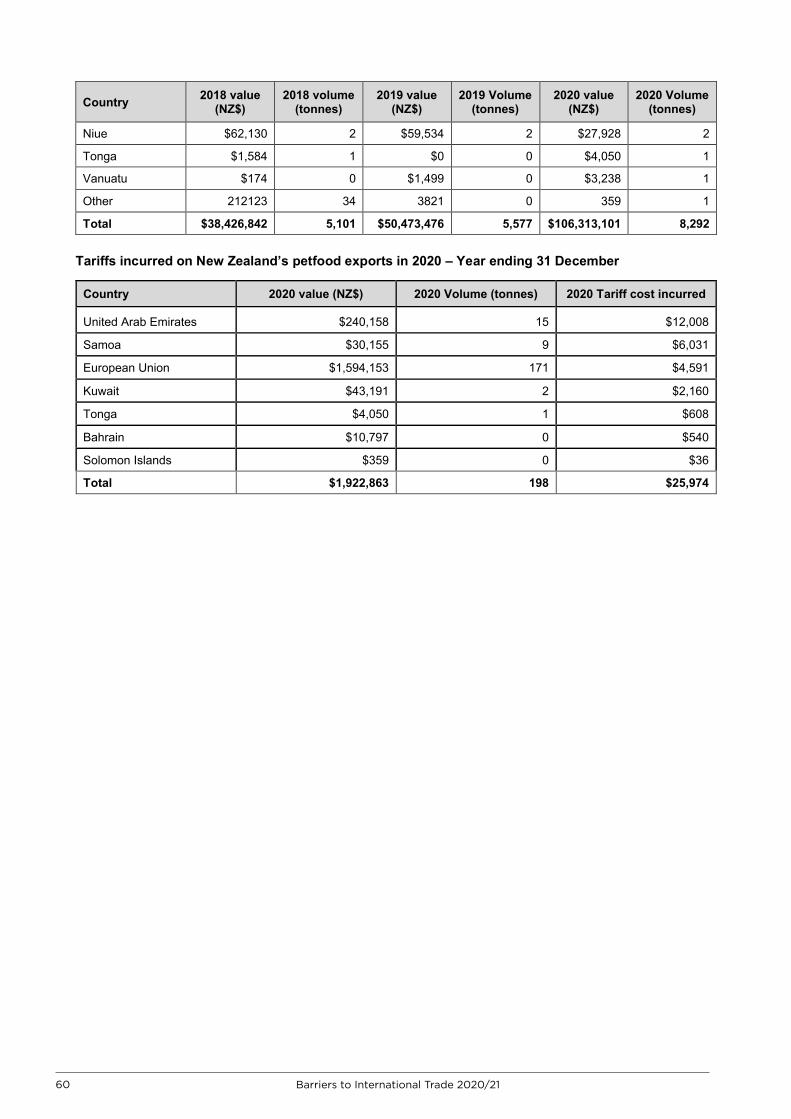
Barriers to International Trade 2020/21 60
Country 2018 value (NZ$)
2018 volume (tonnes)
2019 value (NZ$)
2019 Volume (tonnes)
2020 value (NZ$)
2020 Volume (tonnes)
Niue $62,130 2 $59,534 2 $27,928 2
Tonga $1,584 1 $0 0 $4,050 1
Vanuatu $174 0 $1,499 0 $3,238 1
Other 212123 34 3821 0 359 1
Total $38,426,842 5,101 $50,473,476 5,577 $106,313,101 8,292
Tariffs incurred on New Zealand’s petfood exports in 2020 – Year ending 31 December
Country 2020 value (NZ$) 2020 Volume (tonnes) 2020 Tariff cost incurred
United Arab Emirates $240,158 15 $12,008
Samoa $30,155 9 $6,031
European Union $1,594,153 171 $4,591
Kuwait $43,191 2 $2,160
Tonga $4,050 1 $608
Bahrain $10,797 0 $540
Solomon Islands $359 0 $36
Total $1,922,863 198 $25,974
60 Barriers to International Trade 2020/21