Embed Size (px)
Citation preview

Market Announcement
27 August 2020
NEW ZEALAND KING SALMON ANNOUNCES FY20 RESULTS
New Zealand King Salmon Investments Ltd (NZX & ASX: NZK) reports its financial results for the 12 months
ended 30 June 2020 (FY20) today.
The business delivered strong performance with operating EBITDA of $25.1 million, despite the challenges
of Covid-19 and a drop in harvest volume.
Key highlights include:
• Operating EBITDA of $25.1m, within guidance
• Sales volumes of 6,331mt, down 16% on FY19.
• Revenue of $155.3m, down 10% on FY19.
• Net profit of $18.0m, up 59% on FY19
• Strong pricing achieved of $24.54/kg, up 7% on FY19.
Chairman John Ryder said: “This has been one of the most challenging periods I have experienced in my
business career.
“I want to take this opportunity to thank the team members who have seen us through this difficult Covid-
19 period. They have all adapted to the challenges that have been thrown at them.
“In light of these pressures, we are proud to have achieved this result. Our strong performance was a
sound base as we entered lockdown in March.
“Much of our resilience during this period has been due to the support of our customers, partners,
suppliers, and shareholders – we are stronger together because of these relationships,” Mr Ryder added.
Managing Director and CEO Grant Rosewarne said: “Covid-19 has certainly tested our resilience with sales
revenue dropping by 50% during Level 4 lockdown, but I’m proud to say we have adapted to the crisis
and, with the aid of the Government’s wage subsidy, been able to keep all 550 team members employed.
“At the introduction of lockdown, our priority was the safety of our team members and to keep our
production going. With the support of Ministry for Primary Industries (MPI) we registered as an essential
service which enabled us to keep harvesting and selling our King salmon. Trading is currently around 20
per cent below pre-Covid levels but there are encouraging signs, particularly in the US, despite this key
market being hit so hard by the virus.
“I’d like to thank the Government for their leadership in re-establishing market access for exporters like
us to continue supplying our premium food and beverage to markets around the world. With around half
of our volume sent to international markets, consistent access to cargo routes is critical to business
sustainability.

Mr Rosewarne said: “Despite these challenging times the future of the industry and our company is bright
with the Government’s Aquaculture strategy recognising the opportunity for the industry to grow from
its current $625 million to $3 billion in 2035.
“Our Blue Endeavour application to farm in the Cook Strait, 7kms north of Cape Lambert, is progressing
well with a hearing expected by the end of the year. We expect the result of the application to be
confirmed by mid CY2021, and assuming a positive outcome, first harvest expected in Q4 of CY2023.
“If granted there will be a significant economic impact to the region eventually delivering 300 jobs to the
Top of the South.”
With the departure of our Chief Operating Officer, a decision has been made to split the role to allow
more focus on our aquaculture and processing operations respectively. We are pleased to announce the
internal promotion of Grant Lovell to the new role of General Manager Aquaculture, bringing over 20
years’ experience farming the King salmon species. Further announcements on our processing operations
will be made in due course.
Due to uncertainty caused by the impact of Covid-19, higher levels of inventory and ensuring prudent cash
availability, the Board has decided not to pay a final dividend in respect of the FY20 year. The payment of
dividends will be reviewed next year.
Ends
Contact: Grant Rosewarne
Managing Director and CEO, New Zealand King Salmon Investments Ltd.
Email: [email protected]
About New Zealand King Salmon
New Zealand King Salmon is the world’s largest producer of the premium King salmon species. We operate
under four key brands: Ora King, Regal, Southern Ocean and Omega Plus, and the New Zealand King
Salmon label. We have been growing and selling salmon to consumers for more than 30 years. Today we
employ over 500 people. New Zealand investors make up a significant percentage of the ownership of NZ
King Salmon, and the communities of Marlborough, Nelson and Tasman are well represented with around
400 of the approximately 2,800 shareholders being from the Top of the South.
More information can be found at www.kingsalmon.co.nz

A N N U A L R E S U L T S F Y 2 0

A N N U A L R E S U L T S F Y 2 0 2
H I G H L I G H T S
01
A N N U A L R E S U L T S F Y 2 0
114
136
160
173
155
G E O G R A P H I C S P R E A DO F R E V E N U E
FACTS AND FIGURES
37%3%
6%
44%
2%
$155.3R E V E N U E O F
M I L L I O N
7,336
M E T R I C T O N N E S H A R V E S T E D D U R I N G F Y 2 0
2%
P R O - F O R M A O P E R AT I N G E B I T D A
N Z $ m
N Z $ m
G A A P E B I T D A
3
6%
16.0
21.6
26.2 25.2 25.1
5
10
15
20
25
30
FY16 FY17 FY18 FY19 FY20
13.8
38.5
28.5
23.1
36.1
10
20
30
40
50
FY16 FY17 FY18 FY19 FY20
A N N U A L R E S U L T S F Y 2 0
FINANCIAL HIGHLIGHTS
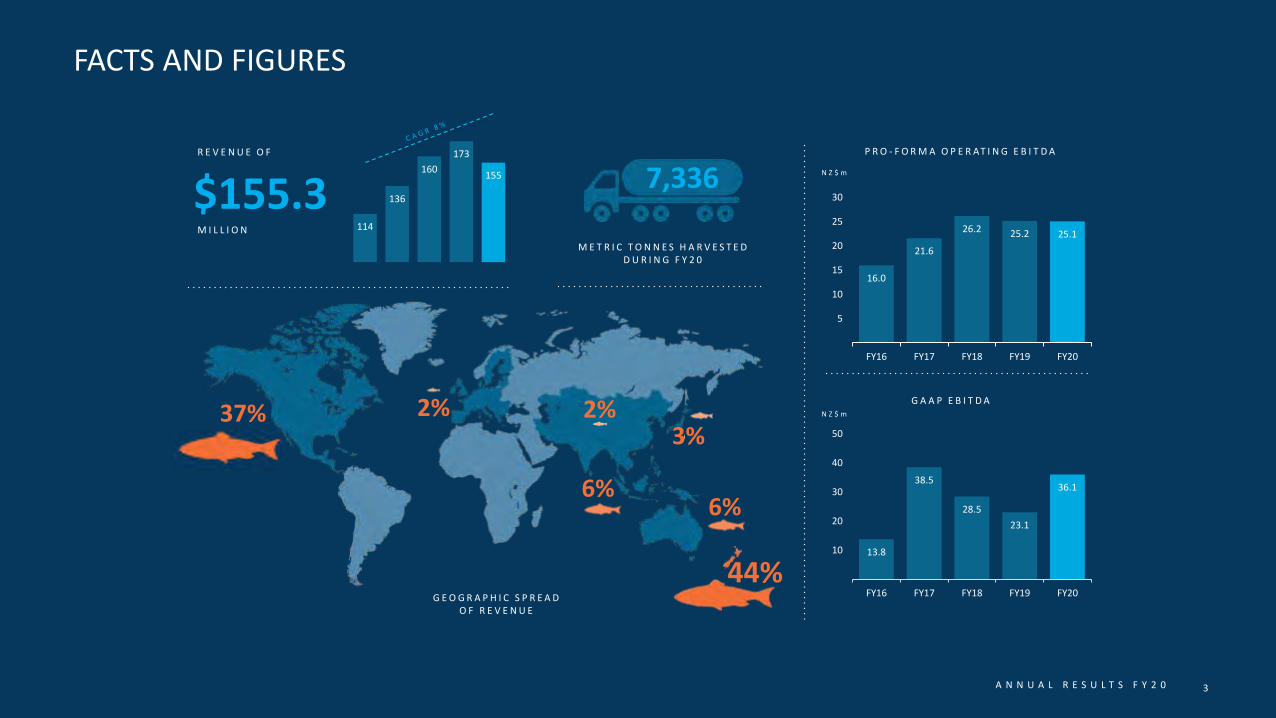
Good financial result, despite challenges posed by COVID-19 and disruptions to supply chains:
• Sales volumes of 6,331 tonnes, down 16% on FY19, sales dropped by 50% during lockdown but have now recovered to ~80% of prior year run rate by August.
• Revenue of $155.3m, down 10% on FY19.
• Achievement of strong pricing with average of $24.54/kg, up 7% on FY19.
• Solid Pro Forma Operating EBITDA of $25.1m*, in line with FY19 and within the FY20 earnings guidance range of $25.0m – 28.5m.
• COVID-19 Wage subsidy helped us to protect all jobs.
• GAAP NPAT of $18.0m, up 59% on FY19 due to an increase in biomass and average fish size as we slowed harvest.
Due to uncertainty caused by the impact of Covid-19, higher levels of inventory and ensuring prudent cash availability, the Board has decided not to pay a final dividend in respect of the FY20 year. The payment of dividends will be reviewed next year.
4
* A full reconciliation between GAAP and Pro Forma results is shown on slide 36 of this presentation.

A N N U A L R E S U L T S F Y 2 0
Strong sales price growth with volumes initially constrained by supply and sales later constrained by COVID-19.
Sales volume of 6,331 tonnes, down 15.8% on FY19:
• Sales volume was impacted by:
► Constrained 1H20 volume resulting from FY19 summer mortality and strong
demand.
► The COVID-19 pandemic during 2H20 which particularly impacted global
foodservice market.
► Disruptions to global supply chains which limited airfreight capacity and
increased cost for fresh export product.
Strong increase in sales prices, up in all key markets and ahead of FY19:
• Positive average price increases across all markets.
Successful implementation of the new Aquaculture model:
• Adoption of best possible biosecurity practices and fallowing between crops.
• Use of upwelling systems to improve environmental conditions.
• Targeted approach to fish husbandry reducing fish handling, eliminating towing,
and rotating and repairing fish nets more often.
We expect to refine this model over the coming years.
Regal smoked range grows international sales
• Now in over 600 stores in North America and with solid growth in SE Asia.
Omega Plus continues to gain traction in export markets
• FY20 saw a significant increase in revenue from sales of Omega Plus in China to
~$650k via online pet retailer Boqii.
OPERATING HIGHLIGHTS
5
* A glossary of terms is included on slide 38 of this presentation.
A N N U A L R E S U L T S F Y 2 0
HEALTH, SAFETY AND WELLNESSWe are uncompromising in our commitment to Health, Safety and Wellness
6
FY20 saw three incidents take place that required WorkSafe notification; in all cases detailed investigations have taken place and improvements
were implemented to prevent reoccurrence.
Key lagging Health, Safety and Wellness metrics for the period saw a pleasing improvement:
• Total Recordable Incident Frequency rate (TRIFR), an indicator of severity, was 207.2 compared to 248.4 for FY19.
• Lost Time Injury Frequency Rate (LTIFR) was 13.7, down from 28.1.
Our key leading Health, Safety and Wellness indicator, near miss reporting, decreased to 560 compared with 832 in FY19, with increasing reporting rates and frequency now
a key area of focus.
NZKS continues building an engaged and motivated workforce, and measures its levels of team member engagement through an annual engagement survey. Health, Safety
and Wellness continues to be our highest scoring area from the survey and that reflects our ongoing commitment to this area.

A N N U A L R E S U L T S F Y 2 0 7
S U STA I N A B I L I T Y
0202

A N N U A L R E S U L T S F Y 2 0 8
OPERATING SUSTAINABLY
New Zealand King Salmon’s mission is that every stakeholder is better off because we exist. We aim to improve the lives of our people, our
community and our stakeholders whilst minimising our long term footprint.
With a growing interest from customers, consumers, community and investors in our sustainable business practices, including our positive contribution to mitigating
climate change, our sustainability program becomes more important every year.
Our certification programme provides independent verification of our sustainable practices with regular assessments by expert third party organisations.

A N N U A L R E S U L T S F Y 2 0 9
OPERATING SUSTAINABLY
Our company continues to be assessed very positively for our farming and processing practices in independent third-party reviews.
• Renewal of our 4-star rating with the Global Aquaculture Alliance’s Best Aquaculture Practices (BAP) certification programme.
• First Aquaculture Stewardship Council (ASC) certification specific to our Clay Point farm.
• Renewal of the New Zealand King salmon industry’s Green/'Best Choice' rating from the globally respected Monterey Bay Seafood Watch programme
• Completion of a life cycle analysis research report to better understand our company’s carbon emissions. Due to the nutritional requirements of our unique King salmon
species and our decision to minimise marine protein in our King salmon diets, our carbon footprint falls at the higher end of aquaculture species, but remains a very
good choice when compared with proteins derived from land animals.
• Opportunities to reduce our carbon footprint align with operational goals to improve survival rates and feed conversion ratios, but incremental gains also possible in the
reduction of waste in packaging, consumables and energy usage.

A N N U A L R E S U L T S F Y 2 0
F I N A N C I A LOV E RV I E W
10
0303

A N N U A L R E S U L T S F Y 2 0
• Pricing is positive
• Sales volumes and market accessibility negatively impacted by COVID-19 in 2H20, with impact on Gross Margin (increased working / cost base).
• GAAP results are positively impacted by fair value gains due to slower harvest and larger fish.
SUMMARY FINANCIAL INFORMATION
* A full reconciliation between GAAP and Pro Forma results is shown on slide 36 of this presentation.
11
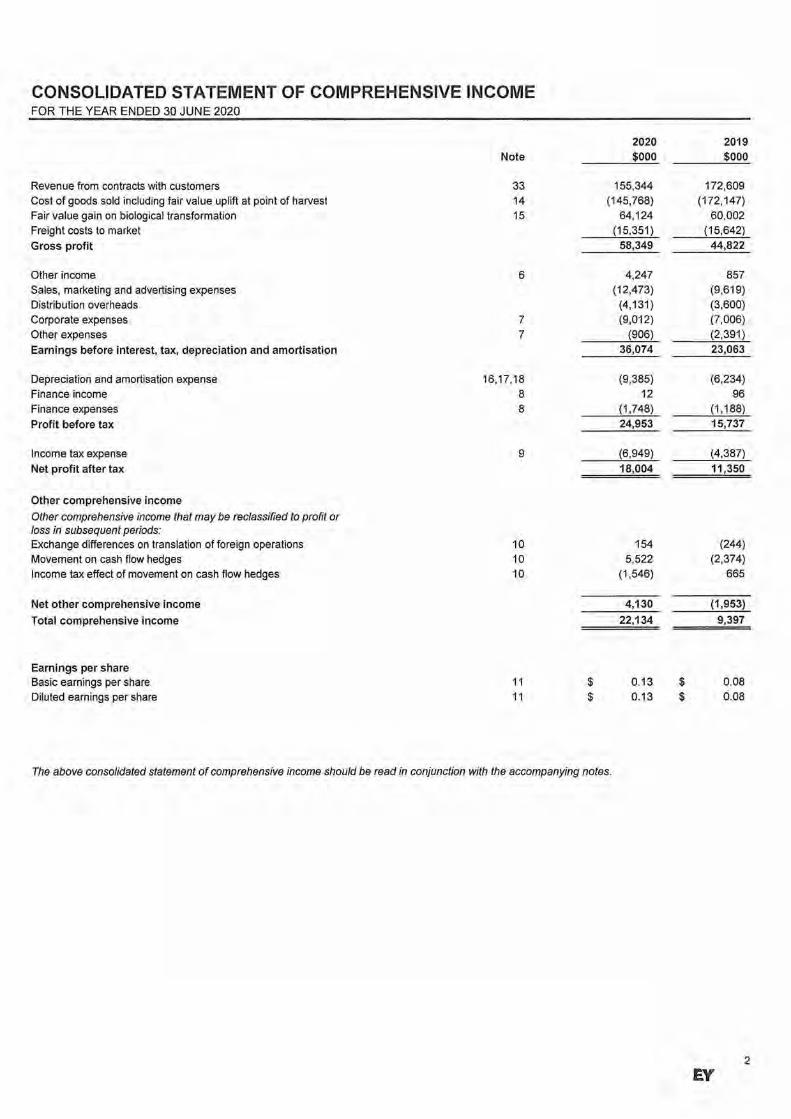
Group Financial Performance
Pro-Forma* Statutory
NZ$000s FY20 FY19 % chg. FY18 % chg. FY20 FY19 % chg.
Volume Sold (tonnes) 6,331 7,520 -16% 7,779 -19% 6,331 7,520 -16%
Revenue 155,344 172,609 -10% 160,271 -3% 155,344 172,609 -10%
Gross Margin 47,346 46,925 1% 47,499 -4% 58,349 44,822 30%
Gross Margin % 30% 27% 30% 38% 26%
EBITDA 25,071 25,166 0% 26,165 -4% 36,074 23,063 56%
EBITDA % 16% 15% 16% 23% 13%
EBIT 17,123 18,932 -10% 21,060 -19% 26,689 16,829 59%
NPAT 11,240 12,864 -13% 14,457 -22% 18,004 11,350 59%

A N N U A L R E S U L T S F Y 2 0
705
815
1,285
2,275
595
1,265
980 Ruakaka
Otanerau
Clay Point
Te Pangu
Waitata
Ngamahau
Kopaua
FY197,920 tonnes
480
2,100
2,200
1,030
1,520
Our aquaculture model means farms may be harvested in alternative years. Timing variances, fish performance and harvest management
programmes also give rise to individual farm production variances.
HARVEST BY FARM
12
* Based on FY20 harvest volumes, note that a further 6 tonnes was harvested from our hatcheries (11 tonnes for FY19).
FY207,330 tonnes

A N N U A L R E S U L T S F Y 2 0
New Zealand King Salmon maintains its strong financial position.
Our balance sheet is strong with debt increasing due to higher inventory levels.
• Net debt of ($31.0m).
► We consider our funding facilities have sufficient headroom on debt and covenants to manage
through temporary FY21 impact of higher inventory / debt.
• Inventories increase significantly to $35.6m due to:
► Slow down of sales during COVID-19.
► The need to harvest fish to ensure optimal fish health and grow-out, plus compliance with consented
feed discharge levels.
► Further inventory growth is forecasted for FY21 (until sales return to pre COVID levels).
• Property, Plant & Equipment increased by $8.6m, see slide 19 for details
• ‘Other’ non-current assets of $60.3m includes goodwill of $39.3m and increases due to increases in the
fair value of derivatives.
• ‘Other’ non-current liabilities of $21.5m reflects deferred tax on fair value gains.
BALANCE SHEET
13
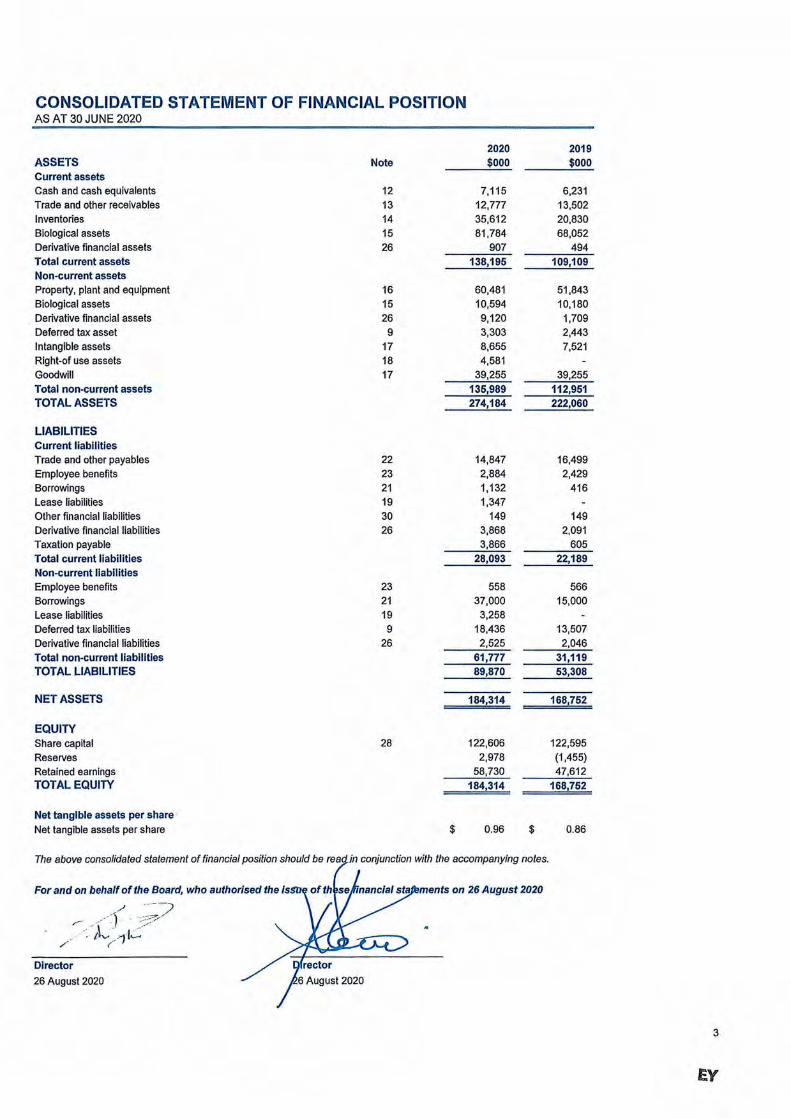
Group Financial Position
Jun-20 Jun-19
NZ$000s Audited Audited
Assets
Current Assets
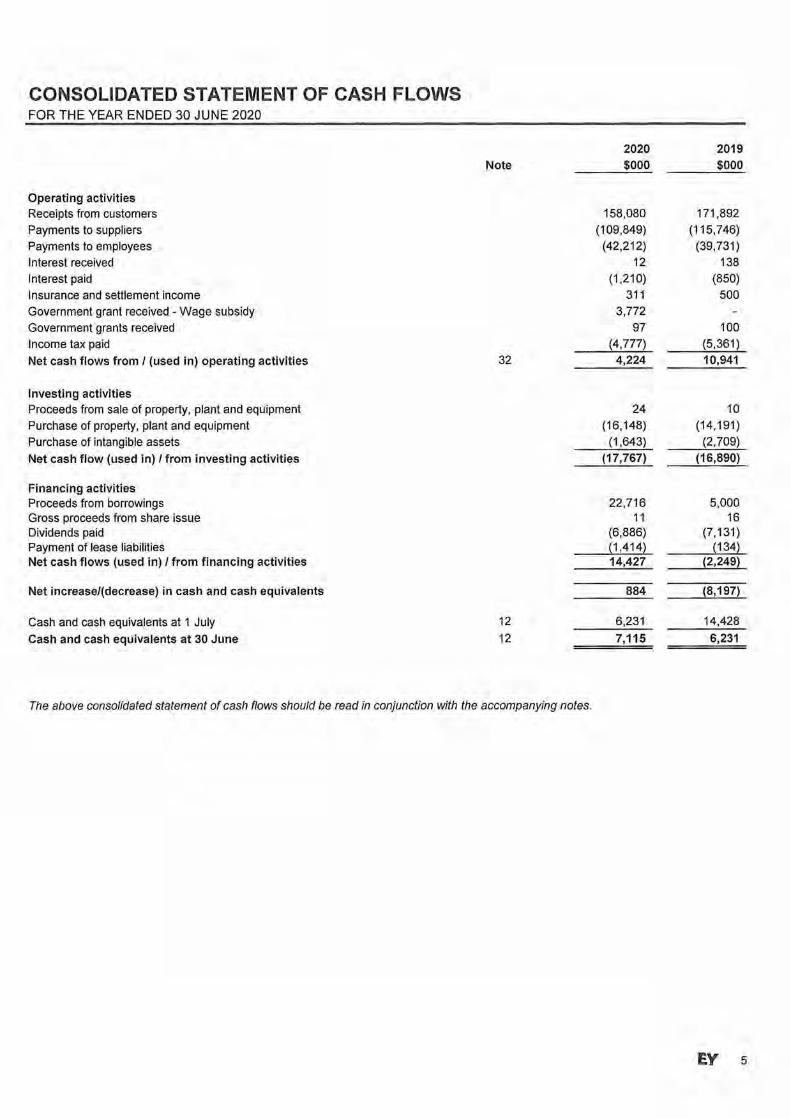
Cash and cash equivalents 7,115 6,231
Receivables 12,777 13,502
Inventories 35,612 20,830
Biological assets 81,784 68,052
Other 907 494
138,195 109,109
Non Current Assets
Property, plant and equipment 60,481 51,843
Right-of-use Assets 4,581 -
Biological assets 10,594 10,180
Other 60,333 50,928
135,989 112,951
Total Assets 274,184 222,060
Liabilities
Current liabilities
Loans (external) 1,132 416
Lease liabilities 1,347 -
Payables 14,847 16,499
Other 10,767 5,274
28,093 22,189
Non-current liabilities
Loans (external) 37,000 15,000
Lease liabilities 3,258 -
Other 21,519 16,119
61,777 31,119
Total Liabilities 89,870 53,308
Net Assets 184,314 168,752
Net Cash / (Debt) (31,017) (9,185)

A N N U A L R E S U L T S F Y 2 0
B U S I N ES SU P DAT E
14
0404

A N N U A L R E S U L T S F Y 2 0
This is our key initiative for FY20 and FY21 years, it targets the protection of fish health, improved survival rates and the adoption
of the best possible biosecurity practices. This year, we achieved:
• Upwelling systems installed on all farms to improve flow and provide cooler water from lower depths. The initiative also helped mitigate the effects of Algal blooms and
Jellyfish inclusion on nets.
• An increased focus on net cleaning and maintaining the best possible environmental conditions on farms.
• Reduced handling of stock, freeing up team member time for husbandry focus – all stock entered into their eventual harvest farm and no stock graded or pumped.
• A greater focus on feed management– especially during summer – with pleasing improvements seen from tide specific feeding regimes and altered feeding practices
during the warmest periods.
The farming of low flow sites continues to pose a challenge in terms of feed discharge and compliance with consent conditions as previously detailed in the MPI Salmon
Relocation Process.
Improvements seen to date are pleasing with further improvements to fish health and survival expected over the next 2-3 years as the model is refined.
NEW AQUACULTURE MODEL
15

A N N U A L R E S U L T S F Y 2 0
Future harvest volumes impacted by challenges with consenting and compliance
• FY21 harvest increases on previous guidance due to slowing of harvest in FY20.
• Slower increase than previous guidance due to:
FORECAST VOLUMES – FY21-FY23
16
Harvest Volumes (tonnes) *
► The delay of the permitted feed discharge increase at Waitata, with our application
for additional feed discharge and pens declined.
► The extended fallowing of the Forsyth farm due to challenges in compliance with
resource consent, as agreed with Marlborough District Council.
► Maximum volume from existing sites is forecast at 10,000 – 11,000 tonnes with this
down on previous guidance as environmental management of the Kopaua site is
proving more challenging than originally expected.
Guidance for future periods is dependent on respective summer fish performance
* Harvest volumes have been forecast based on utilisation of existing resource consents, historic performance and our new aquaculture model. They do not include any impact of farm relocation or open ocean initiatives.
7,931 7,336
~8,500 ~8,500~9,000
FY2019 FY2020 FY2021 FY2022 FY2023

A N N U A L R E S U L T S F Y 2 0
FUTURE FARMING – FARM RELOCATION
17
This slide provides an update on future farming volumes:
Farm relocation (MPI Salmon Relocation Process):
• The 2017 Hearing Panel recommendation to the Minister on which farms to relocate is unlikely to have any material impact on site capacity, however it may result in
modest fish performance improvements.
• A revised proposal from Iwi and NZKS was provided to MPI in June 2019, including use of the proposed site at Mid Waitata.
• Any potential production benefit from relocation would be achieved in FY24 or beyond due to process timing and existing production cycles.
• We support the relocation proposal concurrently with Blue Endeavour, as this ensures better production continuity.

A N N U A L R E S U L T S F Y 2 0
FUTURE FARMING – OPEN OCEAN
18
This slide provides an update on future farming volumes:
Open Ocean Farming - NZKS has applied for its first open ocean farming consent comprising two stages, in the Marlborough region:
• The project has been named “Blue Endeavour” representing a step towards the long term sustainability of the industry.
• NZKS is currently in the process of providing the Marlborough District Council (MDC) with additional information as requested, a pre hearing meeting is expected in Nov
/ Dec 2020 with any public hearings to follow in early 2021.
• The earliest possible harvest from the region would be in the 4th quarter of the 2023 calendar year.
• Capital costs for the infrastructure associated with Blue Endeavour are estimated at ~$35m with some ability for this spend to be staged.
• Our consent application is for up to 5,000 tonnes of harvest per annum, per stage.
• NZKS submitted on the fast track resource management bill to ensure Aquaculture could be part of this process. However we have chosen not to use the fast track
process as the Blue Endeavour application is already well advanced and ensures we continue to positively engage with current submitters and the community.

A N N U A L R E S U L T S F Y 2 0
CAPITAL EXPENDITURE
19
Additional capital investment has been made to build capacity and improve performance:
FY20 Capital expenditure was $17.8m, allowing NZKS to undertake the following key projects:
• Completion of the Thomas Song Barge, replacing temporary barging infrastructure and increasing long term capacity ($2.7m in FY20 of a total $4.9m investment).
• Investment in future farming projects: site relocation, open ocean monitoring and consenting ($1.0m).
• Investment in hatchery facilities to build resilience, decrease risk and increase capacity: first feeding and grading building ($2.0m in FY20 of a total $4.1m
investment).
• Processing automation, risk mitigation, health and food safety improvements including automated filleting, sprinkler install and bin wash ($2.8m)
• Implementation of new aquaculture model including: installation of additional pens, lighting, nets and upwelling pontoons ($3.2m)
Balance of capital expenditure relates to routine replacement of existing assets.

A N N U A L R E S U L T S F Y 2 0
CAPITAL EXPENDITURE – KEY PROJECTS (FY20)
20
Rendering of the Tentburn first feeding facility (first eggs transferred August, expected completion November 2020).
This facility is the first recirculation facility to be built for the commercial rearing of Salmon in New Zealand and will be used to grow our fry prior to transfer to outdoor raceways.
This facility reduces risk posed by variable (upstream)water quality, builds resilience and is expected to benefit fish performance in both freshwater and seawater.
Our latest barge the Thomas Song installed at our Waitata farm in October 2019.

A N N U A L R E S U L T S F Y 2 0
O P E R AT I O N A L U P DAT E
21
05

A N N U A L R E S U L T S F Y 2 0 22
SALES BY MONTHCOVID-19 had a significant impact on H2 sales
The impact of COVID-19 on 2H20 sales has been estimated at between 600 – 700 tonnes with this impact being felt across all markets.
• New Zealand foodservice was essentially shut down when NZ went to Level 4 lockdown on the 25th of March.
• Despite NZKS being listed as an essential service provider, disruptions to global supply chains meant that we were unable to fulfil all available orders.
• Where air freight was able to be secured for export customers it was significantly in excess of normal rates.
• The need to maintain our farming and processing operations through this period also saw NZKS incur an increased cost of working.
• By April the full global impact of COVID-19 was being felt restricting demand despite New Zealand being in a position to loosen lockdown restrictions.
Sales have continued to recover and are currently at ~80% of pre COVID-19 levels but with increased freight costs impacting margins.
JUL AUG SEP OCT NOV DEC JAN FEB MAR APR MAY JUN
Actual Sales
Forecast Sales

A N N U A L R E S U L T S F Y 2 0 23
STRONG PARTNERSHIPSOur strong brand partnerships and collaborative approach supported a prompt pivot into e-commerce and specialty retail to replace lost foodservice sales.
We featured on the ‘NZ special’ of Chef Massimo Buttora’s hugely successful Kitchen Quarantine IGTV/YouTube session.
A N N U A L R E S U L T S F Y 2 0 24
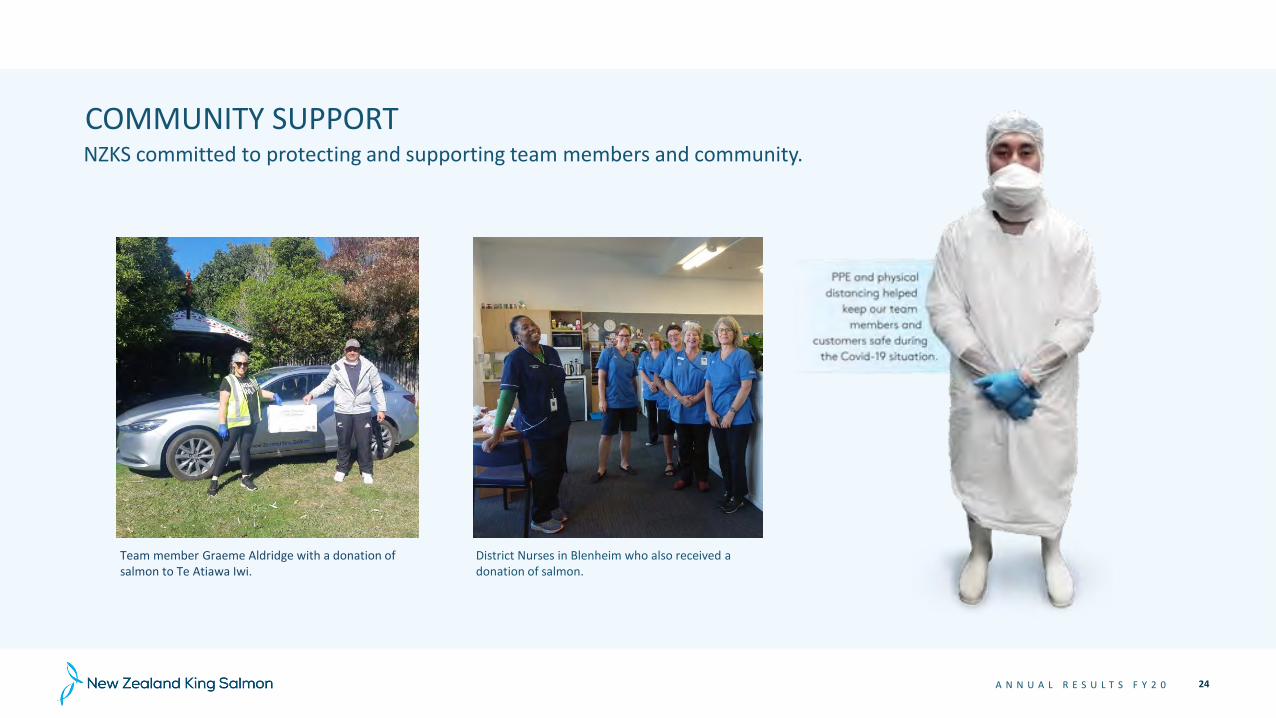
COMMUNITY SUPPORTNZKS committed to protecting and supporting team members and community.
Team member Graeme Aldridge with a donation of salmon to Te Atiawa Iwi.
District Nurses in Blenheim who also received a donation of salmon.

A N N U A L R E S U L T S F Y 2 0 25
SALES BY MARKET - EXPORT
Demand from North America remains strong despite challenges
We continue to deliberately target the North American market and are pleased to see the resilience shown in this market.
• Demand for King Salmon remains strong with NZKS looking to build on this momentum.
• The North American market accounts for 75% of all Ōra King sales (FY19 74%).
• Retail brands continue to develop well with Regal sales up five fold to ~120 tonnes.
• In Q4 of FY20 we successfully redeployed our North American sales team to focus on opportunities in the
ecommerce, specialty retail and business to consumer channels.
• We are looking to invest further in the profitable North American retail segment as this aligns with strategy but
also allows us to spread risk.
Sales to China decrease but market continues to show promise.
• FY20 Sales to China decreased by 16% on FY19, with significant challenges in this market since the January
announcement of the COVID-19 virus.
• We expect to encounter challenges with our targeted growth of this market over the next 12 months.
Continuing to target branded premium markets
North America (tonnes)
China (tonnes)
1,241
1,718
2,175 2,377 2,315
FY2016 FY2017 FY2018 FY2019 FY2020
2471
150 126
FY2016 FY2017 FY2018 FY2019 FY2020
A N N U A L R E S U L T S F Y 2 0 26
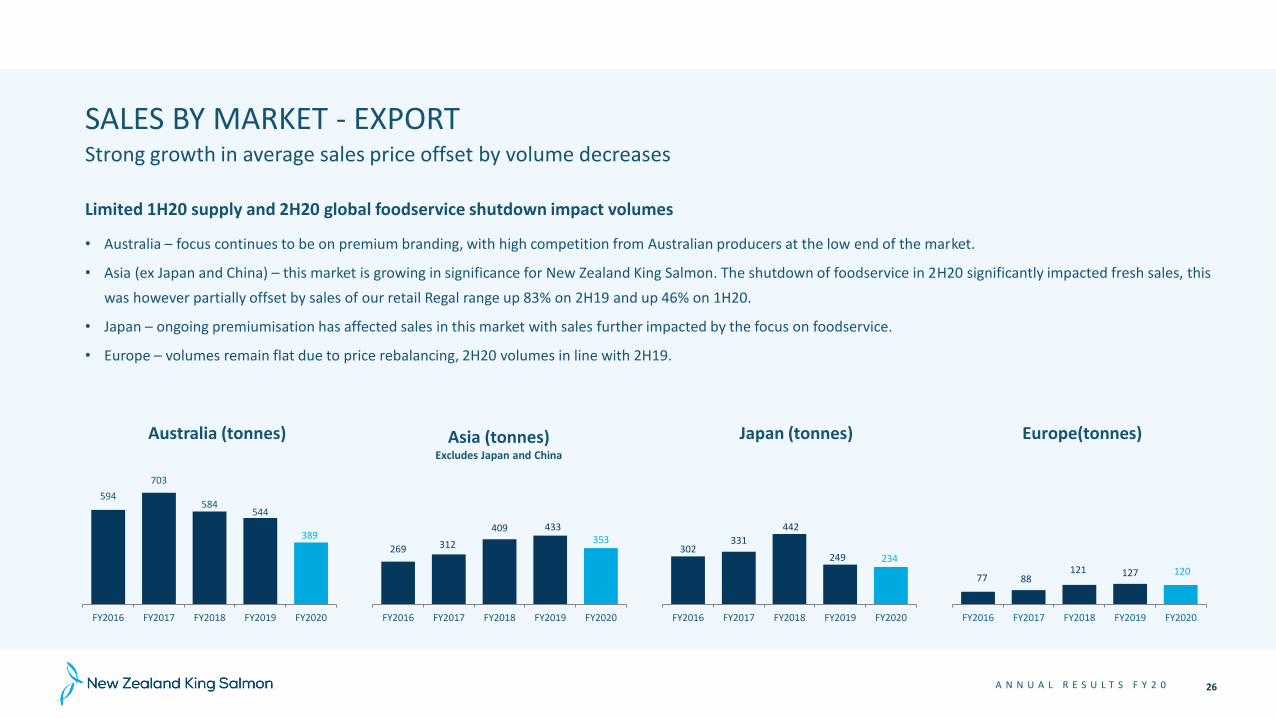
SALES BY MARKET - EXPORTStrong growth in average sales price offset by volume decreases
Limited 1H20 supply and 2H20 global foodservice shutdown impact volumes
• Australia – focus continues to be on premium branding, with high competition from Australian producers at the low end of the market.
• Asia (ex Japan and China) – this market is growing in significance for New Zealand King Salmon. The shutdown of foodservice in 2H20 significantly impacted fresh sales, this
was however partially offset by sales of our retail Regal range up 83% on 2H19 and up 46% on 1H20.
• Japan – ongoing premiumisation has affected sales in this market with sales further impacted by the focus on foodservice.
• Europe – volumes remain flat due to price rebalancing, 2H20 volumes in line with 2H19.
Australia (tonnes) Asia (tonnes)Excludes Japan and China
Japan (tonnes) Europe(tonnes)
594
703
584544
389
FY2016 FY2017 FY2018 FY2019 FY2020
269 312
409 433 353
FY2016 FY2017 FY2018 FY2019 FY2020
302 331
442
249 234
FY2016 FY2017 FY2018 FY2019 FY2020
77 88 121 127 120
FY2016 FY2017 FY2018 FY2019 FY2020
A N N U A L R E S U L T S F Y 2 0 27
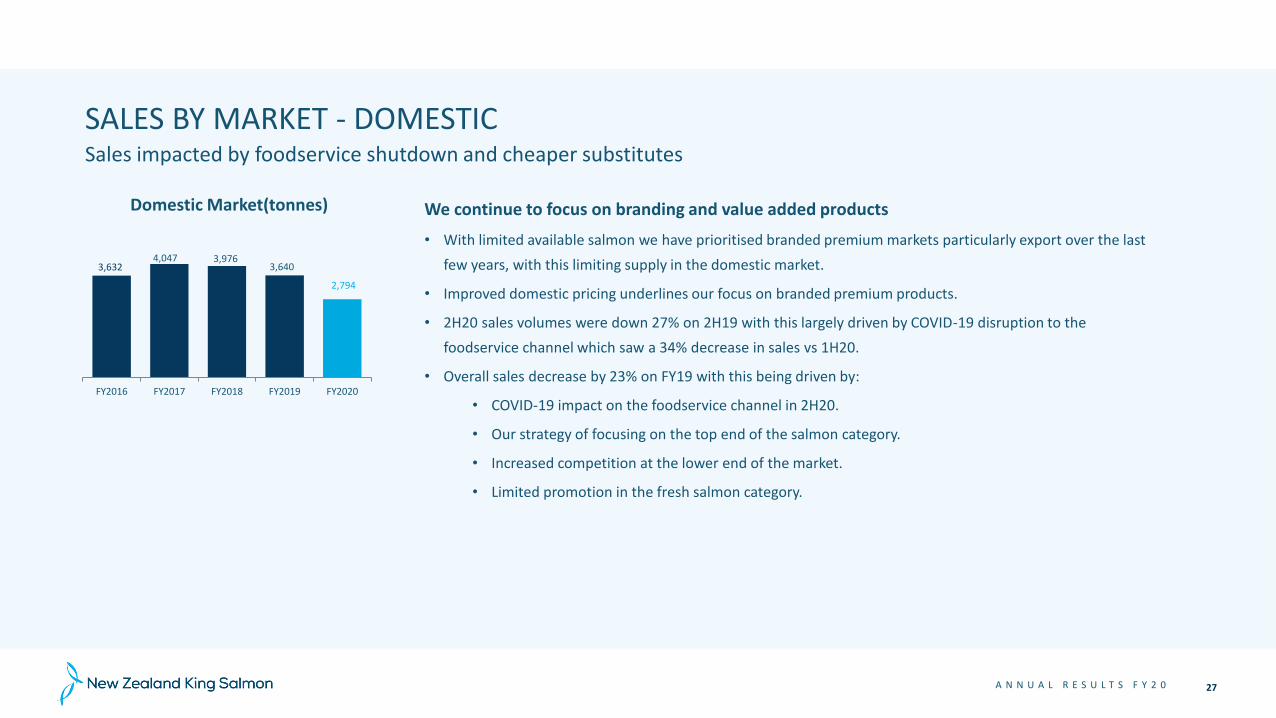
SALES BY MARKET - DOMESTIC
We continue to focus on branding and value added products
• With limited available salmon we have prioritised branded premium markets particularly export over the last
few years, with this limiting supply in the domestic market.
• Improved domestic pricing underlines our focus on branded premium products.
• 2H20 sales volumes were down 27% on 2H19 with this largely driven by COVID-19 disruption to the
foodservice channel which saw a 34% decrease in sales vs 1H20.
• Overall sales decrease by 23% on FY19 with this being driven by:
• COVID-19 impact on the foodservice channel in 2H20.
• Our strategy of focusing on the top end of the salmon category.
• Increased competition at the lower end of the market.
• Limited promotion in the fresh salmon category.
Sales impacted by foodservice shutdown and cheaper substitutes
Domestic Market(tonnes)
3,632 4,047 3,976
3,640
2,794
FY2016 FY2017 FY2018 FY2019 FY2020
A N N U A L R E S U L T S F Y 2 0 28
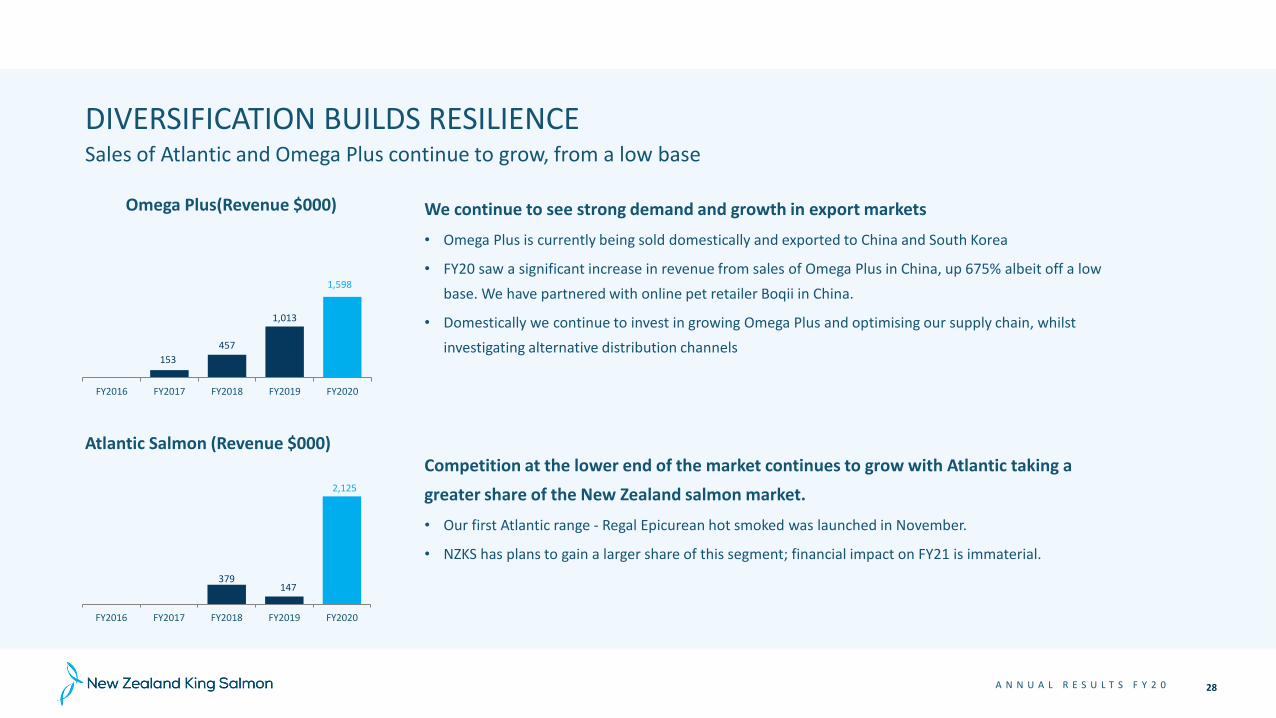
DIVERSIFICATION BUILDS RESILIENCE
We continue to see strong demand and growth in export markets
• Omega Plus is currently being sold domestically and exported to China and South Korea
• FY20 saw a significant increase in revenue from sales of Omega Plus in China, up 675% albeit off a low
base. We have partnered with online pet retailer Boqii in China.
• Domestically we continue to invest in growing Omega Plus and optimising our supply chain, whilst
investigating alternative distribution channels
Competition at the lower end of the market continues to grow with Atlantic taking a
greater share of the New Zealand salmon market.
• Our first Atlantic range - Regal Epicurean hot smoked was launched in November.
• NZKS has plans to gain a larger share of this segment; financial impact on FY21 is immaterial.
Sales of Atlantic and Omega Plus continue to grow, from a low base
Omega Plus(Revenue $000)
Atlantic Salmon (Revenue $000)
379 147
2,125
FY2016 FY2017 FY2018 FY2019 FY2020
153
457
1,013
1,598
FY2016 FY2017 FY2018 FY2019 FY2020

A N N U A L R E S U L T S F Y 2 0
AVERAGE SALE PRICES
Key markets experienced price growth with the optimisation of our product mix, and demand exceeding supply pre Covid-19.
Challenging current environment – core sales maintain pricing despite temporary decrease in demand due to foodservice disruptions.
Branding underpins ongoing improved value to our business
29
* Volume weighted average sales price for all exported salmon based on foreign exchange rates achieved as outlined on the table above.
Sales Prices and Exchange Rates
FY16 FY17 Fy18 FY19 FY20
Average Sales Price per KG
Domestic Sales NZD 17.97 18.77 20.22 22.11 24.91
Export Sales NZD 20.12 20.46 21.70 23.85 25.05
NZD:AUD 0.91 0.93 0.93 0.94 0.94
NZD:USD 0.68 0.69 0.69 0.68 0.66
NZD:JPY 77.5 77.1 75.6 71.3 68.3

A N N U A L R E S U L T S F Y 2 0 30
ŌRA KING SALES2H20 and full year impacted by COVID-19
Ōra King sales down 9% on FY19, a respectable result given the challenges posed by the disruption
to the foodservice industry globally.
Ōra King sales of 1H20 of 1,444 tonnes up 5% on 1H19 were followed by sales of 1,084 tonnes in 1H20 due to COVID-
19 disruption to foodservice channels and a lack of airfreight capacity.
This small decrease reflects:
• Continued demand from North America with 2H20 seeing demand in excess of the available cargo capacity.
• The resilience of the Ōra King brand in the face of the challenges in the wider global foodservice market in 2H20.
As an organisation we continue to focus on:
• Reaching the menus of more premium restaurants, via a combination of branding campaigns in key markets and
targeted sales activity.
• Re-establishing Ōra King sales and supporting key industry partners.
Ōra King Sales (tonnes)
1,689
2,149
2,706 2,772 2,528
FY2016 FY2017 FY2018 FY2019 FY2020

A N N U A L R E S U L T S F Y 2 0 31
FISH PERFORMANCE
Feed Conversion Ratio (FCR) continues to improve, to 1.76 in FY20
Key challenges:
• Harvest volume decreased as we faced the disruption of global foodservice markets due to COVID-19.
• Significant increase in closing livestock biomass, with harvest volumes set to increase in the next 6 months.
• Mortality as a % of biomass decreased from 23.2% to 15.0% (2018: 20.4%), with this also impacted by smolt entry timings.
• Feed cost decreased slightly with seawater feed now exclusively purchased from Australian feed suppliers.
Biological Performance
FY20 FY19 % chg. FY18 % chg.
Harvest Volume(tonnes) 7,336 7,931 -8% 8,018 -9%
Feed Conversion Ratio (FCR) 1.76 1.80 -2% 1.81 -2%
Mortality as a % of Biomass 15.0% 23.2% -35% 20.4% -26%
Closing Livestock Biomass 6,293 5,125 23% 5,391 17%
Feed Cost ($/Kg of feed) 2.48 2.50 -1% 2.22 12%

A N N U A L R E S U L T S F Y 2 0
O U T LO O K
32
06

A N N U A L R E S U L T S F Y 2 0
OUTLOOK
Expectations for FY21 and beyond
• COVID-19 continues to cause ongoing uncertainty in both the foodservice and retail sectors (many supermarkets are not currently considering new products).
• The current sales rate (August) is around 80% of pre COVID-19 levels and we anticipate continuing improvement. We are investing in additional sales resource
in key export markets to support recovery and growth, in both foodservice and new retail opportunities.
• Our species remains scarce and aspirational and our diversification strategy has proven its worth during COVID-19.
• Harvest for FY21 and FY22 is forecast at ~8,500 tonnes with the carry over of stock from FY20 and FY21 used to provide sales and value growth.
• FY20 capital expenditure is expected to be ~$10m, largely in line with depreciation, targeting key projects (including first feeding) and replacement rather
than growth.
• Water space initiatives remain key and we are hopeful of a decision on both our Blue Endeavour Open Ocean resource consent application and the MPI farm
relocation, within FY21.
• Given the uncertain global environment due to COVID-19 and usual summer fish performance uncertainty, providing any forward earnings guidance at this
stage is difficult. Taking these factors into account as well as higher freight costs, it may be challenging for FY21 EBITDA to exceed FY20. By FY22 we do
expect to again be moving towards demand exceeding supply, leading to improved earnings.
33

A N N U A L R E S U L T S F Y 2 0 34
A P P E N D I C ES
07

A N N U A L R E S U L T S F Y 2 0
UNDERSTANDING OUR GAAP RESULTS
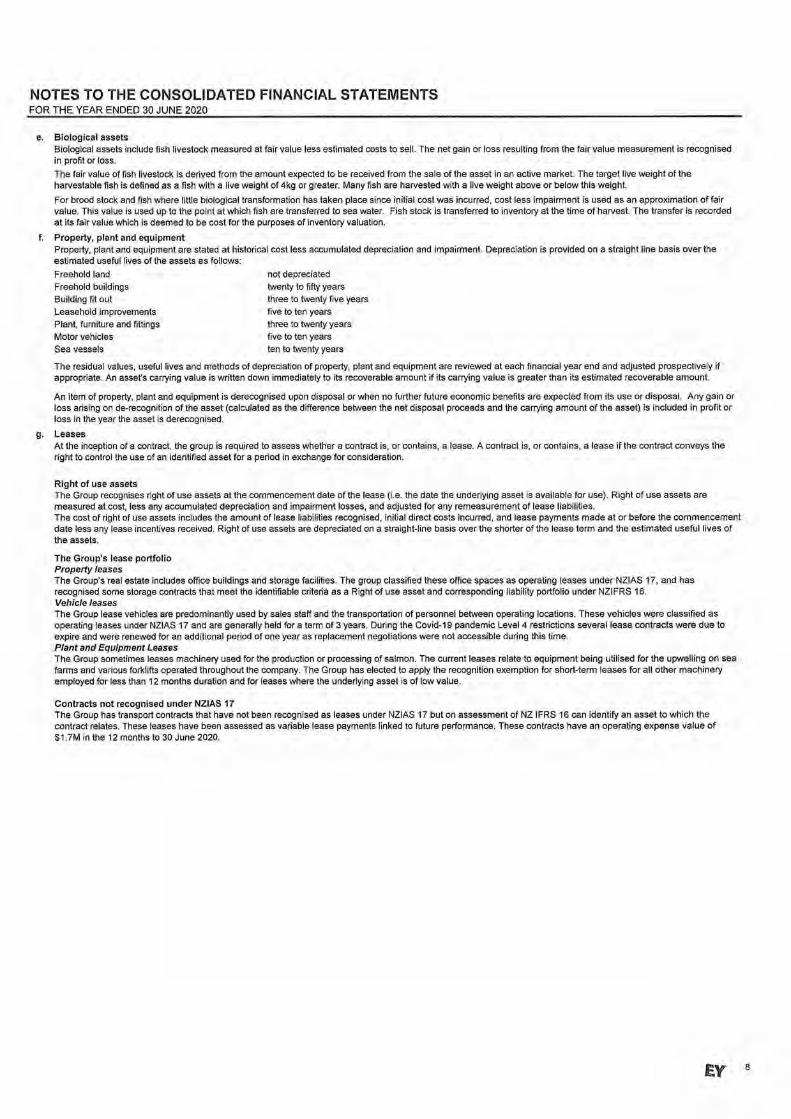
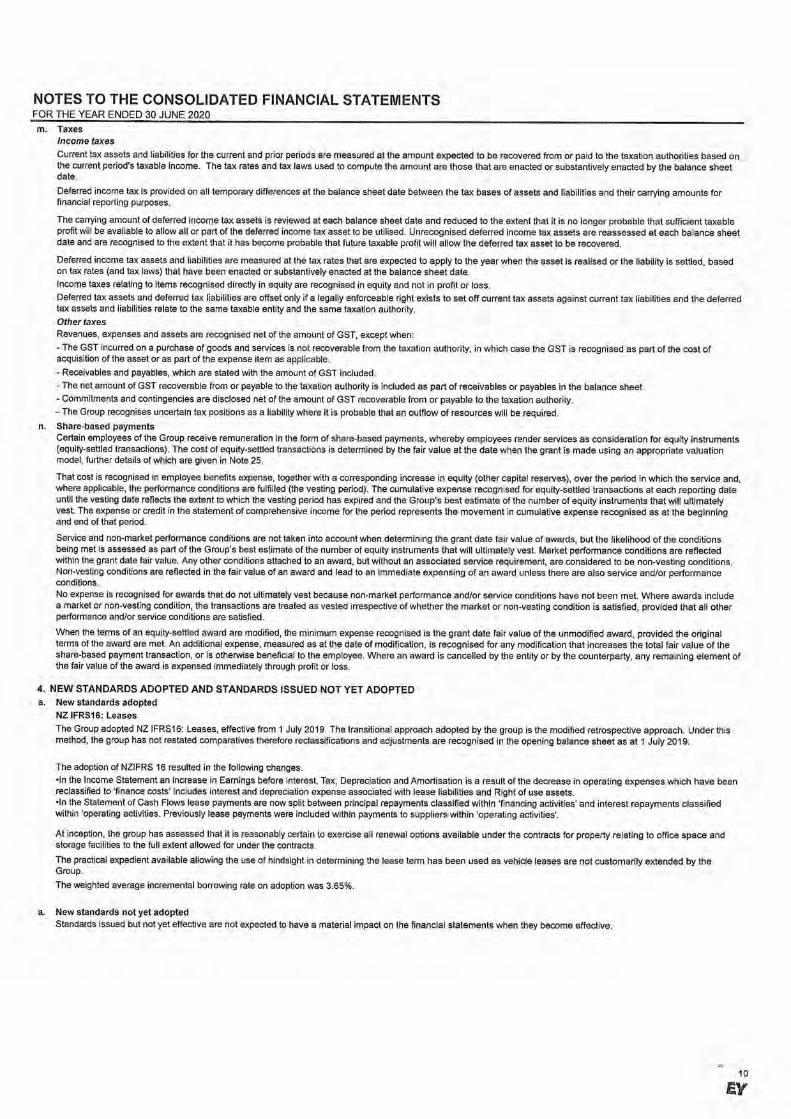
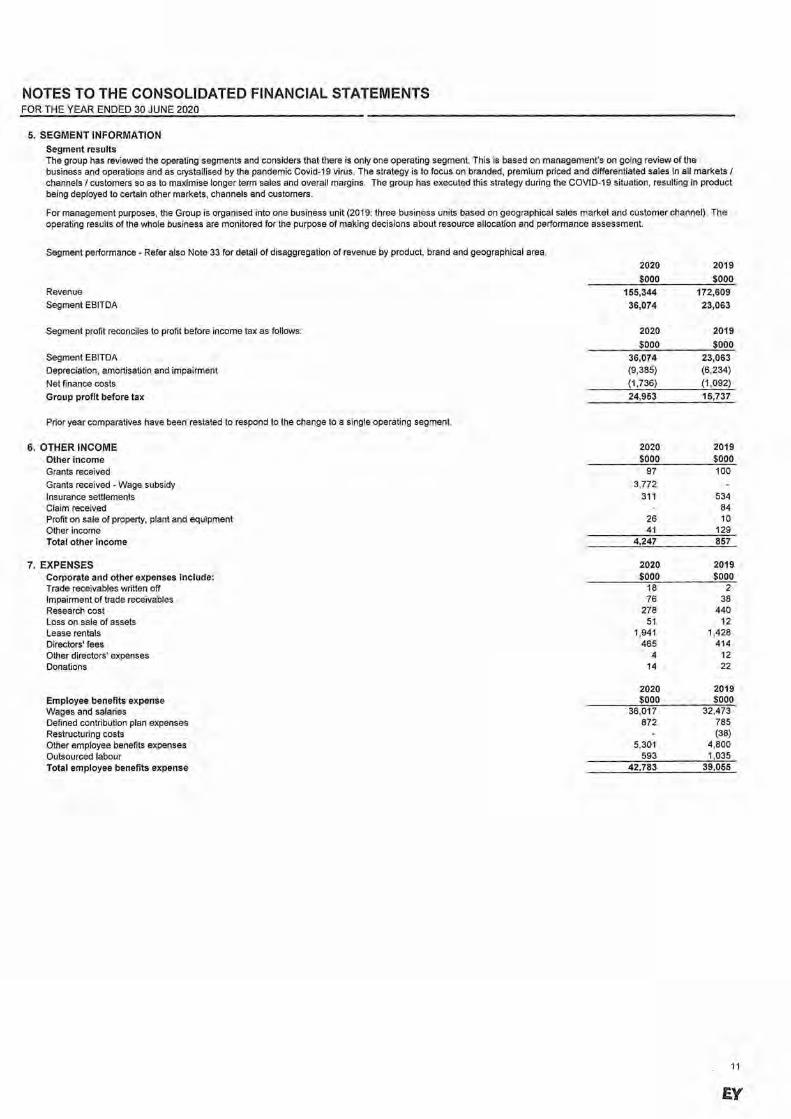
Our GAAP results are impacted by Fair Value gains arising from the application of NZ IAS-41 Agriculture, NZ IAS-2 Inventory and the classification
of leases under NZ IFRS-16 Leases. The impact of these standards are explained below:
Fair Value under NZ IAS-41 Fair Value and NZ IAS-2 Inventory
When we record a change in biomass at sea, or to the expected future profit on fish sales, these standards require us to quantify and recognise the gain in the current
period. This applies to both biomass at sea and inventories of finished products.
The fair value for FY20 has been positively impacted by the number of large fish on hand at balance date compared with the prior year as harvest has been slowed due to
the impacts of COVID-19. This resulted in a larger % of the total fair value being recognised, with this increase in fair value being partially offset by a increase in cost of
working and decrease in the margin per kg (and therefore expected future profits).
NZ IFRS-16 Leases
Under NZ IFRS-16 a lessee will no longer distinguish between finance and operating leases; all (material) leases will be treated as finance leases.
In the statement of financial position we are therefore required to recognise the asset (or right to use the asset) and the liability for the lease, while in the statement of
profit and loss we recognise the interest cost and the depreciation of the leased asset instead of the operating lease expenses. The application of this standard increases
EBITDA, assets and liabilities, however this impact is reversed in our Pro Forma results.
The impact of NZ IAS-41 Fair Value, NZ IAS-2 Inventory and NZ IFRS-16 Leases
35

A N N U A L R E S U L T S F Y 2 0
APPENDIX – FY20 RECONCILIATION BETWEEN GAAP RESULTS AND PRO FORMA FINANCIALS
36
FY20
NZD 000s
Statutory Financial Statements
NZ IAS-41 and NZ IAS-2 Fair Value Adjustments
NZ IFRS-16 Lease Adjustments
Pro Forma Operating Financial
Information
Revenue 155,344 155,344
Cost of goods sold (145,768) 54,705 (1,584) (92,647)
Fair value gain / (loss) on biological transformation 64,124 (64,124) (0)
Freight costs to market (15,351) (15,351)
Gross Profit 58,349 (9,419) (1,584) 47,346
Other operating income 4,247 4,247
Overheads
Sales, marketing and advertising (12,473) (12,473)
Distribution overheads (4,131) (4,131)
Corporate expenses (9,012) (9,012)
Other expenses (906) (906)
EBITDA 36,074 (9,419) (1,584) 25,071
Depreciation and amortisation (9,385) 1,437 (7,948)
EBIT 26,689 (9,419) (147) 17,123
Finance income 12 12
Finance costs (1,748) 171 (1,577)
Net finance costs (1,736) - 171 (1,565)
Profit / (loss) before Tax 24,953 (9,419) 24 15,558
Income tax (expense) / credit (6,949) 2,637 (7) (4,319)
Net Profit / (loss) for the Year 18,004 (6,782) 17 11,240

A N N U A L R E S U L T S F Y 2 0
APPENDIX – FY19 RECONCILIATION BETWEEN GAAP RESULTS AND PRO FORMA FINANCIALS
37
FY19
NZD 000s
Statutory Financial Statements
NZ IAS-41 and NZ IAS-2 Fair Value Adjustments
NZ-IFRS 16 Lease Adjustments
Pro Forma Operating Financial
Information
Revenue 172,609 172,609
Cost of goods sold (172,147) 62,105 (110,042)
Fair value gain / (loss) on biological transformation 60,002 (60,002) (0)
Freight costs to market (15,642) (15,642)
Gross Profit 44,822 2,103 46,925
Other operating income 857 857
Overheads
Sales, marketing and advertising (9,619) (9,619)
Distribution overheads (3,600) (3,600)
Corporate expenses (7,006) (7,006)
Other expenses (2,391) (2,391)
EBITDA 23,063 2,103 25,166
Depreciation and amortisation (6,234) (6,234)
EBIT 16,829 2,103 18,932
Finance income 96 96
Finance costs (1,188) (1,188)
Net finance costs (1,092) - (1,092)
Profit / (loss) before Tax 15,737 2,103 17,840
Income tax (expense) / credit (4,387) (589) (4,976)
Net Profit / (loss) for the Year 11,350 1,514 12,864

A N N U A L R E S U L T S F Y 2 0
APPENDIX – GLOSSARY OF TERMS
FY20 Financial results for the 2020 financial year covering the period 1 July 2019 to 30 June 2020
EBITDA Earnings before interest, tax, depreciation and amortisation
FCR Feed Conversion Ratio – the amount of feed (in kilograms) required to grow 1 kilogram of fish weight
G&G Gilled and gutted. Note that all volumetric information presented is on a gilled and gutted basis unless otherwise stated
GAAP Generally Accepted Accounting Practice
Mortality / Mortality RateThe percentage mortality of salmon in seawater, calculated as the biomass of salmon mortalities in kg divided by the growth of salmon in kg
NPAT Net profit after tax, also reported as net profit for the period in our published financial results
NZKS New Zealand King Salmon
Pro Forma Operating EBITDA
Pro Forma Operating EBITDA refers to earnings before interest, tax, depreciation, amortisation after allowing for pro forma adjustments as described in the Appendices to this document. Pro Forma Operating EBITDA is a non-GAAP profit measure
Upwelling System A system that allows dense cooler water to be moved towards the ocean surface, displacing the warmer water and increasing water flow.
38

A N N U A L R E S U L T S F Y 2 0 39
DISCLAIMER
The information in this presentation has been prepared by New Zealand King Salmon Investments Limited with due care and attention. However, neither New Zealand King Salmon Investments Limited
nor any of its directors, employees, shareholders nor any other person shall have any liability whatsoever to any person for any loss (including, without limitation, arising from any fault or negligence)
arising from this presentation or any information supplied in connection with it.
This presentation may contain projections or forward-looking statements regarding a variety of items. Such projections or forward-looking statements are based on current expectations, estimates and
assumptions and are subject to a number of risks, uncertainties and assumptions. There is no assurance that results contemplated in any projections and forward-looking statements in this presentation
will be realised. Actual results may differ materially from those projected in this presentation. No person is under any obligation to update this presentation at any time after its release to you or to
provide you with further information about New Zealand King Salmon Investments Limited.
Our results are reported under NZ IFRS. This presentation includes non-GAAP financial measures which are not prepared in accordance with NZ IFRS. The non-GAAP financial measures used in this
presentation include:
• EBITDA. We calculate EBITDA by adding back (or deducting) depreciation, amortisation, finance expense / (income), and taxation expense to net earnings / (loss) from continuing operations.
• EBIT. We calculate EBIT by adding back (or deducting) finance expense / (income), and taxation expense to net earnings / (loss) from continuing operations.
• Pro Forma Operating EBITDA refers to earnings before interest, tax, depreciation and amortisation after allowing for pro forma adjustments as described in the Appendix to this document.
We believe that these non-GAAP financial measures provide useful information to readers to assist in the understanding of our financial performance, financial position or returns, but that they should
not be viewed in isolation, nor considered as a substitute for measures reported in accordance with NZ IFRS. Non-GAAP financial measures may not be comparable to similarly titled amounts reported
by other companies.
Forward-looking statements are subject to any material adverse events, significant one-off expenses or other unforeseeable circumstances.
The information in this presentation is of a general nature and does not constitute financial product advice, investment advice or any recommendation. Nothing in this presentation constitutes legal,
financial, tax or other advice.
A N N U A L R E S U L T S F Y 2 0


Results announcement (for Equity Security issuer/Equity and Debt Security issuer)
93 Beatty Street, Tahunanui, Nelson 7011, New Zealand +64 3 548 5714 [email protected] www.kingsalmon.co.nz
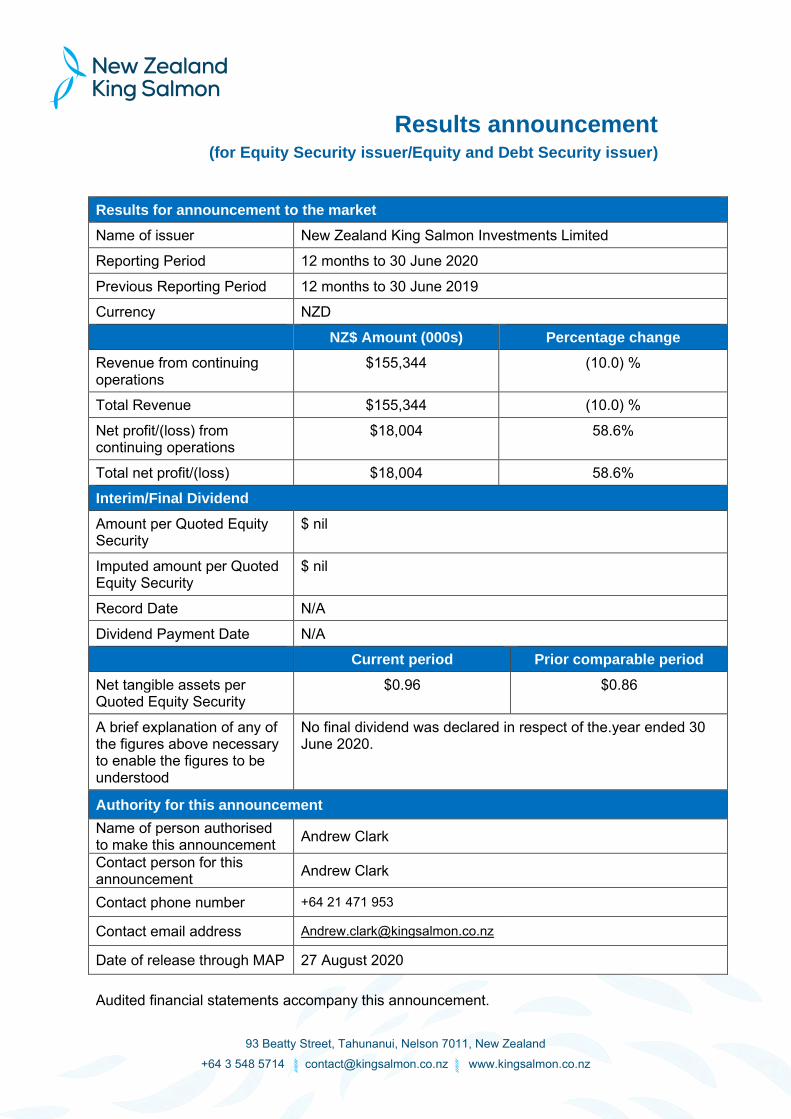
Results for announcement to the market
Name of issuer New Zealand King Salmon Investments Limited
Reporting Period 12 months to 30 June 2020
Previous Reporting Period 12 months to 30 June 2019
Currency NZD
NZ$ Amount (000s) Percentage change
Revenue from continuing operations
$155,344 (10.0) %
Total Revenue $155,344 (10.0) %
Net profit/(loss) from continuing operations
$18,004 58.6%
Total net profit/(loss) $18,004 58.6%
Interim/Final Dividend
Amount per Quoted Equity Security
$ nil
Imputed amount per Quoted Equity Security
$ nil
Record Date N/A
Dividend Payment Date N/A
Current period Prior comparable period
Net tangible assets per Quoted Equity Security
$0.96 $0.86
A brief explanation of any of the figures above necessary to enable the figures to be understood
No final dividend was declared in respect of the.year ended 30 June 2020.
Authority for this announcement
Name of person authorised to make this announcement Andrew Clark
Contact person for this announcement Andrew Clark
Contact phone number +64 21 471 953
Contact email address [email protected]
Date of release through MAP 27 August 2020
Audited financial statements accompany this announcement.