Embed Size (px)
Citation preview
iFAB 2013 F&B INDUSTRY OVERVIEW January 2014 v1.00e
iFAB 2013

The Food and Beverage Information Project The Food & Beverage Information Project is the first comprehensive overview of the state of New Zealand’s Food & Beverage (F&B) industry. Part of the Government’s Business Growth Agenda (BGA), it is an integrated programme of work focusing on the six key inputs businesses need to succeed, grow and add jobs; export markets, capital markets, innovation, skilled and safe workplaces, natural resources and infrastructure. Essentially, the BGA Export Markets goal will require lifting the ratio of exports from today’s rate of 30% of GDP to 40% by 2025. This equates to doubling exports in real terms (or tripling exports in nominal non-inflation adjusted terms). This in turn equates to achieving a 7% per annum growth rate over the next twelve years. This five-year project analyses the main sectors in F&B, including dairy, meat, seafood, produce, processed foods, and beverages, as well as providing an overview of how the industry is fairing in our major markets. It also conducts in-depth sector reviews on a rotating basis. The information is updated annually and feedback from users shows the project is acting as a vital tool for companies looking to expand and grow exports. Why Food & Beverage? The Food & Beverage industry is vitally important to the New Zealand economy. Food & Beverage accounts for 56% of our merchandise trade exports and one in five jobs across the wider value chain. In addition, F&B acts as a vital ambassador for the country, being in most cases the first exposure global consumers get to “Brand New Zealand.” New Zealand’s F&B exports are growing strongly and the country’s export performance is strong and improving relative to peers. In the 15 years leading up to 2010, New Zealand's food and beverage exports grew at a compound annual rate of 7% per annum. So one way to look at the challenge is to ask – can we continue to grow our food & beverage exports at the same rate? To understand if this is possible we need to know what has been driving our success.
What is the purpose of the food and beverage information project? The project pulls together the available information on the food and beverage industry into one place, in a form which is familiar and useful to business. The reports contain analysis and interpretation of trends and opportunities to materially assist with business strategy and government policy. The information will be of vital use to businesses, investors, government, and research institutions as the industry expands and diversifies. This industry view will be very useful to government, enabling better dialogue and the opportunity to address issues collectively. What benefit will this bring to businesses? The Project will have many uses for businesses. These include:
– As a base of market intelligence to enable business to be much more targeted in their own market research
– Reviewing and informing offshore market development (including export and investment) strategies
– Assisting in identifying areas of innovation and R&D for the future
– Identifying strategic partners and collaborators – Enabling a company to benchmark performance with that
of its competitors – Monitoring industry activity – Gaining a better understanding of their own industry
sector – Identifying internal capability needs or external inputs
How will government use the reports? This information will provide much greater insight into the industry, which is useful for a range of policy development, from regulatory frameworks to investment in science and skills and facilitating access to international markets. In particular, a single source of factual information will enable government agencies to better coordinate their efforts across the system and be more responsive to addressing industry issues.
iFAB 2013
2

IFAB 2013 OTHER RELATED iFAB REPORTS
3
This industry overview forms a part of the wider Food & Beverage Information Project
Other reports, including those from previous years, are available on the MBIE or Coriolis website…
http://www.med.govt.nz/sectors-industries/food-beverage/information-project/ http://www.coriolisresearch.com/reports/
iFAB 2013
IFAB 2013
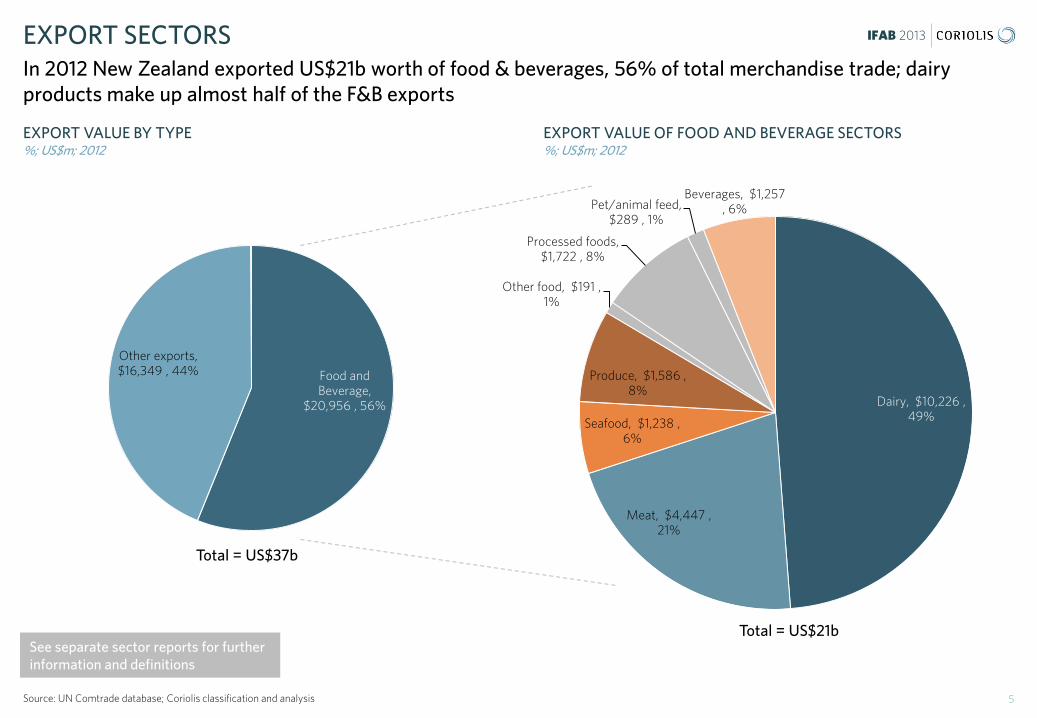
EXPORT VALUE BY TYPE %; US$m; 2012
EXPORT SECTORS In 2012 New Zealand exported US$21b worth of food & beverages, 56% of total merchandise trade; dairy products make up almost half of the F&B exports
5 Source: UN Comtrade database; Coriolis classification and analysis
EXPORT VALUE OF FOOD AND BEVERAGE SECTORS %; US$m; 2012
Dairy, $10,226 , 49%
Meat, $4,447 , 21%
Seafood, $1,238 , 6%
Produce, $1,586 , 8%
Other food, $191 , 1%
Processed foods, $1,722 , 8%
Pet/animal feed, $289 , 1%
Beverages, $1,257 , 6%
Total = US$21b
Food and Beverage,
$20,956 , 56%
Other exports, $16,349 , 44%
Total = US$37b
See separate sector reports for further information and definitions
IFAB 2013
ANNUAL CHANGE IN EXPORT VALUE BY TYPE US$m; 2012 vs. 2011
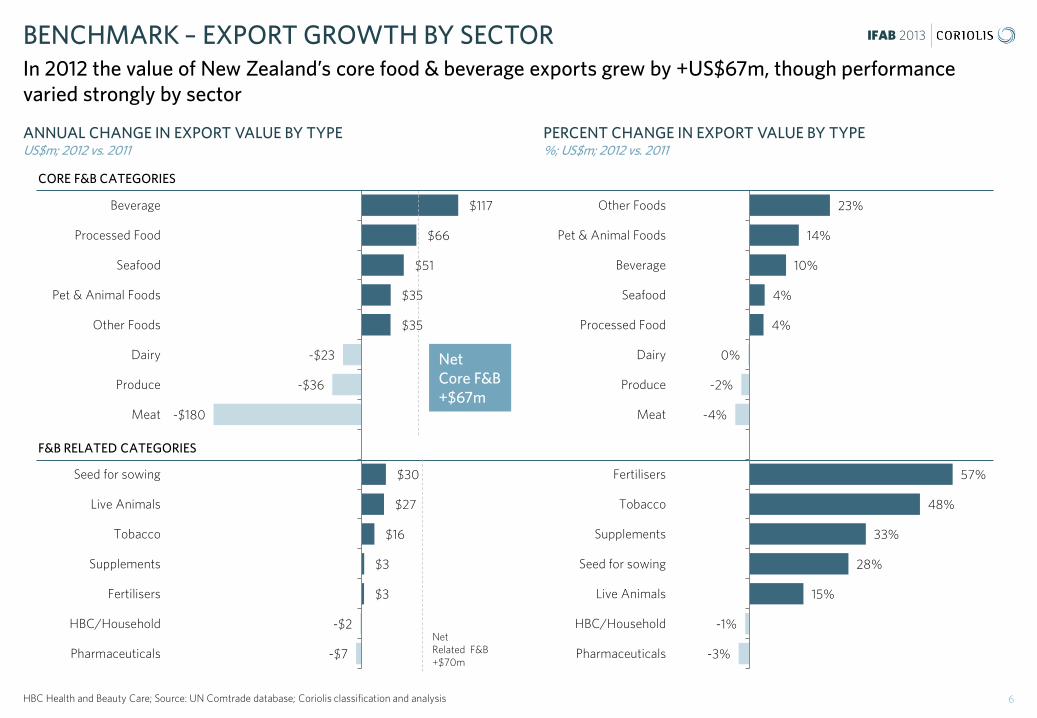
BENCHMARK – EXPORT GROWTH BY SECTOR In 2012 the value of New Zealand’s core food & beverage exports grew by +US$67m, though performance varied strongly by sector
6 HBC Health and Beauty Care; Source: UN Comtrade database; Coriolis classification and analysis
PERCENT CHANGE IN EXPORT VALUE BY TYPE %; US$m; 2012 vs. 2011
$117
$66
$51
$35
$35
-$23
-$36
-$180
$30
$27
$16
$3
$3
-$2
-$7
Beverage
Processed Food
Seafood
Pet & Animal Foods
Other Foods
Dairy
Produce
Meat
Seed for sowing
Live Animals
Tobacco
Supplements
Fertilisers
HBC/Household
Pharmaceuticals
Net Core F&B +$67m
F&B RELATED CATEGORIES
CORE F&B CATEGORIES
23%
14%
10%
4%
4%
0%
-2%
-4%
57%
48%
33%
28%
15%
-1%
-3%
Other Foods
Pet & Animal Foods
Beverage
Seafood
Processed Food
Dairy
Produce
Meat
Fertilisers
Tobacco
Supplements
Seed for sowing
Live Animals
HBC/Household
PharmaceuticalsNet Related F&B +$70m
IFAB 2013 FOOD & BEVERAGE - SITUATION
General New Zealand is a developed, temperate-climate country in the Asia-Pacific region. It is a stable democracy with strong economic freedoms (Index of Economic Freedom #4), excellent investor protection (World Bank #1) and low corruption (Transparency International #1). It is by almost all measures the most attractive investment destination in the temperate zone of the Southern Hemisphere. Food & beverages The Food & Beverage industry is important to New Zealand and the country is a major F&B exporter. New Zealand’s F&B exports are growing strongly and the country’s export performance is strong and improving relative to peers. The country has demonstrated capability in the production of temperate-climate food and beverages. It is the largest exporter in the world of dairy products and lamb and a major exporter of beef, kiwifruit, apples and seafood. Drivers The success of New Zealand in temperate foods is built around a natural environment conducive to agriculture. New Zealand – surrounded by the Pacific Ocean – has the light of Spain with the climate of Bordeaux. This climate will also moderate the effects of global warming going forward (relative to large continents). The country’s farmers are highly productive and efficient. The country has no agricultural subsidies and regulation is light handed. New Zealand has a supportive infrastructure for food and beverages along the total value chain.
New Zealand is a leader in food safety and product traceability. Customers and consumers around the world trust food and beverages produced in New Zealand. In science, New Zealand spends more than half a billion dollars a year on Agri-Food research across a wide range of areas, from fruit genetics to nutraceuticals. The country is also home to four major universities respected globally for their Agri-food research. Opportunities While New Zealand is a major global F&B exporter, the country has significant untapped capacity to export more. New Zealand is a country the size of Italy with the population of Singapore. However Italy feeds a domestic population of 60m people and exports twice as much F&B as New Zealand. To achieve the goals and the Business Growth Agenda, New Zealand will need to roughly double the country’s food and beverage exports over the next 15 years (in real terms)1. This will be achieved through both growth of existing major sectors and the newer emerging growth stars. New Zealand is a young country still discovering its comparative advantages and new industries continue to emerge. In the past twenty years New Zealand wine, honey, aquaculture and avocados have all emerged from almost nothing into world leading sectors. New Zealand has attracted investment in F&B manufacturing from around the world. Global leaders have already endorsed New Zealand by investing in manufacturing in the country and about a quarter of the F&B manufacturing sector (by turnover) is foreign owned.
New Zealand has clear comparative advantage in food & beverage (F&B) production and the capacity to continue growing for the foreseeable future
7 1. Doubling in inflation-adjusted real terms which is tripling in nominal dollars over the same period
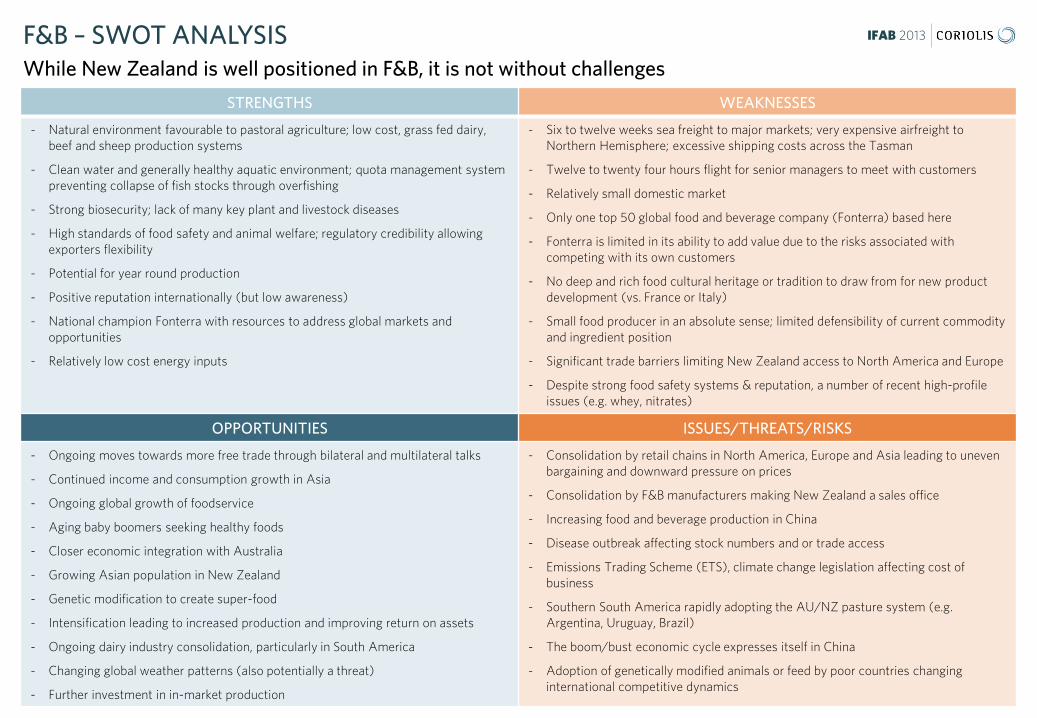
IFAB 2013 F&B – SWOT ANALYSIS While New Zealand is well positioned in F&B, it is not without challenges
8
STRENGTHS WEAKNESSES
- Natural environment favourable to pastoral agriculture; low cost, grass fed dairy, beef and sheep production systems
- Clean water and generally healthy aquatic environment; quota management system preventing collapse of fish stocks through overfishing
- Strong biosecurity; lack of many key plant and livestock diseases
- High standards of food safety and animal welfare; regulatory credibility allowing exporters flexibility
- Potential for year round production
- Positive reputation internationally (but low awareness)
- National champion Fonterra with resources to address global markets and opportunities
- Relatively low cost energy inputs
- Six to twelve weeks sea freight to major markets; very expensive airfreight to Northern Hemisphere; excessive shipping costs across the Tasman
- Twelve to twenty four hours flight for senior managers to meet with customers
- Relatively small domestic market
- Only one top 50 global food and beverage company (Fonterra) based here
- Fonterra is limited in its ability to add value due to the risks associated with competing with its own customers
- No deep and rich food cultural heritage or tradition to draw from for new product development (vs. France or Italy)
- Small food producer in an absolute sense; limited defensibility of current commodity and ingredient position
- Significant trade barriers limiting New Zealand access to North America and Europe
- Despite strong food safety systems & reputation, a number of recent high-profile issues (e.g. whey, nitrates)
OPPORTUNITIES ISSUES/THREATS/RISKS
- Ongoing moves towards more free trade through bilateral and multilateral talks
- Continued income and consumption growth in Asia
- Ongoing global growth of foodservice
- Aging baby boomers seeking healthy foods
- Closer economic integration with Australia
- Growing Asian population in New Zealand
- Genetic modification to create super-food
- Intensification leading to increased production and improving return on assets
- Ongoing dairy industry consolidation, particularly in South America
- Changing global weather patterns (also potentially a threat)
- Further investment in in-market production
- Consolidation by retail chains in North America, Europe and Asia leading to uneven bargaining and downward pressure on prices
- Consolidation by F&B manufacturers making New Zealand a sales office
- Increasing food and beverage production in China
- Disease outbreak affecting stock numbers and or trade access
- Emissions Trading Scheme (ETS), climate change legislation affecting cost of business
- Southern South America rapidly adopting the AU/NZ pasture system (e.g. Argentina, Uruguay, Brazil)
- The boom/bust economic cycle expresses itself in China
- Adoption of genetically modified animals or feed by poor countries changing international competitive dynamics

IFAB 2013 FIRMS - SITUATION
An important sector New Zealand’s food & beverage (F&B) manufacturing sector is large, with more than 2,600 enterprises, employing almost 85,000 people with a total revenue of approximately NZ$38 billion. It accounts for 56% of merchandise trade exports.
Still New Zealand owned, primarily by farmers Historically New Zealand has been a major producer of ingredients through farmer-owned cooperatives and marketed via quasi-government monopsonies1.
The New Zealand F&B industry is predominantly owned by New Zealanders. Four of the top five New Zealand F&B firms are owned by farmers. There is nothing “wrong” with farmers owning the food industry and this is a common situation across many peer group counties.
Moving to the centre Broadly speaking 50% of what is sold in a supermarket anywhere in the world is fresh perishables (e.g. meat, seafood, produce, dairy) and 50% is consumer-ready packaged shelf-stable products. The export mix of peer group countries match these proportions (i.e. 50/50). New Zealand, on the other hand, is 80% weighted toward perishables and only 20% shelf-stable. This mix limits industry profitability.
In the last 10-15 years New Zealand’s F&B industry has begun to transform into a producer of consumer ready packaged goods.
Processed/packaged F&B are showing rapid growth, and over the next 20 years New Zealand’s F&B exports will likely come to resemble those of peer group countries.
While doubling F&B exports over the next 15 years (in real terms) is a clearly a stretch, all of our research suggests it is possible.
To achieve this, the path forward over the next 20 years is about turning ingredients into packaged/processed foods (e.g. infant formula instead of milk powder). This transition will require large amounts of new investment in research, plants and equipment, sales and marketing.
Conceptually this will require something approaching tripling the amount of capital in the F&B industry. Firms will need to make a significant increase in their investment to make this required transition to packaged goods.
Foreign capital filling the gap
Producer owned co-operatives strive to maximise returns to members, which limits availability of capital to fund growth.
Nevertheless, international investors are providing a large and constant in-flow of capital, particularly in the areas of strong growth potential going forward (i.e. beverages and processed foods).
F&B manufacturing is an important sector that will require significant capital if it is to triple exports over the next fifteen years
9 1. A monopsony is a monopoly on selling not buying; also referred to in New Zealand as a “single desk” (the “desk” in question being figurative) or single point of entry
IFAB 2013
Food & beverage manufacturing/ processing $37.7b
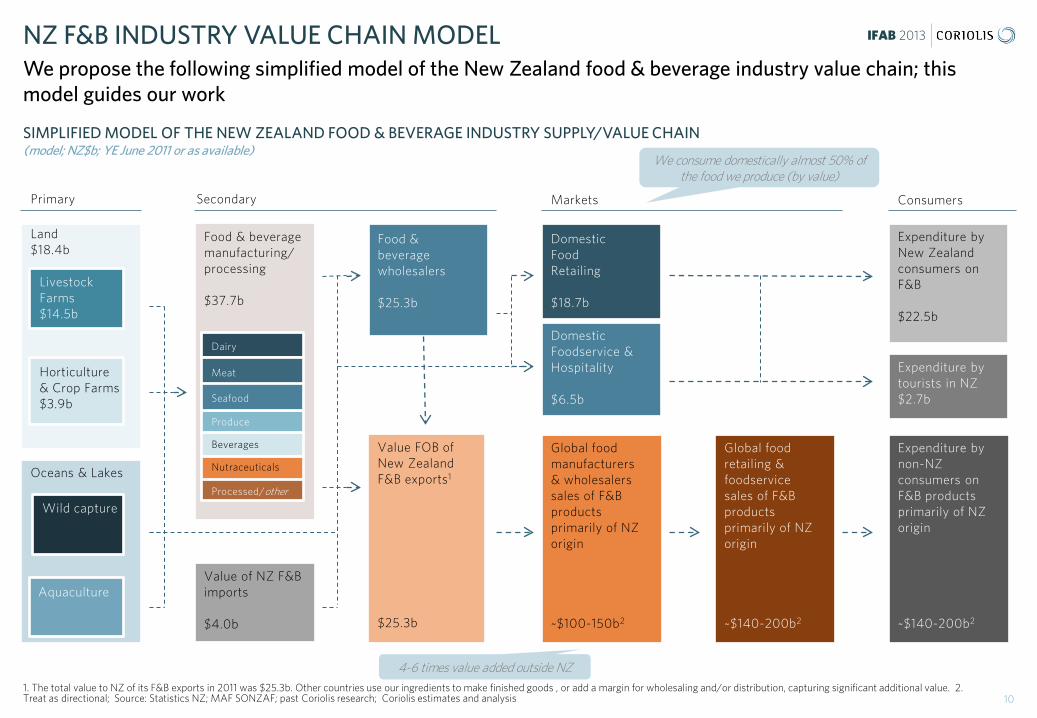
SIMPLIFIED MODEL OF THE NEW ZEALAND FOOD & BEVERAGE INDUSTRY SUPPLY/VALUE CHAIN (model; NZ$b; YE June 2011 or as available)
NZ F&B INDUSTRY VALUE CHAIN MODEL We propose the following simplified model of the New Zealand food & beverage industry value chain; this model guides our work
10 1. The total value to NZ of its F&B exports in 2011 was $25.3b. Other countries use our ingredients to make finished goods , or add a margin for wholesaling and/or distribution, capturing significant additional value. 2. Treat as directional; Source: Statistics NZ; MAF SONZAF; past Coriolis research; Coriolis estimates and analysis
Land $18.4b
Horticulture & Crop Farms $3.9b
Oceans & Lakes
Domestic Food Retailing $18.7b
Domestic Foodservice & Hospitality $6.5b
Value FOB of New Zealand F&B exports1
$25.3b
Primary Secondary Markets
Livestock Farms $14.5b
Aquaculture
Wild capture
Food & beverage wholesalers $25.3b
Expenditure by New Zealand consumers on F&B $22.5b
Expenditure by non-NZ consumers on F&B products primarily of NZ origin ~$140-200b2
Global food manufacturers & wholesalers sales of F&B products primarily of NZ origin ~$100-150b2
Global food retailing & foodservice sales of F&B products primarily of NZ origin ~$140-200b2
Expenditure by tourists in NZ $2.7b
Consumers
Value of NZ F&B imports $4.0b
Dairy
Meat
Produce
Processed/other
Nutraceuticals
Seafood
Beverages
We consume domestically almost 50% of the food we produce (by value)
4-6 times value added outside NZ

iFAB 2013
IFAB 2013
-
1,000
2,000
3,000
4,000
5,000
6,000
7,000
196
1
196
4
196
7
1970
1973
1976
1979
198
2
198
5
198
8
199
1
199
4
199
7
200
0
200
3
200
6
200
9
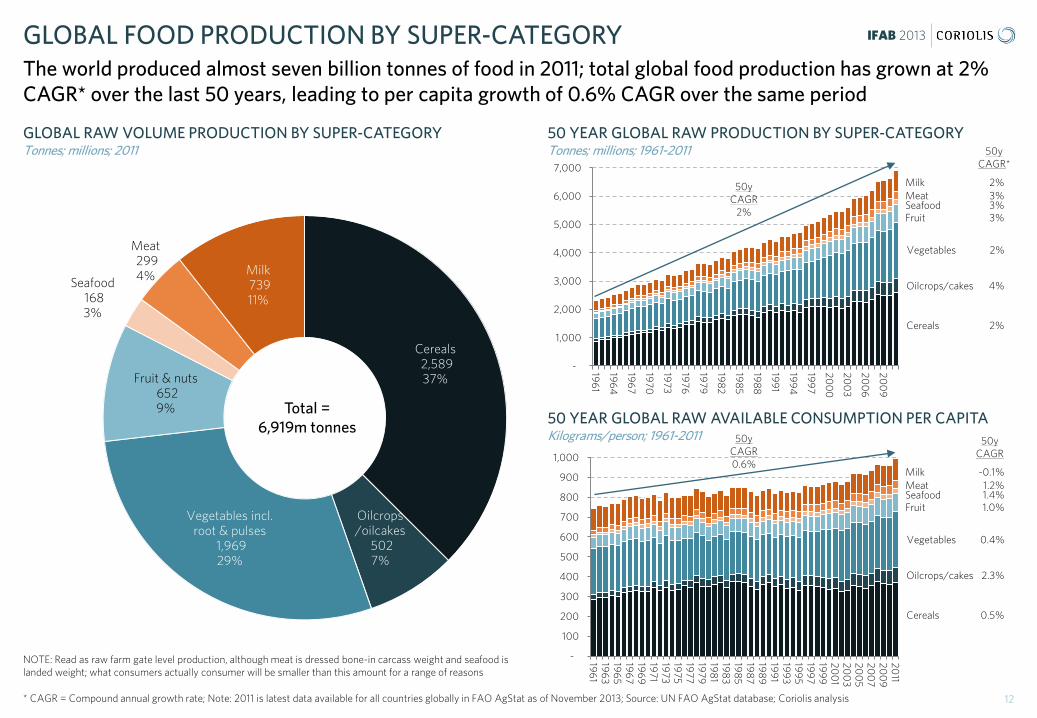
Cereals 2,589 37%
Oilcrops /oilcakes
502 7%
Vegetables incl. root & pulses
1,969 29%
Fruit & nuts 652 9%
Seafood 168 3%
Meat 299 4% Milk
739 11%
GLOBAL FOOD PRODUCTION BY SUPER-CATEGORY The world produced almost seven billion tonnes of food in 2011; total global food production has grown at 2% CAGR* over the last 50 years, leading to per capita growth of 0.6% CAGR over the same period
GLOBAL RAW VOLUME PRODUCTION BY SUPER-CATEGORY Tonnes; millions; 2011
50 YEAR GLOBAL RAW PRODUCTION BY SUPER-CATEGORY Tonnes; millions; 1961-2011
12 * CAGR = Compound annual growth rate; Note: 2011 is latest data available for all countries globally in FAO AgStat as of November 2013; Source: UN FAO AgStat database; Coriolis analysis
Total = 6,919m tonnes
Cereals
Oilcrops/cakes
Fruit Seafood
Milk
2%
4%
3% 3%
2%
50y CAGR*
50y CAGR
2%
50 YEAR GLOBAL RAW AVAILABLE CONSUMPTION PER CAPITA Kilograms/person; 1961-2011
Vegetables 2%
Meat 3%
-
100
200
300
400
500
600
700
800
900
1,00019
61
196
319
65
196
719
69
1971
1973
1975
1977
1979
198
119
83
198
519
87
198
919
91
199
319
95
199
719
99
200
120
03
200
520
07
200
920
11
Cereals
Oilcrops/cakes
Fruit Seafood
Milk
0.5%
2.3%
1.0% 1.4%
-0.1%
50y CAGR
50y CAGR 0.6%
Vegetables 0.4%
Meat 1.2%
NOTE: Read as raw farm gate level production, although meat is dressed bone-in carcass weight and seafood is landed weight; what consumers actually consumer will be smaller than this amount for a range of reasons

IFAB 2013
902 1,117 1,182 1,261 1,146 1,229
346
469 620 599 693
787
29
41 51 53 91
96
160
245
321 378
533
711
59
83
115 169
268
390
130
176
203 285
378
530
212
273
362
492
664
921
100
133
208
266
362
536
363
519
651
897
1,303
1,728
2,302
3,057
3,713
4,400
5,438
6,928
1961 1971 1981 1991 2001 2011
Europe 1,229 18%
N America 787 11%
Australasia 96 1%
C/S America 711 10%
NA/ME/CA 390 6%
SS Africa 530 8%
S Asia 921 13%
SE Asia 536 8%
East Asia 1,728 25%
GLOBAL RAW VOLUME PRODUCTION BY REGION Tonnes; millions; 2011
GLOBAL FOOD PRODUCTION BY REGION New Zealand produces 0.3% of global food volume
13 1. Unlike page prior contains 9m in “other”; Note: 2011 is latest data available for all countries globally in FAO AgStat as of October 2013; Source: UN FAO AgStat database; Coriolis analysis
Total = 6,928m1 tonnes
Europe/Russia
New Zealand 23/0.3% Australia 66/0.9% Pacific Islands 7/0.1%
Australasia
C/S America
E Asia
SE Asia
S Asia
NA/ME/CA
SS Africa
Other
50 YEAR RAW VOLUME PRODUCTION BY REGION Tonnes; millions; 1961-2011
0.6%
1.7%
2.4%
3.0%
3.2%
3.4%
3.0%
3.8%
2.9%
50y CAGR
50y CAGR 2.2%
N America

IFAB 2013 TOP 46 FOOD PRODUCING COUNTRIES New Zealand is the forty-sixth largest food producing country in the world; it is achieving the fastest growth rate of any major developed country producer
TOP 46 FOOD PRODUCERS Tonnes; millions; 2011
10 YEAR PRODUCTION GROWTH RATE CAGR % of tonnes; 2001-2011
14 Source: UN FAO AgStat database; Coriolis analysis
1,565 718
695 298
201 189
153 131 129
119 105 102 100 92 88 86 79 77 72 70 69 66 66 66 62 60 56 52
42 42 40 34 33 32 31 30 30 30 29 28 27 25 25 25 23 23
ChinaIndiaUSA
BrazilRussia
IndonesiaNigeria
ArgentinaFrance
UkraineTurkey
GermanyPakistanCanada
Viet NamThailand
MexicoBangladesh
IranSpain
ItalyChina
AustraliaEgypt
PolandPhilippinesMyanmar
United KingdomJapan
KazakhstanRomaniaEthiopia
MalaysiaSouth Africa
GhanaNetherlands
PeruTanzania
UzbekistanColombia
UgandaBelarus
South KoreaMorocco
DR CongoNew Zealand
3.1% 3.2%
1.2% 3.8%
1.1% 4.7%
3.1% 3.4%
0.4% 3.8%
2.1% -0.5%
3.4% 1.9%
4.4% 1.4%
0.3% 4.4%
3.3% 0.8%
-0.6% 4.1%
-0.1% 2.9%
-1.5% 3.1%
5.1% 0.5%
-1.9% 5.0%
1.1% 6.1%
4.1% 1.9%
4.5% 1.1%
2.6% 6.1%
6.9% 1.1% 1.1%
2.3% -1.0%
5.4% 0.7%
2.4%
ChinaIndiaUSA
BrazilRussia
IndonesiaNigeria
ArgentinaFrance
UkraineTurkey
GermanyPakistanCanada
Viet NamThailand
MexicoBangladesh
IranSpain
ItalyChina
AustraliaEgypt
PolandPhilippinesMyanmar
United KingdomJapan
KazakhstanRomaniaEthiopia
MalaysiaSouth Africa
GhanaNetherlands
PeruTanzania
UzbekistanColombia
UgandaBelarus
South KoreaMorocco
DR CongoNew Zealand
Developed Developing
iFAB 2013

IFAB 2013
TOTAL AREA: NEW ZEALAND VS. SELECT US EAST COAST STATES VS. SELECT DEVELOPED PEER COUNTRIES km2; 2013
BENCHMARK - AREA New Zealand is not a small country; many regions of New Zealand are the size of major European countries or American states
Source: Wikipedia; CIA World Fact Book; Coriolis analysis
14 6
26
12 8 14 7
22
8 10 12
23
45
32
34
122
19
13
23
24
25
62
31
37
41
43
70
49
3
NZ USA Europe
Northland Auckand
Waikato
Bay of Plenty Gisborne
Hawke’s Bay
Taranaki
Manawatu-Wanganui
Wellington Nelson/Tasman
Marlborough
West Coast
Canterbury
Otago
Southland
Belgium
Netherlands
Switzerland
Denmark
Ireland
Slovakia
Luxembourg
New York
New Jersey
Connecticut
New Hampshire
Vermont
Maryland
West Virginia
275
289
274
16

IFAB 2013
NEW ZEALAND LAND USE km2; 000; 2012
NEW ZEALAND LAND USE Farming uses 48% of New Zealand’s land area, however most farmland is used for grazing; historical declines in total farm area appear to have slowed or stabilised over the past few years
17 Source: Statistics New Zealand; World Database of Protected Areas (http://www.wdpa.org); Department of Conservation; Coriolis analysis and estimates
Farming 127 48%
Forestry 16 6%
National parks 71
26%
Other DOC 14 5%
Other 39 15%
Total = 268 (000) km2
10 YEAR CHANGE IN FARMING AREA BY LAND USE Hectare; 000; 2002-2012
FARMING AREA BY LAND USAGE TYPE Hectare; 000; 2012
NEW ZEALAND LAND USE OVER LAST DECADE km2; 000; 2002-2012
Lifestyle blocks Cities and towns
Idle lands Other government
Other
-
50
100
150
200
250
2002 2003 2004 2005 2006 2007 2008 2009 2010 2011 2012
Farming & Forestry
Parks
All other uses
Tussock 2,741 22%
Pasture 7,888 62%
Arable 468 4%
Horticulture 128 1%
Onfarm native bush 1,075 8%
Other 410 3%
Total = 12,584 (000) ha
8,255 8,086 7,888
3,287 2,900 2,741
424 367 468
110 133 128
1,302 1,074 1,075
2002 2007 2012
Pasture
Tussock
On-farm native bush
Arable Horticulture
13,762 12,993 12,584
IFAB 2013
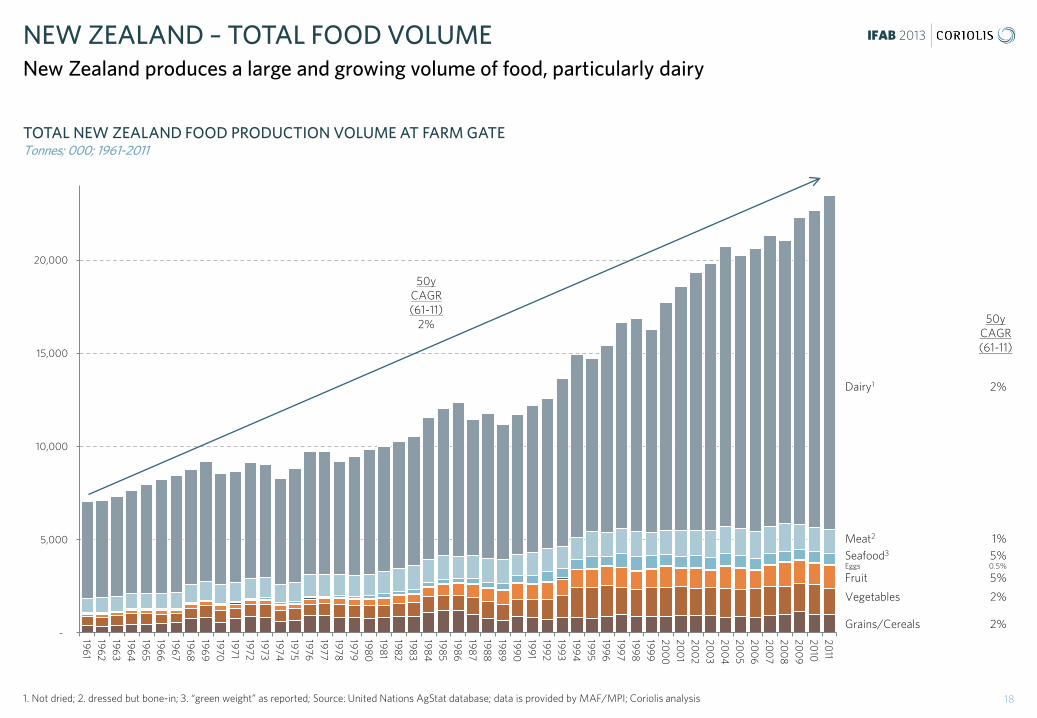
TOTAL NEW ZEALAND FOOD PRODUCTION VOLUME AT FARM GATE Tonnes; 000; 1961-2011
NEW ZEALAND – TOTAL FOOD VOLUME New Zealand produces a large and growing volume of food, particularly dairy
18 1. Not dried; 2. dressed but bone-in; 3. “green weight” as reported; Source: United Nations AgStat database; data is provided by MAF/MPI; Coriolis analysis
-
5,000
10,000
15,000
20,000
196
119
62
196
319
64
196
519
66
196
719
68
196
919
7019
7119
7219
7319
7419
7519
7619
7719
7819
7919
80
198
119
82
198
319
84
198
519
86
198
719
88
198
919
90
199
119
92
199
319
94
199
519
96
199
719
98
199
920
00
200
120
02
200
320
04
200
520
06
200
720
08
200
920
1020
11
Grains/Cereals
Vegetables
Fruit
Seafood3
Meat2
Dairy1
2%
2%
5%
5% 1%
2%
50y CAGR (61-11)
50y CAGR (61-11)
2%
Eggs 0.5%
IFAB 2013
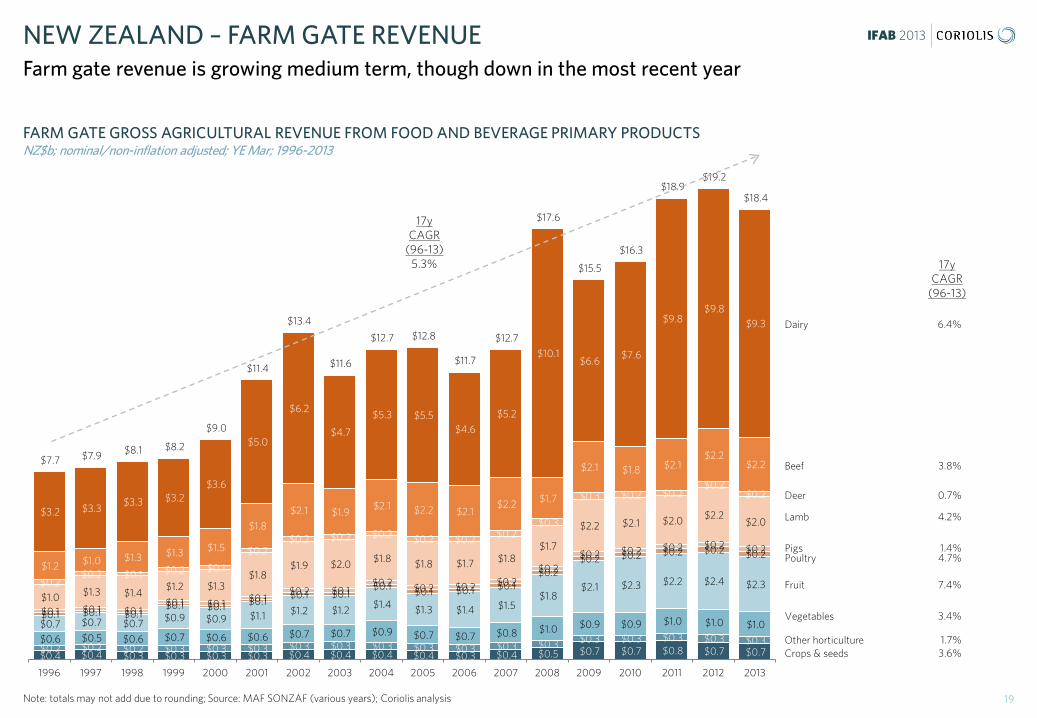
FARM GATE GROSS AGRICULTURAL REVENUE FROM FOOD AND BEVERAGE PRIMARY PRODUCTS NZ$b; nominal/non-inflation adjusted; YE Mar; 1996-2013
NEW ZEALAND – FARM GATE REVENUE Farm gate revenue is growing medium term, though down in the most recent year
19 Note: totals may not add due to rounding; Source: MAF SONZAF (various years); Coriolis analysis
Dairy
Beef
Lamb
Deer
Fruit
Vegetables
Other horticulture Crops & seeds $0.4 $0.4 $0.3 $0.3 $0.3 $0.3 $0.4 $0.4 $0.4 $0.4 $0.3 $0.4 $0.5 $0.7 $0.7 $0.8 $0.7 $0.7 $0.2 $0.2 $0.2 $0.3 $0.3 $0.3 $0.3 $0.3 $0.3 $0.3 $0.3 $0.3 $0.3 $0.3 $0.3 $0.3 $0.3 $0.3 $0.6 $0.5 $0.6 $0.7 $0.6 $0.6 $0.7 $0.7 $0.9 $0.7 $0.7 $0.8 $1.0 $0.9 $0.9 $1.0 $1.0 $1.0 $0.7 $0.7 $0.7 $0.9 $0.9 $1.1 $1.2 $1.2 $1.4 $1.3 $1.4 $1.5
$1.8 $2.1 $2.3 $2.2 $2.4 $2.3
$0.1 $0.1 $0.1 $0.1 $0.1 $0.1
$0.1 $0.1 $0.1 $0.1 $0.1 $0.1
$0.2 $0.2 $0.2 $0.2 $0.2 $0.2
$0.1 $0.1 $0.1 $0.1 $0.1 $0.1
$0.2 $0.1 $0.2 $0.2 $0.2 $0.2
$0.2 $0.2 $0.2 $0.2 $0.2 $0.2
$1.0 $1.3 $1.4 $1.2 $1.3
$1.8 $1.9 $2.0 $1.8 $1.8 $1.7 $1.8
$1.7
$2.2 $2.1 $2.0 $2.2 $2.0
$0.2 $0.2 $0.1 $0.2 $0.1
$0.2 $0.2 $0.2 $0.2 $0.2 $0.2 $0.2
$0.3
$0.3 $0.2 $0.2 $0.2
$0.2
$1.2 $1.0 $1.3 $1.3 $1.5
$1.8
$2.1 $1.9 $2.1 $2.2 $2.1
$2.2 $1.7
$2.1 $1.8 $2.1 $2.2
$2.2
$3.2 $3.3 $3.3 $3.2
$3.6
$5.0
$6.2
$4.7
$5.3 $5.5 $4.6
$5.2
$10.1 $6.6
$7.6
$9.8 $9.8
$9.3
$7.7 $7.9 $8.1 $8.2
$9.0
$11.4
$13.4
$11.6
$12.7 $12.8
$11.7
$12.7
$17.6
$15.5
$16.3
$18.9 $19.2
$18.4
1996 1997 1998 1999 2000 2001 2002 2003 2004 2005 2006 2007 2008 2009 2010 2011 2012 2013
Pigs Poultry
6.4%
3.8%
4.2%
0.7%
7.4%
3.4%
1.7% 3.6%
1.4% 4.7%
17y CAGR
(96-13)
17y CAGR
(96-13) 5.3%
IFAB 2013
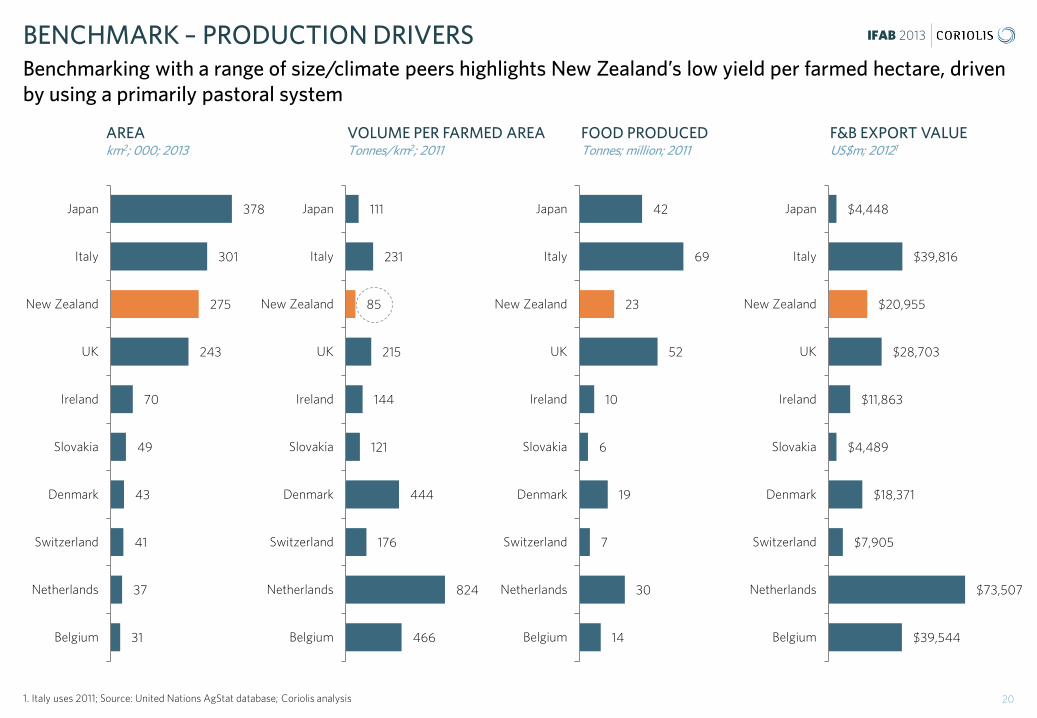
AREA km2; 000; 2013
BENCHMARK – PRODUCTION DRIVERS Benchmarking with a range of size/climate peers highlights New Zealand’s low yield per farmed hectare, driven by using a primarily pastoral system
20 1. Italy uses 2011; Source: United Nations AgStat database; Coriolis analysis
378
301
275
243
70
49
43
41
37
31
Japan
Italy
New Zealand
UK
Ireland
Slovakia
Denmark
Switzerland
Netherlands
Belgium
42
69
23
52
10
6
19
7
30
14
Japan
Italy
New Zealand
UK
Ireland
Slovakia
Denmark
Switzerland
Netherlands
Belgium
$4,448
$39,816
$20,955
$28,703
$11,863
$4,489
$18,371
$7,905
$73,507
$39,544
Japan
Italy
New Zealand
UK
Ireland
Slovakia
Denmark
Switzerland
Netherlands
Belgium
FOOD PRODUCED Tonnes; million; 2011
F&B EXPORT VALUE US$m; 20121
111
231
85
215
144
121
444
176
824
466
Japan
Italy
New Zealand
UK
Ireland
Slovakia
Denmark
Switzerland
Netherlands
Belgium
VOLUME PER FARMED AREA
Tonnes/km2; 2011
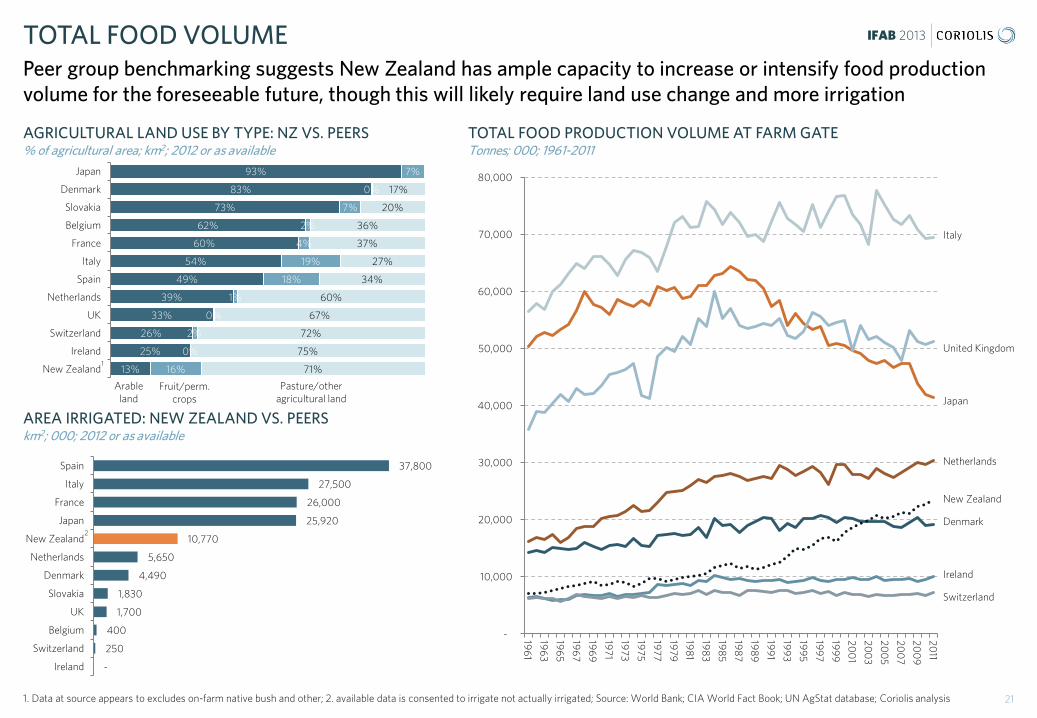
IFAB 2013 TOTAL FOOD VOLUME Peer group benchmarking suggests New Zealand has ample capacity to increase or intensify food production volume for the foreseeable future, though this will likely require land use change and more irrigation
AGRICULTURAL LAND USE BY TYPE: NZ VS. PEERS % of agricultural area; km2; 2012 or as available
TOTAL FOOD PRODUCTION VOLUME AT FARM GATE Tonnes; 000; 1961-2011
21 1. Data at source appears to excludes on-farm native bush and other; 2. available data is consented to irrigate not actually irrigated; Source: World Bank; CIA World Fact Book; UN AgStat database; Coriolis analysis
-
10,000
20,000
30,000
40,000
50,000
60,000
70,000
80,000
196
1
196
3
196
5
196
7
196
9
1971
1973
1975
1977
1979
198
1
198
3
198
5
198
7
198
9
199
1
199
3
199
5
199
7
199
9
200
1
200
3
200
5
200
7
200
9
2011
Switzerland
Ireland
Denmark
New Zealand
Netherlands
Japan
United Kingdom
Italy
93%
83%
73%
62%
60%
54%
49%
39%
33%
26%
25%
13%
7%
0%
7%
2%
4%
19%
18%
1%
0%
2%
0%
16%
17%
20%
36%
37%
27%
34%
60%
67%
72%
75%
71%
Japan
Denmark
Slovakia
Belgium
France
Italy
Spain
Netherlands
UK
Switzerland
Ireland
New Zealand
Arable land
Fruit/perm. crops
Pasture/other agricultural land
AREA IRRIGATED: NEW ZEALAND VS. PEERS km2; 000; 2012 or as available
37,800
27,500
26,000
25,920
10,770
5,650
4,490
1,830
1,700
400
250
-
Spain
Italy
France
Japan
New Zealand
Netherlands
Denmark
Slovakia
UK
Belgium
Switzerland
Ireland
1
2
iFAB 2013
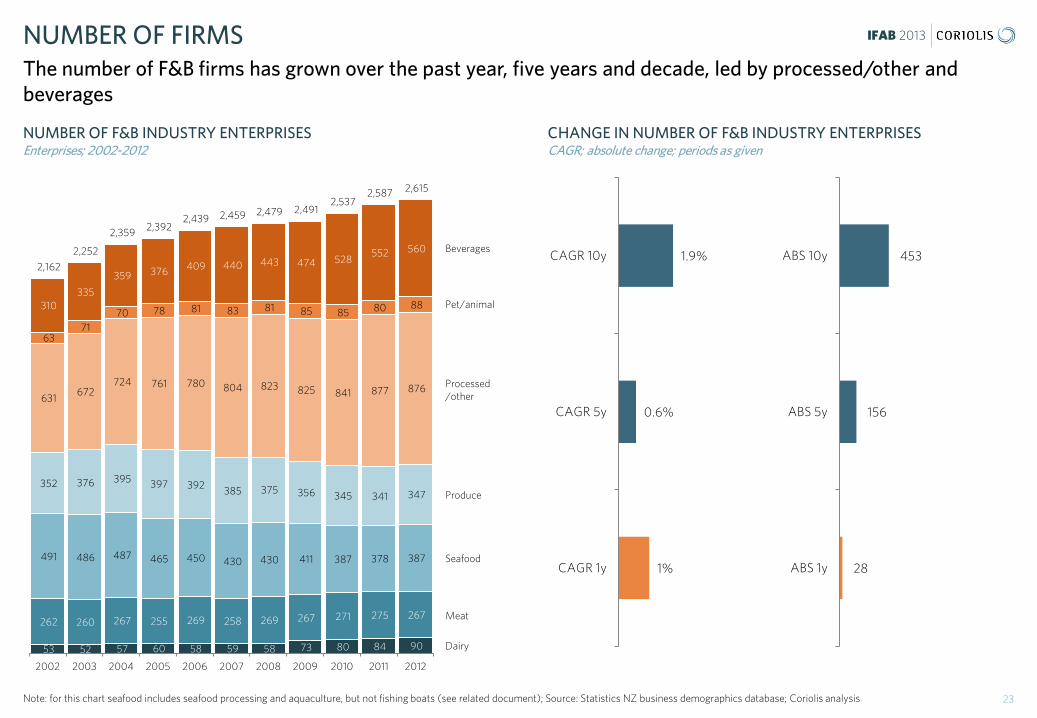
IFAB 2013 NUMBER OF FIRMS The number of F&B firms has grown over the past year, five years and decade, led by processed/other and beverages
NUMBER OF F&B INDUSTRY ENTERPRISES
Enterprises; 2002-2012
23 Note: for this chart seafood includes seafood processing and aquaculture, but not fishing boats (see related document); Source: Statistics NZ business demographics database; Coriolis analysis
CHANGE IN NUMBER OF F&B INDUSTRY ENTERPRISES CAGR; absolute change; periods as given
53 52 57 60 58 59 58 73 80 84 90
262 260 267 255 269 258 269 267 271 275 267
491 486 487 465 450 430 430 411 387 378 387
352 376 395 397 392 385 375 356 345 341 347
631 672
724 761 780 804 823 825 841 877 876
63 71
70 78 81 83 81 85 85 80 88 310 335
359 376 409 440 443 474 528 552 560
2,162
2,252
2,359 2,392 2,439 2,459 2,479 2,491
2,537 2,587 2,615
2002 2003 2004 2005 2006 2007 2008 2009 2010 2011 2012
Dairy
Meat
Seafood
Produce
Processed /other
Pet/animal
Beverages 1.9%
0.6%
1%
CAGR 10y
CAGR 5y
CAGR 1y
453
156
28
ABS 10y
ABS 5y
ABS 1y
IFAB 2013
$2,035
$1,640
$1,487
$1,371
$1,212
$1,088
$730
$669
$641
$613
$534
$534
$500
$494
$487
$471
$466
$460
$414
$406
$378
$377
$373
$336
$320
Fonterra
Silver Fern Farms
Talley's*
Zespri
Alliance
ANZCO
Goodman Fielder
HJ Heinz NZ
T&G
Open Country
Lion - Beer, Spirits & Wine NZ
MG Marketing
Westland
Hawkes Bay Meat*
CCA
Sealord
Tegel Foods
DB Breweries
Sanford
Independent**
Frucor
Nestle NZ
Synlait
Nutricia
Inghams
Mondelez NZ
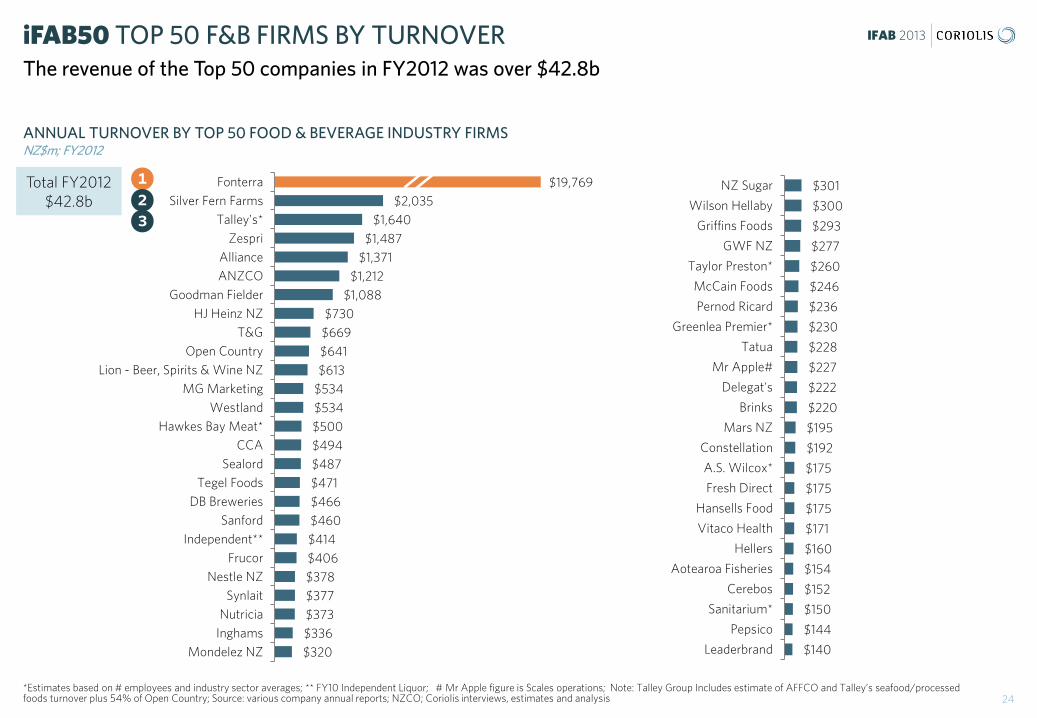
ANNUAL TURNOVER BY TOP 50 FOOD & BEVERAGE INDUSTRY FIRMS NZ$m; FY2012
iFAB50 TOP 50 F&B FIRMS BY TURNOVER The revenue of the Top 50 companies in FY2012 was over $42.8b
24 *Estimates based on # employees and industry sector averages; ** FY10 Independent Liquor; # Mr Apple figure is Scales operations; Note: Talley Group Includes estimate of AFFCO and Talley’s seafood/processed foods turnover plus 54% of Open Country; Source: various company annual reports; NZCO; Coriolis interviews, estimates and analysis
Total FY2012 $42.8b
$19,769 1 2 3
$301
$300
$293
$277
$260
$246
$236
$230
$228
$227
$222
$220
$195
$192
$175
$175
$175
$171
$160
$154
$152
$150
$144
$140
NZ Sugar
Wilson Hellaby
Griffins Foods
GWF NZ
Taylor Preston*
McCain Foods
Pernod Ricard
Greenlea Premier*
Tatua
Mr Apple#
Delegat's
Brinks
Mars NZ
Constellation
A.S. Wilcox*
Fresh Direct
Hansells Food
Vitaco Health
Hellers
Aotearoa Fisheries
Cerebos
Sanitarium*
Pepsico
Leaderbrand
IFAB 2013
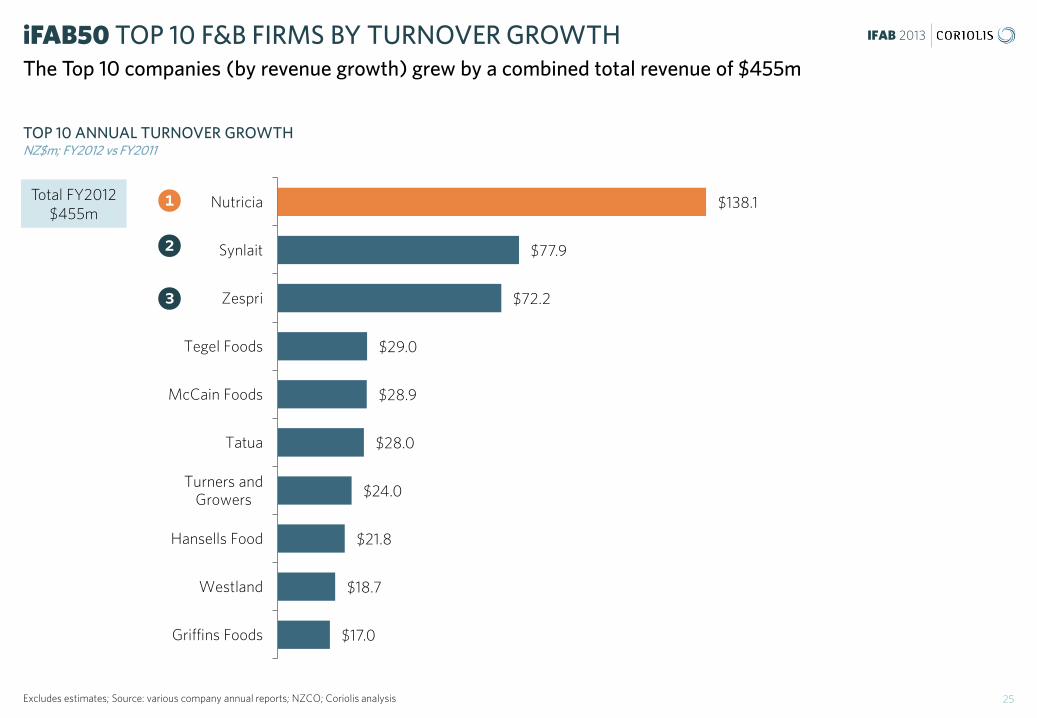
TOP 10 ANNUAL TURNOVER GROWTH NZ$m; FY2012 vs FY2011
iFAB50 TOP 10 F&B FIRMS BY TURNOVER GROWTH The Top 10 companies (by revenue growth) grew by a combined total revenue of $455m
25 Excludes estimates; Source: various company annual reports; NZCO; Coriolis analysis
Total FY2012 $455m
1
2
3
$138.1
$77.9
$72.2
$29.0
$28.9
$28.0
$24.0
$21.8
$18.7
$17.0
Nutricia
Synlait
Zespri
Tegel Foods
McCain Foods
Tatua
Turners andGrowers
Hansells Food
Westland
Griffins Foods
IFAB 2013
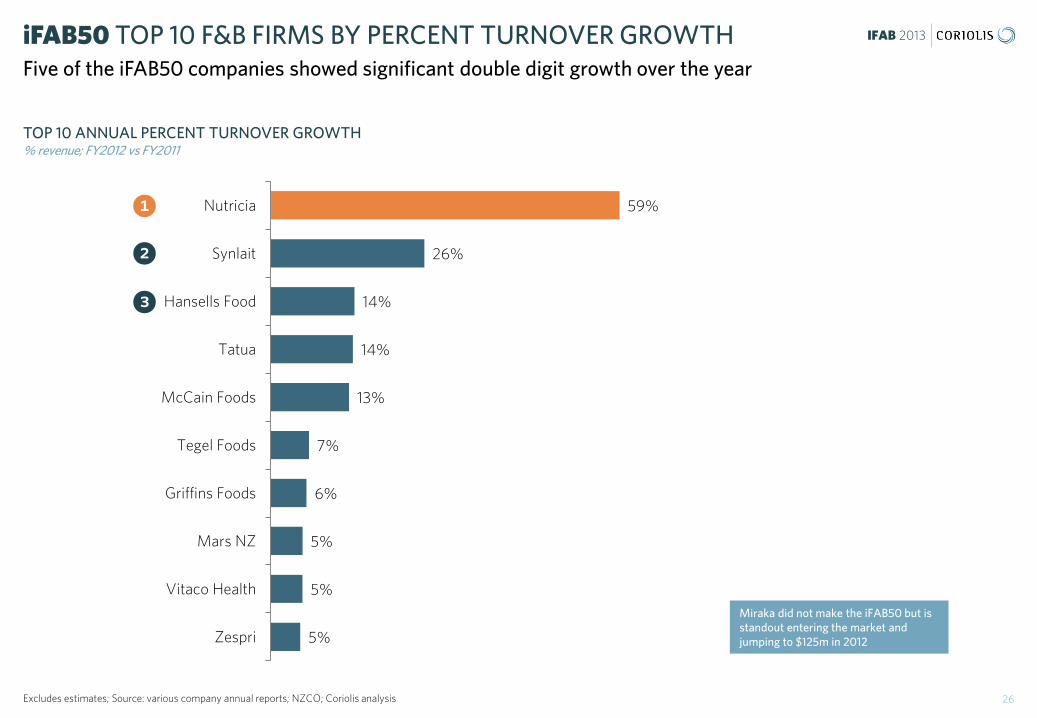
TOP 10 ANNUAL PERCENT TURNOVER GROWTH % revenue; FY2012 vs FY2011
iFAB50 TOP 10 F&B FIRMS BY PERCENT TURNOVER GROWTH Five of the iFAB50 companies showed significant double digit growth over the year
26 Excludes estimates; Source: various company annual reports; NZCO; Coriolis analysis
9 Miraka did not make the iFAB50 but is standout entering the market and jumping to $125m in 2012
1
2
3
59%
26%
14%
14%
13%
7%
6%
5%
5%
5%
Nutricia
Synlait
Hansells Food
Tatua
McCain Foods
Tegel Foods
Griffins Foods
Mars NZ
Vitaco Health
Zespri
IFAB 2013
TOP 10 ANNUAL TURNOVER LOSSES NZ$m; FY2012 vs FY2011
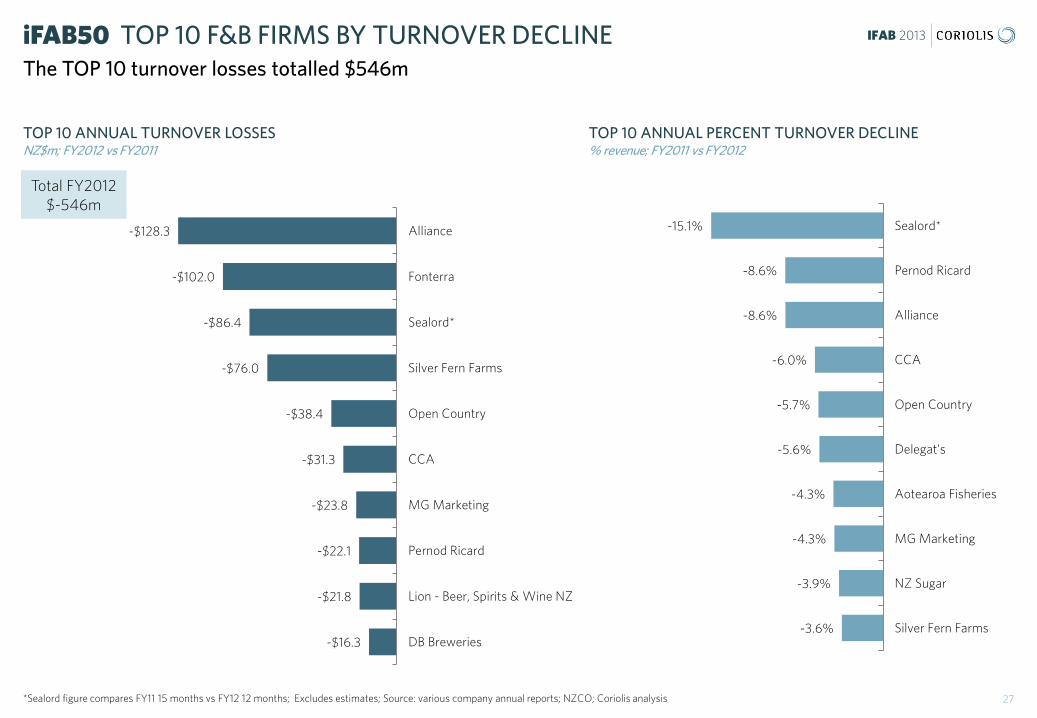
iFAB50 TOP 10 F&B FIRMS BY TURNOVER DECLINE The TOP 10 turnover losses totalled $546m
27 *Sealord figure compares FY11 15 months vs FY12 12 months; Excludes estimates; Source: various company annual reports; NZCO; Coriolis analysis
9
TOP 10 ANNUAL PERCENT TURNOVER DECLINE % revenue; FY2011 vs FY2012
Total FY2012 $-546m
* -$128.3
-$102.0
-$86.4
-$76.0
-$38.4
-$31.3
-$23.8
-$22.1
-$21.8
-$16.3
Alliance
Fonterra
Sealord*
Silver Fern Farms
Open Country
CCA
MG Marketing
Pernod Ricard
Lion - Beer, Spirits & Wine NZ
DB Breweries
-15.1%
-8.6%
-8.6%
-6.0%
-5.7%
-5.6%
-4.3%
-4.3%
-3.9%
-3.6%
Sealord*
Pernod Ricard
Alliance
CCA
Open Country
Delegat's
Aotearoa Fisheries
MG Marketing
NZ Sugar
Silver Fern Farms
IFAB 2013
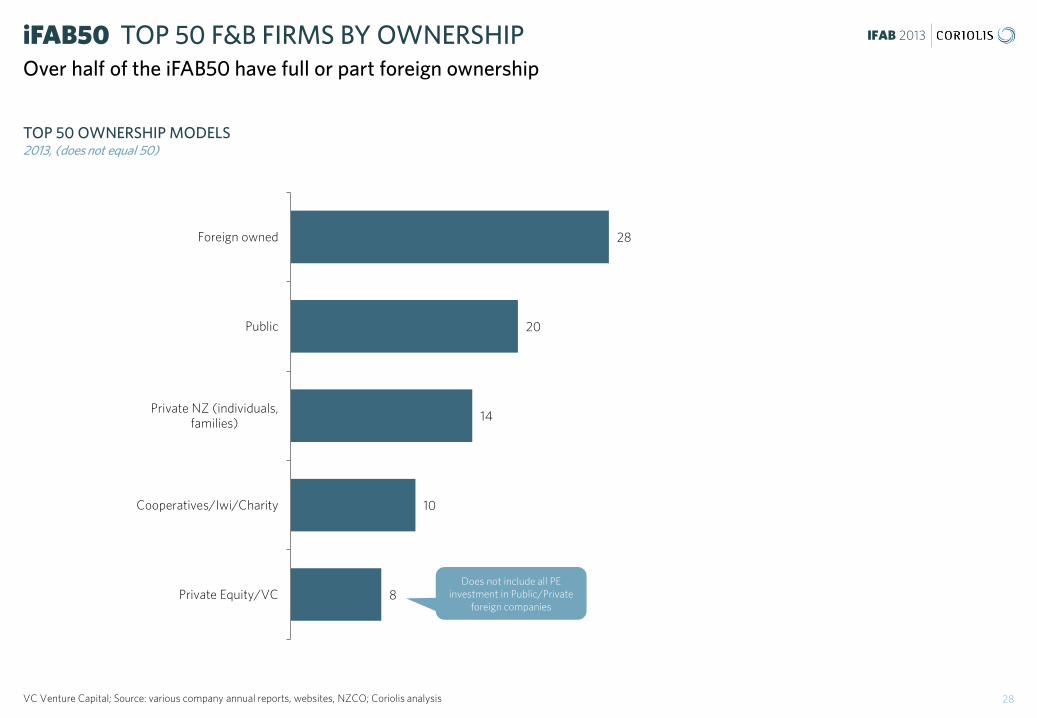
TOP 50 OWNERSHIP MODELS 2013, (does not equal 50)
iFAB50 TOP 50 F&B FIRMS BY OWNERSHIP Over half of the iFAB50 have full or part foreign ownership
28 VC Venture Capital; Source: various company annual reports, websites, NZCO; Coriolis analysis
9
28
20
14
10
8
Foreign owned
Public
Private NZ (individuals,families)
Cooperatives/Iwi/Charity
Private Equity/VCDoes not include all PE
investment in Public/Private foreign companies
IFAB 2013
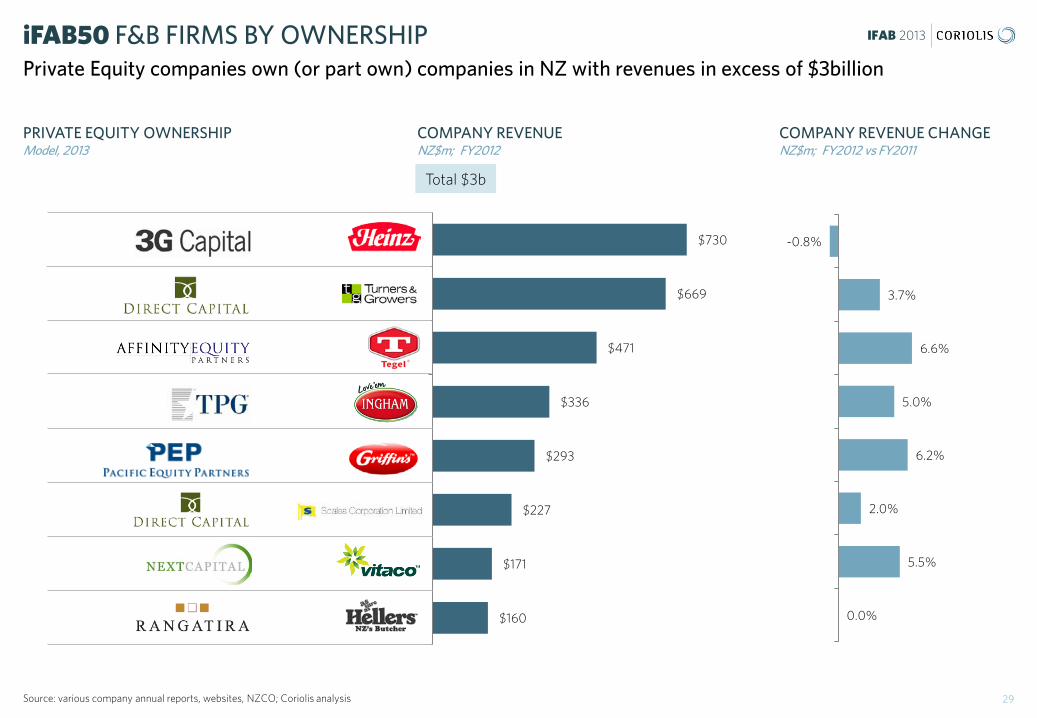
PRIVATE EQUITY OWNERSHIP Model, 2013
iFAB50 F&B FIRMS BY OWNERSHIP Private Equity companies own (or part own) companies in NZ with revenues in excess of $3billion
29 Source: various company annual reports, websites, NZCO; Coriolis analysis
COMPANY REVENUE NZ$m; FY2012
$730
$669
$471
$336
$293
$227
$171
$160
HJ Heinz NZ
T&G
Tegel
Inghams
Griffins Foods
Mr Apple/Scales
Vitaco Health
Hellers
-0.8%
3.7%
6.6%
5.0%
6.2%
2.0%
5.5%
0.0%
COMPANY REVENUE CHANGE NZ$m; FY2012 vs FY2011
Total $3b
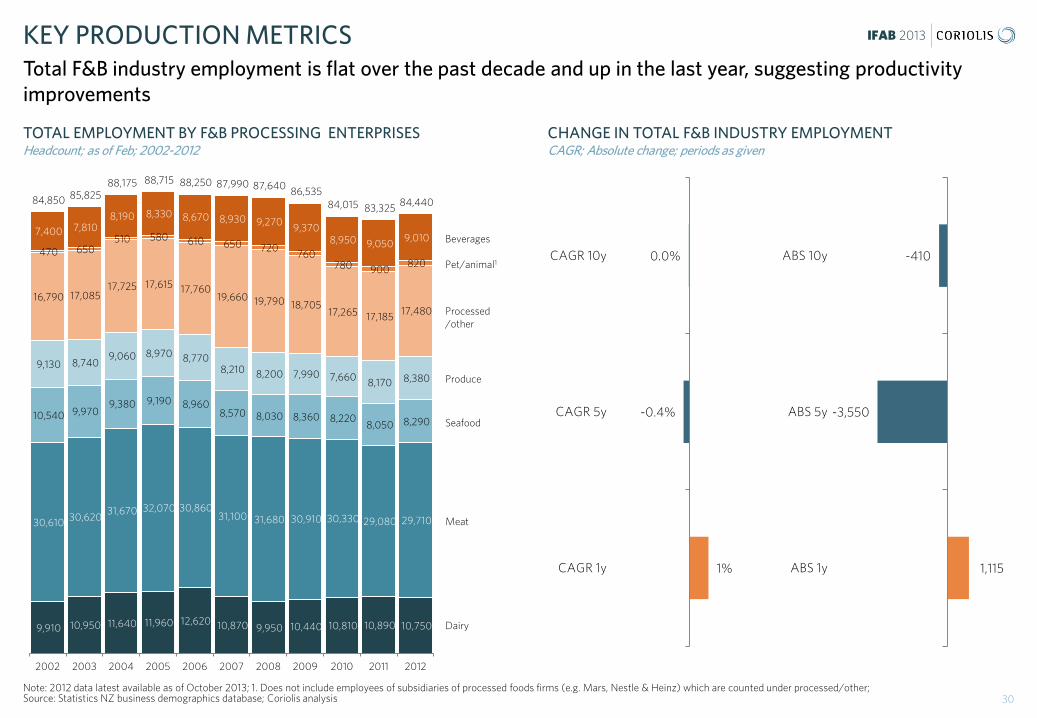
IFAB 2013 KEY PRODUCTION METRICS Total F&B industry employment is flat over the past decade and up in the last year, suggesting productivity improvements
TOTAL EMPLOYMENT BY F&B PROCESSING ENTERPRISES Headcount; as of Feb; 2002-2012
30 Note: 2012 data latest available as of October 2013; 1. Does not include employees of subsidiaries of processed foods firms (e.g. Mars, Nestle & Heinz) which are counted under processed/other; Source: Statistics NZ business demographics database; Coriolis analysis
CHANGE IN TOTAL F&B INDUSTRY EMPLOYMENT CAGR; Absolute change; periods as given
9,910 10,950 11,640 11,960 12,620 10,870 9,950 10,440 10,810 10,890 10,750
30,610 30,620 31,670 32,070 30,860
31,100 31,680 30,910 30,330 29,080 29,710
10,540 9,970 9,380 9,190 8,960
8,570 8,030 8,360 8,220 8,050 8,290
9,130 8,740 9,060 8,970 8,770
8,210 8,200 7,990 7,660 8,170 8,380
16,790 17,085 17,725 17,615 17,760
19,660 19,790 18,705 17,265 17,185 17,480
470 650 510 580 610 650 720
760 780 900
820
7,400 7,810 8,190 8,330 8,670 8,930 9,270 9,370
8,950 9,050 9,010
84,850 85,825 88,175 88,715 88,250 87,990 87,640 86,535
84,015 83,325 84,440
2002 2003 2004 2005 2006 2007 2008 2009 2010 2011 2012
Dairy
Meat
Seafood
Produce
Processed /other
Pet/animal1
Beverages
0.0%
-0.4%
1%
CAGR 10y
CAGR 5y
CAGR 1y
-410
-3,550
1,115
ABS 10y
ABS 5y
ABS 1y
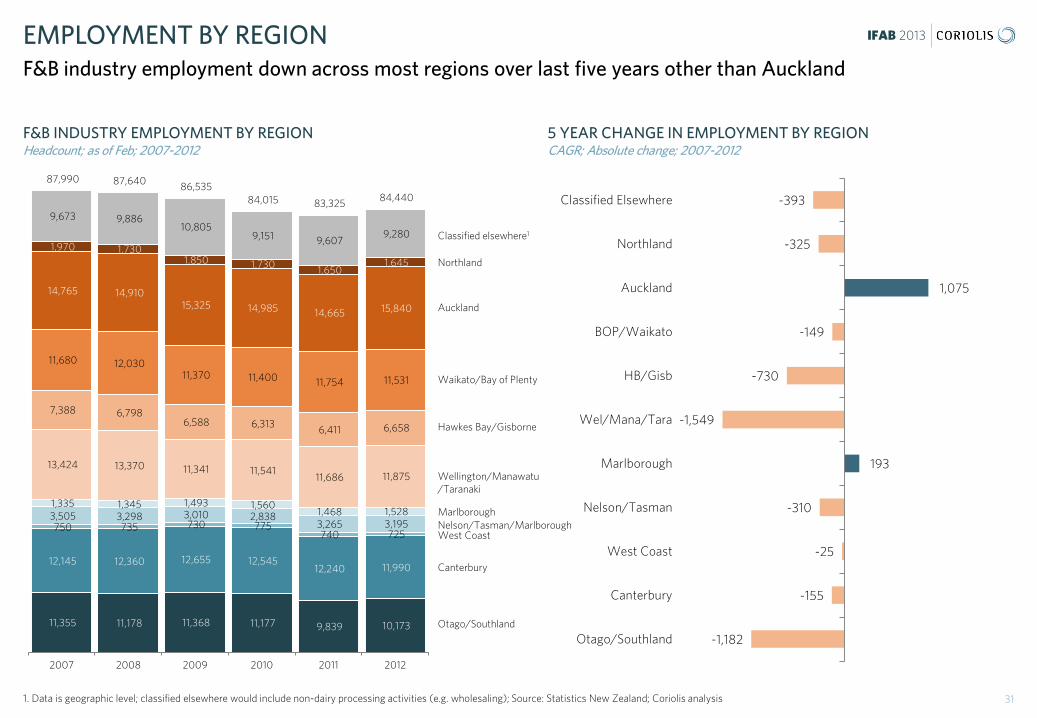
IFAB 2013 EMPLOYMENT BY REGION F&B industry employment down across most regions over last five years other than Auckland
F&B INDUSTRY EMPLOYMENT BY REGION Headcount; as of Feb; 2007-2012
5 YEAR CHANGE IN EMPLOYMENT BY REGION CAGR; Absolute change; 2007-2012
31 1. Data is geographic level; classified elsewhere would include non-dairy processing activities (e.g. wholesaling); Source: Statistics New Zealand; Coriolis analysis
Otago/Southland
Canterbury
West Coast Nelson/Tasman/Marlborough
Hawkes Bay/Gisborne
Waikato/Bay of Plenty
Auckland
Northland
Classified elsewhere1
Wellington/Manawatu/Taranaki
11,355 11,178 11,368 11,177 9,839 10,173
12,145 12,360 12,655 12,545 12,240 11,990
750 735 730 775 740 725
3,505 3,298 3,010 2,838 3,265 3,195
1,335 1,345 1,493 1,560 1,468 1,528
13,424 13,370 11,341 11,541 11,686 11,875
7,388 6,798 6,588 6,313 6,411 6,658
11,680 12,030 11,370 11,400 11,754 11,531
14,765 14,910 15,325 14,985 14,665 15,840
1,970 1,730 1,850 1,730 1,650
1,645
9,673 9,886 10,805
9,151 9,607 9,280
87,990 87,640 86,535 84,015 83,325 84,440
2007 2008 2009 2010 2011 2012
Marlborough
-1,182
-155
-25
-310
193
-1,549
-730
-149
1,075
-325
-393
Otago/Southland
Canterbury
West Coast
Nelson/Tasman
Marlborough
Wel/Mana/Tara
HB/Gisb
BOP/Waikato
Auckland
Northland
Classified Elsewhere
IFAB 2013
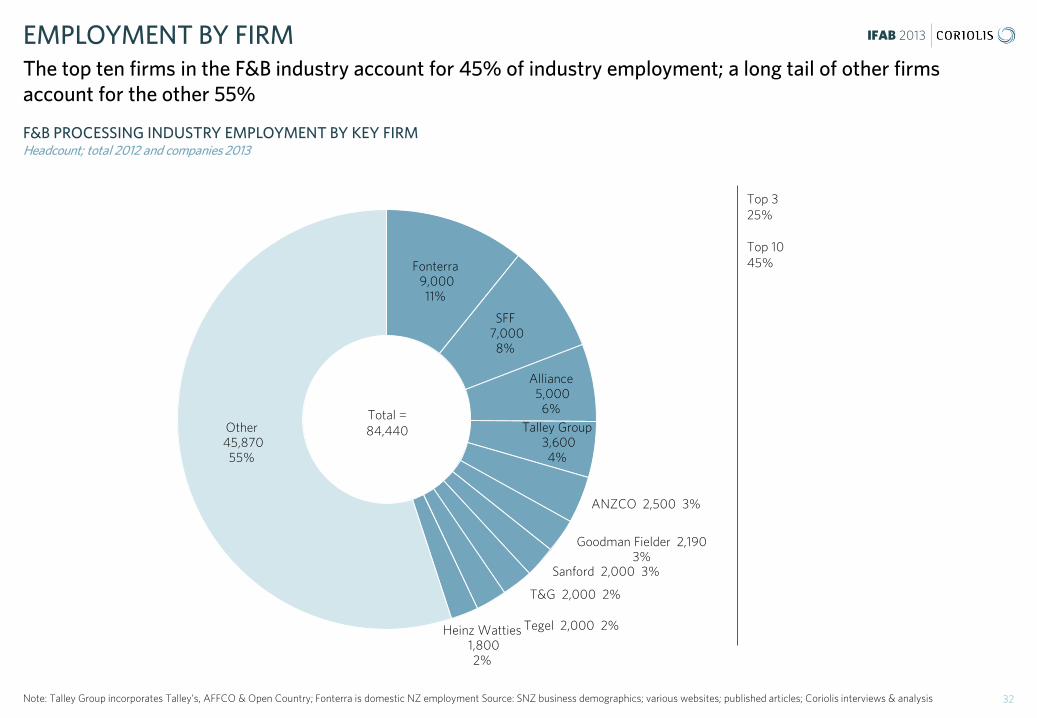
Fonterra 9,000
11%
SFF 7,000
8%
Alliance 5,000
6% Talley Group
3,600 4%
ANZCO 2,500 3%
Goodman Fielder 2,190 3%
Sanford 2,000 3%
T&G 2,000 2%
Tegel 2,000 2% Heinz Watties 1,800
2%
Other 45,870
55%
F&B PROCESSING INDUSTRY EMPLOYMENT BY KEY FIRM
Headcount; total 2012 and companies 2013
EMPLOYMENT BY FIRM The top ten firms in the F&B industry account for 45% of industry employment; a long tail of other firms account for the other 55%
32 Note: Talley Group incorporates Talley’s, AFFCO & Open Country; Fonterra is domestic NZ employment Source: SNZ business demographics; various websites; published articles; Coriolis interviews & analysis
Total = 84,440
Top 3 25% Top 10 45%
IFAB 2013
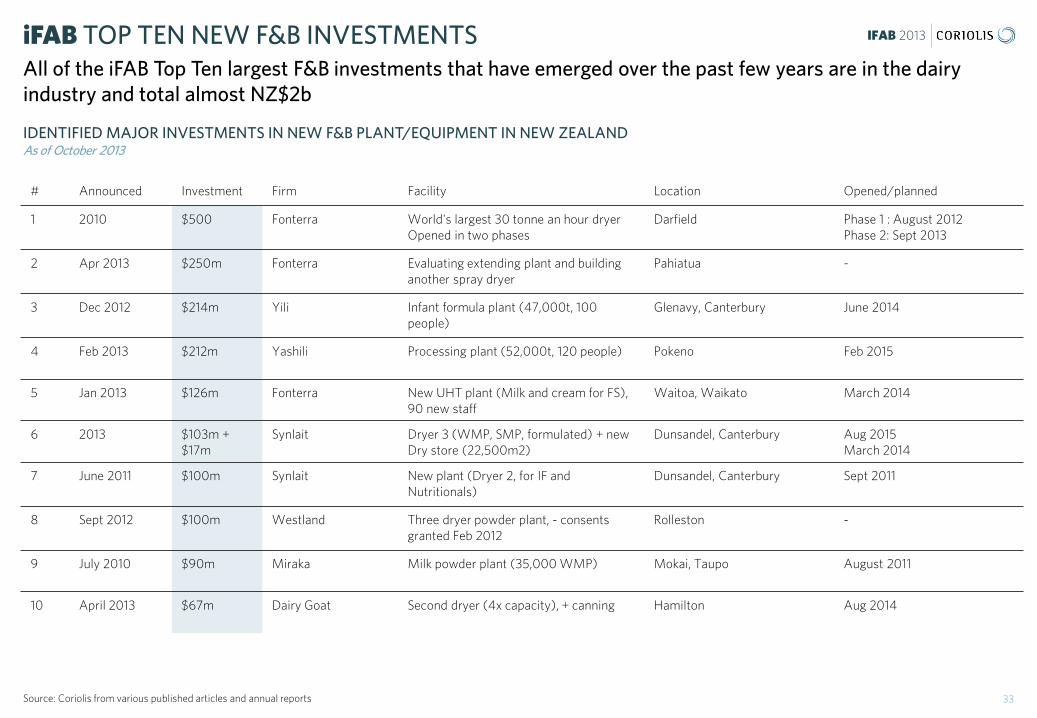
# Announced Investment Firm Facility Location Opened/planned
1 2010 $500 Fonterra World's largest 30 tonne an hour dryer Opened in two phases
Darfield Phase 1 : August 2012 Phase 2: Sept 2013
2 Apr 2013 $250m Fonterra Evaluating extending plant and building another spray dryer
Pahiatua -
3 Dec 2012 $214m Yili Infant formula plant (47,000t, 100 people)
Glenavy, Canterbury June 2014
4 Feb 2013
$212m Yashili Processing plant (52,000t, 120 people) Pokeno Feb 2015
5 Jan 2013 $126m Fonterra New UHT plant (Milk and cream for FS), 90 new staff
Waitoa, Waikato March 2014
6 2013 $103m + $17m
Synlait Dryer 3 (WMP, SMP, formulated) + new Dry store (22,500m2)
Dunsandel, Canterbury Aug 2015 March 2014
7 June 2011 $100m Synlait New plant (Dryer 2, for IF and Nutritionals)
Dunsandel, Canterbury Sept 2011
8 Sept 2012 $100m Westland Three dryer powder plant, - consents granted Feb 2012
Rolleston -
9 July 2010
$90m Miraka Milk powder plant (35,000 WMP) Mokai, Taupo August 2011
10 April 2013
$67m Dairy Goat Second dryer (4x capacity), + canning Hamilton Aug 2014
IDENTIFIED MAJOR INVESTMENTS IN NEW F&B PLANT/EQUIPMENT IN NEW ZEALAND As of October 2013
iFAB TOP TEN NEW F&B INVESTMENTS All of the iFAB Top Ten largest F&B investments that have emerged over the past few years are in the dairy industry and total almost NZ$2b
33 Source: Coriolis from various published articles and annual reports
IFAB 2013
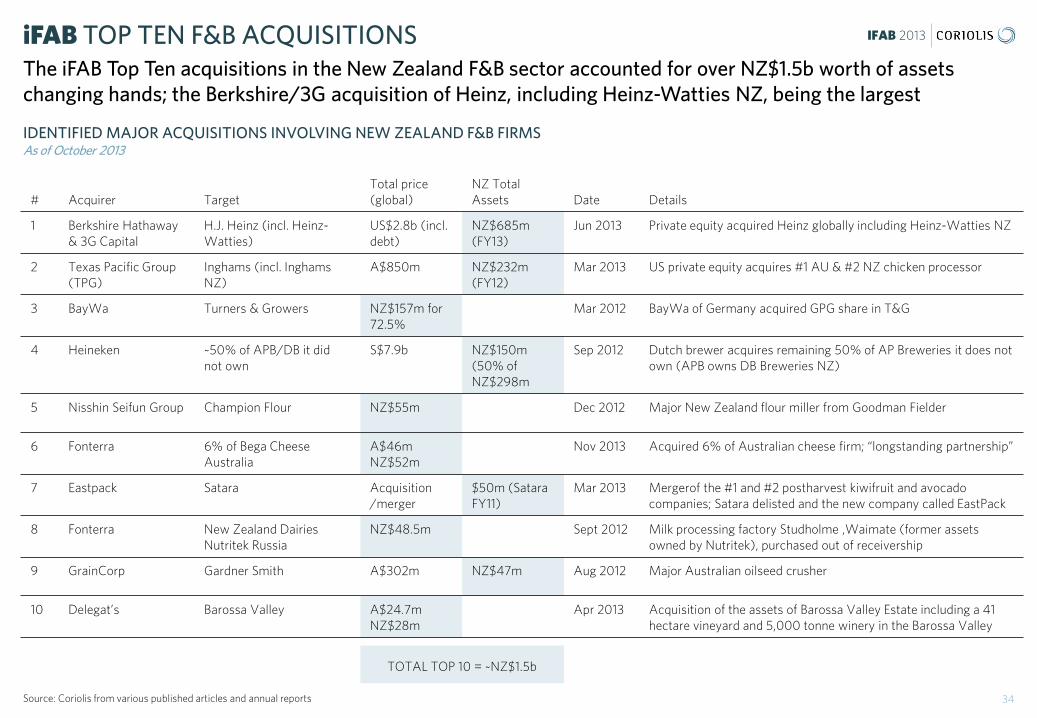
#
Acquirer
Target
Total price (global)
NZ Total Assets
Date
Details
1 Berkshire Hathaway & 3G Capital
H.J. Heinz (incl. Heinz-Watties)
US$2.8b (incl. debt)
NZ$685m (FY13)
Jun 2013 Private equity acquired Heinz globally including Heinz-Watties NZ
2 Texas Pacific Group (TPG)
Inghams (incl. Inghams NZ)
A$850m NZ$232m (FY12)
Mar 2013 US private equity acquires #1 AU & #2 NZ chicken processor
3 BayWa Turners & Growers NZ$157m for 72.5%
Mar 2012 BayWa of Germany acquired GPG share in T&G
4 Heineken ~50% of APB/DB it did not own
S$7.9b NZ$150m (50% of NZ$298m
Sep 2012 Dutch brewer acquires remaining 50% of AP Breweries it does not own (APB owns DB Breweries NZ)
5 Nisshin Seifun Group Champion Flour NZ$55m Dec 2012 Major New Zealand flour miller from Goodman Fielder
6 Fonterra 6% of Bega Cheese Australia
A$46m NZ$52m
Nov 2013 Acquired 6% of Australian cheese firm; “longstanding partnership”
7 Eastpack Satara Acquisition /merger
$50m (Satara FY11)
Mar 2013 Mergerof the #1 and #2 postharvest kiwifruit and avocado companies; Satara delisted and the new company called EastPack
8 Fonterra New Zealand Dairies Nutritek Russia
NZ$48.5m Sept 2012 Milk processing factory Studholme ,Waimate (former assets owned by Nutritek), purchased out of receivership
9 GrainCorp Gardner Smith A$302m NZ$47m Aug 2012 Major Australian oilseed crusher
10 Delegat’s Barossa Valley A$24.7m NZ$28m
Apr 2013 Acquisition of the assets of Barossa Valley Estate including a 41 hectare vineyard and 5,000 tonne winery in the Barossa Valley
IDENTIFIED MAJOR ACQUISITIONS INVOLVING NEW ZEALAND F&B FIRMS As of October 2013
iFAB TOP TEN F&B ACQUISITIONS The iFAB Top Ten acquisitions in the New Zealand F&B sector accounted for over NZ$1.5b worth of assets changing hands; the Berkshire/3G acquisition of Heinz, including Heinz-Watties NZ, being the largest
34 Source: Coriolis from various published articles and annual reports
TOTAL TOP 10 = ~NZ$1.5b

IFAB 2013
EUROPE
AMERICAS
AUSTRALIA
ASIA
FOREIGN INVESTORS The New Zealand F&B industry has attracted investment from a wide range of global leaders
35
IFAB 2013
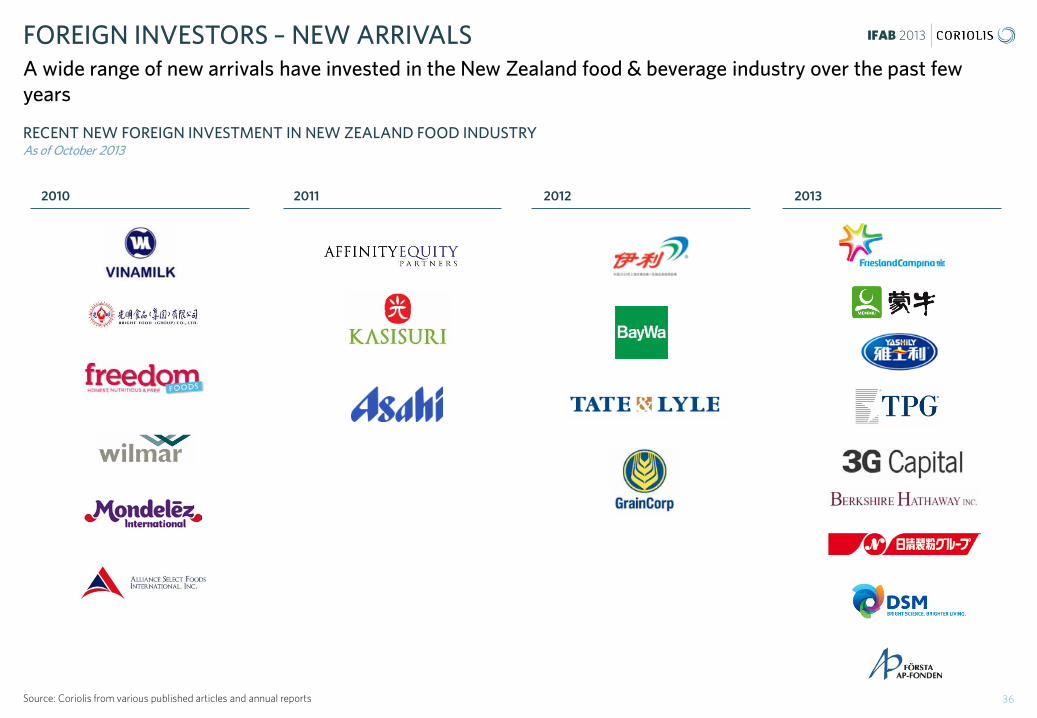
RECENT NEW FOREIGN INVESTMENT IN NEW ZEALAND FOOD INDUSTRY As of October 2013
FOREIGN INVESTORS – NEW ARRIVALS A wide range of new arrivals have invested in the New Zealand food & beverage industry over the past few years
36 Source: Coriolis from various published articles and annual reports
2010 2011 2012 2013

iFAB 2013
IFAB 2013
1 2 3 4
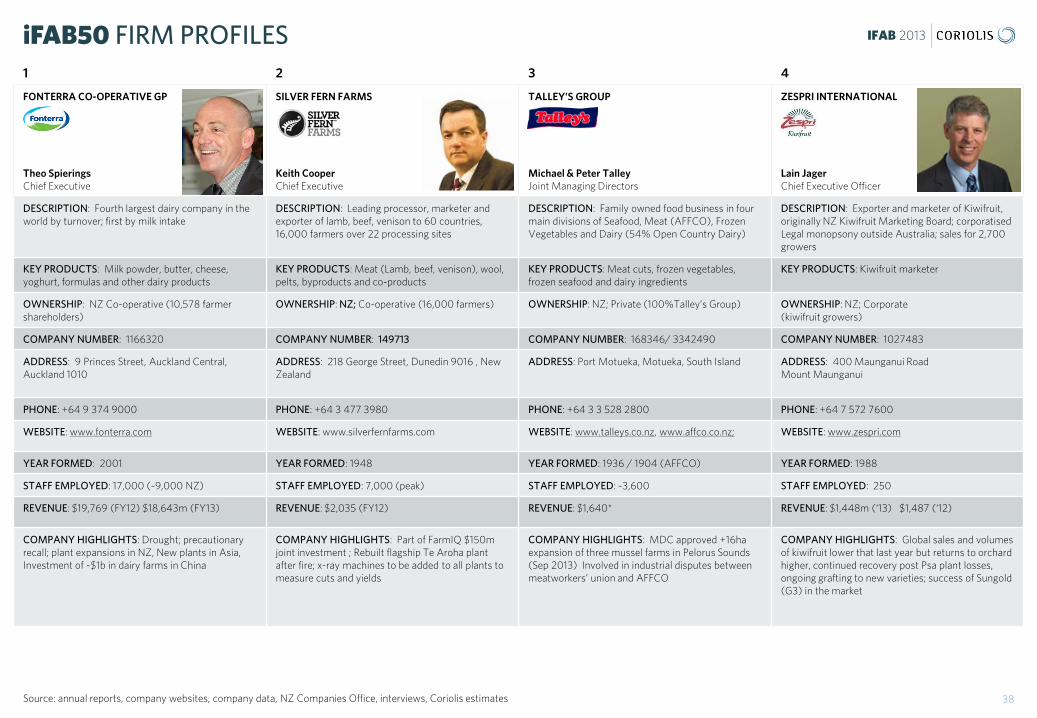
FONTERRA CO-OPERATIVE GP Theo Spierings Chief Executive
SILVER FERN FARMS Keith Cooper Chief Executive
TALLEY’S GROUP Michael & Peter Talley Joint Managing Directors
ZESPRI INTERNATIONAL Lain Jager Chief Executive Officer
DESCRIPTION: Fourth largest dairy company in the world by turnover; first by milk intake
DESCRIPTION: Leading processor, marketer and exporter of lamb, beef, venison to 60 countries, 16,000 farmers over 22 processing sites
DESCRIPTION: Family owned food business in four main divisions of Seafood, Meat (AFFCO), Frozen Vegetables and Dairy (54% Open Country Dairy)
DESCRIPTION: Exporter and marketer of Kiwifruit, originally NZ Kiwifruit Marketing Board; corporatised Legal monopsony outside Australia; sales for 2,700 growers
KEY PRODUCTS: Milk powder, butter, cheese, yoghurt, formulas and other dairy products
KEY PRODUCTS: Meat (Lamb, beef, venison), wool, pelts, byproducts and co-products
KEY PRODUCTS: Meat cuts, frozen vegetables, frozen seafood and dairy ingredients
KEY PRODUCTS: Kiwifruit marketer
OWNERSHIP: NZ Co-operative (10,578 farmer shareholders)
OWNERSHIP: NZ; Co-operative (16,000 farmers) OWNERSHIP: NZ; Private (100%Talley’s Group) OWNERSHIP: NZ; Corporate (kiwifruit growers)
COMPANY NUMBER: 1166320 COMPANY NUMBER: 149713 COMPANY NUMBER: 168346/ 3342490 COMPANY NUMBER: 1027483
ADDRESS: 9 Princes Street, Auckland Central, Auckland 1010
ADDRESS: 218 George Street, Dunedin 9016 , New Zealand
ADDRESS: Port Motueka, Motueka, South Island
ADDRESS: 400 Maunganui Road Mount Maunganui
PHONE: +64 9 374 9000 PHONE: +64 3 477 3980 PHONE: +64 3 3 528 2800 PHONE: +64 7 572 7600
WEBSITE: www.fonterra.com WEBSITE: www.silverfernfarms.com WEBSITE: www.talleys.co.nz, www.affco.co.nz; WEBSITE: www.zespri.com
YEAR FORMED: 2001 YEAR FORMED: 1948 YEAR FORMED: 1936 / 1904 (AFFCO) YEAR FORMED: 1988
STAFF EMPLOYED: 17,000 (~9,000 NZ) STAFF EMPLOYED: 7,000 (peak) STAFF EMPLOYED: ~3,600 STAFF EMPLOYED: 250
REVENUE: $19,769 (FY12) $18,643m (FY13) REVENUE: $2,035 (FY12) REVENUE: $1,640* REVENUE: $1,448m (‘13) $1,487 (‘12)
COMPANY HIGHLIGHTS: Drought; precautionary recall; plant expansions in NZ, New plants in Asia, Investment of ~$1b in dairy farms in China
COMPANY HIGHLIGHTS: Part of FarmIQ $150m joint investment ; Rebuilt flagship Te Aroha plant after fire; x-ray machines to be added to all plants to measure cuts and yields
COMPANY HIGHLIGHTS: MDC approved +16ha expansion of three mussel farms in Pelorus Sounds (Sep 2013) Involved in industrial disputes between meatworkers’ union and AFFCO
COMPANY HIGHLIGHTS: Global sales and volumes of kiwifruit lower that last year but returns to orchard higher, continued recovery post Psa plant losses, ongoing grafting to new varieties; success of Sungold (G3) in the market
38 Source: annual reports, company websites, company data, NZ Companies Office, interviews, Coriolis estimates
iFAB50 FIRM PROFILES

IFAB 2013
5 6 7 8
ALLIANCE GROUP Grant Cuff Chief Executive
ANZCO FOODS Mark Clarkson Managing Director
GOODMAN FIELDER NZ LTD Peter Reidie Managing Director GFNZ
HEINZ WATTIES Michael Gibson Chief Executive Officer
DESCRIPTION: Processor of lamb, sheep, beef and venison; 5,000 farmers send to 8 plants
DESCRIPTION: Vertically integrated farming and manufacturing facilities; leading exporter of beef and sheep meat over 11 sites
DESCRIPTION: Manufacture, marketing and distribution of food and dairy products in NZ, Australia and Asia-Pacific
DESCRIPTION: two plants in Hawkes Bay, 1 Canterbury producing processed vegetables, foods, sauces
KEY PRODUCTS: Lamb, sheep, beef and venison meat cuts, byproducts and co-products
KEY PRODUCTS: Beef, lamb, sheep meat, healthcare solutions, offals and co-products, prepared and gourmet foods
KEY PRODUCTS: Baking, dairy, meals, bread, biscuits, smallgoods, dressings
KEY PRODUCTS: Frozen vegetables, sauce, soups, jams, meals, processed meat-based foods, petfood
OWNERSHIP: NZ; Co-operative (5,000 farmers) OWNERSHIP: NZ/Japan (Itoham 48%; Nippon 25.1%; Harrison 12.6%; JANZ 11.7%; others)
OWNERSHIP: Australia: Public (ASX/NZX) wholly owned subsidiary of Goodman Fielder Ltd
OWNERSHIP: USA: Private (HJ Heinz; Berkshire Hathaway & 3G Capital)
COMPANY NUMBER: 154786 COMPANY NUMBER: 656378 COMPANY NUMBER: 1508360 COMPANY NUMBER: 540128 562309 (H.J Heinz Company (NZ) Ltd
ADDRESS: 51 Don Street, Invercargill ADDRESS: Unit 2, 49 Sir William Pickering Drive, Harewood, Christchurch
ADDRESS: 2/8 Nelson Street, Auckland Central, Auckland
ADDRESS: 46 Parnell Road, Parnell, Auckland
PHONE: +64 3 214 2700 PHONE: +64 3 358 2200 PHONE: +64 9 301 6000 PHONE: +64 9 308 5000
WEBSITE: www. alliance.co.nz WEBSITE: www.anzcofoods.com; www.cmp.co.nz; www.riverlands.co.nz
WEBSITE: www.goodmanfielder.com.au www.goodmanfielder.co.nz
WEBSITE: www.heinzwatties.co.nz
YEAR FORMED: 1948 YEAR FORMED: 1984/1995 YEAR FORMED: 1968 / 1986 YEAR FORMED: 1934/1992
STAFF EMPLOYED: 5,000 STAFF EMPLOYED: 2,500 STAFF EMPLOYED: 2,190 total STAFF EMPLOYED: 1,800
REVENUE: $1,371 (FY12) REVENUE: $1,212 (FY12) REVENUE: Total NZ$1,088m (FY12) segmented into processed, milling $542m; dairy, meat, oils $546m
REVENUE: $730m (FY12) $773 (FY13)
COMPANY HIGHLIGHTS: $57m operating loss for 2012, first loss in 20 years. Closed Sockburn (CHCH) plant in 2012, cease sheep operations at Mataura; Using “Pure South” as umbrella brand for beef, lamb and venison; Secured deal with Marks and Spencer’s (UK)
COMPANY HIGHLIGHTS: pre-tax loss of $25.6m in 2012; Partnering with Waitrose (UK); Developing pharmaceutical, nutraceutical products for healthcare sector
COMPANY HIGHLIGHTS: In 2012 announced selling Integro Foods and NZ Milling business to focus on core business; Wilmar acquires 10.1% of GF in 2012
COMPANY HIGHLIGHTS: Decision in 2011 by Heinz to move manufacturing of select processed vegetables and sauces from AU to NZ; 2013 shift infant formula production from England to NZ, parent HJ Heinz acquired by Warrens Buffett’s Berkshire Capital and 3G Capital for US$28b
39 Source: annual reports, company websites, company data, NZ Companies Office, interviews, Coriolis estimates
iFAB50 FIRM PROFILES
IFAB 2013
9 10 11 12
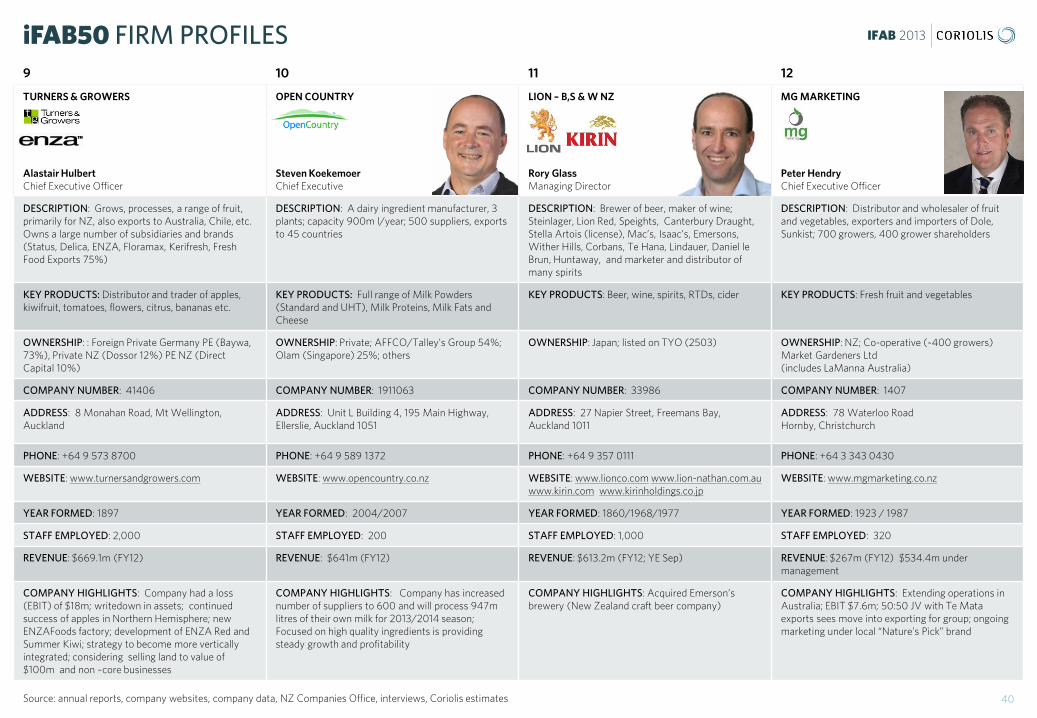
TURNERS & GROWERS Alastair Hulbert Chief Executive Officer
OPEN COUNTRY Steven Koekemoer Chief Executive
LION – B,S & W NZ Rory Glass Managing Director
MG MARKETING Peter Hendry Chief Executive Officer
DESCRIPTION: Grows, processes, a range of fruit, primarily for NZ, also exports to Australia, Chile, etc. Owns a large number of subsidiaries and brands (Status, Delica, ENZA, Floramax, Kerifresh, Fresh Food Exports 75%)
DESCRIPTION: A dairy ingredient manufacturer, 3 plants; capacity 900m l/year; 500 suppliers, exports to 45 countries
DESCRIPTION: Brewer of beer, maker of wine; Steinlager, Lion Red, Speights, Canterbury Draught, Stella Artois (license), Mac’s, Isaac’s, Emersons, Wither Hills, Corbans, Te Hana, Lindauer, Daniel le Brun, Huntaway, and marketer and distributor of many spirits
DESCRIPTION: Distributor and wholesaler of fruit and vegetables, exporters and importers of Dole, Sunkist; 700 growers, 400 grower shareholders
KEY PRODUCTS: Distributor and trader of apples, kiwifruit, tomatoes, flowers, citrus, bananas etc.
KEY PRODUCTS: Full range of Milk Powders (Standard and UHT), Milk Proteins, Milk Fats and Cheese
KEY PRODUCTS: Beer, wine, spirits, RTDs, cider KEY PRODUCTS: Fresh fruit and vegetables
OWNERSHIP: : Foreign Private Germany PE (Baywa, 73%), Private NZ (Dossor 12%) PE NZ (Direct Capital 10%)
OWNERSHIP: Private; AFFCO/Talley’s Group 54%; Olam (Singapore) 25%; others
OWNERSHIP: Japan; listed on TYO (2503) OWNERSHIP: NZ; Co-operative (~400 growers) Market Gardeners Ltd (includes LaManna Australia)
COMPANY NUMBER: 41406 COMPANY NUMBER: 1911063 COMPANY NUMBER: 33986 COMPANY NUMBER: 1407
ADDRESS: 8 Monahan Road, Mt Wellington, Auckland
ADDRESS: Unit L Building 4, 195 Main Highway, Ellerslie, Auckland 1051
ADDRESS: 27 Napier Street, Freemans Bay, Auckland 1011
ADDRESS: 78 Waterloo Road Hornby, Christchurch
PHONE: +64 9 573 8700 PHONE: +64 9 589 1372 PHONE: +64 9 357 0111 PHONE: +64 3 343 0430
WEBSITE: www.turnersandgrowers.com WEBSITE: www.opencountry.co.nz WEBSITE: www.lionco.com www.lion-nathan.com.au www.kirin.com www.kirinholdings.co.jp
WEBSITE: www.mgmarketing.co.nz
YEAR FORMED: 1897 YEAR FORMED: 2004/2007 YEAR FORMED: 1860/1968/1977 YEAR FORMED: 1923 / 1987
STAFF EMPLOYED: 2,000 STAFF EMPLOYED: 200 STAFF EMPLOYED: 1,000 STAFF EMPLOYED: 320
REVENUE: $669.1m (FY12) REVENUE: $641m (FY12) REVENUE: $613.2m (FY12; YE Sep) REVENUE: $267m (FY12) $534.4m under management
COMPANY HIGHLIGHTS: Company had a loss (EBIT) of $18m; writedown in assets; continued success of apples in Northern Hemisphere; new ENZAFoods factory; development of ENZA Red and Summer Kiwi; strategy to become more vertically integrated; considering selling land to value of $100m and non –core businesses
COMPANY HIGHLIGHTS: Company has increased number of suppliers to 600 and will process 947m litres of their own milk for 2013/2014 season; Focused on high quality ingredients is providing steady growth and profitability
COMPANY HIGHLIGHTS: Acquired Emerson’s brewery (New Zealand craft beer company)
COMPANY HIGHLIGHTS: Extending operations in Australia; EBIT $7.6m; 50:50 JV with Te Mata exports sees move into exporting for group; ongoing marketing under local “Nature’s Pick” brand
40 Source: annual reports, company websites, company data, NZ Companies Office, interviews, Coriolis estimates
iFAB50 FIRM PROFILES

IFAB 2013
13 14 15 16
WESTLAND Rod Quin Chief Executive
HAWKES BAY MEAT CO. + PROGRESSIVE MEATS Craig Hickson Owner, Director
COCA-COLA HOLDINGS NZ Barry O’Connell Managing Director
SEALORD Graham Stuart Chief Executive Officer
DESCRIPTION: Regional dairy cooperative based in West Coast region; expanding into Canterbury, 4% milk supply
DESCRIPTION: Multi business processors and marketers of lamb (some venison) over four locations in the North Island; HBMC owns Ovation New Zealand 100%, TeKuiti Meats, 100% Lamb Packers Fielding 100%, Pasture Petfoods (37%), Progressive Leathers; Progressive Meats (toll processor)
DESCRIPTION: Manufacturer and distributor of juice and soft drinks; many brands under license from Coca-Cola USA
DESCRIPTION: Vertically integrated seafood fishing and marketing company exporting to over 60 countries, significant global investments
KEY PRODUCTS: Milk powders, milk proteins, growing up milk powder, butter, base IF, bioactives, ‘own made’ yoghurt “Easiyo”, other dairy products
KEY PRODUCTS: Lamb cuts, co-products , ingredients, mechanically deboned meat (MDM), Petfood ingredients
KEY PRODUCTS: Soft drinks, juices, water KEY PRODUCTS: Frozen and chilled fish, oysters, mussels and other prepared seafood products
OWNERSHIP: New Zealand; cooperative (380+ farmers)
OWNERSHIP: Private (Hickson (majority) and others)
OWNERSHIP: Australia; listed on ASX OWNERSHIP: Kura Limited 100% NZ: Aotearoa Fisheries 50%, Japan: Nippon Suisan Kaisha 50%
COMPANY NUMBER: 153032 COMPANY NUMBER: 1894570/252512/600768/ 36215
COMPANY NUMBER: 440039 COMPANY NUMBER: 168963 / 1097137
ADDRESS: 56 Livingstone Street, Hokitika, 7810 , New Zealand
ADDRESS: 10 Cook Street, Waipukurau 4242, New Zealand
ADDRESS: The Oasis, Mt Wellington Private Bag 14916, Panmure Auckland
ADDRESS: Level 3, Building 8 666 Central Park, Ellerslie, Auckland
PHONE: +64 3 756 9800 PHONE: +64 7 878 6045 +64 6 873 9090 PHONE: +64 9 570 3000 PHONE: +64 9 579 1659
WEBSITE: www.westland.co.nz www.easiyo.com
WEBSITE: www.tkmeats.co.nz; www.ovation.co.nz WEBSITE: ccamatil.co.nz ccamatil.com
WEBSITE: www.sealord.com/nz
YEAR FORMED: 1937 YEAR FORMED: 1980 YEAR FORMED: 1939/1948 YEAR FORMED: 1974
STAFF EMPLOYED: 400 STAFF EMPLOYED: 1,300 STAFF EMPLOYED: 1,100 STAFF EMPLOYED: 1,100 (+400 offshore)
REVENUE: $534m (FY12) $535 (FY13) REVENUE: ~$500m REVENUE: $494m (FY12; YE Dec) REVENUE: $487 (FY12)
COMPANY HIGHLIGHTS: Commissioned a Nutritional wet products plant in Hokitika during 2013 and gained resource consents for new Rolleston plant
COMPANY HIGHLIGHTS: HBMC acquired 100% share in TeKuiti Meats in 2012; Acquired Welsh meat processing company in 2012
COMPANY HIGHLIGHTS: New MD; $15m investment in beverage bottle plant in Christchurch; parent acquired Fijian brewer
COMPANY HIGHLIGHTS: New brand campaign; exits all of Argentinian fishing business Yuken; part of Precision Harvesting project to target fish
41 Source: annual reports, company websites, company data, NZ Companies Office, interviews, Coriolis estimates
iFAB50 FIRM PROFILES
IFAB 2013
17 18 19 20
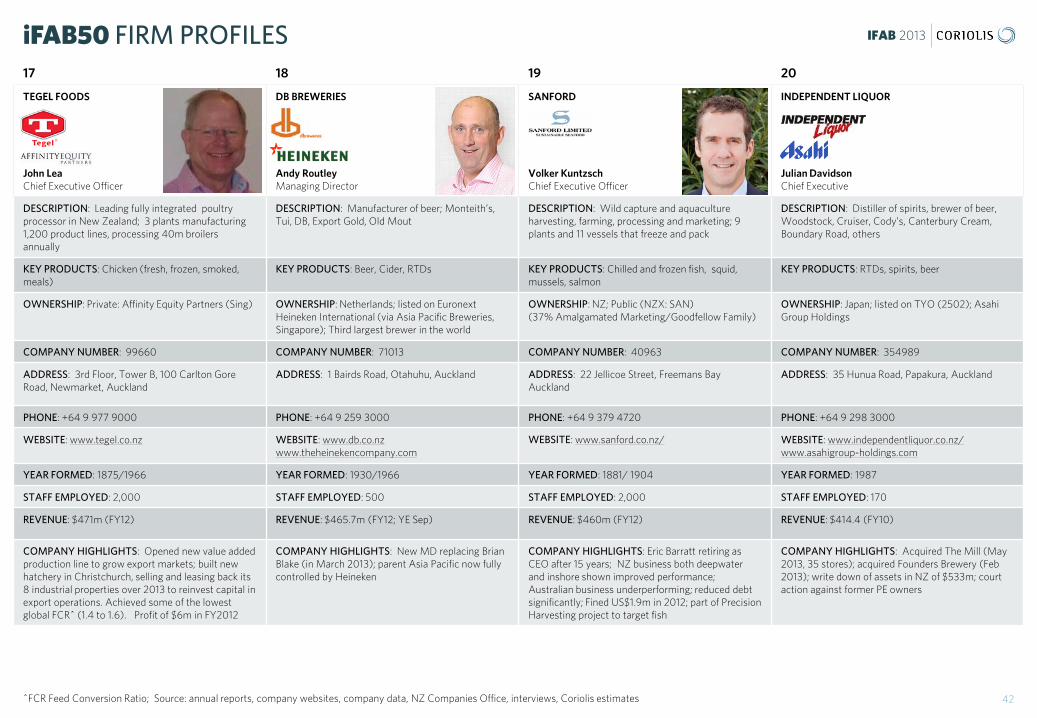
TEGEL FOODS John Lea Chief Executive Officer
DB BREWERIES Andy Routley Managing Director
SANFORD Volker Kuntzsch Chief Executive Officer
INDEPENDENT LIQUOR Julian Davidson Chief Executive
DESCRIPTION: Leading fully integrated poultry processor in New Zealand; 3 plants manufacturing 1,200 product lines, processing 40m broilers annually
DESCRIPTION: Manufacturer of beer; Monteith’s, Tui, DB, Export Gold, Old Mout
DESCRIPTION: Wild capture and aquaculture harvesting, farming, processing and marketing; 9 plants and 11 vessels that freeze and pack
DESCRIPTION: Distiller of spirits, brewer of beer, Woodstock, Cruiser, Cody’s, Canterbury Cream, Boundary Road, others
KEY PRODUCTS: Chicken (fresh, frozen, smoked, meals)
KEY PRODUCTS: Beer, Cider, RTDs KEY PRODUCTS: Chilled and frozen fish, squid, mussels, salmon
KEY PRODUCTS: RTDs, spirits, beer
OWNERSHIP: Private: Affinity Equity Partners (Sing) OWNERSHIP: Netherlands; listed on Euronext Heineken International (via Asia Pacific Breweries, Singapore); Third largest brewer in the world
OWNERSHIP: NZ; Public (NZX: SAN) (37% Amalgamated Marketing/Goodfellow Family)
OWNERSHIP: Japan; listed on TYO (2502); Asahi Group Holdings
COMPANY NUMBER: 99660 COMPANY NUMBER: 71013 COMPANY NUMBER: 40963 COMPANY NUMBER: 354989
ADDRESS: 3rd Floor, Tower B, 100 Carlton Gore Road, Newmarket, Auckland
ADDRESS: 1 Bairds Road, Otahuhu, Auckland ADDRESS: 22 Jellicoe Street, Freemans Bay Auckland
ADDRESS: 35 Hunua Road, Papakura, Auckland
PHONE: +64 9 977 9000 PHONE: +64 9 259 3000 PHONE: +64 9 379 4720 PHONE: +64 9 298 3000
WEBSITE: www.tegel.co.nz WEBSITE: www.db.co.nz www.theheinekencompany.com
WEBSITE: www.sanford.co.nz/ WEBSITE: www.independentliquor.co.nz/ www.asahigroup-holdings.com
YEAR FORMED: 1875/1966 YEAR FORMED: 1930/1966 YEAR FORMED: 1881/ 1904 YEAR FORMED: 1987
STAFF EMPLOYED: 2,000 STAFF EMPLOYED: 500 STAFF EMPLOYED: 2,000 STAFF EMPLOYED: 170
REVENUE: $471m (FY12) REVENUE: $465.7m (FY12; YE Sep) REVENUE: $460m (FY12) REVENUE: $414.4 (FY10)
COMPANY HIGHLIGHTS: Opened new value added production line to grow export markets; built new hatchery in Christchurch, selling and leasing back its 8 industrial properties over 2013 to reinvest capital in export operations. Achieved some of the lowest global FCR^ (1.4 to 1.6). Profit of $6m in FY2012
COMPANY HIGHLIGHTS: New MD replacing Brian Blake (in March 2013); parent Asia Pacific now fully controlled by Heineken
COMPANY HIGHLIGHTS: Eric Barratt retiring as CEO after 15 years; NZ business both deepwater and inshore shown improved performance; Australian business underperforming; reduced debt significantly; Fined US$1.9m in 2012; part of Precision Harvesting project to target fish
COMPANY HIGHLIGHTS: Acquired The Mill (May 2013, 35 stores); acquired Founders Brewery (Feb 2013); write down of assets in NZ of $533m; court action against former PE owners
42 ^FCR Feed Conversion Ratio; Source: annual reports, company websites, company data, NZ Companies Office, interviews, Coriolis estimates
iFAB50 FIRM PROFILES
IFAB 2013
21 22 23 24
FRUCOR BEVERAGES Carl Bergstrom Group Managing Director
NESTLE NZ Veronique Cremades-Mathis Country Manager & CEO
SYNLAIT MILK LIMITED John Penno Managing Director
NUTRICIA NZ Mark Mitchell Manufacturing Director
DESCRIPTION: Manufacturer of soft drinks, juices and other beverages; V, Just Juice, Citrus Tree, Mizone, others
DESCRIPTION: Manufacturer and Importer of Culinary, Confectionery, Beverages, Milks, Breakfast cereals, Snacks, Infant Nutrition and Petfood products. HO in Auckland, 3 regional sales offices; 3 factories: Culinary, Confectionery and Petfood.
DESCRIPTION: Synlait Milk is a Canterbury based dairy manufacturer focussed on supplying higher value dairy products to leading milk-based health and nutrition companies
DESCRIPTION: Manufacturer of infant formula
KEY PRODUCTS: Soft drinks, juice, water KEY PRODUCTSCoffee, Tea, Nourishing drink, Creamer, Chocolate, Confectionery, Culinary, Snacks, Breakfast cereals, Infant Nutrition, Milks and Petfood
KEY PRODUCTS: Infant and adult nutritional formulations, Milk powders (WMP, SMP) functional food ingredients, and specialised products
KEY PRODUCTS: Infant formula and related dairy nutritionals
OWNERSHIP: Japan; private; Suntory Holdings (90% Kotobuki Realty; Torii family; others)
OWNERSHIP: Swiss; public listed (Nestle) OWNERSHIP: New Zealand; listed on NZX; Bright (China) 39% ; Mitsui (Japan) 8%; Friesland (Netherlands) 7.5%
OWNERSHIP: France; Listed (Euro: BN)
COMPANY NUMBER: 913026 COMPANY NUMBER: 46423 COMPANY NUMBER: 1600872 COMPANY NUMBER: 711745
ADDRESS: 86 Plunket Avenue, Wiri, Auckland 2104 ADDRESS: Level 3 Buildings 1 & 2, Carlaw Park Commercial, 12-16 Nicholls Lane, Parnell, Auckland
ADDRESS: 1028 Heslerton Road, Rakaia, Rd 13 , New Zealand
ADDRESS: 37 Banks Road, Mount Wellington Auckland
PHONE: +64 9 250 0100 PHONE: +64 9 367 2800 PHONE: +64 3 373 3000 PHONE: +64 9 570 0970
WEBSITE: www.frucor.co.nz www.suntory.com WEBSITE: www.nestle.co.nz WEBSITE: www.synlait.com WEBSITE: www.nutriciababy.co.nz www.nutricia.co.nz www.danone.com
YEAR FORMED: 1987 YEAR FORMED: 1926 NZ YEAR FORMED: 2000/2005 YEAR FORMED: 1996
STAFF EMPLOYED: 900 STAFF EMPLOYED: 750 STAFF EMPLOYED: 130 (FY12), 171 (FY13) STAFF EMPLOYED: 100
REVENUE: $405.8m (FY12; YE Dec) REVENUE: $378m (FY12) REVENUE: $377 (FY12) $420 (FY13) REVENUE: $373m (FY12)
COMPANY HIGHLIGHTS: Parent Suntory went public in Japan as family owners sold down share (Jul 2013)
COMPANY HIGHLIGHTS: Integration of Wyeth Infant Nutrition acquired in December 2012; 2013 selling its Jenny Craig business (pending); Opening of Nespresso second boutique in Wellington
COMPANY HIGHLIGHTS: Went public in July 2013 $120m capital raising it restructure debt and reinvest; upgraded plant to produce spray dry lactoferrin
COMPANY HIGHLIGHTS: Impacted in 2013 by Fonterra’s WPC80 Precautionary Recall (Whey Protein Concentrate)
43 Source: annual reports, company websites, company data, NZ Companies Office, interviews, Coriolis estimates
iFAB50 FIRM PROFILES

IFAB 2013
25 26 27 28
INGHAMS ENTERPRISES NZ Adrian Revell Plant Manager
MONDELEZ NZ Alastair de Raadt Managing Director
NZ SUGAR COMPANY Bernard Duignan General Manager
WILSON HELLABY Fred Hellaby Managing Director
DESCRIPTION: Fully owned subsidiary of Inghams Australia, #2 Chicken and turkey processor in NZ, vertically integrated in NZ; includes 3 mills
DESCRIPTION: Global confectionery and dairy company; primarily confectionery manufacturing based in Dunedin
DESCRIPTION: Sugar refining company based in Auckland; Blends Sugar, dairy and other ingredients for export; importer and distributor of alternative sweeteners and oils
DESCRIPTION: Processing and further manufacturing of meat products at two plants in Auckland; rendering business and significant presence in domestic branded meat market
KEY PRODUCTS: Chicken meat, horse feed KEY PRODUCTS: chocolate, sweet/sugar confectionery
KEY PRODUCTS: Refined sugar, “Simply” oils and fats, “equal” artificial sweetener
KEY PRODUCTS: Processed beef, sheep, pig and goat frozen and chilled, processed meats and offal
OWNERSHIP: Private Equity Ingham Enterprise AU (TPG Private Equity)
OWNERSHIP: USA Public listed (MDLZ) OWNERSHIP: 75% Singapore; listed (Wilmar International) and 25% AU co-operative (Mackay Sugar)
OWNERSHIP: Private: (Syminton, Hellaby)
COMPANY NUMBER: 464829 COMPANY NUMBER: 204724 COMPANY NUMBER: 91943 / 3252111 COMPANY NUMBER: 900980
ADDRESS: 624 Waihekau Road, R D 1, Waitoa, 3380 , New Zealand
ADDRESS: 494 Rosebank Road, Avondale, Auckland 1026
ADDRESS: 60 Colonial Road, Birkenhead, Auckland ADDRESS: 131 Portage Road, Otahuhu, Auckland
PHONE: +64 7 884 6549 PHONE: +64 9 820 2600 PHONE: +64 9 481 0720 PHONE: +64 9 276 3800
WEBSITE: www.inghams.co.nz WEBSITE: www.cadbury.co.nz WEBSITE: www.chelsea.co.nz WEBSITE: www.wilsonhellaby.co.nz
YEAR FORMED: 1990 YEAR FORMED: 1868 / 1930 YEAR FORMED: 1884 YEAR FORMED: 1998
STAFF EMPLOYED: 1,043 STAFF EMPLOYED: 500 STAFF EMPLOYED: 180 STAFF EMPLOYED: 600
REVENUE: $336m (FY12) REVENUE: $320m (FY12) REVENUE: $301m (FY12) REVENUE: +$300m (FY12)
COMPANY HIGHLIGHTS: Profit of $30m in 2012; Transition to Ross 308 chicken stock in NZ
COMPANY HIGHLIGHTS: Cadbury changed name to Mondelez globally; 2012 amalgamation of Kraft, Cadbury & Natural Confectionery Co.
COMPANY HIGHLIGHTS: $21m profit on the back of increased exports and reduced costs; Wilmar acquired in 2010 via CSR’s Sucrogen business
COMPANY HIGHLIGHTS:
44 Source: annual reports, company websites, company data, NZ Companies Office, interviews, Coriolis estimates
iFAB50 FIRM PROFILES
IFAB 2013
29 30 31 32
GRIFFIN’S FOODS Ron Vela Chief Executive Officer/ Executive Chairman
GWF NZ General Manager – Baking Division NZ
TAYLOR PRESTON Simon Gatenby Chief Executive Officer
MCCAIN FOODS Louis Wolthers Regional President SANZAR
DESCRIPTION: Auckland based manufacturers and marketers of biscuits, salty snacks and muesli bars producing 200m units pa
DESCRIPTION: GWF Bread manufacturing at two bakeries, Weston Milling at three locations, Purity Foods (Big Ben) and Jasol (Cleaning products)
DESCRIPTION: Multispecies meat processors processing 1.5m animals annually, based in Wellington, exporting to 60 countries
DESCRIPTION: Frozen vegetable manufacturer based in Timaru (potato processing) and Hastings (vegetables); supplied by 150 growers
KEY PRODUCTS: biscuits,(Griffins, Huntley and Palmers…) chips (ETA), muesli bars (nice & natural)
KEY PRODUCTS: bread (Tip Top, Ploughmans, Burgen, Golden) Big Ben pies
KEY PRODUCTS: Sheep and beef meat cuts KEY PRODUCTS: Frozen vegetables and meals
OWNERSHIP: Australia; Private Equity: Pacific Equity Partners Fund III (PEP)
OWNERSHIP: UK; listed; Associated British Foods UK (Weston Family)
OWNERSHIP: Private (Taylor, Preston & Grace) OWNERSHIP: Canada: Private (McCain family)
COMPANY NUMBER: 4932 / NZ Snack Food Holdings 1774272
COMPANY NUMBER: 52216 COMPANY NUMBER: 1906031 COMPANY NUMBER: 459976
ADDRESS: Tower B Level 5, 100 Carlton Gore Road, Newmarket, Auckland
ADDRESS: Building 3, Level 2, 666 Great South Road Ellerslie, Auckland
ADDRESS: Centennial Highway, Ngauranga Gorge, Wellington
ADDRESS: Meadows Road, Washdyke, Timaru or Omahu Road, Hastings,
PHONE: +64 9 354 9500 PHONE: +64 9 919 3500 PHONE: +64 4 472 7987 PHONE: +64 6 873 9030
WEBSITE: www.griffins.co.nz WEBSITE: www.gwfbaking.co.nz WEBSITE: www.taylorpreston.co.nz WEBSITE: www.mccain.co.nz
YEAR FORMED: 1864 YEAR FORMED: 1950s YEAR FORMED: 1991 YEAR FORMED: 1987
STAFF EMPLOYED: 1,000 (850 FTE) STAFF EMPLOYED: 1,000 STAFF EMPLOYED: 800 STAFF EMPLOYED: 400-500 (seasonal)
REVENUE: $293 (FY12) REVENUE: $277 (FY12) REVENUE: $260m* (FY12) REVENUE: $246m (FY12)
COMPANY HIGHLIGHTS: $20.5m net profit for calendar year 2012; successful “Dear Griffin’s” campaign; international division now generating 30% of group turnover, exporting to over 26 countries. Invests $70m in Auckland plants to support growth
COMPANY HIGHLIGHTS: COMPANY HIGHLIGHTS: COMPANY HIGHLIGHTS: Holds McDonalds French fries contract; closes potato factory in Australia
45 Source: annual reports, company websites, company data, NZ Companies Office, interviews; *Coriolis estimates
iFAB50 FIRM PROFILES
IFAB 2013
33 34 35 36
PERNOD RICARD WINEMAKERS Fabian Partigliani Managing Director
GREENLEA PREMIER Tony Egan Managing Director
TATUA CO-OPERATIVE DAIRY Paul McGilvary Chief Executive
DELEGAT’S GROUP Jim Delegat Managing Director
DESCRIPTION: Wine maker and grower; Montana, Church Road, Deutz, Brancott Estate, Stoneleigh, Longridge ,
DESCRIPTION: Meat processor based in the Waikato
DESCRIPTION: Specialist dairy ingredients and food products manufacturer, 190ML of milkpa exports 94% of its products, exports to 60 countries
DESCRIPTION: Manufacturer of wine; Oyster Bay
KEY PRODUCTS: Wine, sparkling wine KEY PRODUCTS: Meat KEY PRODUCTS: specialist ingredients (Caseinate, whey proteins, AMF), nutritionals, whipped cream, specialty cheeses
KEY PRODUCTS: Wine
OWNERSHIP: France; listed on Euronext OWNERSHIP: New Zealand; Private (Egan family) OWNERSHIP: New Zealand; cooperative (108 farmers)
OWNERSHIP: New Zealand; listed on NZX:DGL (Delegat family ~66%)
COMPANY NUMBER: 86020 COMPANY NUMBER: 558256 COMPANY NUMBER: 173822 COMPANY NUMBER: 523716
ADDRESS: Level 5, 4 Viaduct Harbour Avenue Auckland Central, Auckland 1010
ADDRESSGreenlea Lane, Hamilton, Waikato ADDRESS: State Highway 26, Tatuanui, Waikato ADDRESS: Level 1, 10 Viaduct Harbour Avenue, Auckland
PHONE: +64 9 336 8300 PHONE: +64 9 359 7300 PHONE: +64 7 889 3999 PHONE: +64 9 359 7300
WEBSITE: www.pernod-ricard-nz.com WEBSITE: www.greenlea.co.nz/ WEBSITE: www.tatua.com WEBSITE: www.delegats.co.nz
YEAR FORMED: 1961 (Montana) YEAR FORMED:1992 YEAR FORMED: 1914 YEAR FORMED: 1947/1991
STAFF EMPLOYED: 750 STAFF EMPLOYED: 500 STAFF EMPLOYED: 280 STAFF EMPLOYED: 50
REVENUE: $235.9m (FY12) REVENUE: $230m* (FY12) REVENUE: $228m (FY12) REVENUE: $222m (FY12) $230m (FY13; YE June)
COMPANY HIGHLIGHTS: Changed name to Pernod Ricard Winemakers NZ; rebranded Montana as Brancott
COMPANY HIGHLIGHTS: COMPANY HIGHLIGHTS: Plans for a new speciality products drier worth $65m
COMPANY HIGHLIGHTS: Acquired Barossa Valley Estate in Australia; acquired 496ha in Marlborough and several vineyards in Hawkes Bay; case sales up +25% to North America; North America will be key growth region for the group for the next 6 years; Operating EBIT $44.6m
46 Source: annual reports, company websites, company data, NZ Companies Office, interviews; *Coriolis estimates
iFAB50 FIRM PROFILES
IFAB 2013
37 38 39 40
MR APPLE NZ Andrew van Workum Chief Executive Officer
VAN DEN BRINK POULTRY Karl van den Brink Managing Director
FRESH DIRECT LTD Peter Turner Managing Director
A.S. WILCOX & SONS Kevin Wilcox Managing Director
DESCRIPTION: #1 apple exporter; vertically integrated with 53 orchards, 3 packhouses, 1 coolstore and logistics service Part of the SCF receivership; Exported 4.2m cartons. Owns 10% T&G
DESCRIPTION: Vertically integrated poultry processor in New Zealand (#3) across three plants
DESCRIPTION: Fresh produce and flower wholesalers and importers; plus exporting via sister company JP Exports Ltd, and Purefresh Organics, Taste Zone, Turners Floral, Turners Produce, Valley Fresh companies
DESCRIPTION: Grower and distributor of Potatoes, onions, carrots, persimmons over 2,500 acres, includes export division Southern Fresh Produce, and Plains Produce and Potato supplies
KEY PRODUCTS: Apples KEY PRODUCTS: Chicken products primarily for domestic retail and foodservice
KEY PRODUCTS: Fresh flowers, fruit and vegetables (apples, blueberries, broccoli, oranges, tomatoes etc.) Purefresh brand
KEY PRODUCTS: Fresh potatoes, onions and carrots branded as Fresh Zone, Country Fresh, Field Fresh and Econo Pack
OWNERSHIP: NZ: Scales Corp (PE: Direct Capital 82.8%)
OWNERSHIP: NZ; Private: (Van Den Brink) OWNERSHIP: NZ; Private (Turner Family) OWNERSHIP: NZ; Private (Wilcox Family)
COMPANY NUMBER: 545180 COMPANY NUMBER: 66969 (others) COMPANY NUMBER: 668313 COMPANY NUMBER: 51206
ADDRESS: Station Road, Whakatu, Hawkes Bay ADDRESS: 652 Great South Road, Manukau, Auckland
ADDRESS: 29 Clemow Drive, Mount Wellington, Auckland
ADDRESS: 58 Union Road, Pukekohe Franklin, Auckland
PHONE: +64 6 873 1030 PHONE: +64 9 262 0903 PHONE: +64 9 573 4100 PHONE: +64 9 237 0740
WEBSITE: www.mrapple.co.nz; www.scalescorporation.co.nz
WEBSITE: www.brinks.co.nz WEBSITE: www.freshdirect.co.nz www.jpexports.co.nz/
WEBSITE: www.aswilcox.co.nz www.sofresh.co.nz
YEAR FORMED: 1998 YEAR FORMED: 1964 YEAR FORMED: 1995 YEAR FORMED: 1954
STAFF EMPLOYED: 220 -1700 (seasonal) STAFF EMPLOYED: ~400 STAFF EMPLOYED: 300+ STAFF EMPLOYED: 170
REVENUE: Gp sales $227 (FY12) Mr Apple ~$140m* (FY10 Gp $186m Mr Apple $116m 62%)
REVENUE: $220* (FY12) REVENUE: $150-200 (FY12) REVENUE: $150-$200* (FY12)
COMPANY HIGHLIGHTS: 2012 Gp sales $227m with 13.6m profit; Acquired 50% Fernridge apple business aim to increase consolidation in sector
COMPANY HIGHLIGHTS: Ownership of multiple companies with (Taylor and Van Den Brink); Tegel looking to acquire in 2009 but refused by Commerce Commission
COMPANY HIGHLIGHTS: Expanding warehousing and undergoing operational restructuring to gain efficiencies
COMPANY HIGHLIGHTS:
47 Source: annual reports, company websites, company data, NZ Companies Office, interviews; *Coriolis estimates
iFAB50 FIRM PROFILES
IFAB 2013
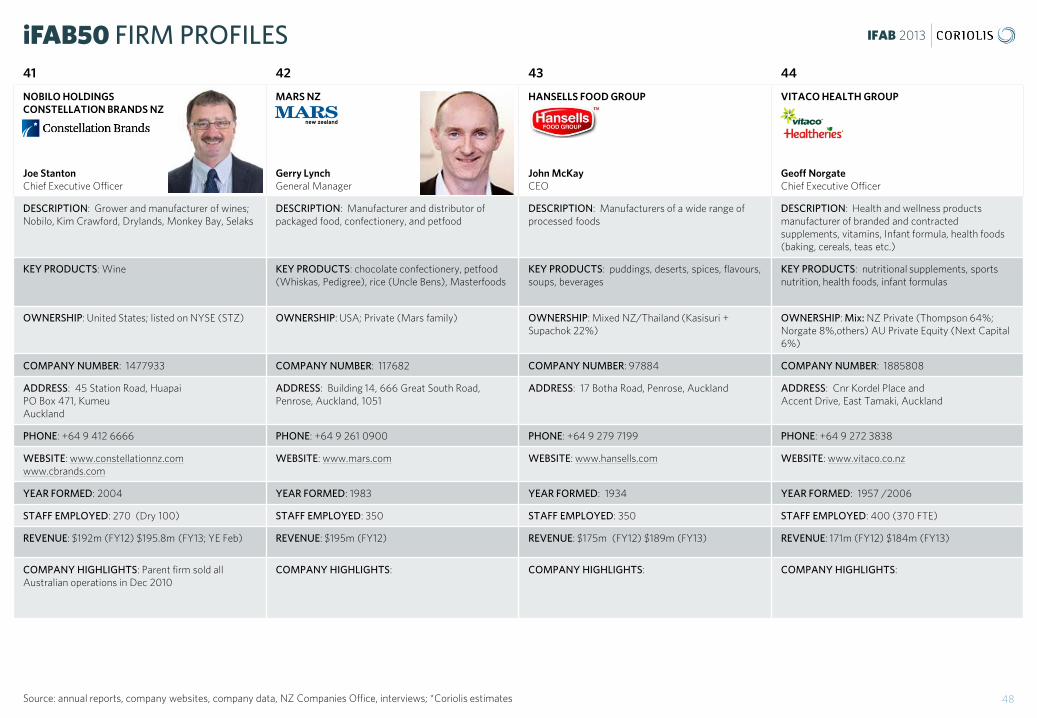
41 42 43 44
NOBILO HOLDINGS CONSTELLATION BRANDS NZ Joe Stanton Chief Executive Officer
MARS NZ Gerry Lynch General Manager
HANSELLS FOOD GROUP John McKay CEO
VITACO HEALTH GROUP Geoff Norgate Chief Executive Officer
DESCRIPTION: Grower and manufacturer of wines; Nobilo, Kim Crawford, Drylands, Monkey Bay, Selaks
DESCRIPTION: Manufacturer and distributor of packaged food, confectionery, and petfood
DESCRIPTION: Manufacturers of a wide range of processed foods
DESCRIPTION: Health and wellness products manufacturer of branded and contracted supplements, vitamins, Infant formula, health foods (baking, cereals, teas etc.)
KEY PRODUCTS: Wine KEY PRODUCTS: chocolate confectionery, petfood (Whiskas, Pedigree), rice (Uncle Bens), Masterfoods
KEY PRODUCTS: puddings, deserts, spices, flavours, soups, beverages
KEY PRODUCTS: nutritional supplements, sports nutrition, health foods, infant formulas
OWNERSHIP: United States; listed on NYSE (STZ) OWNERSHIP: USA; Private (Mars family) OWNERSHIP: Mixed NZ/Thailand (Kasisuri + Supachok 22%)
OWNERSHIP: Mix: NZ Private (Thompson 64%; Norgate 8%,others) AU Private Equity (Next Capital 6%)
COMPANY NUMBER: 1477933 COMPANY NUMBER: 117682 COMPANY NUMBER: 97884 COMPANY NUMBER: 1885808
ADDRESS: 45 Station Road, Huapai PO Box 471, Kumeu Auckland
ADDRESS: Building 14, 666 Great South Road, Penrose, Auckland, 1051
ADDRESS: 17 Botha Road, Penrose, Auckland ADDRESS: Cnr Kordel Place and Accent Drive, East Tamaki, Auckland
PHONE: +64 9 412 6666 PHONE: +64 9 261 0900 PHONE: +64 9 279 7199 PHONE: +64 9 272 3838
WEBSITE: www.constellationnz.com www.cbrands.com
WEBSITE: www.mars.com WEBSITE: www.hansells.com WEBSITE: www.vitaco.co.nz
YEAR FORMED: 2004 YEAR FORMED: 1983 YEAR FORMED: 1934 YEAR FORMED: 1957 /2006
STAFF EMPLOYED: 270 (Dry 100) STAFF EMPLOYED: 350 STAFF EMPLOYED: 350 STAFF EMPLOYED: 400 (370 FTE)
REVENUE: $192m (FY12) $195.8m (FY13; YE Feb) REVENUE: $195m (FY12) REVENUE: $175m (FY12) $189m (FY13) REVENUE: 171m (FY12) $184m (FY13)
COMPANY HIGHLIGHTS: Parent firm sold all Australian operations in Dec 2010
COMPANY HIGHLIGHTS:
COMPANY HIGHLIGHTS: COMPANY HIGHLIGHTS:
48 Source: annual reports, company websites, company data, NZ Companies Office, interviews; *Coriolis estimates
iFAB50 FIRM PROFILES

IFAB 2013
45 46 47 48
HELLERS LTD Nick Harris Managing Director
AOTEAROA FISHERIES Carl Carrington Chief Executive Officer
CEREBOS GREGG’S Andre Gargiulo Country Manager - NZ
SANITARIUM HEALTH AND WELLBEING Pierre van Heerden General Manager
DESCRIPTION: Bacon, ham and smallgoods manufacturer
DESCRIPTION: Pan iwi organisation with 50% ownership in Sealord, and full ownership of Moana Fisheries, OPC Fish, Prepared Foods, Pacific Marine Farms & Kia Ora Seafood.
DESCRIPTION: Auckland based manufacturers of coffee, beverages, sauces, gravies, etc.
DESCRIPTION: Auckland based manufacturers of nutritional and innovative health foods
KEY PRODUCTS: bacon, ham, smallgoods KEY PRODUCTS: Fresh and frozen Fish, oysters, mussels, + prepared seafood products
KEY PRODUCTS: coffee, sauces, gravies KEY PRODUCTS: Cereals, spreads, beverages
OWNERSHIP: Mixed NZ: PE (Rangatira 50%) , (Private: Heller, Harris, others)
OWNERSHIP: NZ; tribal (various iwi/tribal holdings); ownership of Moana Pacific, Pacific Marine Farms, Kia ora Seafoods, OPC
OWNERSHIP: Foreign: Singapore; listed (SIN: C20; Suntory 83%)
OWNERSHIP: NZ; charity (Seventh-day Adventist Church)
COMPANY NUMBER: 386096 COMPANY NUMBER: 1581332 COMPANY NUMBER: 247266 COMPANY NUMBER:-
ADDRESS: 67 Main North Road, Kaiapoi , Canterbury ADDRESS: Level 3, Moana Pacific House 138 Halsey Street, Auckland
ADDRESS: 291 East Tamaki Road, East Tamaki, Auckland
ADDRESS: 124 Pah Road, Royal Oak, Auckland
PHONE: +64 3 375 5017 PHONE: +64 9 302 1520 PHONE: +64 9274 2777 PHONE: +64 9 625 0700
WEBSITE: www.hellers.co.nz; www.rangatira.co.nz
WEBSITE: www.afl.maori.nz WEBSITE: www.cerebos.co.nz WEBSITE: www.sanitarium.co.nz
YEAR FORMED: 1988 YEAR FORMED: 2004 YEAR FORMED: 1984 YEAR FORMED: 1900
STAFF EMPLOYED: 500 STAFF EMPLOYED: 500 (incl 250 Prepared Foods) STAFF EMPLOYED: 350 STAFF EMPLOYED: 350
REVENUE: $160m* (FY12) REVENUE: $154.1 (FY12) REVENUE: $152m (FY12) REVENUE: $150m* (FY12)
COMPANY HIGHLIGHTS: COMPANY HIGHLIGHTS: New Prepared Foods facility near completion; Agreement with Cawthron Institute to take over Pacific oyster nursery; Restructuring business; Sold share in Seafood Processors; Part of Precision Harvesting project to target fish; Overall profit of $17m
COMPANY HIGHLIGHTS: COMPANY HIGHLIGHTS:
49 Source: annual reports, company websites, company data, NZ Companies Office, interviews; *Coriolis estimates
iFAB50 FIRM PROFILES

IFAB 2013
49 50
BLUEBIRD FOODS LTD PEPSICO NZ HOLDINGS Sean Goodwin General Manager
LEADERBRAND Richard Burke General Manager
DESCRIPTION: Global beverage and snack food manufacturer; all beverages contract packed by Frucor
DESCRIPTION: Range of salads, produce and fruits for domestic retail, processing and export; squash to Japan; Growing on 3,000ha
KEY PRODUCTS: non-alcoholic beverages, snacks, salty snacks, nuts, chips
KEY PRODUCTS: Lettuce, broccoli, squash, sweetcorn, salads, watermelons
OWNERSHIP: USA; Public listed (NYSE: PEP)
OWNERSHIP: NZ; Private (McPhail)
COMPANY NUMBER: 163343 / 1882013 COMPANY NUMBER: 827392
ADDRESS: 124 Wiri Station Road, Manukau, Auckland
ADDRESS: 33 Parkinson Street, Gisborne, Hawkes Bay
PHONE: +64 9 9 262 8800 PHONE: +64 6 867 6231
WEBSITE: www.bluebird.co.nz; www.pepsico.com WEBSITE: www.leaderbrand.co.nz
YEAR FORMED: 1947 YEAR FORMED: 1975
STAFF EMPLOYED: 680 STAFF EMPLOYED: 187 (+300 seasonal)
REVENUE: $144m (FY12) REVENUE: $140* (FY12)
COMPANY HIGHLIGHTS: COMPANY HIGHLIGHTS:
50 Source: annual reports, company websites, company data, NZ Companies Office, interviews; *Coriolis estimates
iFAB50 FIRM PROFILES
iFAB 2013
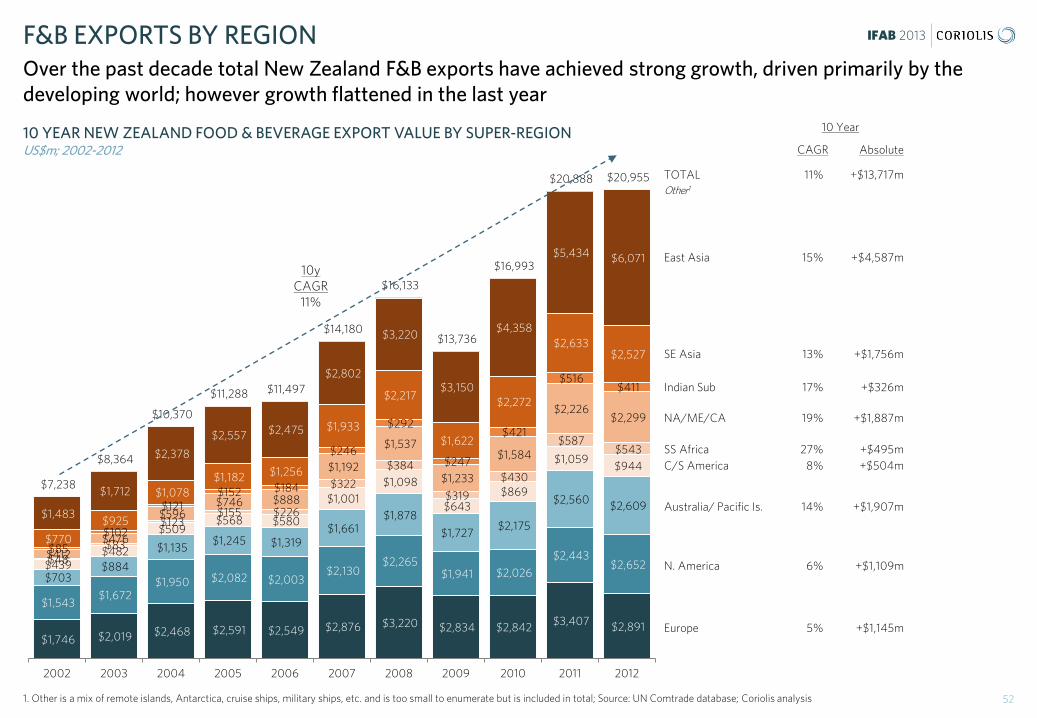
IFAB 2013
$1,746 $2,019 $2,468 $2,591 $2,549 $2,876 $3,220 $2,834 $2,842 $3,407 $2,891
$1,543 $1,672
$1,950 $2,082 $2,003 $2,130
$2,265 $1,941 $2,026
$2,443 $2,652
$703 $884
$1,135 $1,245 $1,319
$1,661 $1,878
$1,727 $2,175
$2,560 $2,609
$439 $482
$509 $568 $580
$1,001 $1,098
$643 $869
$1,059 $944
$48 $83
$123 $155 $226
$322
$384
$319
$430
$587 $543
$412 $476
$596 $746 $888
$1,192
$1,537
$1,233
$1,584
$2,226 $2,299
$85 $102
$121 $152 $184
$246
$292
$247
$421
$516 $411
$770
$925
$1,078 $1,182 $1,256
$1,933
$2,217
$1,622
$2,272
$2,633 $2,527
$1,483
$1,712
$2,378
$2,557 $2,475
$2,802
$3,220
$3,150
$4,358
$5,434 $6,071
$7,238
$8,364
$10,370
$11,288 $11,497
$14,180
$16,133
$13,736
$16,993
$20,888 $20,955
2002 2003 2004 2005 2006 2007 2008 2009 2010 2011 2012
10 YEAR NEW ZEALAND FOOD & BEVERAGE EXPORT VALUE BY SUPER-REGION US$m; 2002-2012
F&B EXPORTS BY REGION Over the past decade total New Zealand F&B exports have achieved strong growth, driven primarily by the developing world; however growth flattened in the last year
52 1. Other is a mix of remote islands, Antarctica, cruise ships, military ships, etc. and is too small to enumerate but is included in total; Source: UN Comtrade database; Coriolis analysis
Europe 5% +$1,145m
N. America 6% +$1,109m
Australia/ Pacific Is. 14% +$1,907m
NA/ME/CA 19% +$1,887m
Indian Sub 17% +$326m
SE Asia 13% +$1,756m
East Asia 15% +$4,587m
TOTAL 11% +$13,717m
C/S America 8% +$504m SS Africa 27% +$495m
CAGR Absolute
10 Year
10y CAGR
11%
Other1

IFAB 2013
TOP 25 NEW ZEALAND FOOD & BEVERAGE EXPORT MARKETS BY VALUE US$m; 2012
EXPORT DOLLARS China continues to be New Zealand’s number one F&B export market; the key Anglo-Sphere countries and Japan round out the top five
53 *Hong Kong Special Administrative Region (SAR); Source: UN Comtrade database; Coriolis analysis
$3,180 $2,341
$2,198 $1,396
$840 $553
$522 $514
$485 $473 $472 $457 $443 $437 $436
$367 $365
$342 $316 $311
$295 $235
$211 $199 $199
ChinaUSA
AustraliaJapan
United KingdomMalaysia
TaiwanSaudi Arabia
Rep. of KoreaHong Kong SAR
IndonesiaGermany
PhilippinesSingapore
United Arab EmiratesVenezuela
ThailandAlgeria
NetherlandsCanada
EgyptViet NamSri Lanka
MexicoBelgium
*
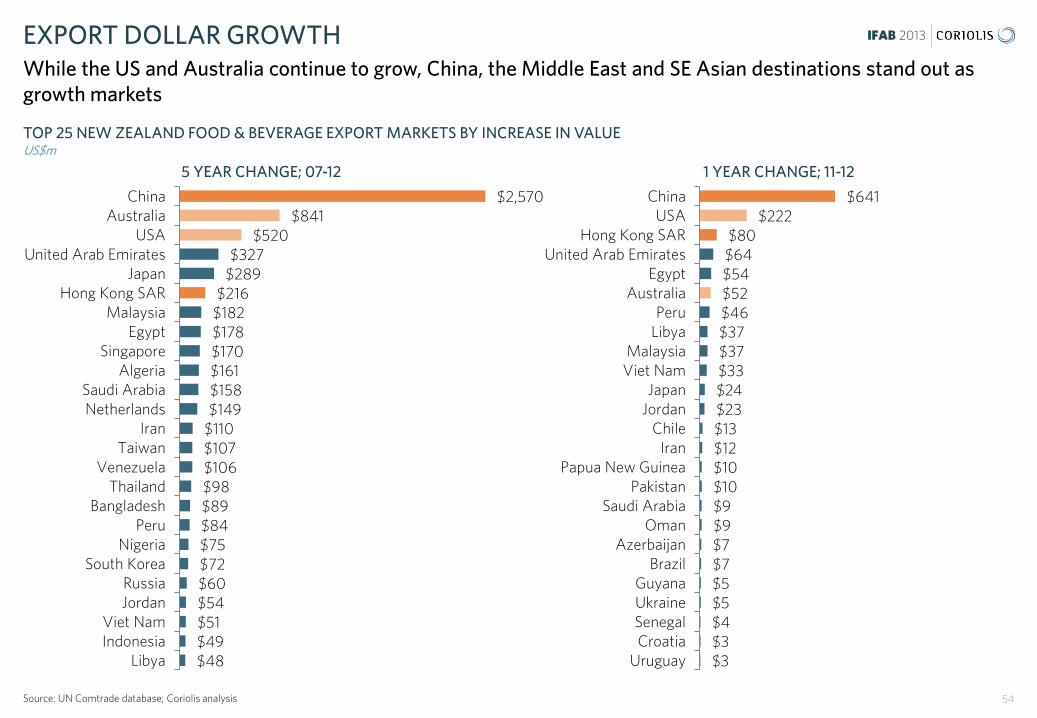
IFAB 2013
TOP 25 NEW ZEALAND FOOD & BEVERAGE EXPORT MARKETS BY INCREASE IN VALUE US$m
EXPORT DOLLAR GROWTH While the US and Australia continue to grow, China, the Middle East and SE Asian destinations stand out as growth markets
54 Source: UN Comtrade database; Coriolis analysis
5 YEAR CHANGE; 07-12 1 YEAR CHANGE; 11-12
$2,570 $841
$520 $327
$289 $216
$182 $178 $170 $161 $158 $149
$110 $107 $106 $98 $89 $84 $75 $72 $60 $54 $51 $49 $48
ChinaAustralia
USAUnited Arab Emirates
JapanHong Kong SAR
MalaysiaEgypt
SingaporeAlgeria
Saudi ArabiaNetherlands
IranTaiwan
VenezuelaThailand
BangladeshPeru
NigeriaSouth Korea
RussiaJordan
Viet NamIndonesia
Libya
$641 $222
$80 $64 $54 $52 $46 $37 $37 $33 $24 $23 $13 $12 $10 $10 $9 $9 $7 $7 $5 $5 $4 $3 $3
ChinaUSA
Hong Kong SARUnited Arab Emirates
EgyptAustralia
PeruLibya
MalaysiaViet Nam
JapanJordan
ChileIran
Papua New GuineaPakistan
Saudi ArabiaOman
AzerbaijanBrazil
GuyanaUkraineSenegalCroatia
Uruguay
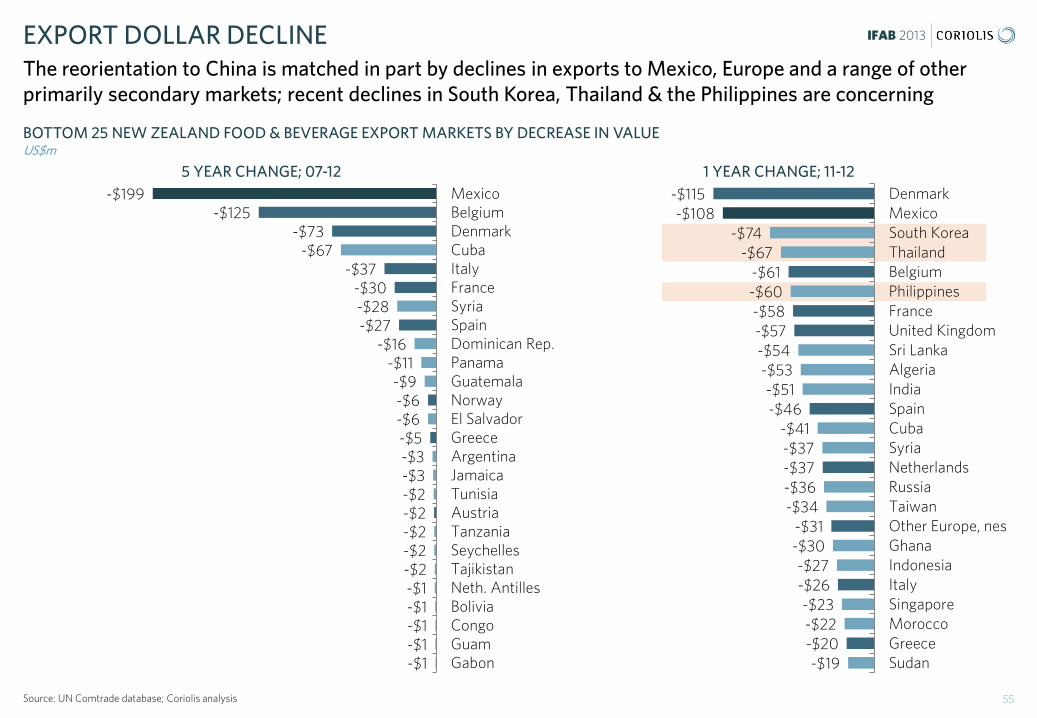
IFAB 2013
BOTTOM 25 NEW ZEALAND FOOD & BEVERAGE EXPORT MARKETS BY DECREASE IN VALUE US$m
EXPORT DOLLAR DECLINE The reorientation to China is matched in part by declines in exports to Mexico, Europe and a range of other primarily secondary markets; recent declines in South Korea, Thailand & the Philippines are concerning
55 Source: UN Comtrade database; Coriolis analysis
-$199 -$125
-$73 -$67
-$37 -$30 -$28 -$27
-$16 -$11 -$9 -$6 -$6 -$5 -$3 -$3 -$2 -$2 -$2 -$2 -$2 -$1 -$1 -$1 -$1 -$1
MexicoBelgiumDenmarkCubaItalyFranceSyriaSpainDominican Rep.PanamaGuatemalaNorwayEl SalvadorGreeceArgentinaJamaicaTunisiaAustriaTanzaniaSeychellesTajikistanNeth. AntillesBoliviaCongoGuamGabon
-$115 -$108
-$74 -$67
-$61 -$60 -$58 -$57 -$54 -$53 -$51 -$46
-$41 -$37 -$37 -$36 -$34
-$31 -$30 -$27 -$26 -$23 -$22 -$20 -$19
DenmarkMexicoSouth KoreaThailandBelgiumPhilippinesFranceUnited KingdomSri LankaAlgeriaIndiaSpainCubaSyriaNetherlandsRussiaTaiwanOther Europe, nesGhanaIndonesiaItalySingaporeMoroccoGreeceSudan
5 YEAR CHANGE; 07-12 1 YEAR CHANGE; 11-12
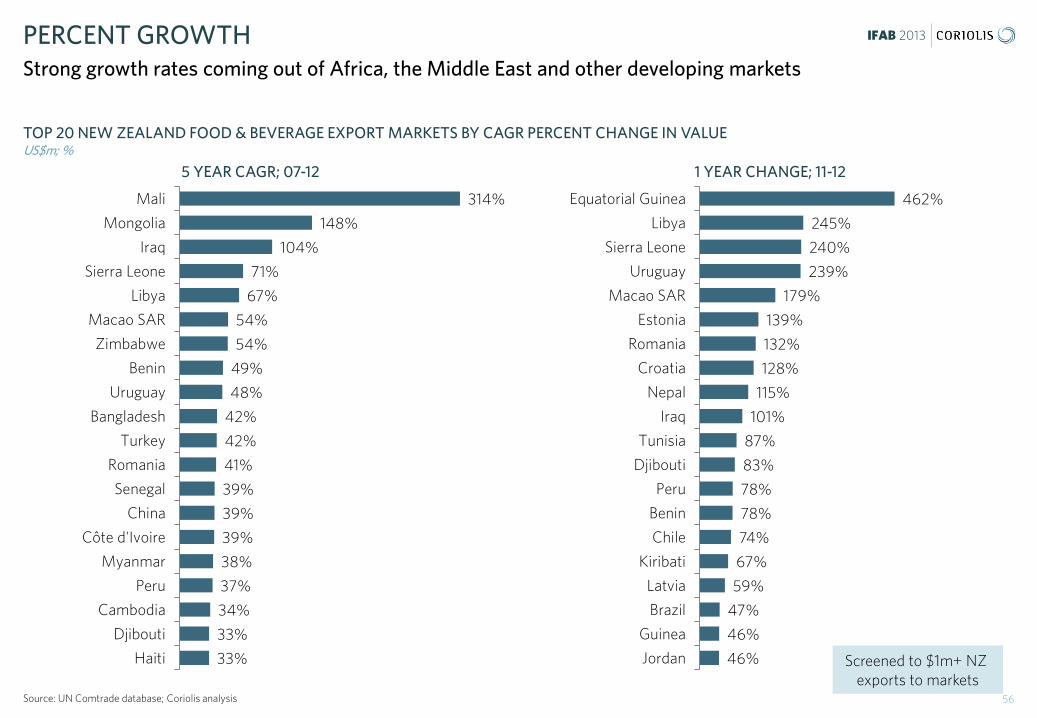
IFAB 2013
TOP 20 NEW ZEALAND FOOD & BEVERAGE EXPORT MARKETS BY CAGR PERCENT CHANGE IN VALUE US$m; %
PERCENT GROWTH Strong growth rates coming out of Africa, the Middle East and other developing markets
56 Source: UN Comtrade database; Coriolis analysis
5 YEAR CAGR; 07-12 1 YEAR CHANGE; 11-12
314%
148%
104%
71%
67%
54%
54%
49%
48%
42%
42%
41%
39%
39%
39%
38%
37%
34%
33%
33%
Mali
Mongolia
Iraq
Sierra Leone
Libya
Macao SAR
Zimbabwe
Benin
Uruguay
Bangladesh
Turkey
Romania
Senegal
China
Côte d'Ivoire
Myanmar
Peru
Cambodia
Djibouti
Haiti
462%
245%
240%
239%
179%
139%
132%
128%
115%
101%
87%
83%
78%
78%
74%
67%
59%
47%
46%
46%
Equatorial Guinea
Libya
Sierra Leone
Uruguay
Macao SAR
Estonia
Romania
Croatia
Nepal
Iraq
Tunisia
Djibouti
Peru
Benin
Chile
Kiribati
Latvia
Brazil
Guinea
Jordan Screened to $1m+ NZ exports to markets
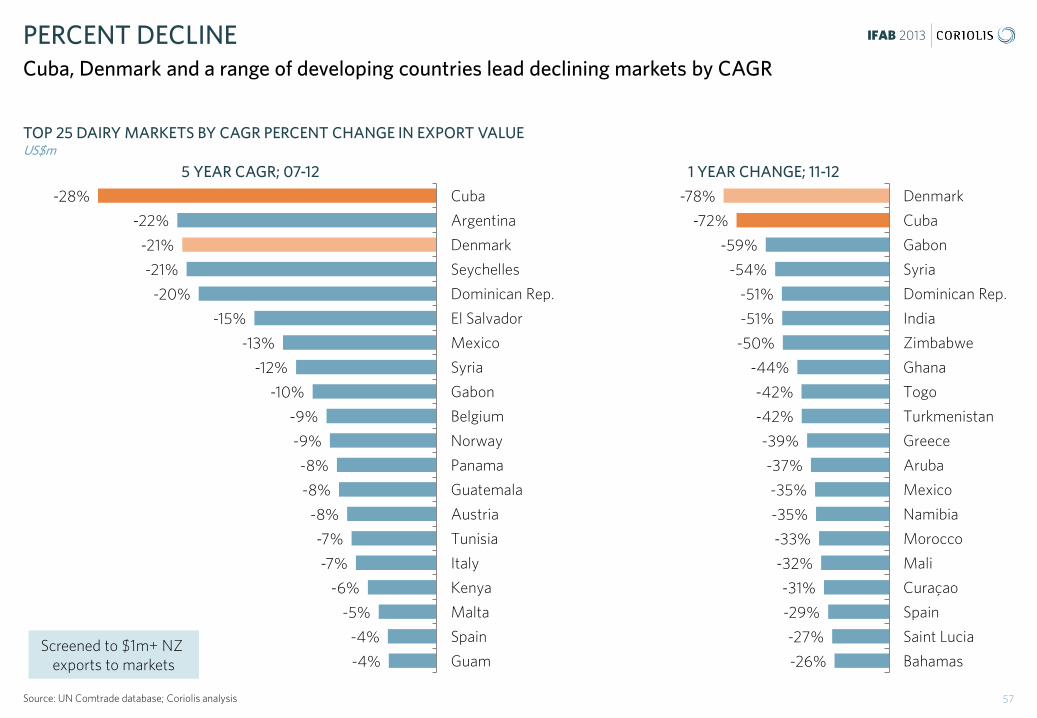
IFAB 2013
TOP 25 DAIRY MARKETS BY CAGR PERCENT CHANGE IN EXPORT VALUE US$m
PERCENT DECLINE Cuba, Denmark and a range of developing countries lead declining markets by CAGR
57 Source: UN Comtrade database; Coriolis analysis
5 YEAR CAGR; 07-12 1 YEAR CHANGE; 11-12
-28%
-22%
-21%
-21%
-20%
-15%
-13%
-12%
-10%
-9%
-9%
-8%
-8%
-8%
-7%
-7%
-6%
-5%
-4%
-4%
Cuba
Argentina
Denmark
Seychelles
Dominican Rep.
El Salvador
Mexico
Syria
Gabon
Belgium
Norway
Panama
Guatemala
Austria
Tunisia
Italy
Kenya
Malta
Spain
GuamScreened to $1m+ NZ
exports to markets
-78%
-72%
-59%
-54%
-51%
-51%
-50%
-44%
-42%
-42%
-39%
-37%
-35%
-35%
-33%
-32%
-31%
-29%
-27%
-26%
Denmark
Cuba
Gabon
Syria
Dominican Rep.
India
Zimbabwe
Ghana
Togo
Turkmenistan
Greece
Aruba
Mexico
Namibia
Morocco
Mali
Curaçao
Spain
Saint Lucia
Bahamas
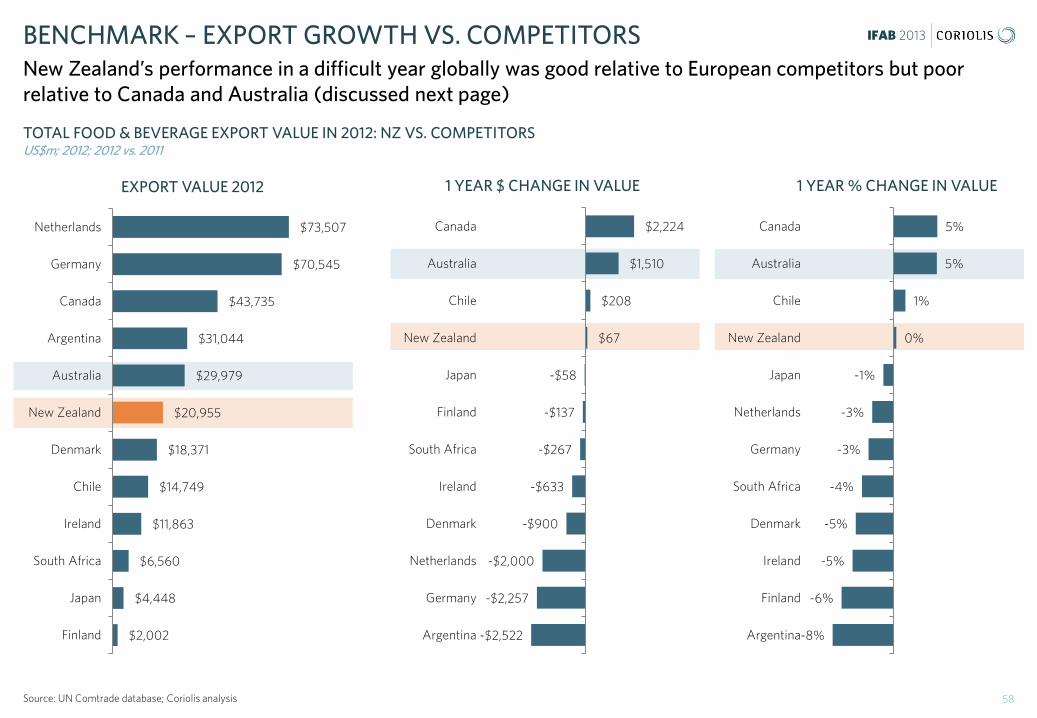
IFAB 2013
TOTAL FOOD & BEVERAGE EXPORT VALUE IN 2012: NZ VS. COMPETITORS US$m; 2012; 2012 vs. 2011
BENCHMARK – EXPORT GROWTH VS. COMPETITORS New Zealand’s performance in a difficult year globally was good relative to European competitors but poor relative to Canada and Australia (discussed next page)
58 Source: UN Comtrade database; Coriolis analysis
EXPORT VALUE 2012 1 YEAR $ CHANGE IN VALUE 1 YEAR % CHANGE IN VALUE
$73,507
$70,545
$43,735
$31,044
$29,979
$20,955
$18,371
$14,749
$11,863
$6,560
$4,448
$2,002
Netherlands
Germany
Canada
Argentina
Australia
New Zealand
Denmark
Chile
Ireland
South Africa
Japan
Finland
$2,224
$1,510
$208
$67
-$58
-$137
-$267
-$633
-$900
-$2,000
-$2,257
-$2,522
Canada
Australia
Chile
New Zealand
Japan
Finland
South Africa
Ireland
Denmark
Netherlands
Germany
Argentina
5%
5%
1%
0%
-1%
-3%
-3%
-4%
-5%
-5%
-6%
-8%
Canada
Australia
Chile
New Zealand
Japan
Netherlands
Germany
South Africa
Denmark
Ireland
Finland
Argentina
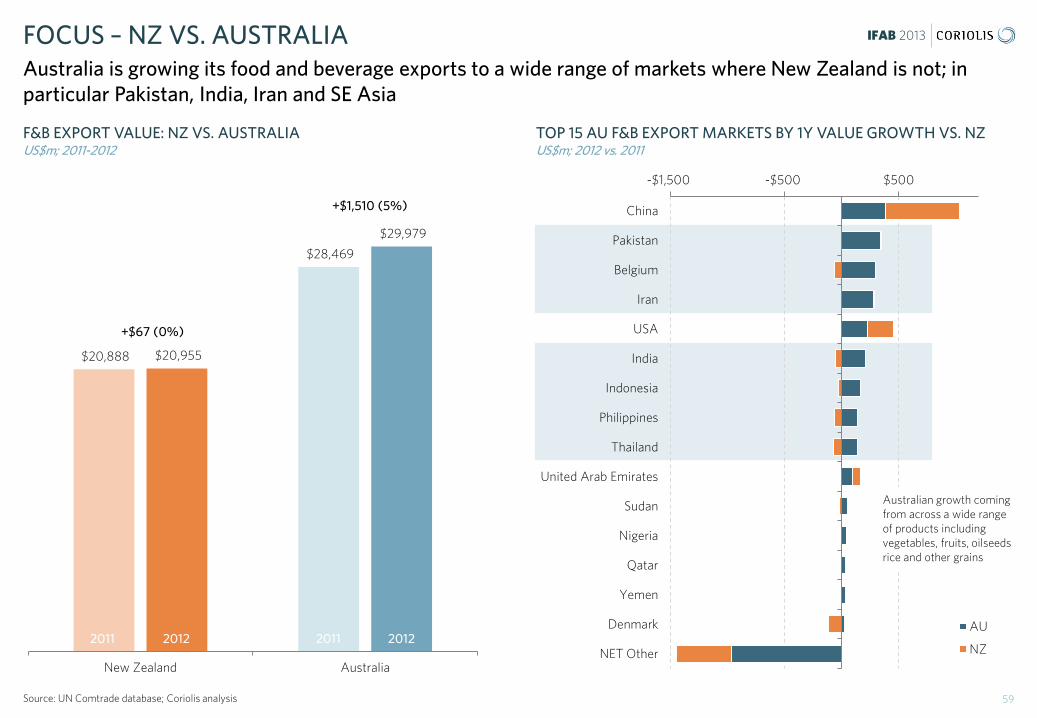
IFAB 2013
$20,888
$28,469
$20,955
$29,979
New Zealand Australia
F&B EXPORT VALUE: NZ VS. AUSTRALIA US$m; 2011-2012
FOCUS – NZ VS. AUSTRALIA Australia is growing its food and beverage exports to a wide range of markets where New Zealand is not; in particular Pakistan, India, Iran and SE Asia
59 Source: UN Comtrade database; Coriolis analysis
2011 2012 2011 2012
+$67 (0%)
+$1,510 (5%)
TOP 15 AU F&B EXPORT MARKETS BY 1Y VALUE GROWTH VS. NZ US$m; 2012 vs. 2011
-$1,500 -$500 $500
China
Pakistan
Belgium
Iran
USA
India
Indonesia
Philippines
Thailand
United Arab Emirates
Sudan
Nigeria
Qatar
Yemen
Denmark
NET Other
AU
NZ
Australian growth coming from across a wide range of products including vegetables, fruits, oilseeds rice and other grains
iFAB 2013
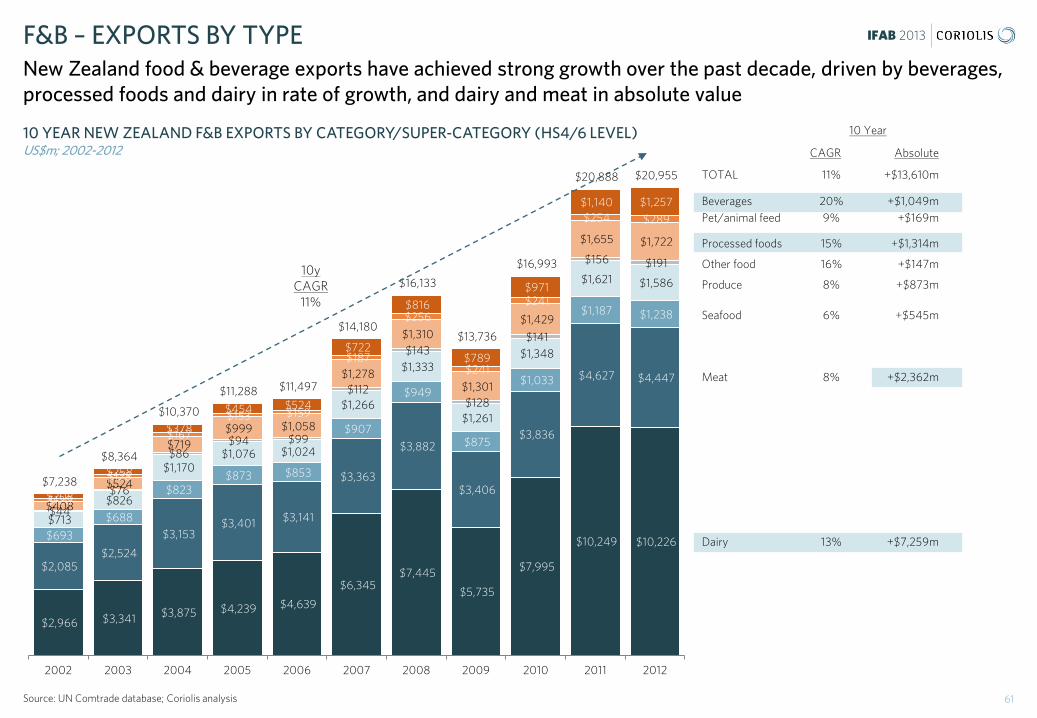
IFAB 2013
$2,966 $3,341 $3,875 $4,239 $4,639
$6,345 $7,445
$5,735
$7,995
$10,249 $10,226
$2,085 $2,524
$3,153 $3,401 $3,141
$3,363
$3,882
$3,406
$3,836
$4,627 $4,447
$693
$688
$823 $873 $853
$907
$949
$875
$1,033
$1,187 $1,238
$713
$826
$1,170 $1,076 $1,024
$1,266
$1,333
$1,261
$1,348
$1,621 $1,586
$44
$76
$86 $94 $99
$112
$143
$128
$141
$156 $191
$408
$524
$719 $999 $1,058
$1,278
$1,310
$1,301
$1,429
$1,655 $1,722
$120
$128
$167
$153 $159
$187
$256
$241
$241
$254 $289
$208
$258
$378
$454 $524
$722
$816
$789
$971
$1,140 $1,257
$7,238
$8,364
$10,370
$11,288 $11,497
$14,180
$16,133
$13,736
$16,993
$20,888 $20,955
2002 2003 2004 2005 2006 2007 2008 2009 2010 2011 2012
10 YEAR NEW ZEALAND F&B EXPORTS BY CATEGORY/SUPER-CATEGORY (HS4/6 LEVEL) US$m; 2002-2012
F&B – EXPORTS BY TYPE New Zealand food & beverage exports have achieved strong growth over the past decade, driven by beverages, processed foods and dairy in rate of growth, and dairy and meat in absolute value
61 Source: UN Comtrade database; Coriolis analysis
Dairy 13% +$7,259m
Meat 8% +$2,362m
6% +$545m
Produce 8% +$873m
Other food 16% +$147m
Processed foods 15% +$1,314m
Beverages 20% +$1,049m
TOTAL 11% +$13,610m
CAGR Absolute
10 Year
10y CAGR
11%
Pet/animal feed 9% +$169m
Seafood

IFAB 2013
EXPORT VALUE OF TOP 40 F&B PRODUCTS (HS6 LEVEL) IN 2012 US$m; 2012
EXPORT DOLLARS Milk powder and frozen meat continue to be New Zealand’s only “billion plus” exports; however there is a strong group of $100m+ products, many of which are growth engines
62 WMP Whole Milk Powder, SMP Skim Milk Powder, MBM Meat and Bone Meal; Source: UN Comtrade database; Coriolis analysis
$1,374
$1,253
$1,108
$916
$840
$824
$799
$680
$513
$448
$407
$406
$319
$310
$293
$261
$241
$240
$211
WMP
Beef, frozen boneless
SMP
Sheep, frozen bone-in
Butter
Kiwifruit
Wine, bottle
Cheese, cheddar, etc.
Other milk fats and oils
Natural milk constituent nes
Sheep, chilled bone-in
Casein
Innovative foods
Sheep, frozen boneless
Caseinates/other derivatives
Apples
Frozen fish, nes
Infant formula retail
Anlene; other dairy nutritionals
Milk albumin
$4,243 $210
$185
$180
$177
$171
$159
$148
$145
$129
$125
$108
$103
$99
$97
$88
$87
$86
$85
$84
$74
Beef, chilled boneless
Fresh cheese
Sheep, chilled boneless
Rock Lobster, fresh
Frozen fish fillets
Deer, fresh & frozen
Mussels (not-live)
Wine, bulk
Buttermilk powder, other fermented
Animal fats
Canned beef
Honey
MBM for pet food
Grated or powdered cheese
Processed cheese
Whey & modified whey
UHT milk, other whole fluid
Beef, frozen bone-in
Sauces
High fat fluid milk
*
*
*
NOTE: All F&B export products at HS6 level. Definitions in Sector reports
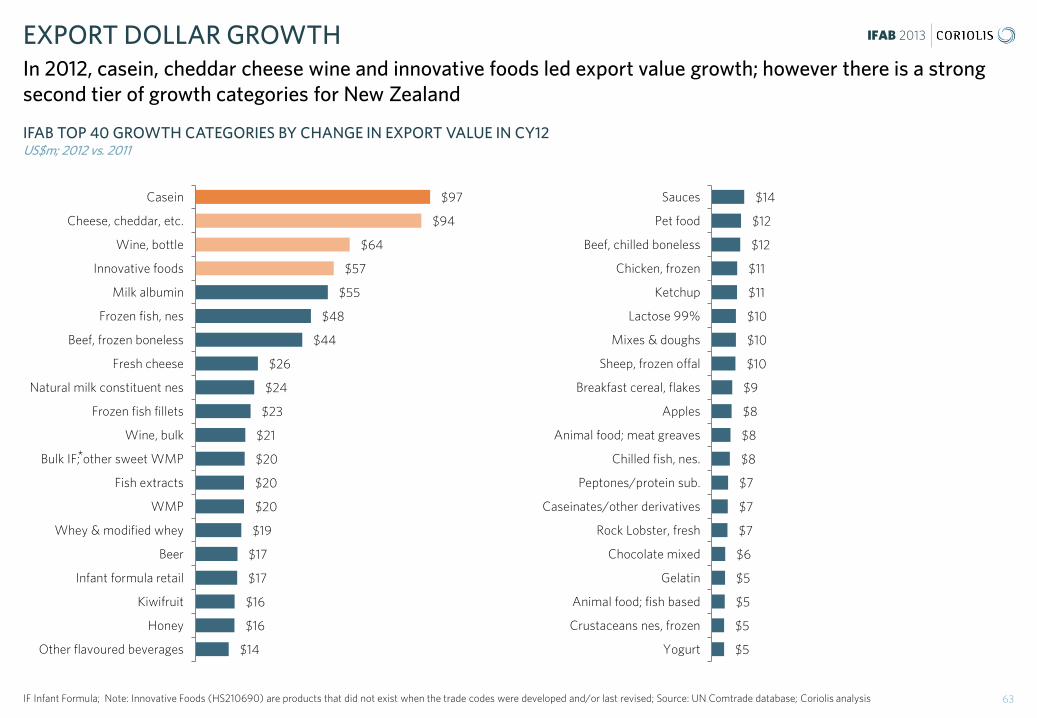
IFAB 2013
IFAB TOP 40 GROWTH CATEGORIES BY CHANGE IN EXPORT VALUE IN CY12 US$m; 2012 vs. 2011
EXPORT DOLLAR GROWTH In 2012, casein, cheddar cheese wine and innovative foods led export value growth; however there is a strong second tier of growth categories for New Zealand
63 IF Infant Formula; Note: Innovative Foods (HS210690) are products that did not exist when the trade codes were developed and/or last revised; Source: UN Comtrade database; Coriolis analysis
$97
$94
$64
$57
$55
$48
$44
$26
$24
$23
$21
$20
$20
$20
$19
$17
$17
$16
$16
$14
Casein
Cheese, cheddar, etc.
Wine, bottle
Innovative foods
Milk albumin
Frozen fish, nes
Beef, frozen boneless
Fresh cheese
Natural milk constituent nes
Frozen fish fillets
Wine, bulk
Bulk IF; other sweet WMP
Fish extracts
WMP
Whey & modified whey
Beer
Infant formula retail
Kiwifruit
Honey
Other flavoured beverages
$14
$12
$12
$11
$11
$10
$10
$10
$9
$8
$8
$8
$7
$7
$7
$6
$5
$5
$5
$5
Sauces
Pet food
Beef, chilled boneless
Chicken, frozen
Ketchup
Lactose 99%
Mixes & doughs
Sheep, frozen offal
Breakfast cereal, flakes
Apples
Animal food; meat greaves
Chilled fish, nes.
Peptones/protein sub.
Caseinates/other derivatives
Rock Lobster, fresh
Chocolate mixed
Gelatin
Animal food; fish based
Crustaceans nes, frozen
Yogurt
*

IFAB 2013
IFAB BOTTOM 40 DECLINING CATEGORIES BY CHANGE IN EXPORT VALUE IN CY12 US$m; 2012 vs. 2011
EXPORT DOLLAR DECLINE In 2012, butter/other milk fats and frozen sheep/lamb led declining categories by value
64 Source: UN Comtrade database; Coriolis analysis
-$216
-$141
-$88
-$82
-$56
-$40
-$32
-$25
-$25
-$23
-$20
-$18
-$18
-$17
-$14
-$13
-$10
-$9
-$9
-$8
Butter
Other milk fats and oils
Sheep, frozen boneless
Sheep, frozen bone-in
Anlene; other dairy nutritionals
Sheep, chilled boneless
Onions
Frozen fish meat
Avocados
Sheep, chilled bone-in
SMP
Grated or powdered cheese
Mussels (not-live)
Deer, fresh & frozen
Squid (non-chilled)
Frozen french fries
Sheep, frozen carcass
Mussels, prepared
Bulk chocolate
Processed cheese
-$6
-$6
-$5
-$5
-$4
-$4
-$4
-$4
-$4
-$3
-$3
-$3
-$3
-$3
-$2
-$2
-$2
-$2
-$2
-$2
Soups
High fat fluid milk
Dairy spreads
Beef, frozen tongues
Salmon, frozen whole
Potatoes
Salmon, chilled whole
Breakfast cereal, puffed
Tomatoes
Animal fats
Albumins (excl. egg albumin), albuminates, other
Prawns, frozen
Oysters
Beef, frozen bone-in
Maize (corn) flour
Prep/pres fins
Pears
Beef, frozen livers
Frozen mixed veg
Canned chicken
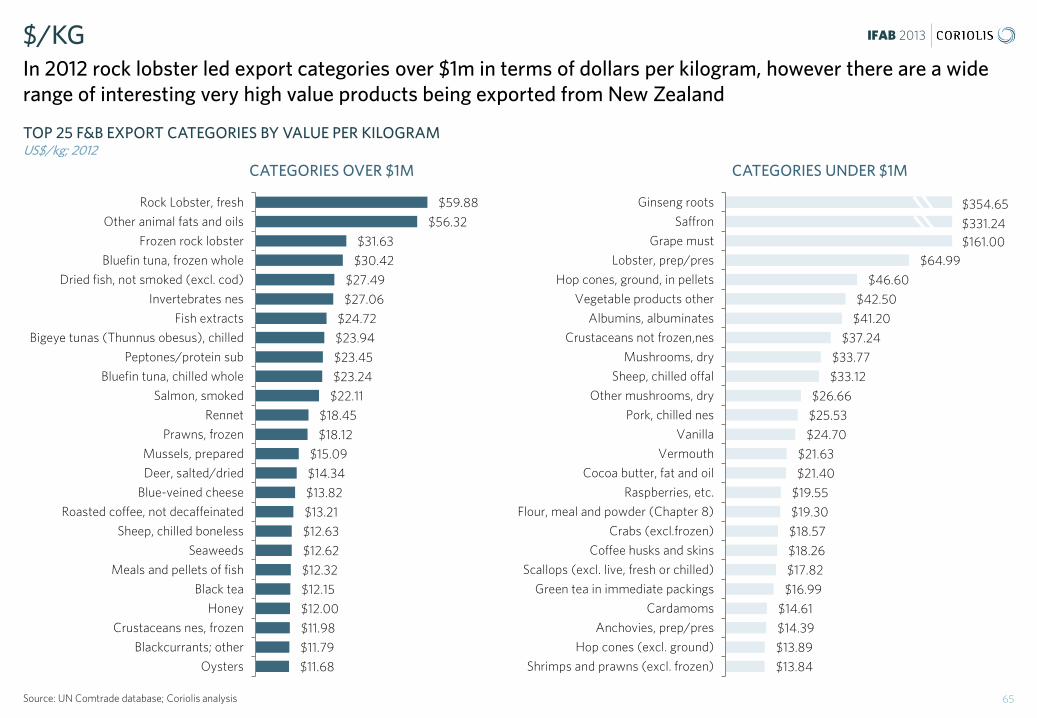
IFAB 2013
TOP 25 F&B EXPORT CATEGORIES BY VALUE PER KILOGRAM US$/kg; 2012
$/KG In 2012 rock lobster led export categories over $1m in terms of dollars per kilogram, however there are a wide range of interesting very high value products being exported from New Zealand
65 Source: UN Comtrade database; Coriolis analysis
$64.99
$46.60
$42.50
$41.20
$37.24
$33.77
$33.12
$26.66
$25.53
$24.70
$21.63
$21.40
$19.55
$19.30
$18.57
$18.26
$17.82
$16.99
$14.61
$14.39
$13.89
$13.84
Ginseng roots
Saffron
Grape must
Lobster, prep/pres
Hop cones, ground, in pellets
Vegetable products other
Albumins, albuminates
Crustaceans not frozen,nes
Mushrooms, dry
Sheep, chilled offal
Other mushrooms, dry
Pork, chilled nes
Vanilla
Vermouth
Cocoa butter, fat and oil
Raspberries, etc.
Flour, meal and powder (Chapter 8)
Crabs (excl.frozen)
Coffee husks and skins
Scallops (excl. live, fresh or chilled)
Green tea in immediate packings
Cardamoms
Anchovies, prep/pres
Hop cones (excl. ground)
Shrimps and prawns (excl. frozen)
$59.88
$56.32
$31.63
$30.42
$27.49
$27.06
$24.72
$23.94
$23.45
$23.24
$22.11
$18.45
$18.12
$15.09
$14.34
$13.82
$13.21
$12.63
$12.62
$12.32
$12.15
$12.00
$11.98
$11.79
$11.68
Rock Lobster, fresh
Other animal fats and oils
Frozen rock lobster
Bluefin tuna, frozen whole
Dried fish, not smoked (excl. cod)
Invertebrates nes
Fish extracts
Bigeye tunas (Thunnus obesus), chilled
Peptones/protein sub
Bluefin tuna, chilled whole
Salmon, smoked
Rennet
Prawns, frozen
Mussels, prepared
Deer, salted/dried
Blue-veined cheese
Roasted coffee, not decaffeinated
Sheep, chilled boneless
Seaweeds
Meals and pellets of fish
Black tea
Honey
Crustaceans nes, frozen
Blackcurrants; other
Oysters
$354.65
$331.24
CATEGORIES OVER $1M CATEGORIES UNDER $1M
$161.00
iFAB 2013
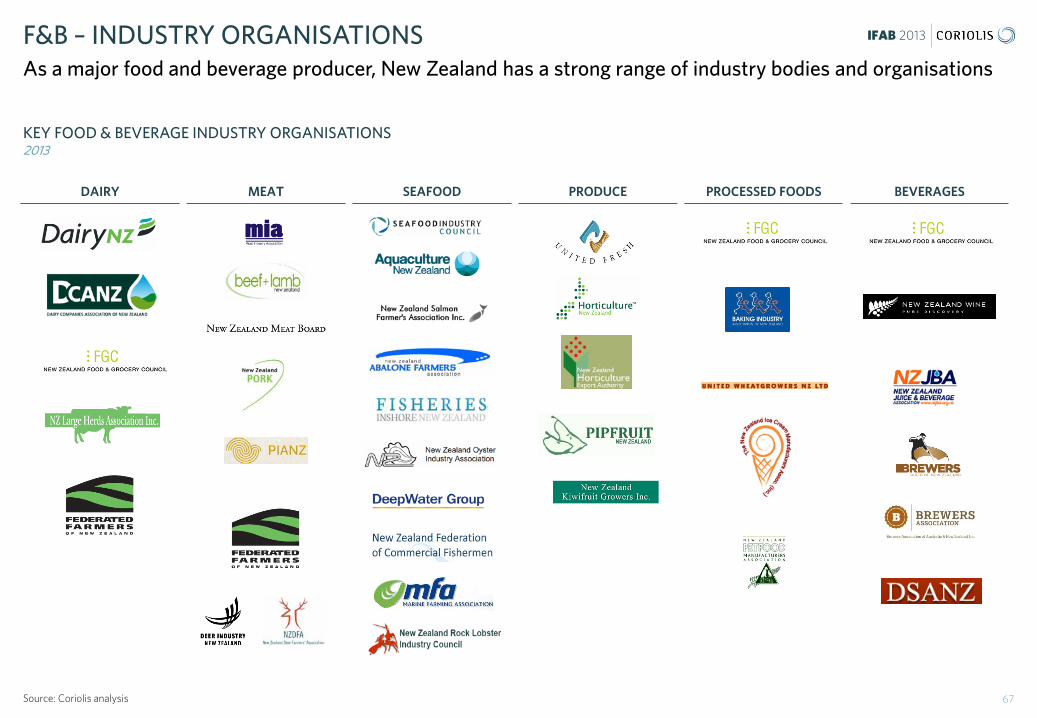
IFAB 2013
KEY FOOD & BEVERAGE INDUSTRY ORGANISATIONS 2013
F&B – INDUSTRY ORGANISATIONS As a major food and beverage producer, New Zealand has a strong range of industry bodies and organisations
67 Source: Coriolis analysis
DAIRY MEAT SEAFOOD PRODUCE PROCESSED FOODS BEVERAGES
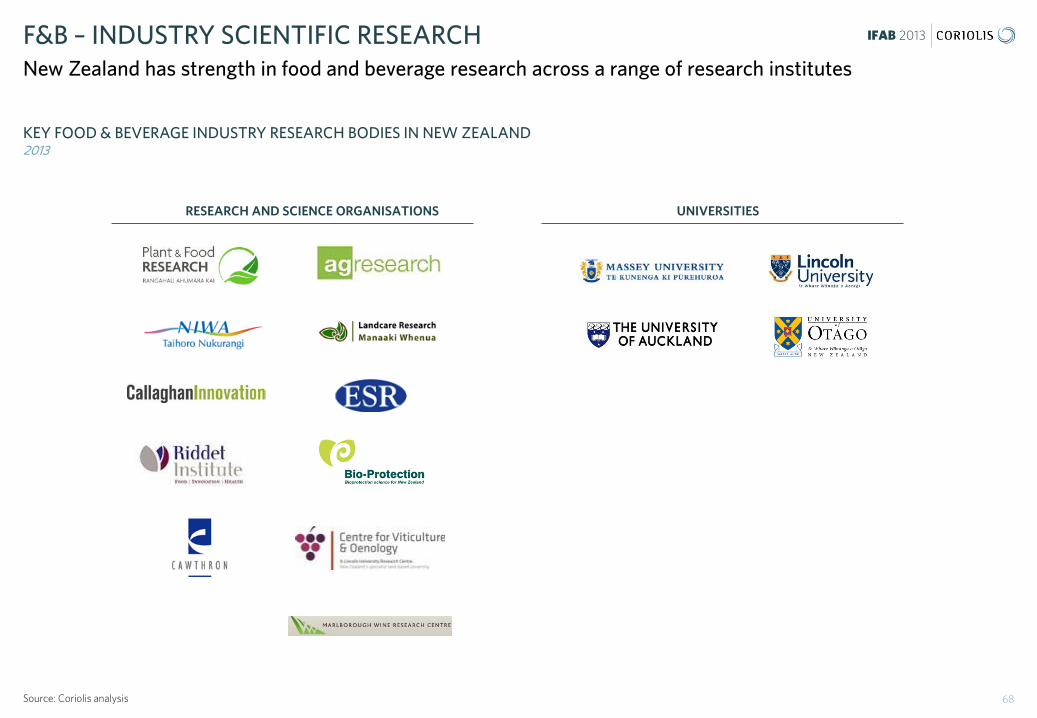
IFAB 2013
KEY FOOD & BEVERAGE INDUSTRY RESEARCH BODIES IN NEW ZEALAND 2013
F&B – INDUSTRY SCIENTIFIC RESEARCH New Zealand has strength in food and beverage research across a range of research institutes
68 Source: Coriolis analysis
RESEARCH AND SCIENCE ORGANISATIONS UNIVERSITIES
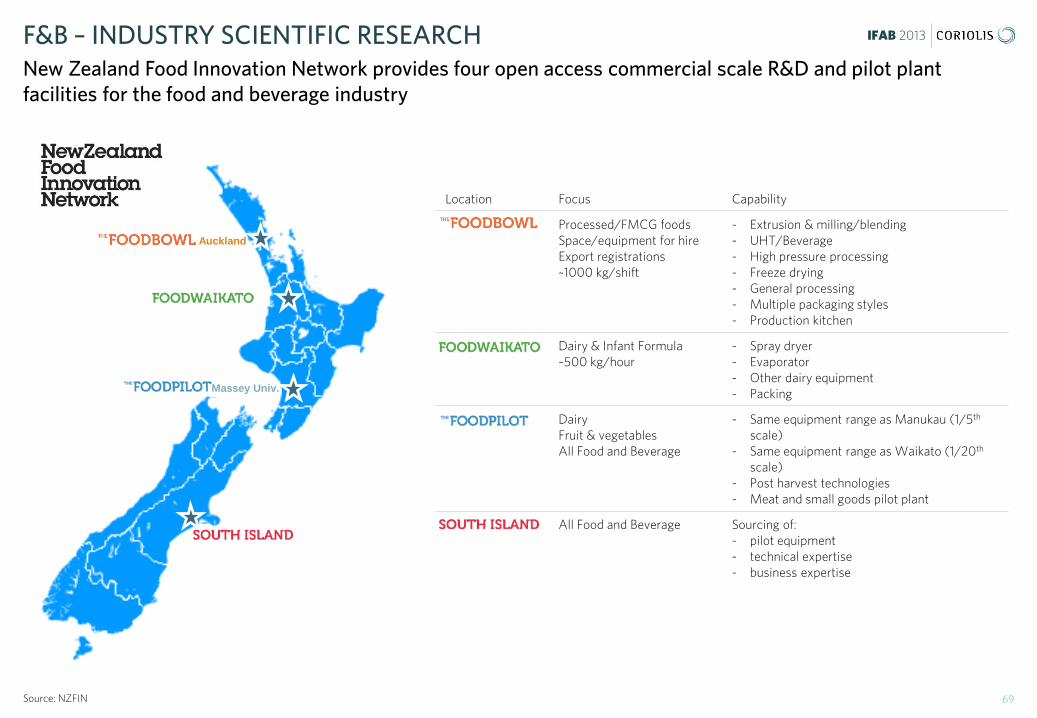
IFAB 2013 F&B – INDUSTRY SCIENTIFIC RESEARCH New Zealand Food Innovation Network provides four open access commercial scale R&D and pilot plant facilities for the food and beverage industry
69 Source: NZFIN
Location Focus Capability
Processed/FMCG foods Space/equipment for hire Export registrations ~1000 kg/shift
- Extrusion & milling/blending - UHT/Beverage - High pressure processing - Freeze drying - General processing - Multiple packaging styles - Production kitchen
Dairy & Infant Formula ~500 kg/hour
- Spray dryer - Evaporator - Other dairy equipment - Packing
Dairy Fruit & vegetables All Food and Beverage
- Same equipment range as Manukau (1/5th scale)
- Same equipment range as Waikato (1/20th scale)
- Post harvest technologies - Meat and small goods pilot plant
All Food and Beverage Sourcing of: - pilot equipment - technical expertise - business expertise
Auckland
Massey Univ.
IFAB 2013 METHODOLOGY & DATA SOURCES
This report uses a range of information sources, both qualitative and quantitative.
The numbers in this report come from multiple sources. While we believe the data are directionally correct, we recognise the limitations in what information is available. In many cases different data sources disagree (e.g. Statistics New Zealand vs. FAO vs. UN Comtrade). Many data sources themselves incorporate estimates of industry experts (e.g. FAO AgStat). As one example, in many cases, the value and/or volume recorded as exported by one country does not match the amount recorded as being received as imports by the counterparty [for understood reasons]. In addition, in some places, we have made our own clearly noted estimates.
All trade data analysed in all sections of the F&B Information project are calculated and displayed in US$. This is done for a range of reasons:
1. It is the currency most used in international trade
2. It allows for cross country comparisons (e.g. vs. Denmark)
3. It removes the impact of NZD exchange rate variability
4. It is more comprehensible to non-NZ audiences (e.g. foreign investors)
5. It is the currency in which the United Nations collects and tabulates global trade data
The opinions expressed in this report represent those of the industry participants interviewed and the authors. These do not necessarily represent those of Coriolis Limited or the New Zealand Government.
Coriolis has not been asked to independently verify or audit the information or material provided to it by or on behalf of the Client or any of the data sources used in the project. The information contained in the report and any commentary has been compiled from information and material supplied by third party sources and publicly available information which may (in part) be inaccurate or incomplete. Coriolis makes no representation, warranty or guarantee, whether express or implied, as to the quality, accuracy, reliability, currency or completeness of the information provided in the report.
If you have any questions about the methodology, sources or accuracy of any part of this report, please contact project lead Tim Morris at Coriolis, on +64 9 623 1848
70
Data was from a variety of sources, and has a number of identified limitations
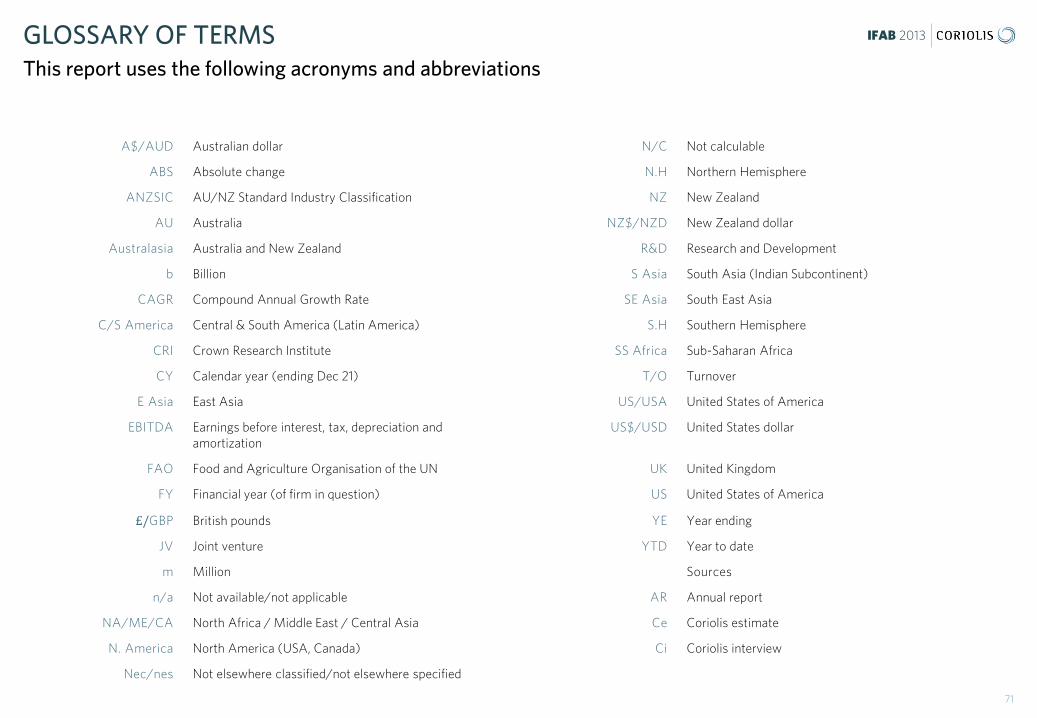
IFAB 2013 GLOSSARY OF TERMS
71
This report uses the following acronyms and abbreviations
A$/AUD Australian dollar N/C Not calculable
ABS Absolute change N.H Northern Hemisphere
ANZSIC AU/NZ Standard Industry Classification NZ New Zealand
AU Australia NZ$/NZD New Zealand dollar
Australasia Australia and New Zealand R&D Research and Development
b Billion S Asia South Asia (Indian Subcontinent)
CAGR Compound Annual Growth Rate SE Asia South East Asia
C/S America Central & South America (Latin America) S.H Southern Hemisphere
CRI Crown Research Institute SS Africa Sub-Saharan Africa
CY Calendar year (ending Dec 21) T/O Turnover
E Asia East Asia US/USA United States of America
EBITDA Earnings before interest, tax, depreciation and amortization
US$/USD United States dollar
FAO Food and Agriculture Organisation of the UN UK United Kingdom
FY Financial year (of firm in question) US United States of America
£/GBP British pounds YE Year ending
JV Joint venture YTD Year to date
m Million Sources
n/a Not available/not applicable AR Annual report
NA/ME/CA North Africa / Middle East / Central Asia Ce Coriolis estimate
N. America North America (USA, Canada) Ci Coriolis interview
Nec/nes Not elsewhere classified/not elsewhere specified
Coriolis is a boutique management consulting firm that focuses on food, consumer packaged goods, retailing and foodservice. Coriolis advises clients on strategy, operations, organization, and mergers and acquisitions. We develop practical, fact-based insights grounded in the real world that guide our clients decisions and actions. Founded in 1999, Coriolis is based in Auckland, New Zealand and works on projects across the Asia Pacific region. WHAT WE DO We help our clients assemble the facts needed to guide their big decisions. We make practical recommendations. Where appropriate, we work with them to make change happen. HOW WE DO IT Our style is practical and down-to-earth. We try to put ourselves in our clients’ shoes and focus on actions. We listen hard, but we are suspicious of the consensus. We provide an external, objective perspective. We are happy to link our fees to results. WHO WE WORK WITH We only work with a select group of clients we trust. We build long term relationships with our clients and more than 80% of our work comes from existing clients. Our clients trust our experience, advice and integrity.
Typical assignments for clients include… FIRM STRATEGY & OPERATIONS: We help clients develop their own strategy for growing sales and profits. We have a strong bias towards growth driven by new products, new channels and new markets. MARKET ENTRY We help clients identify which countries are the most attractive – from a consumer, a competition and a channel point-of-view. Following this we assist in developing a plan for market entry and growth. VALUE CREATION We help clients create value through revenue growth and cost reduction. TARGET IDENTIFICATION We help clients identify high potential acquisition targets by profiling industries, screening companies and devising a plan to approach targets. DUE DILIGENCE We help organisations make better decisions by performing consumer and market-focused due diligence and assessing performance improvement opportunities. EXPERT WITNESS We provide expert witness support to clients in legal cases and insurance claims. We assist with applications under competition/fair trade laws and regulations. READ MORE ON OUR WEBSITE.
ABOUT CORIOLIS’ SERVICES
CORIOLIS LIMITED PO BOX 90-509 AUCKLAND, NEW ZEALAND T: +64 9 623 1848 www.coriolisresearch.com
ABOUT CORIOLIS’ SERVICES
72