Embed Size (px)
Citation preview
New Zealand Dairy Statistics
2012-13
New
Zealand Dairy Statistics 2012-13
Copyright in this publication (including text, graphics, logos and icons) is owned by or licensed to DairyNZ. Other than for the purposes of, and
subject to the conditions prescribed under, the Copyright Act 1994 and similar legislation which applies in your location, and except as
expressly authorised by these terms and conditions, you may not in any form or by any means adapt, reproduce, store, distribute, print, display,
perform, publish or create derivative works from any part of this publication or commercialise any information, products or services obtained
from any part of this publication without our written permission.
Price for hand-held copy: $35.00 (excl. GST). Levy-paying dairy farmers can obtain a free copy by contacting DairyNZ.
New Zealand Dairy Statistics is also available online, at no charge, at: www.lic.co.nz (select News and Publications, followed by Publications), or at: www.dairynz.co.nz/dairystatistics
Statistics
LIC
Private Bag 3016
Hamilton 3240
New Zealand
Telephone: 64-7-856 0700
Fax: 64-7-856 0608
Email: [email protected]
Website: www.lic.co.nz
© 2013 DairyNZ Limited
DairyNZ
Private Bag 3221
Hamilton 3240
New Zealand
Telephone: 0800 4 DAIRYNZ
Email: [email protected]
Website: www.dairynz.co.nz
New Zealand Dairy Statistics 2012-13 1
Contents1. Introduction 4
2. National dairy statistics 5
A. Industry statistics 5
i) Production 5
ii) Population 6
B. Herd production statistics 8
i) Production per cow and per hectare 9
ii) Herd size distribution 11
3. Regional dairy statistics 13
A. Region 13
B. District 16
C. Operating structures 20
D. Breed breakdown 24
4. Herd improvement 25
A. Use of herd testing 25
B. Herd test averages 27
i) Seasonal averages 27
ii) Monthly averages 29
iii) Breed averages 31
C. Artificial Breeding (AB) statistics 33
D. Herd reproduction 38
E. Calving 41
i) Planned start of calving and median calving dates 41
ii) Calving interval 42
F. Animal Evaluation 43
5. Prices received 49
A. Milk prices 49
B. Dairy farm land prices 50
6. Disease control 51
A. Tuberculosis (Tb) control 51
Appendix 1: Farming regions and districts 52
New Zealand Dairy Statistics 2012-132
List of tables2.1 Summary of milk production statistics for the last 35 seasons 5
2.2 Summary of herd statistics since 1974/75 7
2.3 Summary of herd production for the last 35 seasons 8
2.4 Average production per cow by herd size in 2012/13 11
3.1 Herd analysis by region in 2012/13 14
3.2 Herd production analysis by region in 2012/13 15
3.3 Herd analysis by district in 2012/13 16
3.4 Herd production analysis by district in 2012/13 18
3.5 Herd analysis by operating structure in 2012/13 20
3.6 Herd production analysis by operating structure in 2012/13 21
3.7 Trend in the percentage of herds in each operating structure for the last 10 seasons 21
3.8 Trend in the number of herds in each operating structure for the last 10 seasons 21
3.9 Operating structure by region in 2012/13 22
3.10 Operating structure by herd size in 2012/13 23
4.1 Trend in the use of herd testing services for the last 20 seasons 25
4.2 Use of herd testing by region in 2012/13 26
4.3 Season herd test averages per cow by region in 2012/13 27
4.4 Trend in the national herd test averages for the last 20 seasons 28
4.5 Monthly herd test averages by region in 2012/13 29
4.6 Herd test breed averages by age of cow in 2012/13 31
4.7 Liveweight by age and breed of cow in 2012/13 32
4.8 Trend in Artificial Breeding use for the last nine seasons by region: Cows and yearlings to AB 33
4.9 Mean herd reproductive performance since 2008/09 38
4.10 Mean 6-week in-calf rate by farming region for the last three seasons 39
4.11 Actual 6-week in-calf rate in 2012/13 39
4.12 Estimated 6-week in-calf rate in 2012/13 40
4.13 Mean calving interval by breed since 2000/01 42
4.14 Economic values used from 16 February 2013 43
4.15 Average Breeding Values and Breeding Worth of 2008-born bulls 44
4.16 Number of sires by birth year and breed 44
4.17 Herd Breeding Worth in 2012/13 45
4.18 Herd Production Worth in 2012/13 45
4.19 Cow Breeding Worth in 2012/13 46
4.20 Cow Production Worth in 2012/13 46
4.21 Average Breeding Worth and Breeding Values of all cows born in 2010 by breed 48
4.22 Survivability percentages since 1996/97 48
5.1 Trend in prices received for milksolids for the last 20 seasons 49
5.2 Trend in dairy land sale values since 2009/10 50
6.1 Tuberculosis (Tb) testing and results in 2012/13 51
New Zealand Dairy Statistics 2012-13 3
List of graphs2.1 Trend in the number of herds and average herd size for the last 30 seasons 6
2.2 Milksolid production per cow and per effective hectare since 1992/93 9
2.3 Distribution of herds by milksolids production per cow for the last three seasons 10
2.4 Herd size distribution for 2012/13 compared with 2007/08 12
3.1 Regional distribution of dairy cows in 2012/13 13
3.2 Breed percentages of cows for New Zealand in 2012/13 24
3.3 Breed percentages of cows by region in 2012/13 24
4.1 Trend in the percentage of herds testing for the last 30 seasons 26
4.2 Average milkfat and protein production per cow by region in 2012/13 28
4.3 Liveweight by age and breed of cow in 2012/13 32
4.4 Trend in the percentage of cows to Artificial Breeding for the last 30 seasons 34
4.5 Average number of inseminations per cow for the last 20 seasons 35
4.6 Ayrshire semen usage (%) over cow breed for the last five seasons 35
4.7 Crossbreed semen usage (%) over cow breed for the last five seasons 36
4.8 Jersey semen usage (%) over cow breed for the last five seasons 36
4.9 Holstein-Friesian semen usage (%) over cow breed for the last five seasons 36
4.10 Trend in the percentage of inseminations of each major breed for the last 40 seasons 37
4.11 Mean actual and estimated 6-week in-calf rate since 2008/09 38
4.12 Distribution of actual 6-week in-calf rate in 2012/13 39
4.13 Distribution of estimated 6-week in-calf rate in 2012/13 40
4.14 Planned start of calving and median calving dates for cows (excluding first calvers) by region 41
4.15 Trend in planned start of calving dates for cows (excluding first calvers) by region 42
4.16 Genetic trend of proven dairy bulls by year of birth 44
4.17 Distribution of Herd Breeding Worth in 2012/13 45
4.18 Distribution of Herd Production Worth in 2012/13 45
4.19 Distribution of Cow Breeding Worth in 2012/13 46
4.20 Distribution of Cow Production Worth in 2012/13 46
4.21 Trend in Breeding Worth for all cows 47
4.22 Trend in Production Worth for all cows 47
5.1 Trend in milksolids payout to dairy farmers for the last 30 seasons 50
New Zealand Dairy Statistics 2012-134
1. Introduction
The purpose of New Zealand Dairy Statistics is to provide statistical information related to the New Zealand Dairy Industry. Funding is provided
by Livestock Improvement Corporation (LIC) and DairyNZ Incorporated (dairy farmer levy). Contributors include New Zealand Animal Evaluation
Limited.
Data are sourced from the LIC National Database, dairy companies, Animal Evaluation database, Animal Health Board Annual Report (year
ending 30 June 2013), Real Estate Institute of New Zealand, and Statistics New Zealand.
New Zealand Dairy Statistics 2012/13 is a report that shows historical information up to and including the 2012/13 season. Data for previous
years were released under Dairy Statistics from 1998, Annual Report (Livestock Improvement Division) in 1987/88, Livestock Improvement
Report from 1984/85 to 1986/87, and New Zealand Dairy Board Farm Production Report up to 1983/84.
Prior to 1991/92 the information for the Dairy Statistics publication was obtained primarily from the analysis of the New Zealand Dairy Industry
Cow Census (an annual survey of all dairy farmers). The 1991/92 Dairy Statistics publication was a transition year for which only minimal data
was available.
As of March 2002, LIC became a user-owned co-operative, with responsibility for farm production activities and, in particular, dairy herd
improvement and herd records.
LIC’s activities can broadly be described as genetics, information and advice. Services provided to farmers include farm management
information, herd testing and artificial breeding services, DNA analysis, a farm advisory service, research to improve farm profitability, statistical
information related to the New Zealand dairy industry, and herd recording on the LIC Database.
DairyNZ is the industry organisation representing New Zealand’s dairy farmers. We are funded by farmers through a levy on milksolids. Our
purpose is to secure and enhance the profitability, sustainability and competitiveness of New Zealand dairy farming. For more information, visit
www.dairynz.co.nz
New Zealand Dairy Statistics 2012-13 5
2. National dairy statistics
A. Industry statistics
i) Production
• 1.6% decrease in milksolids processed
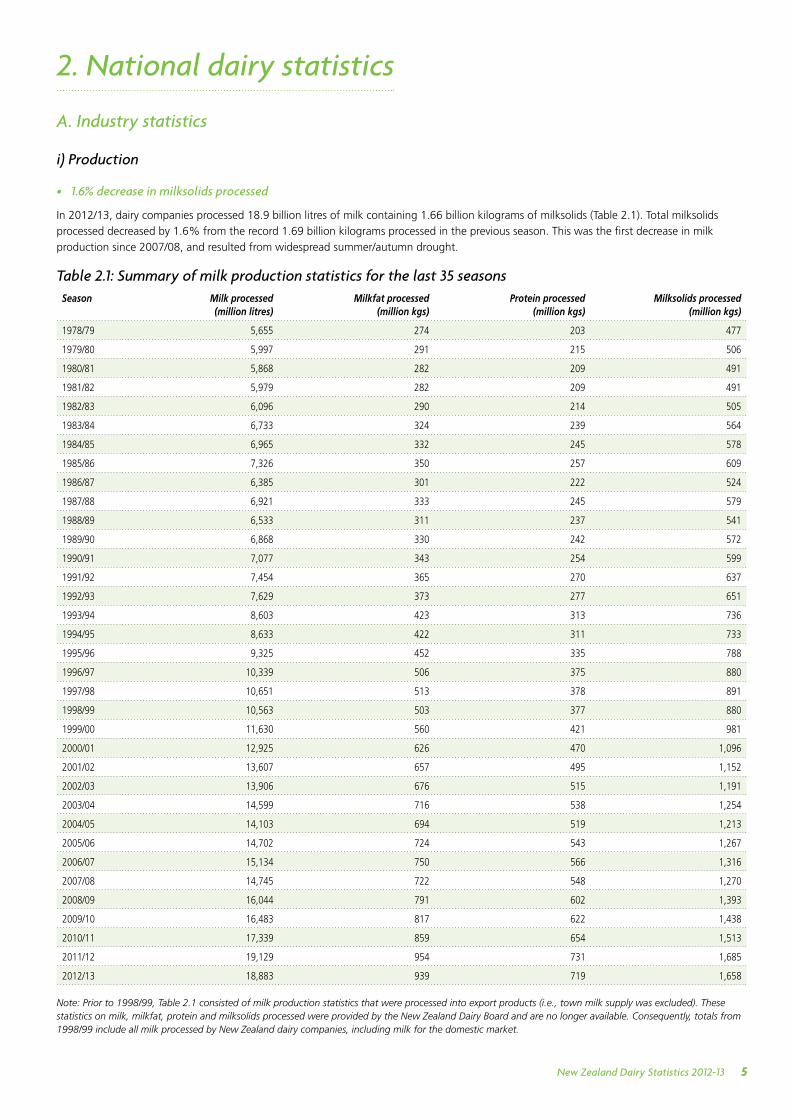
In 2012/13, dairy companies processed 18.9 billion litres of milk containing 1.66 billion kilograms of milksolids (Table 2.1). Total milksolids
processed decreased by 1.6% from the record 1.69 billion kilograms processed in the previous season. This was the first decrease in milk
production since 2007/08, and resulted from widespread summer/autumn drought.
Table 2.1: Summary of milk production statistics for the last 35 seasonsSeason Milk processed
(million litres)Milkfat processed
(million kgs)Protein processed
(million kgs)Milksolids processed
(million kgs)
1978/79 5,655 274 203 477
1979/80 5,997 291 215 506
1980/81 5,868 282 209 491
1981/82 5,979 282 209 491
1982/83 6,096 290 214 505
1983/84 6,733 324 239 564
1984/85 6,965 332 245 578
1985/86 7,326 350 257 609
1986/87 6,385 301 222 524
1987/88 6,921 333 245 579
1988/89 6,533 311 237 541
1989/90 6,868 330 242 572
1990/91 7,077 343 254 599
1991/92 7,454 365 270 637
1992/93 7,629 373 277 651
1993/94 8,603 423 313 736
1994/95 8,633 422 311 733
1995/96 9,325 452 335 788
1996/97 10,339 506 375 880
1997/98 10,651 513 378 891
1998/99 10,563 503 377 880
1999/00 11,630 560 421 981
2000/01 12,925 626 470 1,096
2001/02 13,607 657 495 1,152
2002/03 13,906 676 515 1,191
2003/04 14,599 716 538 1,254
2004/05 14,103 694 519 1,213
2005/06 14,702 724 543 1,267
2006/07 15,134 750 566 1,316
2007/08 14,745 722 548 1,270
2008/09 16,044 791 602 1,393
2009/10 16,483 817 622 1,438
2010/11 17,339 859 654 1,513
2011/12 19,129 954 731 1,685
2012/13 18,883 939 719 1,658
Note: Prior to 1998/99, Table 2.1 consisted of milk production statistics that were processed into export products (i.e., town milk supply was excluded). These statistics on milk, milkfat, protein and milksolids processed were provided by the New Zealand Dairy Board and are no longer available. Consequently, totals from 1998/99 include all milk processed by New Zealand dairy companies, including milk for the domestic market.
New Zealand Dairy Statistics 2012-136
ii) Population
• Small increase in the number of herds
• Cow numbers increase by 150,000 to 4.78 million cows
• Average herd size exceeds 400 cows
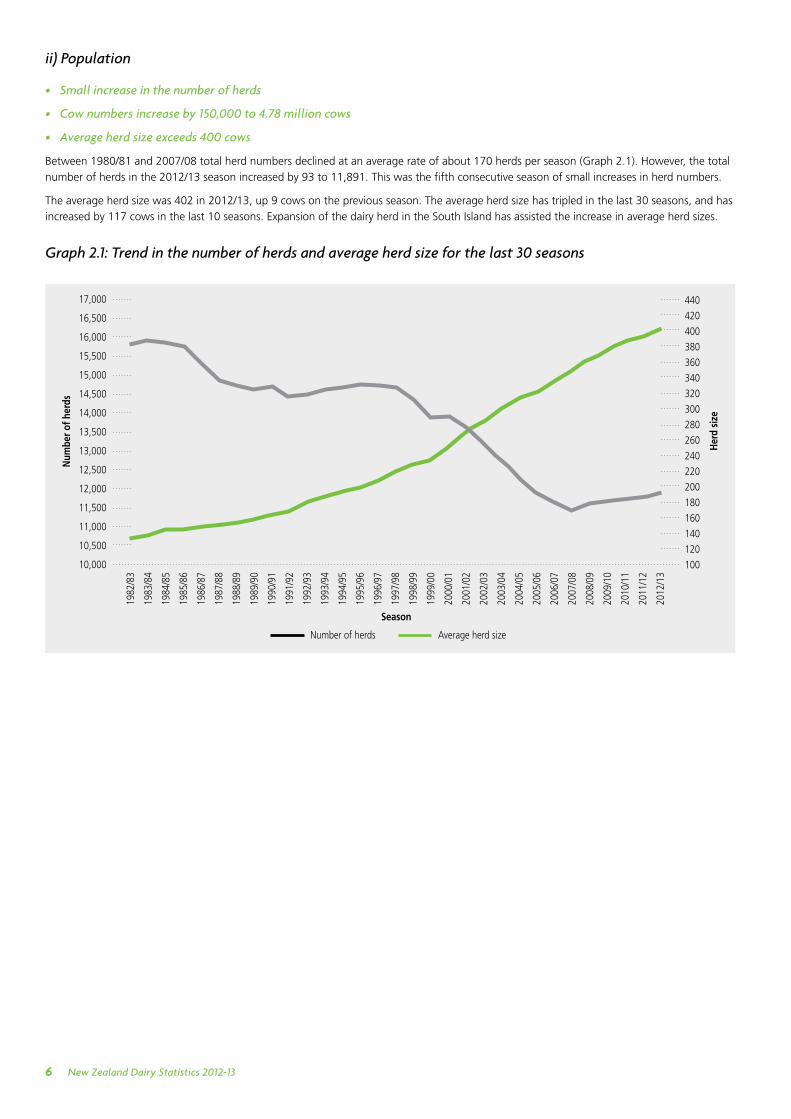
Between 1980/81 and 2007/08 total herd numbers declined at an average rate of about 170 herds per season (Graph 2.1). However, the total
number of herds in the 2012/13 season increased by 93 to 11,891. This was the fifth consecutive season of small increases in herd numbers.
The average herd size was 402 in 2012/13, up 9 cows on the previous season. The average herd size has tripled in the last 30 seasons, and has
increased by 117 cows in the last 10 seasons. Expansion of the dairy herd in the South Island has assisted the increase in average herd sizes.
Graph 2.1: Trend in the number of herds and average herd size for the last 30 seasons
17,000
16,500
16,000
15,500
15,000
14,500
14,000
13,500
13,000
12,500
12,000
11,500
11,000
10,500
10,000
1982
/83
1983
/84
1984
/85
1985
/86
1986
/87
1987
/88
1988
/89
1989
/90
1990
/91
1991
/92
1992
/93
1993
/94
1994
/95
1995
/96
1996
/97
1997
/98
1998
/99
1999
/00
2000
/01
2001
/02
2002
/03
2003
/04
2004
/05
2005
/06
2006
/07
2007
/08
2008
/09
2009
/10
2010
/11
2011
/12
2012
/13
440
420
400
380
360
340
320
300
280
260
240
220
200
180
160
140
120
100
Season
Num
ber o
f her
ds
Her
d si
ze
Number of herds Average herd size
New Zealand Dairy Statistics 2012-13 7
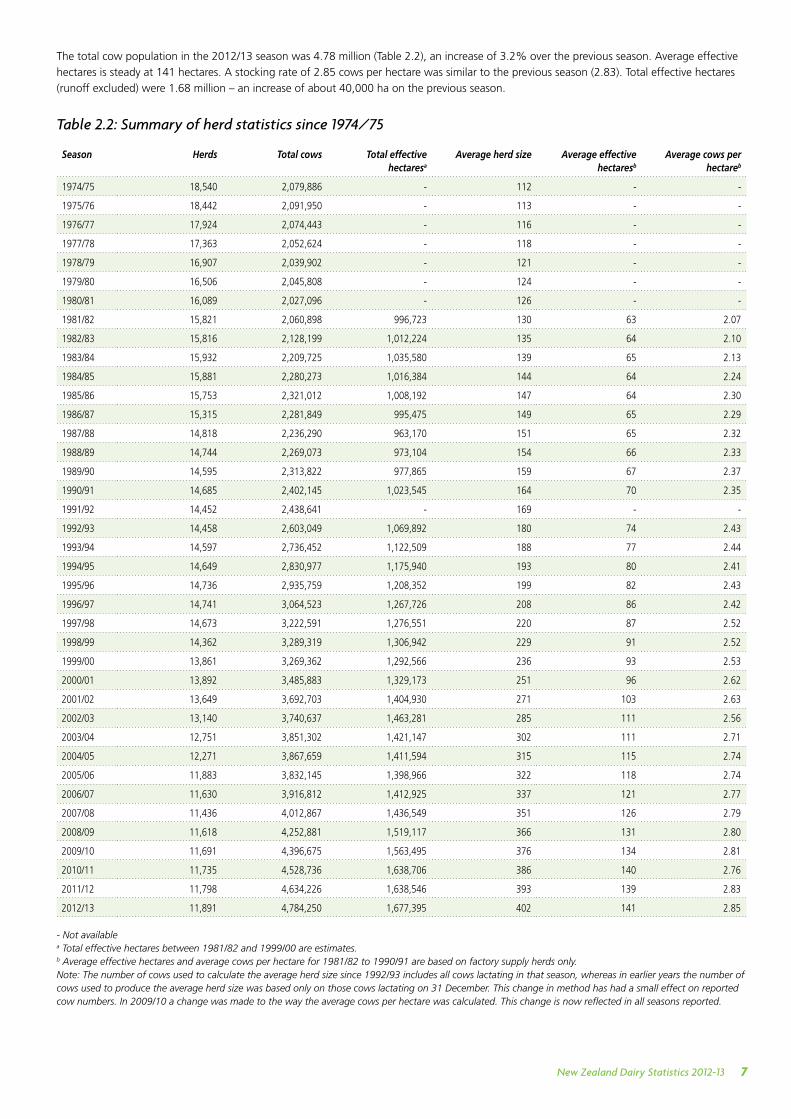
The total cow population in the 2012/13 season was 4.78 million (Table 2.2), an increase of 3.2% over the previous season. Average effective
hectares is steady at 141 hectares. A stocking rate of 2.85 cows per hectare was similar to the previous season (2.83). Total effective hectares
(runoff excluded) were 1.68 million – an increase of about 40,000 ha on the previous season.
Table 2.2: Summary of herd statistics since 1974/75
Season Herds Total cows Total effective hectaresa
Average herd size Average effective hectaresb
Average cows per hectareb
1974/75 18,540 2,079,886 - 112 - -
1975/76 18,442 2,091,950 - 113 - -
1976/77 17,924 2,074,443 - 116 - -
1977/78 17,363 2,052,624 - 118 - -
1978/79 16,907 2,039,902 - 121 - -
1979/80 16,506 2,045,808 - 124 - -
1980/81 16,089 2,027,096 - 126 - -
1981/82 15,821 2,060,898 996,723 130 63 2.07
1982/83 15,816 2,128,199 1,012,224 135 64 2.10
1983/84 15,932 2,209,725 1,035,580 139 65 2.13
1984/85 15,881 2,280,273 1,016,384 144 64 2.24
1985/86 15,753 2,321,012 1,008,192 147 64 2.30
1986/87 15,315 2,281,849 995,475 149 65 2.29
1987/88 14,818 2,236,290 963,170 151 65 2.32
1988/89 14,744 2,269,073 973,104 154 66 2.33
1989/90 14,595 2,313,822 977,865 159 67 2.37
1990/91 14,685 2,402,145 1,023,545 164 70 2.35
1991/92 14,452 2,438,641 - 169 - -
1992/93 14,458 2,603,049 1,069,892 180 74 2.43
1993/94 14,597 2,736,452 1,122,509 188 77 2.44
1994/95 14,649 2,830,977 1,175,940 193 80 2.41
1995/96 14,736 2,935,759 1,208,352 199 82 2.43
1996/97 14,741 3,064,523 1,267,726 208 86 2.42
1997/98 14,673 3,222,591 1,276,551 220 87 2.52
1998/99 14,362 3,289,319 1,306,942 229 91 2.52
1999/00 13,861 3,269,362 1,292,566 236 93 2.53
2000/01 13,892 3,485,883 1,329,173 251 96 2.62
2001/02 13,649 3,692,703 1,404,930 271 103 2.63
2002/03 13,140 3,740,637 1,463,281 285 111 2.56
2003/04 12,751 3,851,302 1,421,147 302 111 2.71
2004/05 12,271 3,867,659 1,411,594 315 115 2.74
2005/06 11,883 3,832,145 1,398,966 322 118 2.74
2006/07 11,630 3,916,812 1,412,925 337 121 2.77
2007/08 11,436 4,012,867 1,436,549 351 126 2.79
2008/09 11,618 4,252,881 1,519,117 366 131 2.80
2009/10 11,691 4,396,675 1,563,495 376 134 2.81
2010/11 11,735 4,528,736 1,638,706 386 140 2.76
2011/12 11,798 4,634,226 1,638,546 393 139 2.83
2012/13 11,891 4,784,250 1,677,395 402 141 2.85
- Not availablea Total effective hectares between 1981/82 and 1999/00 are estimates.b Average effective hectares and average cows per hectare for 1981/82 to 1990/91 are based on factory supply herds only.Note: The number of cows used to calculate the average herd size since 1992/93 includes all cows lactating in that season, whereas in earlier years the number of cows used to produce the average herd size was based only on those cows lactating on 31 December. This change in method has had a small effect on reported cow numbers. In 2009/10 a change was made to the way the average cows per hectare was calculated. This change is now reflected in all seasons reported.
New Zealand Dairy Statistics 2012-138
B. Herd production statistics
• Milk production down on last season
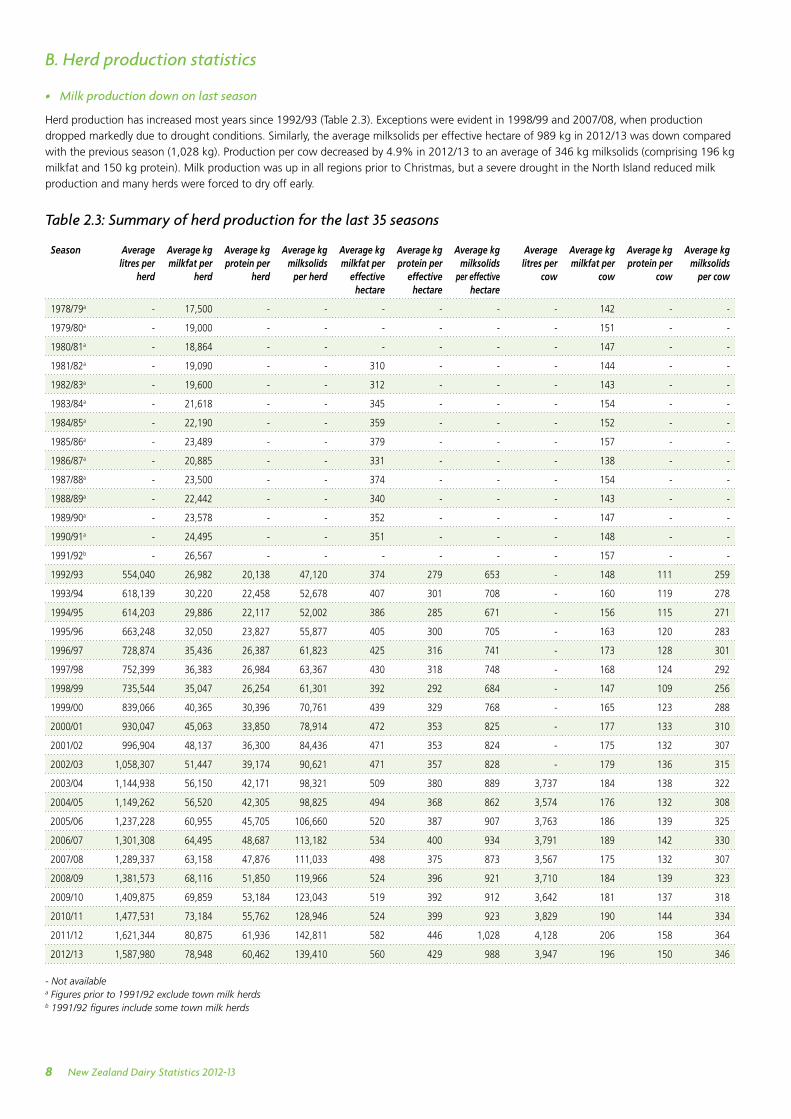
Herd production has increased most years since 1992/93 (Table 2.3). Exceptions were evident in 1998/99 and 2007/08, when production
dropped markedly due to drought conditions. Similarly, the average milksolids per effective hectare of 989 kg in 2012/13 was down compared
with the previous season (1,028 kg). Production per cow decreased by 4.9% in 2012/13 to an average of 346 kg milksolids (comprising 196 kg
milkfat and 150 kg protein). Milk production was up in all regions prior to Christmas, but a severe drought in the North Island reduced milk
production and many herds were forced to dry off early.
Table 2.3: Summary of herd production for the last 35 seasons
Season Average litres per
herd
Average kg milkfat per
herd
Average kg protein per
herd
Average kg milksolids
per herd
Average kg milkfat per
effective hectare
Average kg protein per
effective hectare
Average kg milksolids
per effective hectare
Average litres per
cow
Average kg milkfat per
cow
Average kg protein per
cow
Average kg milksolids
per cow
1978/79a - 17,500 - - - - - - 142 - -
1979/80a - 19,000 - - - - - - 151 - -
1980/81a - 18,864 - - - - - - 147 - -
1981/82a - 19,090 - - 310 - - - 144 - -
1982/83a - 19,600 - - 312 - - - 143 - -
1983/84a - 21,618 - - 345 - - - 154 - -
1984/85a - 22,190 - - 359 - - - 152 - -
1985/86a - 23,489 - - 379 - - - 157 - -
1986/87a - 20,885 - - 331 - - - 138 - -
1987/88a - 23,500 - - 374 - - - 154 - -
1988/89a - 22,442 - - 340 - - - 143 - -
1989/90a - 23,578 - - 352 - - - 147 - -
1990/91a - 24,495 - - 351 - - - 148 - -
1991/92b - 26,567 - - - - - - 157 - -
1992/93 554,040 26,982 20,138 47,120 374 279 653 - 148 111 259
1993/94 618,139 30,220 22,458 52,678 407 301 708 - 160 119 278
1994/95 614,203 29,886 22,117 52,002 386 285 671 - 156 115 271
1995/96 663,248 32,050 23,827 55,877 405 300 705 - 163 120 283
1996/97 728,874 35,436 26,387 61,823 425 316 741 - 173 128 301
1997/98 752,399 36,383 26,984 63,367 430 318 748 - 168 124 292
1998/99 735,544 35,047 26,254 61,301 392 292 684 - 147 109 256
1999/00 839,066 40,365 30,396 70,761 439 329 768 - 165 123 288
2000/01 930,047 45,063 33,850 78,914 472 353 825 - 177 133 310
2001/02 996,904 48,137 36,300 84,436 471 353 824 - 175 132 307
2002/03 1,058,307 51,447 39,174 90,621 471 357 828 - 179 136 315
2003/04 1,144,938 56,150 42,171 98,321 509 380 889 3,737 184 138 322
2004/05 1,149,262 56,520 42,305 98,825 494 368 862 3,574 176 132 308
2005/06 1,237,228 60,955 45,705 106,660 520 387 907 3,763 186 139 325
2006/07 1,301,308 64,495 48,687 113,182 534 400 934 3,791 189 142 330
2007/08 1,289,337 63,158 47,876 111,033 498 375 873 3,567 175 132 307
2008/09 1,381,573 68,116 51,850 119,966 524 396 921 3,710 184 139 323
2009/10 1,409,875 69,859 53,184 123,043 519 392 912 3,642 181 137 318
2010/11 1,477,531 73,184 55,762 128,946 524 399 923 3,829 190 144 334
2011/12 1,621,344 80,875 61,936 142,811 582 446 1,028 4,128 206 158 364
2012/13 1,587,980 78,948 60,462 139,410 560 429 988 3,947 196 150 346
- Not availablea Figures prior to 1991/92 exclude town milk herdsb 1991/92 figures include some town milk herds
New Zealand Dairy Statistics 2012-13 9
i) Production per cow and per hectare
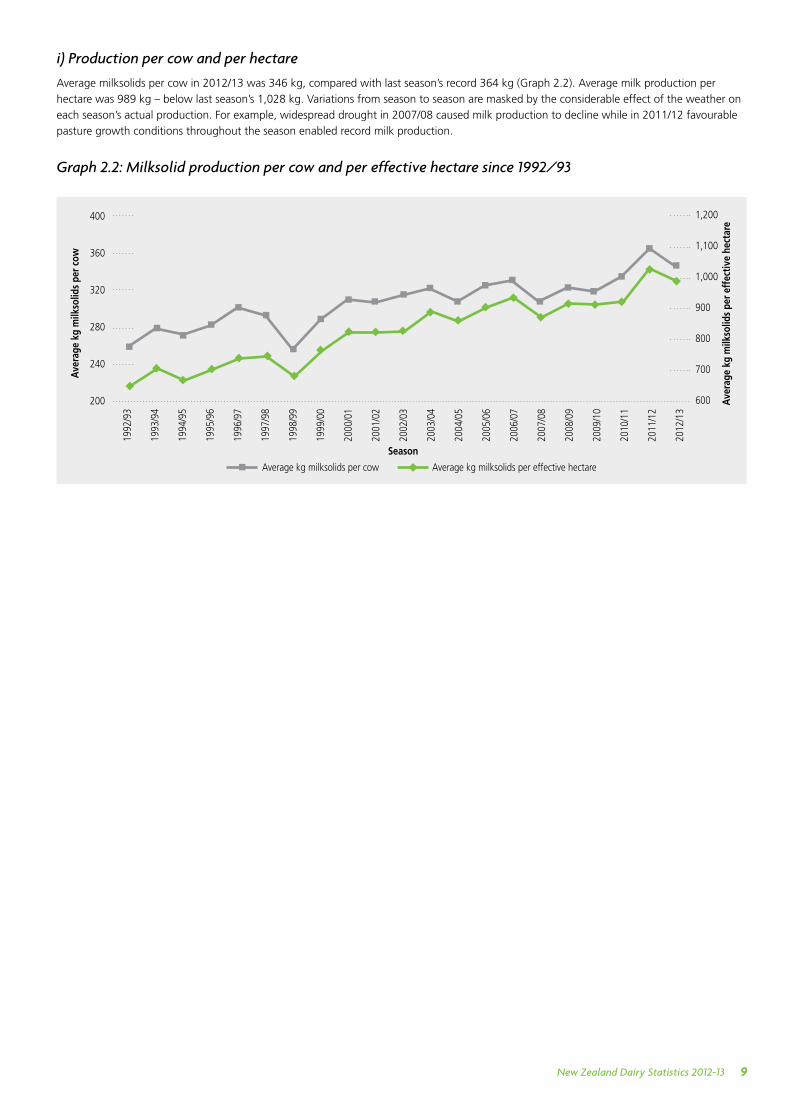
Average milksolids per cow in 2012/13 was 346 kg, compared with last season’s record 364 kg (Graph 2.2). Average milk production per
hectare was 989 kg – below last season’s 1,028 kg. Variations from season to season are masked by the considerable effect of the weather on
each season’s actual production. For example, widespread drought in 2007/08 caused milk production to decline while in 2011/12 favourable
pasture growth conditions throughout the season enabled record milk production.
Graph 2.2: Milksolid production per cow and per effective hectare since 1992/93
400
360
320
280
240
200
1,200
1,100
1,000
900
800
700
600
1992
/93
1993
/94
1994
/95
1995
/96
1996
/97
1997
/98
1998
/99
1999
/00
2000
/01
2001
/02
2002
/03
2003
/04
2004
/05
2005
/06
2006
/07
2007
/08
2008
/09
2009
/10
2010
/11
2011
/12
2012
/13
Ave
rage
kg
milk
solid
s pe
r cow
Ave
rage
kg
milk
solid
s pe
r eff
ectiv
e he
ctar
e
Season
Average kg milksolids per cow Average kg milksolids per effective hectare
New Zealand Dairy Statistics 2012-1310
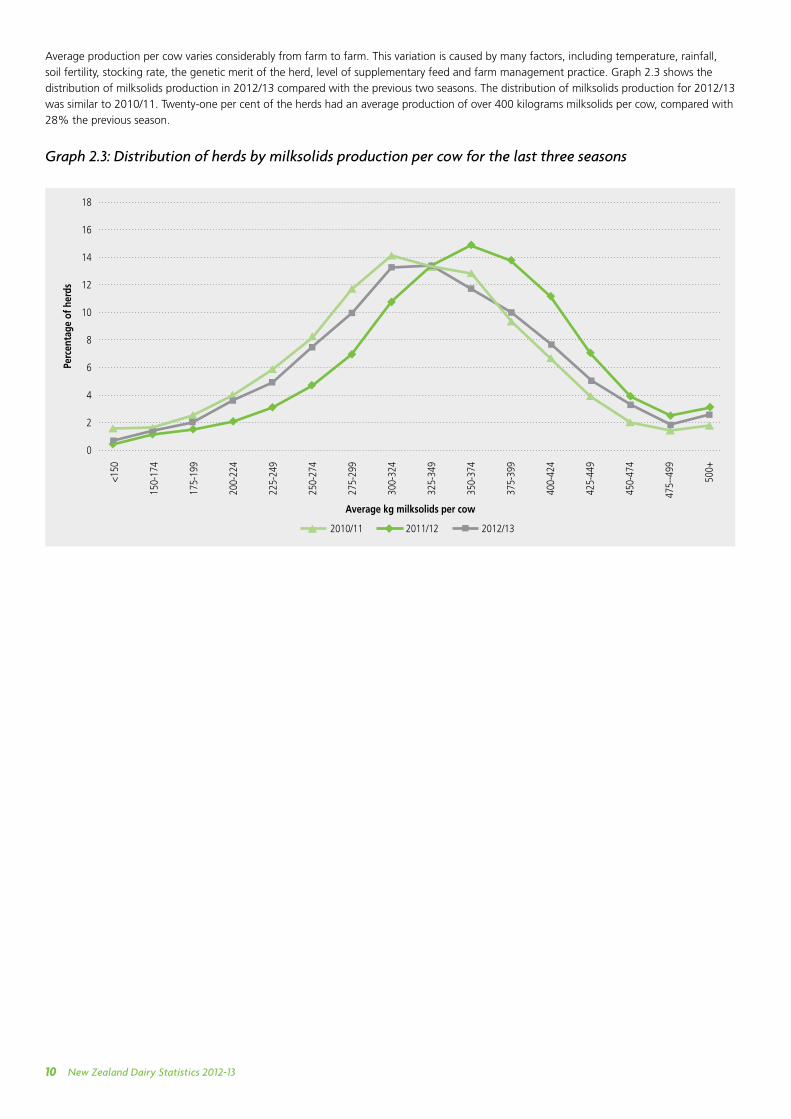
Average production per cow varies considerably from farm to farm. This variation is caused by many factors, including temperature, rainfall,
soil fertility, stocking rate, the genetic merit of the herd, level of supplementary feed and farm management practice. Graph 2.3 shows the
distribution of milksolids production in 2012/13 compared with the previous two seasons. The distribution of milksolids production for 2012/13
was similar to 2010/11. Twenty-one per cent of the herds had an average production of over 400 kilograms milksolids per cow, compared with
28% the previous season.
Graph 2.3: Distribution of herds by milksolids production per cow for the last three seasons
18
16
14
12
10
8
6
4
2
0
<150
150-
174
175-
199
200-
224
225-
249
250-
274
275-
299
300-
324
325-
349
350-
374
375-
399
400-
424
425-
449
450-
474
475-
-499
500+
Perc
enta
ge o
f her
ds
Average kg milksolids per cow
2010/11 2011/12 2012/13
New Zealand Dairy Statistics 2012-13 11
ii) Herd size distribution
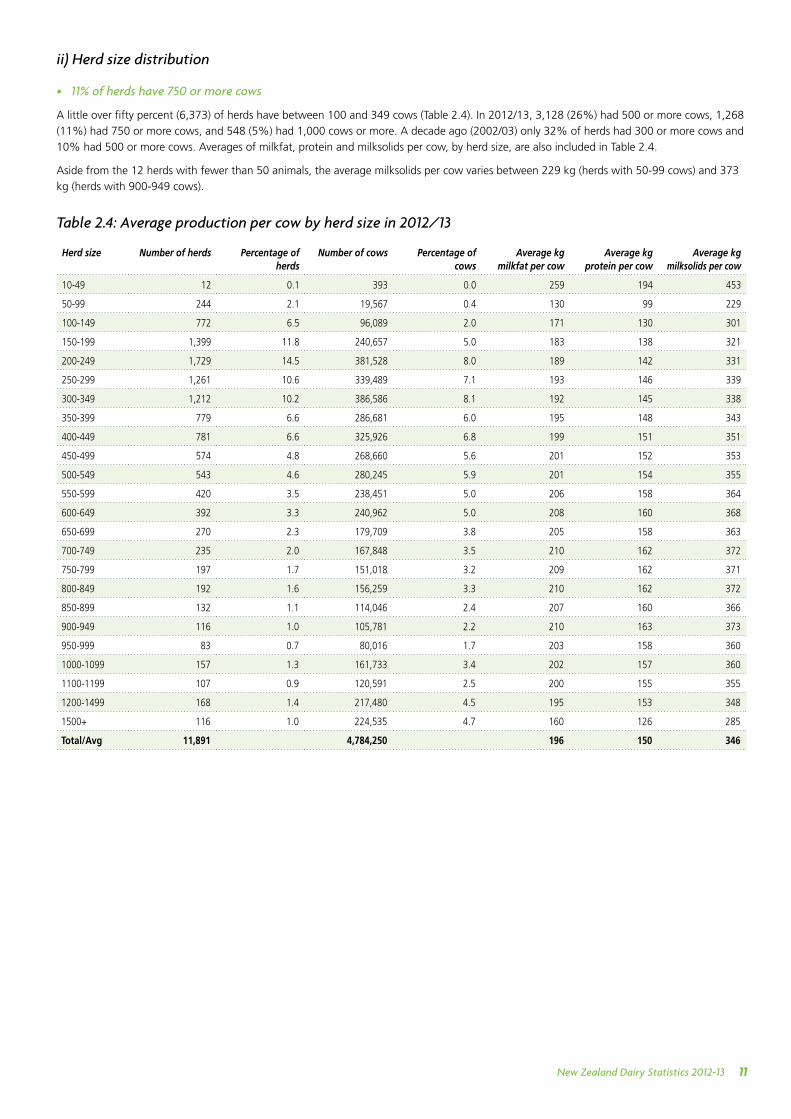
• 11% of herds have 750 or more cows
A little over fifty percent (6,373) of herds have between 100 and 349 cows (Table 2.4). In 2012/13, 3,128 (26%) had 500 or more cows, 1,268
(11%) had 750 or more cows, and 548 (5%) had 1,000 cows or more. A decade ago (2002/03) only 32% of herds had 300 or more cows and
10% had 500 or more cows. Averages of milkfat, protein and milksolids per cow, by herd size, are also included in Table 2.4.
Aside from the 12 herds with fewer than 50 animals, the average milksolids per cow varies between 229 kg (herds with 50-99 cows) and 373
kg (herds with 900-949 cows).
Table 2.4: Average production per cow by herd size in 2012/13
Herd size Number of herds Percentage of herds
Number of cows Percentage of cows
Average kg milkfat per cow
Average kg protein per cow
Average kg milksolids per cow
10-49 12 0.1 393 0.0 259 194 453
50-99 244 2.1 19,567 0.4 130 99 229
100-149 772 6.5 96,089 2.0 171 130 301
150-199 1,399 11.8 240,657 5.0 183 138 321
200-249 1,729 14.5 381,528 8.0 189 142 331
250-299 1,261 10.6 339,489 7.1 193 146 339
300-349 1,212 10.2 386,586 8.1 192 145 338
350-399 779 6.6 286,681 6.0 195 148 343
400-449 781 6.6 325,926 6.8 199 151 351
450-499 574 4.8 268,660 5.6 201 152 353
500-549 543 4.6 280,245 5.9 201 154 355
550-599 420 3.5 238,451 5.0 206 158 364
600-649 392 3.3 240,962 5.0 208 160 368
650-699 270 2.3 179,709 3.8 205 158 363
700-749 235 2.0 167,848 3.5 210 162 372
750-799 197 1.7 151,018 3.2 209 162 371
800-849 192 1.6 156,259 3.3 210 162 372
850-899 132 1.1 114,046 2.4 207 160 366
900-949 116 1.0 105,781 2.2 210 163 373
950-999 83 0.7 80,016 1.7 203 158 360
1000-1099 157 1.3 161,733 3.4 202 157 360
1100-1199 107 0.9 120,591 2.5 200 155 355
1200-1499 168 1.4 217,480 4.5 195 153 348
1500+ 116 1.0 224,535 4.7 160 126 285
Total/Avg 11,891 4,784,250 196 150 346
New Zealand Dairy Statistics 2012-1312
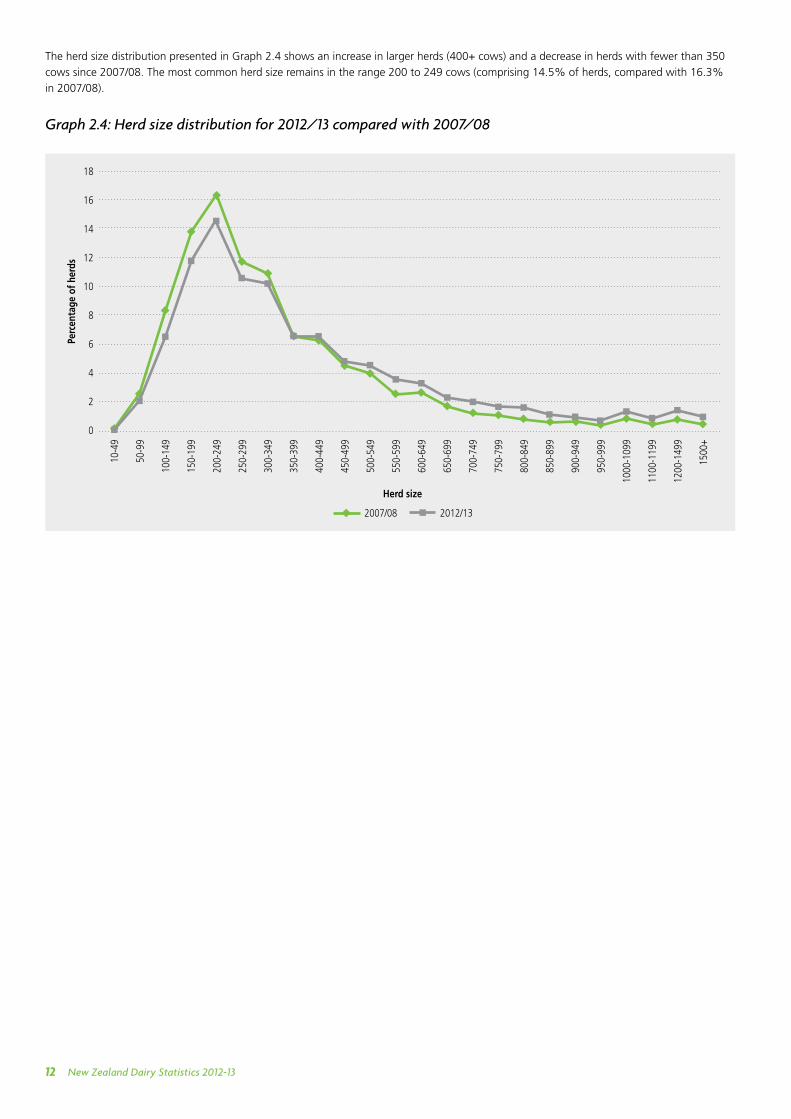
The herd size distribution presented in Graph 2.4 shows an increase in larger herds (400+ cows) and a decrease in herds with fewer than 350
cows since 2007/08. The most common herd size remains in the range 200 to 249 cows (comprising 14.5% of herds, compared with 16.3%
in 2007/08).
Graph 2.4: Herd size distribution for 2012/13 compared with 2007/08
18
16
14
12
10
8
6
4
2
0
10-4
9
50-9
9
100-
149
150-
199
200-
249
250-
299
300-
349
350-
399
400-
449
450-
499
500-
549
550-
599
600-
649
650-
699
700-
749
750-
799
800-
849
850-
899
900-
949
950-
999
1000
-109
9
1100
-119
9
1200
-149
9
1500
+
Perc
enta
ge o
f her
ds
Herd size
2007/08 2012/13
New Zealand Dairy Statistics 2012-13 13
3. Regional dairy statistics
A. Region
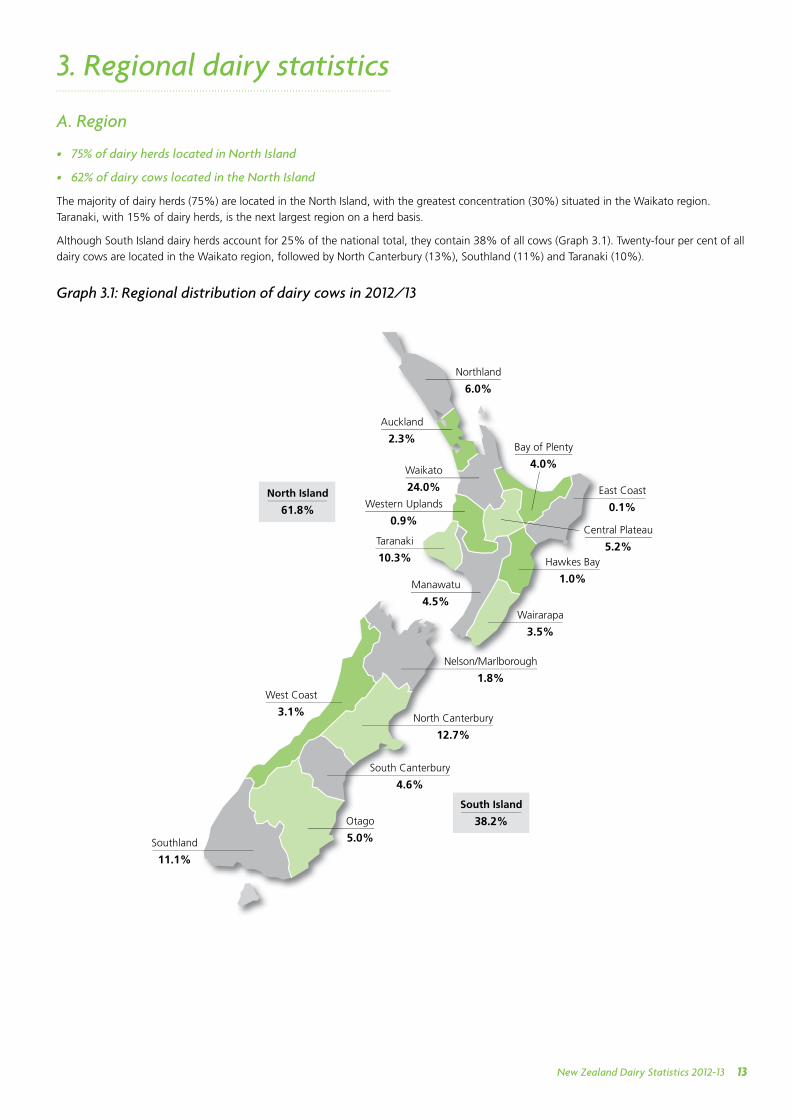
• 75% of dairy herds located in North Island
• 62% of dairy cows located in the North Island
The majority of dairy herds (75%) are located in the North Island, with the greatest concentration (30%) situated in the Waikato region.
Taranaki, with 15% of dairy herds, is the next largest region on a herd basis.
Although South Island dairy herds account for 25% of the national total, they contain 38% of all cows (Graph 3.1). Twenty-four per cent of all
dairy cows are located in the Waikato region, followed by North Canterbury (13%), Southland (11%) and Taranaki (10%).
Graph 3.1: Regional distribution of dairy cows in 2012/13
Northland
6.0%
Nelson/Marlborough
1.8%
Otago
5.0%
North Canterbury
12.7%
West Coast
3.1%
Manawatu
4.5%
Taranaki
10.3%
Western Uplands
0.9%
Waikato
24.0%
Auckland
2.3%Bay of Plenty
4.0%
Central Plateau
5.2%Hawkes Bay
1.0%
Wairarapa
3.5%
South Canterbury
4.6%
Southland
11.1%
East Coast
0.1%North Island
61.8%
South Island
38.2%
New Zealand Dairy Statistics 2012-1314
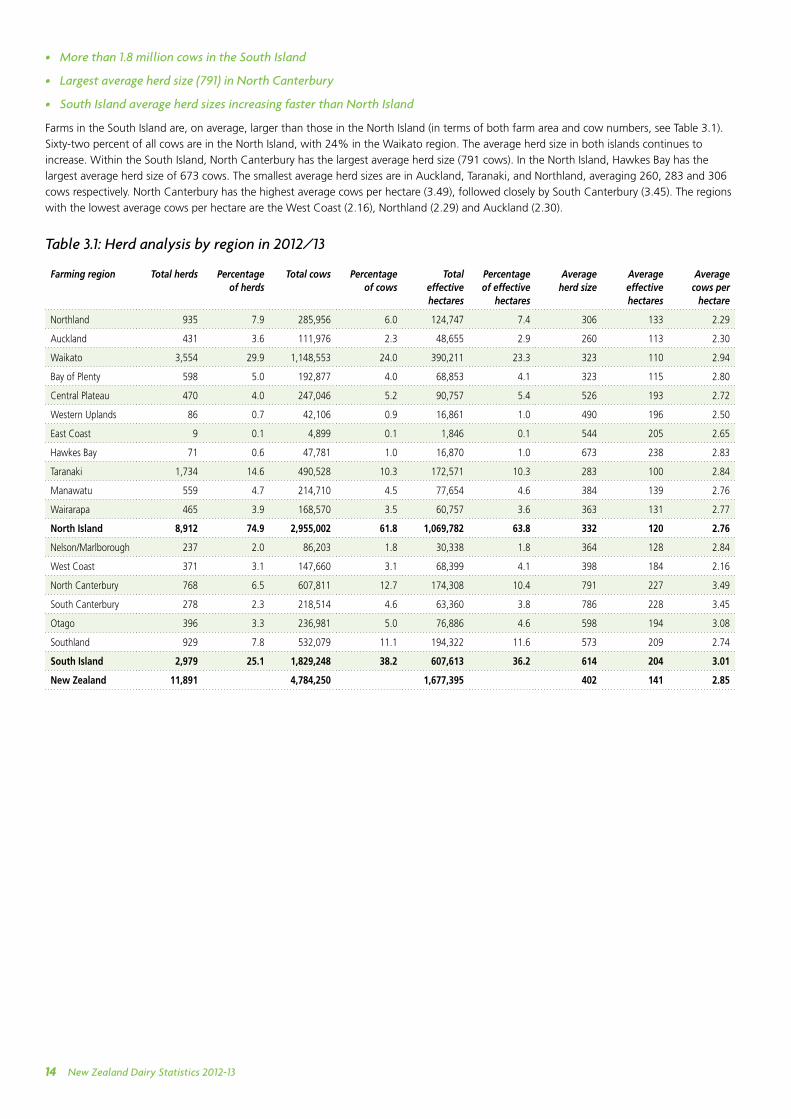
• More than 1.8 million cows in the South Island
• Largest average herd size (791) in North Canterbury
• South Island average herd sizes increasing faster than North Island
Farms in the South Island are, on average, larger than those in the North Island (in terms of both farm area and cow numbers, see Table 3.1).
Sixty-two percent of all cows are in the North Island, with 24% in the Waikato region. The average herd size in both islands continues to
increase. Within the South Island, North Canterbury has the largest average herd size (791 cows). In the North Island, Hawkes Bay has the
largest average herd size of 673 cows. The smallest average herd sizes are in Auckland, Taranaki, and Northland, averaging 260, 283 and 306
cows respectively. North Canterbury has the highest average cows per hectare (3.49), followed closely by South Canterbury (3.45). The regions
with the lowest average cows per hectare are the West Coast (2.16), Northland (2.29) and Auckland (2.30).
Table 3.1: Herd analysis by region in 2012/13
Farming region Total herds Percentage of herds
Total cows Percentage of cows
Total effective hectares
Percentage of effective
hectares
Average herd size
Average effective hectares
Average cows per
hectare
Northland 935 7.9 285,956 6.0 124,747 7.4 306 133 2.29
Auckland 431 3.6 111,976 2.3 48,655 2.9 260 113 2.30
Waikato 3,554 29.9 1,148,553 24.0 390,211 23.3 323 110 2.94
Bay of Plenty 598 5.0 192,877 4.0 68,853 4.1 323 115 2.80
Central Plateau 470 4.0 247,046 5.2 90,757 5.4 526 193 2.72
Western Uplands 86 0.7 42,106 0.9 16,861 1.0 490 196 2.50
East Coast 9 0.1 4,899 0.1 1,846 0.1 544 205 2.65
Hawkes Bay 71 0.6 47,781 1.0 16,870 1.0 673 238 2.83
Taranaki 1,734 14.6 490,528 10.3 172,571 10.3 283 100 2.84
Manawatu 559 4.7 214,710 4.5 77,654 4.6 384 139 2.76
Wairarapa 465 3.9 168,570 3.5 60,757 3.6 363 131 2.77
North Island 8,912 74.9 2,955,002 61.8 1,069,782 63.8 332 120 2.76
Nelson/Marlborough 237 2.0 86,203 1.8 30,338 1.8 364 128 2.84
West Coast 371 3.1 147,660 3.1 68,399 4.1 398 184 2.16
North Canterbury 768 6.5 607,811 12.7 174,308 10.4 791 227 3.49
South Canterbury 278 2.3 218,514 4.6 63,360 3.8 786 228 3.45
Otago 396 3.3 236,981 5.0 76,886 4.6 598 194 3.08
Southland 929 7.8 532,079 11.1 194,322 11.6 573 209 2.74
South Island 2,979 25.1 1,829,248 38.2 607,613 36.2 614 204 3.01
New Zealand 11,891 4,784,250 1,677,395 402 141 2.85
New Zealand Dairy Statistics 2012-13 15
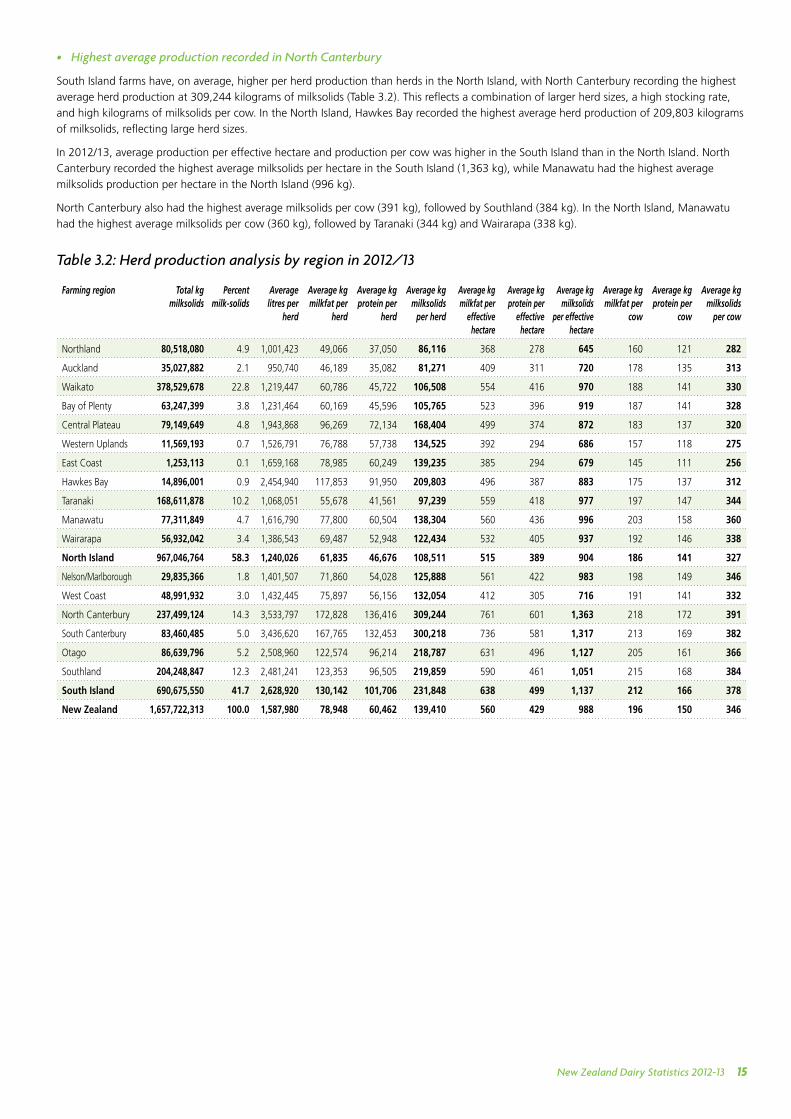
• Highest average production recorded in North Canterbury
South Island farms have, on average, higher per herd production than herds in the North Island, with North Canterbury recording the highest
average herd production at 309,244 kilograms of milksolids (Table 3.2). This reflects a combination of larger herd sizes, a high stocking rate,
and high kilograms of milksolids per cow. In the North Island, Hawkes Bay recorded the highest average herd production of 209,803 kilograms
of milksolids, reflecting large herd sizes.
In 2012/13, average production per effective hectare and production per cow was higher in the South Island than in the North Island. North
Canterbury recorded the highest average milksolids per hectare in the South Island (1,363 kg), while Manawatu had the highest average
milksolids production per hectare in the North Island (996 kg).
North Canterbury also had the highest average milksolids per cow (391 kg), followed by Southland (384 kg). In the North Island, Manawatu
had the highest average milksolids per cow (360 kg), followed by Taranaki (344 kg) and Wairarapa (338 kg).
Table 3.2: Herd production analysis by region in 2012/13
Farming region Total kg milksolids
Percent milk-solids
Average litres per
herd
Average kg milkfat per
herd
Average kg protein per
herd
Average kg milksolids
per herd
Average kg milkfat per
effective hectare
Average kg protein per
effective hectare
Average kg milksolids
per effective hectare
Average kg milkfat per
cow
Average kg protein per
cow
Average kg milksolids
per cow
Northland 80,518,080 4.9 1,001,423 49,066 37,050 86,116 368 278 645 160 121 282
Auckland 35,027,882 2.1 950,740 46,189 35,082 81,271 409 311 720 178 135 313
Waikato 378,529,678 22.8 1,219,447 60,786 45,722 106,508 554 416 970 188 141 330
Bay of Plenty 63,247,399 3.8 1,231,464 60,169 45,596 105,765 523 396 919 187 141 328
Central Plateau 79,149,649 4.8 1,943,868 96,269 72,134 168,404 499 374 872 183 137 320
Western Uplands 11,569,193 0.7 1,526,791 76,788 57,738 134,525 392 294 686 157 118 275
East Coast 1,253,113 0.1 1,659,168 78,985 60,249 139,235 385 294 679 145 111 256
Hawkes Bay 14,896,001 0.9 2,454,940 117,853 91,950 209,803 496 387 883 175 137 312
Taranaki 168,611,878 10.2 1,068,051 55,678 41,561 97,239 559 418 977 197 147 344
Manawatu 77,311,849 4.7 1,616,790 77,800 60,504 138,304 560 436 996 203 158 360
Wairarapa 56,932,042 3.4 1,386,543 69,487 52,948 122,434 532 405 937 192 146 338
North Island 967,046,764 58.3 1,240,026 61,835 46,676 108,511 515 389 904 186 141 327
Nelson/Marlborough 29,835,366 1.8 1,401,507 71,860 54,028 125,888 561 422 983 198 149 346
West Coast 48,991,932 3.0 1,432,445 75,897 56,156 132,054 412 305 716 191 141 332
North Canterbury 237,499,124 14.3 3,533,797 172,828 136,416 309,244 761 601 1,363 218 172 391
South Canterbury 83,460,485 5.0 3,436,620 167,765 132,453 300,218 736 581 1,317 213 169 382
Otago 86,639,796 5.2 2,508,960 122,574 96,214 218,787 631 496 1,127 205 161 366
Southland 204,248,847 12.3 2,481,241 123,353 96,505 219,859 590 461 1,051 215 168 384
South Island 690,675,550 41.7 2,628,920 130,142 101,706 231,848 638 499 1,137 212 166 378
New Zealand 1,657,722,313 100.0 1,587,980 78,948 60,462 139,410 560 429 988 196 150 346
New Zealand Dairy Statistics 2012-1316
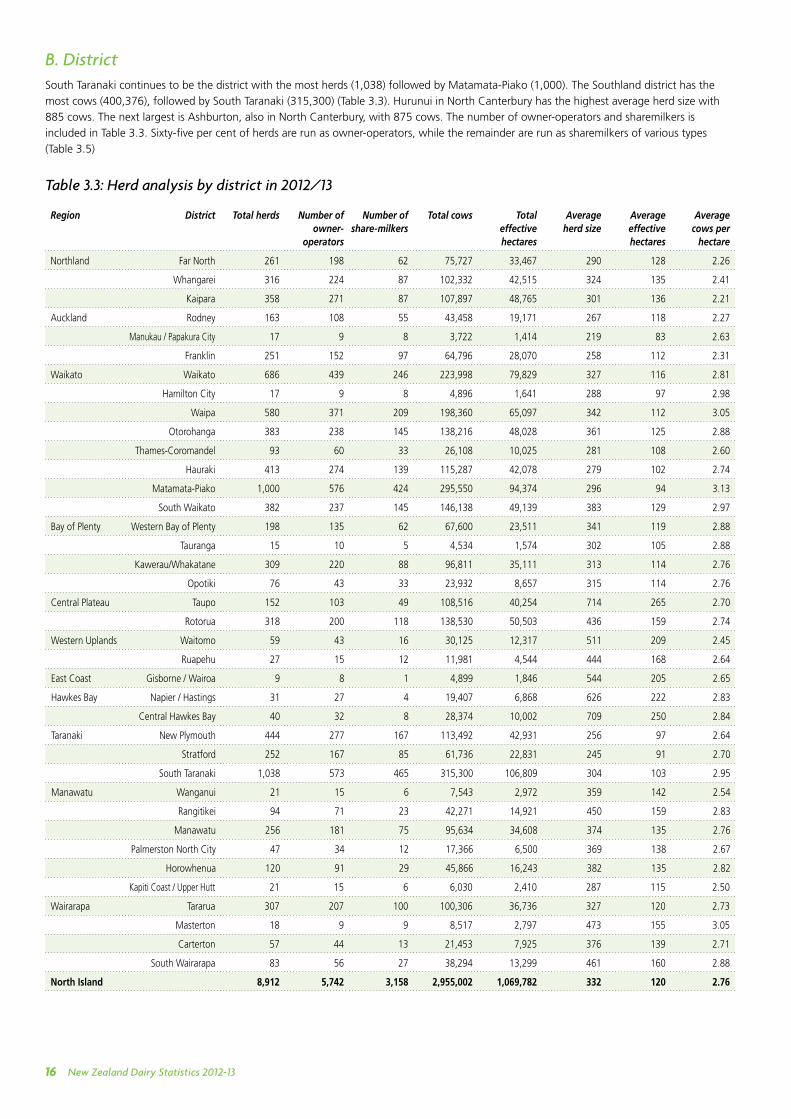
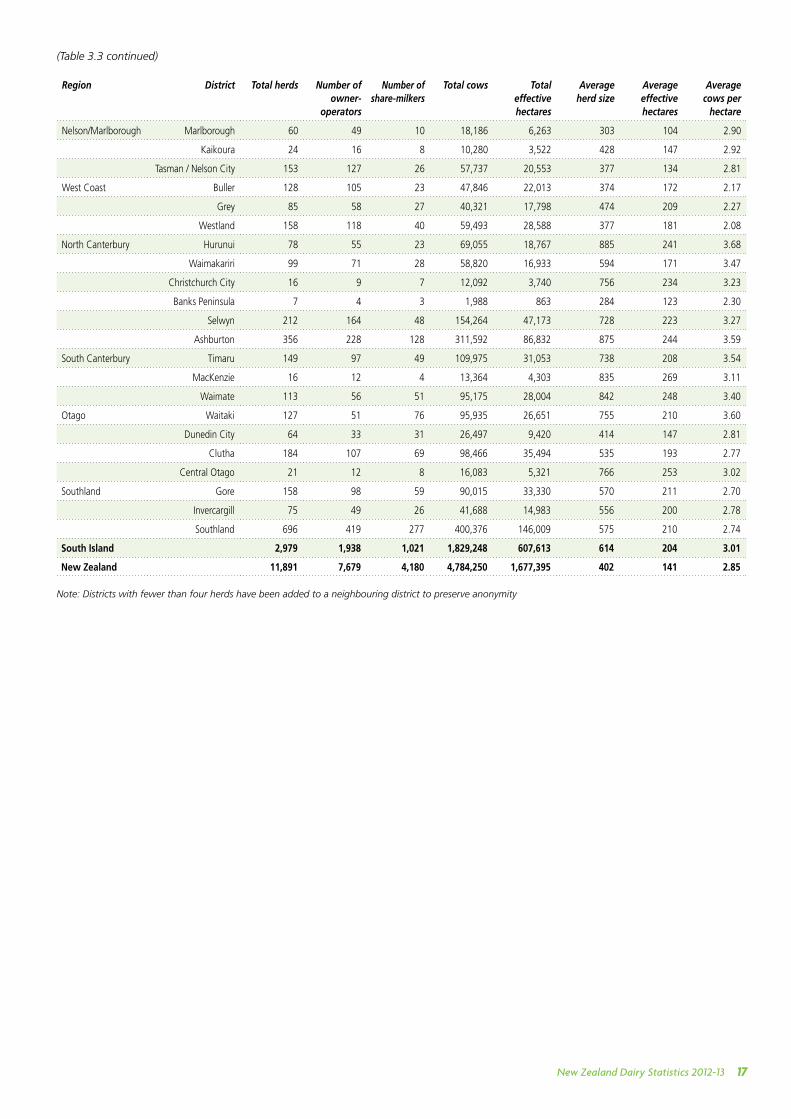
B. DistrictSouth Taranaki continues to be the district with the most herds (1,038) followed by Matamata-Piako (1,000). The Southland district has the
most cows (400,376), followed by South Taranaki (315,300) (Table 3.3). Hurunui in North Canterbury has the highest average herd size with
885 cows. The next largest is Ashburton, also in North Canterbury, with 875 cows. The number of owner-operators and sharemilkers is
included in Table 3.3. Sixty-five per cent of herds are run as owner-operators, while the remainder are run as sharemilkers of various types
(Table 3.5)
Table 3.3: Herd analysis by district in 2012/13
Region District Total herds Number of owner-
operators
Number of share-milkers
Total cows Total effective hectares
Average herd size
Average effective hectares
Average cows per
hectare
Northland Far North 261 198 62 75,727 33,467 290 128 2.26
Whangarei 316 224 87 102,332 42,515 324 135 2.41
Kaipara 358 271 87 107,897 48,765 301 136 2.21
Auckland Rodney 163 108 55 43,458 19,171 267 118 2.27
Manukau / Papakura City 17 9 8 3,722 1,414 219 83 2.63
Franklin 251 152 97 64,796 28,070 258 112 2.31
Waikato Waikato 686 439 246 223,998 79,829 327 116 2.81
Hamilton City 17 9 8 4,896 1,641 288 97 2.98
Waipa 580 371 209 198,360 65,097 342 112 3.05
Otorohanga 383 238 145 138,216 48,028 361 125 2.88
Thames-Coromandel 93 60 33 26,108 10,025 281 108 2.60
Hauraki 413 274 139 115,287 42,078 279 102 2.74
Matamata-Piako 1,000 576 424 295,550 94,374 296 94 3.13
South Waikato 382 237 145 146,138 49,139 383 129 2.97
Bay of Plenty Western Bay of Plenty 198 135 62 67,600 23,511 341 119 2.88
Tauranga 15 10 5 4,534 1,574 302 105 2.88
Kawerau/Whakatane 309 220 88 96,811 35,111 313 114 2.76
Opotiki 76 43 33 23,932 8,657 315 114 2.76
Central Plateau Taupo 152 103 49 108,516 40,254 714 265 2.70
Rotorua 318 200 118 138,530 50,503 436 159 2.74
Western Uplands Waitomo 59 43 16 30,125 12,317 511 209 2.45
Ruapehu 27 15 12 11,981 4,544 444 168 2.64
East Coast Gisborne / Wairoa 9 8 1 4,899 1,846 544 205 2.65
Hawkes Bay Napier / Hastings 31 27 4 19,407 6,868 626 222 2.83
Central Hawkes Bay 40 32 8 28,374 10,002 709 250 2.84
Taranaki New Plymouth 444 277 167 113,492 42,931 256 97 2.64
Stratford 252 167 85 61,736 22,831 245 91 2.70
South Taranaki 1,038 573 465 315,300 106,809 304 103 2.95
Manawatu Wanganui 21 15 6 7,543 2,972 359 142 2.54
Rangitikei 94 71 23 42,271 14,921 450 159 2.83
Manawatu 256 181 75 95,634 34,608 374 135 2.76
Palmerston North City 47 34 12 17,366 6,500 369 138 2.67
Horowhenua 120 91 29 45,866 16,243 382 135 2.82
Kapiti Coast / Upper Hutt 21 15 6 6,030 2,410 287 115 2.50
Wairarapa Tararua 307 207 100 100,306 36,736 327 120 2.73
Masterton 18 9 9 8,517 2,797 473 155 3.05
Carterton 57 44 13 21,453 7,925 376 139 2.71
South Wairarapa 83 56 27 38,294 13,299 461 160 2.88
North Island 8,912 5,742 3,158 2,955,002 1,069,782 332 120 2.76
New Zealand Dairy Statistics 2012-13 17
(Table 3.3 continued)
Region District Total herds Number of owner-
operators
Number of share-milkers
Total cows Total effective hectares
Average herd size
Average effective hectares
Average cows per
hectare
Nelson/Marlborough Marlborough 60 49 10 18,186 6,263 303 104 2.90
Kaikoura 24 16 8 10,280 3,522 428 147 2.92
Tasman / Nelson City 153 127 26 57,737 20,553 377 134 2.81
West Coast Buller 128 105 23 47,846 22,013 374 172 2.17
Grey 85 58 27 40,321 17,798 474 209 2.27
Westland 158 118 40 59,493 28,588 377 181 2.08
North Canterbury Hurunui 78 55 23 69,055 18,767 885 241 3.68
Waimakariri 99 71 28 58,820 16,933 594 171 3.47
Christchurch City 16 9 7 12,092 3,740 756 234 3.23
Banks Peninsula 7 4 3 1,988 863 284 123 2.30
Selwyn 212 164 48 154,264 47,173 728 223 3.27
Ashburton 356 228 128 311,592 86,832 875 244 3.59
South Canterbury Timaru 149 97 49 109,975 31,053 738 208 3.54
MacKenzie 16 12 4 13,364 4,303 835 269 3.11
Waimate 113 56 51 95,175 28,004 842 248 3.40
Otago Waitaki 127 51 76 95,935 26,651 755 210 3.60
Dunedin City 64 33 31 26,497 9,420 414 147 2.81
Clutha 184 107 69 98,466 35,494 535 193 2.77
Central Otago 21 12 8 16,083 5,321 766 253 3.02
Southland Gore 158 98 59 90,015 33,330 570 211 2.70
Invercargill 75 49 26 41,688 14,983 556 200 2.78
Southland 696 419 277 400,376 146,009 575 210 2.74
South Island 2,979 1,938 1,021 1,829,248 607,613 614 204 3.01
New Zealand 11,891 7,679 4,180 4,784,250 1,677,395 402 141 2.85
Note: Districts with fewer than four herds have been added to a neighbouring district to preserve anonymity
New Zealand Dairy Statistics 2012-1318
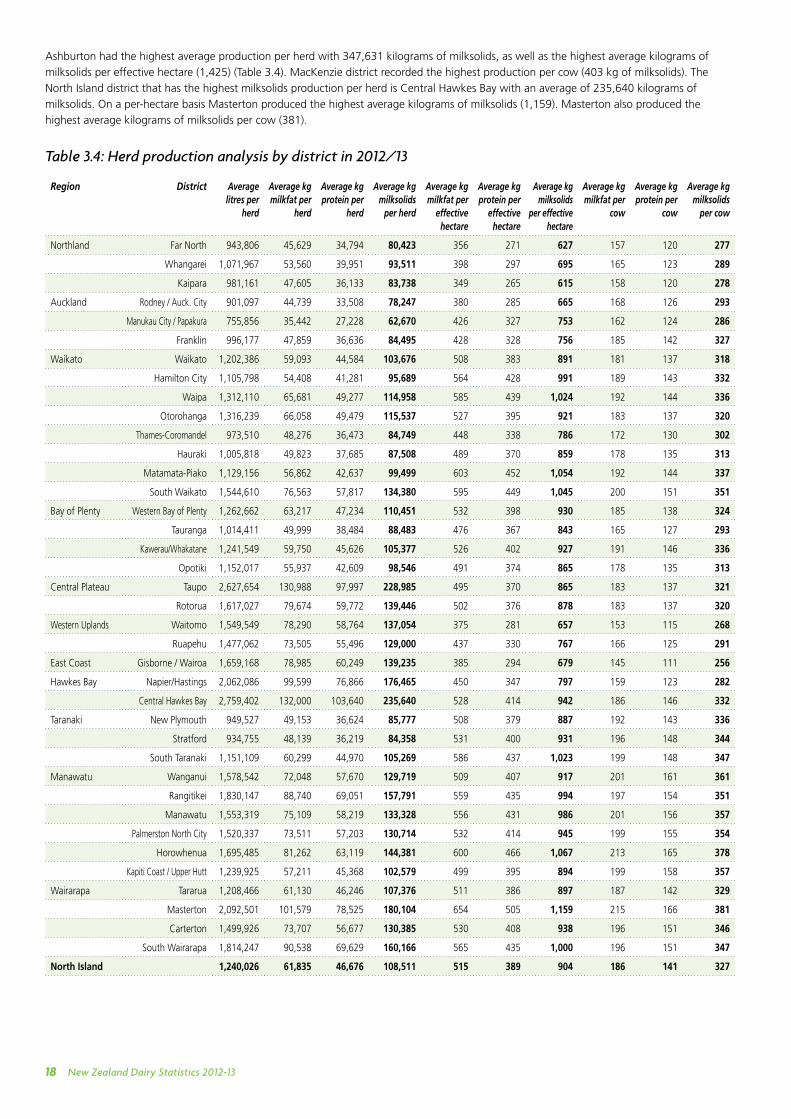
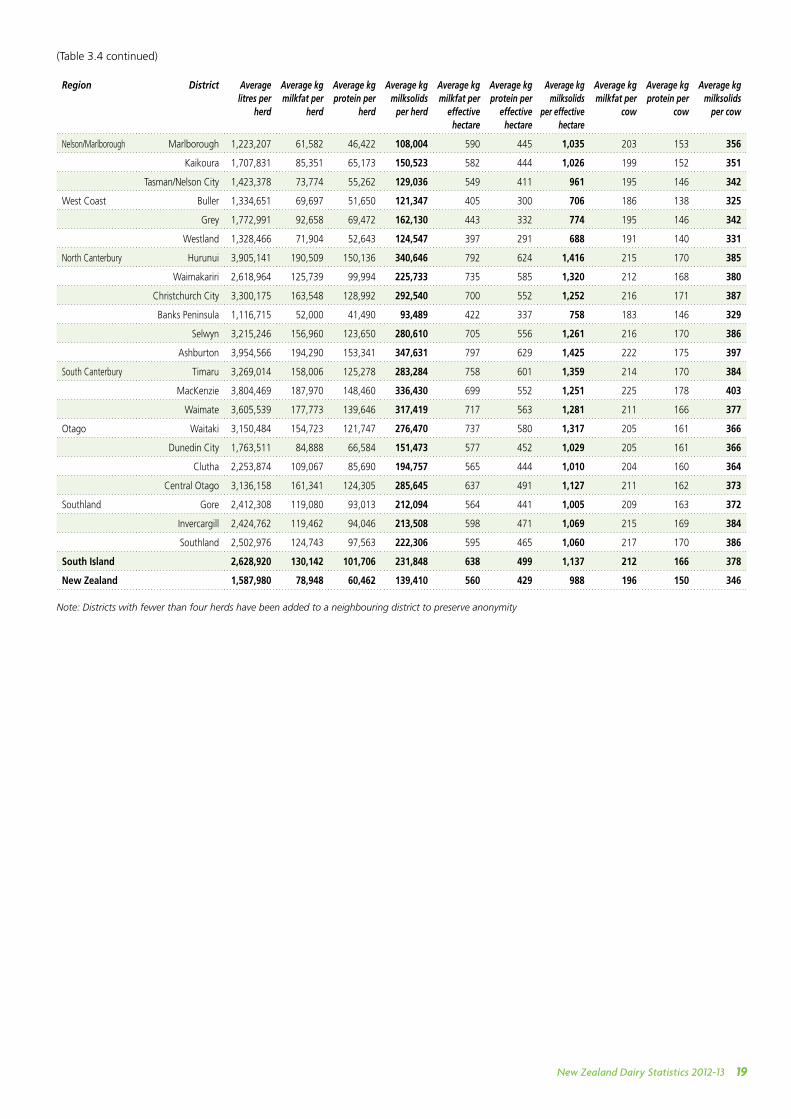
Ashburton had the highest average production per herd with 347,631 kilograms of milksolids, as well as the highest average kilograms of
milksolids per effective hectare (1,425) (Table 3.4). MacKenzie district recorded the highest production per cow (403 kg of milksolids). The
North Island district that has the highest milksolids production per herd is Central Hawkes Bay with an average of 235,640 kilograms of
milksolids. On a per-hectare basis Masterton produced the highest average kilograms of milksolids (1,159). Masterton also produced the
highest average kilograms of milksolids per cow (381).
Table 3.4: Herd production analysis by district in 2012/13
Region District Average litres per
herd
Average kg milkfat per
herd
Average kg protein per
herd
Average kg milksolids
per herd
Average kg milkfat per
effective hectare
Average kg protein per
effective hectare
Average kg milksolids
per effective hectare
Average kg milkfat per
cow
Average kg protein per
cow
Average kg milksolids
per cow
Northland Far North 943,806 45,629 34,794 80,423 356 271 627 157 120 277
Whangarei 1,071,967 53,560 39,951 93,511 398 297 695 165 123 289
Kaipara 981,161 47,605 36,133 83,738 349 265 615 158 120 278
Auckland Rodney / Auck. City 901,097 44,739 33,508 78,247 380 285 665 168 126 293
Manukau City / Papakura 755,856 35,442 27,228 62,670 426 327 753 162 124 286
Franklin 996,177 47,859 36,636 84,495 428 328 756 185 142 327
Waikato Waikato 1,202,386 59,093 44,584 103,676 508 383 891 181 137 318
Hamilton City 1,105,798 54,408 41,281 95,689 564 428 991 189 143 332
Waipa 1,312,110 65,681 49,277 114,958 585 439 1,024 192 144 336
Otorohanga 1,316,239 66,058 49,479 115,537 527 395 921 183 137 320
Thames-Coromandel 973,510 48,276 36,473 84,749 448 338 786 172 130 302
Hauraki 1,005,818 49,823 37,685 87,508 489 370 859 178 135 313
Matamata-Piako 1,129,156 56,862 42,637 99,499 603 452 1,054 192 144 337
South Waikato 1,544,610 76,563 57,817 134,380 595 449 1,045 200 151 351
Bay of Plenty Western Bay of Plenty 1,262,662 63,217 47,234 110,451 532 398 930 185 138 324
Tauranga 1,014,411 49,999 38,484 88,483 476 367 843 165 127 293
Kawerau/Whakatane 1,241,549 59,750 45,626 105,377 526 402 927 191 146 336
Opotiki 1,152,017 55,937 42,609 98,546 491 374 865 178 135 313
Central Plateau Taupo 2,627,654 130,988 97,997 228,985 495 370 865 183 137 321
Rotorua 1,617,027 79,674 59,772 139,446 502 376 878 183 137 320
Western Uplands Waitomo 1,549,549 78,290 58,764 137,054 375 281 657 153 115 268
Ruapehu 1,477,062 73,505 55,496 129,000 437 330 767 166 125 291
East Coast Gisborne / Wairoa 1,659,168 78,985 60,249 139,235 385 294 679 145 111 256
Hawkes Bay Napier/Hastings 2,062,086 99,599 76,866 176,465 450 347 797 159 123 282
Central Hawkes Bay 2,759,402 132,000 103,640 235,640 528 414 942 186 146 332
Taranaki New Plymouth 949,527 49,153 36,624 85,777 508 379 887 192 143 336
Stratford 934,755 48,139 36,219 84,358 531 400 931 196 148 344
South Taranaki 1,151,109 60,299 44,970 105,269 586 437 1,023 199 148 347
Manawatu Wanganui 1,578,542 72,048 57,670 129,719 509 407 917 201 161 361
Rangitikei 1,830,147 88,740 69,051 157,791 559 435 994 197 154 351
Manawatu 1,553,319 75,109 58,219 133,328 556 431 986 201 156 357
Palmerston North City 1,520,337 73,511 57,203 130,714 532 414 945 199 155 354
Horowhenua 1,695,485 81,262 63,119 144,381 600 466 1,067 213 165 378
Kapiti Coast / Upper Hutt 1,239,925 57,211 45,368 102,579 499 395 894 199 158 357
Wairarapa Tararua 1,208,466 61,130 46,246 107,376 511 386 897 187 142 329
Masterton 2,092,501 101,579 78,525 180,104 654 505 1,159 215 166 381
Carterton 1,499,926 73,707 56,677 130,385 530 408 938 196 151 346
South Wairarapa 1,814,247 90,538 69,629 160,166 565 435 1,000 196 151 347
North Island 1,240,026 61,835 46,676 108,511 515 389 904 186 141 327
New Zealand Dairy Statistics 2012-13 19
(Table 3.4 continued)
Region District Average litres per
herd
Average kg milkfat per
herd
Average kg protein per
herd
Average kg milksolids
per herd
Average kg milkfat per
effective hectare
Average kg protein per
effective hectare
Average kg milksolids
per effective hectare
Average kg milkfat per
cow
Average kg protein per
cow
Average kg milksolids
per cow
Nelson/Marlborough Marlborough 1,223,207 61,582 46,422 108,004 590 445 1,035 203 153 356
Kaikoura 1,707,831 85,351 65,173 150,523 582 444 1,026 199 152 351
Tasman/Nelson City 1,423,378 73,774 55,262 129,036 549 411 961 195 146 342
West Coast Buller 1,334,651 69,697 51,650 121,347 405 300 706 186 138 325
Grey 1,772,991 92,658 69,472 162,130 443 332 774 195 146 342
Westland 1,328,466 71,904 52,643 124,547 397 291 688 191 140 331
North Canterbury Hurunui 3,905,141 190,509 150,136 340,646 792 624 1,416 215 170 385
Waimakariri 2,618,964 125,739 99,994 225,733 735 585 1,320 212 168 380
Christchurch City 3,300,175 163,548 128,992 292,540 700 552 1,252 216 171 387
Banks Peninsula 1,116,715 52,000 41,490 93,489 422 337 758 183 146 329
Selwyn 3,215,246 156,960 123,650 280,610 705 556 1,261 216 170 386
Ashburton 3,954,566 194,290 153,341 347,631 797 629 1,425 222 175 397
South Canterbury Timaru 3,269,014 158,006 125,278 283,284 758 601 1,359 214 170 384
MacKenzie 3,804,469 187,970 148,460 336,430 699 552 1,251 225 178 403
Waimate 3,605,539 177,773 139,646 317,419 717 563 1,281 211 166 377
Otago Waitaki 3,150,484 154,723 121,747 276,470 737 580 1,317 205 161 366
Dunedin City 1,763,511 84,888 66,584 151,473 577 452 1,029 205 161 366
Clutha 2,253,874 109,067 85,690 194,757 565 444 1,010 204 160 364
Central Otago 3,136,158 161,341 124,305 285,645 637 491 1,127 211 162 373
Southland Gore 2,412,308 119,080 93,013 212,094 564 441 1,005 209 163 372
Invercargill 2,424,762 119,462 94,046 213,508 598 471 1,069 215 169 384
Southland 2,502,976 124,743 97,563 222,306 595 465 1,060 217 170 386
South Island 2,628,920 130,142 101,706 231,848 638 499 1,137 212 166 378
New Zealand 1,587,980 78,948 60,462 139,410 560 429 988 196 150 346
Note: Districts with fewer than four herds have been added to a neighbouring district to preserve anonymity
New Zealand Dairy Statistics 2012-1320
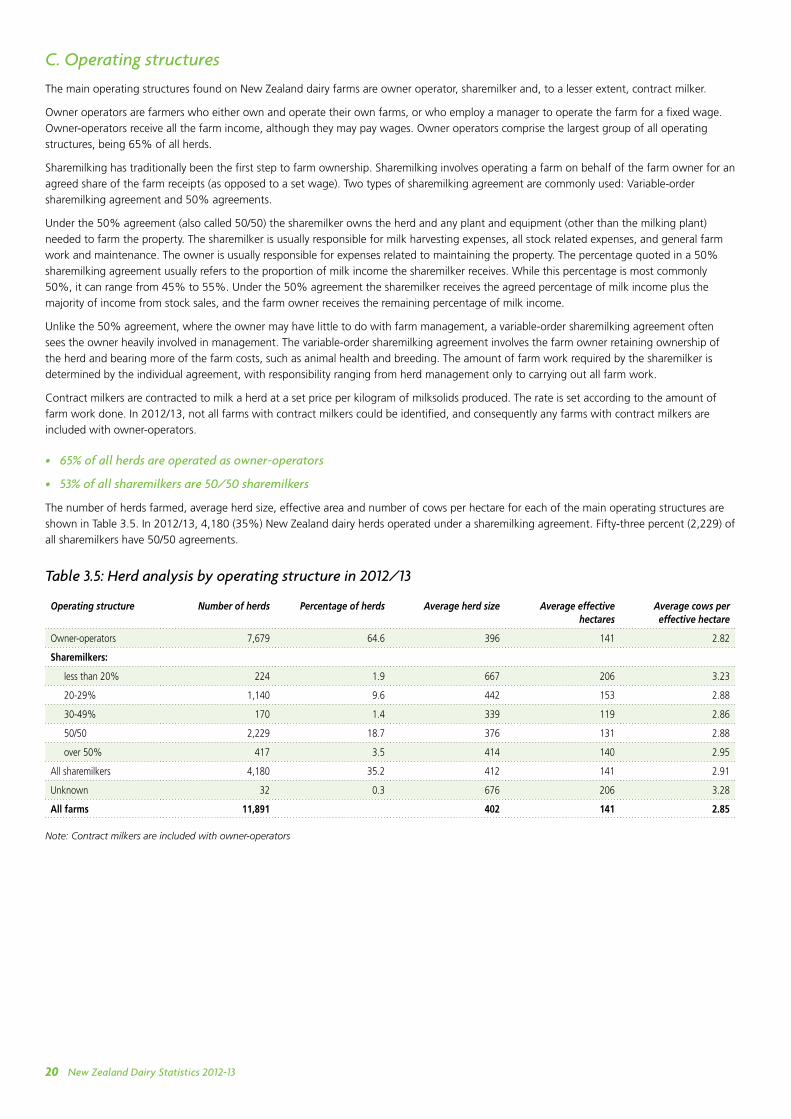
C. Operating structures
The main operating structures found on New Zealand dairy farms are owner operator, sharemilker and, to a lesser extent, contract milker.
Owner operators are farmers who either own and operate their own farms, or who employ a manager to operate the farm for a fixed wage.
Owner-operators receive all the farm income, although they may pay wages. Owner operators comprise the largest group of all operating
structures, being 65% of all herds.
Sharemilking has traditionally been the first step to farm ownership. Sharemilking involves operating a farm on behalf of the farm owner for an
agreed share of the farm receipts (as opposed to a set wage). Two types of sharemilking agreement are commonly used: Variable-order
sharemilking agreement and 50% agreements.
Under the 50% agreement (also called 50/50) the sharemilker owns the herd and any plant and equipment (other than the milking plant)
needed to farm the property. The sharemilker is usually responsible for milk harvesting expenses, all stock related expenses, and general farm
work and maintenance. The owner is usually responsible for expenses related to maintaining the property. The percentage quoted in a 50%
sharemilking agreement usually refers to the proportion of milk income the sharemilker receives. While this percentage is most commonly
50%, it can range from 45% to 55%. Under the 50% agreement the sharemilker receives the agreed percentage of milk income plus the
majority of income from stock sales, and the farm owner receives the remaining percentage of milk income.
Unlike the 50% agreement, where the owner may have little to do with farm management, a variable-order sharemilking agreement often
sees the owner heavily involved in management. The variable-order sharemilking agreement involves the farm owner retaining ownership of
the herd and bearing more of the farm costs, such as animal health and breeding. The amount of farm work required by the sharemilker is
determined by the individual agreement, with responsibility ranging from herd management only to carrying out all farm work.
Contract milkers are contracted to milk a herd at a set price per kilogram of milksolids produced. The rate is set according to the amount of
farm work done. In 2012/13, not all farms with contract milkers could be identified, and consequently any farms with contract milkers are
included with owner-operators.
• 65% of all herds are operated as owner-operators
• 53% of all sharemilkers are 50/50 sharemilkers
The number of herds farmed, average herd size, effective area and number of cows per hectare for each of the main operating structures are
shown in Table 3.5. In 2012/13, 4,180 (35%) New Zealand dairy herds operated under a sharemilking agreement. Fifty-three percent (2,229) of
all sharemilkers have 50/50 agreements.
Table 3.5: Herd analysis by operating structure in 2012/13
Operating structure Number of herds Percentage of herds Average herd size Average effective hectares
Average cows per effective hectare
Owner-operators 7,679 64.6 396 141 2.82
Sharemilkers:
less than 20% 224 1.9 667 206 3.23
20-29% 1,140 9.6 442 153 2.88
30-49% 170 1.4 339 119 2.86
50/50 2,229 18.7 376 131 2.88
over 50% 417 3.5 414 140 2.95
All sharemilkers 4,180 35.2 412 141 2.91
Unknown 32 0.3 676 206 3.28
All farms 11,891 402 141 2.85
Note: Contract milkers are included with owner-operators
New Zealand Dairy Statistics 2012-13 21
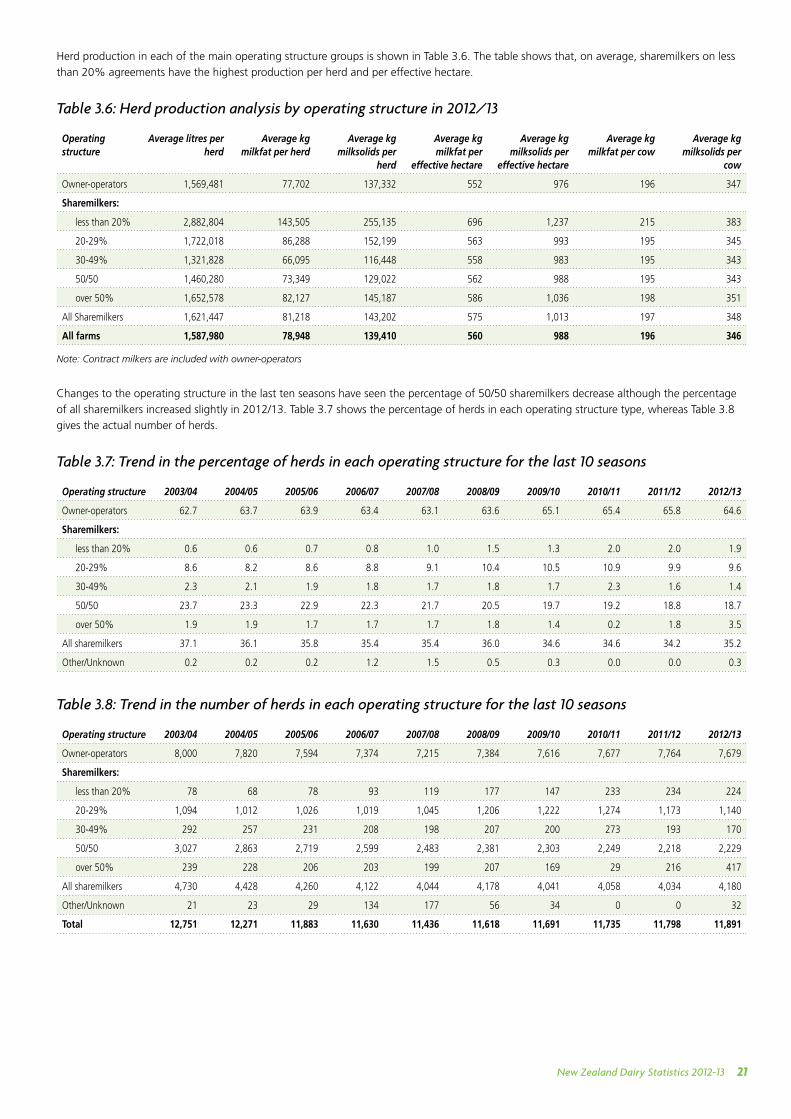
Herd production in each of the main operating structure groups is shown in Table 3.6. The table shows that, on average, sharemilkers on less
than 20% agreements have the highest production per herd and per effective hectare.
Table 3.6: Herd production analysis by operating structure in 2012/13
Operating structure
Average litres per herd
Average kg milkfat per herd
Average kg milksolids per
herd
Average kg milkfat per
effective hectare
Average kg milksolids per
effective hectare
Average kg milkfat per cow
Average kg milksolids per
cow
Owner-operators 1,569,481 77,702 137,332 552 976 196 347
Sharemilkers:
less than 20% 2,882,804 143,505 255,135 696 1,237 215 383
20-29% 1,722,018 86,288 152,199 563 993 195 345
30-49% 1,321,828 66,095 116,448 558 983 195 343
50/50 1,460,280 73,349 129,022 562 988 195 343
over 50% 1,652,578 82,127 145,187 586 1,036 198 351
All Sharemilkers 1,621,447 81,218 143,202 575 1,013 197 348
All farms 1,587,980 78,948 139,410 560 988 196 346
Note: Contract milkers are included with owner-operators
Changes to the operating structure in the last ten seasons have seen the percentage of 50/50 sharemilkers decrease although the percentage
of all sharemilkers increased slightly in 2012/13. Table 3.7 shows the percentage of herds in each operating structure type, whereas Table 3.8
gives the actual number of herds.
Table 3.7: Trend in the percentage of herds in each operating structure for the last 10 seasons
Operating structure 2003/04 2004/05 2005/06 2006/07 2007/08 2008/09 2009/10 2010/11 2011/12 2012/13
Owner-operators 62.7 63.7 63.9 63.4 63.1 63.6 65.1 65.4 65.8 64.6
Sharemilkers:
less than 20% 0.6 0.6 0.7 0.8 1.0 1.5 1.3 2.0 2.0 1.9
20-29% 8.6 8.2 8.6 8.8 9.1 10.4 10.5 10.9 9.9 9.6
30-49% 2.3 2.1 1.9 1.8 1.7 1.8 1.7 2.3 1.6 1.4
50/50 23.7 23.3 22.9 22.3 21.7 20.5 19.7 19.2 18.8 18.7
over 50% 1.9 1.9 1.7 1.7 1.7 1.8 1.4 0.2 1.8 3.5
All sharemilkers 37.1 36.1 35.8 35.4 35.4 36.0 34.6 34.6 34.2 35.2
Other/Unknown 0.2 0.2 0.2 1.2 1.5 0.5 0.3 0.0 0.0 0.3
Table 3.8: Trend in the number of herds in each operating structure for the last 10 seasons
Operating structure 2003/04 2004/05 2005/06 2006/07 2007/08 2008/09 2009/10 2010/11 2011/12 2012/13
Owner-operators 8,000 7,820 7,594 7,374 7,215 7,384 7,616 7,677 7,764 7,679
Sharemilkers:
less than 20% 78 68 78 93 119 177 147 233 234 224
20-29% 1,094 1,012 1,026 1,019 1,045 1,206 1,222 1,274 1,173 1,140
30-49% 292 257 231 208 198 207 200 273 193 170
50/50 3,027 2,863 2,719 2,599 2,483 2,381 2,303 2,249 2,218 2,229
over 50% 239 228 206 203 199 207 169 29 216 417
All sharemilkers 4,730 4,428 4,260 4,122 4,044 4,178 4,041 4,058 4,034 4,180
Other/Unknown 21 23 29 134 177 56 34 0 0 32
Total 12,751 12,271 11,883 11,630 11,436 11,618 11,691 11,735 11,798 11,891
New Zealand Dairy Statistics 2012-1322
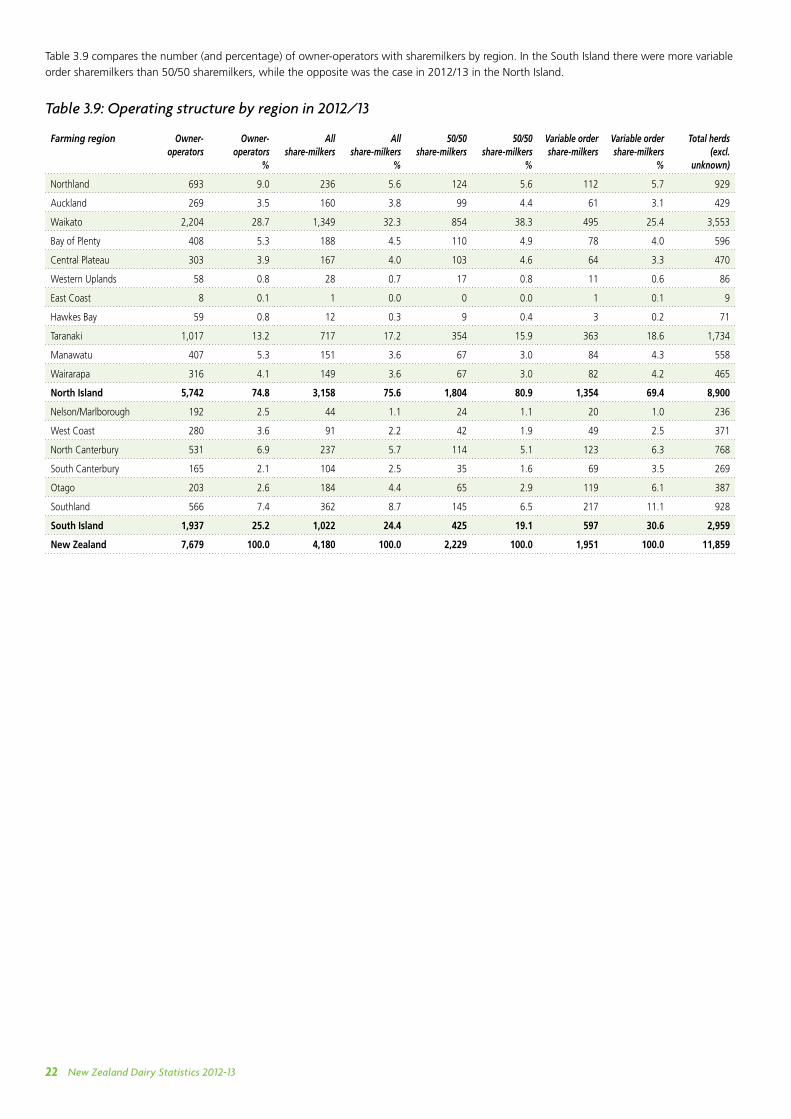
Table 3.9 compares the number (and percentage) of owner-operators with sharemilkers by region. In the South Island there were more variable
order sharemilkers than 50/50 sharemilkers, while the opposite was the case in 2012/13 in the North Island.
Table 3.9: Operating structure by region in 2012/13
Farming region Owner-operators
Owner-operators
%
All share-milkers
All share-milkers
%
50/50 share-milkers
50/50 share-milkers
%
Variable order share-milkers
Variable order share-milkers
%
Total herds (excl.
unknown)
Northland 693 9.0 236 5.6 124 5.6 112 5.7 929
Auckland 269 3.5 160 3.8 99 4.4 61 3.1 429
Waikato 2,204 28.7 1,349 32.3 854 38.3 495 25.4 3,553
Bay of Plenty 408 5.3 188 4.5 110 4.9 78 4.0 596
Central Plateau 303 3.9 167 4.0 103 4.6 64 3.3 470
Western Uplands 58 0.8 28 0.7 17 0.8 11 0.6 86
East Coast 8 0.1 1 0.0 0 0.0 1 0.1 9
Hawkes Bay 59 0.8 12 0.3 9 0.4 3 0.2 71
Taranaki 1,017 13.2 717 17.2 354 15.9 363 18.6 1,734
Manawatu 407 5.3 151 3.6 67 3.0 84 4.3 558
Wairarapa 316 4.1 149 3.6 67 3.0 82 4.2 465
North Island 5,742 74.8 3,158 75.6 1,804 80.9 1,354 69.4 8,900
Nelson/Marlborough 192 2.5 44 1.1 24 1.1 20 1.0 236
West Coast 280 3.6 91 2.2 42 1.9 49 2.5 371
North Canterbury 531 6.9 237 5.7 114 5.1 123 6.3 768
South Canterbury 165 2.1 104 2.5 35 1.6 69 3.5 269
Otago 203 2.6 184 4.4 65 2.9 119 6.1 387
Southland 566 7.4 362 8.7 145 6.5 217 11.1 928
South Island 1,937 25.2 1,022 24.4 425 19.1 597 30.6 2,959
New Zealand 7,679 100.0 4,180 100.0 2,229 100.0 1,951 100.0 11,859
New Zealand Dairy Statistics 2012-13 23
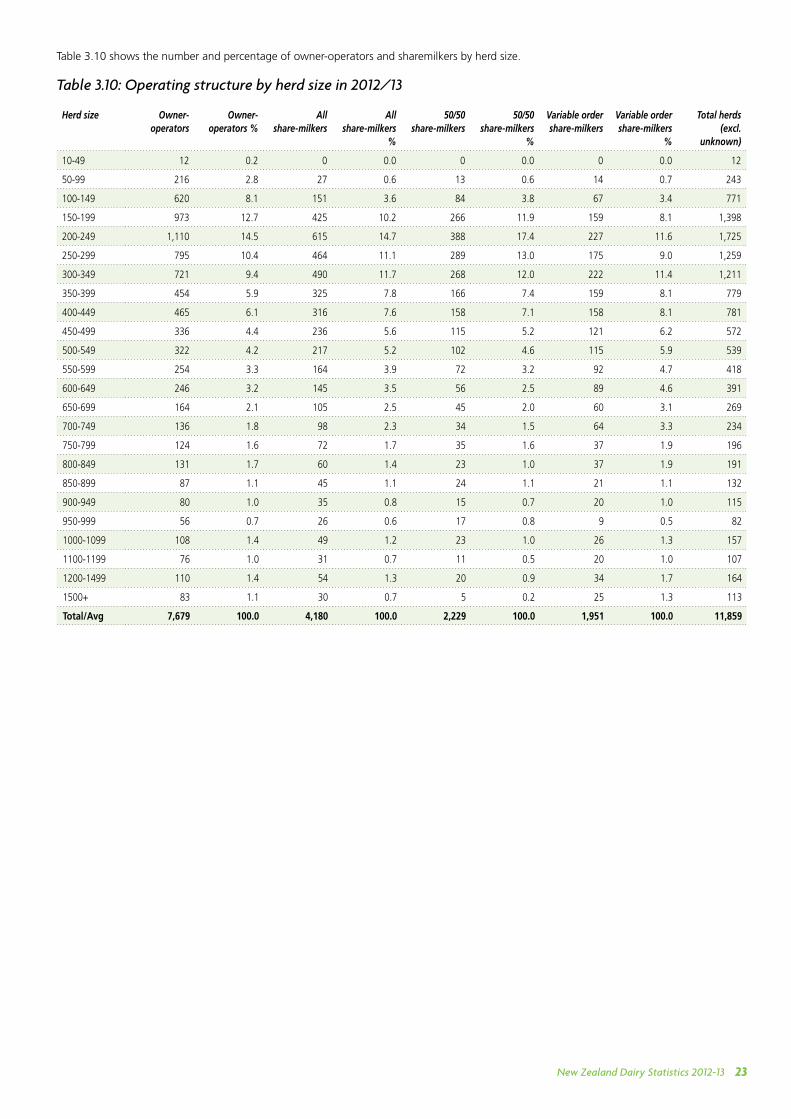
Table 3.10 shows the number and percentage of owner-operators and sharemilkers by herd size.
Table 3.10: Operating structure by herd size in 2012/13
Herd size Owner-operators
Owner-operators %
All share-milkers
All share-milkers
%
50/50 share-milkers
50/50 share-milkers
%
Variable order share-milkers
Variable order share-milkers
%
Total herds (excl.
unknown)
10-49 12 0.2 0 0.0 0 0.0 0 0.0 12
50-99 216 2.8 27 0.6 13 0.6 14 0.7 243
100-149 620 8.1 151 3.6 84 3.8 67 3.4 771
150-199 973 12.7 425 10.2 266 11.9 159 8.1 1,398
200-249 1,110 14.5 615 14.7 388 17.4 227 11.6 1,725
250-299 795 10.4 464 11.1 289 13.0 175 9.0 1,259
300-349 721 9.4 490 11.7 268 12.0 222 11.4 1,211
350-399 454 5.9 325 7.8 166 7.4 159 8.1 779
400-449 465 6.1 316 7.6 158 7.1 158 8.1 781
450-499 336 4.4 236 5.6 115 5.2 121 6.2 572
500-549 322 4.2 217 5.2 102 4.6 115 5.9 539
550-599 254 3.3 164 3.9 72 3.2 92 4.7 418
600-649 246 3.2 145 3.5 56 2.5 89 4.6 391
650-699 164 2.1 105 2.5 45 2.0 60 3.1 269
700-749 136 1.8 98 2.3 34 1.5 64 3.3 234
750-799 124 1.6 72 1.7 35 1.6 37 1.9 196
800-849 131 1.7 60 1.4 23 1.0 37 1.9 191
850-899 87 1.1 45 1.1 24 1.1 21 1.1 132
900-949 80 1.0 35 0.8 15 0.7 20 1.0 115
950-999 56 0.7 26 0.6 17 0.8 9 0.5 82
1000-1099 108 1.4 49 1.2 23 1.0 26 1.3 157
1100-1199 76 1.0 31 0.7 11 0.5 20 1.0 107
1200-1499 110 1.4 54 1.3 20 0.9 34 1.7 164
1500+ 83 1.1 30 0.7 5 0.2 25 1.3 113
Total/Avg 7,679 100.0 4,180 100.0 2,229 100.0 1,951 100.0 11,859
New Zealand Dairy Statistics 2012-1324
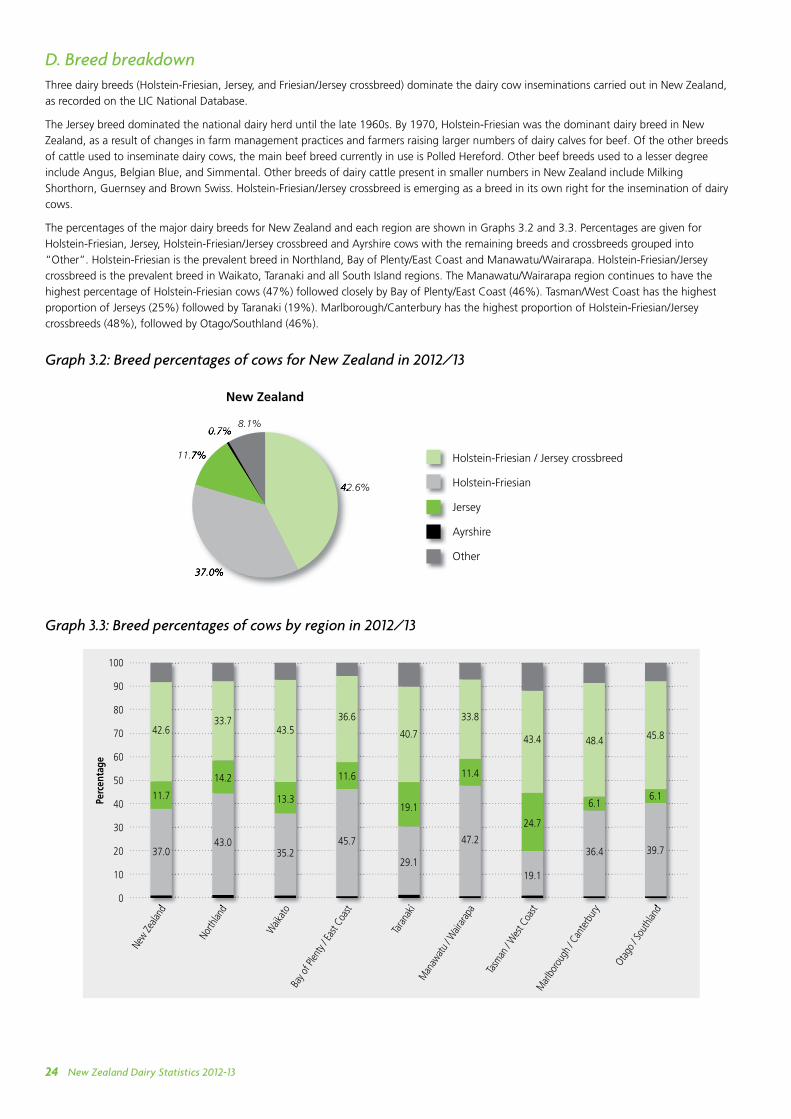
D. Breed breakdownThree dairy breeds (Holstein-Friesian, Jersey, and Friesian/Jersey crossbreed) dominate the dairy cow inseminations carried out in New Zealand,
as recorded on the LIC National Database.
The Jersey breed dominated the national dairy herd until the late 1960s. By 1970, Holstein-Friesian was the dominant dairy breed in New
Zealand, as a result of changes in farm management practices and farmers raising larger numbers of dairy calves for beef. Of the other breeds
of cattle used to inseminate dairy cows, the main beef breed currently in use is Polled Hereford. Other beef breeds used to a lesser degree
include Angus, Belgian Blue, and Simmental. Other breeds of dairy cattle present in smaller numbers in New Zealand include Milking
Shorthorn, Guernsey and Brown Swiss. Holstein-Friesian/Jersey crossbreed is emerging as a breed in its own right for the insemination of dairy
cows.
The percentages of the major dairy breeds for New Zealand and each region are shown in Graphs 3.2 and 3.3. Percentages are given for
Holstein-Friesian, Jersey, Holstein-Friesian/Jersey crossbreed and Ayrshire cows with the remaining breeds and crossbreeds grouped into
“Other”. Holstein-Friesian is the prevalent breed in Northland, Bay of Plenty/East Coast and Manawatu/Wairarapa. Holstein-Friesian/Jersey
crossbreed is the prevalent breed in Waikato, Taranaki and all South Island regions. The Manawatu/Wairarapa region continues to have the
highest percentage of Holstein-Friesian cows (47%) followed closely by Bay of Plenty/East Coast (46%). Tasman/West Coast has the highest
proportion of Jerseys (25%) followed by Taranaki (19%). Marlborough/Canterbury has the highest proportion of Holstein-Friesian/Jersey
crossbreeds (48%), followed by Otago/Southland (46%).
Graph 3.2: Breed percentages of cows for New Zealand in 2012/13
Graph 3.3: Breed percentages of cows by region in 2012/13
Holstein-Friesian / Jersey crossbreed
Holstein-Friesian
Jersey
Ayrshire
Other
11.7%
0.7%8.1%
42.6%
37.0%
New Zealand
11.7%
0.7%
42.6%
37.0%
100
90
80
70
60
50
40
30
20
10
0
Perc
enta
ge
North
land
Waik
ato
Bay o
f Plen
ty / E
ast C
oast
Tara
naki
Man
awat
u / W
airar
apa
Tasm
an /
Wes
t Coa
stM
arlbo
roug
h / C
ante
rbur
y
Otag
o / S
outh
land
New Ze
aland
New Ze
aland
North
land
Waik
ato
Bay o
f Plen
ty / E
ast C
oast
Tara
naki
Man
awat
u / W
airar
apa
Tasm
an /
Wes
t Coa
stM
arlbo
roug
h / C
ante
rbur
y
Otag
o / S
outh
land
42.633.7
43.536.6
40.7
33.8
43.4 48.4 45.8
37.0
11.7
43.0
14.2
35.2
13.3
45.7
11.6
29.1
19.1
47.2
11.4
19.1
24.7
36.4
6.1
39.7
6.1
New Zealand Dairy Statistics 2012-13 25
4. Herd improvement
A. Use of herd testing
Herd testing enables farmers to collect information about individual cows in their herds. The information gained from herd testing is vital for
effective herd management and decision making. Farmers are able to benchmark animal performance within herd, within region, and
nationally.
Farmers currently have the choice of two herd testing service providers (CRV AmBreed and LIC), and are able to choose the frequency of
testing. Data used in the following analysis includes figures from both herd test providers.
Herd testing involves the collection of individual milk samples from animals in the herd. A full herd test provides information on milk volumes,
milkfat and protein yields, and somatic cell counts.
Herd testing provides an overall picture of the production of the herd, and enables the mastitis status to be monitored. More specifically, herd
test information identifies low-producing cows (for culling or drying off), high producers (for breeding), and cows with mastitis (for therapy or
culling).
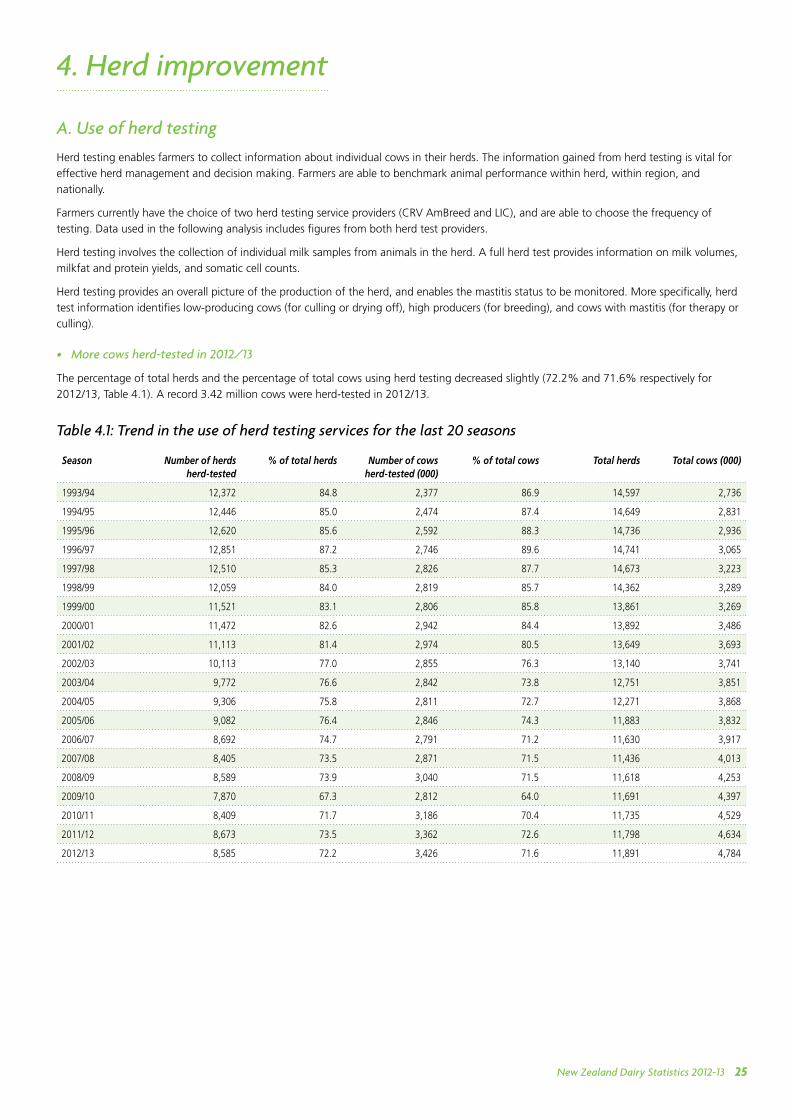
• More cows herd-tested in 2012/13
The percentage of total herds and the percentage of total cows using herd testing decreased slightly (72.2% and 71.6% respectively for
2012/13, Table 4.1). A record 3.42 million cows were herd-tested in 2012/13.
Table 4.1: Trend in the use of herd testing services for the last 20 seasons
Season Number of herds herd-tested
% of total herds Number of cows herd-tested (000)
% of total cows Total herds Total cows (000)
1993/94 12,372 84.8 2,377 86.9 14,597 2,736
1994/95 12,446 85.0 2,474 87.4 14,649 2,831
1995/96 12,620 85.6 2,592 88.3 14,736 2,936
1996/97 12,851 87.2 2,746 89.6 14,741 3,065
1997/98 12,510 85.3 2,826 87.7 14,673 3,223
1998/99 12,059 84.0 2,819 85.7 14,362 3,289
1999/00 11,521 83.1 2,806 85.8 13,861 3,269
2000/01 11,472 82.6 2,942 84.4 13,892 3,486
2001/02 11,113 81.4 2,974 80.5 13,649 3,693
2002/03 10,113 77.0 2,855 76.3 13,140 3,741
2003/04 9,772 76.6 2,842 73.8 12,751 3,851
2004/05 9,306 75.8 2,811 72.7 12,271 3,868
2005/06 9,082 76.4 2,846 74.3 11,883 3,832
2006/07 8,692 74.7 2,791 71.2 11,630 3,917
2007/08 8,405 73.5 2,871 71.5 11,436 4,013
2008/09 8,589 73.9 3,040 71.5 11,618 4,253
2009/10 7,870 67.3 2,812 64.0 11,691 4,397
2010/11 8,409 71.7 3,186 70.4 11,735 4,529
2011/12 8,673 73.5 3,362 72.6 11,798 4,634
2012/13 8,585 72.2 3,426 71.6 11,891 4,784
New Zealand Dairy Statistics 2012-1326
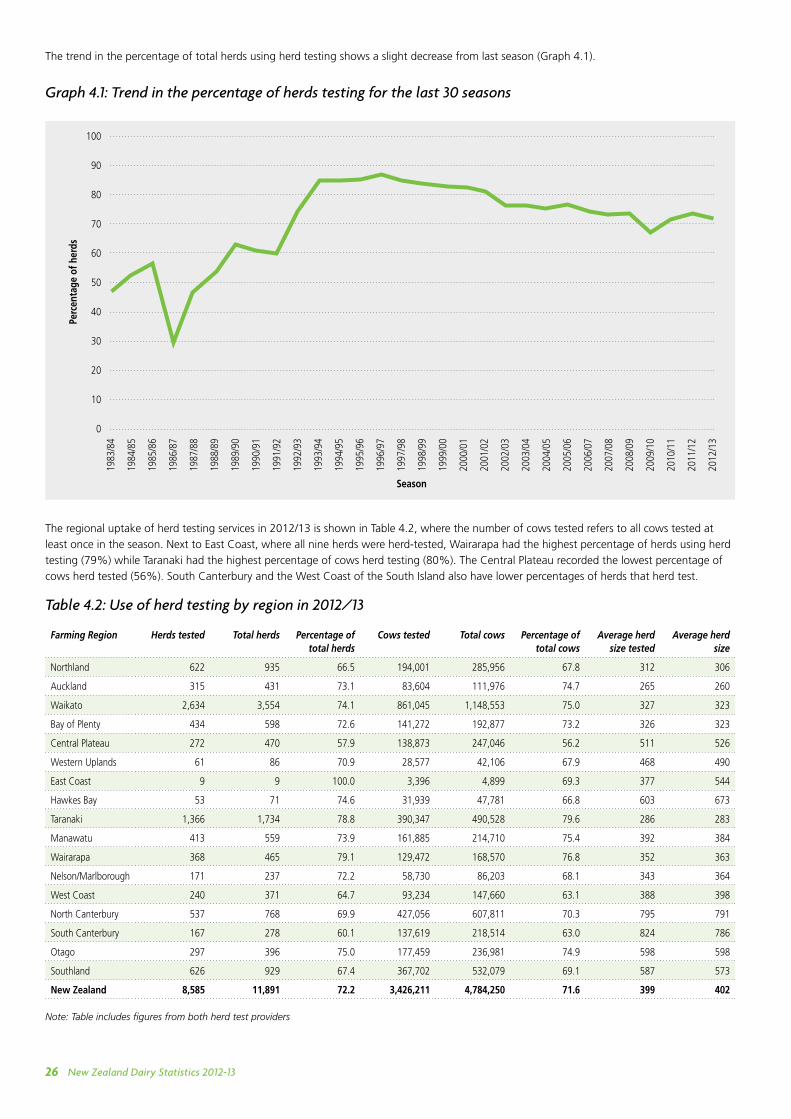
The trend in the percentage of total herds using herd testing shows a slight decrease from last season (Graph 4.1).
Graph 4.1: Trend in the percentage of herds testing for the last 30 seasons
The regional uptake of herd testing services in 2012/13 is shown in Table 4.2, where the number of cows tested refers to all cows tested at
least once in the season. Next to East Coast, where all nine herds were herd-tested, Wairarapa had the highest percentage of herds using herd
testing (79%) while Taranaki had the highest percentage of cows herd testing (80%). The Central Plateau recorded the lowest percentage of
cows herd tested (56%). South Canterbury and the West Coast of the South Island also have lower percentages of herds that herd test.
Table 4.2: Use of herd testing by region in 2012/13
Farming Region Herds tested Total herds Percentage of total herds
Cows tested Total cows Percentage of total cows
Average herd size tested
Average herd size
Northland 622 935 66.5 194,001 285,956 67.8 312 306
Auckland 315 431 73.1 83,604 111,976 74.7 265 260
Waikato 2,634 3,554 74.1 861,045 1,148,553 75.0 327 323
Bay of Plenty 434 598 72.6 141,272 192,877 73.2 326 323
Central Plateau 272 470 57.9 138,873 247,046 56.2 511 526
Western Uplands 61 86 70.9 28,577 42,106 67.9 468 490
East Coast 9 9 100.0 3,396 4,899 69.3 377 544
Hawkes Bay 53 71 74.6 31,939 47,781 66.8 603 673
Taranaki 1,366 1,734 78.8 390,347 490,528 79.6 286 283
Manawatu 413 559 73.9 161,885 214,710 75.4 392 384
Wairarapa 368 465 79.1 129,472 168,570 76.8 352 363
Nelson/Marlborough 171 237 72.2 58,730 86,203 68.1 343 364
West Coast 240 371 64.7 93,234 147,660 63.1 388 398
North Canterbury 537 768 69.9 427,056 607,811 70.3 795 791
South Canterbury 167 278 60.1 137,619 218,514 63.0 824 786
Otago 297 396 75.0 177,459 236,981 74.9 598 598
Southland 626 929 67.4 367,702 532,079 69.1 587 573
New Zealand 8,585 11,891 72.2 3,426,211 4,784,250 71.6 399 402
Note: Table includes figures from both herd test providers
100
90
80
70
60
50
40
30
20
10
0
1983
/84
1984
/85
1985
/86
1986
/87
1987
/88
1988
/89
1989
/90
1990
/91
1991
/92
1992
/93
1993
/94
1994
/95
1995
/96
1996
/97
1997
/98
1998
/99
1999
/00
2000
/01
2001
/02
2002
/03
2003
/04
2004
/05
2005
/06
2006
/07
2007
/08
2008
/09
2009
/10
2010
/11
2011
/12
2012
/13
Perc
enta
ge o
f her
ds
Season
New Zealand Dairy Statistics 2012-13 27
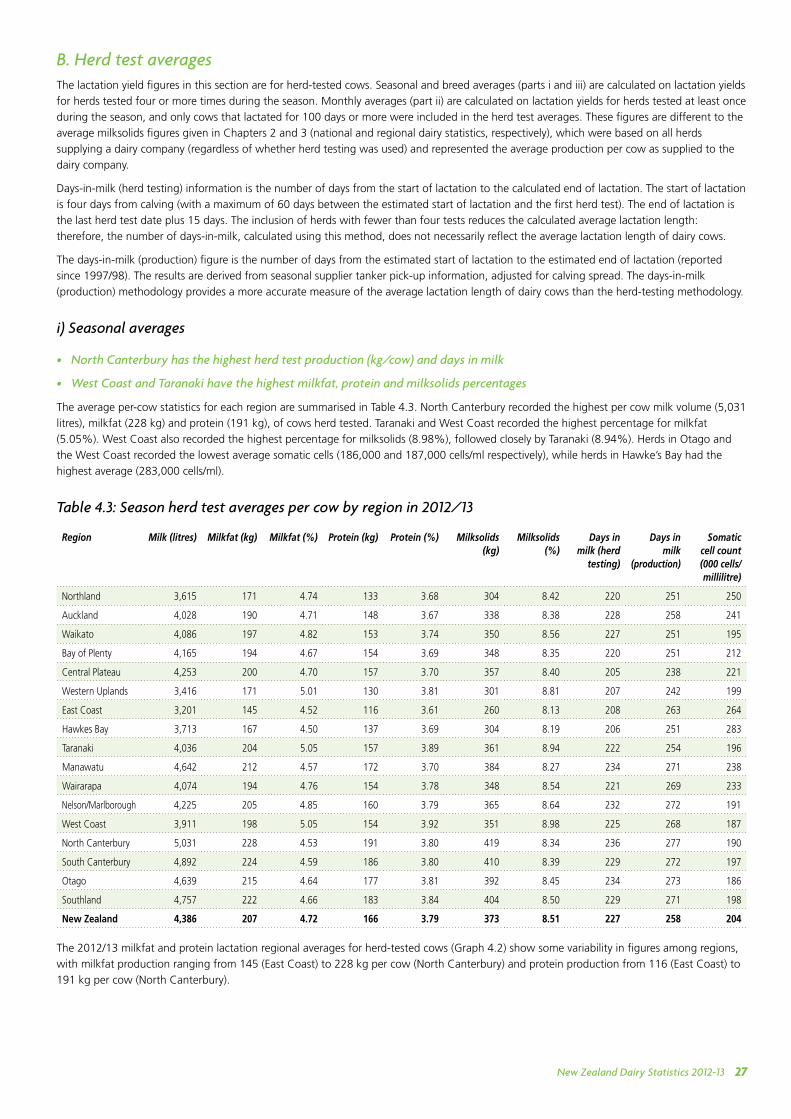
B. Herd test averagesThe lactation yield figures in this section are for herd-tested cows. Seasonal and breed averages (parts i and iii) are calculated on lactation yields
for herds tested four or more times during the season. Monthly averages (part ii) are calculated on lactation yields for herds tested at least once
during the season, and only cows that lactated for 100 days or more were included in the herd test averages. These figures are different to the
average milksolids figures given in Chapters 2 and 3 (national and regional dairy statistics, respectively), which were based on all herds
supplying a dairy company (regardless of whether herd testing was used) and represented the average production per cow as supplied to the
dairy company.
Days-in-milk (herd testing) information is the number of days from the start of lactation to the calculated end of lactation. The start of lactation
is four days from calving (with a maximum of 60 days between the estimated start of lactation and the first herd test). The end of lactation is
the last herd test date plus 15 days. The inclusion of herds with fewer than four tests reduces the calculated average lactation length:
therefore, the number of days-in-milk, calculated using this method, does not necessarily reflect the average lactation length of dairy cows.
The days-in-milk (production) figure is the number of days from the estimated start of lactation to the estimated end of lactation (reported
since 1997/98). The results are derived from seasonal supplier tanker pick-up information, adjusted for calving spread. The days-in-milk
(production) methodology provides a more accurate measure of the average lactation length of dairy cows than the herd-testing methodology.
i) Seasonal averages
• North Canterbury has the highest herd test production (kg/cow) and days in milk
• West Coast and Taranaki have the highest milkfat, protein and milksolids percentages
The average per-cow statistics for each region are summarised in Table 4.3. North Canterbury recorded the highest per cow milk volume (5,031
litres), milkfat (228 kg) and protein (191 kg), of cows herd tested. Taranaki and West Coast recorded the highest percentage for milkfat
(5.05%). West Coast also recorded the highest percentage for milksolids (8.98%), followed closely by Taranaki (8.94%). Herds in Otago and
the West Coast recorded the lowest average somatic cells (186,000 and 187,000 cells/ml respectively), while herds in Hawke’s Bay had the
highest average (283,000 cells/ml).
Table 4.3: Season herd test averages per cow by region in 2012/13
Region Milk (litres) Milkfat (kg) Milkfat (%) Protein (kg) Protein (%) Milksolids (kg)
Milksolids (%)
Days in milk (herd
testing)
Days in milk
(production)
Somatic cell count (000 cells/ millilitre)
Northland 3,615 171 4.74 133 3.68 304 8.42 220 251 250
Auckland 4,028 190 4.71 148 3.67 338 8.38 228 258 241
Waikato 4,086 197 4.82 153 3.74 350 8.56 227 251 195
Bay of Plenty 4,165 194 4.67 154 3.69 348 8.35 220 251 212
Central Plateau 4,253 200 4.70 157 3.70 357 8.40 205 238 221
Western Uplands 3,416 171 5.01 130 3.81 301 8.81 207 242 199
East Coast 3,201 145 4.52 116 3.61 260 8.13 208 263 264
Hawkes Bay 3,713 167 4.50 137 3.69 304 8.19 206 251 283
Taranaki 4,036 204 5.05 157 3.89 361 8.94 222 254 196
Manawatu 4,642 212 4.57 172 3.70 384 8.27 234 271 238
Wairarapa 4,074 194 4.76 154 3.78 348 8.54 221 269 233
Nelson/Marlborough 4,225 205 4.85 160 3.79 365 8.64 232 272 191
West Coast 3,911 198 5.05 154 3.92 351 8.98 225 268 187
North Canterbury 5,031 228 4.53 191 3.80 419 8.34 236 277 190
South Canterbury 4,892 224 4.59 186 3.80 410 8.39 229 272 197
Otago 4,639 215 4.64 177 3.81 392 8.45 234 273 186
Southland 4,757 222 4.66 183 3.84 404 8.50 229 271 198
New Zealand 4,386 207 4.72 166 3.79 373 8.51 227 258 204
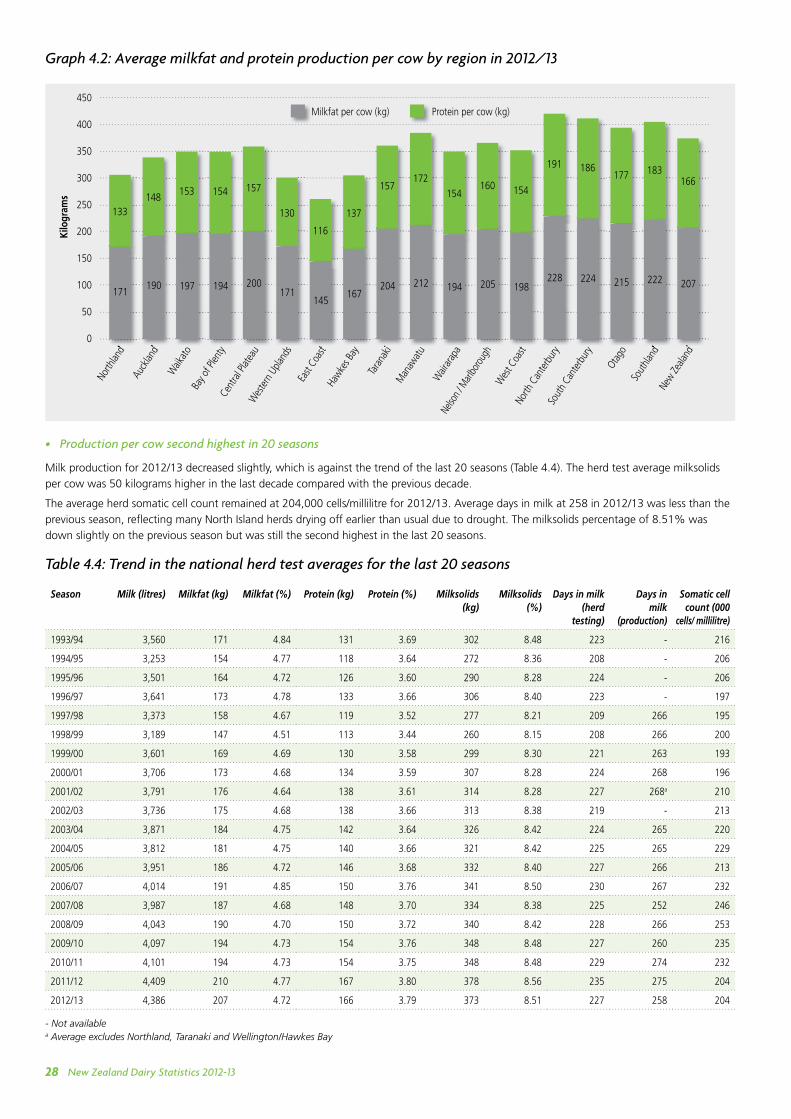
The 2012/13 milkfat and protein lactation regional averages for herd-tested cows (Graph 4.2) show some variability in figures among regions,
with milkfat production ranging from 145 (East Coast) to 228 kg per cow (North Canterbury) and protein production from 116 (East Coast) to
191 kg per cow (North Canterbury).
New Zealand Dairy Statistics 2012-1328
Graph 4.2: Average milkfat and protein production per cow by region in 2012/13
• Production per cow second highest in 20 seasons
Milk production for 2012/13 decreased slightly, which is against the trend of the last 20 seasons (Table 4.4). The herd test average milksolids
per cow was 50 kilograms higher in the last decade compared with the previous decade.
The average herd somatic cell count remained at 204,000 cells/millilitre for 2012/13. Average days in milk at 258 in 2012/13 was less than the
previous season, refl ecting many North Island herds drying off earlier than usual due to drought. The milksolids percentage of 8.51% was
down slightly on the previous season but was still the second highest in the last 20 seasons.
Table 4.4: Trend in the national herd test averages for the last 20 seasons
Season Milk (litres) Milkfat (kg) Milkfat (%) Protein (kg) Protein (%) Milksolids (kg)
Milksolids (%)
Days in milk (herd
testing)
Days inmilk
(production)
Somatic cell count (000
cells/ millilitre)
1993/94 3,560 171 4.84 131 3.69 302 8.48 223 - 216
1994/95 3,253 154 4.77 118 3.64 272 8.36 208 - 206
1995/96 3,501 164 4.72 126 3.60 290 8.28 224 - 206
1996/97 3,641 173 4.78 133 3.66 306 8.40 223 - 197
1997/98 3,373 158 4.67 119 3.52 277 8.21 209 266 195
1998/99 3,189 147 4.51 113 3.44 260 8.15 208 266 200
1999/00 3,601 169 4.69 130 3.58 299 8.30 221 263 193
2000/01 3,706 173 4.68 134 3.59 307 8.28 224 268 196
2001/02 3,791 176 4.64 138 3.61 314 8.28 227 268a 210
2002/03 3,736 175 4.68 138 3.66 313 8.38 219 - 213
2003/04 3,871 184 4.75 142 3.64 326 8.42 224 265 220
2004/05 3,812 181 4.75 140 3.66 321 8.42 225 265 229
2005/06 3,951 186 4.72 146 3.68 332 8.40 227 266 213
2006/07 4,014 191 4.85 150 3.76 341 8.50 230 267 232
2007/08 3,987 187 4.68 148 3.70 334 8.38 225 252 246
2008/09 4,043 190 4.70 150 3.72 340 8.42 228 266 253
2009/10 4,097 194 4.73 154 3.76 348 8.48 227 260 235
2010/11 4,101 194 4.73 154 3.75 348 8.48 229 274 232
2011/12 4,409 210 4.77 167 3.80 378 8.56 235 275 204
2012/13 4,386 207 4.72 166 3.79 373 8.51 227 258 204
- Not availablea Average excludes Northland, Taranaki and Wellington/Hawkes Bay
450
400
350
300
250
200
150
100
50
0
Kilo
gram
s
North
land
Auck
land
Waik
ato
Bay o
f Plen
tyCe
ntra
l Plat
eau
Wes
tern
Upla
nds
East
Coas
tHa
wkes B
ay
Tara
naki
Man
awat
u
Wair
arap
aNe
lson /
Marl
boro
ugh
Wes
t Coa
stNo
rth C
ante
rbur
ySo
uth
Cant
erbu
ry
Otag
oSo
uthla
ndNe
w Zeala
nd
North
land
133
171
Auck
land
148
190
Waik
ato
153
197
Bay o
f Plen
ty
154
194
Cent
ral P
latea
u
157
200
Wes
tern
Upla
nds
130
171Ea
st Co
ast
116
145
Hawke
s Bay
137
167
Tara
naki
157
204
Man
awat
u
172
212
Wair
arap
a
154
194
Nelso
n / M
arlbo
roug
h
160
205
Wes
t Coa
st
154
198
North
Can
terb
ury
191
228
Sout
h Ca
nter
bury
186
224
Otag
o
177
215
Sout
hland
183
222
New Ze
aland
166
207
Milkfat per cow (kg) Protein per cow (kg)
New Zealand Dairy Statistics 2012-13 29
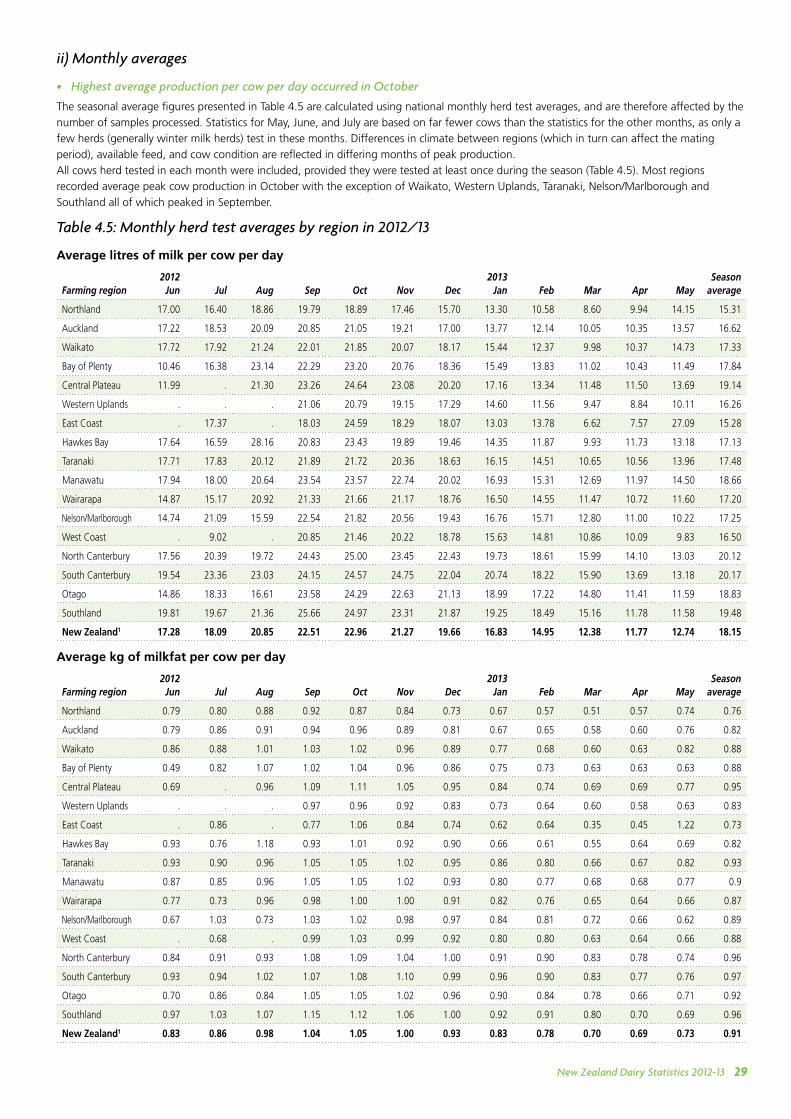
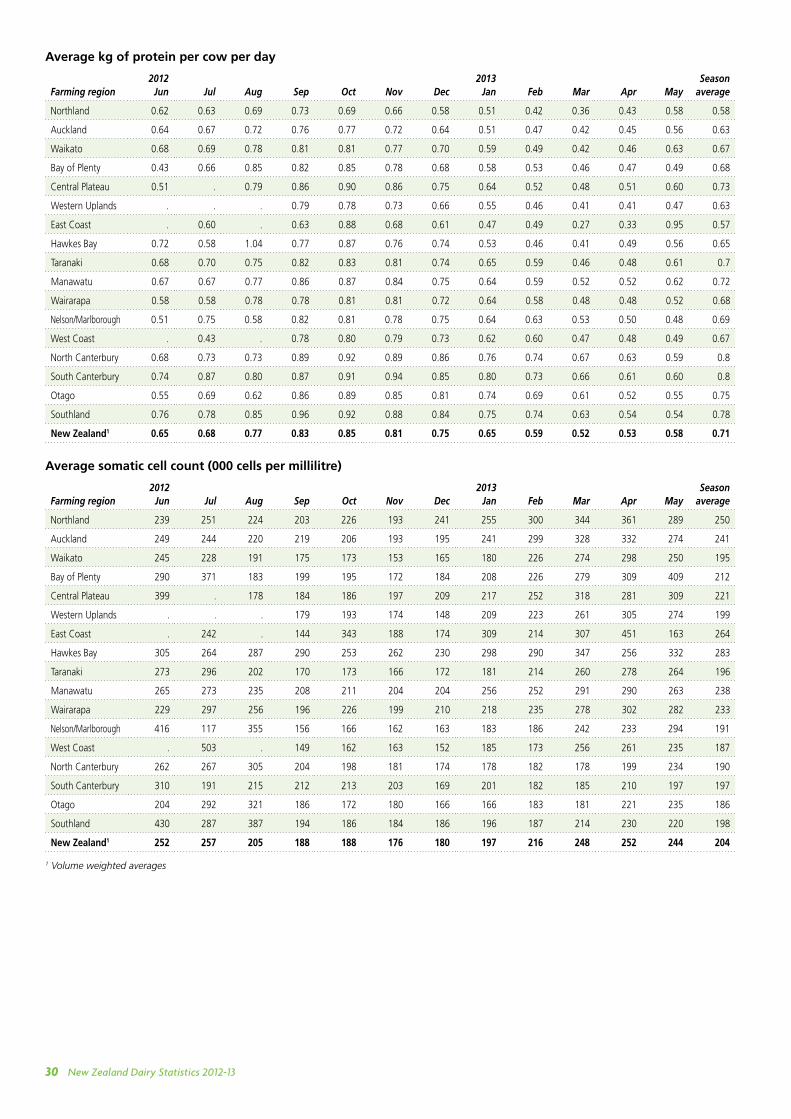
ii) Monthly averages
• Highest average production per cow per day occurred in October
The seasonal average figures presented in Table 4.5 are calculated using national monthly herd test averages, and are therefore affected by the
number of samples processed. Statistics for May, June, and July are based on far fewer cows than the statistics for the other months, as only a
few herds (generally winter milk herds) test in these months. Differences in climate between regions (which in turn can affect the mating
period), available feed, and cow condition are reflected in differing months of peak production.
All cows herd tested in each month were included, provided they were tested at least once during the season (Table 4.5). Most regions
recorded average peak cow production in October with the exception of Waikato, Western Uplands, Taranaki, Nelson/Marlborough and
Southland all of which peaked in September.
Table 4.5: Monthly herd test averages by region in 2012/13
Average litres of milk per cow per day
Farming region2012
Jun Jul Aug Sep Oct Nov Dec2013
Jan Feb Mar Apr MaySeason
average
Northland 17.00 16.40 18.86 19.79 18.89 17.46 15.70 13.30 10.58 8.60 9.94 14.15 15.31
Auckland 17.22 18.53 20.09 20.85 21.05 19.21 17.00 13.77 12.14 10.05 10.35 13.57 16.62
Waikato 17.72 17.92 21.24 22.01 21.85 20.07 18.17 15.44 12.37 9.98 10.37 14.73 17.33
Bay of Plenty 10.46 16.38 23.14 22.29 23.20 20.76 18.36 15.49 13.83 11.02 10.43 11.49 17.84
Central Plateau 11.99 . 21.30 23.26 24.64 23.08 20.20 17.16 13.34 11.48 11.50 13.69 19.14
Western Uplands . . . 21.06 20.79 19.15 17.29 14.60 11.56 9.47 8.84 10.11 16.26
East Coast . 17.37 . 18.03 24.59 18.29 18.07 13.03 13.78 6.62 7.57 27.09 15.28
Hawkes Bay 17.64 16.59 28.16 20.83 23.43 19.89 19.46 14.35 11.87 9.93 11.73 13.18 17.13
Taranaki 17.71 17.83 20.12 21.89 21.72 20.36 18.63 16.15 14.51 10.65 10.56 13.96 17.48
Manawatu 17.94 18.00 20.64 23.54 23.57 22.74 20.02 16.93 15.31 12.69 11.97 14.50 18.66
Wairarapa 14.87 15.17 20.92 21.33 21.66 21.17 18.76 16.50 14.55 11.47 10.72 11.60 17.20
Nelson/Marlborough 14.74 21.09 15.59 22.54 21.82 20.56 19.43 16.76 15.71 12.80 11.00 10.22 17.25
West Coast . 9.02 . 20.85 21.46 20.22 18.78 15.63 14.81 10.86 10.09 9.83 16.50
North Canterbury 17.56 20.39 19.72 24.43 25.00 23.45 22.43 19.73 18.61 15.99 14.10 13.03 20.12
South Canterbury 19.54 23.36 23.03 24.15 24.57 24.75 22.04 20.74 18.22 15.90 13.69 13.18 20.17
Otago 14.86 18.33 16.61 23.58 24.29 22.63 21.13 18.99 17.22 14.80 11.41 11.59 18.83
Southland 19.81 19.67 21.36 25.66 24.97 23.31 21.87 19.25 18.49 15.16 11.78 11.58 19.48
New Zealand1 17.28 18.09 20.85 22.51 22.96 21.27 19.66 16.83 14.95 12.38 11.77 12.74 18.15
Average kg of milkfat per cow per day
Farming region2012
Jun Jul Aug Sep Oct Nov Dec2013
Jan Feb Mar Apr MaySeason
average
Northland 0.79 0.80 0.88 0.92 0.87 0.84 0.73 0.67 0.57 0.51 0.57 0.74 0.76
Auckland 0.79 0.86 0.91 0.94 0.96 0.89 0.81 0.67 0.65 0.58 0.60 0.76 0.82
Waikato 0.86 0.88 1.01 1.03 1.02 0.96 0.89 0.77 0.68 0.60 0.63 0.82 0.88
Bay of Plenty 0.49 0.82 1.07 1.02 1.04 0.96 0.86 0.75 0.73 0.63 0.63 0.63 0.88
Central Plateau 0.69 . 0.96 1.09 1.11 1.05 0.95 0.84 0.74 0.69 0.69 0.77 0.95
Western Uplands . . . 0.97 0.96 0.92 0.83 0.73 0.64 0.60 0.58 0.63 0.83
East Coast . 0.86 . 0.77 1.06 0.84 0.74 0.62 0.64 0.35 0.45 1.22 0.73
Hawkes Bay 0.93 0.76 1.18 0.93 1.01 0.92 0.90 0.66 0.61 0.55 0.64 0.69 0.82
Taranaki 0.93 0.90 0.96 1.05 1.05 1.02 0.95 0.86 0.80 0.66 0.67 0.82 0.93
Manawatu 0.87 0.85 0.96 1.05 1.05 1.02 0.93 0.80 0.77 0.68 0.68 0.77 0.9
Wairarapa 0.77 0.73 0.96 0.98 1.00 1.00 0.91 0.82 0.76 0.65 0.64 0.66 0.87
Nelson/Marlborough 0.67 1.03 0.73 1.03 1.02 0.98 0.97 0.84 0.81 0.72 0.66 0.62 0.89
West Coast . 0.68 . 0.99 1.03 0.99 0.92 0.80 0.80 0.63 0.64 0.66 0.88
North Canterbury 0.84 0.91 0.93 1.08 1.09 1.04 1.00 0.91 0.90 0.83 0.78 0.74 0.96
South Canterbury 0.93 0.94 1.02 1.07 1.08 1.10 0.99 0.96 0.90 0.83 0.77 0.76 0.97
Otago 0.70 0.86 0.84 1.05 1.05 1.02 0.96 0.90 0.84 0.78 0.66 0.71 0.92
Southland 0.97 1.03 1.07 1.15 1.12 1.06 1.00 0.92 0.91 0.80 0.70 0.69 0.96
New Zealand1 0.83 0.86 0.98 1.04 1.05 1.00 0.93 0.83 0.78 0.70 0.69 0.73 0.91
New Zealand Dairy Statistics 2012-1330
Average kg of protein per cow per day
Farming region2012
Jun Jul Aug Sep Oct Nov Dec2013
Jan Feb Mar Apr MaySeason
average
Northland 0.62 0.63 0.69 0.73 0.69 0.66 0.58 0.51 0.42 0.36 0.43 0.58 0.58
Auckland 0.64 0.67 0.72 0.76 0.77 0.72 0.64 0.51 0.47 0.42 0.45 0.56 0.63
Waikato 0.68 0.69 0.78 0.81 0.81 0.77 0.70 0.59 0.49 0.42 0.46 0.63 0.67
Bay of Plenty 0.43 0.66 0.85 0.82 0.85 0.78 0.68 0.58 0.53 0.46 0.47 0.49 0.68
Central Plateau 0.51 . 0.79 0.86 0.90 0.86 0.75 0.64 0.52 0.48 0.51 0.60 0.73
Western Uplands . . . 0.79 0.78 0.73 0.66 0.55 0.46 0.41 0.41 0.47 0.63
East Coast . 0.60 . 0.63 0.88 0.68 0.61 0.47 0.49 0.27 0.33 0.95 0.57
Hawkes Bay 0.72 0.58 1.04 0.77 0.87 0.76 0.74 0.53 0.46 0.41 0.49 0.56 0.65
Taranaki 0.68 0.70 0.75 0.82 0.83 0.81 0.74 0.65 0.59 0.46 0.48 0.61 0.7
Manawatu 0.67 0.67 0.77 0.86 0.87 0.84 0.75 0.64 0.59 0.52 0.52 0.62 0.72
Wairarapa 0.58 0.58 0.78 0.78 0.81 0.81 0.72 0.64 0.58 0.48 0.48 0.52 0.68
Nelson/Marlborough 0.51 0.75 0.58 0.82 0.81 0.78 0.75 0.64 0.63 0.53 0.50 0.48 0.69
West Coast . 0.43 . 0.78 0.80 0.79 0.73 0.62 0.60 0.47 0.48 0.49 0.67
North Canterbury 0.68 0.73 0.73 0.89 0.92 0.89 0.86 0.76 0.74 0.67 0.63 0.59 0.8
South Canterbury 0.74 0.87 0.80 0.87 0.91 0.94 0.85 0.80 0.73 0.66 0.61 0.60 0.8
Otago 0.55 0.69 0.62 0.86 0.89 0.85 0.81 0.74 0.69 0.61 0.52 0.55 0.75
Southland 0.76 0.78 0.85 0.96 0.92 0.88 0.84 0.75 0.74 0.63 0.54 0.54 0.78
New Zealand1 0.65 0.68 0.77 0.83 0.85 0.81 0.75 0.65 0.59 0.52 0.53 0.58 0.71
Average somatic cell count (000 cells per millilitre)
Farming region2012
Jun Jul Aug Sep Oct Nov Dec2013
Jan Feb Mar Apr MaySeason
average
Northland 239 251 224 203 226 193 241 255 300 344 361 289 250
Auckland 249 244 220 219 206 193 195 241 299 328 332 274 241
Waikato 245 228 191 175 173 153 165 180 226 274 298 250 195
Bay of Plenty 290 371 183 199 195 172 184 208 226 279 309 409 212
Central Plateau 399 . 178 184 186 197 209 217 252 318 281 309 221
Western Uplands . . . 179 193 174 148 209 223 261 305 274 199
East Coast . 242 . 144 343 188 174 309 214 307 451 163 264
Hawkes Bay 305 264 287 290 253 262 230 298 290 347 256 332 283
Taranaki 273 296 202 170 173 166 172 181 214 260 278 264 196
Manawatu 265 273 235 208 211 204 204 256 252 291 290 263 238
Wairarapa 229 297 256 196 226 199 210 218 235 278 302 282 233
Nelson/Marlborough 416 117 355 156 166 162 163 183 186 242 233 294 191
West Coast . 503 . 149 162 163 152 185 173 256 261 235 187
North Canterbury 262 267 305 204 198 181 174 178 182 178 199 234 190
South Canterbury 310 191 215 212 213 203 169 201 182 185 210 197 197
Otago 204 292 321 186 172 180 166 166 183 181 221 235 186
Southland 430 287 387 194 186 184 186 196 187 214 230 220 198
New Zealand1 252 257 205 188 188 176 180 197 216 248 252 244 204
1 Volume weighted averages
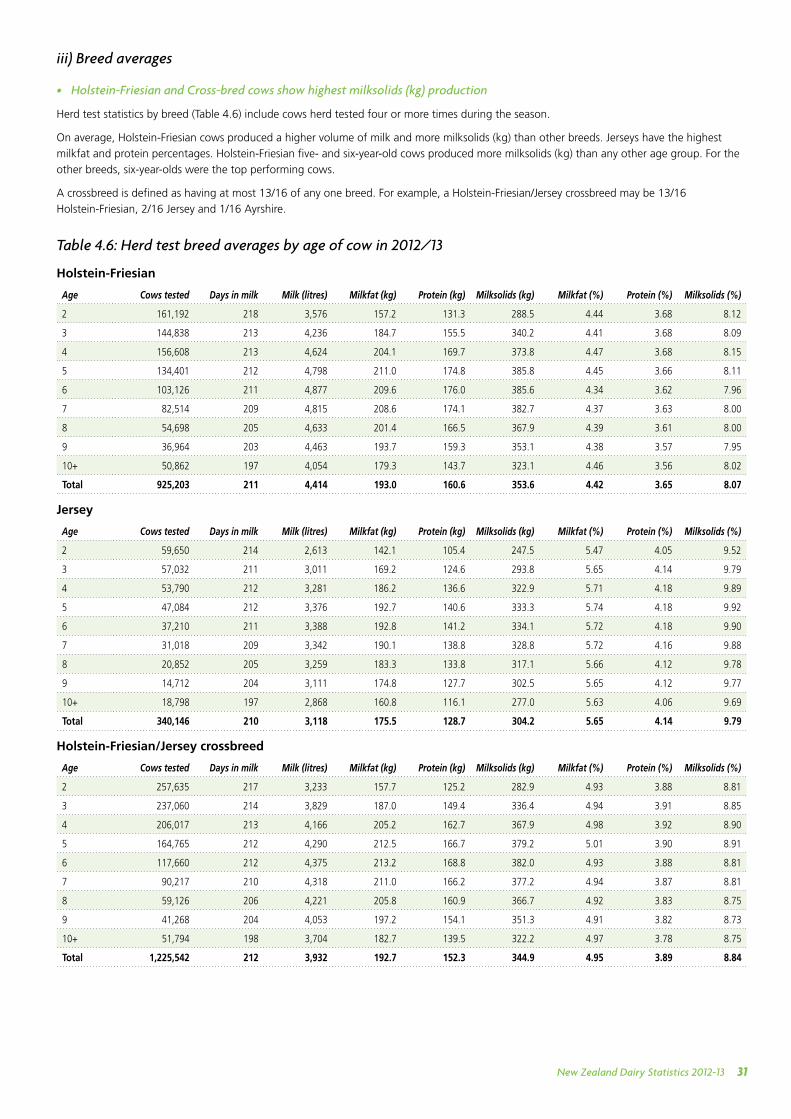
New Zealand Dairy Statistics 2012-13 31
iii) Breed averages
• Holstein-Friesian and Cross-bred cows show highest milksolids (kg) production
Herd test statistics by breed (Table 4.6) include cows herd tested four or more times during the season.
On average, Holstein-Friesian cows produced a higher volume of milk and more milksolids (kg) than other breeds. Jerseys have the highest
milkfat and protein percentages. Holstein-Friesian five- and six-year-old cows produced more milksolids (kg) than any other age group. For the
other breeds, six-year-olds were the top performing cows.
A crossbreed is defined as having at most 13/16 of any one breed. For example, a Holstein-Friesian/Jersey crossbreed may be 13/16
Holstein-Friesian, 2/16 Jersey and 1/16 Ayrshire.
Table 4.6: Herd test breed averages by age of cow in 2012/13
Holstein-Friesian
Age Cows tested Days in milk Milk (litres) Milkfat (kg) Protein (kg) Milksolids (kg) Milkfat (%) Protein (%) Milksolids (%)
2 161,192 218 3,576 157.2 131.3 288.5 4.44 3.68 8.12
3 144,838 213 4,236 184.7 155.5 340.2 4.41 3.68 8.09
4 156,608 213 4,624 204.1 169.7 373.8 4.47 3.68 8.15
5 134,401 212 4,798 211.0 174.8 385.8 4.45 3.66 8.11
6 103,126 211 4,877 209.6 176.0 385.6 4.34 3.62 7.96
7 82,514 209 4,815 208.6 174.1 382.7 4.37 3.63 8.00
8 54,698 205 4,633 201.4 166.5 367.9 4.39 3.61 8.00
9 36,964 203 4,463 193.7 159.3 353.1 4.38 3.57 7.95
10+ 50,862 197 4,054 179.3 143.7 323.1 4.46 3.56 8.02
Total 925,203 211 4,414 193.0 160.6 353.6 4.42 3.65 8.07
Jersey
Age Cows tested Days in milk Milk (litres) Milkfat (kg) Protein (kg) Milksolids (kg) Milkfat (%) Protein (%) Milksolids (%)
2 59,650 214 2,613 142.1 105.4 247.5 5.47 4.05 9.52
3 57,032 211 3,011 169.2 124.6 293.8 5.65 4.14 9.79
4 53,790 212 3,281 186.2 136.6 322.9 5.71 4.18 9.89
5 47,084 212 3,376 192.7 140.6 333.3 5.74 4.18 9.92
6 37,210 211 3,388 192.8 141.2 334.1 5.72 4.18 9.90
7 31,018 209 3,342 190.1 138.8 328.8 5.72 4.16 9.88
8 20,852 205 3,259 183.3 133.8 317.1 5.66 4.12 9.78
9 14,712 204 3,111 174.8 127.7 302.5 5.65 4.12 9.77
10+ 18,798 197 2,868 160.8 116.1 277.0 5.63 4.06 9.69
Total 340,146 210 3,118 175.5 128.7 304.2 5.65 4.14 9.79
Holstein-Friesian/Jersey crossbreed
Age Cows tested Days in milk Milk (litres) Milkfat (kg) Protein (kg) Milksolids (kg) Milkfat (%) Protein (%) Milksolids (%)
2 257,635 217 3,233 157.7 125.2 282.9 4.93 3.88 8.81
3 237,060 214 3,829 187.0 149.4 336.4 4.94 3.91 8.85
4 206,017 213 4,166 205.2 162.7 367.9 4.98 3.92 8.90
5 164,765 212 4,290 212.5 166.7 379.2 5.01 3.90 8.91
6 117,660 212 4,375 213.2 168.8 382.0 4.93 3.88 8.81
7 90,217 210 4,318 211.0 166.2 377.2 4.94 3.87 8.81
8 59,126 206 4,221 205.8 160.9 366.7 4.92 3.83 8.75
9 41,268 204 4,053 197.2 154.1 351.3 4.91 3.82 8.73
10+ 51,794 198 3,704 182.7 139.5 322.2 4.97 3.78 8.75
Total 1,225,542 212 3,932 192.7 152.3 344.9 4.95 3.89 8.84
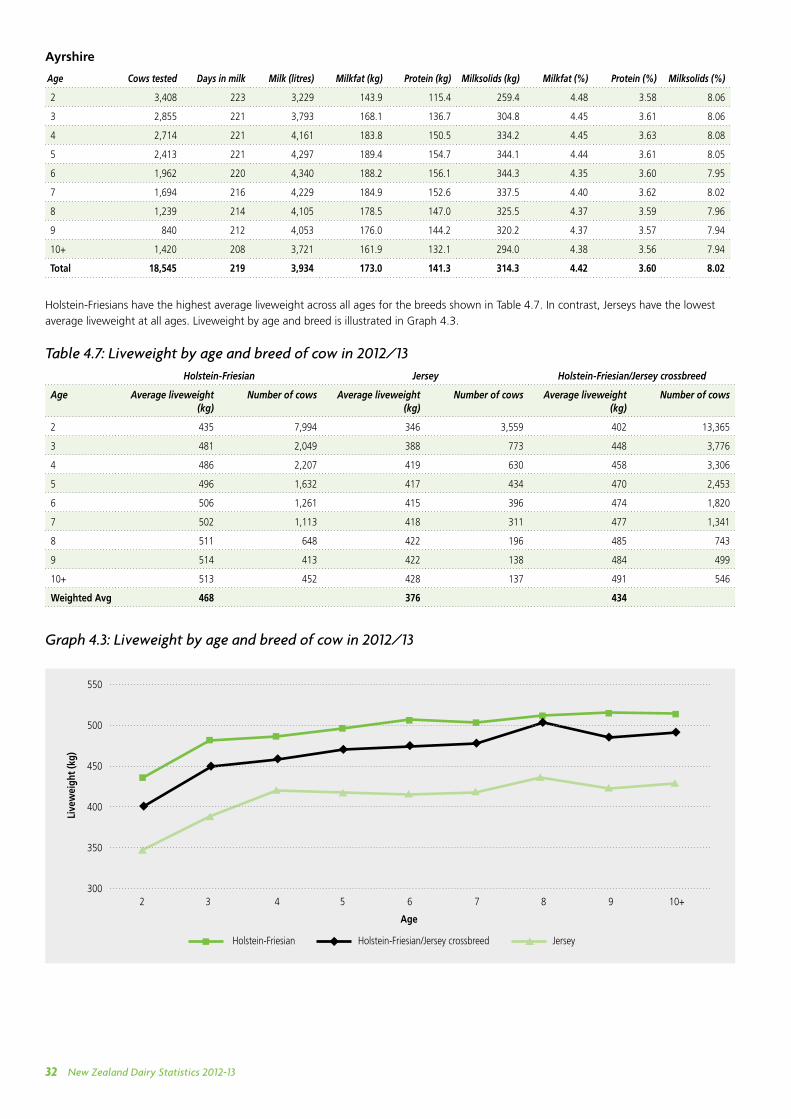
New Zealand Dairy Statistics 2012-1332
Ayrshire
Age Cows tested Days in milk Milk (litres) Milkfat (kg) Protein (kg) Milksolids (kg) Milkfat (%) Protein (%) Milksolids (%)
2 3,408 223 3,229 143.9 115.4 259.4 4.48 3.58 8.06
3 2,855 221 3,793 168.1 136.7 304.8 4.45 3.61 8.06
4 2,714 221 4,161 183.8 150.5 334.2 4.45 3.63 8.08
5 2,413 221 4,297 189.4 154.7 344.1 4.44 3.61 8.05
6 1,962 220 4,340 188.2 156.1 344.3 4.35 3.60 7.95
7 1,694 216 4,229 184.9 152.6 337.5 4.40 3.62 8.02
8 1,239 214 4,105 178.5 147.0 325.5 4.37 3.59 7.96
9 840 212 4,053 176.0 144.2 320.2 4.37 3.57 7.94
10+ 1,420 208 3,721 161.9 132.1 294.0 4.38 3.56 7.94
Total 18,545 219 3,934 173.0 141.3 314.3 4.42 3.60 8.02
Holstein-Friesians have the highest average liveweight across all ages for the breeds shown in Table 4.7. In contrast, Jerseys have the lowest
average liveweight at all ages. Liveweight by age and breed is illustrated in Graph 4.3.
Table 4.7: Liveweight by age and breed of cow in 2012/13Holstein-Friesian Jersey Holstein-Friesian/Jersey crossbreed
Age Average liveweight (kg)
Number of cows Average liveweight (kg)
Number of cows Average liveweight (kg)
Number of cows
2 435 7,994 346 3,559 402 13,365
3 481 2,049 388 773 448 3,776
4 486 2,207 419 630 458 3,306
5 496 1,632 417 434 470 2,453
6 506 1,261 415 396 474 1,820
7 502 1,113 418 311 477 1,341
8 511 648 422 196 485 743
9 514 413 422 138 484 499
10+ 513 452 428 137 491 546
Weighted Avg 468 376 434
Graph 4.3: Liveweight by age and breed of cow in 2012/13
550
500
450
400
350
300
Holstein-Friesian Jersey
2 3 4 5 6 7 8 9 10+
Holstein-Friesian/Jersey crossbreed
Live
wei
ght (
kg)
Age
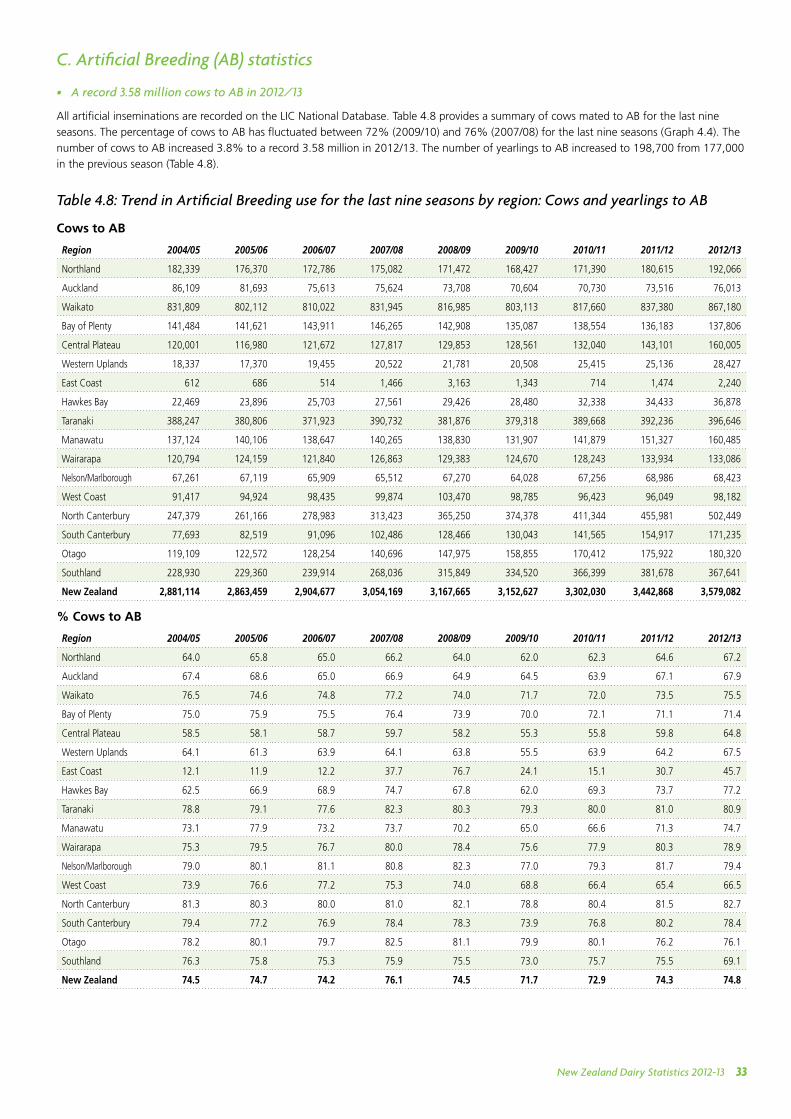
New Zealand Dairy Statistics 2012-13 33
C. Artificial Breeding (AB) statistics
• A record 3.58 million cows to AB in 2012/13
All artificial inseminations are recorded on the LIC National Database. Table 4.8 provides a summary of cows mated to AB for the last nine
seasons. The percentage of cows to AB has fluctuated between 72% (2009/10) and 76% (2007/08) for the last nine seasons (Graph 4.4). The
number of cows to AB increased 3.8% to a record 3.58 million in 2012/13. The number of yearlings to AB increased to 198,700 from 177,000
in the previous season (Table 4.8).
Table 4.8: Trend in Artificial Breeding use for the last nine seasons by region: Cows and yearlings to AB
Cows to AB
Region 2004/05 2005/06 2006/07 2007/08 2008/09 2009/10 2010/11 2011/12 2012/13
Northland 182,339 176,370 172,786 175,082 171,472 168,427 171,390 180,615 192,066
Auckland 86,109 81,693 75,613 75,624 73,708 70,604 70,730 73,516 76,013
Waikato 831,809 802,112 810,022 831,945 816,985 803,113 817,660 837,380 867,180
Bay of Plenty 141,484 141,621 143,911 146,265 142,908 135,087 138,554 136,183 137,806
Central Plateau 120,001 116,980 121,672 127,817 129,853 128,561 132,040 143,101 160,005
Western Uplands 18,337 17,370 19,455 20,522 21,781 20,508 25,415 25,136 28,427
East Coast 612 686 514 1,466 3,163 1,343 714 1,474 2,240
Hawkes Bay 22,469 23,896 25,703 27,561 29,426 28,480 32,338 34,433 36,878
Taranaki 388,247 380,806 371,923 390,732 381,876 379,318 389,668 392,236 396,646
Manawatu 137,124 140,106 138,647 140,265 138,830 131,907 141,879 151,327 160,485
Wairarapa 120,794 124,159 121,840 126,863 129,383 124,670 128,243 133,934 133,086
Nelson/Marlborough 67,261 67,119 65,909 65,512 67,270 64,028 67,256 68,986 68,423
West Coast 91,417 94,924 98,435 99,874 103,470 98,785 96,423 96,049 98,182
North Canterbury 247,379 261,166 278,983 313,423 365,250 374,378 411,344 455,981 502,449
South Canterbury 77,693 82,519 91,096 102,486 128,466 130,043 141,565 154,917 171,235
Otago 119,109 122,572 128,254 140,696 147,975 158,855 170,412 175,922 180,320
Southland 228,930 229,360 239,914 268,036 315,849 334,520 366,399 381,678 367,641
New Zealand 2,881,114 2,863,459 2,904,677 3,054,169 3,167,665 3,152,627 3,302,030 3,442,868 3,579,082
% Cows to AB
Region 2004/05 2005/06 2006/07 2007/08 2008/09 2009/10 2010/11 2011/12 2012/13
Northland 64.0 65.8 65.0 66.2 64.0 62.0 62.3 64.6 67.2
Auckland 67.4 68.6 65.0 66.9 64.9 64.5 63.9 67.1 67.9
Waikato 76.5 74.6 74.8 77.2 74.0 71.7 72.0 73.5 75.5
Bay of Plenty 75.0 75.9 75.5 76.4 73.9 70.0 72.1 71.1 71.4
Central Plateau 58.5 58.1 58.7 59.7 58.2 55.3 55.8 59.8 64.8
Western Uplands 64.1 61.3 63.9 64.1 63.8 55.5 63.9 64.2 67.5
East Coast 12.1 11.9 12.2 37.7 76.7 24.1 15.1 30.7 45.7
Hawkes Bay 62.5 66.9 68.9 74.7 67.8 62.0 69.3 73.7 77.2
Taranaki 78.8 79.1 77.6 82.3 80.3 79.3 80.0 81.0 80.9
Manawatu 73.1 77.9 73.2 73.7 70.2 65.0 66.6 71.3 74.7
Wairarapa 75.3 79.5 76.7 80.0 78.4 75.6 77.9 80.3 78.9
Nelson/Marlborough 79.0 80.1 81.1 80.8 82.3 77.0 79.3 81.7 79.4
West Coast 73.9 76.6 77.2 75.3 74.0 68.8 66.4 65.4 66.5
North Canterbury 81.3 80.3 80.0 81.0 82.1 78.8 80.4 81.5 82.7
South Canterbury 79.4 77.2 76.9 78.4 78.3 73.9 76.8 80.2 78.4
Otago 78.2 80.1 79.7 82.5 81.1 79.9 80.1 76.2 76.1
Southland 76.3 75.8 75.3 75.9 75.5 73.0 75.7 75.5 69.1
New Zealand 74.5 74.7 74.2 76.1 74.5 71.7 72.9 74.3 74.8
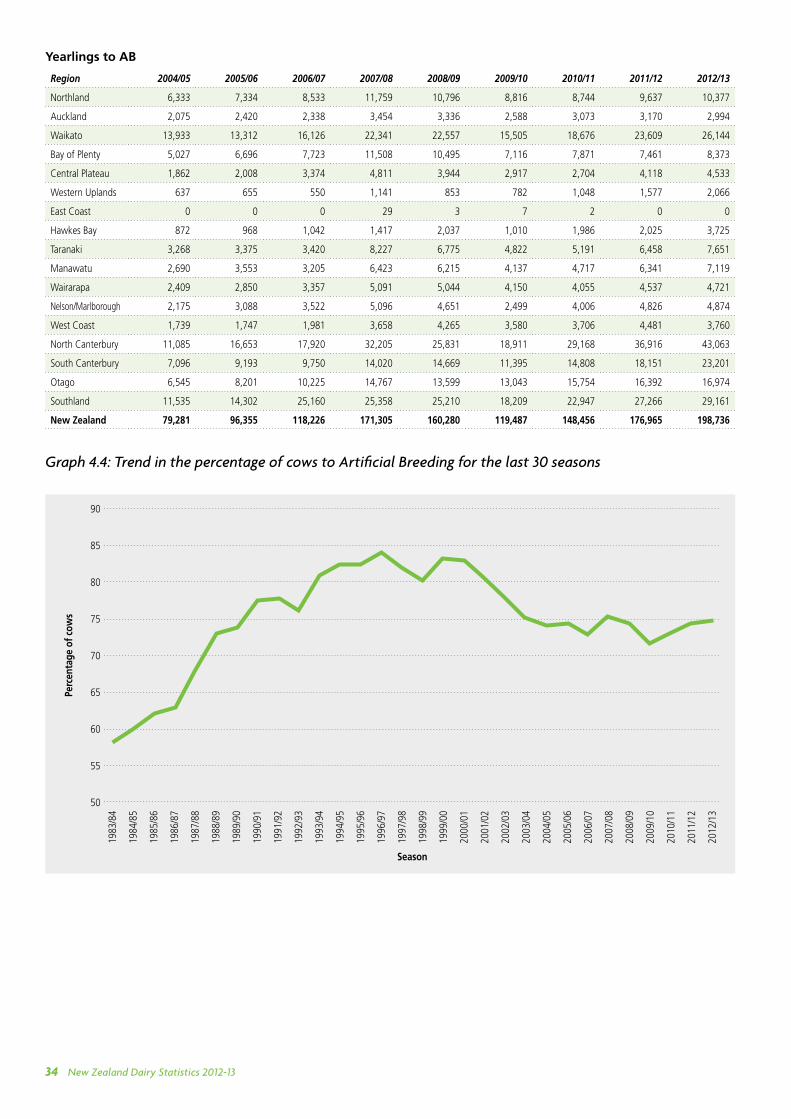
New Zealand Dairy Statistics 2012-1334
Yearlings to AB
Region 2004/05 2005/06 2006/07 2007/08 2008/09 2009/10 2010/11 2011/12 2012/13
Northland 6,333 7,334 8,533 11,759 10,796 8,816 8,744 9,637 10,377
Auckland 2,075 2,420 2,338 3,454 3,336 2,588 3,073 3,170 2,994
Waikato 13,933 13,312 16,126 22,341 22,557 15,505 18,676 23,609 26,144
Bay of Plenty 5,027 6,696 7,723 11,508 10,495 7,116 7,871 7,461 8,373
Central Plateau 1,862 2,008 3,374 4,811 3,944 2,917 2,704 4,118 4,533
Western Uplands 637 655 550 1,141 853 782 1,048 1,577 2,066
East Coast 0 0 0 29 3 7 2 0 0
Hawkes Bay 872 968 1,042 1,417 2,037 1,010 1,986 2,025 3,725
Taranaki 3,268 3,375 3,420 8,227 6,775 4,822 5,191 6,458 7,651
Manawatu 2,690 3,553 3,205 6,423 6,215 4,137 4,717 6,341 7,119
Wairarapa 2,409 2,850 3,357 5,091 5,044 4,150 4,055 4,537 4,721
Nelson/Marlborough 2,175 3,088 3,522 5,096 4,651 2,499 4,006 4,826 4,874
West Coast 1,739 1,747 1,981 3,658 4,265 3,580 3,706 4,481 3,760
North Canterbury 11,085 16,653 17,920 32,205 25,831 18,911 29,168 36,916 43,063
South Canterbury 7,096 9,193 9,750 14,020 14,669 11,395 14,808 18,151 23,201
Otago 6,545 8,201 10,225 14,767 13,599 13,043 15,754 16,392 16,974
Southland 11,535 14,302 25,160 25,358 25,210 18,209 22,947 27,266 29,161
New Zealand 79,281 96,355 118,226 171,305 160,280 119,487 148,456 176,965 198,736
Graph 4.4: Trend in the percentage of cows to Artificial Breeding for the last 30 seasons
90
85
80
75
70
65
60
55
50
1983
/84
1984
/85
1985
/86
1986
/87
1987
/88
1988
/89
1989
/90
1990
/91
1991
/92
1992
/93
1993
/94
1994
/95
1995
/96
1996
/97
1997
/98
1998
/99
1999
/00
2000
/01
2001
/02
2002
/03
2003
/04
2004
/05
2005
/06
2006
/07
2007
/08
2008
/09
2009
/10
2010
/11
2011
/12
2012
/13
Perc
enta
ge o
f cow
s
Season
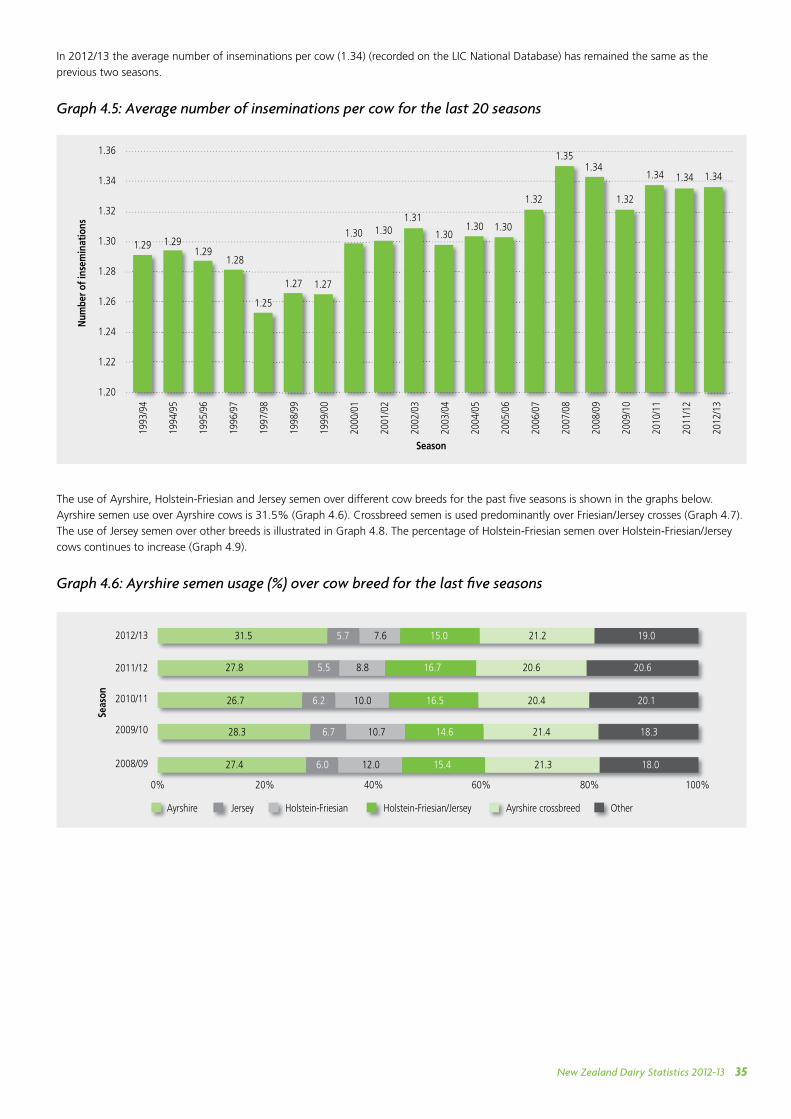
New Zealand Dairy Statistics 2012-13 35
In 2012/13 the average number of inseminations per cow (1.34) (recorded on the LIC National Database) has remained the same as the
previous two seasons.
Graph 4.5: Average number of inseminations per cow for the last 20 seasons
The use of Ayrshire, Holstein-Friesian and Jersey semen over different cow breeds for the past fi ve seasons is shown in the graphs below.
Ayrshire semen use over Ayrshire cows is 31.5% (Graph 4.6). Crossbreed semen is used predominantly over Friesian/Jersey crosses (Graph 4.7).
The use of Jersey semen over other breeds is illustrated in Graph 4.8. The percentage of Holstein-Friesian semen over Holstein-Friesian/Jersey
cows continues to increase (Graph 4.9).
Graph 4.6: Ayrshire semen usage (%) over cow breed for the last fi ve seasons
1993
/94
1994
/95
1995
/96
1996
/97
1997
/98
1998
/99
1999
/00
2000
/01
2001
/02
2002
/03
2003
/04
2004
/05
2005
/06
2006
/07
2007
/08
2008
/09
2009
/10
2010
/11
2011
/12
2012
/13
1.34 1.34
1.29 1.291.29
1.28
1.25
1.27 1.27
1.30 1.301.31
1.301.30 1.30
1.32
1.351.34
1.32
1.36
1.34
1.32
1.30
1.28
1.26
1.24
1.22
1.20
Num
ber o
f ins
emin
atio
ns
Season
1.34
0%
2010/11
2011/12
2009/10
2008/09
2012/13
20%
26.7 6.2 10.0 16.5 20.4 20.1
28.3 6.7 10.7 14.6 21.4 18.3
27.4 6.0 12.0 15.4 21.3 18.0
31.5 5.7 7.6 15.0 21.2 19.0
40% 60% 80% 100%
Ayrshire Jersey Holstein-Friesian Ayrshire crossbreedHolstein-Friesian/Jersey Other
Seas
on
27.8 5.5 8.8 16.7 20.6 20.6
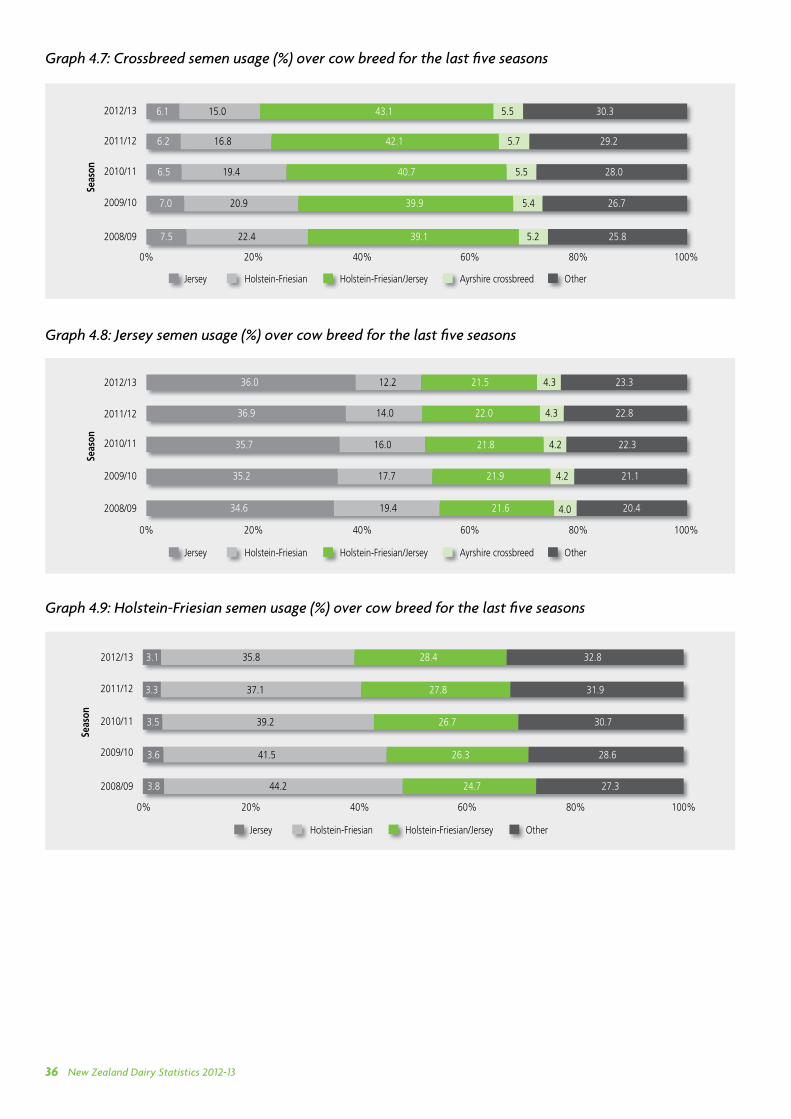
New Zealand Dairy Statistics 2012-1336
Graph 4.7: Crossbreed semen usage (%) over cow breed for the last fi ve seasons
Graph 4.8: Jersey semen usage (%) over cow breed for the last fi ve seasons
Graph 4.9: Holstein-Friesian semen usage (%) over cow breed for the last fi ve seasons
0%
2010/11
2009/10
2008/09
2012/13
2011/12
20% 40% 60% 80% 100%
Jersey Holstein-Friesian Holstein-Friesian/Jersey Ayrshire crossbreed Other
19.46.5 40.7 5.5 28.0
20.97.0 39.9 5.4 26.7
22.47.5 39.1 5.2 25.8
15.06.1 43.1 5.5 30.3
16.86.2 42.1 5.7 29.2
Seas
on
Jersey Holstein-Friesian Holstein-Friesian/Jersey Other
2010/11
2009/10
2008/09
2012/13
2011/12
0% 20% 40% 60% 80% 100%
41.53.6 26.3 28.6
44.23.8 24.7 27.3
35.83.1 28.4 32.8
37.13.3 27.8 31.9
39.23.5 26.7 30.7
Seas
on
0%
2009/10
2008/09
2012/13
2011/12
2010/11
20% 40% 60% 80% 100%
Jersey Holstein-Friesian Holstein-Friesian/Jersey Ayrshire crossbreed Other
16.035.7 21.8 22.34.2
17.735.2 21.9 21.14.2
19.434.6 21.6 20.4
12.236.0 21.5 23.34.3
14.036.9 22.0 22.84.3
Seas
on
4.0
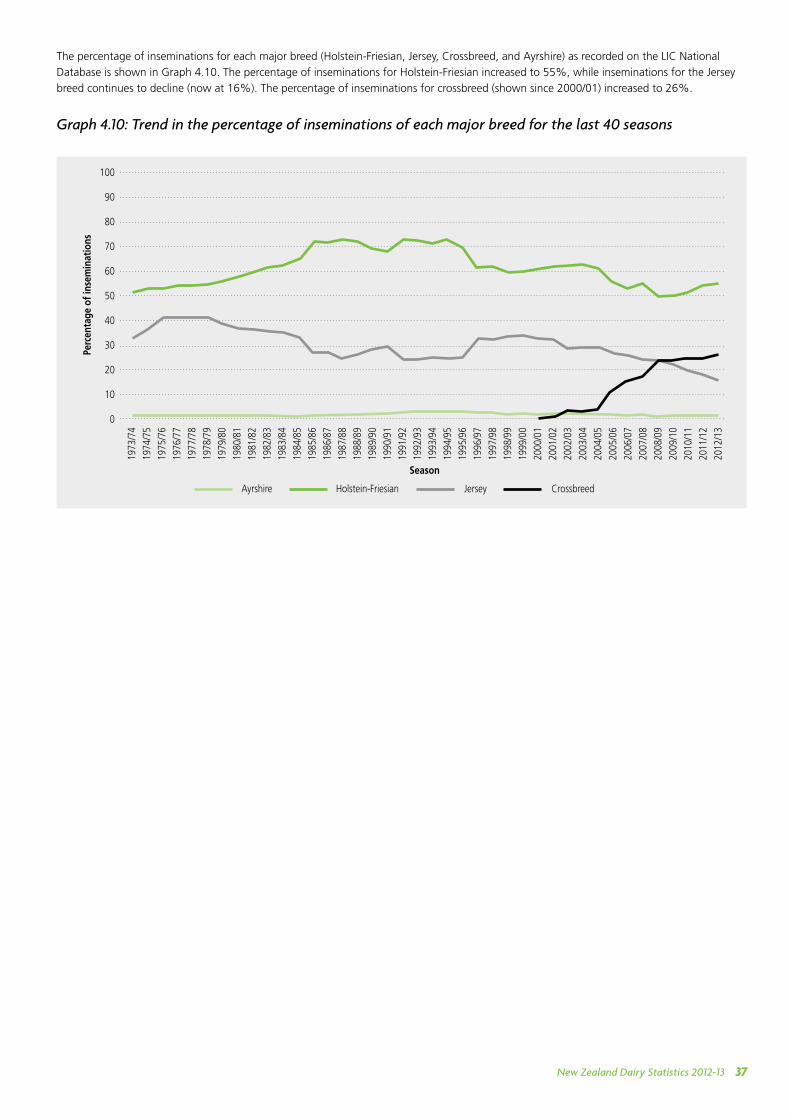
New Zealand Dairy Statistics 2012-13 37
The percentage of inseminations for each major breed (Holstein-Friesian, Jersey, Crossbreed, and Ayrshire) as recorded on the LIC National
Database is shown in Graph 4.10. The percentage of inseminations for Holstein-Friesian increased to 55%, while inseminations for the Jersey
breed continues to decline (now at 16%). The percentage of inseminations for crossbreed (shown since 2000/01) increased to 26%.
Graph 4.10: Trend in the percentage of inseminations of each major breed for the last 40 seasons
100
90
80
70
60
50
40
30
20
10
0
1973
/74
1974
/75
1975
/76
1976
/77
1977
/78
1978
/79
1979
/80
1980
/81
1981
/82
1982
/83
1983
/84
1984
/85
1985
/86
1986
/87
1987
/88
1988
/89
1989
/90
1990
/91
1991
/92
1992
/93
1993
/94
1994
/95
1995
/96
1996
/97
1997
/98
1998
/99
1999
/00
2000
/01
2001
/02
2002
/03
2003
/04
2004
/05
2005
/06
2006
/07
2007
/08
2008
/09
2009
/10
2010
/11
2011
/12
2012
/13
Perc
enta
ge o
f ins
emin
atio
ns
Season
Ayrshire Holstein-Friesian Jersey Crossbreed
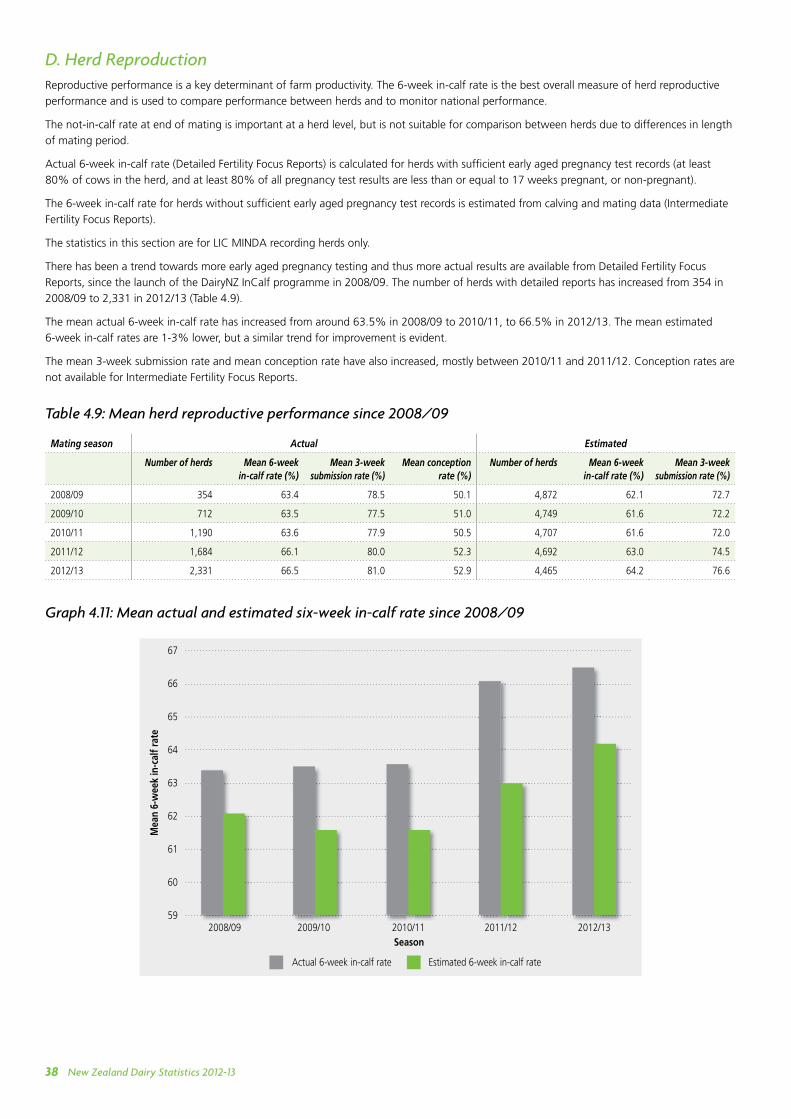
New Zealand Dairy Statistics 2012-1338
D. Herd ReproductionReproductive performance is a key determinant of farm productivity. The 6-week in-calf rate is the best overall measure of herd reproductive
performance and is used to compare performance between herds and to monitor national performance.
The not-in-calf rate at end of mating is important at a herd level, but is not suitable for comparison between herds due to differences in length
of mating period.
Actual 6-week in-calf rate (Detailed Fertility Focus Reports) is calculated for herds with suffi cient early aged pregnancy test records (at least
80% of cows in the herd, and at least 80% of all pregnancy test results are less than or equal to 17 weeks pregnant, or non-pregnant).
The 6-week in-calf rate for herds without suffi cient early aged pregnancy test records is estimated from calving and mating data (Intermediate
Fertility Focus Reports).
The statistics in this section are for LIC MINDA recording herds only.
There has been a trend towards more early aged pregnancy testing and thus more actual results are available from Detailed Fertility Focus
Reports, since the launch of the DairyNZ InCalf programme in 2008/09. The number of herds with detailed reports has increased from 354 in
2008/09 to 2,331 in 2012/13 (Table 4.9).
The mean actual 6-week in-calf rate has increased from around 63.5% in 2008/09 to 2010/11, to 66.5% in 2012/13. The mean estimated
6-week in-calf rates are 1-3% lower, but a similar trend for improvement is evident.
The mean 3-week submission rate and mean conception rate have also increased, mostly between 2010/11 and 2011/12. Conception rates are
not available for Intermediate Fertility Focus Reports.
Table 4.9: Mean herd reproductive performance since 2008/09
Mating season Actual Estimated
Number of herds Mean 6-week in-calf rate (%)
Mean 3-week submission rate (%)
Mean conception rate (%)
Number of herds Mean 6-week in-calf rate (%)
Mean 3-week submission rate (%)
2008/09 354 63.4 78.5 50.1 4,872 62.1 72.7
2009/10 712 63.5 77.5 51.0 4,749 61.6 72.2
2010/11 1,190 63.6 77.9 50.5 4,707 61.6 72.0
2011/12 1,684 66.1 80.0 52.3 4,692 63.0 74.5
2012/13 2,331 66.5 81.0 52.9 4,465 64.2 76.6
Graph 4.11: Mean actual and estimated six-week in-calf rate since 2008/09
2008/09 2009/10 2010/11 2011/12 2012/13
67
66
65
64
63
62
61
60
59
Mea
n 6-
wee
k in
-cal
f rat
e
Season
Actual 6-week in-calf rate Estimated 6-week in-calf rate
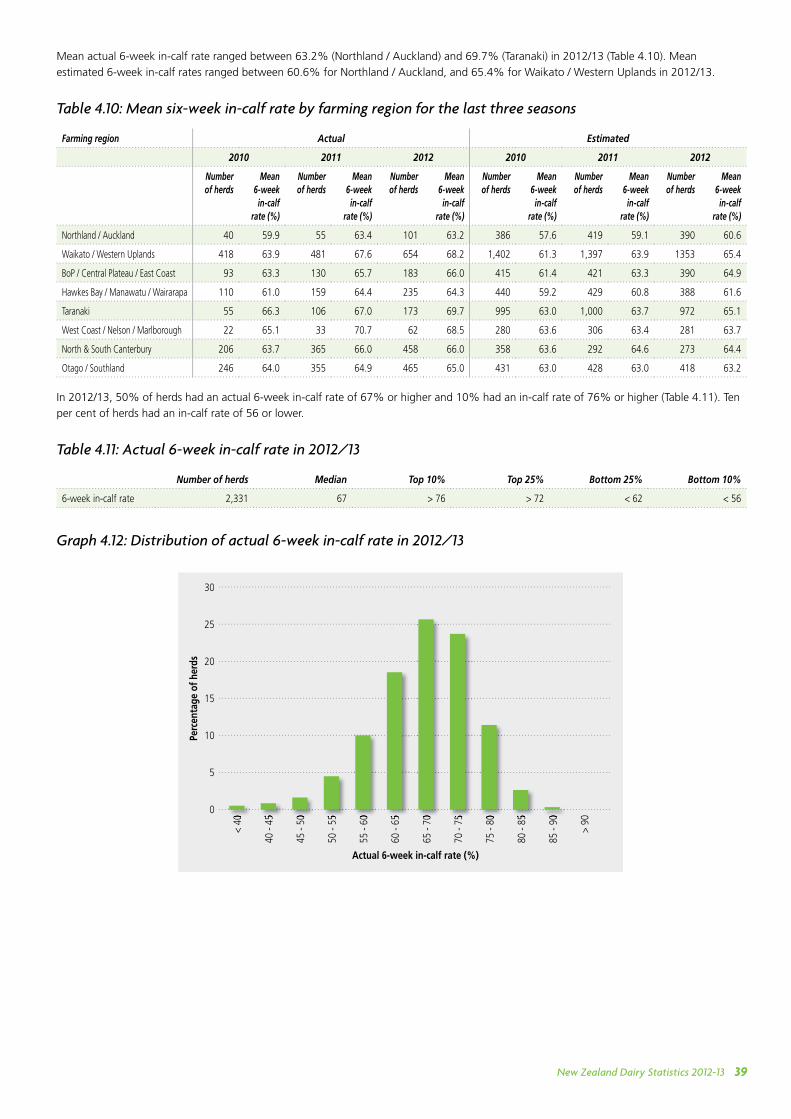
New Zealand Dairy Statistics 2012-13 39
Mean actual 6-week in-calf rate ranged between 63.2% (Northland / Auckland) and 69.7% (Taranaki) in 2012/13 (Table 4.10). Mean
estimated 6-week in-calf rates ranged between 60.6% for Northland / Auckland, and 65.4% for Waikato / Western Uplands in 2012/13.
Table 4.10: Mean six-week in-calf rate by farming region for the last three seasons
Farming region Actual Estimated
2010 2011 2012 2010 2011 2012
Number of herds
Mean 6-week
in-calf rate (%)
Number of herds
Mean 6-week
in-calf rate (%)
Number of herds
Mean 6-week
in-calf rate (%)
Number of herds
Mean 6-week
in-calf rate (%)
Number of herds
Mean 6-week
in-calf rate (%)
Number of herds
Mean 6-week
in-calf rate (%)
Northland / Auckland 40 59.9 55 63.4 101 63.2 386 57.6 419 59.1 390 60.6
Waikato / Western Uplands 418 63.9 481 67.6 654 68.2 1,402 61.3 1,397 63.9 1353 65.4
BoP / Central Plateau / East Coast 93 63.3 130 65.7 183 66.0 415 61.4 421 63.3 390 64.9
Hawkes Bay / Manawatu / Wairarapa 110 61.0 159 64.4 235 64.3 440 59.2 429 60.8 388 61.6
Taranaki 55 66.3 106 67.0 173 69.7 995 63.0 1,000 63.7 972 65.1
West Coast / Nelson / Marlborough 22 65.1 33 70.7 62 68.5 280 63.6 306 63.4 281 63.7
North & South Canterbury 206 63.7 365 66.0 458 66.0 358 63.6 292 64.6 273 64.4
Otago / Southland 246 64.0 355 64.9 465 65.0 431 63.0 428 63.0 418 63.2
In 2012/13, 50% of herds had an actual 6-week in-calf rate of 67% or higher and 10% had an in-calf rate of 76% or higher (Table 4.11). Ten
per cent of herds had an in-calf rate of 56 or lower.
Table 4.11: Actual 6-week in-calf rate in 2012/13
Number of herds Median Top 10% Top 25% Bottom 25% Bottom 10%
6-week in-calf rate 2,331 67 > 76 > 72 < 62 < 56
Graph 4.12: Distribution of actual 6-week in-calf rate in 2012/13
< 40
40 -
45
45 -
50
50 -
55
55 -
60
60 -
65
65 -
70
70 -
75
75 -
80
80 -
85
85 -
90
> 90
30
25
20
15
10
5
0
Perc
enta
ge o
f her
ds
Actual 6-week in-calf rate (%)
< 40
40 -
45
45 -
50
50 -
55
55 -
60
60 -
65
65 -
70
70 -
75
75 -
80
80 -
85
85 -
90
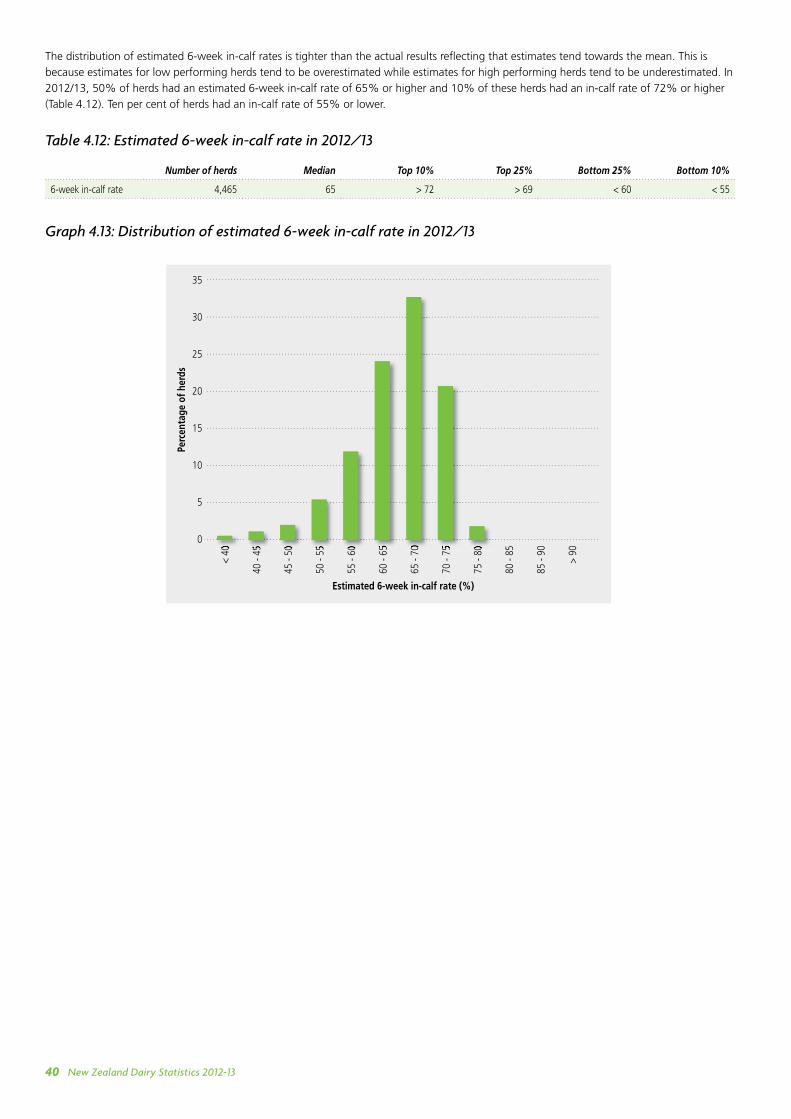
New Zealand Dairy Statistics 2012-1340
The distribution of estimated 6-week in-calf rates is tighter than the actual results refl ecting that estimates tend towards the mean. This is
because estimates for low performing herds tend to be overestimated while estimates for high performing herds tend to be underestimated. In
2012/13, 50% of herds had an estimated 6-week in-calf rate of 65% or higher and 10% of these herds had an in-calf rate of 72% or higher
(Table 4.12). Ten per cent of herds had an in-calf rate of 55% or lower.
Table 4.12: Estimated 6-week in-calf rate in 2012/13
Number of herds Median Top 10% Top 25% Bottom 25% Bottom 10%
6-week in-calf rate 4,465 65 > 72 > 69 < 60 < 55
Graph 4.13: Distribution of estimated 6-week in-calf rate in 2012/13<
40
40 -
45
45 -
50
50 -
55
55 -
60
60 -
65
65 -
70
70 -
75
75 -
80
80 -
85
85 -
90
> 90
35
30
25
20
15
10
5
0
Perc
enta
ge o
f her
ds
Estimated 6-week in-calf rate (%)
< 40
40 -
45
45 -
50
50 -
55
55 -
60
60 -
65
65 -
70
70 -
75
75 -
80
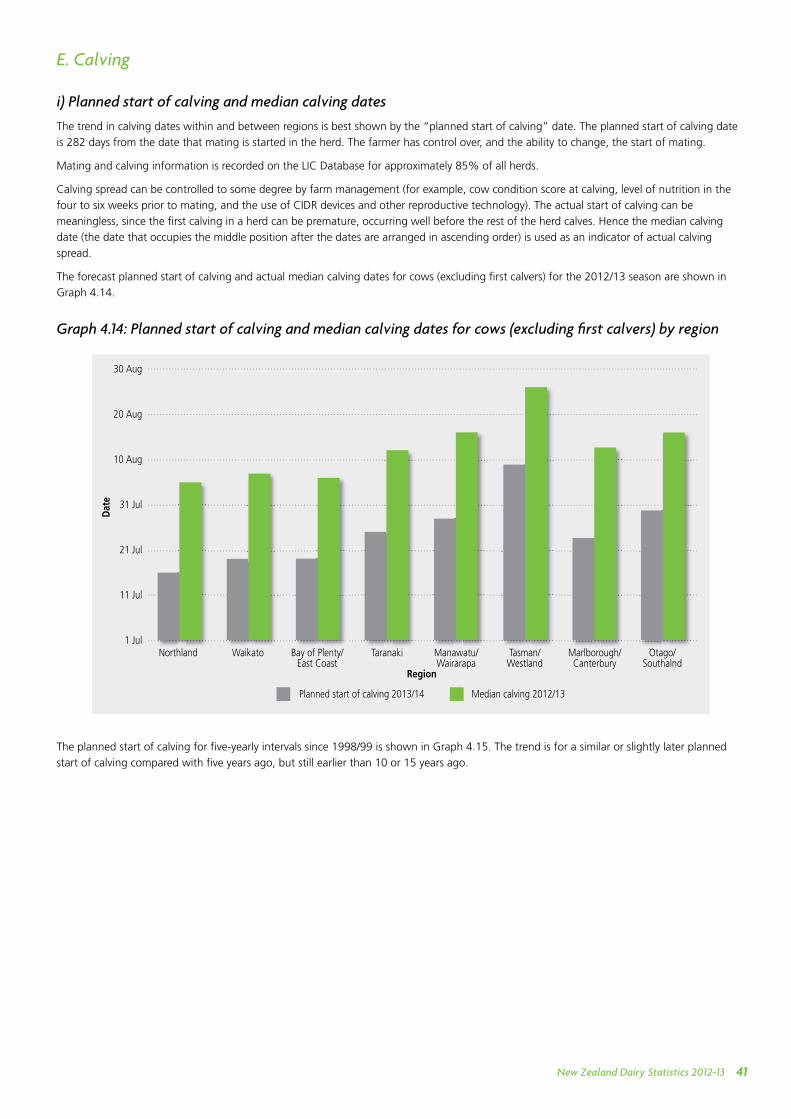
New Zealand Dairy Statistics 2012-13 41
E. Calving
i) Planned start of calving and median calving dates
The trend in calving dates within and between regions is best shown by the “planned start of calving” date. The planned start of calving date
is 282 days from the date that mating is started in the herd. The farmer has control over, and the ability to change, the start of mating.
Mating and calving information is recorded on the LIC Database for approximately 85% of all herds.
Calving spread can be controlled to some degree by farm management (for example, cow condition score at calving, level of nutrition in the
four to six weeks prior to mating, and the use of CIDR devices and other reproductive technology). The actual start of calving can be
meaningless, since the fi rst calving in a herd can be premature, occurring well before the rest of the herd calves. Hence the median calving
date (the date that occupies the middle position after the dates are arranged in ascending order) is used as an indicator of actual calving
spread.
The forecast planned start of calving and actual median calving dates for cows (excluding fi rst calvers) for the 2012/13 season are shown in
Graph 4.14.
Graph 4.14: Planned start of calving and median calving dates for cows (excluding fi rst calvers) by region
The planned start of calving for fi ve-yearly intervals since 1998/99 is shown in Graph 4.15. The trend is for a similar or slightly later planned
start of calving compared with fi ve years ago, but still earlier than 10 or 15 years ago.
Northland Waikato Bay of Plenty/East Coast
Taranaki Manawatu/Wairarapa
Tasman/Westland
Marlborough/Canterbury
Otago/Southalnd
30 Aug
20 Aug
10 Aug
31 Jul
21 Jul
11 Jul
1 Jul
Dat
e
Region
Planned start of calving 2013/14 Median calving 2012/13
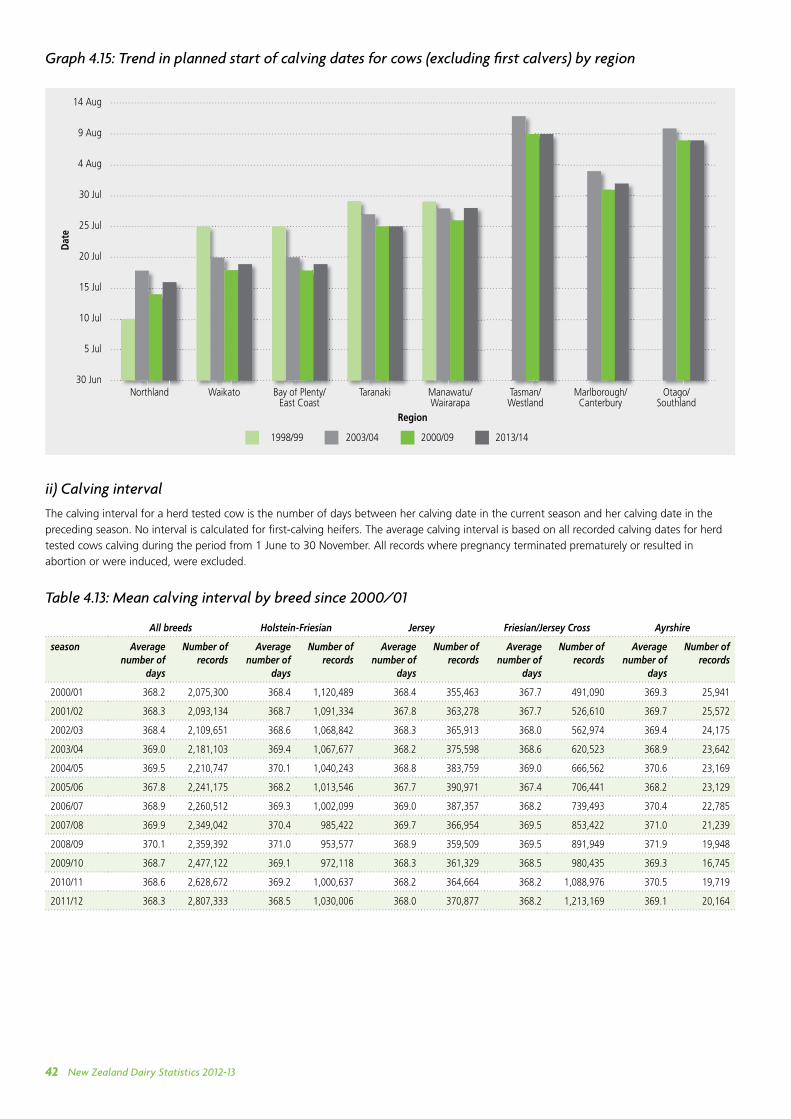
New Zealand Dairy Statistics 2012-1342
Graph 4.15: Trend in planned start of calving dates for cows (excluding fi rst calvers) by region
ii) Calving interval
The calving interval for a herd tested cow is the number of days between her calving date in the current season and her calving date in the
preceding season. No interval is calculated for fi rst-calving heifers. The average calving interval is based on all recorded calving dates for herd
tested cows calving during the period from 1 June to 30 November. All records where pregnancy terminated prematurely or resulted in
abortion or were induced, were excluded.
Table 4.13: Mean calving interval by breed since 2000/01
All breeds Holstein-Friesian Jersey Friesian/Jersey Cross Ayrshire
season Average number of
days
Number of records
Average number of
days
Number of records
Average number of
days
Number of records
Average number of
days
Number of records
Average number of
days
Number of records
2000/01 368.2 2,075,300 368.4 1,120,489 368.4 355,463 367.7 491,090 369.3 25,941
2001/02 368.3 2,093,134 368.7 1,091,334 367.8 363,278 367.7 526,610 369.7 25,572
2002/03 368.4 2,109,651 368.6 1,068,842 368.3 365,913 368.0 562,974 369.4 24,175
2003/04 369.0 2,181,103 369.4 1,067,677 368.2 375,598 368.6 620,523 368.9 23,642
2004/05 369.5 2,210,747 370.1 1,040,243 368.8 383,759 369.0 666,562 370.6 23,169
2005/06 367.8 2,241,175 368.2 1,013,546 367.7 390,971 367.4 706,441 368.2 23,129
2006/07 368.9 2,260,512 369.3 1,002,099 369.0 387,357 368.2 739,493 370.4 22,785
2007/08 369.9 2,349,042 370.4 985,422 369.7 366,954 369.5 853,422 371.0 21,239
2008/09 370.1 2,359,392 371.0 953,577 368.9 359,509 369.5 891,949 371.9 19,948
2009/10 368.7 2,477,122 369.1 972,118 368.3 361,329 368.5 980,435 369.3 16,745
2010/11 368.6 2,628,672 369.2 1,000,637 368.2 364,664 368.2 1,088,976 370.5 19,719
2011/12 368.3 2,807,333 368.5 1,030,006 368.0 370,877 368.2 1,213,169 369.1 20,164
Waikato Bay of Plenty/East Coast
Taranaki Manawatu/Wairarapa
Tasman/Westland
Marlborough/Canterbury
Otago/Southland
Dat
e
Region
1998/99 2003/04 2000/09 2013/14
14 Aug
9 Aug
4 Aug
30 Jul
25 Jul
20 Jul
15 Jul
10 Jul
5 Jul
30 JunNorthland
New Zealand Dairy Statistics 2012-13 43
F. Animal Evaluation
The genetic merit of New Zealand dairy cows and sires is estimated using statistical methods which allow simultaneous evaluation of cows and
sires of all breeds, using all recorded relationships. The structure of the national herd reveals large numbers of crossbred cows, and large
numbers of herds with mixed breeds. For this reason the national evaluation system is designed to compare animals irrespective of breed, both
nationally and within herd, to assist farmers in selecting the most profitable animals for the future.
There are two types of evaluation calculated for New Zealand dairy animals:
1. Trait evaluations are estimates of an animal’s genetic merit (Breeding Values) and lifetime productive ability (Production Values) for
individual traits including milkfat, protein, volume, liveweight, somatic cell, fertility and residual survival.
2. Economic evaluations combine an animal’s individual trait evaluations to estimate its comparative ability to convert feed into profit, through
breeding replacements (Breeding Worth) and lifetime production (Production Worth).
For each economic index, Economic Values are calculated for the relevant traits. For Breeding Worth, the Economic Values represent the net
income per unit of feed from breeding replacements with a one unit genetic improvement in the trait. For Production Worth, the Economic
Values represent the net income per unit of feed from milking cows with a one unit improved productive ability in the trait. In each case the
base unit of feed is 5 tonnes of dry matter in average quality pasture.
The profit-related traits are combined into a single economic index. For example:
Breeding Worth = Milkfat BV x $EV (Milkfat) +
Protein BV x $EV (Protein) +
Milk BV x $EV (Milk) +
Liveweight BV x $EV (Liveweight) +
Somatic Cell BV x $EV (Somatic cell) +
Fertility BV x $EV (Fertility) +
Residual Survival BV x $EV (Residual Survival)
where: BV = Breeding Value for each trait $EV = Economic Value for each trait for breeding replacements
Animal Evaluation ranks animals in terms of their expected profit per unit of feed eaten. Breeding Worth (BW) and Production Worth (PW) are
based on historical and future price predictions for milk components.
The economic values for 2013 are presented below (Table 4.14). The economic values are reviewed annually and therefore may change from
year to year.
Table 4.14: Economic values used from 16 February 2013
Milkfat ($/kg) Protein ($/kg) Milk ($/kg) Liveweight ($/kg) Somatic Cell ($/score)
Fertility ($/%) Residual Survival ($/day)
Breeding Worth 1.79 8.63 -0.091 -1.52 -38.57 7.35 0.148
Production Worth 1.79 8.63 -0.089 -1.52 - - -
The information for all Animal Evaluation statistics was sourced from cows and sires recorded on the LIC National Database as at 11 May 2013.
The evaluations were conducted with reference to a genetic base of cows born in 2000.
Table 4.15 shows the Breeding Values (BV) and Breeding Worth (BW) by breed, of all bulls born in 2008 first proven in the 2012/13 season
with a BW Reliability of 75% or greater. Reliability of BW is reported on a scale from 0% to 99%. 0% is the case where there are no
performance records for any related animal used in the bull’s evaluation. 99% is the case where the bull has a very large number of
performance-recorded daughters.
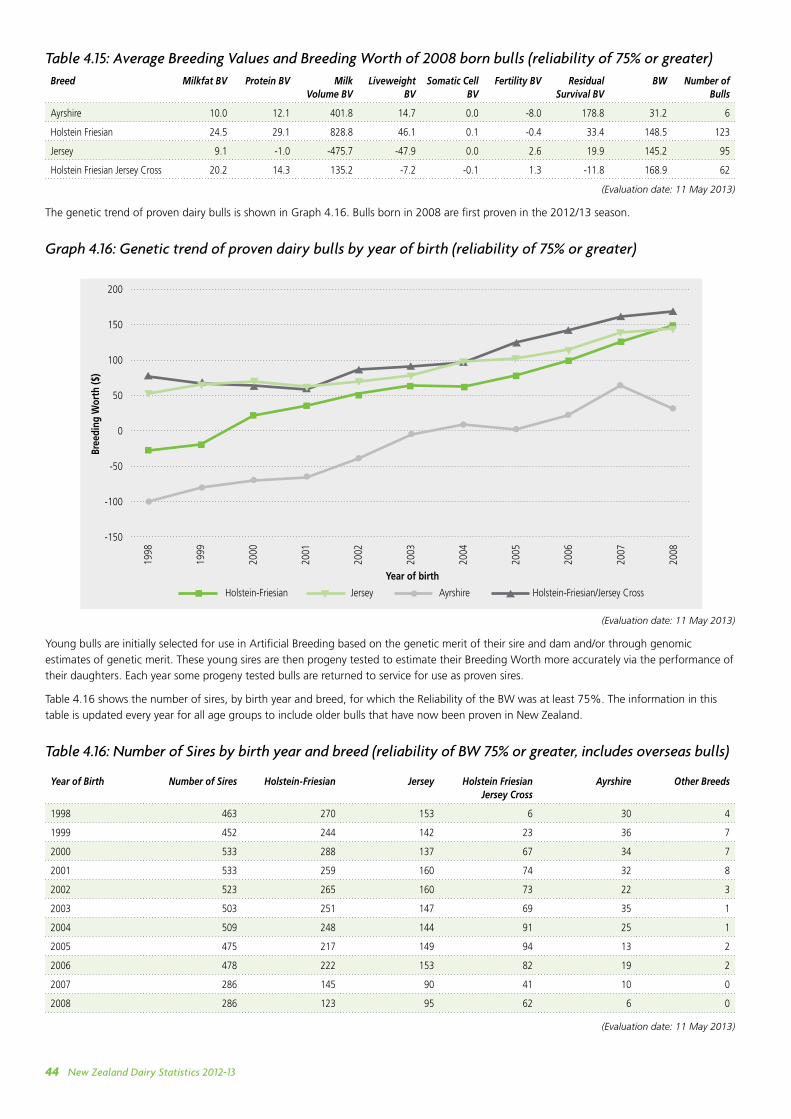
New Zealand Dairy Statistics 2012-1344
Table 4.15: Average Breeding Values and Breeding Worth of 2008 born bulls (reliability of 75% or greater)Breed Milkfat BV Protein BV Milk
Volume BVLiveweight
BVSomatic Cell
BVFertility BV Residual
Survival BVBW Number of
Bulls
Ayrshire 10.0 12.1 401.8 14.7 0.0 -8.0 178.8 31.2 6
Holstein Friesian 24.5 29.1 828.8 46.1 0.1 -0.4 33.4 148.5 123
Jersey 9.1 -1.0 -475.7 -47.9 0.0 2.6 19.9 145.2 95
Holstein Friesian Jersey Cross 20.2 14.3 135.2 -7.2 -0.1 1.3 -11.8 168.9 62
(Evaluation date: 11 May 2013)
The genetic trend of proven dairy bulls is shown in Graph 4.16. Bulls born in 2008 are first proven in the 2012/13 season.
Graph 4.16: Genetic trend of proven dairy bulls by year of birth (reliability of 75% or greater)
(Evaluation date: 11 May 2013)
Young bulls are initially selected for use in Artificial Breeding based on the genetic merit of their sire and dam and/or through genomic
estimates of genetic merit. These young sires are then progeny tested to estimate their Breeding Worth more accurately via the performance of
their daughters. Each year some progeny tested bulls are returned to service for use as proven sires.
Table 4.16 shows the number of sires, by birth year and breed, for which the Reliability of the BW was at least 75%. The information in this
table is updated every year for all age groups to include older bulls that have now been proven in New Zealand.
Table 4.16: Number of Sires by birth year and breed (reliability of BW 75% or greater, includes overseas bulls)
Year of Birth Number of Sires Holstein-Friesian Jersey Holstein Friesian Jersey Cross
Ayrshire Other Breeds
1998 463 270 153 6 30 4
1999 452 244 142 23 36 7
2000 533 288 137 67 34 7
2001 533 259 160 74 32 8
2002 523 265 160 73 22 3
2003 503 251 147 69 35 1
2004 509 248 144 91 25 1
2005 475 217 149 94 13 2
2006 478 222 153 82 19 2
2007 286 145 90 41 10 0
2008 286 123 95 62 6 0
(Evaluation date: 11 May 2013)
1998
1999
2000
2001
2002
2003
2004
2005
2006
2007
2008
200
150
100
50
0
-50
-100
-150
Bree
ding
Wor
th ($
)
Year of birth
Holstein-Friesian Jersey Ayrshire Holstein-Friesian/Jersey Cross
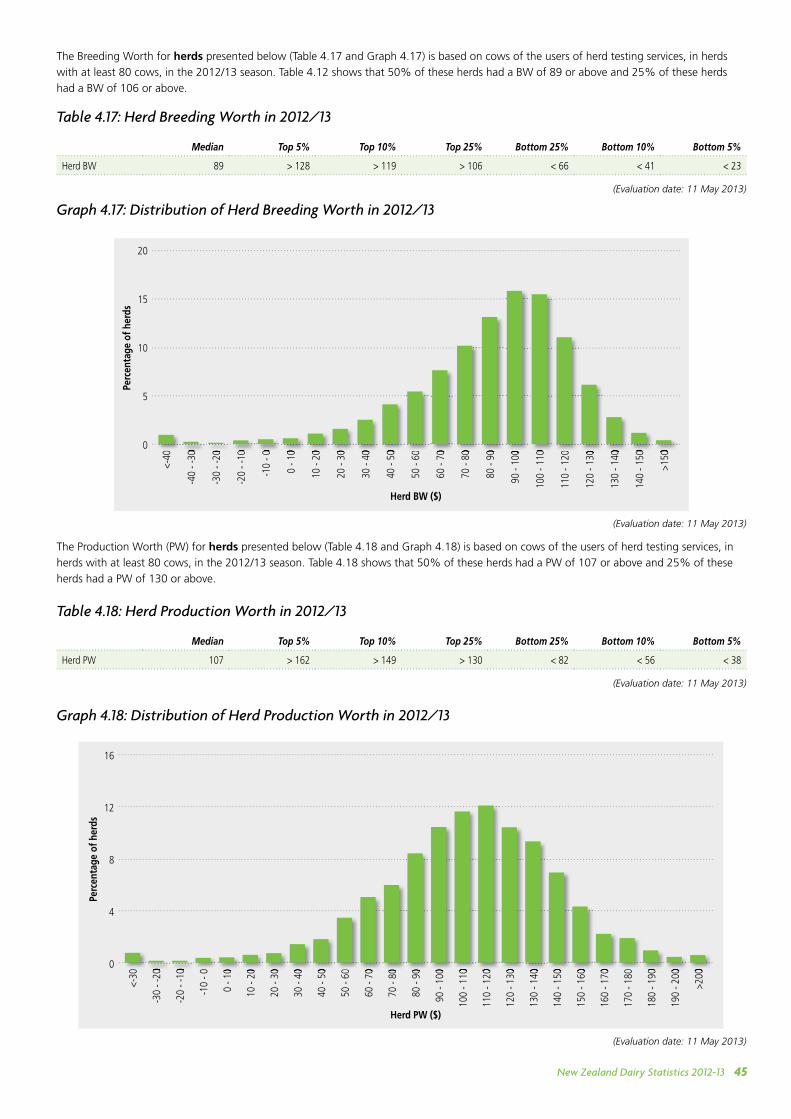
New Zealand Dairy Statistics 2012-13 45
<-30
-30
- -20
-20
- -10
-10
- 0
0 - 1
0
10 -
20
20 -
30
30 -
40
40 -
50
50 -
60
60 -
70
70 -
80
80 -
90
90 -
100
100
- 110
110
- 120
120
- 130
130
- 140
140
- 150
150
- 160
160
- 170
170
- 180
180
- 190
190
- 200
>200
16
12
8
4
0
Perc
enta
ge o
f her
ds
Herd PW ($)
-30
- -20
-20
- -10
0 - 1
0
10 -
20
20 -
30
30 -
40
40 -
50
60 -
70
70 -
80
80 -
90
90 -
100
100
- 110
110
- 120
120
- 130
180
- 190
130
- 140
190
- 200
140
- 150
>200
150
- 160
160
- 170
The Breeding Worth for herds presented below (Table 4.17 and Graph 4.17) is based on cows of the users of herd testing services, in herds
with at least 80 cows, in the 2012/13 season. Table 4.12 shows that 50% of these herds had a BW of 89 or above and 25% of these herds
had a BW of 106 or above.
Table 4.17: Herd Breeding Worth in 2012/13
Median Top 5% Top 10% Top 25% Bottom 25% Bottom 10% Bottom 5%
Herd BW 89 > 128 > 119 > 106 < 66 < 41 < 23
(Evaluation date: 11 May 2013)
Graph 4.17: Distribution of Herd Breeding Worth in 2012/13
(Evaluation date: 11 May 2013)
The Production Worth (PW) for herds presented below (Table 4.18 and Graph 4.18) is based on cows of the users of herd testing services, in
herds with at least 80 cows, in the 2012/13 season. Table 4.18 shows that 50% of these herds had a PW of 107 or above and 25% of these
herds had a PW of 130 or above.
Table 4.18: Herd Production Worth in 2012/13
Median Top 5% Top 10% Top 25% Bottom 25% Bottom 10% Bottom 5%
Herd PW 107 > 162 > 149 > 130 < 82 < 56 < 38
(Evaluation date: 11 May 2013)
Graph 4.18: Distribution of Herd Production Worth in 2012/13
(Evaluation date: 11 May 2013)
<-40
-40
- -30
-30
- -20
-20
- -10
-10
- 0
0 - 1
0
10 -
20
20 -
30
30 -
40
40 -
50
50 -
60
60 -
70
70 -
80
80 -
90
90 -
100
100
- 110
110
- 120
120
- 130
130
- 140
140
- 150
>150
20
15
10
5
0
Perc
enta
ge o
f her
ds
Herd BW ($)
-40
- -30
-30
- -20
-20
- -10
-10
- 0
0 - 1
0
10 -
20
20 -
30
30 -
40
40 -
50
60 -
70
70 -
80
80 -
90
90 -
100
100
- 110
120
- 130
130
- 140
140
- 150
>150
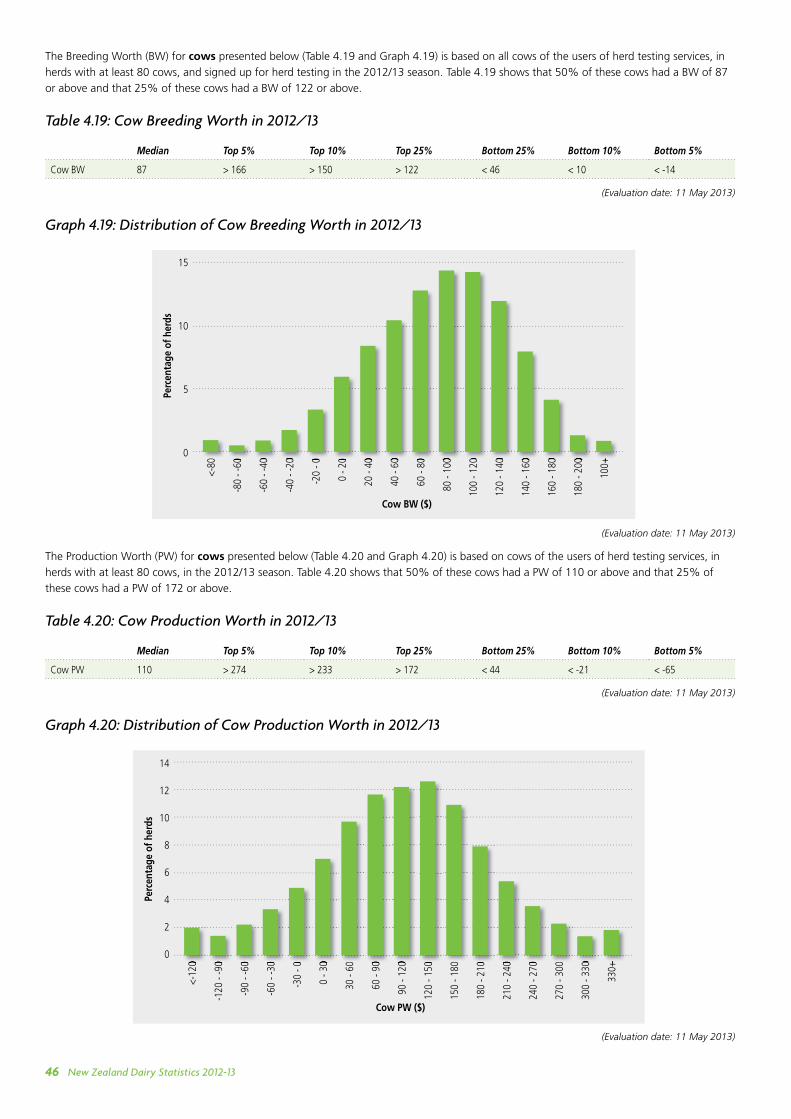
New Zealand Dairy Statistics 2012-1346
The Breeding Worth (BW) for cows presented below (Table 4.19 and Graph 4.19) is based on all cows of the users of herd testing services, in
herds with at least 80 cows, and signed up for herd testing in the 2012/13 season. Table 4.19 shows that 50% of these cows had a BW of 87
or above and that 25% of these cows had a BW of 122 or above.
Table 4.19: Cow Breeding Worth in 2012/13
Median Top 5% Top 10% Top 25% Bottom 25% Bottom 10% Bottom 5%
Cow BW 87 > 166 > 150 > 122 < 46 < 10 < -14
(Evaluation date: 11 May 2013)
Graph 4.19: Distribution of Cow Breeding Worth in 2012/13
(Evaluation date: 11 May 2013)
The Production Worth (PW) for cows presented below (Table 4.20 and Graph 4.20) is based on cows of the users of herd testing services, in
herds with at least 80 cows, in the 2012/13 season. Table 4.20 shows that 50% of these cows had a PW of 110 or above and that 25% of
these cows had a PW of 172 or above.
Table 4.20: Cow Production Worth in 2012/13
Median Top 5% Top 10% Top 25% Bottom 25% Bottom 10% Bottom 5%
Cow PW 110 > 274 > 233 > 172 < 44 < -21 < -65
(Evaluation date: 11 May 2013)
Graph 4.20: Distribution of Cow Production Worth in 2012/13
(Evaluation date: 11 May 2013)
<-80
-80
- -60
-60
- -40
-40
- -20
-20
- 0
0 - 2
0
20 -
40
40 -
60
60 -
80
80 -
100
100
- 120
120
- 140
140
- 160
160
- 180
180
- 200
100+
15
10
5
0
Perc
enta
ge o
f her
ds
Cow BW ($)
-80
- -60
-60
- -40
-40
- -20
-20
- 0
0 - 2
0
20 -
40
40 -
60
60 -
80
80 -
100
100
- 120
120
- 140
140
- 160
160
- 180
180
- 200
100+
<-12
0
-120
- -9
0
-90
- -60
-60
- -30
-30
- 0
0 - 3
0
30 -
60
60 -
90
90 -
120
120
- 150
150
- 180
180
- 210
210
- 240
240
- 270
270
- 300
300
- 330
330+
14
12
10
8
6
4
2
0
Perc
enta
ge o
f her
ds
Cow PW ($)
<-12
0
-120
- -9
0
-90
- -60
-60
- -30
-30
- 0
0 - 3
0
60 -
90
90 -
120
120
- 150
180
- 210
210
- 240
240
- 270
300
- 330
330+
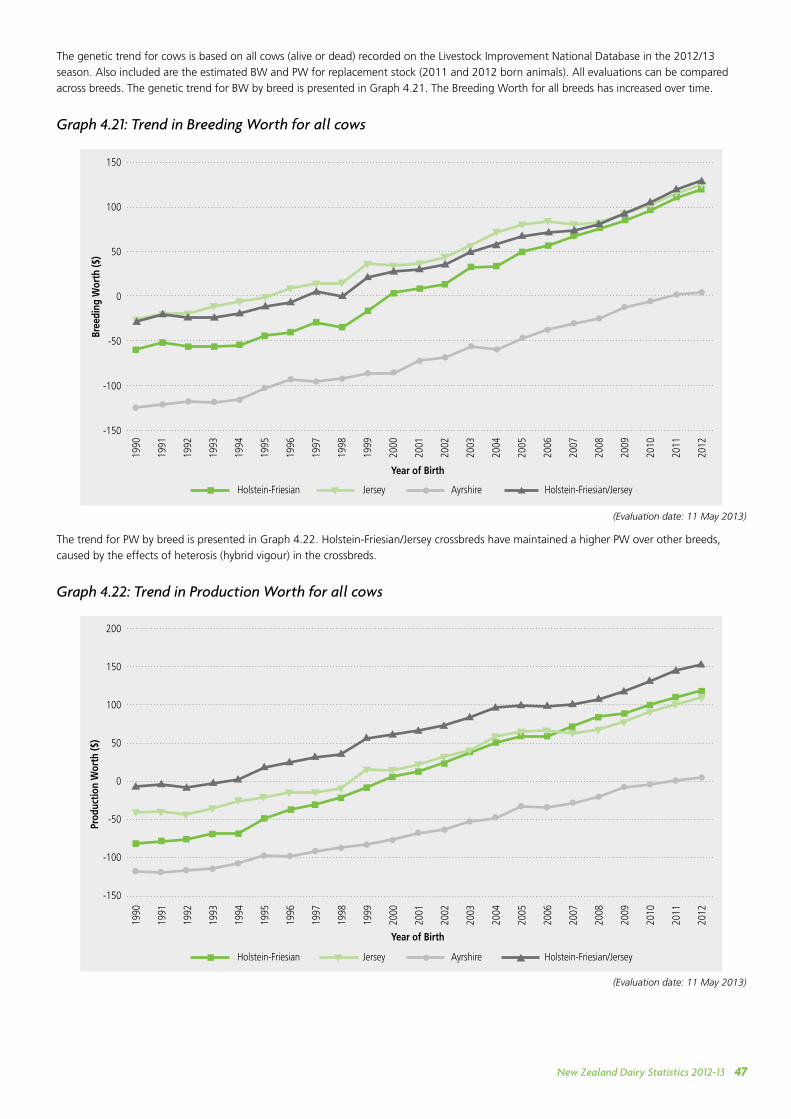
New Zealand Dairy Statistics 2012-13 47
The genetic trend for cows is based on all cows (alive or dead) recorded on the Livestock Improvement National Database in the 2012/13
season. Also included are the estimated BW and PW for replacement stock (2011 and 2012 born animals). All evaluations can be compared
across breeds. The genetic trend for BW by breed is presented in Graph 4.21. The Breeding Worth for all breeds has increased over time.
Graph 4.21: Trend in Breeding Worth for all cows
(Evaluation date: 11 May 2013)
The trend for PW by breed is presented in Graph 4.22. Holstein-Friesian/Jersey crossbreds have maintained a higher PW over other breeds,
caused by the effects of heterosis (hybrid vigour) in the crossbreds.
Graph 4.22: Trend in Production Worth for all cows
(Evaluation date: 11 May 2013)
Prod
uctio
n W
orth
($)
Year of Birth
Holstein-Friesian Jersey Ayrshire Holstein-Friesian/Jersey
1990
1991
1992
1993
1994
1995
1996
1997
1998
1999
2000
2001
2002
2003
2004
2005
2006
2007
2008
2009
2010
2011
2012
200
150
100
50
0
-50
-100
-150
150
100
50
0
-50
-100
-150
Bree
ding
Wor
th ($
)
Year of Birth
Holstein-Friesian Jersey Ayrshire Holstein-Friesian/Jersey
1990
1991
1992
1993
1994
1995
1996
1997
1998
1999
2000
2001
2002
2003
2004
2005
2006
2007
2008
2009
2010
2011
2012
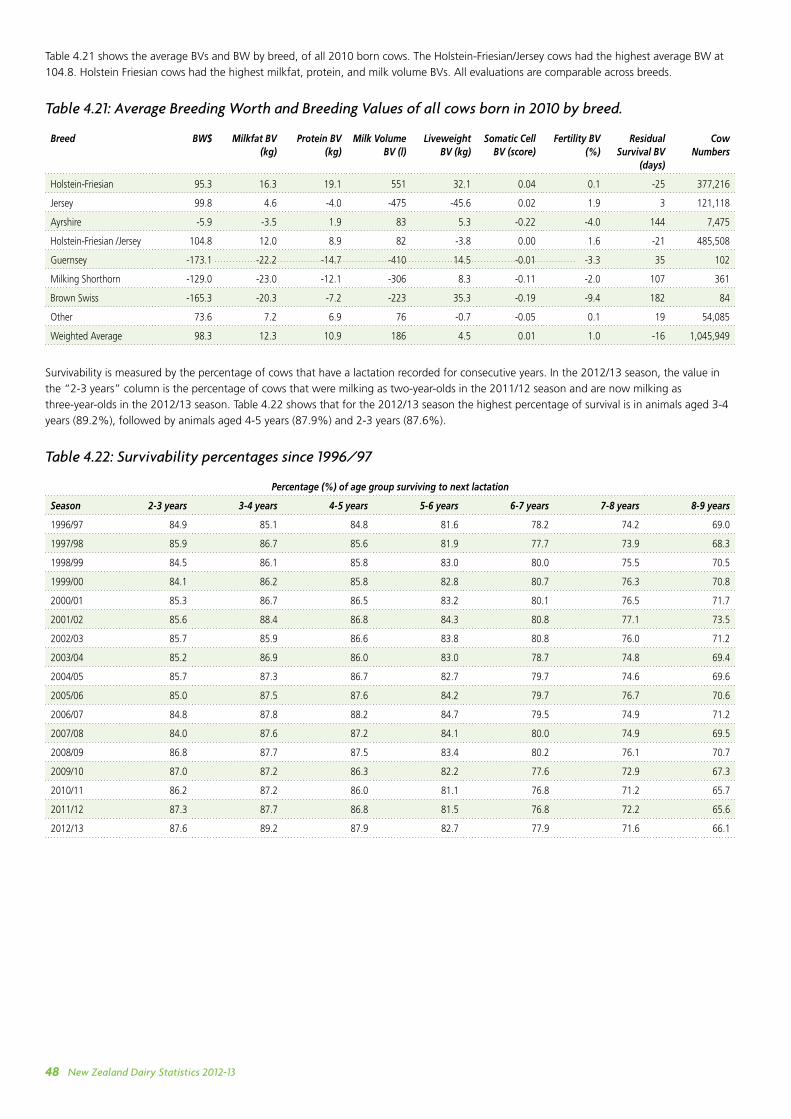
New Zealand Dairy Statistics 2012-1348
Table 4.21 shows the average BVs and BW by breed, of all 2010 born cows. The Holstein-Friesian/Jersey cows had the highest average BW at
104.8. Holstein Friesian cows had the highest milkfat, protein, and milk volume BVs. All evaluations are comparable across breeds.
Table 4.21: Average Breeding Worth and Breeding Values of all cows born in 2010 by breed.
Breed BW$ Milkfat BV (kg)
Protein BV (kg)
Milk Volume BV (l)
Liveweight BV (kg)
Somatic Cell BV (score)
Fertility BV (%)
Residual Survival BV
(days)
Cow Numbers
Holstein-Friesian 95.3 16.3 19.1 551 32.1 0.04 0.1 -25 377,216
Jersey 99.8 4.6 -4.0 -475 -45.6 0.02 1.9 3 121,118
Ayrshire -5.9 -3.5 1.9 83 5.3 -0.22 -4.0 144 7,475
Holstein-Friesian /Jersey 104.8 12.0 8.9 82 -3.8 0.00 1.6 -21 485,508
Guernsey -173.1 -22.2 -14.7 -410 14.5 -0.01 -3.3 35 102
Milking Shorthorn -129.0 -23.0 -12.1 -306 8.3 -0.11 -2.0 107 361
Brown Swiss -165.3 -20.3 -7.2 -223 35.3 -0.19 -9.4 182 84
Other 73.6 7.2 6.9 76 -0.7 -0.05 0.1 19 54,085
Weighted Average 98.3 12.3 10.9 186 4.5 0.01 1.0 -16 1,045,949
Survivability is measured by the percentage of cows that have a lactation recorded for consecutive years. In the 2012/13 season, the value in
the “2-3 years” column is the percentage of cows that were milking as two-year-olds in the 2011/12 season and are now milking as
three-year-olds in the 2012/13 season. Table 4.22 shows that for the 2012/13 season the highest percentage of survival is in animals aged 3-4
years (89.2%), followed by animals aged 4-5 years (87.9%) and 2-3 years (87.6%).
Table 4.22: Survivability percentages since 1996/97
Percentage (%) of age group surviving to next lactation
Season 2-3 years 3-4 years 4-5 years 5-6 years 6-7 years 7-8 years 8-9 years
1996/97 84.9 85.1 84.8 81.6 78.2 74.2 69.0
1997/98 85.9 86.7 85.6 81.9 77.7 73.9 68.3
1998/99 84.5 86.1 85.8 83.0 80.0 75.5 70.5
1999/00 84.1 86.2 85.8 82.8 80.7 76.3 70.8
2000/01 85.3 86.7 86.5 83.2 80.1 76.5 71.7
2001/02 85.6 88.4 86.8 84.3 80.8 77.1 73.5
2002/03 85.7 85.9 86.6 83.8 80.8 76.0 71.2
2003/04 85.2 86.9 86.0 83.0 78.7 74.8 69.4
2004/05 85.7 87.3 86.7 82.7 79.7 74.6 69.6
2005/06 85.0 87.5 87.6 84.2 79.7 76.7 70.6
2006/07 84.8 87.8 88.2 84.7 79.5 74.9 71.2
2007/08 84.0 87.6 87.2 84.1 80.0 74.9 69.5
2008/09 86.8 87.7 87.5 83.4 80.2 76.1 70.7
2009/10 87.0 87.2 86.3 82.2 77.6 72.9 67.3
2010/11 86.2 87.2 86.0 81.1 76.8 71.2 65.7
2011/12 87.3 87.7 86.8 81.5 76.8 72.2 65.6
2012/13 87.6 89.2 87.9 82.7 77.9 71.6 66.1
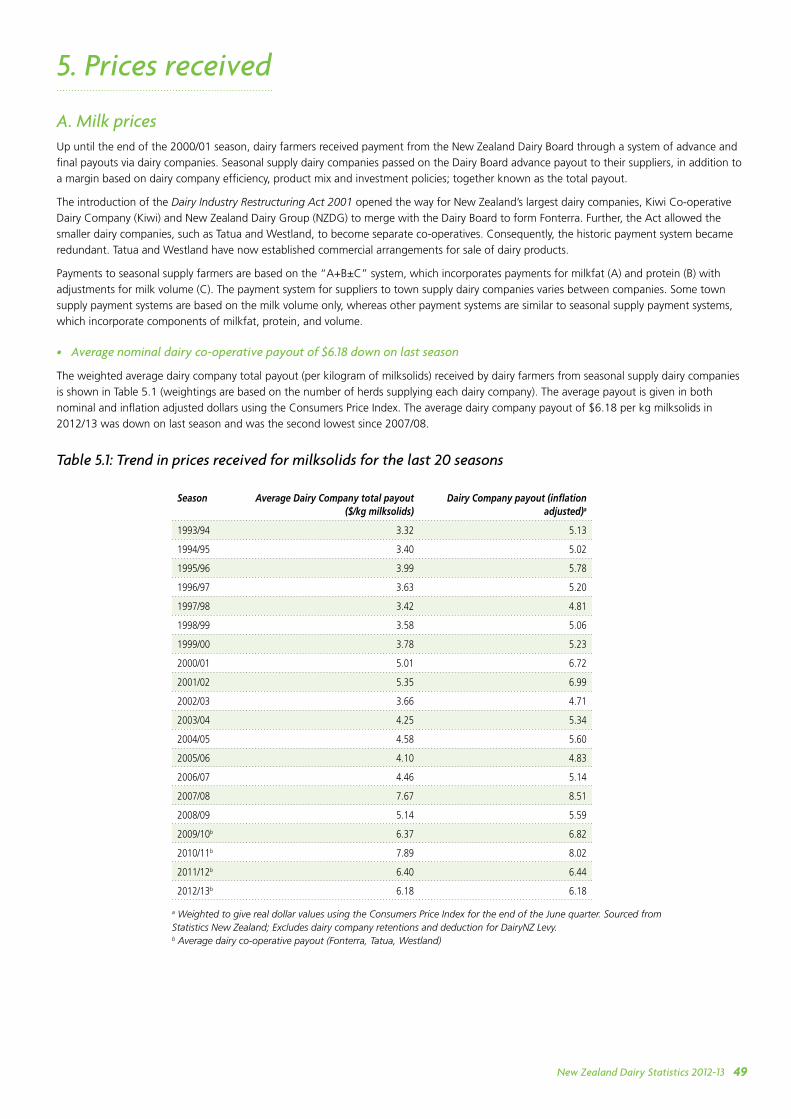
New Zealand Dairy Statistics 2012-13 49
5. Prices received
A. Milk pricesUp until the end of the 2000/01 season, dairy farmers received payment from the New Zealand Dairy Board through a system of advance and
final payouts via dairy companies. Seasonal supply dairy companies passed on the Dairy Board advance payout to their suppliers, in addition to
a margin based on dairy company efficiency, product mix and investment policies; together known as the total payout.
The introduction of the Dairy Industry Restructuring Act 2001 opened the way for New Zealand’s largest dairy companies, Kiwi Co-operative
Dairy Company (Kiwi) and New Zealand Dairy Group (NZDG) to merge with the Dairy Board to form Fonterra. Further, the Act allowed the
smaller dairy companies, such as Tatua and Westland, to become separate co-operatives. Consequently, the historic payment system became
redundant. Tatua and Westland have now established commercial arrangements for sale of dairy products.
Payments to seasonal supply farmers are based on the “A+B±C” system, which incorporates payments for milkfat (A) and protein (B) with
adjustments for milk volume (C). The payment system for suppliers to town supply dairy companies varies between companies. Some town
supply payment systems are based on the milk volume only, whereas other payment systems are similar to seasonal supply payment systems,
which incorporate components of milkfat, protein, and volume.
• Average nominal dairy co-operative payout of $6.18 down on last season
The weighted average dairy company total payout (per kilogram of milksolids) received by dairy farmers from seasonal supply dairy companies
is shown in Table 5.1 (weightings are based on the number of herds supplying each dairy company). The average payout is given in both
nominal and inflation adjusted dollars using the Consumers Price Index. The average dairy company payout of $6.18 per kg milksolids in
2012/13 was down on last season and was the second lowest since 2007/08.
Table 5.1: Trend in prices received for milksolids for the last 20 seasons
Season Average Dairy Company total payout ($/kg milksolids)
Dairy Company payout (inflation adjusted)a
1993/94 3.32 5.13
1994/95 3.40 5.02
1995/96 3.99 5.78
1996/97 3.63 5.20
1997/98 3.42 4.81
1998/99 3.58 5.06
1999/00 3.78 5.23
2000/01 5.01 6.72
2001/02 5.35 6.99
2002/03 3.66 4.71
2003/04 4.25 5.34
2004/05 4.58 5.60
2005/06 4.10 4.83
2006/07 4.46 5.14
2007/08 7.67 8.51
2008/09 5.14 5.59
2009/10b 6.37 6.82
2010/11b 7.89 8.02
2011/12b 6.40 6.44
2012/13b 6.18 6.18
a Weighted to give real dollar values using the Consumers Price Index for the end of the June quarter. Sourced from Statistics New Zealand; Excludes dairy company retentions and deduction for DairyNZ Levy.b Average dairy co-operative payout (Fonterra, Tatua, Westland)
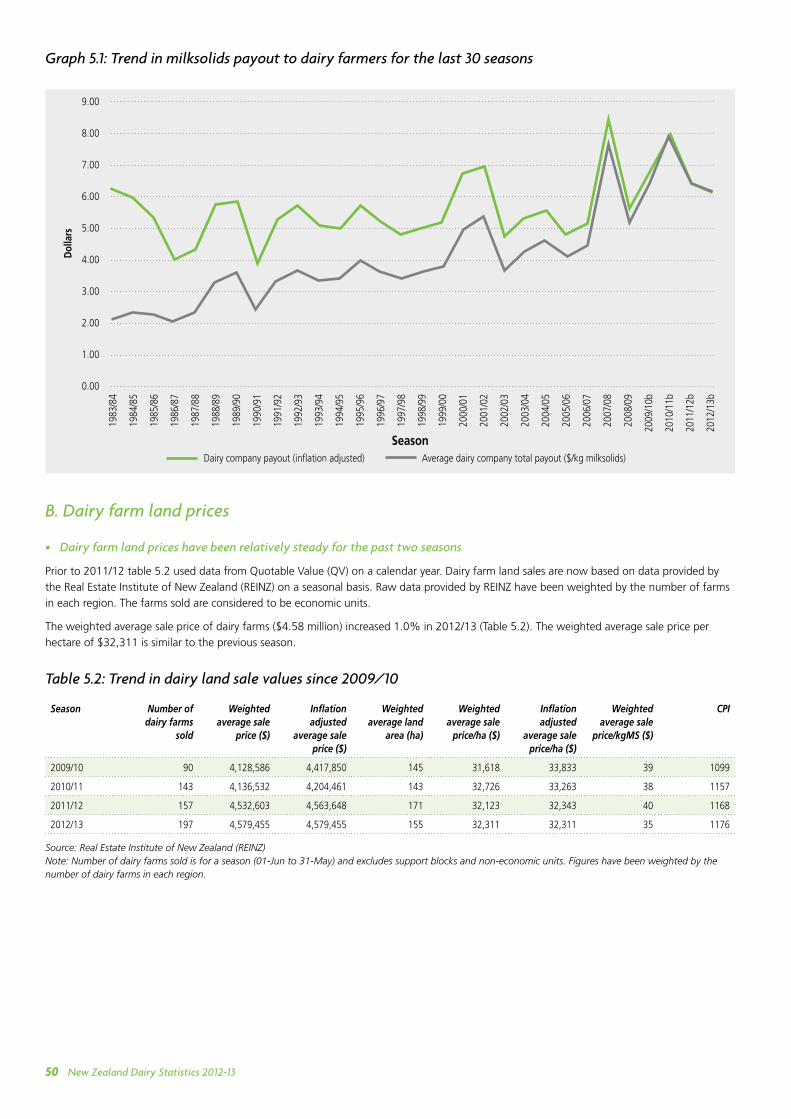
New Zealand Dairy Statistics 2012-1350
Graph 5.1: Trend in milksolids payout to dairy farmers for the last 30 seasons
B. Dairy farm land prices
• Dairy farm land prices have been relatively steady for the past two seasons
Prior to 2011/12 table 5.2 used data from Quotable Value (QV) on a calendar year. Dairy farm land sales are now based on data provided by
the Real Estate Institute of New Zealand (REINZ) on a seasonal basis. Raw data provided by REINZ have been weighted by the number of farms
in each region. The farms sold are considered to be economic units.
The weighted average sale price of dairy farms ($4.58 million) increased 1.0% in 2012/13 (Table 5.2). The weighted average sale price per
hectare of $32,311 is similar to the previous season.
Table 5.2: Trend in dairy land sale values since 2009/10
Season Number of dairy farms
sold
Weighted average sale
price ($)
Inflation adjusted
average sale price ($)
Weighted average land
area (ha)
Weighted average sale
price/ha ($)
Inflation adjusted
average sale price/ha ($)
Weighted average sale
price/kgMS ($)
CPI
2009/10 90 4,128,586 4,417,850 145 31,618 33,833 39 1099
2010/11 143 4,136,532 4,204,461 143 32,726 33,263 38 1157
2011/12 157 4,532,603 4,563,648 171 32,123 32,343 40 1168
2012/13 197 4,579,455 4,579,455 155 32,311 32,311 35 1176
Source: Real Estate Institute of New Zealand (REINZ) Note: Number of dairy farms sold is for a season (01-Jun to 31-May) and excludes support blocks and non-economic units. Figures have been weighted by the number of dairy farms in each region.
9.00
8.00
7.00
6.00
5.00
4.00
3.00
2.00
1.00
0.00
1983
/84
1984
/85
1985
/86
1986
/87
1987
/88
1988
/89
1989
/90
1990
/91
1991
/92
1992
/93
1993
/94
1994
/95
1995
/96
1996
/97
1997
/98
1998
/99
1999
/00
2000
/01
2001
/02
2002
/03
2003
/04
2004
/05
2005
/06
2006
/07
2007
/08
2008
/09
2009
/10b
2010
/11b
2011
/12b
2012
/13b
Season
Dol
lars
Dairy company payout (inflation adjusted) Average dairy company total payout ($/kg milksolids)
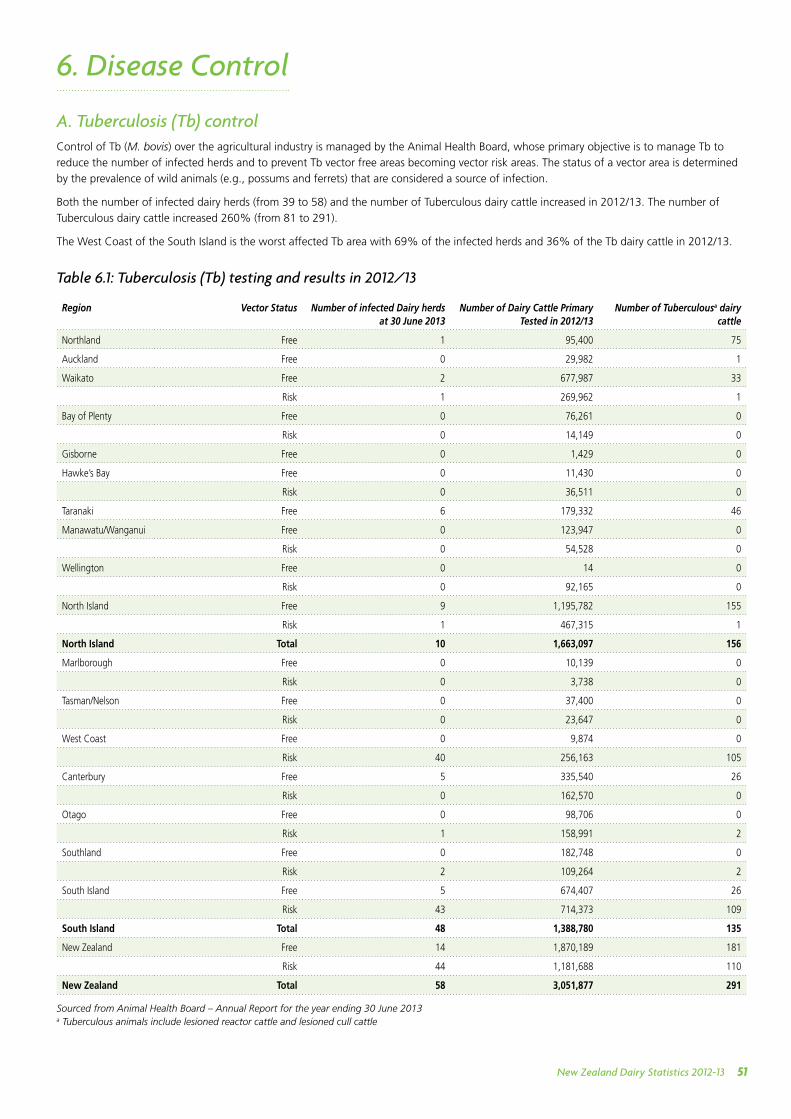
New Zealand Dairy Statistics 2012-13 51
6. Disease Control
A. Tuberculosis (Tb) controlControl of Tb (M. bovis) over the agricultural industry is managed by the Animal Health Board, whose primary objective is to manage Tb to
reduce the number of infected herds and to prevent Tb vector free areas becoming vector risk areas. The status of a vector area is determined
by the prevalence of wild animals (e.g., possums and ferrets) that are considered a source of infection.
Both the number of infected dairy herds (from 39 to 58) and the number of Tuberculous dairy cattle increased in 2012/13. The number of
Tuberculous dairy cattle increased 260% (from 81 to 291).
The West Coast of the South Island is the worst affected Tb area with 69% of the infected herds and 36% of the Tb dairy cattle in 2012/13.
Table 6.1: Tuberculosis (Tb) testing and results in 2012/13
Region Vector Status Number of infected Dairy herds at 30 June 2013
Number of Dairy Cattle Primary Tested in 2012/13
Number of Tuberculousa dairy cattle
Northland Free 1 95,400 75
Auckland Free 0 29,982 1
Waikato Free 2 677,987 33
Risk 1 269,962 1
Bay of Plenty Free 0 76,261 0
Risk 0 14,149 0
Gisborne Free 0 1,429 0
Hawke’s Bay Free 0 11,430 0
Risk 0 36,511 0
Taranaki Free 6 179,332 46
Manawatu/Wanganui Free 0 123,947 0
Risk 0 54,528 0
Wellington Free 0 14 0
Risk 0 92,165 0
North Island Free 9 1,195,782 155
Risk 1 467,315 1
North Island Total 10 1,663,097 156
Marlborough Free 0 10,139 0
Risk 0 3,738 0
Tasman/Nelson Free 0 37,400 0
Risk 0 23,647 0
West Coast Free 0 9,874 0
Risk 40 256,163 105
Canterbury Free 5 335,540 26
Risk 0 162,570 0
Otago Free 0 98,706 0
Risk 1 158,991 2
Southland Free 0 182,748 0
Risk 2 109,264 2
South Island Free 5 674,407 26
Risk 43 714,373 109
South Island Total 48 1,388,780 135
New Zealand Free 14 1,870,189 181
Risk 44 1,181,688 110
New Zealand Total 58 3,051,877 291
Sourced from Animal Health Board – Annual Report for the year ending 30 June 2013 a Tuberculous animals include lesioned reactor cattle and lesioned cull cattle
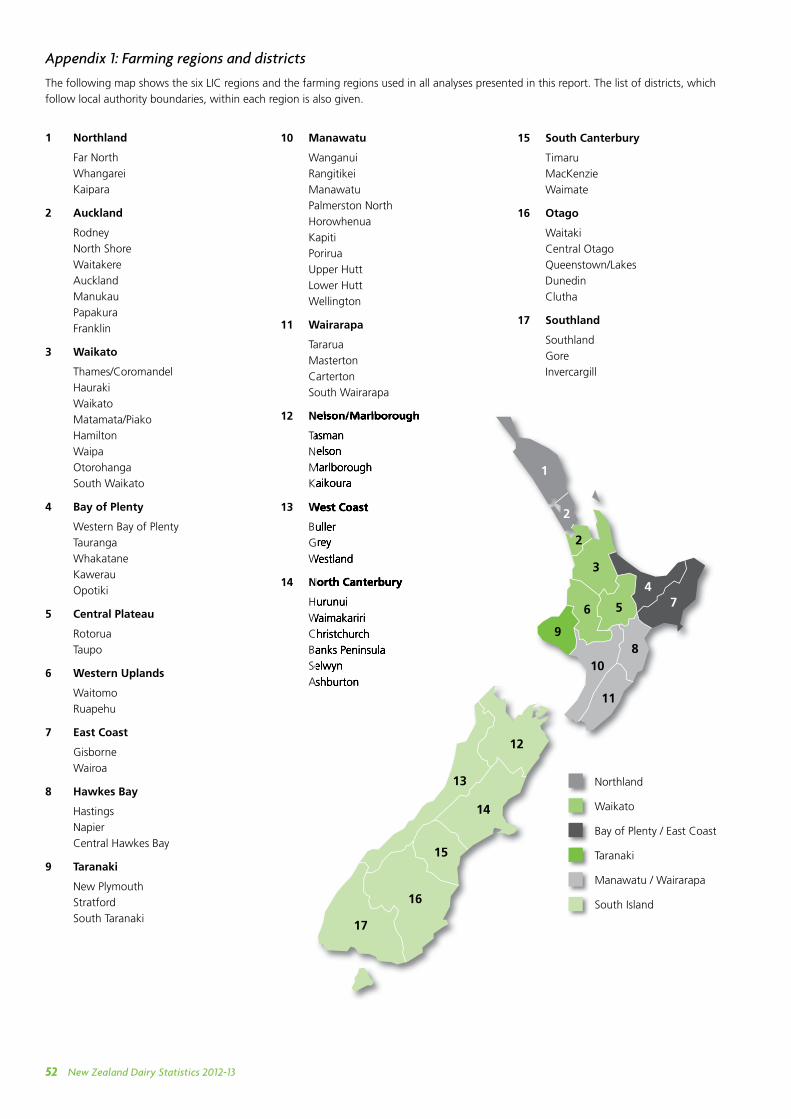
New Zealand Dairy Statistics 2012-1352
1 Northland
Far North
Whangarei
Kaipara
2 Auckland
Rodney
North Shore
Waitakere
Auckland
Manukau
Papakura
Franklin
3 Waikato
Thames/Coromandel
Hauraki
Waikato
Matamata/Piako
Hamilton
Waipa
Otorohanga
South Waikato
4 Bay of Plenty
Western Bay of Plenty
Tauranga
Whakatane
Kawerau
Opotiki
5 Central Plateau
Rotorua
Taupo
6 Western Uplands
Waitomo
Ruapehu
7 East Coast
Gisborne
Wairoa
8 Hawkes Bay
Hastings
Napier
Central Hawkes Bay
9 Taranaki
New Plymouth
Stratford
South Taranaki
10 Manawatu
Wanganui
Rangitikei
Manawatu
Palmerston North
Horowhenua
Kapiti
Porirua
Upper Hutt
Lower Hutt
Wellington
11 Wairarapa
Tararua
Masterton
Carterton
South Wairarapa
12 Nelson/Marlborough
Tasman
Nelson
Marlborough
Kaikoura
13 West Coast
Buller
Grey
Westland
14 North Canterbury
Hurunui
Waimakariri
Christchurch
Banks Peninsula
Selwyn
Ashburton
15 South Canterbury
Timaru
MacKenzie
Waimate
16 Otago
Waitaki
Central Otago
Queenstown/Lakes
Dunedin
Clutha
17 Southland
Southland
Gore
Invercargill
12 Nelson/Marlborough
Tasman
Nelson
Marlborough
Kaikoura
13 West Coast
Buller
Grey
Westland
14 North Canterbury
Hurunui
Waimakariri
Christchurch
Banks Peninsula
Selwyn
Ashburton
1
2
2
3
6 5
8
11
10
12
14
15
13
16
17
9
74
Northland
Waikato
Bay of Plenty / East Coast
Taranaki
Manawatu / Wairarapa
South Island
Appendix 1: Farming regions and districts
The following map shows the six LIC regions and the farming regions used in all analyses presented in this report. The list of districts, which
follow local authority boundaries, within each region is also given.

New Zealand Dairy Statistics
2012-13
New
Zealand Dairy Statistics 2012-13