Embed Size (px)
Citation preview
8/3/2019 New Zealand; Corrective Maintenance Costs for Green Infrastructure
http://slidepdf.com/reader/full/new-zealand-corrective-maintenance-costs-for-green-infrastructure 1/79
(Version 1)
User Manual
December 2009
Prepared by Koru Environmental Consultants Ltd. for Landcare Research
8/3/2019 New Zealand; Corrective Maintenance Costs for Green Infrastructure
http://slidepdf.com/reader/full/new-zealand-corrective-maintenance-costs-for-green-infrastructure 2/79
COSTnz Model – User Manual (V.1) December 2009
i
COSTnz Model – User Manual
CONTENTSDEFINITIONS ............................................................................................................. iii 1. INTRODUCTION.................................................................................................. 1
1.1 Aims of the user guide and how to use it......................................................1 1.2 Overview of the Model ..................................................................................1 1.3 Origins of the Data & Algorithms ..................................................................2
1.3.1 Unit Cost Data ..........................................................................................2 1.3.2 Statistical Relationships for Total Acquisition Costs ................................. 2 1.3.3 Cleanout Frequencies ..............................................................................5
1.4 Limitations of the Model and Caveats ..........................................................5 2. LIFE CYCLE COSTING .......................................................................................7
2.1 What is Life Cycle Costing? .........................................................................7 2.2 Life Cycle Costing Parameters .....................................................................7
3. STORMWATER PONDS .....................................................................................9 3.1 Introduction ...................................................................................................9 3.2 Pond Design and Costing Assumptions .....................................................10 3.3 Total Acquisition Costs (Design & Construction Costs) ..............................12 3.4 Maintenance and Decommissioning Costs ................................................14
4. WETLANDS .......................................................................................................17 4.1 Introduction .................................................................................................17 4.2 Wetland Design and Costing Assumptions ................................................18 4.4 Total Acquisition Costs (Design & Construction Costs) ..............................20 4.4 Maintenance and Decommissioning Costs ................................................22
5. RAIN GARDENS ................................................................................................26 5.1 Introduction .................................................................................................26 5.2 Rain Garden Design and Costing Assumptions .........................................26 5.3 Total Acquisition Costs (Design & Construction Costs) ..............................29 5.4 Maintenance and Decommissioning Costs ................................................31
6 SAND FILTERS .................................................................................................33 6.1 Introduction .................................................................................................33 6.2 Sand Filter Design and Costing Assumptions ............................................33 6.3 Total Acquisition Costs (Design & Construction Costs) ..............................36 6.4 Maintenance and Decommissioning Costs ................................................37
7 INFILTRATION PRACTICES .............................................................................40 7.1 Introduction .................................................................................................40 7.2 Infiltration Design and Costing Assumptions ..............................................40 7.3 Total Acquisition Costs (Design & Construction Costs) ..............................42 7.4 Maintenance and Decommissioning Costs ................................................44
8
SWALES AND FILTER STRIPS ........................................................................47
8.1 Introduction .................................................................................................47 8.2 Swale/ Filter Strip Design and Costing Assumptions .................................47
8/3/2019 New Zealand; Corrective Maintenance Costs for Green Infrastructure
http://slidepdf.com/reader/full/new-zealand-corrective-maintenance-costs-for-green-infrastructure 3/79
COSTnz Model – User Manual (V.1) December 2009
ii
8.3 Total Acquisition Costs (Design & Construction Costs) ..............................49 8.4 Maintenance and Decommissioning Costs ................................................52
9 RAIN TANKS .....................................................................................................55 9.1 Introduction .................................................................................................55 9.2 Rain Tank Design and Costing Assumptions .............................................55 9.3 Total Acquisition Costs (Design & Construction Costs) ..............................57 9.4 Maintenance and Decommissioning Costs ................................................58
10 THE GENERIC MODULE ..................................................................................61 10.1 Introduction .................................................................................................61 10.2 The Generic Design and Costing Assumptions ..........................................61 10.3 Total Acquisition Costs (Design & Construction Costs) ..............................64 10.4 Maintenance and Decommissioning Costs ................................................65
11 DISPLAYING AND USING THE RESULTS .......................................................68 11.1 Summary of Displayed Results ..................................................................68 11.2
Reporting Results .......................................................................................69
11.3 Saving and Retrieving Scenarios ...............................................................69 11.4 Exporting and Printing the Results .............................................................70 11.5 User Assistance ...........................................Error! Bookmark not defined.
REFERENCES ...........................................................................................................72 APPENDIX A ..............................................................................................................74
8/3/2019 New Zealand; Corrective Maintenance Costs for Green Infrastructure
http://slidepdf.com/reader/full/new-zealand-corrective-maintenance-costs-for-green-infrastructure 4/79
COSTnz Model – User Manual (V.1) December 2009
iii
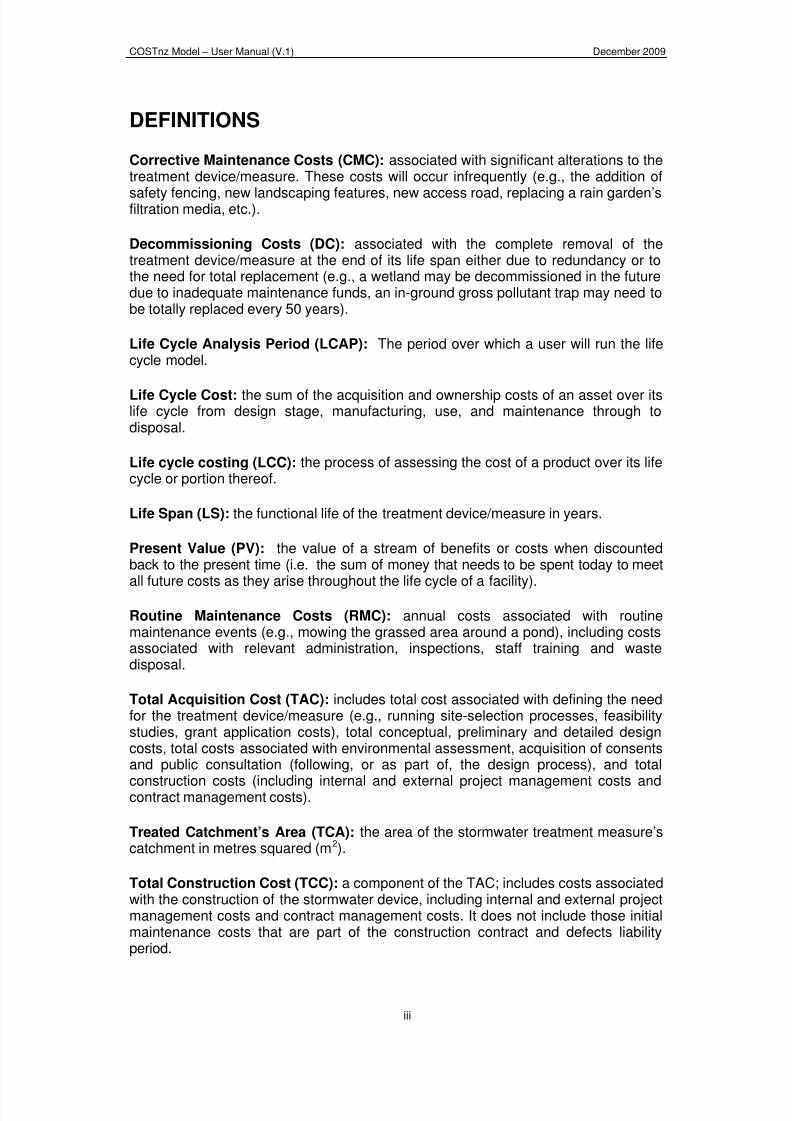
DEFINITIONS
Corrective Maintenance Costs (CMC): associated with significant alterations to thetreatment device/measure. These costs will occur infrequently (e.g., the addition of
safety fencing, new landscaping features, new access road, replacing a rain garden’sfiltration media, etc.).
Decommissioning Costs (DC): associated with the complete removal of thetreatment device/measure at the end of its life span either due to redundancy or tothe need for total replacement (e.g., a wetland may be decommissioned in the futuredue to inadequate maintenance funds, an in-ground gross pollutant trap may need tobe totally replaced every 50 years).
Life Cycle Analysis Period (LCAP): The period over which a user will run the lifecycle model.
Life Cycle Cost: the sum of the acquisition and ownership costs of an asset over itslife cycle from design stage, manufacturing, use, and maintenance through todisposal.
Life cycle costing (LCC): the process of assessing the cost of a product over its lifecycle or portion thereof.
Life Span (LS): the functional life of the treatment device/measure in years.
Present Value (PV): the value of a stream of benefits or costs when discountedback to the present time (i.e. the sum of money that needs to be spent today to meetall future costs as they arise throughout the life cycle of a facility).
Routine Maintenance Costs (RMC): annual costs associated with routinemaintenance events (e.g., mowing the grassed area around a pond), including costsassociated with relevant administration, inspections, staff training and wastedisposal.
Total Acquisition Cost (TAC): includes total cost associated with defining the needfor the treatment device/measure (e.g., running site-selection processes, feasibilitystudies, grant application costs), total conceptual, preliminary and detailed designcosts, total costs associated with environmental assessment, acquisition of consents
and public consultation (following, or as part of, the design process), and totalconstruction costs (including internal and external project management costs andcontract management costs).
Treated Catchment’s Area (TCA): the area of the stormwater treatment measure’scatchment in metres squared (m2).
Total Construction Cost (TCC): a component of the TAC; includes costs associatedwith the construction of the stormwater device, including internal and external projectmanagement costs and contract management costs. It does not include those initialmaintenance costs that are part of the construction contract and defects liabilityperiod.

8/3/2019 New Zealand; Corrective Maintenance Costs for Green Infrastructure
http://slidepdf.com/reader/full/new-zealand-corrective-maintenance-costs-for-green-infrastructure 5/79
COSTnz Model – User Manual (V.1) December 2009
iv
Treatment Zone Area (TZA): refers to the area where stormwater is treated. Forexample, for ponds and wetlands the treatment zone area includes the forebay/inletpond area as well as the main treatment zone; for rain gardens/bioretention systemsthe area of the filter can be separately estimated.
8/3/2019 New Zealand; Corrective Maintenance Costs for Green Infrastructure
http://slidepdf.com/reader/full/new-zealand-corrective-maintenance-costs-for-green-infrastructure 6/79
COSTnz Model: User Manual (v.1) Chapter 1: Introduction
December 2009 Page 1
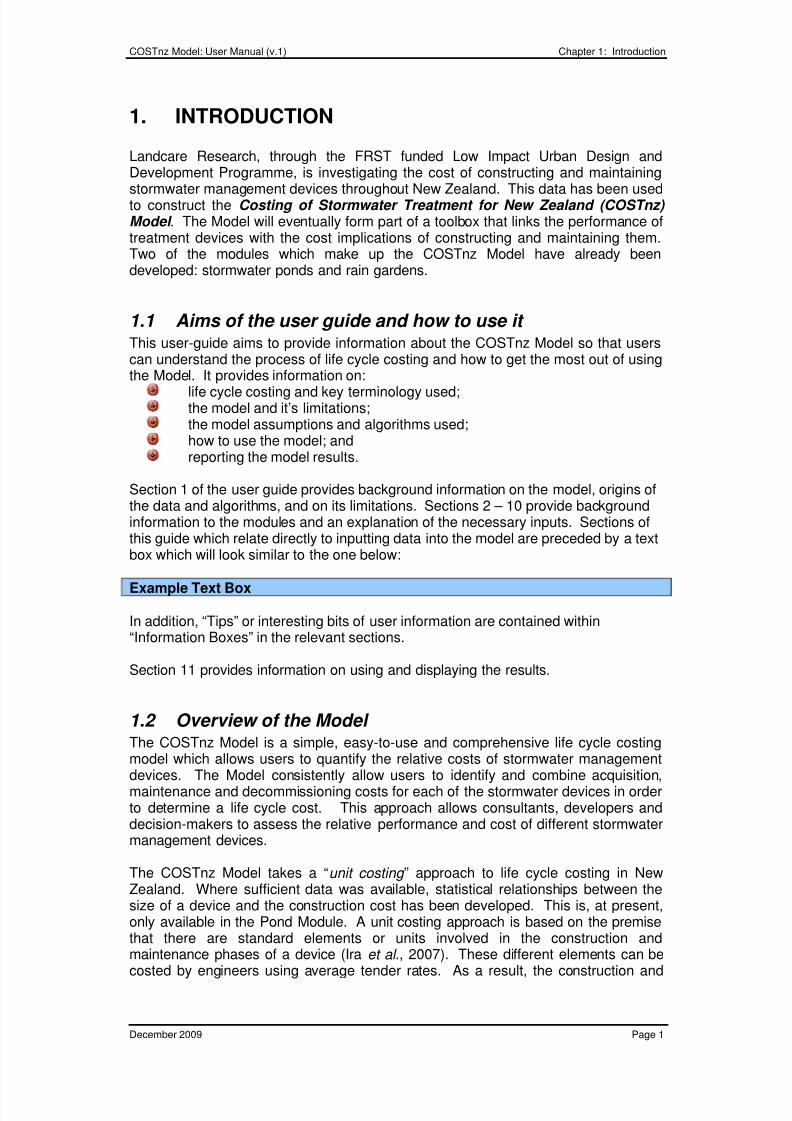
1. INTRODUCTION
Landcare Research, through the FRST funded Low Impact Urban Design andDevelopment Programme, is investigating the cost of constructing and maintaining
stormwater management devices throughout New Zealand. This data has been usedto construct the Costing of Stormwater Treatment for New Zealand (COSTnz) Model . The Model will eventually form part of a toolbox that links the performance oftreatment devices with the cost implications of constructing and maintaining them.Two of the modules which make up the COSTnz Model have already beendeveloped: stormwater ponds and rain gardens.
1.1 Aims of the user guide and how to use it This user-guide aims to provide information about the COSTnz Model so that userscan understand the process of life cycle costing and how to get the most out of using
the Model. It provides information on:life cycle costing and key terminology used;the model and it’s limitations;the model assumptions and algorithms used;how to use the model; andreporting the model results.
Section 1 of the user guide provides background information on the model, origins ofthe data and algorithms, and on its limitations. Sections 2 – 10 provide backgroundinformation to the modules and an explanation of the necessary inputs. Sections ofthis guide which relate directly to inputting data into the model are preceded by a textbox which will look similar to the one below:
Example Text Box
In addition, “Tips” or interesting bits of user information are contained within“Information Boxes” in the relevant sections.
Section 11 provides information on using and displaying the results.
1.2 Overview of the Model The COSTnz Model is a simple, easy-to-use and comprehensive life cycle costing
model which allows users to quantify the relative costs of stormwater managementdevices. The Model consistently allow users to identify and combine acquisition,maintenance and decommissioning costs for each of the stormwater devices in orderto determine a life cycle cost. This approach allows consultants, developers anddecision-makers to assess the relative performance and cost of different stormwatermanagement devices.
The COSTnz Model takes a “unit costing ” approach to life cycle costing in NewZealand. Where sufficient data was available, statistical relationships between thesize of a device and the construction cost has been developed. This is, at present,only available in the Pond Module. A unit costing approach is based on the premisethat there are standard elements or units involved in the construction and
maintenance phases of a device (Ira et al ., 2007). These different elements can becosted by engineers using average tender rates. As a result, the construction and
8/3/2019 New Zealand; Corrective Maintenance Costs for Green Infrastructure
http://slidepdf.com/reader/full/new-zealand-corrective-maintenance-costs-for-green-infrastructure 7/79
COSTnz Model: User Manual (v.1) Chapter 1: Introduction
December 2009 Page 2
maintenance activities for each device have been broken down into discreteelements or units. The total acquisition costing page in the Model mimics that of apayment certificate, whilst the maintenance costing page looks similar to amaintenance contract where the specific activities have been itemised. Wherepracticable, the different modules also allow users to size the stormwater treatmentdevice.
The model takes all the information inputted by the user in order to work out the totallife cycle cost, discounted life cycle cost, as well as proportions of acquisition andmaintenance costs making up the total. A series of pie and bar graphs are used tovisually represent the results and aid reporting.
1.3 Origins of the Data & Algorithms
1.3.1 Unit Cost Data
Unit construction cost and unit maintenance cost protocols were developed to ensure
that any data collected would be comparable and usable in the Model.
The total acquisition cost protocol was developed using payment schedules fromconstructed devices. This initial protocol was given to a consulting engineering firmfor peer review and their comments were included in the final protocol. The finalprotocol was then given to a New Zealand based contracting firm to price. Inaddition, two consulting engineering firms assisted in providing cost data based ontheir experiences. Low, median and high cost estimates were provided which areindicative of the economies of scale related to larger (lower unit cost) or smaller(higher unit cost) projects. Values were checked against the Rawlinsons NewZealand Construction Handbook (Giddens, 2007).
The maintenance cost protocol was developed from the maintenance activities andfrequencies for ponds and rain gardens given in the ARC’s Technical Publication 10,Stormwater Management Devices: Design Guideline (ARC, 2003). The protocoldivided the maintenance activities into two broad types – routine maintenance andcorrective maintenance. Routine maintenance includes activities that occur on amonthly to annual basis (e.g., mowing, inspections after major storms, cleaning out ofdebris, weed management, making good from vandalism). Corrective maintenanceincludes activities such as replacement of parts, cleanout of devices, disposal ofsediments, etc. that are undertaken over a timeframe longer than 1 year and aregenerally dependant on the flows and contaminant loads that are being routedthrough the device.
Local authorities, maintenance contractors and consultants from around NewZealand were approached for maintenance cost data. The majority of cost data wasobtained from the Auckland Region. This is probably because Auckland currentlyhas the most aggressive stormwater management programme. All seven Auckland-based local authorities and Transit New Zealand’s Auckland Office were able tosupply maintenance cost data. Four councils from outside the Auckland region(Tauranga City Council, Wellington City Council [Capacity], Nelson City Council andChristchurch City Council) were also able to provide maintenance cost data.
1.3.2 Statistical Relationships for Total Acquisition Costs
In 2006 cost data was collected from local authorities across New Zealand in order todetermine whether or not a statistical relationship could be developed (Vesely et al.,
8/3/2019 New Zealand; Corrective Maintenance Costs for Green Infrastructure
http://slidepdf.com/reader/full/new-zealand-corrective-maintenance-costs-for-green-infrastructure 8/79
COSTnz Model: User Manual (v.1) Chapter 1: Introduction
December 2009 Page 3
2006). In summary, a statistical relationship between device size and total acquisitioncosts (TAC) could only be generated for ponds and wetlands.
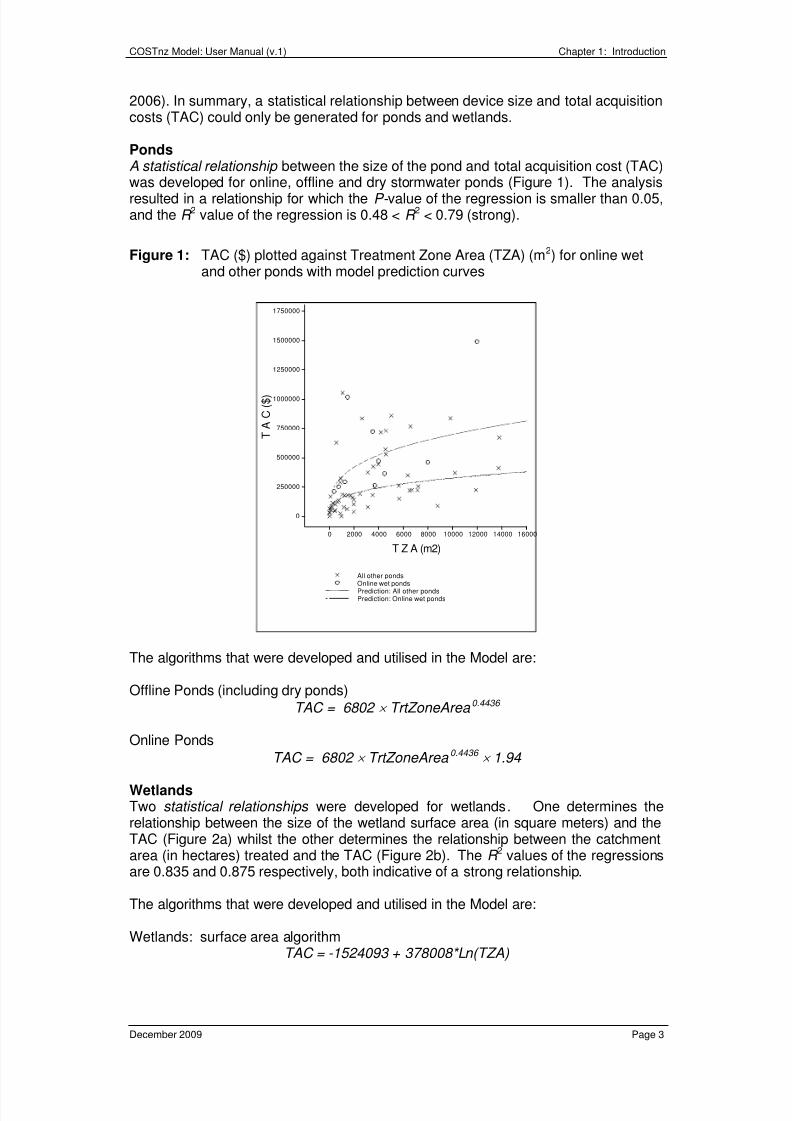
PondsA statistical relationship between the size of the pond and total acquisition cost (TAC)was developed for online, offline and dry stormwater ponds (Figure 1). The analysisresulted in a relationship for which the P- value of the regression is smaller than 0.05,and the R 2 value of the regression is 0.48 < R 2 < 0.79 (strong).
Figure 1: TAC ($) plotted against Treatment Zone Area (TZA) (m2) for online wetand other ponds with model prediction curves
T Z A (m2)
40002000 8000
0
12000
250000
16000
500000
750000
1000000
1250000
1500000
6000
1750000
14000100000
T
A C ( $
)
Prediction: All other ponds
All other ponds
Prediction: Online wet ponds
Online wet ponds
The algorithms that were developed and utilised in the Model are:
Offline Ponds (including dry ponds)TAC = 6802 TrtZoneArea 0.4436
Online Ponds
TAC = 6802
TrtZoneArea
0.4436
1.94
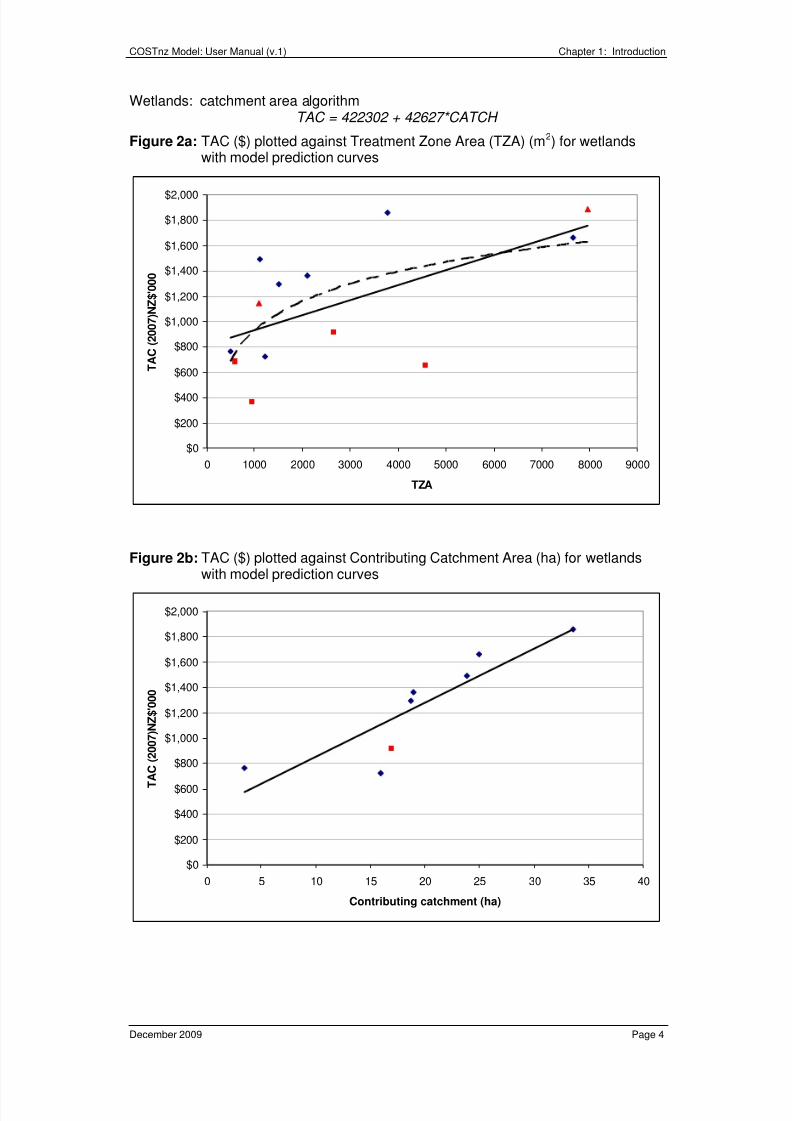
WetlandsTwo statistical relationships were developed for wetlands. One determines therelationship between the size of the wetland surface area (in square meters) and theTAC (Figure 2a) whilst the other determines the relationship between the catchmentarea (in hectares) treated and the TAC (Figure 2b). The R 2 values of the regressionsare 0.835 and 0.875 respectively, both indicative of a strong relationship.
The algorithms that were developed and utilised in the Model are:
Wetlands: surface area algorithm
TAC = -1524093 + 378008*Ln(TZA)
8/3/2019 New Zealand; Corrective Maintenance Costs for Green Infrastructure
http://slidepdf.com/reader/full/new-zealand-corrective-maintenance-costs-for-green-infrastructure 9/79
COSTnz Model: User Manual (v.1) Chapter 1: Introduction
December 2009 Page 4
Wetlands: catchment area algorithmTAC = 422302 + 42627*CATCH
Figure 2a: TAC ($) plotted against Treatment Zone Area (TZA) (m2) for wetlandswith model prediction curves
Figure 2b: TAC ($) plotted against Contributing Catchment Area (ha) for wetlands
with model prediction curves
$0
$200
$400
$600
$800
$1,000
$1,200
$1,400
$1,600
$1,800
$2,000
0 1000 2000 3000 4000 5000 6000 7000 8000 9000
TZA
T A C
( 2 0 0 7 ) N Z $ ' 0 0 0
$0
$200
$400
$600
$800
$1,000
$1,200
$1,400
$1,600
$1,800
$2,000
0 5 10 15 20 25 30 35 40
Contributing catchment (ha)
T A C
( 2 0 0 7 ) N Z $ ' 0 0 0
8/3/2019 New Zealand; Corrective Maintenance Costs for Green Infrastructure
http://slidepdf.com/reader/full/new-zealand-corrective-maintenance-costs-for-green-infrastructure 10/79
COSTnz Model: User Manual (v.1) Chapter 1: Introduction
December 2009 Page 5
Other PracticesDue to a lack of data, no statistical relationships could be developed for sand filters,rain gardens, swales, filter strips, infiltration trenches, rain tanks or the genericmodel.
1.3.3 Cleanout Frequencies
In order to accurately cost maintenance of any device, the cleanout frequency andthe amount of material to be disposed needs to be calculated.
Clean out frequency of a pond forebay or rain garden is a function of the sedimentload entering the pond and the volume available within the device to allow fordeposition. In order to work out how often a maintenance contractor needs to cleanout the pond, users need to be able to work out the incoming sediment load. Atpresent, users will need to use the Auckland Regional Council (ARC) “ContaminantLoad Model” to ascertain the sediment load generated by the contributing catchmentarea. The Contaminant Load Model can be downloaded from the ARC’s website at:
http://www.arc.govt.nz/environment/water/stormwater/contaminants-in-auckland-stormwater.cfm
The Model assumes that a device needs to be cleaned out once 50% of the livestorage volume has been taken up by sediment. This figure is based on therecommended percentage at which pond cleanout needs to occur (ARC, 2003). Theamount of sediment captured is dependant on the design efficiency of the device.The Model uses a density of sediment of 1.4 g/m3. After the major earth movingstage the density of deposited material is around 1.4 g/m3 to 1.6 g/m3 once thedeposited material has settled. However, deposited density increases over time,therefore the model needs to assume a density at the lower end of the range so thatmaintenance estimations are conservative. The decision to use 1.4 g/m3 density ofdeposited sediment (by the time maintenance is required) is therefore consideredreasonable (pers comm. Timperley and Green, 2007).
1.4 Limitations of the Model and Caveats Given that the Model is the first of its kind in New Zealand, and that very little realstormwater management cost data is available, the estimation of costs associatedwith stormwater management devices is currently surrounded by high levels ofuncertainty. This can be seen by looking at the wide range of high and low defaultvalues for some activities given in the Model. The statistical relationships providedand unit cost values given represent the best available algorithms and values at the
time when the costing data was collected (2007). For some devices, available datawas very limited.
To ensure that the statistical relationships for total acquisition costs are fullyunderstood, Section 1.3.2 provides details of the strength of the relationship (R2 – variance) and the significance (p value). The prediction model curves and sampleset is also presented (Figures 1 - 3).
Unit costs are based on average tender rates as at 2007. The inflation rate used inthe model is taken from the Statistics New Zealand website(http://www.stats.govt.nz). The inflation rate is calculated from the Producer Index for“Other Construction Activities”.

8/3/2019 New Zealand; Corrective Maintenance Costs for Green Infrastructure
http://slidepdf.com/reader/full/new-zealand-corrective-maintenance-costs-for-green-infrastructure 11/79
COSTnz Model: User Manual (v.1) Chapter 1: Introduction
December 2009 Page 6
Unit total acquisition cost data was collected from a New Zealand based contractor.Construction elements costed relate to the actual stormwater device and do notaccount for piped connections to the stormwater network. Set up costs (i.e.preliminary and general) and earthworking costs are included. With respect toinfrastructure, the construction costs provided in the template relate to the point ofentry to the device (i.e. the inlet pipe, wingwall or associated inlet structure) to thepoint of exit (i.e. the pipe outlet; associated outlet structure and erosion protection).Landscaping costs are also included.
Land costs are not included as part of the life cycle costing analysis, however, a boxis provided where land costs can be entered and reported in the results page of theModel.
Unit maintenance cost data was collected from local authority stormwatermaintenance contracts. The wide range of default values given in the Model formaintenance costs is indicative of the uncertainty surrounding local governmentcommunities on the need for and/ or cost of stormwater device maintenance.
Maintenance frequencies are based on theoretical best practice maintenancerequirements (ARC, 2003). Cleanout (i.e. desilting and disposal of sediment) ofdevices is linked to the total suspended solids (TSS) load generated within thecontributing catchment area. The Model is unable to calculate the frequency forreplacing filter medias as a result of saturation from chemical contaminants such aszinc or copper.
It is considered that the Model will be most useful for undertaking a relativecomparison of costs of different types of devices. In addition, the Model will aid localauthorities to gain an understanding of the required maintenance activities and theirassociated costs. This will assist in budgeting of maintenance in annual plans andlong term council community plans. However, the uncertainty of costs should be kept
in mind when undertaking and reporting on the COSTNZ Model results.
The data collection undertaken for and development of the COSTnz Model hashighlighted that either New Zealand government organizations are unsure of theactivities and costs involved with stormwater management, or they do not have goodprotocols in place to record cost data. As a result, Landcare Research is working onbuilding a web-based protocol for the collection of cost data. This data will thencontribute to updating the default values given in the updated versions of theCOSTnz Model.
Whilst every effort has been made to ensure the integrity of the data and COSTnzModel, the developers of the COSTnz Model do not give any warranty as to the
accuracy, completeness, currency or reliability of the information made available viathe Model and expressly disclaims (to the maximum extent permitted by law) allliability for any damage or loss resulting from your use of, or reliance on the Model orthe information or graphs provided through them.
8/3/2019 New Zealand; Corrective Maintenance Costs for Green Infrastructure
http://slidepdf.com/reader/full/new-zealand-corrective-maintenance-costs-for-green-infrastructure 12/79
COSTnz Model: User Manual (v.1) Chapter 3: Stormwater Ponds
December 2009 Page 7
2. LIFE CYCLE COSTING
2.1 What is Life Cycle Costing?
A life cycle costing (LCC) approach has been previously used to assess costsassociated with stormwater devices in Australia, the United States of America (USA)and the United Kingdom (UK) (Vesely et al., 2006). The Australian/New ZealandStandard 4536:1999 defines LCC as:
“the process of assessing the cost of a product over its life cycle or portion thereof.”
The life cycle cost is the sum of the acquisition and ownership costs of an asset overits life cycle from design, manufacturing, usage, and maintenance through todisposal. The consideration of revenues is excluded from LCC. A cradle-to-grave
time frame is warranted because future costs associated with the use and ownershipof an asset are often greater than the initial acquisition cost and may varysignificantly between alternative solutions to a given operational need (AustralianNational Audit Office, 2001).
LCC has a number of benefits and supports a number of applications and analyses(Lampe et al 2005):
it allows for an improved understanding of long-term investmentrequirements;
it helps decision-makers make more cost-effective choices at the projectscoping phase;
it provides for an explicit assessment of long-term risk;
it reduces uncertainties and helps local authorities determine appropriatedevelopment contributions; and
it assists local authorities in their budgeting, reporting and auditing processes.
Decision making on the use of low-impact stormwater devices needs quality data onthe technical and financial performance of these devices. The financial performancewill depend on the sum and distribution over the life cycle of the device of theacquisition and maintenance costs including design, construction, use, maintenance,and disposal. Life cycle costing can be used for structuring and analysing thisfinancial information. Results emanating from a life cycle cost analysis can then beutilized by developers or councils in an evaluation process that incorporates financial,social and environmental assessment criteria (Taylor, 2005).
As mentioned previously, the COSTnz Model takes a unit costing approach to LCC.Where sufficient data has been collected (i.e. for ponds), the modules have statisticalrelationships for Total Acquisition Costs. In any event, the type of life cycle costinginformation that needs to be entered into the model is the same for all the modulesand is described below.
2.2 Life Cycle Costing Parameters The COSTnz Model uses real costs, and all default cost options given in the modelhave a base year of 2007. A value in real cost terms is the dollar amount to be paid
if the reason for the cost occurred and had to be paid at the base date. Real costsallow current known cost information to be used in the analysis process. Forecast

8/3/2019 New Zealand; Corrective Maintenance Costs for Green Infrastructure
http://slidepdf.com/reader/full/new-zealand-corrective-maintenance-costs-for-green-infrastructure 13/79
COSTnz Model: User Manual (v.1) Chapter 3: Stormwater Ponds
December 2009 Page 8
changes that are more or less than general price inflation should be incorporated intoreal cost estimates. The default inflation rate used in the model to ensure all costdata has a base date of 2007 is 4.8%. This relates to the Producer Index given byStatistics New Zealand (http://www.stats.govt.nz) and is determined by looking at thelast 7 years of “Other Construction Activity” rates. While all the default model valueshave a base date of 2007, a calculator is provided that allows users to inflate ordeflate their own costing data from a different year. The model enables users tochange select a rate and it is recommended that users make use of the inflationindices provided by Statistics New Zealand.
Discounting is used to find the value at the base year of future costs associated witha stormwater device. The Model uses real discount rates - adjusted to eliminate theeffects of expected inflation - to discount the real costs. Users can either select oneof the default rates (3% or 6%) or input their own. Due to the potentially significantimpact of the discount rate on the estimated life cycle cost (e.g., a cost that isaccrued 10 years from the base year is reduced by 29% if the discount rate is 3.5%per annum but by 61% if the rate is 10%), sensitivity analysis is recommended using
different discount rates. Based on feed-back from users, we are expecting to updatethe range of discount rates indicated in the Model.
Two other key parameters of the LCC analysis are the life span (LS) of the deviceand the life cycle analysis period (LCAP). The LCAP is the period of time (in years)over which the model will analyse the costs, while the life span is the actual period oftime in years over which the device itself will function. The LCAP function isavailable for the Rain Tank and Generic COSTnz modules as these types of deviceshave defined ‘lives’. For the vegetated types of practices, the LS equates to theLCAP. The LS will differ depending on the type of device, and a range of options hasbeen provided in the model.
All unit costs given are excluding GST.
8/3/2019 New Zealand; Corrective Maintenance Costs for Green Infrastructure
http://slidepdf.com/reader/full/new-zealand-corrective-maintenance-costs-for-green-infrastructure 14/79
COSTnz Model: User Manual (v.1) Chapter 3: Stormwater Ponds
December 2009 Page 9
3. STORMWATER PONDS
3.1 Introduction Wet detention ponds are defined as (ARC, 2003):
“Permanent ponds that have a normal pool of water. These ponds can either be used for water quality control only or in conjunction with extended detention and peak flow control to provide stream channel and flood protection.”
On the other hand, dry detention ponds are:…
“….permanent ponds that temporarily store runoff to control the peak rate of discharges and provide some water quality treatment. These ponds are normally dry between storm events.”
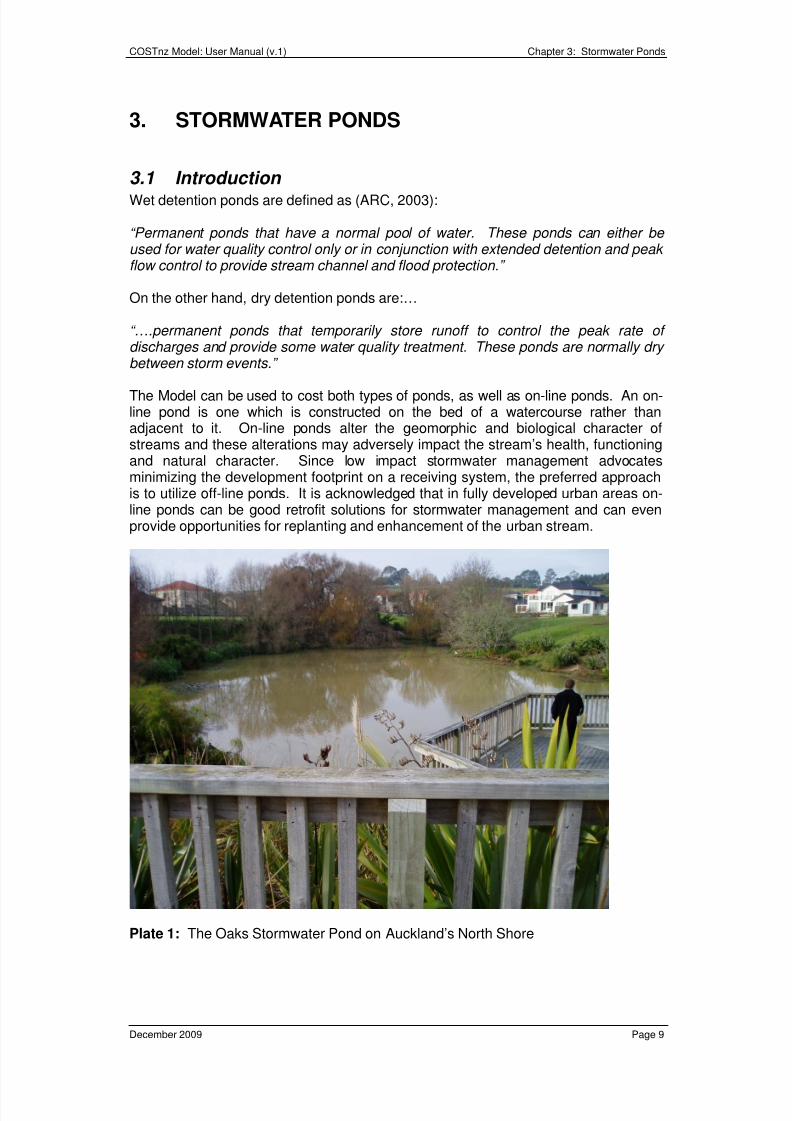
The Model can be used to cost both types of ponds, as well as on-line ponds. An on-line pond is one which is constructed on the bed of a watercourse rather thanadjacent to it. On-line ponds alter the geomorphic and biological character ofstreams and these alterations may adversely impact the stream’s health, functioningand natural character. Since low impact stormwater management advocatesminimizing the development footprint on a receiving system, the preferred approachis to utilize off-line ponds. It is acknowledged that in fully developed urban areas on-line ponds can be good retrofit solutions for stormwater management and can evenprovide opportunities for replanting and enhancement of the urban stream.
Plate 1: The Oaks Stormwater Pond on Auckland’s North Shore
8/3/2019 New Zealand; Corrective Maintenance Costs for Green Infrastructure
http://slidepdf.com/reader/full/new-zealand-corrective-maintenance-costs-for-green-infrastructure 15/79
COSTnz Model: User Manual (v.1) Chapter 3: Stormwater Ponds
December 2009 Page 10
3.2 Pond Design and Costing Assumptions Users will need to use a stormwater design package to design and size theirstormwater pond. In addition, users will need to use a contaminant model toascertain the annual sediment load to be treated by the pond.
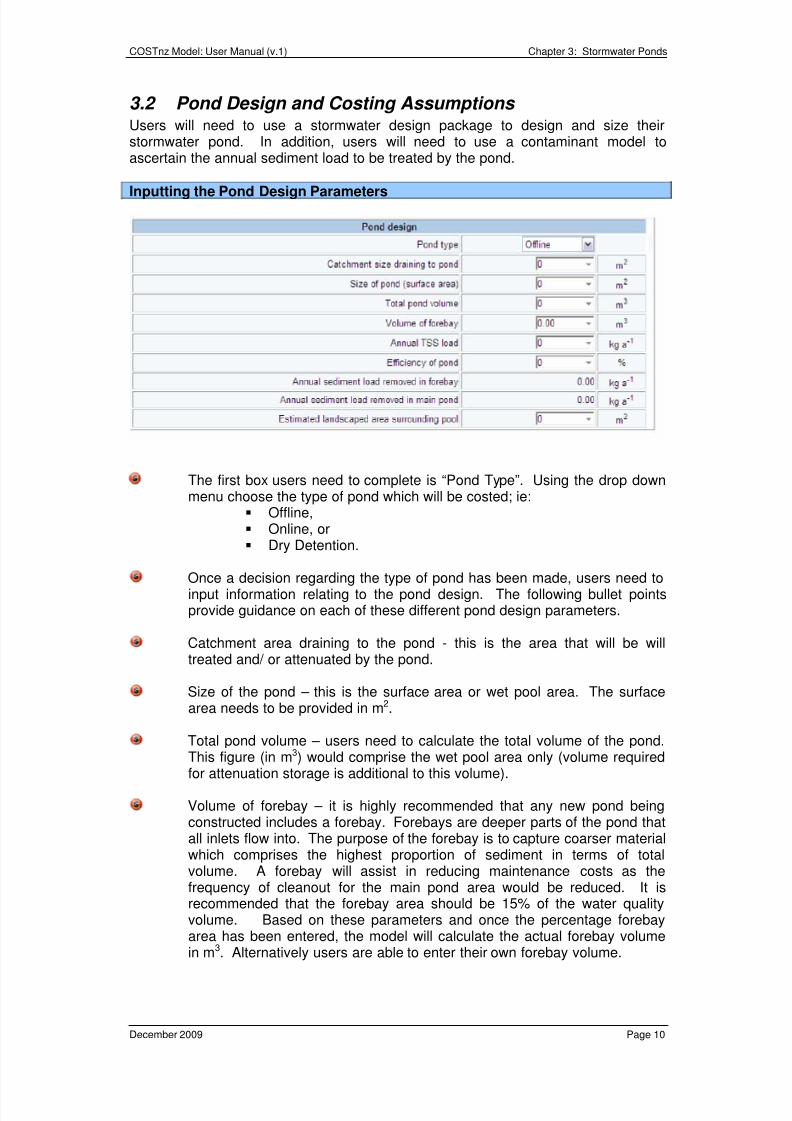
Inputting the Pond Design Parameters
The first box users need to complete is “Pond Type”. Using the drop downmenu choose the type of pond which will be costed; ie:
Offline, Online, or Dry Detention.
Once a decision regarding the type of pond has been made, users need toinput information relating to the pond design. The following bullet pointsprovide guidance on each of these different pond design parameters.
Catchment area draining to the pond - this is the area that will be willtreated and/ or attenuated by the pond.
Size of the pond – this is the surface area or wet pool area. The surfacearea needs to be provided in m2.
Total pond volume – users need to calculate the total volume of the pond.This figure (in m3) would comprise the wet pool area only (volume requiredfor attenuation storage is additional to this volume).
Volume of forebay – it is highly recommended that any new pond beingconstructed includes a forebay. Forebays are deeper parts of the pond thatall inlets flow into. The purpose of the forebay is to capture coarser materialwhich comprises the highest proportion of sediment in terms of totalvolume. A forebay will assist in reducing maintenance costs as thefrequency of cleanout for the main pond area would be reduced. It isrecommended that the forebay area should be 15% of the water qualityvolume. Based on these parameters and once the percentage forebayarea has been entered, the model will calculate the actual forebay volume
in m3
. Alternatively users are able to enter their own forebay volume.
8/3/2019 New Zealand; Corrective Maintenance Costs for Green Infrastructure
http://slidepdf.com/reader/full/new-zealand-corrective-maintenance-costs-for-green-infrastructure 16/79
COSTnz Model: User Manual (v.1) Chapter 3: Stormwater Ponds
December 2009 Page 11
Annual TSS load - in order to calculate the theoretical cleanout frequencyfor a pond, the model needs to know how much sediment is coming off thepond catchment area. Users will need to use a contaminant load model todetermine the annual total suspended solids (TSS) load. Users can use theARC “Contaminant Load Model ” to work out the sediment load generatedby contributing catchment area. This model can be downloaded from theARC’s website at:http://www.arc.govt.nz/environment/water/stormwater/contaminants-in-auckland-stormwater.cfm
Alternatively, users can use the C-CALM model developed by NIWA towork out contaminant loads.
Efficiency of Pond – this is the design efficiency of the pond and should beexpressed as a percentage of total suspended solids removed.
Annual loads removed – once the annual TSS load and pond design
parameters have been entered the model will calculate the annual TSS loadremoved in the forebay and in the main pond.
Estimated landscaped area surrounding the pond – this is the finalparameter which needs to be entered relating to pond design. Users needto estimate the area (in m2) surrounding the pond which will be grassed,landscaped or used for access. This figure is important as it will determinethe amount of general routine maintenance for the pond site.
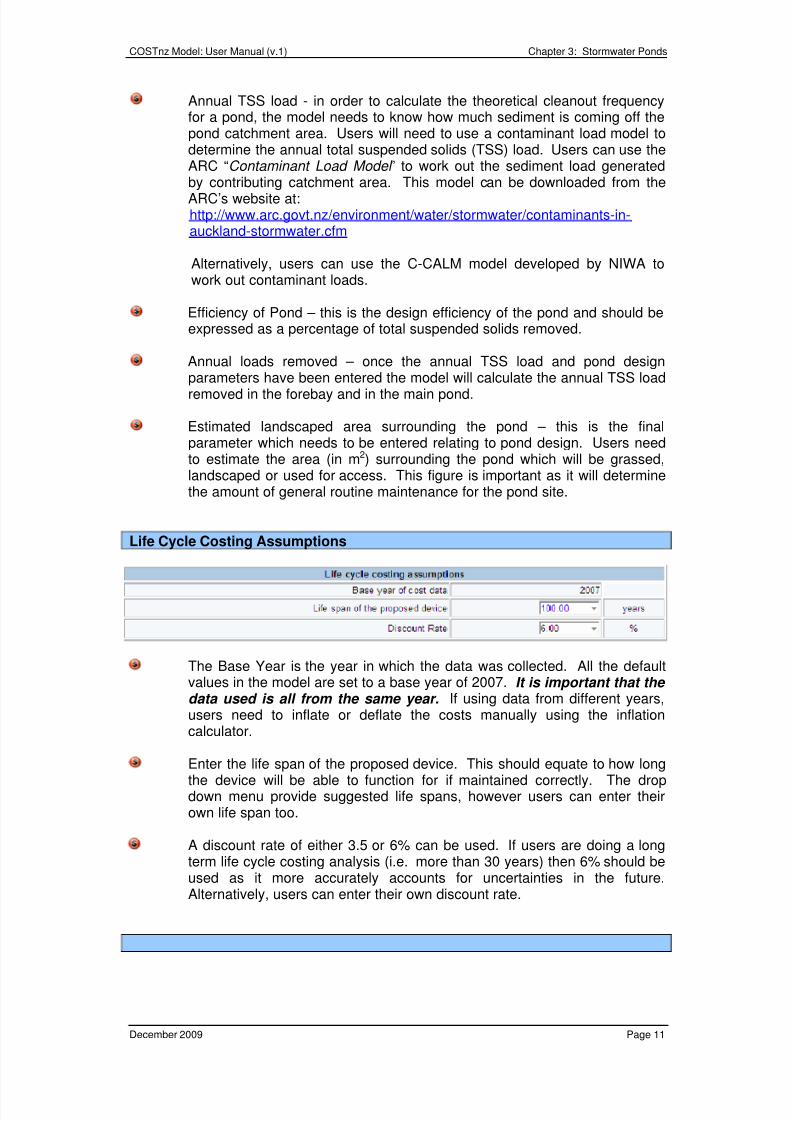
Life Cycle Costing Assumptions
The Base Year is the year in which the data was collected. All the defaultvalues in the model are set to a base year of 2007. It is important that the data used is all from the same year. If using data from different years,users need to inflate or deflate the costs manually using the inflationcalculator.
Enter the life span of the proposed device. This should equate to how longthe device will be able to function for if maintained correctly. The dropdown menu provide suggested life spans, however users can enter theirown life span too.
A discount rate of either 3.5 or 6% can be used. If users are doing a longterm life cycle costing analysis (i.e. more than 30 years) then 6% should beused as it more accurately accounts for uncertainties in the future.Alternatively, users can enter their own discount rate.
8/3/2019 New Zealand; Corrective Maintenance Costs for Green Infrastructure
http://slidepdf.com/reader/full/new-zealand-corrective-maintenance-costs-for-green-infrastructure 17/79
COSTnz Model: User Manual (v.1) Chapter 3: Stormwater Ponds
December 2009 Page 12
3.3 Total Acquisition Costs (Design & Construction Costs)
The Model presents two different options for calculating the Total Acquisition Cost ofa stormwater pond.
The first option utilises the statistical relationship which relates pond size to cost.The statistical relationships are based on the type of pond which is beingconstructed, i.e. whether the pond is on-line or off-line. The menu provides aselection of low, mean or high cost values for the type of pond that was selected.
The second option available to users is to input their own unit cost data. In order tocomplete the TAC: Unit Cost section of the model the user will need to haveundertaken detailed design of the pond. This is because the unit costing works onthe premise that individual elements of the construction phase can be costedseparately. As a result, each type of construction element is broken down in themodel and needs to be completed. The drop down menus for these elementsprovides a selection of low and high cost values. Users can also input their own data
into this template if they already know the cost of the pond.
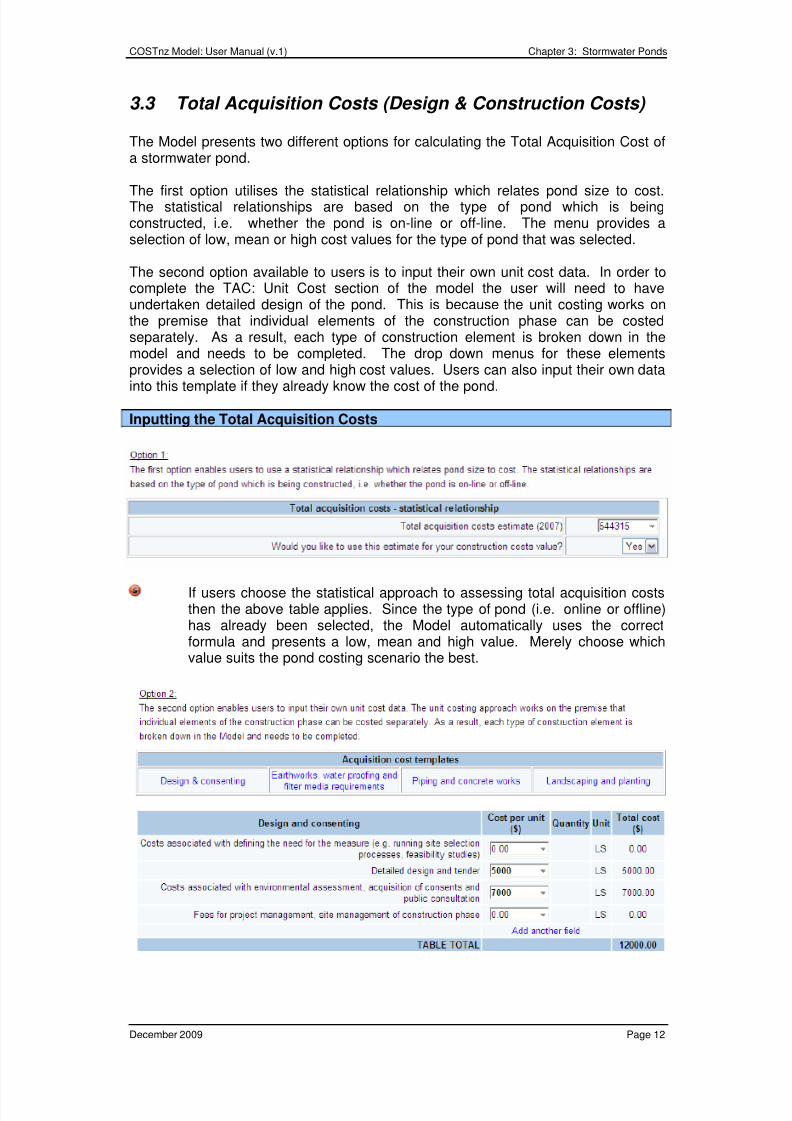
Inputting the Total Acquisition Costs
If users choose the statistical approach to assessing total acquisition coststhen the above table applies. Since the type of pond (i.e. online or offline)has already been selected, the Model automatically uses the correctformula and presents a low, mean and high value. Merely choose whichvalue suits the pond costing scenario the best.
8/3/2019 New Zealand; Corrective Maintenance Costs for Green Infrastructure
http://slidepdf.com/reader/full/new-zealand-corrective-maintenance-costs-for-green-infrastructure 18/79
COSTnz Model: User Manual (v.1) Chapter 3: Stormwater Ponds
December 2009 Page 13
If users have undertaken detailed design and have a good knowledge of theconstruction elements involved in the pond construction then the unitcosting template can be used.
The above summary table shows the different categories which need to bepriced. In order to enter costs click on the “Design and Consenting ”template. This will bring up a table which allows users to enter all costsassociated with the conceptual and detailed design of the pond, consentingcosts and project management costs associated with the constructionphase. No model default values are provided for this template.
Once users have completed this table, click the “Earthworks & geotechnical Requirements ” template. Users can now enter costs associated with siteestablishment, earthworks and geotechnical requirements for pondconstruction. High, mean and low model default values are provided. Itshould be noted that the template covers a wide variety of constructionitems, so not every field needs to be completed. Only items relevant to the
specific pond to be modeled should be completed.
Repeat the above step in order to complete the remaining constructiontemplates (i.e. piping and concrete works; structures; landscaping andplanting).
There may well be items which need to be costed and haven’t beenspecified in the unit costing template. As a result users can create anotherrow and enter their own construction cost information in this section. Units,as well as the unit cost information, need to be entered in this table.
Remember: if using the unit cost template use rates or cost data from the
same year. If the rates are prior to 2007, then inflate the rates to a 2007value. If using rates post-2007, deflate the rates to a 2007 value (see theInflation/ Deflation calculator Tip Box). This also enables users to comparethe unit cost results with the statistical relationship results. Users can use adifferent base year if need be, but then they must ensure that themaintenance cost data is for the same base year.
TIP BOX
THE INFLATION CALCULATOR
You can use the inflation calculator provided to deflate orinflate your own cost to the base date of the model, 2007.To do this:
1. put in your desired inflation rate2. put in your unit cost3. put in the year of your cost (e.g. 2001 or 2010)4. click on inflate or deflate to obtain the base date
cost.
INFLATE costs prior to 2007
DEFLATE costs post 2007
8/3/2019 New Zealand; Corrective Maintenance Costs for Green Infrastructure
http://slidepdf.com/reader/full/new-zealand-corrective-maintenance-costs-for-green-infrastructure 19/79
COSTnz Model: User Manual (v.1) Chapter 3: Stormwater Ponds
December 2009 Page 14
3.4 Maintenance and Decommissioning Costs The maintenance costs in the COSTnz Model have been divided into routine and
corrective maintenance activities.
Routine maintenance is defined as including those types of activities which occur ona monthly to annual basis (e.g. mowing, inspections after major storms, cleaning outof debris, weed management, making good from vandalism). Correctivemaintenance includes activities such as replacement of parts, cleanout of devices,disposal of sediments. These activities are generally undertaken on a longertimeframe and are dependant on the flows and contaminant loads that are beingrouted through the device. The default maintenance activities and frequencies in themodel are based on TP10 (ARC, 2003) and data collected during the COSTnzproject. The Model allows for elevated routine maintenance costs for the first 5 yearsafter construction. The unit maintenance cost default values given in the Pond
Module are ‘high’, ‘mean’ and ‘low’.
Inputting the Maintenance Costs
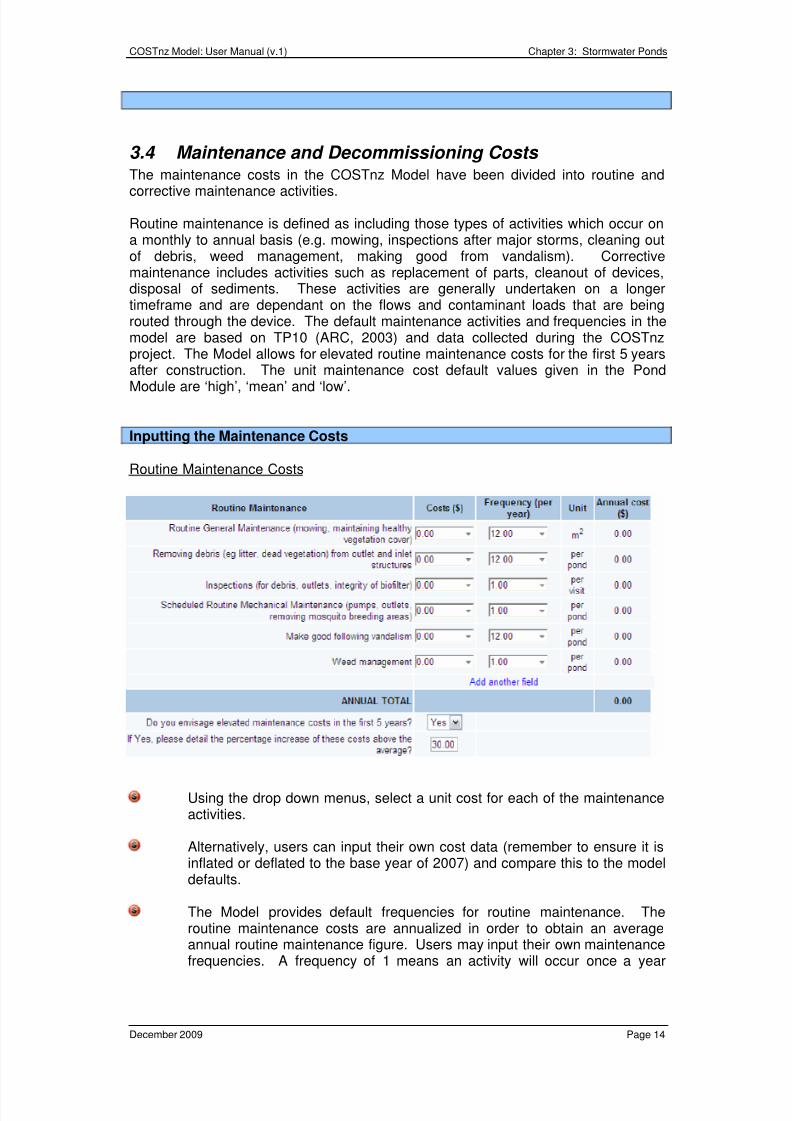
Routine Maintenance Costs
Using the drop down menus, select a unit cost for each of the maintenanceactivities.
Alternatively, users can input their own cost data (remember to ensure it isinflated or deflated to the base year of 2007) and compare this to the modeldefaults.
The Model provides default frequencies for routine maintenance. Theroutine maintenance costs are annualized in order to obtain an averageannual routine maintenance figure. Users may input their own maintenance
frequencies. A frequency of 1 means an activity will occur once a year
8/3/2019 New Zealand; Corrective Maintenance Costs for Green Infrastructure
http://slidepdf.com/reader/full/new-zealand-corrective-maintenance-costs-for-green-infrastructure 20/79
COSTnz Model: User Manual (v.1) Chapter 3: Stormwater Ponds
December 2009 Page 15
whilst a frequency of 12 means that the activity will occur monthly (or twelvetimes a year).
The Model enables users to estimate elevated maintenance costs in thefirst few years after construction. Users need to complete this question witha yes or no answer and then estimate the percentage increase in theaverage cost.
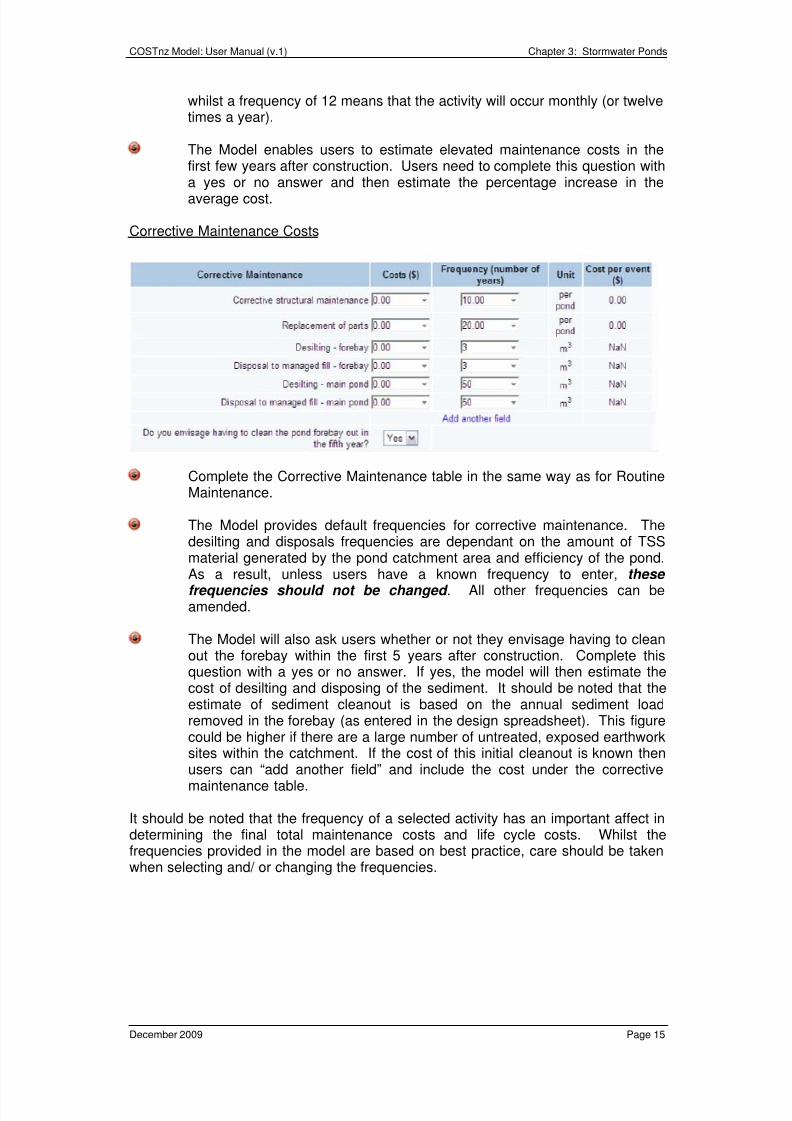
Corrective Maintenance Costs
Complete the Corrective Maintenance table in the same way as for RoutineMaintenance.
The Model provides default frequencies for corrective maintenance. Thedesilting and disposals frequencies are dependant on the amount of TSSmaterial generated by the pond catchment area and efficiency of the pond.
As a result, unless users have a known frequency to enter, these frequencies should not be changed . All other frequencies can beamended.
The Model will also ask users whether or not they envisage having to cleanout the forebay within the first 5 years after construction. Complete thisquestion with a yes or no answer. If yes, the model will then estimate thecost of desilting and disposing of the sediment. It should be noted that theestimate of sediment cleanout is based on the annual sediment loadremoved in the forebay (as entered in the design spreadsheet). This figurecould be higher if there are a large number of untreated, exposed earthworksites within the catchment. If the cost of this initial cleanout is known then
users can “add another field” and include the cost under the correctivemaintenance table.
It should be noted that the frequency of a selected activity has an important affect indetermining the final total maintenance costs and life cycle costs. Whilst thefrequencies provided in the model are based on best practice, care should be takenwhen selecting and/ or changing the frequencies.
8/3/2019 New Zealand; Corrective Maintenance Costs for Green Infrastructure
http://slidepdf.com/reader/full/new-zealand-corrective-maintenance-costs-for-green-infrastructure 21/79
COSTnz Model: User Manual (v.1) Chapter 3: Stormwater Ponds
December 2009 Page 16
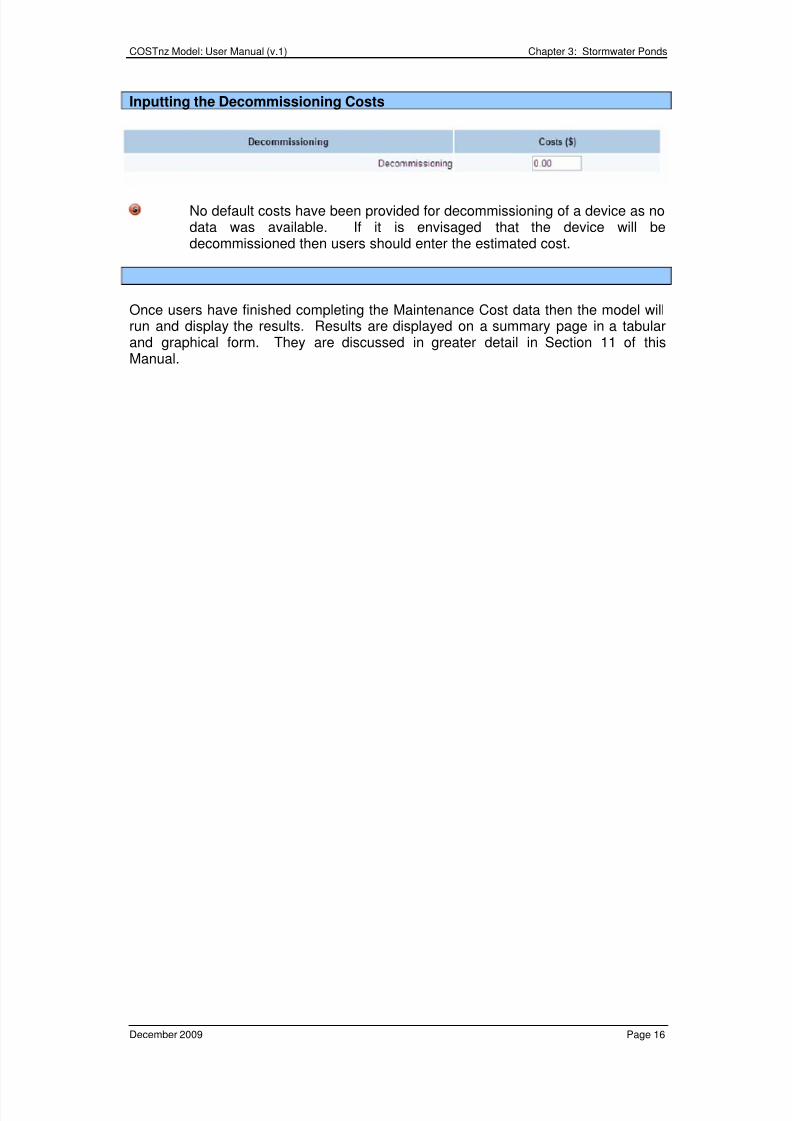
Inputting the Decommissioning Costs
No default costs have been provided for decommissioning of a device as nodata was available. If it is envisaged that the device will bedecommissioned then users should enter the estimated cost.
Once users have finished completing the Maintenance Cost data then the model willrun and display the results. Results are displayed on a summary page in a tabularand graphical form. They are discussed in greater detail in Section 11 of thisManual.
8/3/2019 New Zealand; Corrective Maintenance Costs for Green Infrastructure
http://slidepdf.com/reader/full/new-zealand-corrective-maintenance-costs-for-green-infrastructure 22/79
COSTnz Model: User Manual (v.1) Chapter 4: Wetlands
December 2009 Page 17
4. WETLANDS
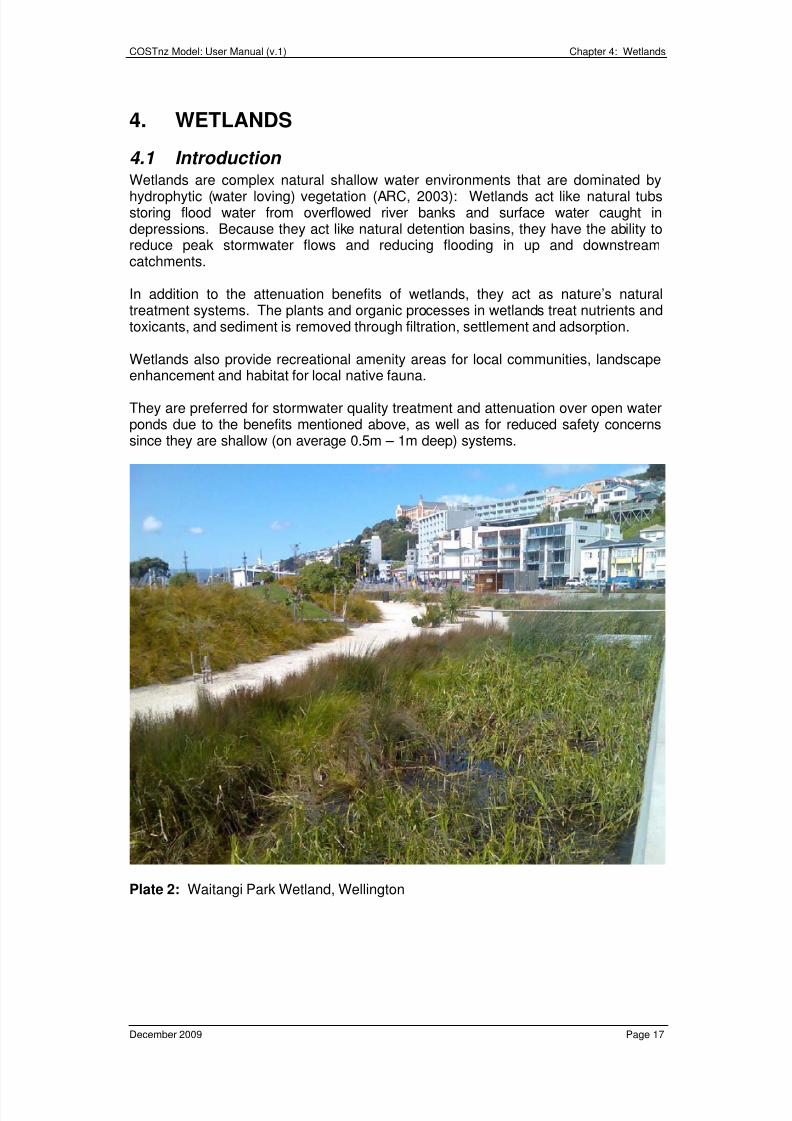
4.1 Introduction Wetlands are complex natural shallow water environments that are dominated byhydrophytic (water loving) vegetation (ARC, 2003): Wetlands act like natural tubsstoring flood water from overflowed river banks and surface water caught indepressions. Because they act like natural detention basins, they have the ability toreduce peak stormwater flows and reducing flooding in up and downstreamcatchments.
In addition to the attenuation benefits of wetlands, they act as nature’s naturaltreatment systems. The plants and organic processes in wetlands treat nutrients andtoxicants, and sediment is removed through filtration, settlement and adsorption.
Wetlands also provide recreational amenity areas for local communities, landscape
enhancement and habitat for local native fauna.
They are preferred for stormwater quality treatment and attenuation over open waterponds due to the benefits mentioned above, as well as for reduced safety concernssince they are shallow (on average 0.5m – 1m deep) systems.
Plate 2: Waitangi Park Wetland, Wellington
8/3/2019 New Zealand; Corrective Maintenance Costs for Green Infrastructure
http://slidepdf.com/reader/full/new-zealand-corrective-maintenance-costs-for-green-infrastructure 23/79
COSTnz Model: User Manual (v.1) Chapter 4: Wetlands
December 2009 Page 18
4.2 Wetland Design and Costing Assumptions Users will need to use a stormwater design package to design and size theirstormwater wetland. In addition, users will need to use a contaminant model toascertain the annual sediment load to be treated by the wetland.
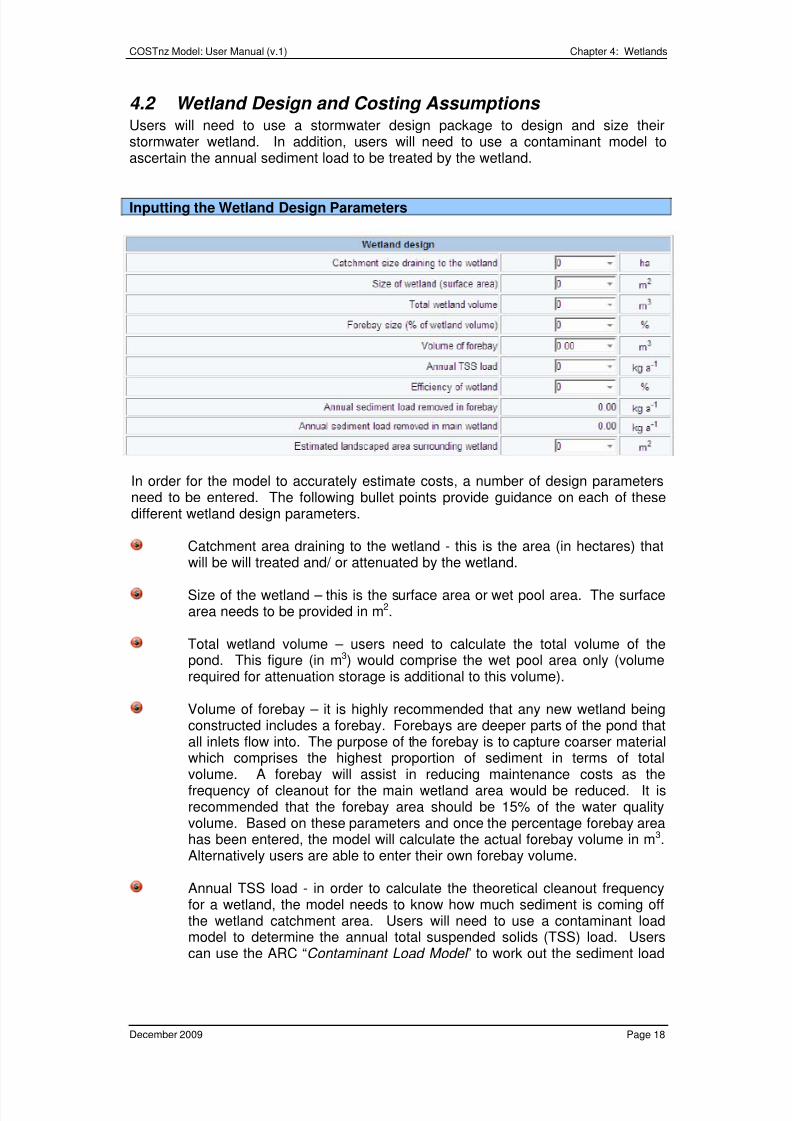
Inputting the Wetland Design Parameters
In order for the model to accurately estimate costs, a number of design parametersneed to be entered. The following bullet points provide guidance on each of thesedifferent wetland design parameters.
Catchment area draining to the wetland - this is the area (in hectares) thatwill be will treated and/ or attenuated by the wetland.
Size of the wetland – this is the surface area or wet pool area. The surfacearea needs to be provided in m2.
Total wetland volume – users need to calculate the total volume of thepond. This figure (in m3) would comprise the wet pool area only (volumerequired for attenuation storage is additional to this volume).
Volume of forebay – it is highly recommended that any new wetland beingconstructed includes a forebay. Forebays are deeper parts of the pond thatall inlets flow into. The purpose of the forebay is to capture coarser material
which comprises the highest proportion of sediment in terms of totalvolume. A forebay will assist in reducing maintenance costs as thefrequency of cleanout for the main wetland area would be reduced. It isrecommended that the forebay area should be 15% of the water qualityvolume. Based on these parameters and once the percentage forebay areahas been entered, the model will calculate the actual forebay volume in m 3.Alternatively users are able to enter their own forebay volume.
Annual TSS load - in order to calculate the theoretical cleanout frequencyfor a wetland, the model needs to know how much sediment is coming offthe wetland catchment area. Users will need to use a contaminant loadmodel to determine the annual total suspended solids (TSS) load. Users
can use the ARC “Contaminant Load Model ” to work out the sediment load
8/3/2019 New Zealand; Corrective Maintenance Costs for Green Infrastructure
http://slidepdf.com/reader/full/new-zealand-corrective-maintenance-costs-for-green-infrastructure 24/79
COSTnz Model: User Manual (v.1) Chapter 4: Wetlands
December 2009 Page 19
generated by contributing catchment area. This model can be downloadedfrom the ARC’s website at:http://www.arc.govt.nz/environment/water/stormwater/contaminants-in-auckland-stormwater.cfm
Alternatively, users can use the C-CALM model developed by NIWA towork out contaminant loads.
Efficiency of wetland – this is the design efficiency of the wetland andshould be expressed as a percentage of total suspended solids removed.
Annual loads removed – once the annual TSS load and wetland designparameters have been entered the model will calculate the annual TSS loadremoved in the forebay and in the main body of the wetland.
Estimated landscaped area surrounding the wetland – this is the finalparameter which needs to be entered relating to wetland design. Users
need to estimate the area (in m
2
) surrounding the wetland which will begrassed, landscaped or used for access. This figure is important as it willdetermine the amount of general routine maintenance for the wetland site.
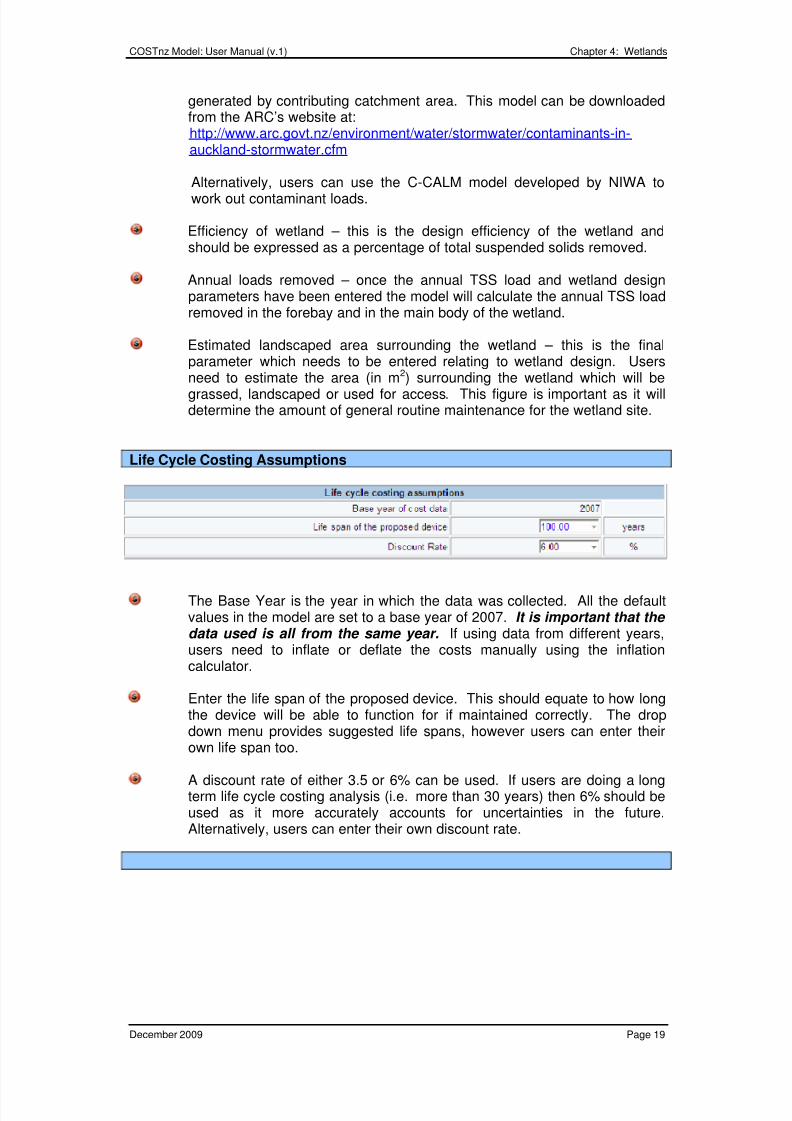
Life Cycle Costing Assumptions
The Base Year is the year in which the data was collected. All the defaultvalues in the model are set to a base year of 2007. It is important that the data used is all from the same year. If using data from different years,users need to inflate or deflate the costs manually using the inflationcalculator.
Enter the life span of the proposed device. This should equate to how longthe device will be able to function for if maintained correctly. The dropdown menu provides suggested life spans, however users can enter theirown life span too.
A discount rate of either 3.5 or 6% can be used. If users are doing a longterm life cycle costing analysis (i.e. more than 30 years) then 6% should beused as it more accurately accounts for uncertainties in the future.Alternatively, users can enter their own discount rate.
8/3/2019 New Zealand; Corrective Maintenance Costs for Green Infrastructure
http://slidepdf.com/reader/full/new-zealand-corrective-maintenance-costs-for-green-infrastructure 25/79
COSTnz Model: User Manual (v.1) Chapter 4: Wetlands
December 2009 Page 20
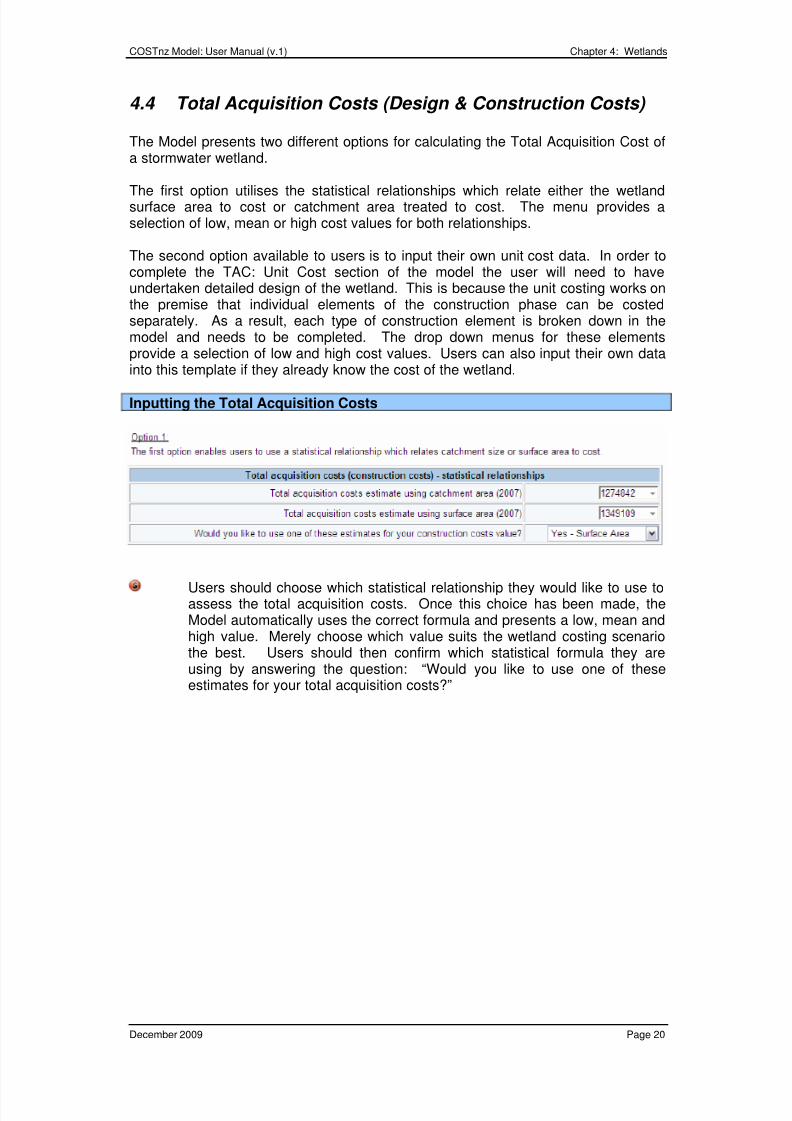
4.4 Total Acquisition Costs (Design & Construction Costs)
The Model presents two different options for calculating the Total Acquisition Cost ofa stormwater wetland.
The first option utilises the statistical relationships which relate either the wetlandsurface area to cost or catchment area treated to cost. The menu provides aselection of low, mean or high cost values for both relationships.
The second option available to users is to input their own unit cost data. In order tocomplete the TAC: Unit Cost section of the model the user will need to haveundertaken detailed design of the wetland. This is because the unit costing works onthe premise that individual elements of the construction phase can be costedseparately. As a result, each type of construction element is broken down in themodel and needs to be completed. The drop down menus for these elementsprovide a selection of low and high cost values. Users can also input their own datainto this template if they already know the cost of the wetland.
Inputting the Total Acquisition Costs
Users should choose which statistical relationship they would like to use toassess the total acquisition costs. Once this choice has been made, theModel automatically uses the correct formula and presents a low, mean andhigh value. Merely choose which value suits the wetland costing scenariothe best. Users should then confirm which statistical formula they areusing by answering the question: “Would you like to use one of theseestimates for your total acquisition costs?”
8/3/2019 New Zealand; Corrective Maintenance Costs for Green Infrastructure
http://slidepdf.com/reader/full/new-zealand-corrective-maintenance-costs-for-green-infrastructure 26/79
COSTnz Model: User Manual (v.1) Chapter 4: Wetlands
December 2009 Page 21
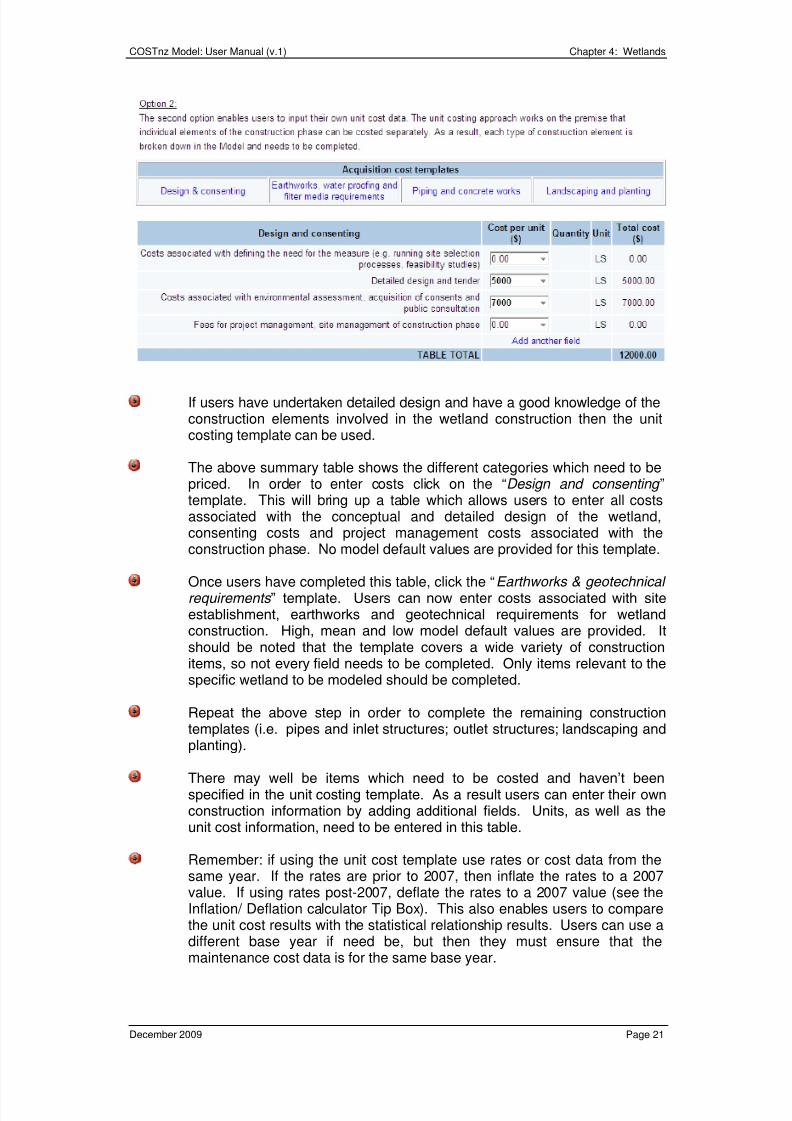
If users have undertaken detailed design and have a good knowledge of theconstruction elements involved in the wetland construction then the unitcosting template can be used.
The above summary table shows the different categories which need to bepriced. In order to enter costs click on the “Design and consenting ”template. This will bring up a table which allows users to enter all costsassociated with the conceptual and detailed design of the wetland,consenting costs and project management costs associated with theconstruction phase. No model default values are provided for this template.
Once users have completed this table, click the “Earthworks & geotechnical requirements ” template. Users can now enter costs associated with siteestablishment, earthworks and geotechnical requirements for wetlandconstruction. High, mean and low model default values are provided. Itshould be noted that the template covers a wide variety of constructionitems, so not every field needs to be completed. Only items relevant to thespecific wetland to be modeled should be completed.
Repeat the above step in order to complete the remaining constructiontemplates (i.e. pipes and inlet structures; outlet structures; landscaping andplanting).
There may well be items which need to be costed and haven’t beenspecified in the unit costing template. As a result users can enter their ownconstruction information by adding additional fields. Units, as well as theunit cost information, need to be entered in this table.
Remember: if using the unit cost template use rates or cost data from thesame year. If the rates are prior to 2007, then inflate the rates to a 2007value. If using rates post-2007, deflate the rates to a 2007 value (see theInflation/ Deflation calculator Tip Box). This also enables users to comparethe unit cost results with the statistical relationship results. Users can use adifferent base year if need be, but then they must ensure that the
maintenance cost data is for the same base year.
8/3/2019 New Zealand; Corrective Maintenance Costs for Green Infrastructure
http://slidepdf.com/reader/full/new-zealand-corrective-maintenance-costs-for-green-infrastructure 27/79
COSTnz Model: User Manual (v.1) Chapter 4: Wetlands
December 2009 Page 22
TIP BOX
4.4 Maintenance and Decommissioning Costs The maintenance costs in the COSTnz Model have been divided into routine andcorrective maintenance activities.
Routine maintenance is defined as including those types of activities which occur ona monthly to annual basis (e.g. mowing, inspections after major storms, cleaning outof debris, weed management, making good from vandalism). Correctivemaintenance includes activities such as replacement of parts, cleanout of devices,disposal of sediments. These activities are generally undertaken on a longertimeframe and are dependant on the flows and contaminant loads that are beingrouted through the device. The default maintenance activities and frequencies in themodel are based on TP10 (ARC, 2003) and data collected during the COSTnzproject. The Model allows for elevated routine maintenance costs for the first 5 years
after construction. The unit maintenance cost default values given in the WetlandModule are ‘high’, ‘mean’ and ‘low’.
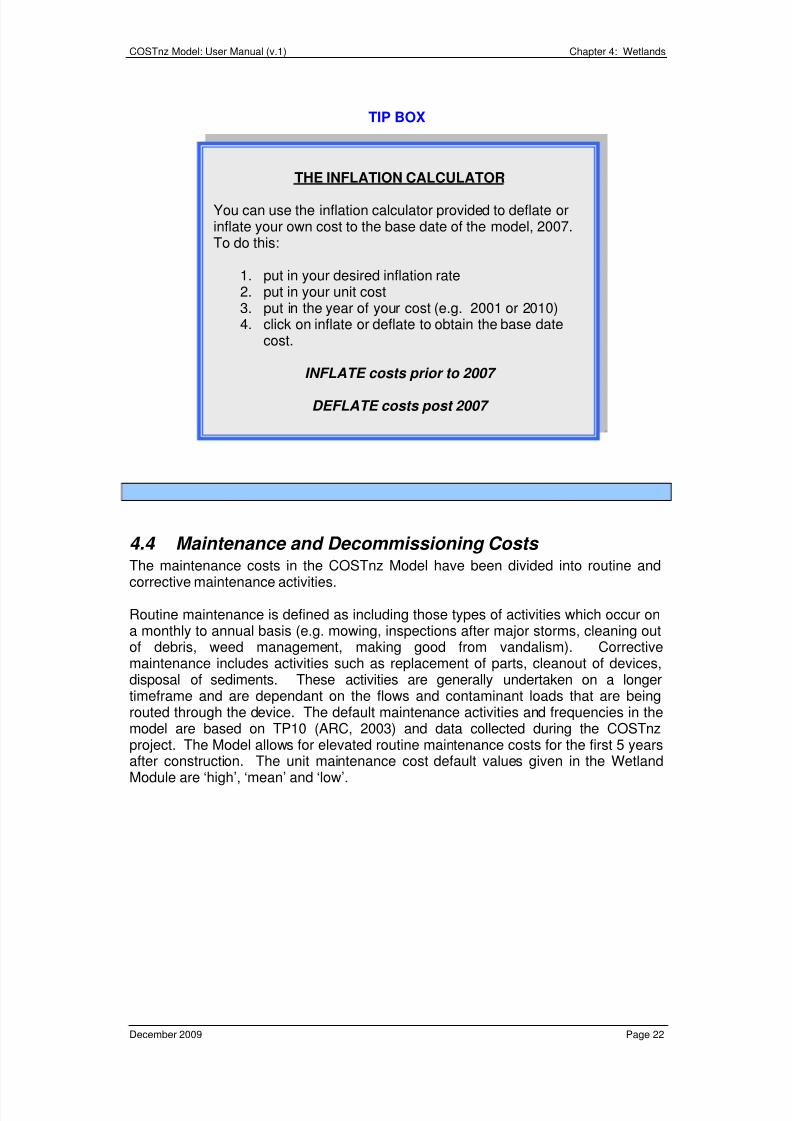
THE INFLATION CALCULATOR
You can use the inflation calculator provided to deflate orinflate your own cost to the base date of the model, 2007.To do this:
1. put in your desired inflation rate2. put in your unit cost3. put in the year of your cost (e.g. 2001 or 2010)4. click on inflate or deflate to obtain the base date
cost.
INFLATE costs prior to 2007
DEFLATE costs post 2007
8/3/2019 New Zealand; Corrective Maintenance Costs for Green Infrastructure
http://slidepdf.com/reader/full/new-zealand-corrective-maintenance-costs-for-green-infrastructure 28/79
COSTnz Model: User Manual (v.1) Chapter 4: Wetlands
December 2009 Page 23
Inputting the Maintenance Costs
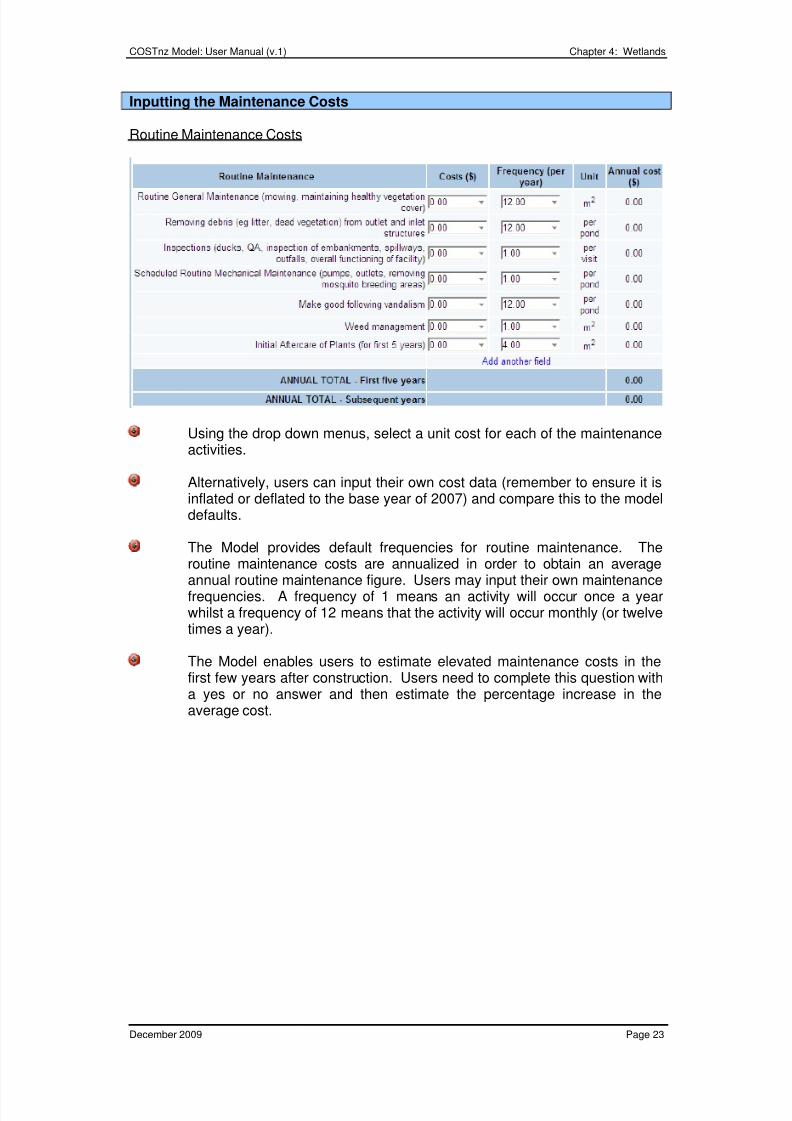
Routine Maintenance Costs
Using the drop down menus, select a unit cost for each of the maintenanceactivities.
Alternatively, users can input their own cost data (remember to ensure it isinflated or deflated to the base year of 2007) and compare this to the modeldefaults.
The Model provides default frequencies for routine maintenance. Theroutine maintenance costs are annualized in order to obtain an averageannual routine maintenance figure. Users may input their own maintenancefrequencies. A frequency of 1 means an activity will occur once a yearwhilst a frequency of 12 means that the activity will occur monthly (or twelvetimes a year).
The Model enables users to estimate elevated maintenance costs in thefirst few years after construction. Users need to complete this question witha yes or no answer and then estimate the percentage increase in theaverage cost.
8/3/2019 New Zealand; Corrective Maintenance Costs for Green Infrastructure
http://slidepdf.com/reader/full/new-zealand-corrective-maintenance-costs-for-green-infrastructure 29/79
COSTnz Model: User Manual (v.1) Chapter 4: Wetlands
December 2009 Page 24
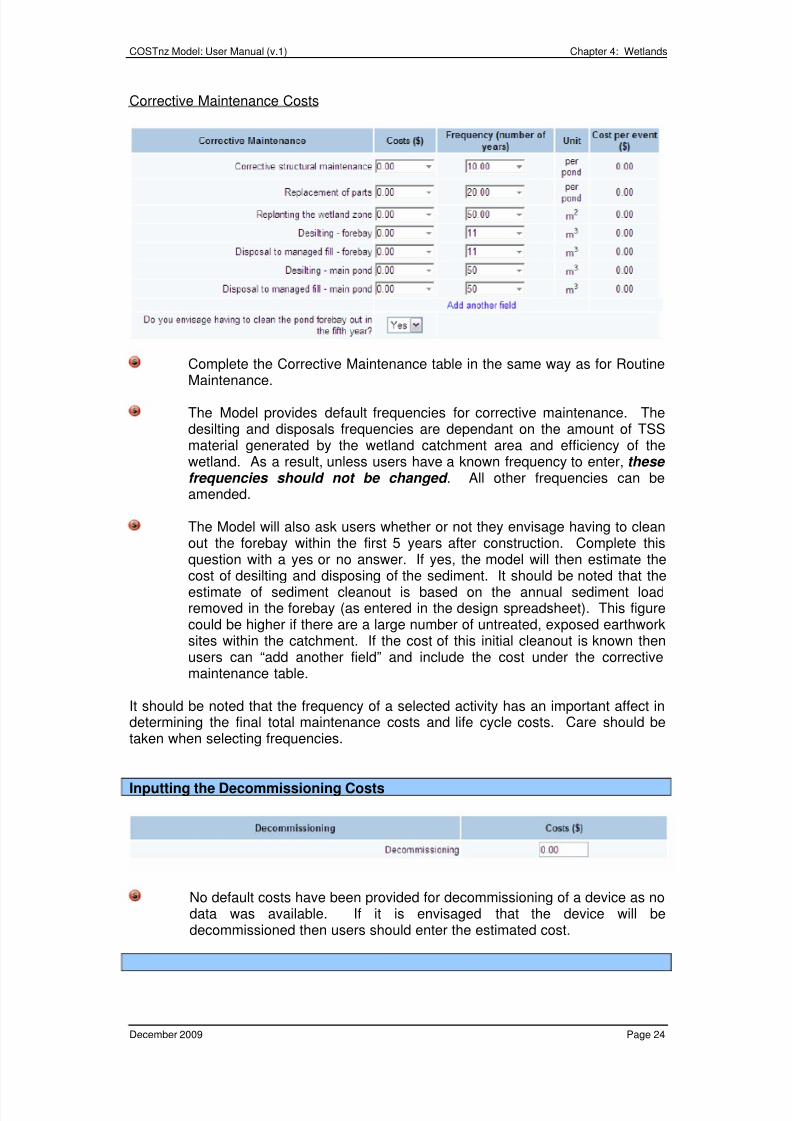
Corrective Maintenance Costs
Complete the Corrective Maintenance table in the same way as for Routine
Maintenance.
The Model provides default frequencies for corrective maintenance. Thedesilting and disposals frequencies are dependant on the amount of TSSmaterial generated by the wetland catchment area and efficiency of thewetland. As a result, unless users have a known frequency to enter, these frequencies should not be changed . All other frequencies can beamended.
The Model will also ask users whether or not they envisage having to cleanout the forebay within the first 5 years after construction. Complete thisquestion with a yes or no answer. If yes, the model will then estimate the
cost of desilting and disposing of the sediment. It should be noted that theestimate of sediment cleanout is based on the annual sediment loadremoved in the forebay (as entered in the design spreadsheet). This figurecould be higher if there are a large number of untreated, exposed earthworksites within the catchment. If the cost of this initial cleanout is known thenusers can “add another field” and include the cost under the correctivemaintenance table.
It should be noted that the frequency of a selected activity has an important affect indetermining the final total maintenance costs and life cycle costs. Care should betaken when selecting frequencies.
Inputting the Decommissioning Costs
No default costs have been provided for decommissioning of a device as nodata was available. If it is envisaged that the device will bedecommissioned then users should enter the estimated cost.

8/3/2019 New Zealand; Corrective Maintenance Costs for Green Infrastructure
http://slidepdf.com/reader/full/new-zealand-corrective-maintenance-costs-for-green-infrastructure 30/79
COSTnz Model: User Manual (v.1) Chapter 4: Wetlands
December 2009 Page 25
Once users have finished completing the Maintenance Cost data then the model willrun and display the results. Results are displayed on a summary page in a tabularand graphical form. They are discussed in greater detail in Section 11 of thisManual.
8/3/2019 New Zealand; Corrective Maintenance Costs for Green Infrastructure
http://slidepdf.com/reader/full/new-zealand-corrective-maintenance-costs-for-green-infrastructure 31/79
COSTnz Model: User Manual (v.1) Chapter 5: Rain Gardens
December 2009 Page 26
5. RAIN GARDENS
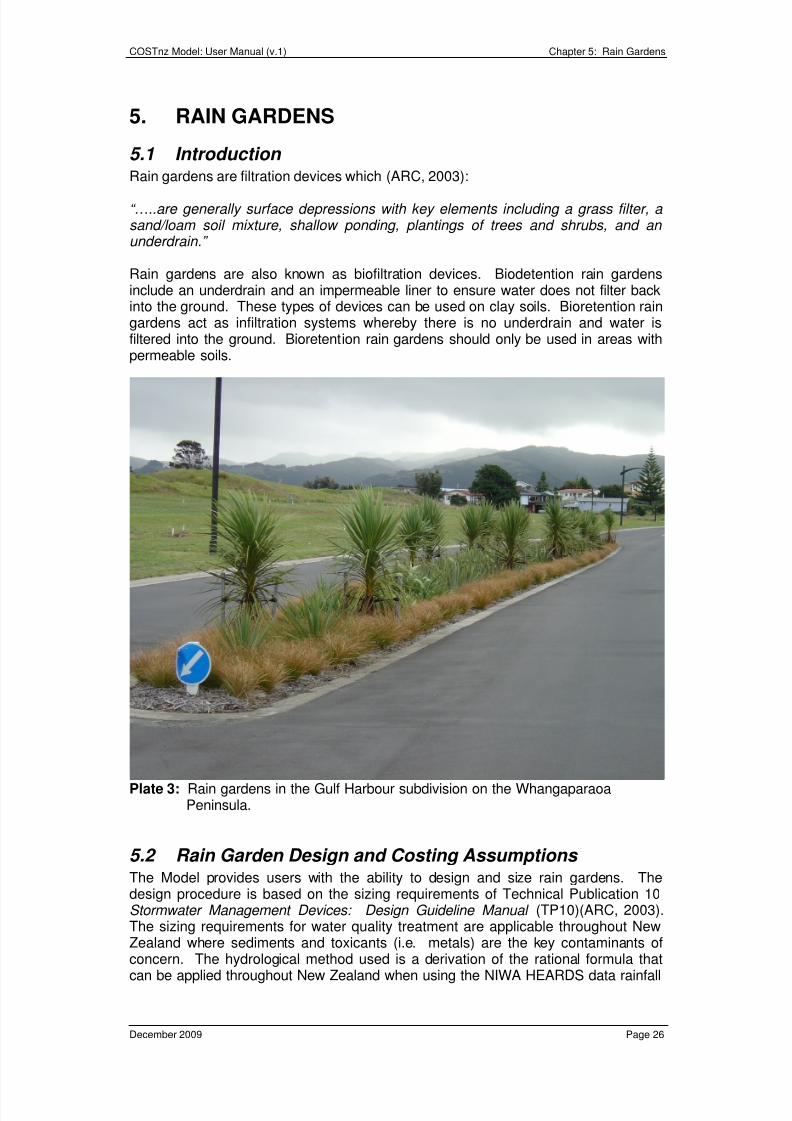
5.1 Introduction Rain gardens are filtration devices which (ARC, 2003):
“…..are generally surface depressions with key elements including a grass filter, a sand/loam soil mixture, shallow ponding, plantings of trees and shrubs, and an underdrain.”
Rain gardens are also known as biofiltration devices. Biodetention rain gardensinclude an underdrain and an impermeable liner to ensure water does not filter backinto the ground. These types of devices can be used on clay soils. Bioretention raingardens act as infiltration systems whereby there is no underdrain and water isfiltered into the ground. Bioretention rain gardens should only be used in areas withpermeable soils.
Plate 3: Rain gardens in the Gulf Harbour subdivision on the WhangaparaoaPeninsula.
5.2 Rain Garden Design and Costing Assumptions The Model provides users with the ability to design and size rain gardens. Thedesign procedure is based on the sizing requirements of Technical Publication 10Stormwater Management Devices: Design Guideline Manual (TP10)(ARC, 2003).The sizing requirements for water quality treatment are applicable throughout NewZealand where sediments and toxicants (i.e. metals) are the key contaminants of
concern. The hydrological method used is a derivation of the rational formula thatcan be applied throughout New Zealand when using the NIWA HEARDS data rainfall
8/3/2019 New Zealand; Corrective Maintenance Costs for Green Infrastructure
http://slidepdf.com/reader/full/new-zealand-corrective-maintenance-costs-for-green-infrastructure 32/79
COSTnz Model: User Manual (v.1) Chapter 5: Rain Gardens
December 2009 Page 27
maps (see Appendix A). Users will need to use the ARC’s Contaminant Load Modelor an equivalent contaminant model to ascertain the annual sediment load to betreated by the rain garden.
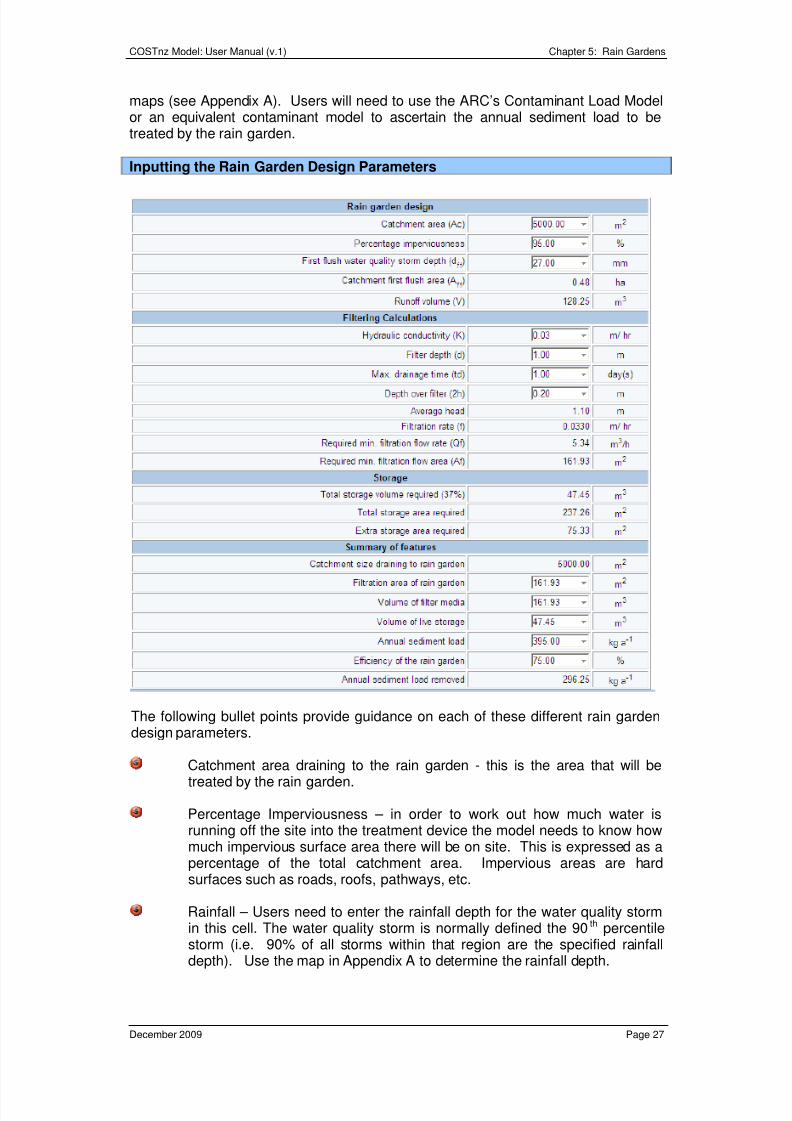
Inputting the Rain Garden Design Parameters
The following bullet points provide guidance on each of these different rain gardendesign parameters.
Catchment area draining to the rain garden - this is the area that will betreated by the rain garden.
Percentage Imperviousness – in order to work out how much water isrunning off the site into the treatment device the model needs to know howmuch impervious surface area there will be on site. This is expressed as apercentage of the total catchment area. Impervious areas are hardsurfaces such as roads, roofs, pathways, etc.
Rainfall – Users need to enter the rainfall depth for the water quality stormin this cell. The water quality storm is normally defined the 90th percentilestorm (i.e. 90% of all storms within that region are the specified rainfall
depth). Use the map in Appendix A to determine the rainfall depth.
8/3/2019 New Zealand; Corrective Maintenance Costs for Green Infrastructure
http://slidepdf.com/reader/full/new-zealand-corrective-maintenance-costs-for-green-infrastructure 33/79
COSTnz Model: User Manual (v.1) Chapter 5: Rain Gardens
December 2009 Page 28
Hydraulic conductivity – this is the coefficient of permeability. TP10 (ARC,2003) recommends a rate of 0.3m/day (or 0.025m/hr).
Filter Depth – this is the planting soil depth. It is recommended that aminimum of 0.8 to 1m planting soil depth should be used.
Maximum Drainage Time – this is the time to pass the water quality volumethrough the soil bed. TP10 (ARC, 2003) recommends that 1 day is used forresidential areas and up to 1.5 days for non-residential developments.
Average height of Water (Depth over Filter) – the average height of thewater above the soil media is equal to half the maximum depth of pondingwater. For example, if your ponded depth is 0.3m then the depth over filterwill be 0.15m. It is recommended that the rain garden design allow for a0.3m ponding depth, however, this figure can be varied.
If you already know the size of your rain garden you can enter the design
parameters in the User Defined column of the Design Summary Table.
Annual TSS load - in order to calculate the theoretical cleanout frequencyfor a rain garden, the model needs to know how much sediment is comingoff the rain garden catchment area. Users will need to use a contaminantload model to determine the annual total suspended solids (TSS) load.Users can use the ARC “Contaminant Load Model ” to work out thesediment load generated by contributing catchment area. This model canbe downloaded from the ARC’s website at:http://www.arc.govt.nz/environment/water/stormwater/contaminants-in-auckland-stormwater.cfm
Alternatively, users can use the C-CALM model developed by NIWA towork out contaminant loads.
Efficiency of Rain Garden – this is the design efficiency of the rain gardenand should be expressed as a percentage of total suspended solidsremoved.
Annual loads removed – once the annual TSS load and rain garden designparameters have been entered the model will calculate the annual TSS loadremoved by the rain garden.
Life Cycle Costing Assumptions
Enter the life span of the proposed device. This should equate to how longthe device will be able to function for if maintained correctly. The dropdown menu provides suggested life spans, however users can enter theirown life span too.
8/3/2019 New Zealand; Corrective Maintenance Costs for Green Infrastructure
http://slidepdf.com/reader/full/new-zealand-corrective-maintenance-costs-for-green-infrastructure 34/79
COSTnz Model: User Manual (v.1) Chapter 5: Rain Gardens
December 2009 Page 29
A discount rate of either 3.5 or 6% can be used. If users are doing a longterm life cycle costing analysis (i.e. more than 30 years) then 6% should beused as it more accurately accounts for uncertainties in the future.Alternatively, users can enter their own discount rate.
The Base Year is the year in which the data was collected. All the defaultvalues in the model are set to a base year of 2007. It is important that the data used is all from the same year. If using data from different years,users need to inflate or deflate the costs manually using the inflationcalculator.
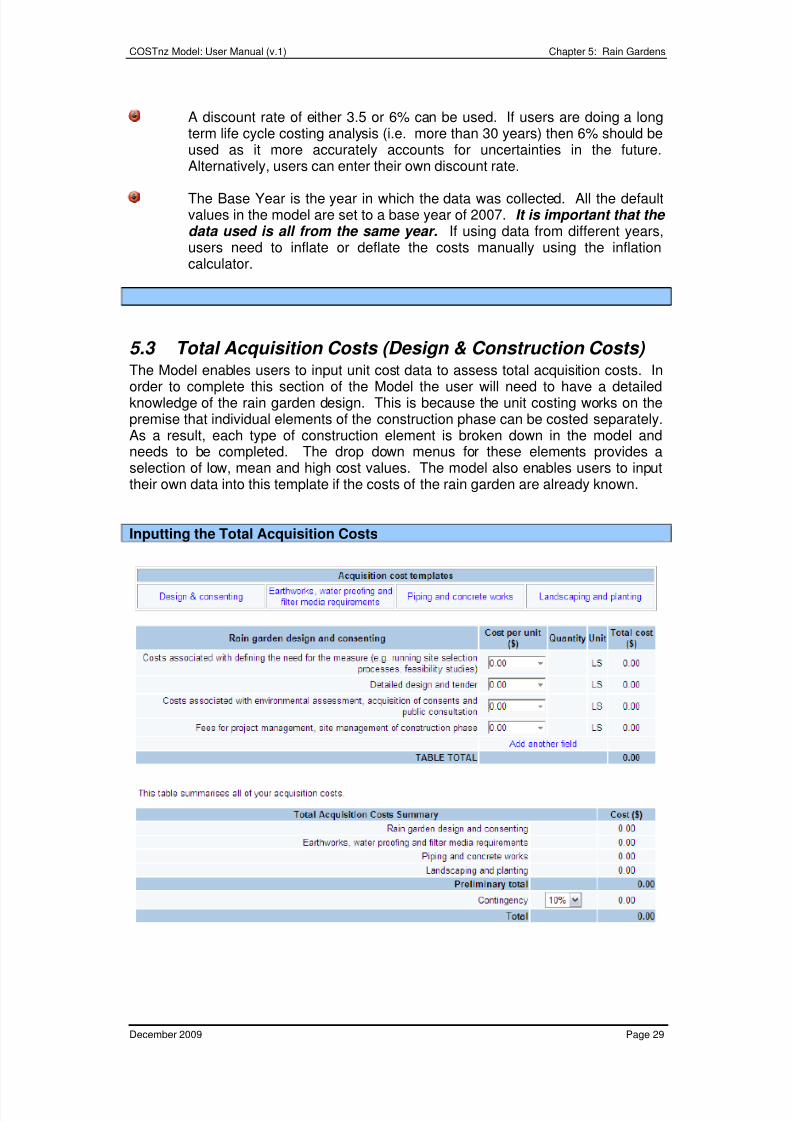
5.3 Total Acquisition Costs (Design & Construction Costs) The Model enables users to input unit cost data to assess total acquisition costs. In
order to complete this section of the Model the user will need to have a detailedknowledge of the rain garden design. This is because the unit costing works on thepremise that individual elements of the construction phase can be costed separately.As a result, each type of construction element is broken down in the model andneeds to be completed. The drop down menus for these elements provides aselection of low, mean and high cost values. The model also enables users to inputtheir own data into this template if the costs of the rain garden are already known.
Inputting the Total Acquisition Costs
8/3/2019 New Zealand; Corrective Maintenance Costs for Green Infrastructure
http://slidepdf.com/reader/full/new-zealand-corrective-maintenance-costs-for-green-infrastructure 35/79
COSTnz Model: User Manual (v.1) Chapter 5: Rain Gardens
December 2009 Page 30
The above summary table shows the different categories to be costedwhich make up the total acquisition costs. In order to enter costs click onthe “Design and consenting ” template. This will bring up a table whichallows you to enter all costs associated with the conceptual and detaileddesign of the rain garden, consenting costs and project management costsassociated with the construction phase. No model default values areprovided for this template.
Once users have completed this table, click the “E arthworks, waterproofing and filter media requirements ” template. Users can now enter costsassociated with site establishment, earthworks and geotechnicalrequirements of the rain garden construction. Low, mean and high modeldefault values are provided. It should be noted that the template covers awide variety of construction items, so not every field has to be completed.Only those items relevant to the specific rain garden to be modeled shouldbe completed.
Repeat the above step in order to complete the remaining constructiontemplates (i.e. piping and concrete works; landscaping and planting).
There may well be items which need to be costed that haven’t beenspecified in the unit costing template. As a result users can createadditional items and enter their own construction information in this section.Units as well as the unit cost need to be entered in this table.
Remember: if using the unit cost template use rates or cost data from thesame year. If the rates are prior to 2007, inflate the rates to a 2007 value.If using rates post-2007, deflate the rates to a 2007 value (see the Inflation/ Deflation calculator Tip Box). This also enables users to compare the unit
cost results with the statistical relationship results. Users can use adifferent base year if need be, but then they must ensure that themaintenance cost data is for the same base year.
TIP BOX
THE INFLATION CALCULATOR
You can use the inflation calculator provided to deflate or
inflate your own cost to the base date of the model, 2007.To do this:
1. put in your desired inflation rate2. put in your unit cost3. put in the year of your cost (e.g. 2001 or 2010)4. click on inflate or deflate to obtain the base date
cost.
INFLATE costs prior to 2007
DEFLATE costs post 2007
8/3/2019 New Zealand; Corrective Maintenance Costs for Green Infrastructure
http://slidepdf.com/reader/full/new-zealand-corrective-maintenance-costs-for-green-infrastructure 36/79
COSTnz Model: User Manual (v.1) Chapter 5: Rain Gardens
December 2009 Page 31
5.4 Maintenance and Decommissioning Costs
The maintenance costs in the COSTnz Model have been divided into routine andcorrective maintenance activities.
Routine maintenance is defined as including those types of activities which occur ona monthly to annual basis (e.g. mowing, inspections after major storms, cleaning outof debris, weed management, making good from vandalism). Correctivemaintenance includes activities such as replacement of parts, cleanout of devices,disposal of sediments. These activities are generally undertaken on a longertimeframe and are dependant on the flows and contaminant loads that are beingrouted through the device. The default maintenance activities and frequencies in themodel are based on TP10 (ARC, 2003) and data collected during the COSTnzproject. The Model allows for elevated routine maintenance costs for the first 5 years
after construction.
The unit maintenance cost default values given in the Rain Garden Module are ‘high’and ‘low’.
Inputting the Maintenance Costs
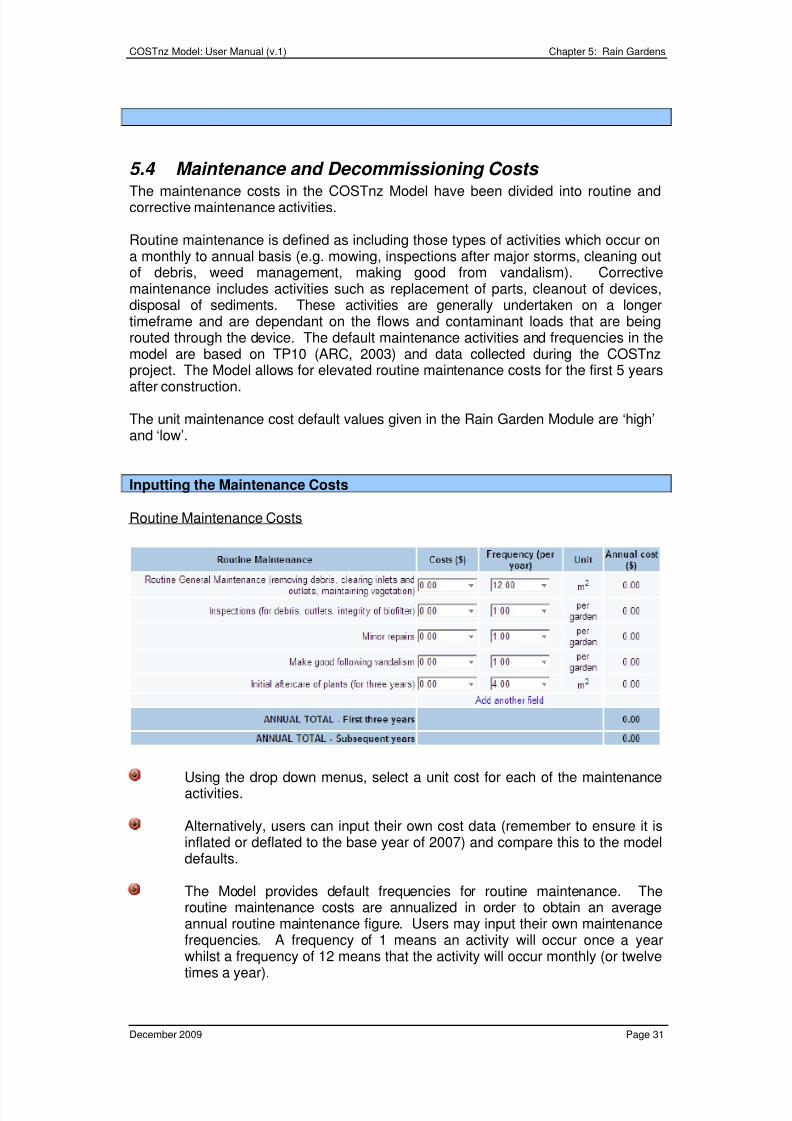
Routine Maintenance Costs
Using the drop down menus, select a unit cost for each of the maintenanceactivities.
Alternatively, users can input their own cost data (remember to ensure it isinflated or deflated to the base year of 2007) and compare this to the modeldefaults.
The Model provides default frequencies for routine maintenance. Theroutine maintenance costs are annualized in order to obtain an averageannual routine maintenance figure. Users may input their own maintenancefrequencies. A frequency of 1 means an activity will occur once a year
whilst a frequency of 12 means that the activity will occur monthly (or twelvetimes a year).
8/3/2019 New Zealand; Corrective Maintenance Costs for Green Infrastructure
http://slidepdf.com/reader/full/new-zealand-corrective-maintenance-costs-for-green-infrastructure 37/79
COSTnz Model: User Manual (v.1) Chapter 5: Rain Gardens
December 2009 Page 32
The Model assumes that there will be elevated maintenance costs in the first3 years due to aftercare of plants.
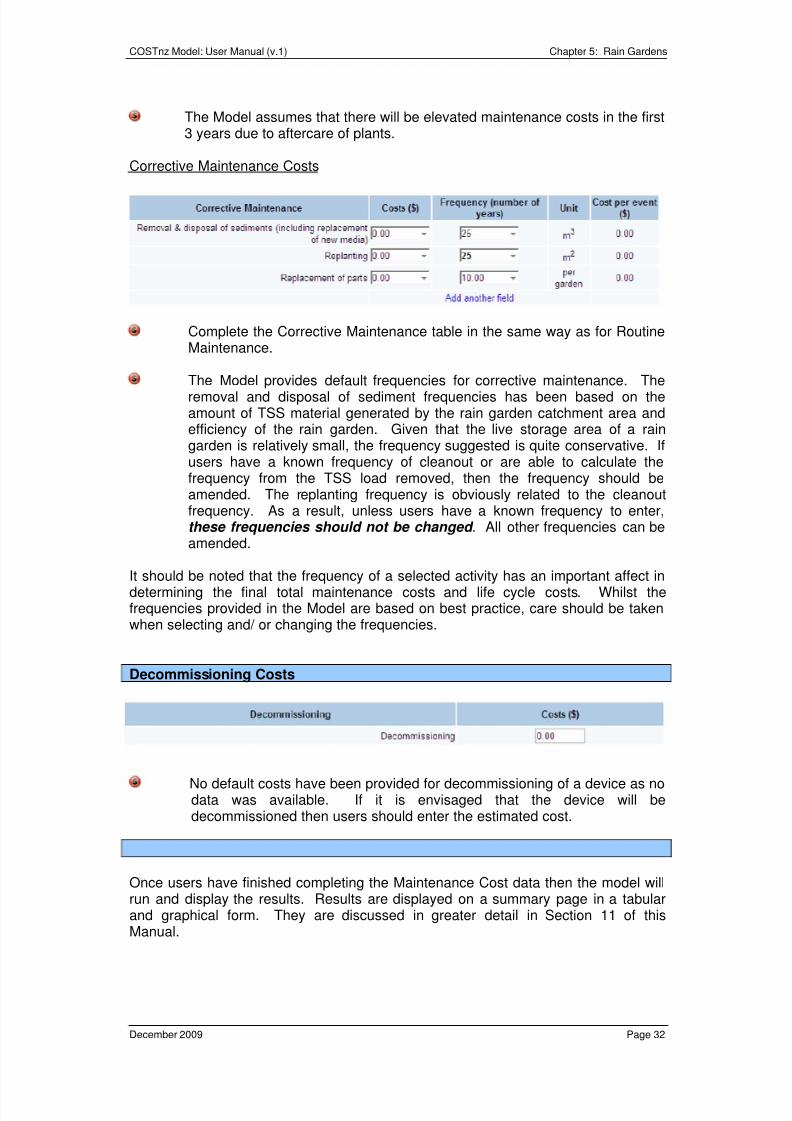
Corrective Maintenance Costs
Complete the Corrective Maintenance table in the same way as for RoutineMaintenance.
The Model provides default frequencies for corrective maintenance. Theremoval and disposal of sediment frequencies has been based on theamount of TSS material generated by the rain garden catchment area andefficiency of the rain garden. Given that the live storage area of a raingarden is relatively small, the frequency suggested is quite conservative. Ifusers have a known frequency of cleanout or are able to calculate thefrequency from the TSS load removed, then the frequency should beamended. The replanting frequency is obviously related to the cleanoutfrequency. As a result, unless users have a known frequency to enter,these frequencies should not be changed . All other frequencies can beamended.
It should be noted that the frequency of a selected activity has an important affect indetermining the final total maintenance costs and life cycle costs. Whilst thefrequencies provided in the Model are based on best practice, care should be takenwhen selecting and/ or changing the frequencies.
Decommissioning Costs
No default costs have been provided for decommissioning of a device as nodata was available. If it is envisaged that the device will bedecommissioned then users should enter the estimated cost.
Once users have finished completing the Maintenance Cost data then the model willrun and display the results. Results are displayed on a summary page in a tabularand graphical form. They are discussed in greater detail in Section 11 of thisManual.
8/3/2019 New Zealand; Corrective Maintenance Costs for Green Infrastructure
http://slidepdf.com/reader/full/new-zealand-corrective-maintenance-costs-for-green-infrastructure 38/79
COSTnz Model: User Manual (v.1) Chapter 6: Sand Filters
December 2009 Page 33
6 SAND FILTERS
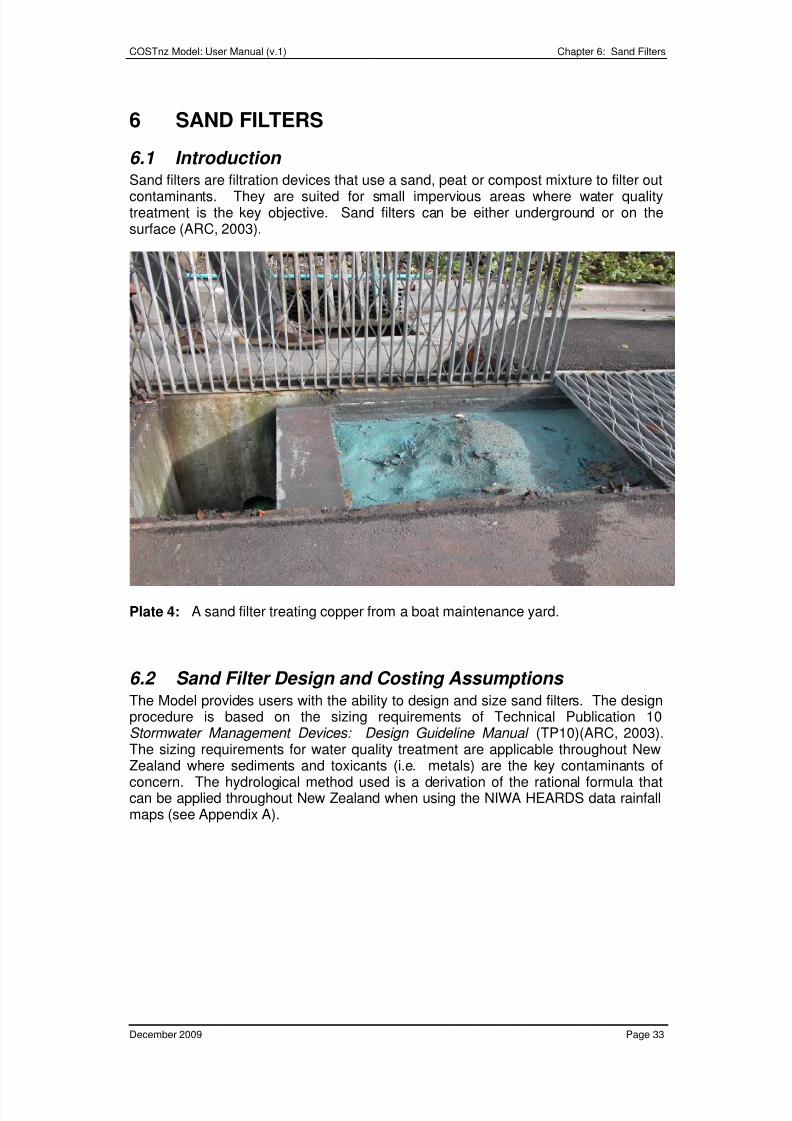
6.1 Introduction Sand filters are filtration devices that use a sand, peat or compost mixture to filter outcontaminants. They are suited for small impervious areas where water qualitytreatment is the key objective. Sand filters can be either underground or on thesurface (ARC, 2003).
Plate 4: A sand filter treating copper from a boat maintenance yard.
6.2 Sand Filter Design and Costing Assumptions The Model provides users with the ability to design and size sand filters. The designprocedure is based on the sizing requirements of Technical Publication 10Stormwater Management Devices: Design Guideline Manual (TP10)(ARC, 2003).The sizing requirements for water quality treatment are applicable throughout New
Zealand where sediments and toxicants (i.e. metals) are the key contaminants ofconcern. The hydrological method used is a derivation of the rational formula thatcan be applied throughout New Zealand when using the NIWA HEARDS data rainfallmaps (see Appendix A).
8/3/2019 New Zealand; Corrective Maintenance Costs for Green Infrastructure
http://slidepdf.com/reader/full/new-zealand-corrective-maintenance-costs-for-green-infrastructure 39/79
COSTnz Model: User Manual (v.1) Chapter 6: Sand Filters
December 2009 Page 34
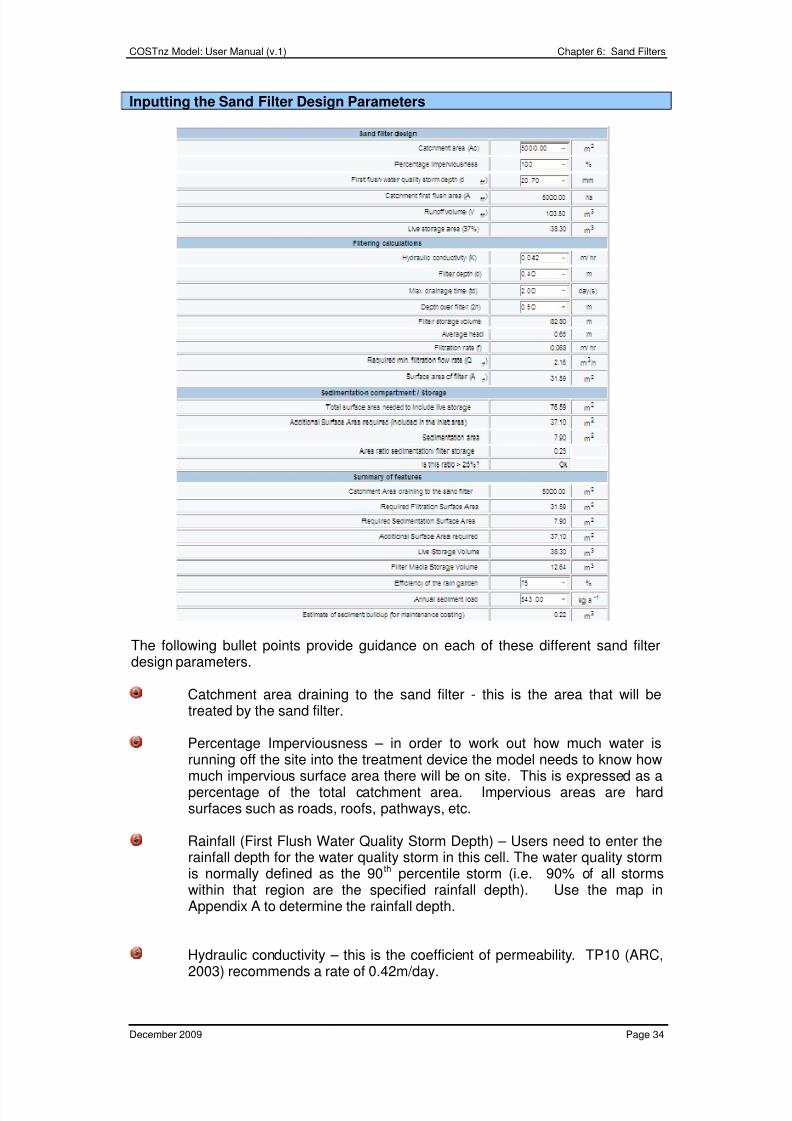
Inputting the Sand Filter Design Parameters
The following bullet points provide guidance on each of these different sand filterdesign parameters.
Catchment area draining to the sand filter - this is the area that will betreated by the sand filter.
Percentage Imperviousness – in order to work out how much water is
running off the site into the treatment device the model needs to know howmuch impervious surface area there will be on site. This is expressed as apercentage of the total catchment area. Impervious areas are hardsurfaces such as roads, roofs, pathways, etc.
Rainfall (First Flush Water Quality Storm Depth) – Users need to enter therainfall depth for the water quality storm in this cell. The water quality stormis normally defined as the 90th percentile storm (i.e. 90% of all stormswithin that region are the specified rainfall depth). Use the map inAppendix A to determine the rainfall depth.
Hydraulic conductivity – this is the coefficient of permeability. TP10 (ARC,2003) recommends a rate of 0.42m/day.
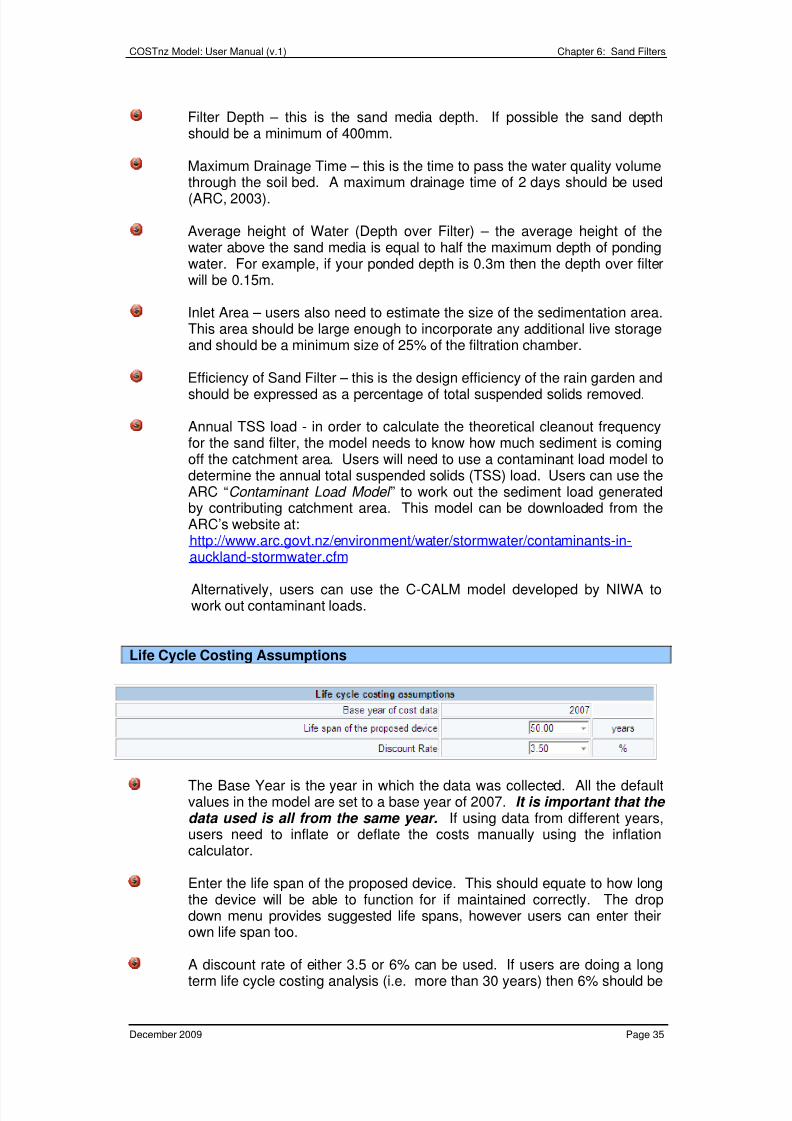
8/3/2019 New Zealand; Corrective Maintenance Costs for Green Infrastructure
http://slidepdf.com/reader/full/new-zealand-corrective-maintenance-costs-for-green-infrastructure 40/79
COSTnz Model: User Manual (v.1) Chapter 6: Sand Filters
December 2009 Page 35
Filter Depth – this is the sand media depth. If possible the sand depthshould be a minimum of 400mm.
Maximum Drainage Time – this is the time to pass the water quality volumethrough the soil bed. A maximum drainage time of 2 days should be used(ARC, 2003).
Average height of Water (Depth over Filter) – the average height of thewater above the sand media is equal to half the maximum depth of pondingwater. For example, if your ponded depth is 0.3m then the depth over filterwill be 0.15m.
Inlet Area – users also need to estimate the size of the sedimentation area.This area should be large enough to incorporate any additional live storageand should be a minimum size of 25% of the filtration chamber.
Efficiency of Sand Filter – this is the design efficiency of the rain garden andshould be expressed as a percentage of total suspended solids removed.
Annual TSS load - in order to calculate the theoretical cleanout frequencyfor the sand filter, the model needs to know how much sediment is comingoff the catchment area. Users will need to use a contaminant load model todetermine the annual total suspended solids (TSS) load. Users can use theARC “Contaminant Load Model ” to work out the sediment load generatedby contributing catchment area. This model can be downloaded from theARC’s website at:http://www.arc.govt.nz/environment/water/stormwater/contaminants-in-auckland-stormwater.cfm
Alternatively, users can use the C-CALM model developed by NIWA towork out contaminant loads.
Life Cycle Costing Assumptions
The Base Year is the year in which the data was collected. All the defaultvalues in the model are set to a base year of 2007. It is important that the data used is all from the same year. If using data from different years,users need to inflate or deflate the costs manually using the inflationcalculator.
Enter the life span of the proposed device. This should equate to how longthe device will be able to function for if maintained correctly. The dropdown menu provides suggested life spans, however users can enter theirown life span too.
A discount rate of either 3.5 or 6% can be used. If users are doing a longterm life cycle costing analysis (i.e. more than 30 years) then 6% should be
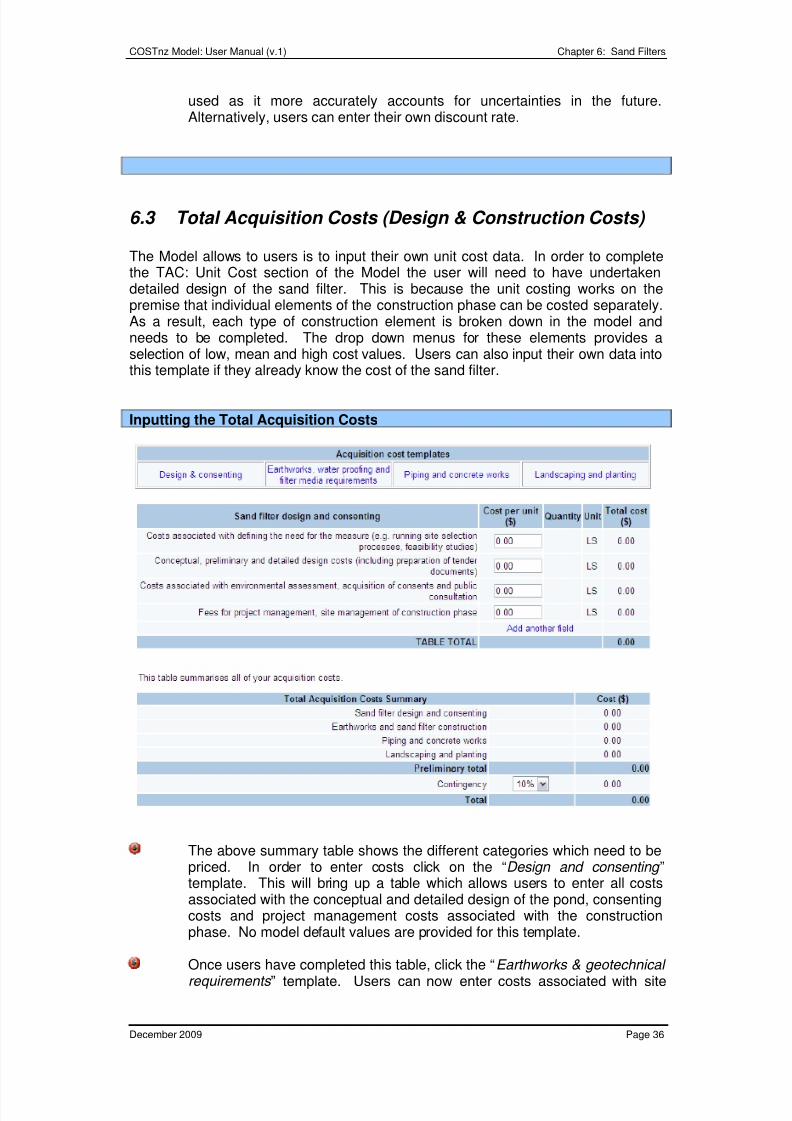
8/3/2019 New Zealand; Corrective Maintenance Costs for Green Infrastructure
http://slidepdf.com/reader/full/new-zealand-corrective-maintenance-costs-for-green-infrastructure 41/79
COSTnz Model: User Manual (v.1) Chapter 6: Sand Filters
December 2009 Page 36
used as it more accurately accounts for uncertainties in the future.Alternatively, users can enter their own discount rate.
6.3 Total Acquisition Costs (Design & Construction Costs)
The Model allows to users is to input their own unit cost data. In order to completethe TAC: Unit Cost section of the Model the user will need to have undertakendetailed design of the sand filter. This is because the unit costing works on thepremise that individual elements of the construction phase can be costed separately.As a result, each type of construction element is broken down in the model andneeds to be completed. The drop down menus for these elements provides aselection of low, mean and high cost values. Users can also input their own data intothis template if they already know the cost of the sand filter.
Inputting the Total Acquisition Costs
The above summary table shows the different categories which need to bepriced. In order to enter costs click on the “Design and consenting ”template. This will bring up a table which allows users to enter all costsassociated with the conceptual and detailed design of the pond, consentingcosts and project management costs associated with the constructionphase. No model default values are provided for this template.
Once users have completed this table, click the “Earthworks & geotechnical requirements ” template. Users can now enter costs associated with site
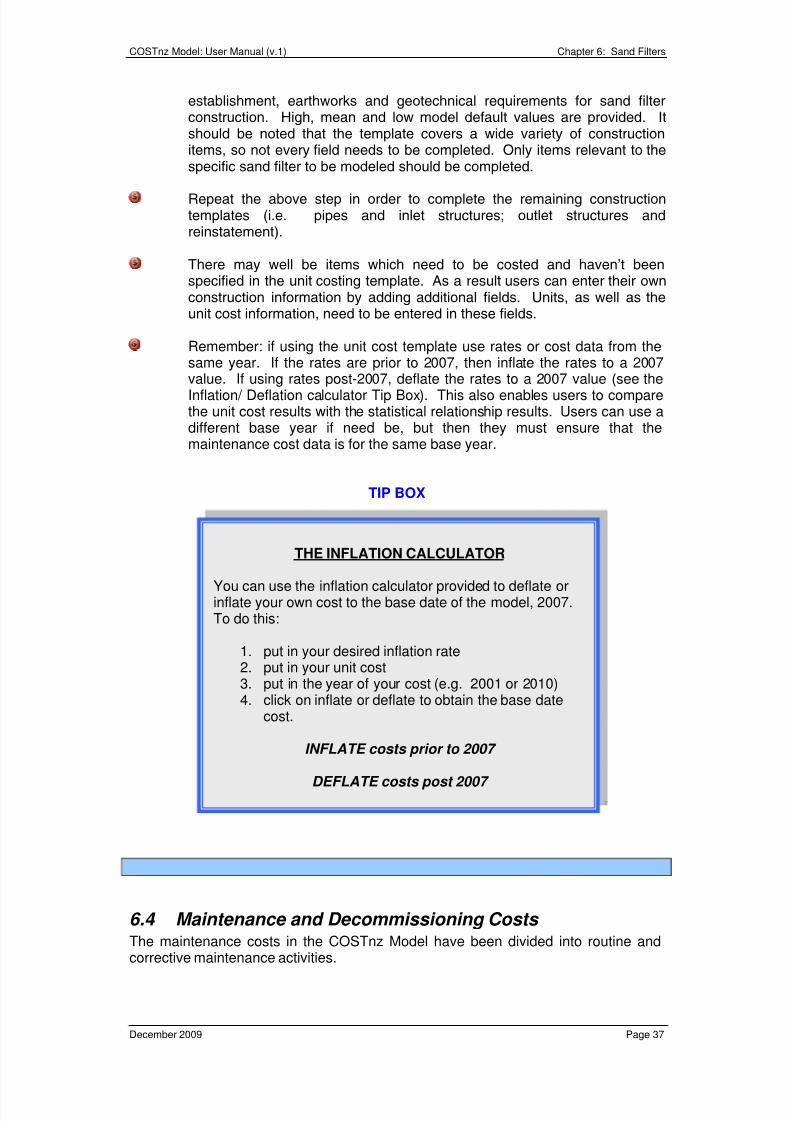
8/3/2019 New Zealand; Corrective Maintenance Costs for Green Infrastructure
http://slidepdf.com/reader/full/new-zealand-corrective-maintenance-costs-for-green-infrastructure 42/79
COSTnz Model: User Manual (v.1) Chapter 6: Sand Filters
December 2009 Page 37
establishment, earthworks and geotechnical requirements for sand filterconstruction. High, mean and low model default values are provided. Itshould be noted that the template covers a wide variety of constructionitems, so not every field needs to be completed. Only items relevant to thespecific sand filter to be modeled should be completed.
Repeat the above step in order to complete the remaining constructiontemplates (i.e. pipes and inlet structures; outlet structures andreinstatement).
There may well be items which need to be costed and haven’t beenspecified in the unit costing template. As a result users can enter their ownconstruction information by adding additional fields. Units, as well as theunit cost information, need to be entered in these fields.
Remember: if using the unit cost template use rates or cost data from thesame year. If the rates are prior to 2007, then inflate the rates to a 2007
value. If using rates post-2007, deflate the rates to a 2007 value (see theInflation/ Deflation calculator Tip Box). This also enables users to comparethe unit cost results with the statistical relationship results. Users can use adifferent base year if need be, but then they must ensure that themaintenance cost data is for the same base year.
TIP BOX
6.4 Maintenance and Decommissioning Costs The maintenance costs in the COSTnz Model have been divided into routine and
corrective maintenance activities.
THE INFLATION CALCULATOR
You can use the inflation calculator provided to deflate orinflate your own cost to the base date of the model, 2007.To do this:
1. put in your desired inflation rate2. put in your unit cost3. put in the year of your cost (e.g. 2001 or 2010)4. click on inflate or deflate to obtain the base date
cost.
INFLATE costs prior to 2007
DEFLATE costs post 2007
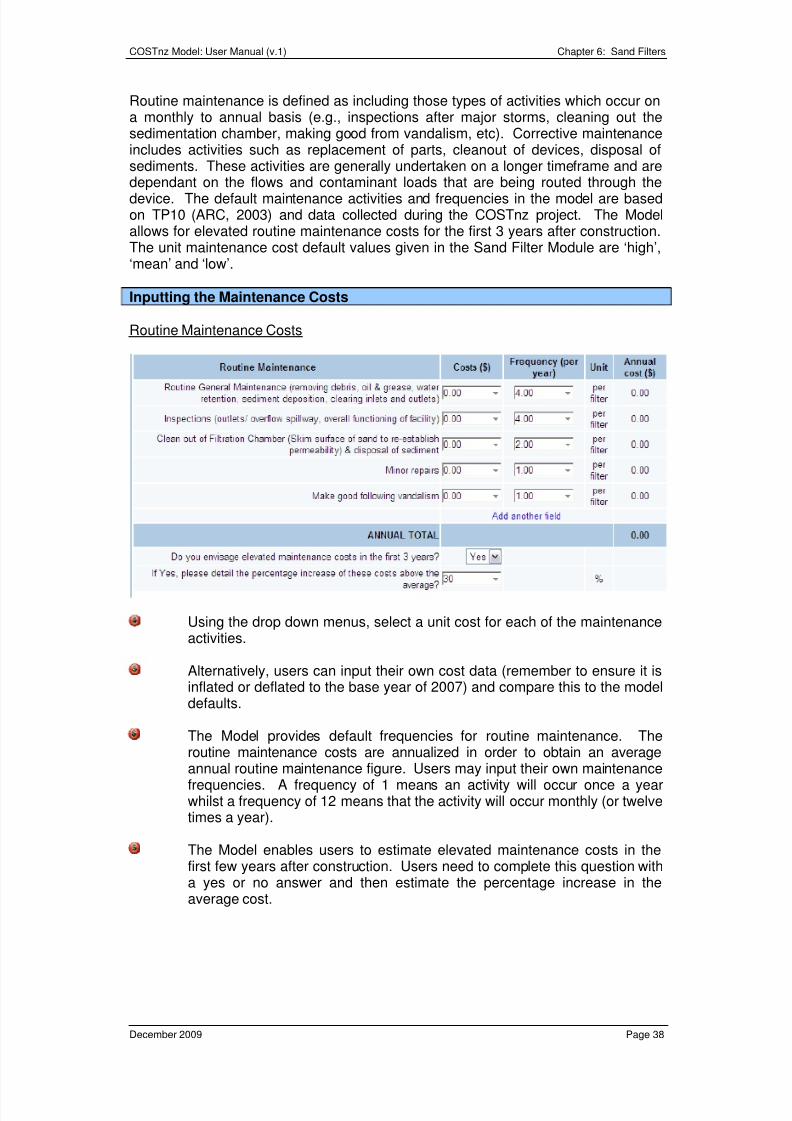
8/3/2019 New Zealand; Corrective Maintenance Costs for Green Infrastructure
http://slidepdf.com/reader/full/new-zealand-corrective-maintenance-costs-for-green-infrastructure 43/79
COSTnz Model: User Manual (v.1) Chapter 6: Sand Filters
December 2009 Page 38
Routine maintenance is defined as including those types of activities which occur ona monthly to annual basis (e.g., inspections after major storms, cleaning out thesedimentation chamber, making good from vandalism, etc). Corrective maintenanceincludes activities such as replacement of parts, cleanout of devices, disposal ofsediments. These activities are generally undertaken on a longer timeframe and aredependant on the flows and contaminant loads that are being routed through thedevice. The default maintenance activities and frequencies in the model are basedon TP10 (ARC, 2003) and data collected during the COSTnz project. The Modelallows for elevated routine maintenance costs for the first 3 years after construction.The unit maintenance cost default values given in the Sand Filter Module are ‘high’,‘mean’ and ‘low’.
Inputting the Maintenance Costs
Routine Maintenance Costs
Using the drop down menus, select a unit cost for each of the maintenanceactivities.
Alternatively, users can input their own cost data (remember to ensure it isinflated or deflated to the base year of 2007) and compare this to the modeldefaults.
The Model provides default frequencies for routine maintenance. Theroutine maintenance costs are annualized in order to obtain an average
annual routine maintenance figure. Users may input their own maintenancefrequencies. A frequency of 1 means an activity will occur once a yearwhilst a frequency of 12 means that the activity will occur monthly (or twelvetimes a year).
The Model enables users to estimate elevated maintenance costs in thefirst few years after construction. Users need to complete this question witha yes or no answer and then estimate the percentage increase in theaverage cost.
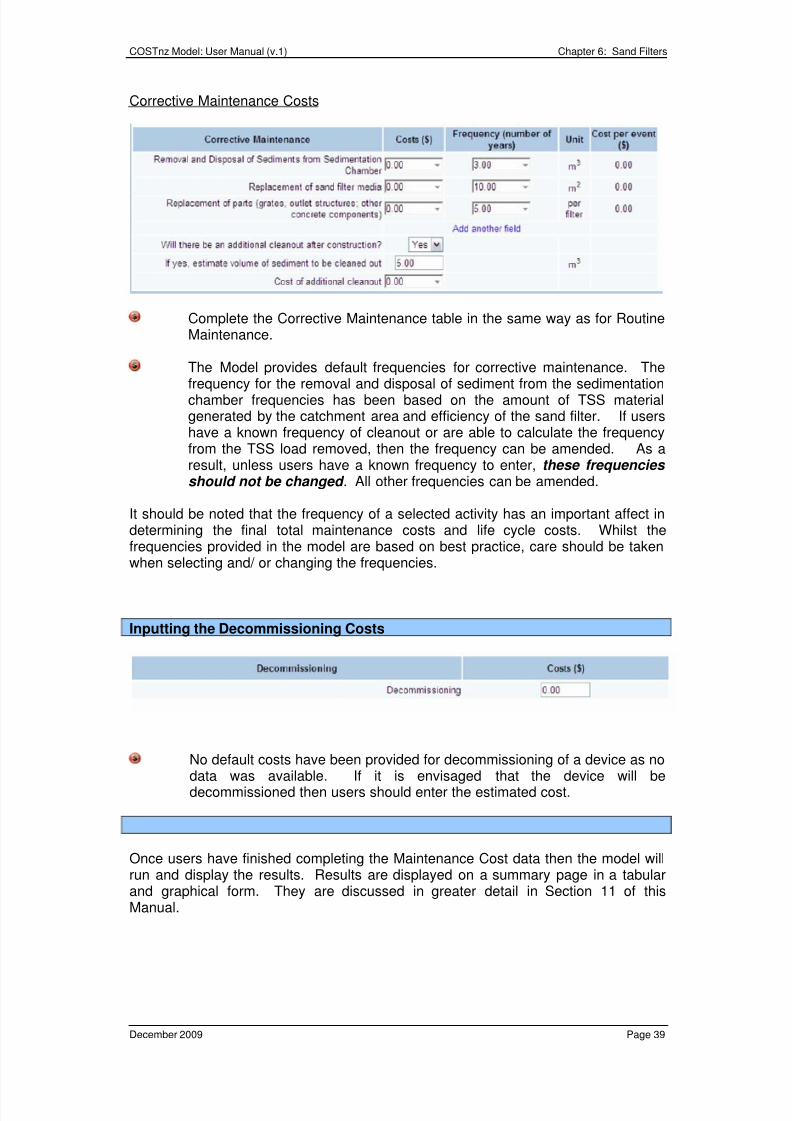
8/3/2019 New Zealand; Corrective Maintenance Costs for Green Infrastructure
http://slidepdf.com/reader/full/new-zealand-corrective-maintenance-costs-for-green-infrastructure 44/79
COSTnz Model: User Manual (v.1) Chapter 6: Sand Filters
December 2009 Page 39
Corrective Maintenance Costs
Complete the Corrective Maintenance table in the same way as for RoutineMaintenance.
The Model provides default frequencies for corrective maintenance. The
frequency for the removal and disposal of sediment from the sedimentationchamber frequencies has been based on the amount of TSS materialgenerated by the catchment area and efficiency of the sand filter. If usershave a known frequency of cleanout or are able to calculate the frequencyfrom the TSS load removed, then the frequency can be amended. As aresult, unless users have a known frequency to enter, these frequencies should not be changed . All other frequencies can be amended.
It should be noted that the frequency of a selected activity has an important affect indetermining the final total maintenance costs and life cycle costs. Whilst thefrequencies provided in the model are based on best practice, care should be takenwhen selecting and/ or changing the frequencies.
Inputting the Decommissioning Costs
No default costs have been provided for decommissioning of a device as nodata was available. If it is envisaged that the device will bedecommissioned then users should enter the estimated cost.
Once users have finished completing the Maintenance Cost data then the model willrun and display the results. Results are displayed on a summary page in a tabularand graphical form. They are discussed in greater detail in Section 11 of thisManual.
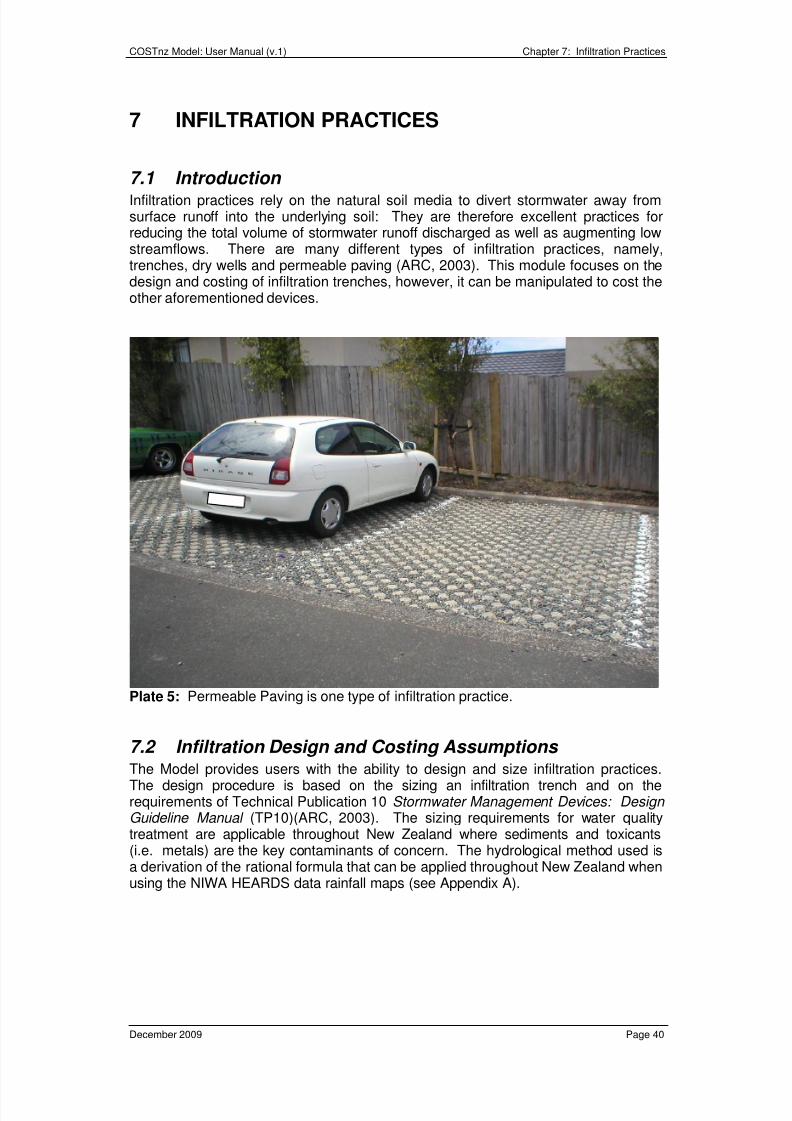
8/3/2019 New Zealand; Corrective Maintenance Costs for Green Infrastructure
http://slidepdf.com/reader/full/new-zealand-corrective-maintenance-costs-for-green-infrastructure 45/79
COSTnz Model: User Manual (v.1) Chapter 7: Infiltration Practices
December 2009 Page 40
7 INFILTRATION PRACTICES
7.1 Introduction Infiltration practices rely on the natural soil media to divert stormwater away fromsurface runoff into the underlying soil: They are therefore excellent practices forreducing the total volume of stormwater runoff discharged as well as augmenting lowstreamflows. There are many different types of infiltration practices, namely,trenches, dry wells and permeable paving (ARC, 2003). This module focuses on thedesign and costing of infiltration trenches, however, it can be manipulated to cost theother aforementioned devices.
Plate 5: Permeable Paving is one type of infiltration practice.
7.2 Infiltration Design and Costing Assumptions
The Model provides users with the ability to design and size infiltration practices.The design procedure is based on the sizing an infiltration trench and on therequirements of Technical Publication 10 Stormwater Management Devices: Design Guideline Manual (TP10)(ARC, 2003). The sizing requirements for water qualitytreatment are applicable throughout New Zealand where sediments and toxicants(i.e. metals) are the key contaminants of concern. The hydrological method used isa derivation of the rational formula that can be applied throughout New Zealand whenusing the NIWA HEARDS data rainfall maps (see Appendix A).
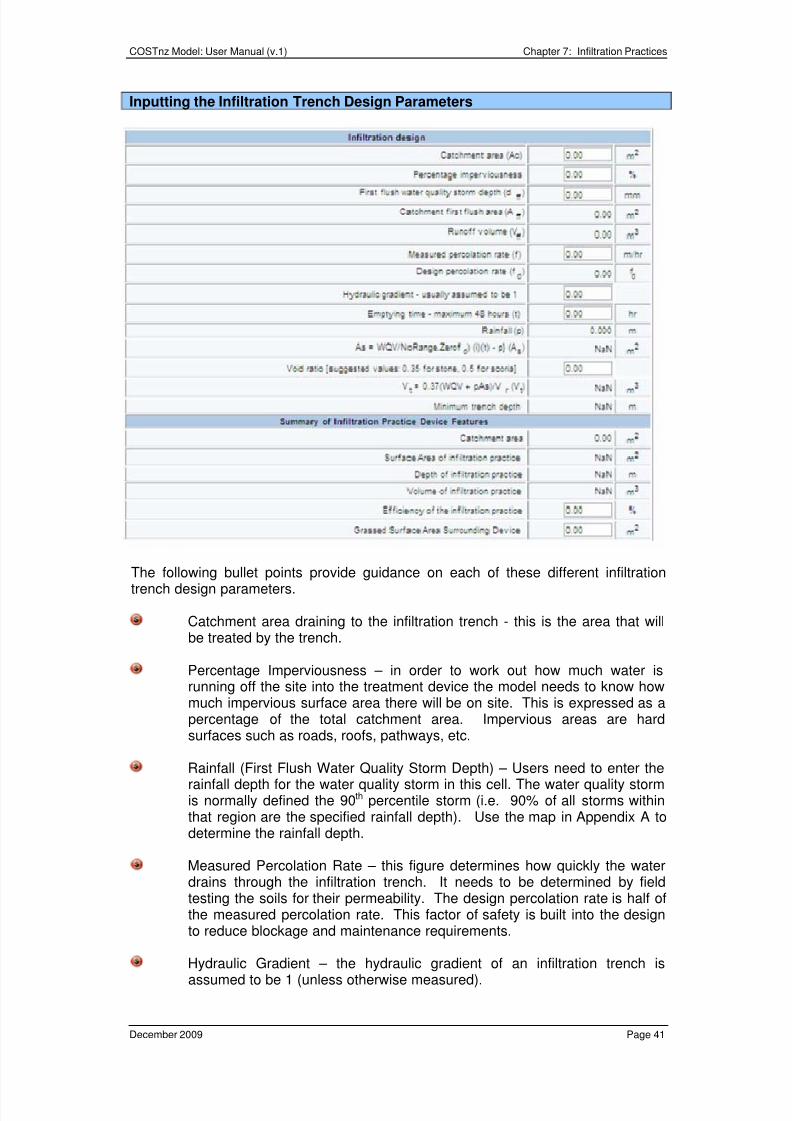
8/3/2019 New Zealand; Corrective Maintenance Costs for Green Infrastructure
http://slidepdf.com/reader/full/new-zealand-corrective-maintenance-costs-for-green-infrastructure 46/79
COSTnz Model: User Manual (v.1) Chapter 7: Infiltration Practices
December 2009 Page 41
Inputting the Infiltration Trench Design Parameters
The following bullet points provide guidance on each of these different infiltrationtrench design parameters.
Catchment area draining to the infiltration trench - this is the area that willbe treated by the trench.
Percentage Imperviousness – in order to work out how much water isrunning off the site into the treatment device the model needs to know howmuch impervious surface area there will be on site. This is expressed as apercentage of the total catchment area. Impervious areas are hardsurfaces such as roads, roofs, pathways, etc.
Rainfall (First Flush Water Quality Storm Depth) – Users need to enter therainfall depth for the water quality storm in this cell. The water quality stormis normally defined the 90th percentile storm (i.e. 90% of all storms withinthat region are the specified rainfall depth). Use the map in Appendix A todetermine the rainfall depth.
Measured Percolation Rate – this figure determines how quickly the waterdrains through the infiltration trench. It needs to be determined by fieldtesting the soils for their permeability. The design percolation rate is half ofthe measured percolation rate. This factor of safety is built into the designto reduce blockage and maintenance requirements.
Hydraulic Gradient – the hydraulic gradient of an infiltration trench isassumed to be 1 (unless otherwise measured).
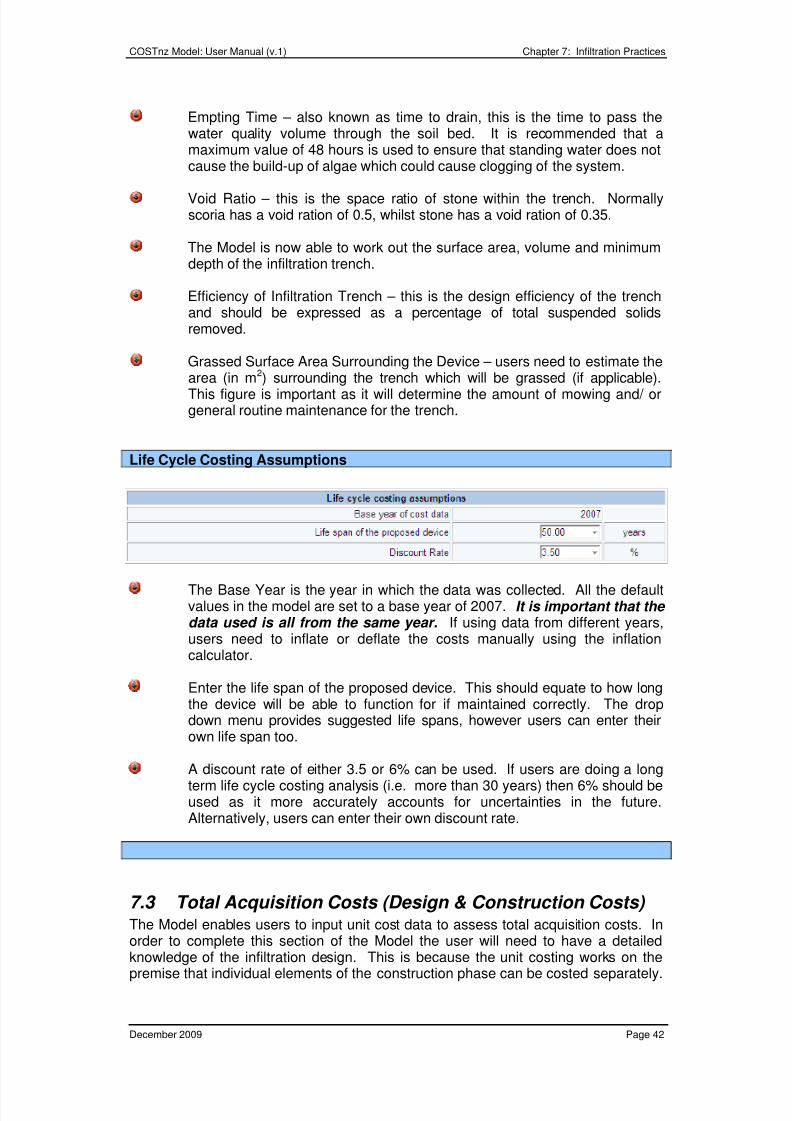
8/3/2019 New Zealand; Corrective Maintenance Costs for Green Infrastructure
http://slidepdf.com/reader/full/new-zealand-corrective-maintenance-costs-for-green-infrastructure 47/79
COSTnz Model: User Manual (v.1) Chapter 7: Infiltration Practices
December 2009 Page 42
Empting Time – also known as time to drain, this is the time to pass thewater quality volume through the soil bed. It is recommended that amaximum value of 48 hours is used to ensure that standing water does notcause the build-up of algae which could cause clogging of the system.
Void Ratio – this is the space ratio of stone within the trench. Normallyscoria has a void ration of 0.5, whilst stone has a void ration of 0.35.
The Model is now able to work out the surface area, volume and minimumdepth of the infiltration trench.
Efficiency of Infiltration Trench – this is the design efficiency of the trenchand should be expressed as a percentage of total suspended solidsremoved.
Grassed Surface Area Surrounding the Device – users need to estimate the
area (in m2
) surrounding the trench which will be grassed (if applicable).This figure is important as it will determine the amount of mowing and/ orgeneral routine maintenance for the trench.
Life Cycle Costing Assumptions
The Base Year is the year in which the data was collected. All the defaultvalues in the model are set to a base year of 2007. It is important that the data used is all from the same year. If using data from different years,users need to inflate or deflate the costs manually using the inflationcalculator.
Enter the life span of the proposed device. This should equate to how longthe device will be able to function for if maintained correctly. The dropdown menu provides suggested life spans, however users can enter theirown life span too.
A discount rate of either 3.5 or 6% can be used. If users are doing a longterm life cycle costing analysis (i.e. more than 30 years) then 6% should beused as it more accurately accounts for uncertainties in the future.Alternatively, users can enter their own discount rate.
7.3 Total Acquisition Costs (Design & Construction Costs) The Model enables users to input unit cost data to assess total acquisition costs. Inorder to complete this section of the Model the user will need to have a detailed
knowledge of the infiltration design. This is because the unit costing works on thepremise that individual elements of the construction phase can be costed separately.
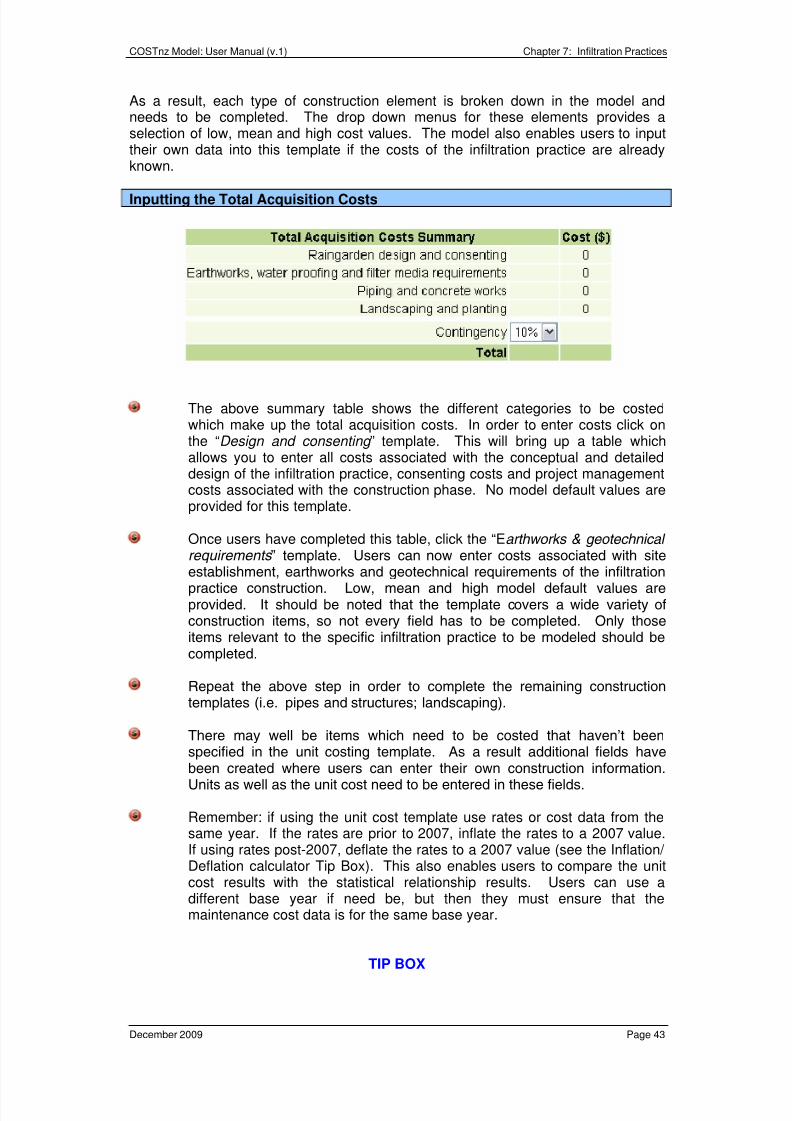
8/3/2019 New Zealand; Corrective Maintenance Costs for Green Infrastructure
http://slidepdf.com/reader/full/new-zealand-corrective-maintenance-costs-for-green-infrastructure 48/79
COSTnz Model: User Manual (v.1) Chapter 7: Infiltration Practices
December 2009 Page 43
As a result, each type of construction element is broken down in the model andneeds to be completed. The drop down menus for these elements provides aselection of low, mean and high cost values. The model also enables users to inputtheir own data into this template if the costs of the infiltration practice are alreadyknown.
Inputting the Total Acquisition Costs
The above summary table shows the different categories to be costedwhich make up the total acquisition costs. In order to enter costs click onthe “Design and consenting ” template. This will bring up a table whichallows you to enter all costs associated with the conceptual and detaileddesign of the infiltration practice, consenting costs and project managementcosts associated with the construction phase. No model default values areprovided for this template.
Once users have completed this table, click the “Earthworks & geotechnical requirements ” template. Users can now enter costs associated with site
establishment, earthworks and geotechnical requirements of the infiltrationpractice construction. Low, mean and high model default values areprovided. It should be noted that the template covers a wide variety ofconstruction items, so not every field has to be completed. Only thoseitems relevant to the specific infiltration practice to be modeled should becompleted.
Repeat the above step in order to complete the remaining constructiontemplates (i.e. pipes and structures; landscaping).
There may well be items which need to be costed that haven’t beenspecified in the unit costing template. As a result additional fields have
been created where users can enter their own construction information.Units as well as the unit cost need to be entered in these fields.
Remember: if using the unit cost template use rates or cost data from thesame year. If the rates are prior to 2007, inflate the rates to a 2007 value.If using rates post-2007, deflate the rates to a 2007 value (see the Inflation/ Deflation calculator Tip Box). This also enables users to compare the unitcost results with the statistical relationship results. Users can use adifferent base year if need be, but then they must ensure that themaintenance cost data is for the same base year.
TIP BOX
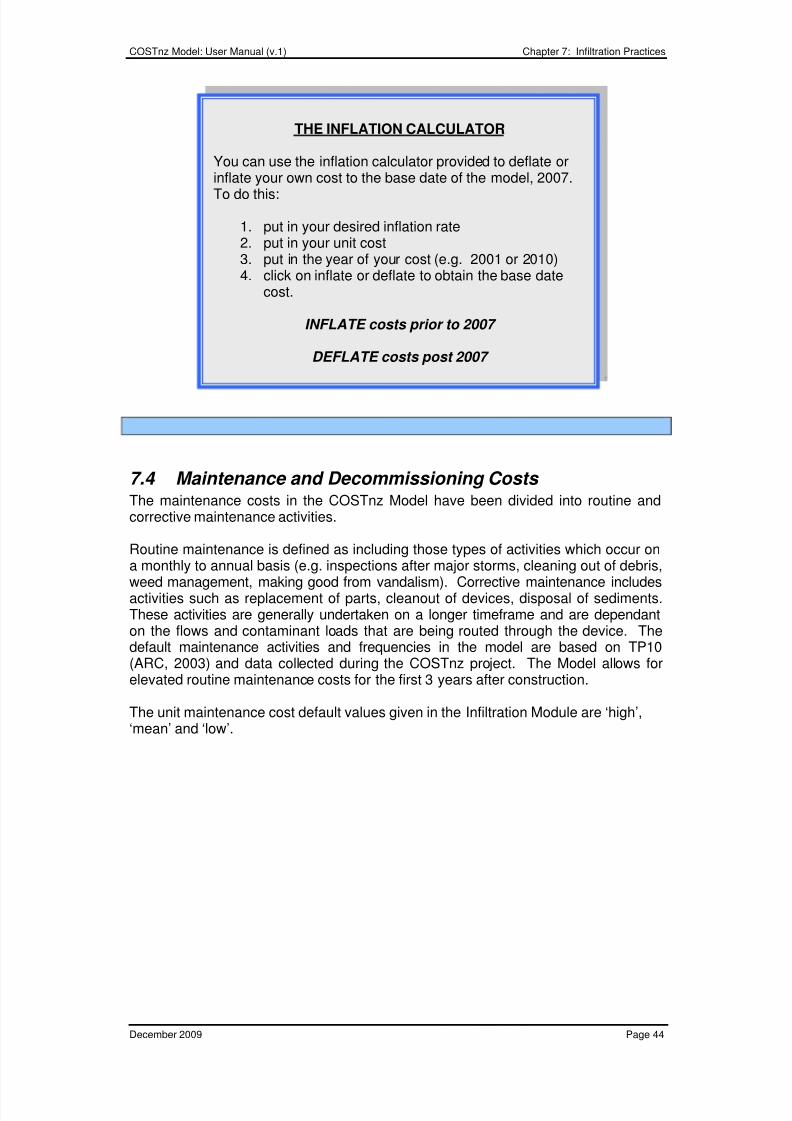
8/3/2019 New Zealand; Corrective Maintenance Costs for Green Infrastructure
http://slidepdf.com/reader/full/new-zealand-corrective-maintenance-costs-for-green-infrastructure 49/79
COSTnz Model: User Manual (v.1) Chapter 7: Infiltration Practices
December 2009 Page 44
7.4 Maintenance and Decommissioning Costs The maintenance costs in the COSTnz Model have been divided into routine andcorrective maintenance activities.
Routine maintenance is defined as including those types of activities which occur ona monthly to annual basis (e.g. inspections after major storms, cleaning out of debris,weed management, making good from vandalism). Corrective maintenance includesactivities such as replacement of parts, cleanout of devices, disposal of sediments.These activities are generally undertaken on a longer timeframe and are dependanton the flows and contaminant loads that are being routed through the device. Thedefault maintenance activities and frequencies in the model are based on TP10(ARC, 2003) and data collected during the COSTnz project. The Model allows forelevated routine maintenance costs for the first 3 years after construction.
The unit maintenance cost default values given in the Infiltration Module are ‘high’,‘mean’ and ‘low’.
THE INFLATION CALCULATOR
You can use the inflation calculator provided to deflate orinflate your own cost to the base date of the model, 2007.
To do this:
1. put in your desired inflation rate2. put in your unit cost3. put in the year of your cost (e.g. 2001 or 2010)4. click on inflate or deflate to obtain the base date
cost.
INFLATE costs prior to 2007
DEFLATE costs post 2007
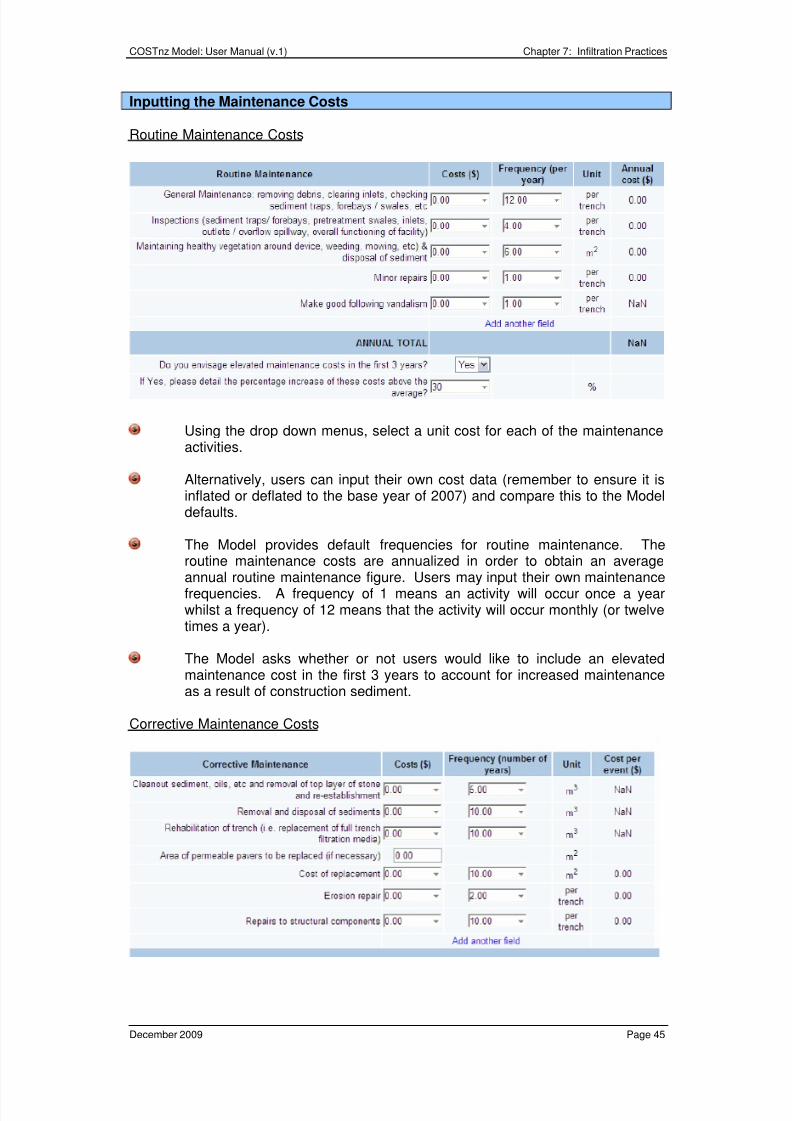
8/3/2019 New Zealand; Corrective Maintenance Costs for Green Infrastructure
http://slidepdf.com/reader/full/new-zealand-corrective-maintenance-costs-for-green-infrastructure 50/79
COSTnz Model: User Manual (v.1) Chapter 7: Infiltration Practices
December 2009 Page 45
Inputting the Maintenance Costs
Routine Maintenance Costs
Using the drop down menus, select a unit cost for each of the maintenanceactivities.
Alternatively, users can input their own cost data (remember to ensure it isinflated or deflated to the base year of 2007) and compare this to the Modeldefaults.
The Model provides default frequencies for routine maintenance. Theroutine maintenance costs are annualized in order to obtain an average
annual routine maintenance figure. Users may input their own maintenancefrequencies. A frequency of 1 means an activity will occur once a yearwhilst a frequency of 12 means that the activity will occur monthly (or twelvetimes a year).
The Model asks whether or not users would like to include an elevatedmaintenance cost in the first 3 years to account for increased maintenanceas a result of construction sediment.
Corrective Maintenance Costs
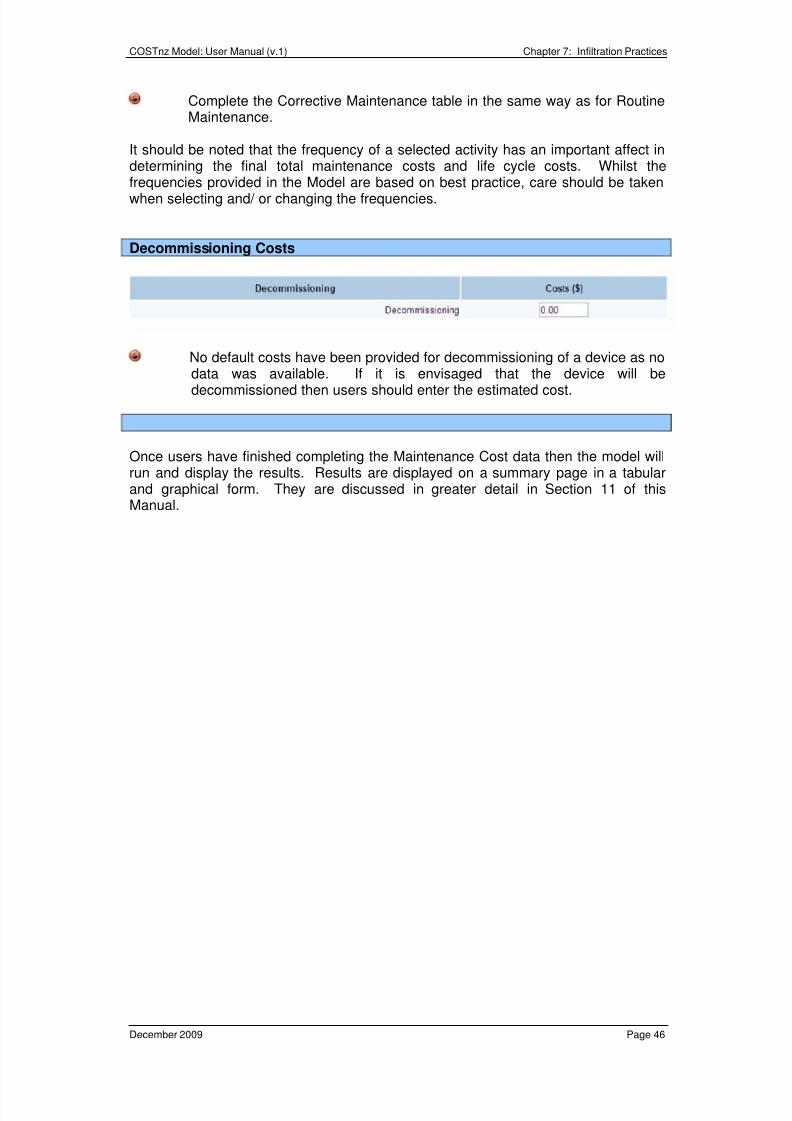
8/3/2019 New Zealand; Corrective Maintenance Costs for Green Infrastructure
http://slidepdf.com/reader/full/new-zealand-corrective-maintenance-costs-for-green-infrastructure 51/79
COSTnz Model: User Manual (v.1) Chapter 7: Infiltration Practices
December 2009 Page 46
Complete the Corrective Maintenance table in the same way as for RoutineMaintenance.
It should be noted that the frequency of a selected activity has an important affect indetermining the final total maintenance costs and life cycle costs. Whilst thefrequencies provided in the Model are based on best practice, care should be takenwhen selecting and/ or changing the frequencies.
Decommissioning Costs
No default costs have been provided for decommissioning of a device as nodata was available. If it is envisaged that the device will bedecommissioned then users should enter the estimated cost.
Once users have finished completing the Maintenance Cost data then the model willrun and display the results. Results are displayed on a summary page in a tabularand graphical form. They are discussed in greater detail in Section 11 of thisManual.
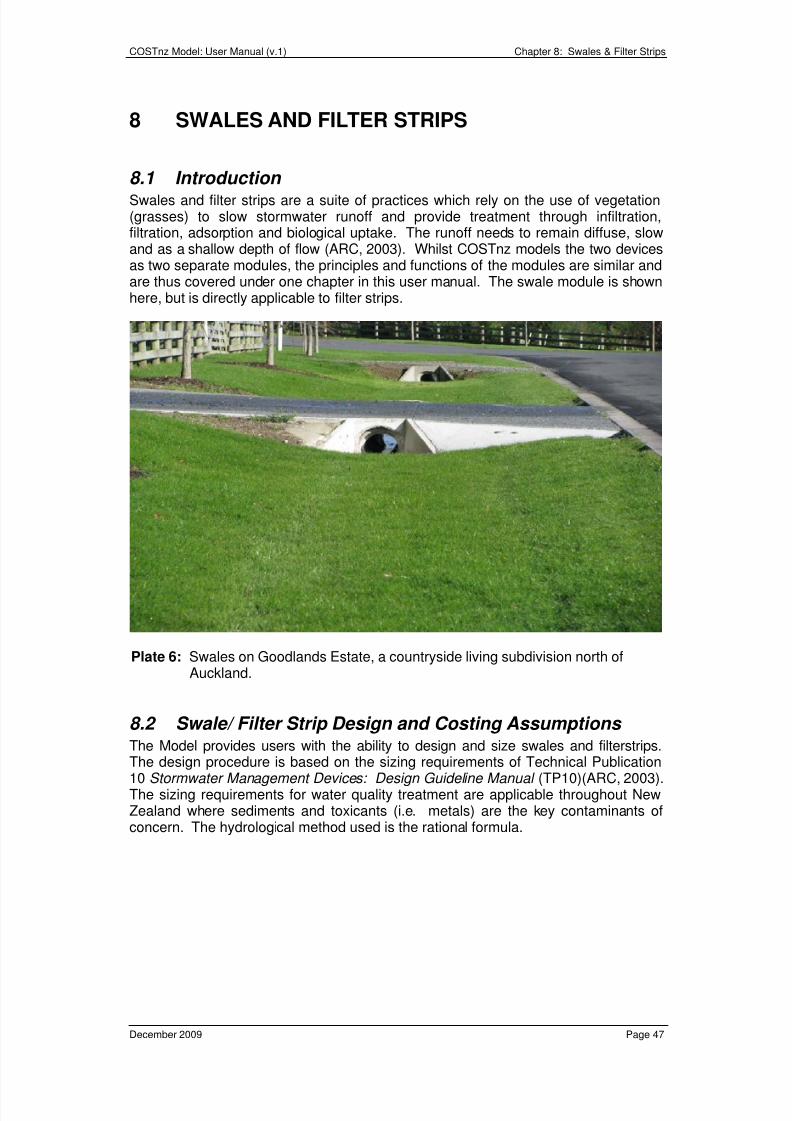
8/3/2019 New Zealand; Corrective Maintenance Costs for Green Infrastructure
http://slidepdf.com/reader/full/new-zealand-corrective-maintenance-costs-for-green-infrastructure 52/79
COSTnz Model: User Manual (v.1) Chapter 8: Swales & Filter Strips
December 2009 Page 47
8 SWALES AND FILTER STRIPS
8.1 Introduction Swales and filter strips are a suite of practices which rely on the use of vegetation(grasses) to slow stormwater runoff and provide treatment through infiltration,filtration, adsorption and biological uptake. The runoff needs to remain diffuse, slowand as a shallow depth of flow (ARC, 2003). Whilst COSTnz models the two devicesas two separate modules, the principles and functions of the modules are similar andare thus covered under one chapter in this user manual. The swale module is shownhere, but is directly applicable to filter strips.
Plate 6: Swales on Goodlands Estate, a countryside living subdivision north ofAuckland.
8.2 Swale/ Filter Strip Design and Costing Assumptions The Model provides users with the ability to design and size swales and filterstrips.
The design procedure is based on the sizing requirements of Technical Publication10 Stormwater Management Devices: Design Guideline Manual (TP10)(ARC, 2003).The sizing requirements for water quality treatment are applicable throughout NewZealand where sediments and toxicants (i.e. metals) are the key contaminants ofconcern. The hydrological method used is the rational formula.
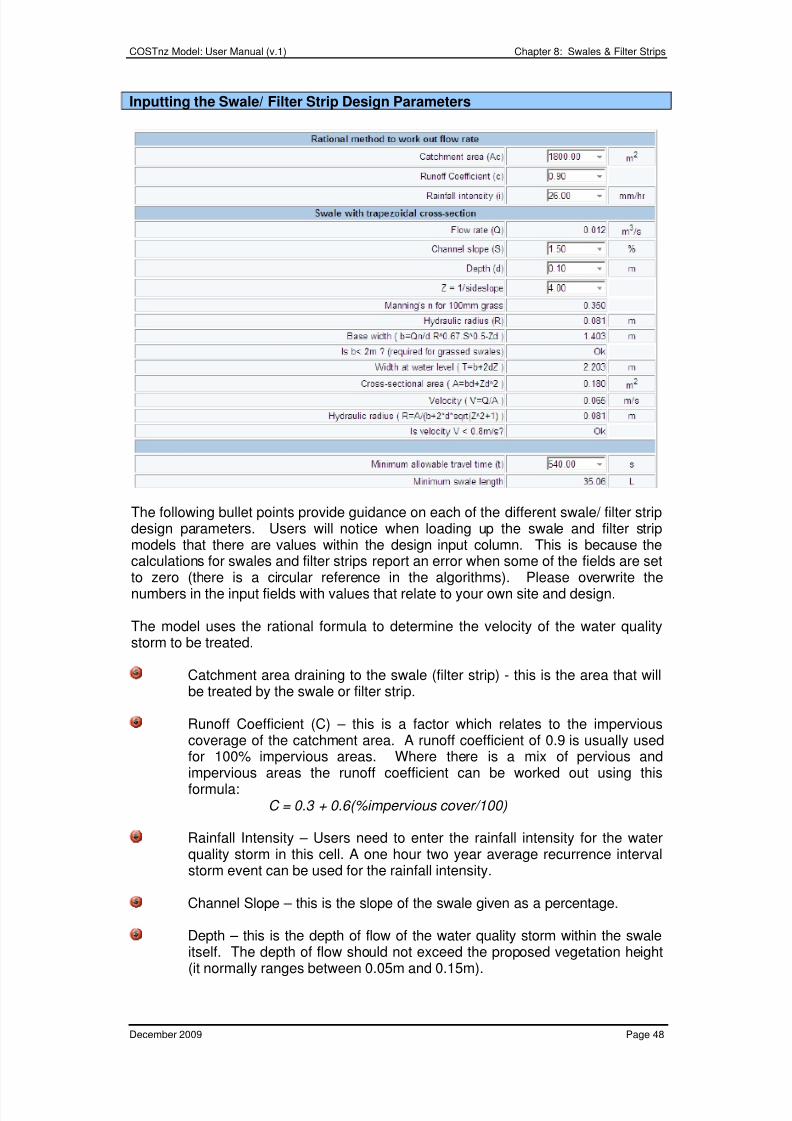
8/3/2019 New Zealand; Corrective Maintenance Costs for Green Infrastructure
http://slidepdf.com/reader/full/new-zealand-corrective-maintenance-costs-for-green-infrastructure 53/79
COSTnz Model: User Manual (v.1) Chapter 8: Swales & Filter Strips
December 2009 Page 48
Inputting the Swale/ Filter Strip Design Parameters
The following bullet points provide guidance on each of the different swale/ filter stripdesign parameters. Users will notice when loading up the swale and filter stripmodels that there are values within the design input column. This is because thecalculations for swales and filter strips report an error when some of the fields are set
to zero (there is a circular reference in the algorithms). Please overwrite thenumbers in the input fields with values that relate to your own site and design.
The model uses the rational formula to determine the velocity of the water qualitystorm to be treated.
Catchment area draining to the swale (filter strip) - this is the area that willbe treated by the swale or filter strip.
Runoff Coefficient (C) – this is a factor which relates to the imperviouscoverage of the catchment area. A runoff coefficient of 0.9 is usually usedfor 100% impervious areas. Where there is a mix of pervious andimpervious areas the runoff coefficient can be worked out using thisformula:
C = 0.3 + 0.6(%impervious cover/100)
Rainfall Intensity – Users need to enter the rainfall intensity for the waterquality storm in this cell. A one hour two year average recurrence intervalstorm event can be used for the rainfall intensity.
Channel Slope – this is the slope of the swale given as a percentage.
Depth – this is the depth of flow of the water quality storm within the swale
itself. The depth of flow should not exceed the proposed vegetation height(it normally ranges between 0.05m and 0.15m).
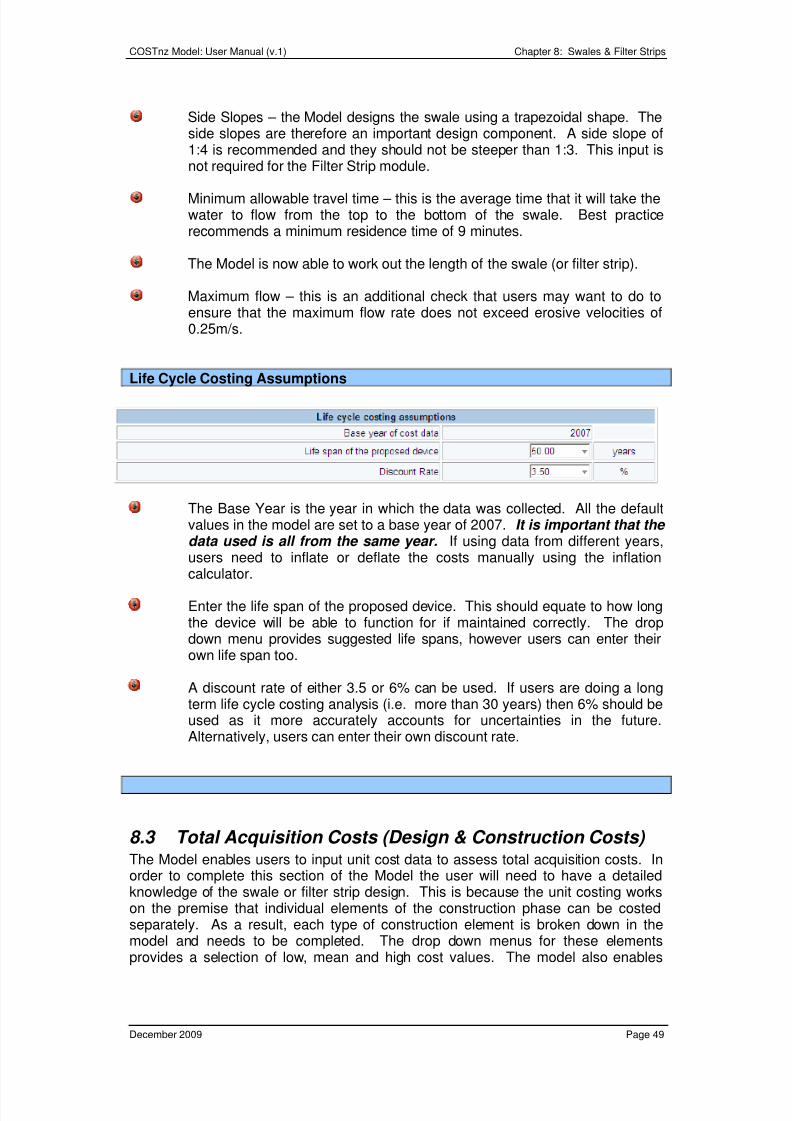
8/3/2019 New Zealand; Corrective Maintenance Costs for Green Infrastructure
http://slidepdf.com/reader/full/new-zealand-corrective-maintenance-costs-for-green-infrastructure 54/79
COSTnz Model: User Manual (v.1) Chapter 8: Swales & Filter Strips
December 2009 Page 49
Side Slopes – the Model designs the swale using a trapezoidal shape. Theside slopes are therefore an important design component. A side slope of1:4 is recommended and they should not be steeper than 1:3. This input isnot required for the Filter Strip module.
Minimum allowable travel time – this is the average time that it will take thewater to flow from the top to the bottom of the swale. Best practicerecommends a minimum residence time of 9 minutes.
The Model is now able to work out the length of the swale (or filter strip).
Maximum flow – this is an additional check that users may want to do toensure that the maximum flow rate does not exceed erosive velocities of0.25m/s.
Life Cycle Costing Assumptions
The Base Year is the year in which the data was collected. All the defaultvalues in the model are set to a base year of 2007. It is important that the data used is all from the same year. If using data from different years,users need to inflate or deflate the costs manually using the inflation
calculator.
Enter the life span of the proposed device. This should equate to how longthe device will be able to function for if maintained correctly. The dropdown menu provides suggested life spans, however users can enter theirown life span too.
A discount rate of either 3.5 or 6% can be used. If users are doing a longterm life cycle costing analysis (i.e. more than 30 years) then 6% should beused as it more accurately accounts for uncertainties in the future.Alternatively, users can enter their own discount rate.
8.3 Total Acquisition Costs (Design & Construction Costs) The Model enables users to input unit cost data to assess total acquisition costs. Inorder to complete this section of the Model the user will need to have a detailedknowledge of the swale or filter strip design. This is because the unit costing workson the premise that individual elements of the construction phase can be costedseparately. As a result, each type of construction element is broken down in themodel and needs to be completed. The drop down menus for these elements
provides a selection of low, mean and high cost values. The model also enables

8/3/2019 New Zealand; Corrective Maintenance Costs for Green Infrastructure
http://slidepdf.com/reader/full/new-zealand-corrective-maintenance-costs-for-green-infrastructure 55/79
COSTnz Model: User Manual (v.1) Chapter 8: Swales & Filter Strips
December 2009 Page 50
users to input their own data into this template if the costs of the swale or filter stripare already known.
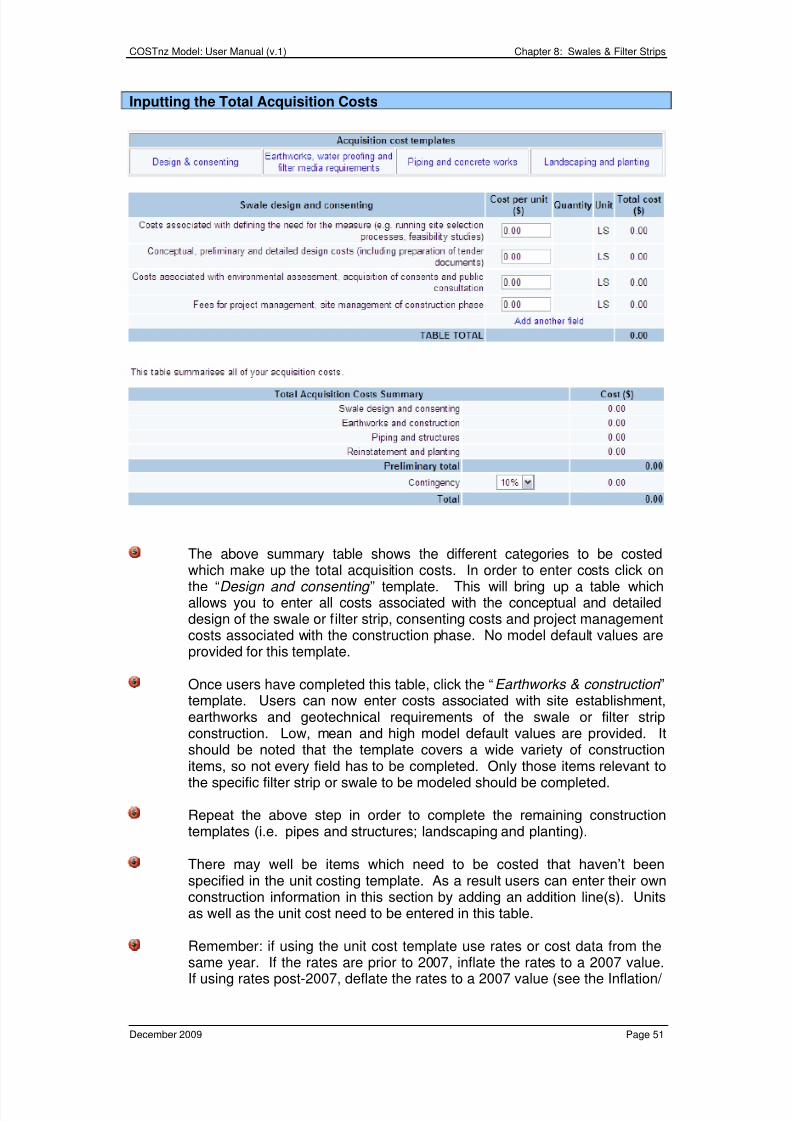
8/3/2019 New Zealand; Corrective Maintenance Costs for Green Infrastructure
http://slidepdf.com/reader/full/new-zealand-corrective-maintenance-costs-for-green-infrastructure 56/79
COSTnz Model: User Manual (v.1) Chapter 8: Swales & Filter Strips
December 2009 Page 51
Inputting the Total Acquisition Costs
The above summary table shows the different categories to be costed
which make up the total acquisition costs. In order to enter costs click onthe “Design and consenting ” template. This will bring up a table whichallows you to enter all costs associated with the conceptual and detaileddesign of the swale or filter strip, consenting costs and project managementcosts associated with the construction phase. No model default values areprovided for this template.
Once users have completed this table, click the “Earthworks & construction ”template. Users can now enter costs associated with site establishment,earthworks and geotechnical requirements of the swale or filter stripconstruction. Low, mean and high model default values are provided. Itshould be noted that the template covers a wide variety of construction
items, so not every field has to be completed. Only those items relevant tothe specific filter strip or swale to be modeled should be completed.
Repeat the above step in order to complete the remaining constructiontemplates (i.e. pipes and structures; landscaping and planting).
There may well be items which need to be costed that haven’t beenspecified in the unit costing template. As a result users can enter their ownconstruction information in this section by adding an addition line(s). Unitsas well as the unit cost need to be entered in this table.
Remember: if using the unit cost template use rates or cost data from thesame year. If the rates are prior to 2007, inflate the rates to a 2007 value.If using rates post-2007, deflate the rates to a 2007 value (see the Inflation/
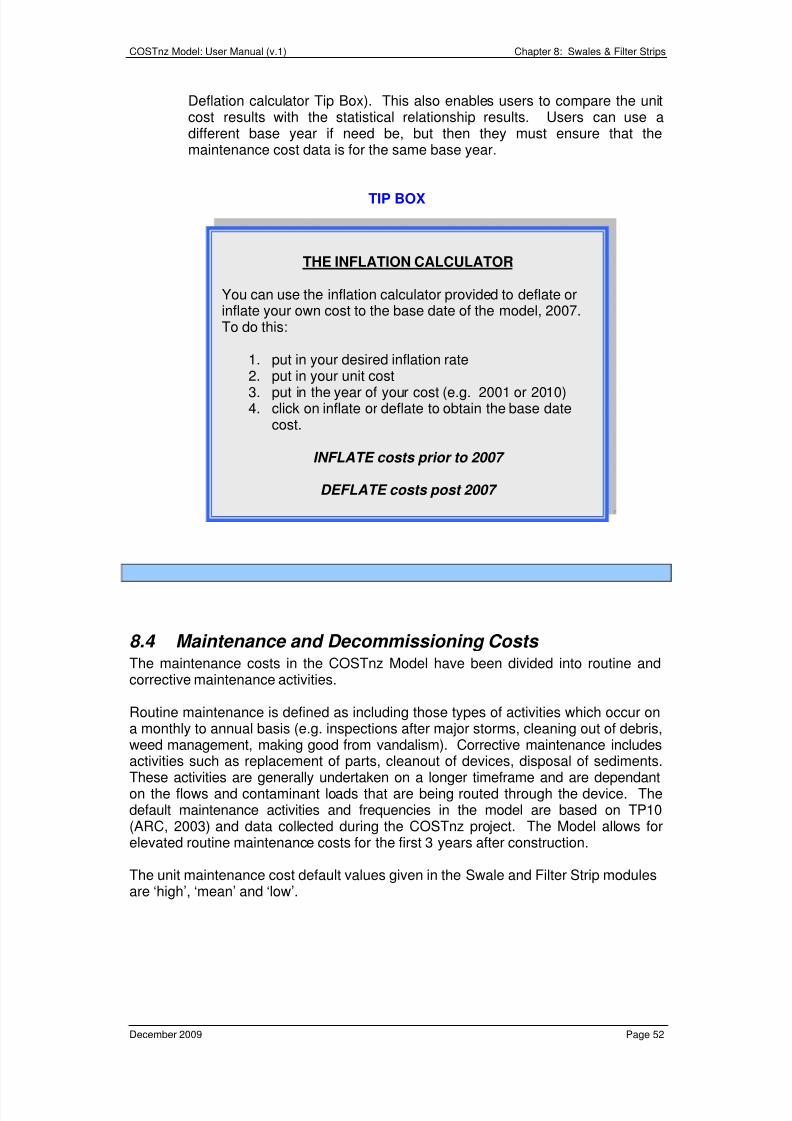
8/3/2019 New Zealand; Corrective Maintenance Costs for Green Infrastructure
http://slidepdf.com/reader/full/new-zealand-corrective-maintenance-costs-for-green-infrastructure 57/79
COSTnz Model: User Manual (v.1) Chapter 8: Swales & Filter Strips
December 2009 Page 52
Deflation calculator Tip Box). This also enables users to compare the unitcost results with the statistical relationship results. Users can use adifferent base year if need be, but then they must ensure that themaintenance cost data is for the same base year.
TIP BOX
8.4 Maintenance and Decommissioning Costs The maintenance costs in the COSTnz Model have been divided into routine andcorrective maintenance activities.
Routine maintenance is defined as including those types of activities which occur ona monthly to annual basis (e.g. inspections after major storms, cleaning out of debris,weed management, making good from vandalism). Corrective maintenance includes
activities such as replacement of parts, cleanout of devices, disposal of sediments.These activities are generally undertaken on a longer timeframe and are dependanton the flows and contaminant loads that are being routed through the device. Thedefault maintenance activities and frequencies in the model are based on TP10(ARC, 2003) and data collected during the COSTnz project. The Model allows forelevated routine maintenance costs for the first 3 years after construction.
The unit maintenance cost default values given in the Swale and Filter Strip modulesare ‘high’, ‘mean’ and ‘low’.
THE INFLATION CALCULATOR
You can use the inflation calculator provided to deflate orinflate your own cost to the base date of the model, 2007.To do this:
1. put in your desired inflation rate
2. put in your unit cost3. put in the year of your cost (e.g. 2001 or 2010)4. click on inflate or deflate to obtain the base date
cost.
INFLATE costs prior to 2007
DEFLATE costs post 2007
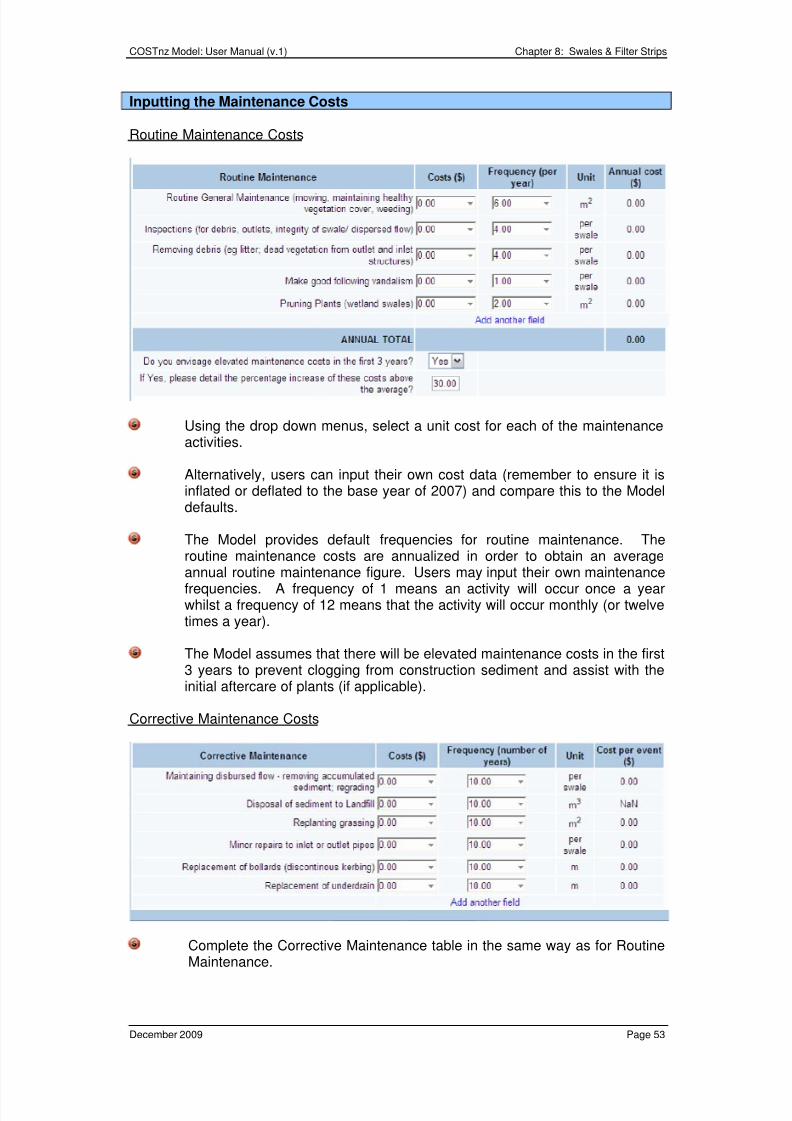
8/3/2019 New Zealand; Corrective Maintenance Costs for Green Infrastructure
http://slidepdf.com/reader/full/new-zealand-corrective-maintenance-costs-for-green-infrastructure 58/79
COSTnz Model: User Manual (v.1) Chapter 8: Swales & Filter Strips
December 2009 Page 53
Inputting the Maintenance Costs
Routine Maintenance Costs
Using the drop down menus, select a unit cost for each of the maintenanceactivities.
Alternatively, users can input their own cost data (remember to ensure it isinflated or deflated to the base year of 2007) and compare this to the Modeldefaults.
The Model provides default frequencies for routine maintenance. Theroutine maintenance costs are annualized in order to obtain an average
annual routine maintenance figure. Users may input their own maintenancefrequencies. A frequency of 1 means an activity will occur once a yearwhilst a frequency of 12 means that the activity will occur monthly (or twelvetimes a year).
The Model assumes that there will be elevated maintenance costs in the first3 years to prevent clogging from construction sediment and assist with theinitial aftercare of plants (if applicable).
Corrective Maintenance Costs
Complete the Corrective Maintenance table in the same way as for RoutineMaintenance.
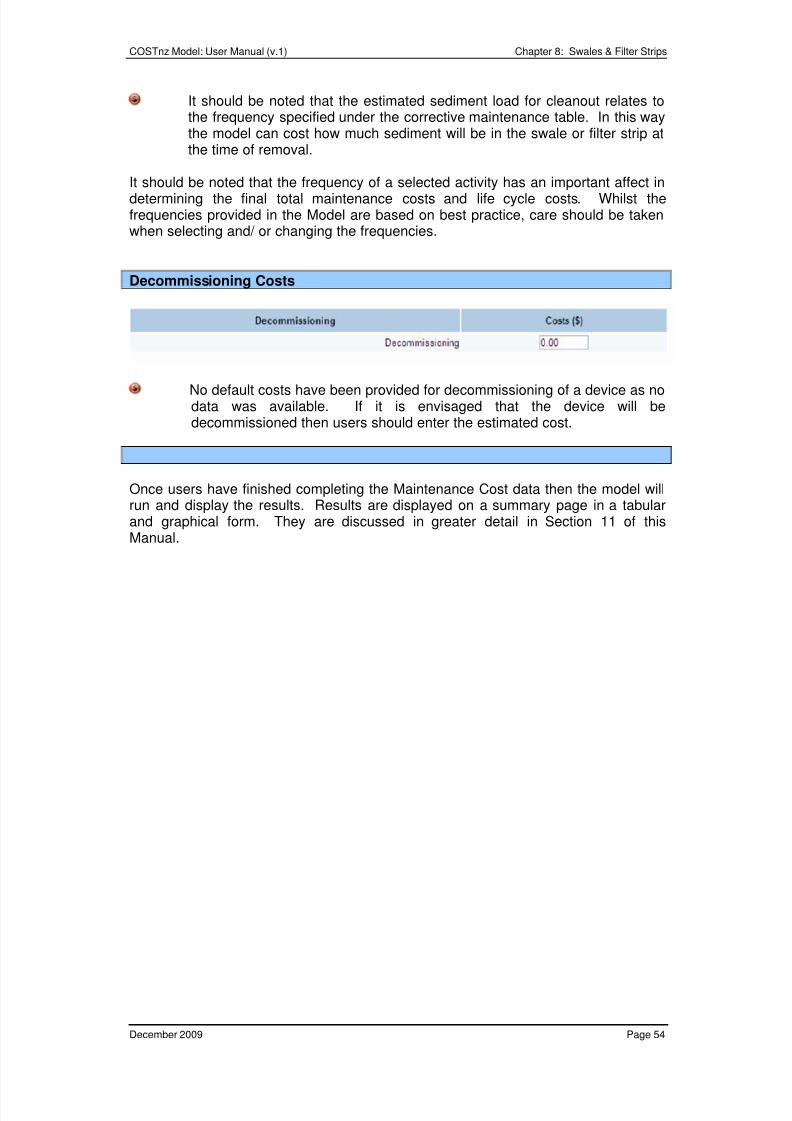
8/3/2019 New Zealand; Corrective Maintenance Costs for Green Infrastructure
http://slidepdf.com/reader/full/new-zealand-corrective-maintenance-costs-for-green-infrastructure 59/79
COSTnz Model: User Manual (v.1) Chapter 8: Swales & Filter Strips
December 2009 Page 54
It should be noted that the estimated sediment load for cleanout relates tothe frequency specified under the corrective maintenance table. In this waythe model can cost how much sediment will be in the swale or filter strip atthe time of removal.
It should be noted that the frequency of a selected activity has an important affect indetermining the final total maintenance costs and life cycle costs. Whilst thefrequencies provided in the Model are based on best practice, care should be takenwhen selecting and/ or changing the frequencies.
Decommissioning Costs
No default costs have been provided for decommissioning of a device as nodata was available. If it is envisaged that the device will bedecommissioned then users should enter the estimated cost.
Once users have finished completing the Maintenance Cost data then the model willrun and display the results. Results are displayed on a summary page in a tabularand graphical form. They are discussed in greater detail in Section 11 of thisManual.
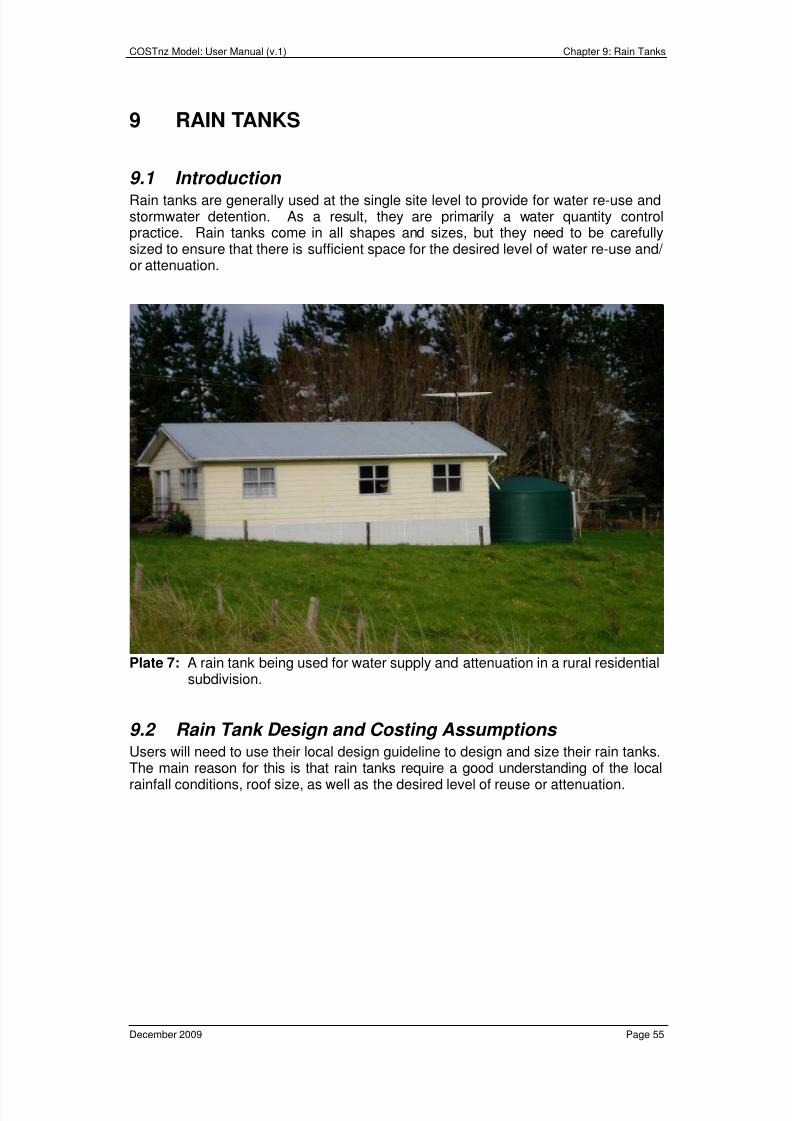
8/3/2019 New Zealand; Corrective Maintenance Costs for Green Infrastructure
http://slidepdf.com/reader/full/new-zealand-corrective-maintenance-costs-for-green-infrastructure 60/79
COSTnz Model: User Manual (v.1) Chapter 9: Rain Tanks
December 2009 Page 55
9 RAIN TANKS
9.1 Introduction Rain tanks are generally used at the single site level to provide for water re-use andstormwater detention. As a result, they are primarily a water quantity controlpractice. Rain tanks come in all shapes and sizes, but they need to be carefullysized to ensure that there is sufficient space for the desired level of water re-use and/ or attenuation.
Plate 7: A rain tank being used for water supply and attenuation in a rural residentialsubdivision.
9.2 Rain Tank Design and Costing Assumptions Users will need to use their local design guideline to design and size their rain tanks.
The main reason for this is that rain tanks require a good understanding of the localrainfall conditions, roof size, as well as the desired level of reuse or attenuation.
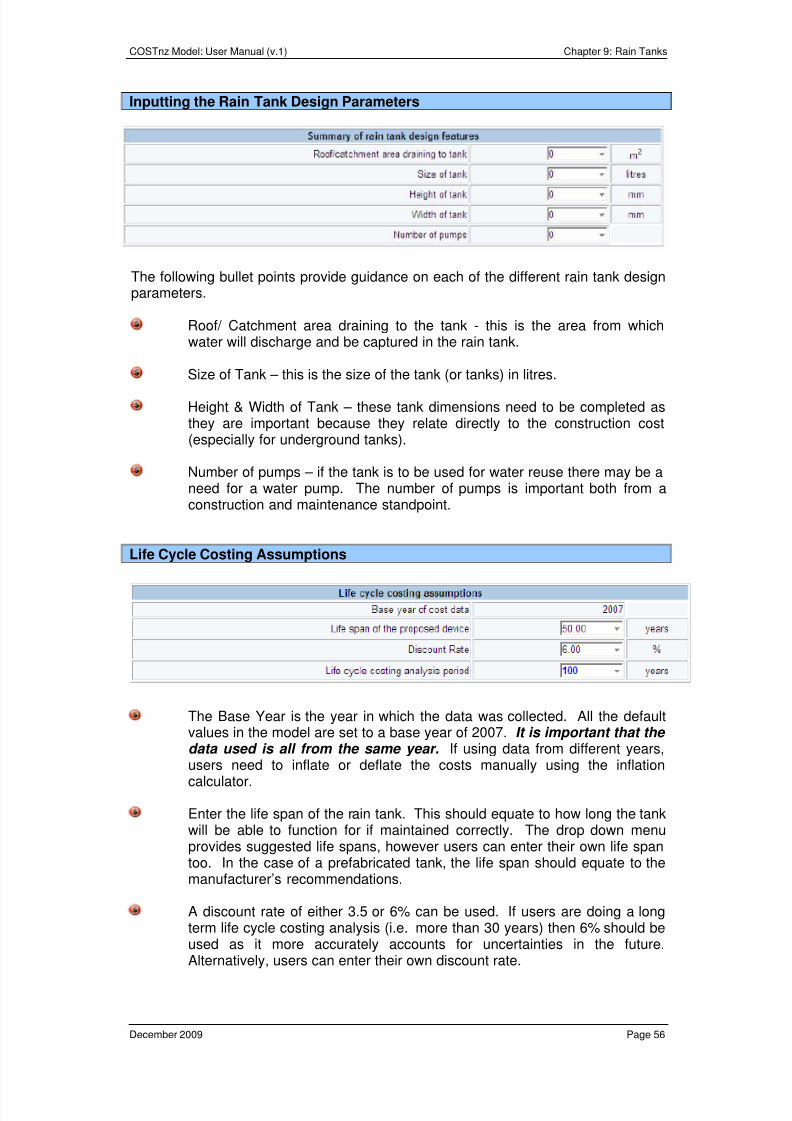
8/3/2019 New Zealand; Corrective Maintenance Costs for Green Infrastructure
http://slidepdf.com/reader/full/new-zealand-corrective-maintenance-costs-for-green-infrastructure 61/79
COSTnz Model: User Manual (v.1) Chapter 9: Rain Tanks
December 2009 Page 56
Inputting the Rain Tank Design Parameters
The following bullet points provide guidance on each of the different rain tank designparameters.
Roof/ Catchment area draining to the tank - this is the area from whichwater will discharge and be captured in the rain tank.
Size of Tank – this is the size of the tank (or tanks) in litres.
Height & Width of Tank – these tank dimensions need to be completed asthey are important because they relate directly to the construction cost(especially for underground tanks).
Number of pumps – if the tank is to be used for water reuse there may be aneed for a water pump. The number of pumps is important both from aconstruction and maintenance standpoint.
Life Cycle Costing Assumptions
The Base Year is the year in which the data was collected. All the defaultvalues in the model are set to a base year of 2007. It is important that the data used is all from the same year. If using data from different years,
users need to inflate or deflate the costs manually using the inflationcalculator.
Enter the life span of the rain tank. This should equate to how long the tankwill be able to function for if maintained correctly. The drop down menuprovides suggested life spans, however users can enter their own life spantoo. In the case of a prefabricated tank, the life span should equate to themanufacturer’s recommendations.
A discount rate of either 3.5 or 6% can be used. If users are doing a longterm life cycle costing analysis (i.e. more than 30 years) then 6% should beused as it more accurately accounts for uncertainties in the future.
Alternatively, users can enter their own discount rate.
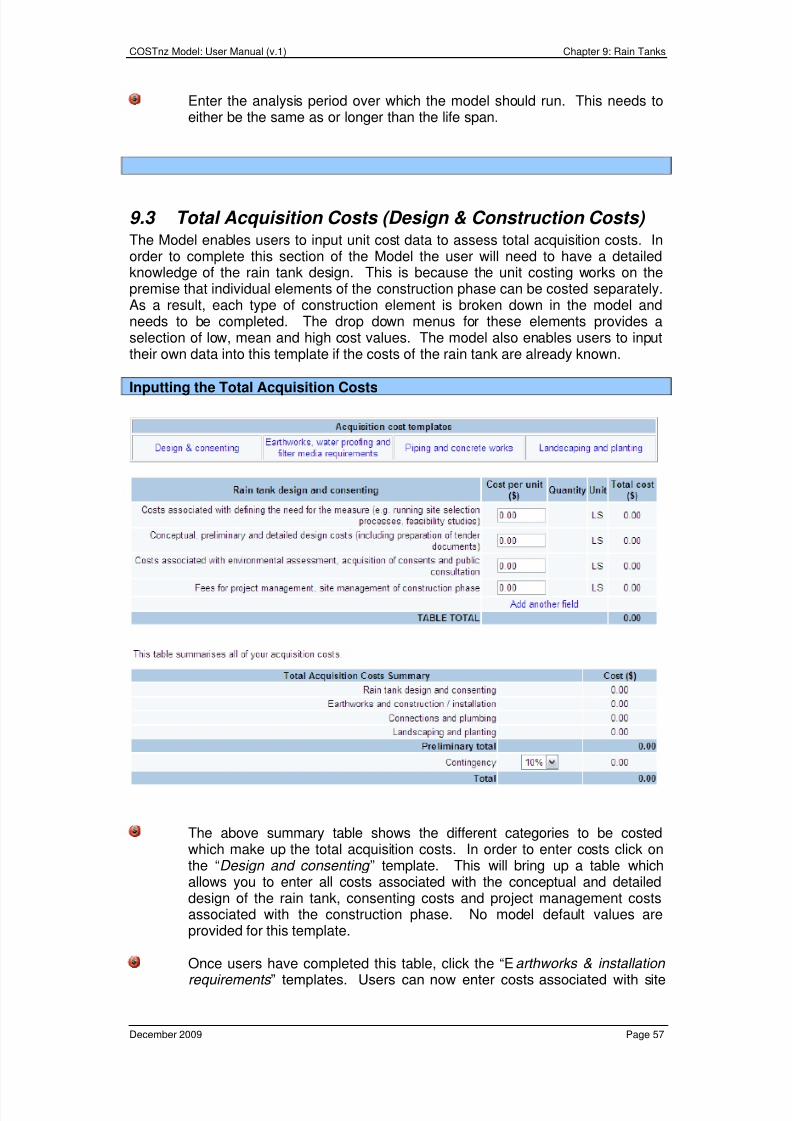
8/3/2019 New Zealand; Corrective Maintenance Costs for Green Infrastructure
http://slidepdf.com/reader/full/new-zealand-corrective-maintenance-costs-for-green-infrastructure 62/79
COSTnz Model: User Manual (v.1) Chapter 9: Rain Tanks
December 2009 Page 57
Enter the analysis period over which the model should run. This needs toeither be the same as or longer than the life span.
9.3 Total Acquisition Costs (Design & Construction Costs) The Model enables users to input unit cost data to assess total acquisition costs. Inorder to complete this section of the Model the user will need to have a detailedknowledge of the rain tank design. This is because the unit costing works on thepremise that individual elements of the construction phase can be costed separately.As a result, each type of construction element is broken down in the model andneeds to be completed. The drop down menus for these elements provides aselection of low, mean and high cost values. The model also enables users to inputtheir own data into this template if the costs of the rain tank are already known.
Inputting the Total Acquisition Costs
The above summary table shows the different categories to be costedwhich make up the total acquisition costs. In order to enter costs click onthe “Design and consenting ” template. This will bring up a table whichallows you to enter all costs associated with the conceptual and detaileddesign of the rain tank, consenting costs and project management costsassociated with the construction phase. No model default values areprovided for this template.
Once users have completed this table, click the “Earthworks & installation requirements ” templates. Users can now enter costs associated with site
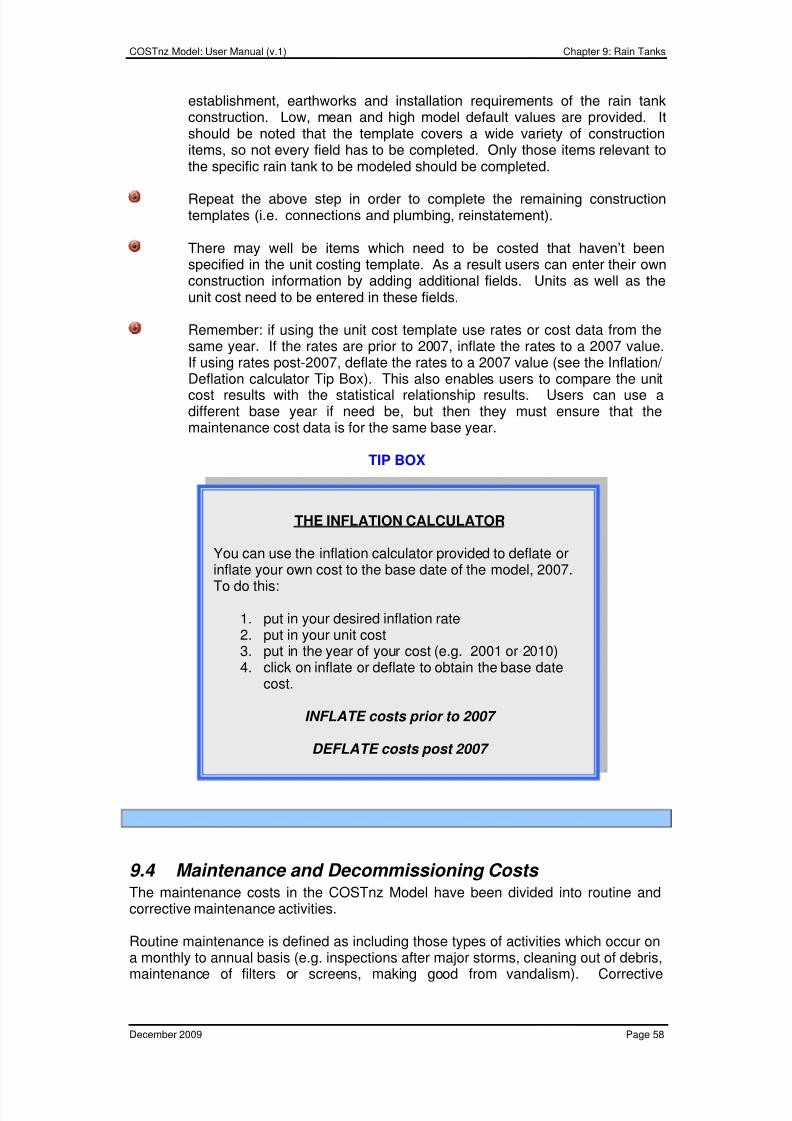
8/3/2019 New Zealand; Corrective Maintenance Costs for Green Infrastructure
http://slidepdf.com/reader/full/new-zealand-corrective-maintenance-costs-for-green-infrastructure 63/79
COSTnz Model: User Manual (v.1) Chapter 9: Rain Tanks
December 2009 Page 58
establishment, earthworks and installation requirements of the rain tankconstruction. Low, mean and high model default values are provided. Itshould be noted that the template covers a wide variety of constructionitems, so not every field has to be completed. Only those items relevant tothe specific rain tank to be modeled should be completed.
Repeat the above step in order to complete the remaining constructiontemplates (i.e. connections and plumbing, reinstatement).
There may well be items which need to be costed that haven’t beenspecified in the unit costing template. As a result users can enter their ownconstruction information by adding additional fields. Units as well as theunit cost need to be entered in these fields.
Remember: if using the unit cost template use rates or cost data from thesame year. If the rates are prior to 2007, inflate the rates to a 2007 value.If using rates post-2007, deflate the rates to a 2007 value (see the Inflation/
Deflation calculator Tip Box). This also enables users to compare the unitcost results with the statistical relationship results. Users can use adifferent base year if need be, but then they must ensure that themaintenance cost data is for the same base year.
TIP BOX
9.4 Maintenance and Decommissioning Costs The maintenance costs in the COSTnz Model have been divided into routine andcorrective maintenance activities.
Routine maintenance is defined as including those types of activities which occur on
a monthly to annual basis (e.g. inspections after major storms, cleaning out of debris,maintenance of filters or screens, making good from vandalism). Corrective
THE INFLATION CALCULATOR
You can use the inflation calculator provided to deflate or
inflate your own cost to the base date of the model, 2007.To do this:
1. put in your desired inflation rate2. put in your unit cost3. put in the year of your cost (e.g. 2001 or 2010)4. click on inflate or deflate to obtain the base date
cost.
INFLATE costs prior to 2007
DEFLATE costs post 2007
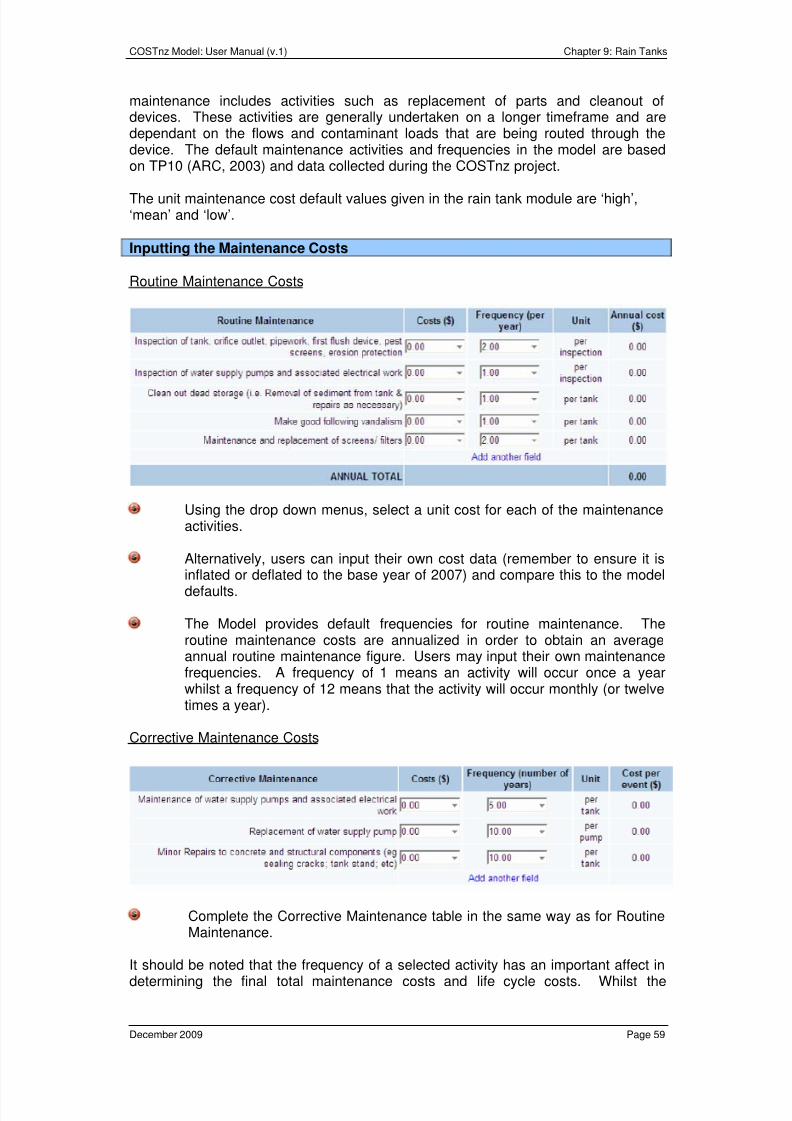
8/3/2019 New Zealand; Corrective Maintenance Costs for Green Infrastructure
http://slidepdf.com/reader/full/new-zealand-corrective-maintenance-costs-for-green-infrastructure 64/79
COSTnz Model: User Manual (v.1) Chapter 9: Rain Tanks
December 2009 Page 59
maintenance includes activities such as replacement of parts and cleanout ofdevices. These activities are generally undertaken on a longer timeframe and aredependant on the flows and contaminant loads that are being routed through thedevice. The default maintenance activities and frequencies in the model are basedon TP10 (ARC, 2003) and data collected during the COSTnz project.
The unit maintenance cost default values given in the rain tank module are ‘high’,‘mean’ and ‘low’.
Inputting the Maintenance Costs
Routine Maintenance Costs
Using the drop down menus, select a unit cost for each of the maintenanceactivities.
Alternatively, users can input their own cost data (remember to ensure it is
inflated or deflated to the base year of 2007) and compare this to the modeldefaults.
The Model provides default frequencies for routine maintenance. Theroutine maintenance costs are annualized in order to obtain an averageannual routine maintenance figure. Users may input their own maintenancefrequencies. A frequency of 1 means an activity will occur once a yearwhilst a frequency of 12 means that the activity will occur monthly (or twelvetimes a year).
Corrective Maintenance Costs
Complete the Corrective Maintenance table in the same way as for RoutineMaintenance.
It should be noted that the frequency of a selected activity has an important affect indetermining the final total maintenance costs and life cycle costs. Whilst the
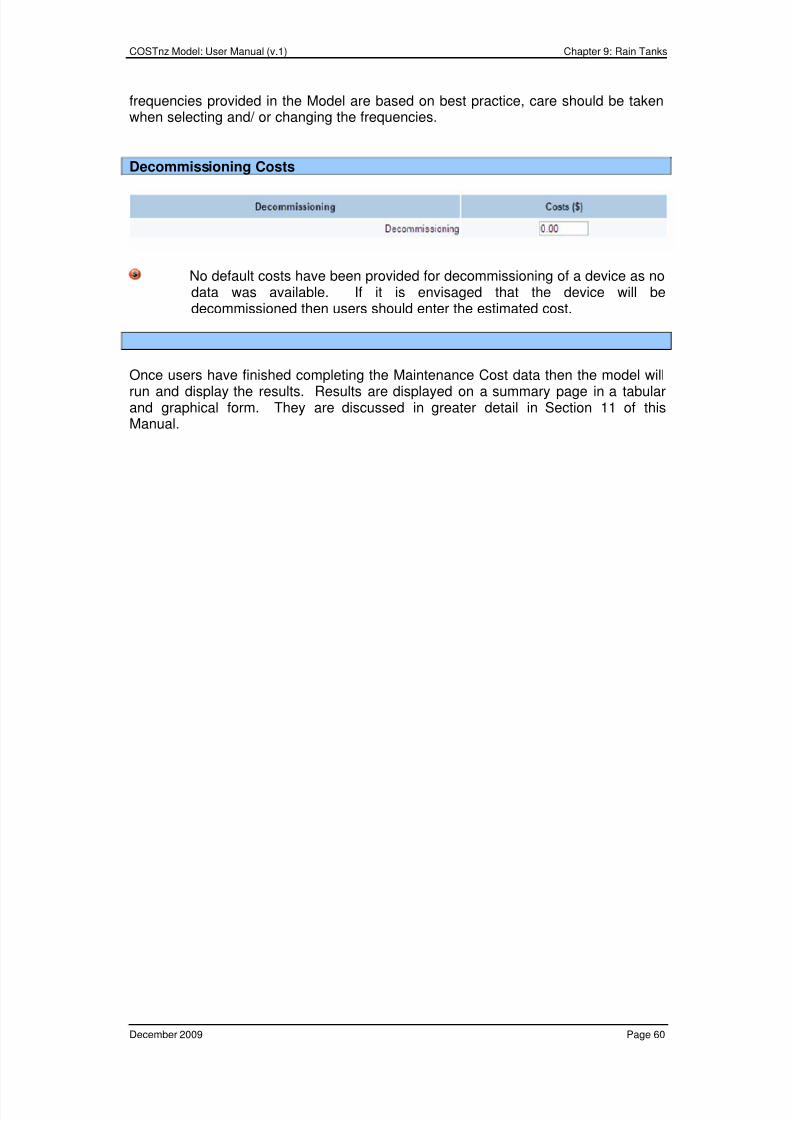
8/3/2019 New Zealand; Corrective Maintenance Costs for Green Infrastructure
http://slidepdf.com/reader/full/new-zealand-corrective-maintenance-costs-for-green-infrastructure 65/79
COSTnz Model: User Manual (v.1) Chapter 9: Rain Tanks
December 2009 Page 60
frequencies provided in the Model are based on best practice, care should be takenwhen selecting and/ or changing the frequencies.
Decommissioning Costs
No default costs have been provided for decommissioning of a device as nodata was available. If it is envisaged that the device will bedecommissioned then users should enter the estimated cost.
Once users have finished completing the Maintenance Cost data then the model willrun and display the results. Results are displayed on a summary page in a tabularand graphical form. They are discussed in greater detail in Section 11 of thisManual.
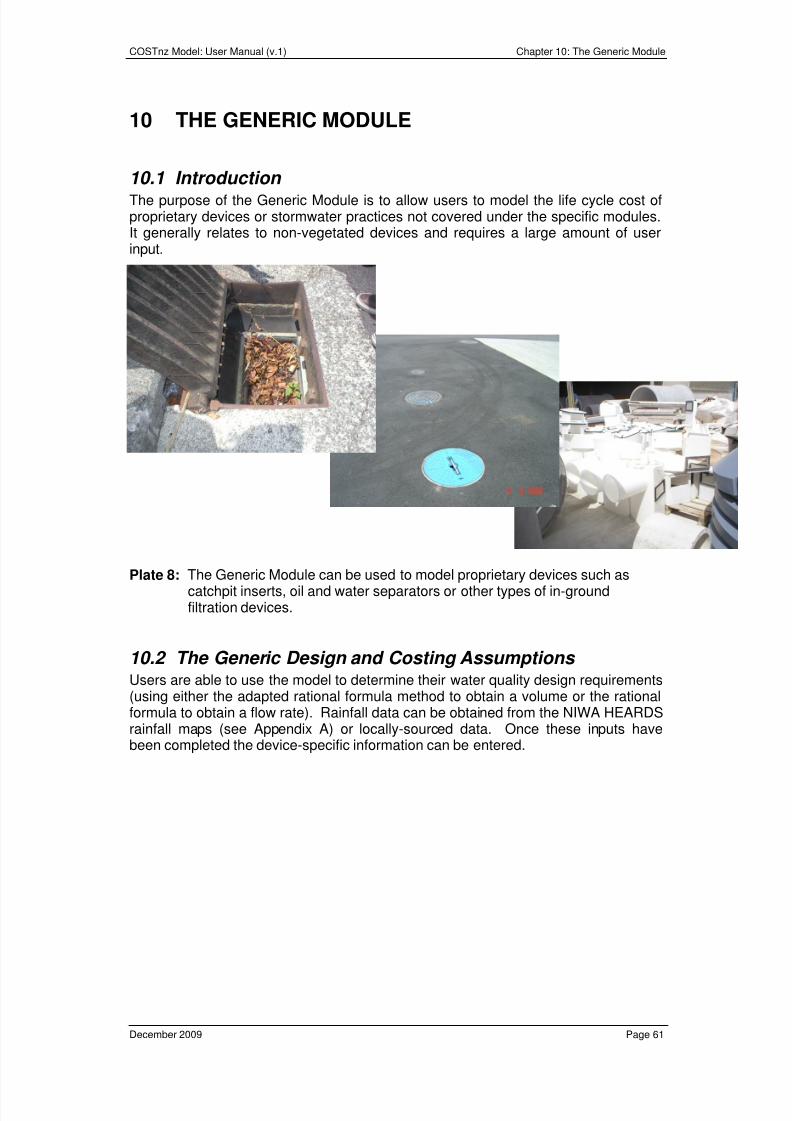
8/3/2019 New Zealand; Corrective Maintenance Costs for Green Infrastructure
http://slidepdf.com/reader/full/new-zealand-corrective-maintenance-costs-for-green-infrastructure 66/79
COSTnz Model: User Manual (v.1) Chapter 10: The Generic Module
December 2009 Page 61
10 THE GENERIC MODULE
10.1 Introduction The purpose of the Generic Module is to allow users to model the life cycle cost ofproprietary devices or stormwater practices not covered under the specific modules.It generally relates to non-vegetated devices and requires a large amount of userinput.
Plate 8: The Generic Module can be used to model proprietary devices such ascatchpit inserts, oil and water separators or other types of in-groundfiltration devices.
10.2 The Generic Design and Costing Assumptions Users are able to use the model to determine their water quality design requirements(using either the adapted rational formula method to obtain a volume or the rationalformula to obtain a flow rate). Rainfall data can be obtained from the NIWA HEARDSrainfall maps (see Appendix A) or locally-sourced data. Once these inputs havebeen completed the device-specific information can be entered.
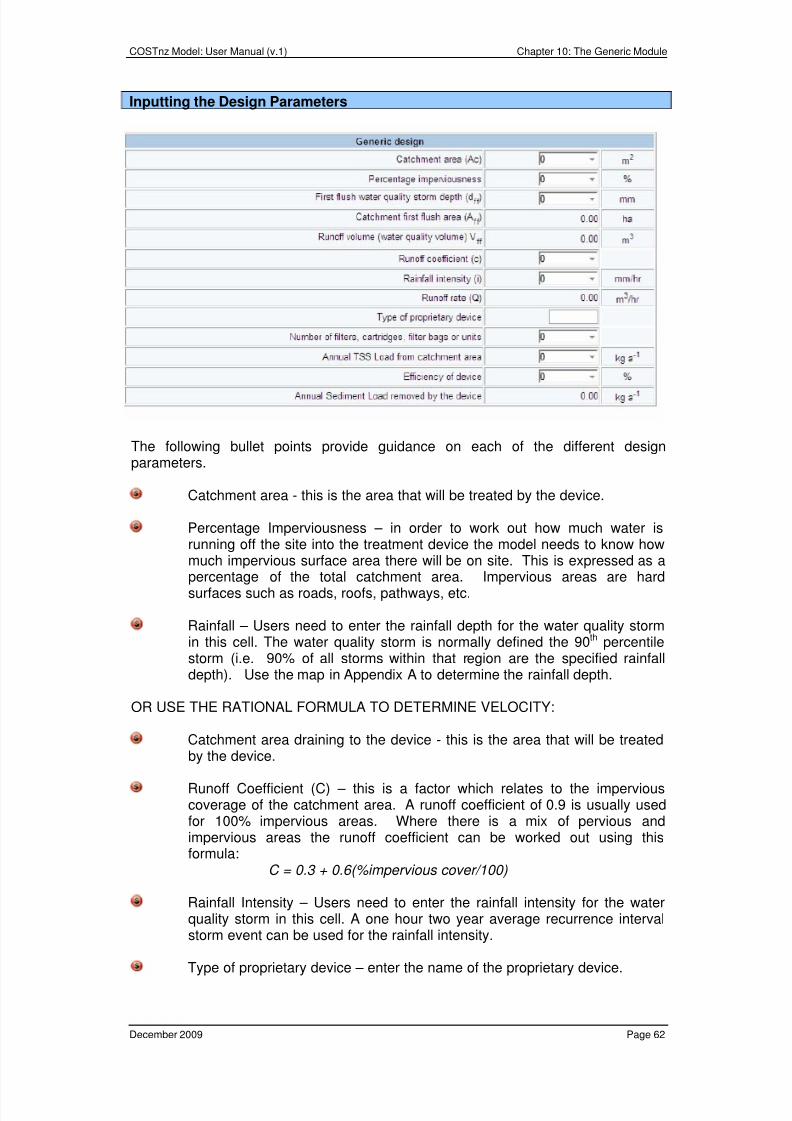
8/3/2019 New Zealand; Corrective Maintenance Costs for Green Infrastructure
http://slidepdf.com/reader/full/new-zealand-corrective-maintenance-costs-for-green-infrastructure 67/79
COSTnz Model: User Manual (v.1) Chapter 10: The Generic Module
December 2009 Page 62
Inputting the Design Parameters
The following bullet points provide guidance on each of the different designparameters.
Catchment area - this is the area that will be treated by the device.
Percentage Imperviousness – in order to work out how much water isrunning off the site into the treatment device the model needs to know howmuch impervious surface area there will be on site. This is expressed as a
percentage of the total catchment area. Impervious areas are hardsurfaces such as roads, roofs, pathways, etc.
Rainfall – Users need to enter the rainfall depth for the water quality stormin this cell. The water quality storm is normally defined the 90 th percentilestorm (i.e. 90% of all storms within that region are the specified rainfalldepth). Use the map in Appendix A to determine the rainfall depth.
OR USE THE RATIONAL FORMULA TO DETERMINE VELOCITY:
Catchment area draining to the device - this is the area that will be treatedby the device.
Runoff Coefficient (C) – this is a factor which relates to the imperviouscoverage of the catchment area. A runoff coefficient of 0.9 is usually usedfor 100% impervious areas. Where there is a mix of pervious andimpervious areas the runoff coefficient can be worked out using thisformula:
C = 0.3 + 0.6(%impervious cover/100)
Rainfall Intensity – Users need to enter the rainfall intensity for the waterquality storm in this cell. A one hour two year average recurrence intervalstorm event can be used for the rainfall intensity.
Type of proprietary device – enter the name of the proprietary device.
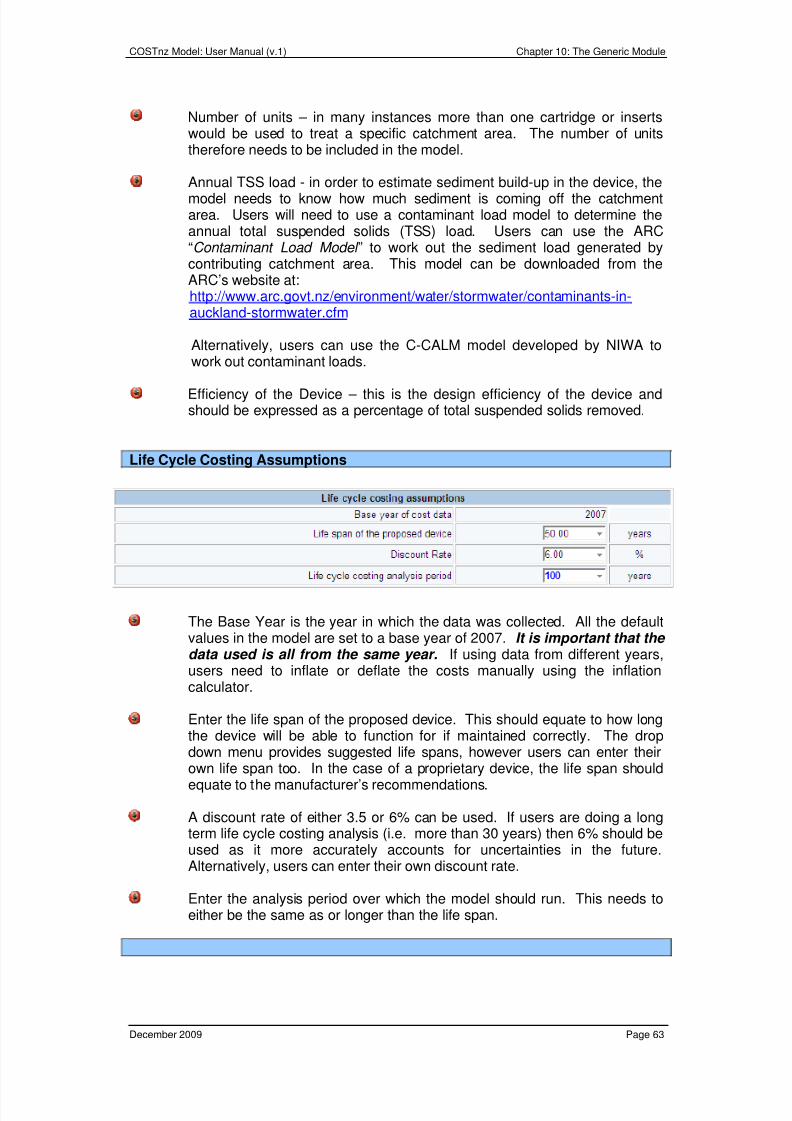
8/3/2019 New Zealand; Corrective Maintenance Costs for Green Infrastructure
http://slidepdf.com/reader/full/new-zealand-corrective-maintenance-costs-for-green-infrastructure 68/79
COSTnz Model: User Manual (v.1) Chapter 10: The Generic Module
December 2009 Page 63
Number of units – in many instances more than one cartridge or insertswould be used to treat a specific catchment area. The number of unitstherefore needs to be included in the model.
Annual TSS load - in order to estimate sediment build-up in the device, themodel needs to know how much sediment is coming off the catchmentarea. Users will need to use a contaminant load model to determine theannual total suspended solids (TSS) load. Users can use the ARC“Contaminant Load Model ” to work out the sediment load generated bycontributing catchment area. This model can be downloaded from theARC’s website at:http://www.arc.govt.nz/environment/water/stormwater/contaminants-in-auckland-stormwater.cfm
Alternatively, users can use the C-CALM model developed by NIWA towork out contaminant loads.
Efficiency of the Device – this is the design efficiency of the device andshould be expressed as a percentage of total suspended solids removed.
Life Cycle Costing Assumptions
The Base Year is the year in which the data was collected. All the defaultvalues in the model are set to a base year of 2007. It is important that the data used is all from the same year. If using data from different years,users need to inflate or deflate the costs manually using the inflationcalculator.
Enter the life span of the proposed device. This should equate to how longthe device will be able to function for if maintained correctly. The dropdown menu provides suggested life spans, however users can enter their
own life span too. In the case of a proprietary device, the life span shouldequate to the manufacturer’s recommendations.
A discount rate of either 3.5 or 6% can be used. If users are doing a longterm life cycle costing analysis (i.e. more than 30 years) then 6% should beused as it more accurately accounts for uncertainties in the future.Alternatively, users can enter their own discount rate.
Enter the analysis period over which the model should run. This needs toeither be the same as or longer than the life span.
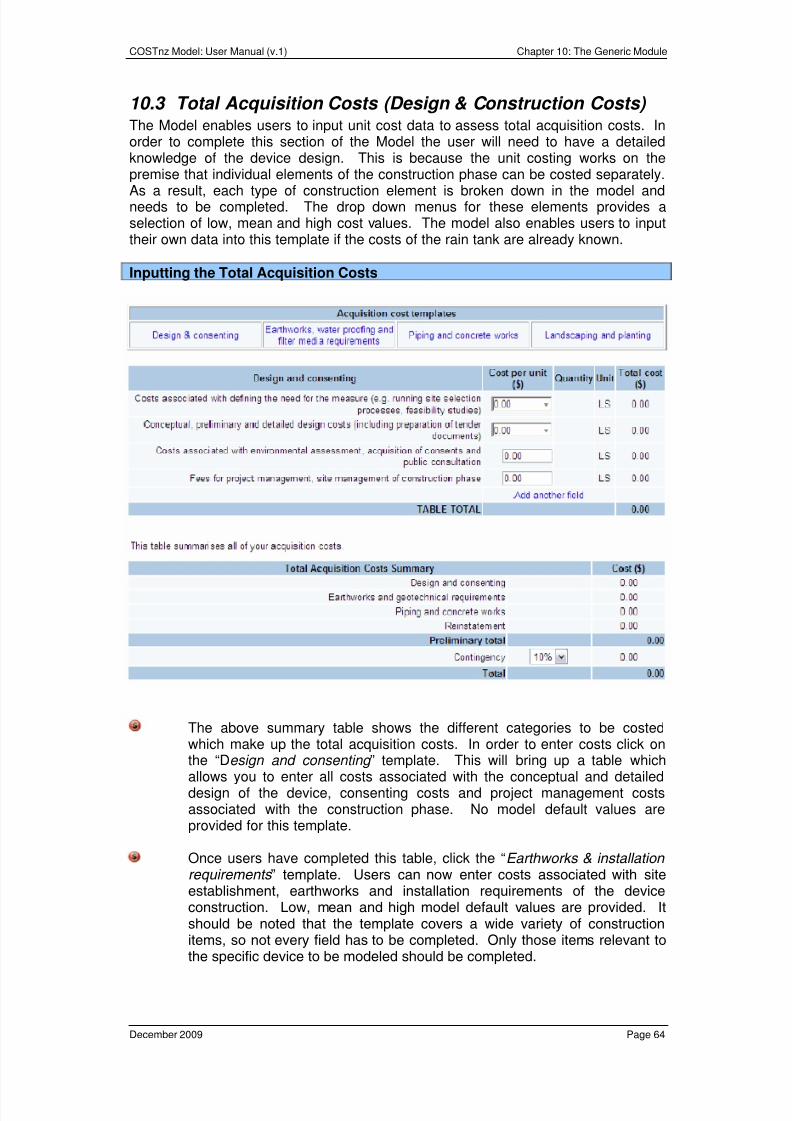
8/3/2019 New Zealand; Corrective Maintenance Costs for Green Infrastructure
http://slidepdf.com/reader/full/new-zealand-corrective-maintenance-costs-for-green-infrastructure 69/79
COSTnz Model: User Manual (v.1) Chapter 10: The Generic Module
December 2009 Page 64
10.3 Total Acquisition Costs (Design & Construction Costs) The Model enables users to input unit cost data to assess total acquisition costs. Inorder to complete this section of the Model the user will need to have a detailedknowledge of the device design. This is because the unit costing works on thepremise that individual elements of the construction phase can be costed separately.
As a result, each type of construction element is broken down in the model andneeds to be completed. The drop down menus for these elements provides aselection of low, mean and high cost values. The model also enables users to inputtheir own data into this template if the costs of the rain tank are already known.
Inputting the Total Acquisition Costs
The above summary table shows the different categories to be costedwhich make up the total acquisition costs. In order to enter costs click on
the “Design and consenting ” template. This will bring up a table whichallows you to enter all costs associated with the conceptual and detaileddesign of the device, consenting costs and project management costsassociated with the construction phase. No model default values areprovided for this template.
Once users have completed this table, click the “Earthworks & installation requirements ” template. Users can now enter costs associated with siteestablishment, earthworks and installation requirements of the deviceconstruction. Low, mean and high model default values are provided. Itshould be noted that the template covers a wide variety of constructionitems, so not every field has to be completed. Only those items relevant to
the specific device to be modeled should be completed.
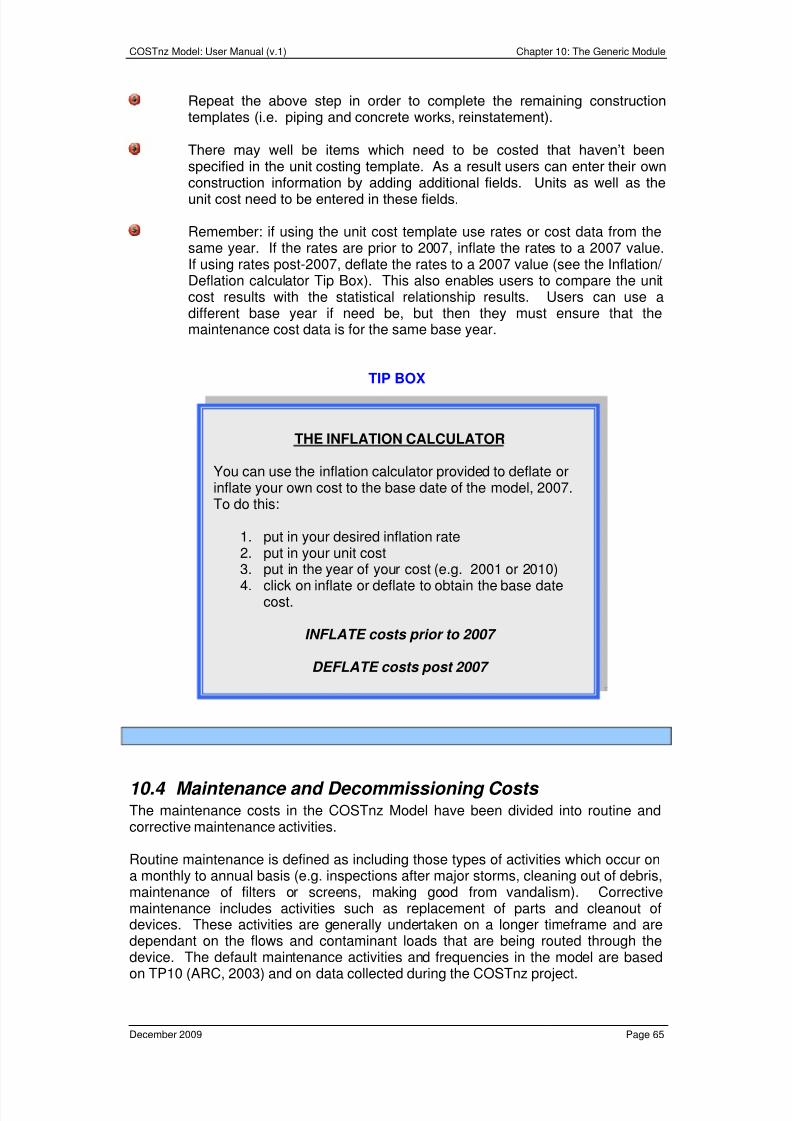
8/3/2019 New Zealand; Corrective Maintenance Costs for Green Infrastructure
http://slidepdf.com/reader/full/new-zealand-corrective-maintenance-costs-for-green-infrastructure 70/79
COSTnz Model: User Manual (v.1) Chapter 10: The Generic Module
December 2009 Page 65
Repeat the above step in order to complete the remaining constructiontemplates (i.e. piping and concrete works, reinstatement).
There may well be items which need to be costed that haven’t beenspecified in the unit costing template. As a result users can enter their ownconstruction information by adding additional fields. Units as well as theunit cost need to be entered in these fields.
Remember: if using the unit cost template use rates or cost data from thesame year. If the rates are prior to 2007, inflate the rates to a 2007 value.If using rates post-2007, deflate the rates to a 2007 value (see the Inflation/ Deflation calculator Tip Box). This also enables users to compare the unitcost results with the statistical relationship results. Users can use adifferent base year if need be, but then they must ensure that themaintenance cost data is for the same base year.
TIP BOX
10.4 Maintenance and Decommissioning Costs The maintenance costs in the COSTnz Model have been divided into routine andcorrective maintenance activities.
Routine maintenance is defined as including those types of activities which occur ona monthly to annual basis (e.g. inspections after major storms, cleaning out of debris,maintenance of filters or screens, making good from vandalism). Correctivemaintenance includes activities such as replacement of parts and cleanout ofdevices. These activities are generally undertaken on a longer timeframe and aredependant on the flows and contaminant loads that are being routed through the
device. The default maintenance activities and frequencies in the model are basedon TP10 (ARC, 2003) and on data collected during the COSTnz project.
THE INFLATION CALCULATOR
You can use the inflation calculator provided to deflate orinflate your own cost to the base date of the model, 2007.To do this:
1. put in your desired inflation rate2. put in your unit cost
3. put in the year of your cost (e.g. 2001 or 2010)4. click on inflate or deflate to obtain the base datecost.
INFLATE costs prior to 2007
DEFLATE costs post 2007
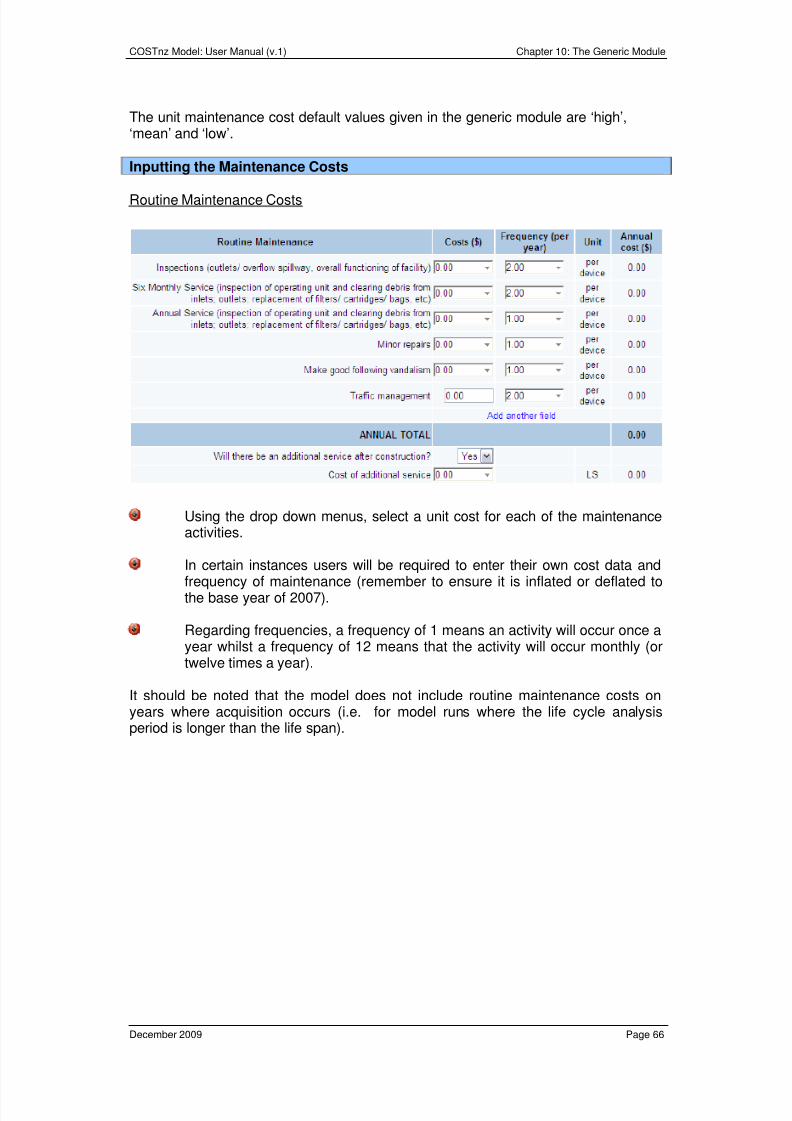
8/3/2019 New Zealand; Corrective Maintenance Costs for Green Infrastructure
http://slidepdf.com/reader/full/new-zealand-corrective-maintenance-costs-for-green-infrastructure 71/79
COSTnz Model: User Manual (v.1) Chapter 10: The Generic Module
December 2009 Page 66
The unit maintenance cost default values given in the generic module are ‘high’,‘mean’ and ‘low’.
Inputting the Maintenance Costs
Routine Maintenance Costs
Using the drop down menus, select a unit cost for each of the maintenanceactivities.
In certain instances users will be required to enter their own cost data andfrequency of maintenance (remember to ensure it is inflated or deflated tothe base year of 2007).
Regarding frequencies, a frequency of 1 means an activity will occur once ayear whilst a frequency of 12 means that the activity will occur monthly (ortwelve times a year).
It should be noted that the model does not include routine maintenance costs onyears where acquisition occurs (i.e. for model runs where the life cycle analysisperiod is longer than the life span).
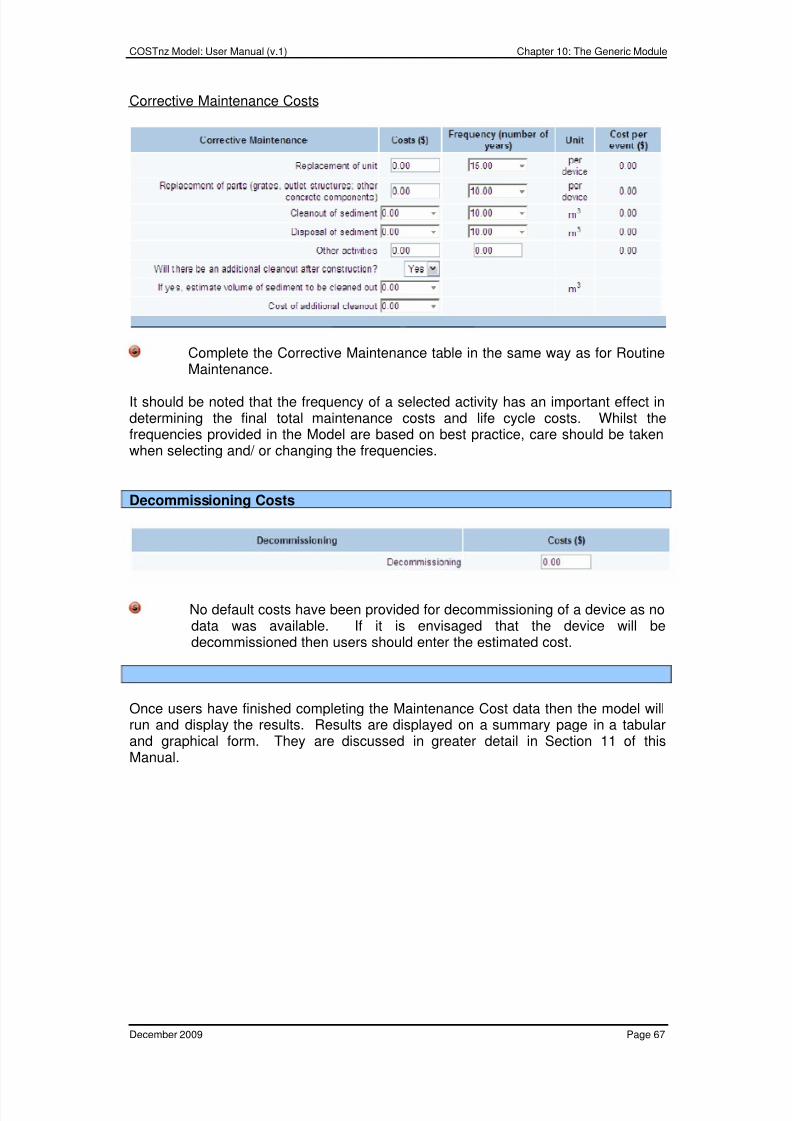
8/3/2019 New Zealand; Corrective Maintenance Costs for Green Infrastructure
http://slidepdf.com/reader/full/new-zealand-corrective-maintenance-costs-for-green-infrastructure 72/79
COSTnz Model: User Manual (v.1) Chapter 10: The Generic Module
December 2009 Page 67
Corrective Maintenance Costs
Complete the Corrective Maintenance table in the same way as for RoutineMaintenance.
It should be noted that the frequency of a selected activity has an important effect indetermining the final total maintenance costs and life cycle costs. Whilst thefrequencies provided in the Model are based on best practice, care should be takenwhen selecting and/ or changing the frequencies.
Decommissioning Costs
No default costs have been provided for decommissioning of a device as nodata was available. If it is envisaged that the device will bedecommissioned then users should enter the estimated cost.
Once users have finished completing the Maintenance Cost data then the model willrun and display the results. Results are displayed on a summary page in a tabularand graphical form. They are discussed in greater detail in Section 11 of thisManual.
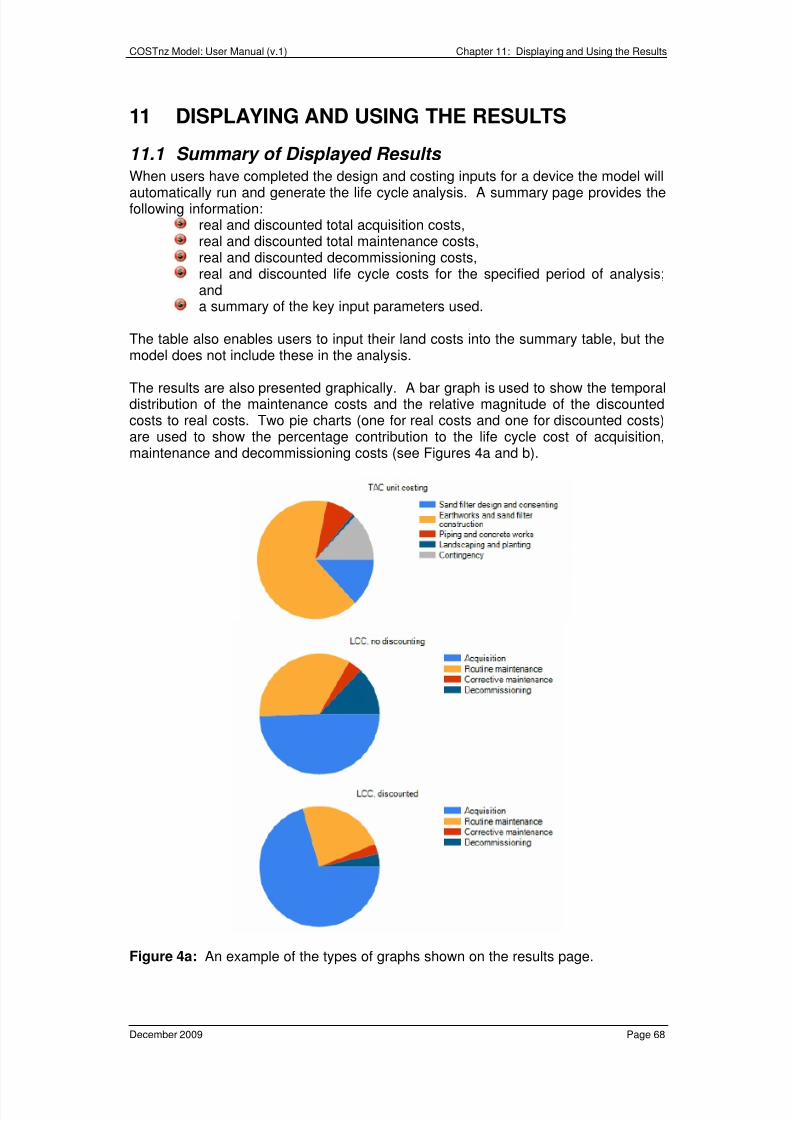
8/3/2019 New Zealand; Corrective Maintenance Costs for Green Infrastructure
http://slidepdf.com/reader/full/new-zealand-corrective-maintenance-costs-for-green-infrastructure 73/79
COSTnz Model: User Manual (v.1) Chapter 11: Displaying and Using the Results
December 2009 Page 68
11 DISPLAYING AND USING THE RESULTS
11.1 Summary of Displayed Results When users have completed the design and costing inputs for a device the model will
automatically run and generate the life cycle analysis. A summary page provides thefollowing information:
real and discounted total acquisition costs,real and discounted total maintenance costs,real and discounted decommissioning costs,real and discounted life cycle costs for the specified period of analysis;anda summary of the key input parameters used.
The table also enables users to input their land costs into the summary table, but themodel does not include these in the analysis.
The results are also presented graphically. A bar graph is used to show the temporaldistribution of the maintenance costs and the relative magnitude of the discountedcosts to real costs. Two pie charts (one for real costs and one for discounted costs)are used to show the percentage contribution to the life cycle cost of acquisition,maintenance and decommissioning costs (see Figures 4a and b).
Figure 4a: An example of the types of graphs shown on the results page.
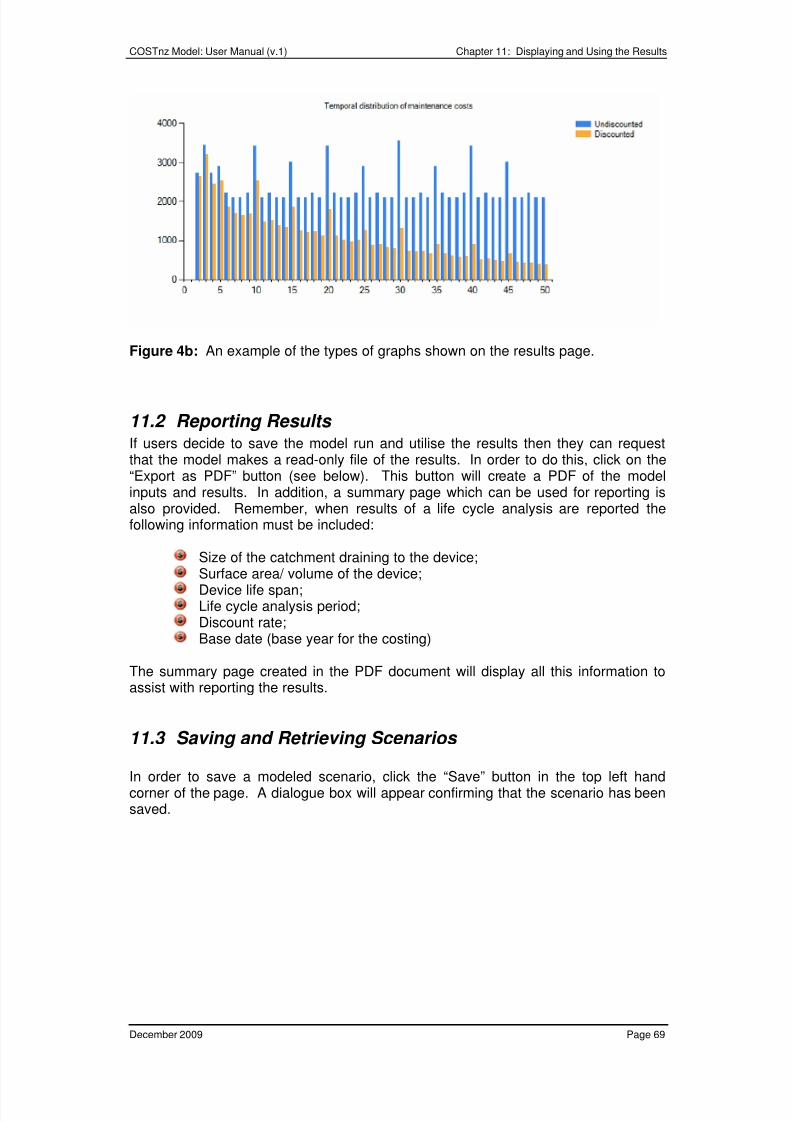
8/3/2019 New Zealand; Corrective Maintenance Costs for Green Infrastructure
http://slidepdf.com/reader/full/new-zealand-corrective-maintenance-costs-for-green-infrastructure 74/79
COSTnz Model: User Manual (v.1) Chapter 11: Displaying and Using the Results
December 2009 Page 69
Figure 4b: An example of the types of graphs shown on the results page.
11.2 Reporting Results If users decide to save the model run and utilise the results then they can requestthat the model makes a read-only file of the results. In order to do this, click on the“Export as PDF” button (see below). This button will create a PDF of the modelinputs and results. In addition, a summary page which can be used for reporting isalso provided. Remember, when results of a life cycle analysis are reported thefollowing information must be included:
Size of the catchment draining to the device;
Surface area/ volume of the device;Device life span;Life cycle analysis period;Discount rate;Base date (base year for the costing)
The summary page created in the PDF document will display all this information toassist with reporting the results.
11.3 Saving and Retrieving Scenarios
In order to save a modeled scenario, click the “Save” button in the top left handcorner of the page. A dialogue box will appear confirming that the scenario has beensaved.
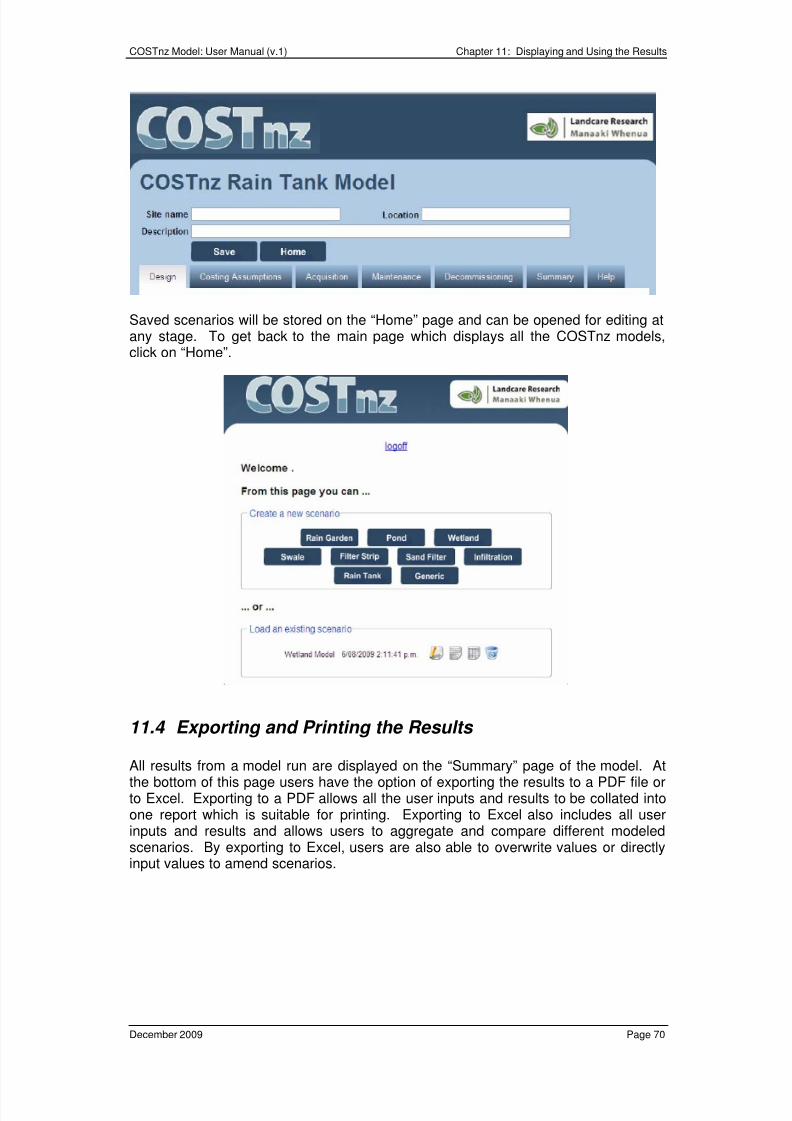
8/3/2019 New Zealand; Corrective Maintenance Costs for Green Infrastructure
http://slidepdf.com/reader/full/new-zealand-corrective-maintenance-costs-for-green-infrastructure 75/79
COSTnz Model: User Manual (v.1) Chapter 11: Displaying and Using the Results
December 2009 Page 70
Saved scenarios will be stored on the “Home” page and can be opened for editing atany stage. To get back to the main page which displays all the COSTnz models,click on “Home”.
11.4 Exporting and Printing the Results
All results from a model run are displayed on the “Summary” page of the model. Atthe bottom of this page users have the option of exporting the results to a PDF file orto Excel. Exporting to a PDF allows all the user inputs and results to be collated intoone report which is suitable for printing. Exporting to Excel also includes all userinputs and results and allows users to aggregate and compare different modeledscenarios. By exporting to Excel, users are also able to overwrite values or directlyinput values to amend scenarios.

8/3/2019 New Zealand; Corrective Maintenance Costs for Green Infrastructure
http://slidepdf.com/reader/full/new-zealand-corrective-maintenance-costs-for-green-infrastructure 76/79
COSTnz Model: User Manual (v.1) Chapter 11: Displaying and Using the Results
December 2009 Page 71
8/3/2019 New Zealand; Corrective Maintenance Costs for Green Infrastructure
http://slidepdf.com/reader/full/new-zealand-corrective-maintenance-costs-for-green-infrastructure 77/79
COSTnz Model: User Manual (v.1) References
December 2009 Page 72
REFERENCES
Auckland Regional Council. 2003. Technical Publication 10: StormwaterManagement Devices: Design Guideline Manual.
Australian National Audit Office. 2001. Life Cycle Costing: Better practice guide.Canberra, Commonwealth of Australia.
Australian/New Zealand Standard. 1999. Life Cycle Costing: An Application Guide,AS/NZ 4536:1999. Standards Australia, Homebush, NSW, Australia and StandardsNew Zealand, Wellington, NZ.
Giddens, C. (2007). Rawlinsons Construction Handbook. Rawlinsons Media Ltd.Auckland.
Ira, S. J. T., Vesely, E-T., and Krausse, M. 2007. Life Cycle Costing of StormwaterTreatment Devices – A Unit Costing Approach for New Zealand. NZWWA Journal(Issue 152).
Lampe, L., Barrett, M., Woods-Ballard, B., Kellagher, R., Martin, P., Jefferies, C.,Hollon, M. 2005. Performance and Whole Life Costs of Best Management Practicesand Sustainable Urban Drainage Systems. WERF Report Number 01-CTS-21T.
Taylor, A.C. 2003. An Introduction to Life Cycle Costing Involving StructuralStormwater Quality Management Measures. Cooperative Research Centre forCatchment Hydrology, Melbourne, Victoria.
Taylor, A.C. 2005. Guidelines for Evaluating the Financial, Ecological and SocialAspects of Urban Stormwater Management measures to Improve Waterway Health.Technical Report. Cooperative Research Centre for Catchment Hydrology,Melbourne, Victoria.
Vesely, E-T. 2007. Life Cycle Costing of Stormwater Devices: Addison BlockDevelopment. Landcare Research Report LC0607/059.
Vesely, E-T., Arnold, G., Ira, S. and Krausse, M. 2006. Costing Stormwater Devicesin the Auckland Region. NZWWA Conference Paper.

8/3/2019 New Zealand; Corrective Maintenance Costs for Green Infrastructure
http://slidepdf.com/reader/full/new-zealand-corrective-maintenance-costs-for-green-infrastructure 78/79
COSTnz Model: User Manual (v.1) Appendices
December 2009 Page 73
APPENDICES
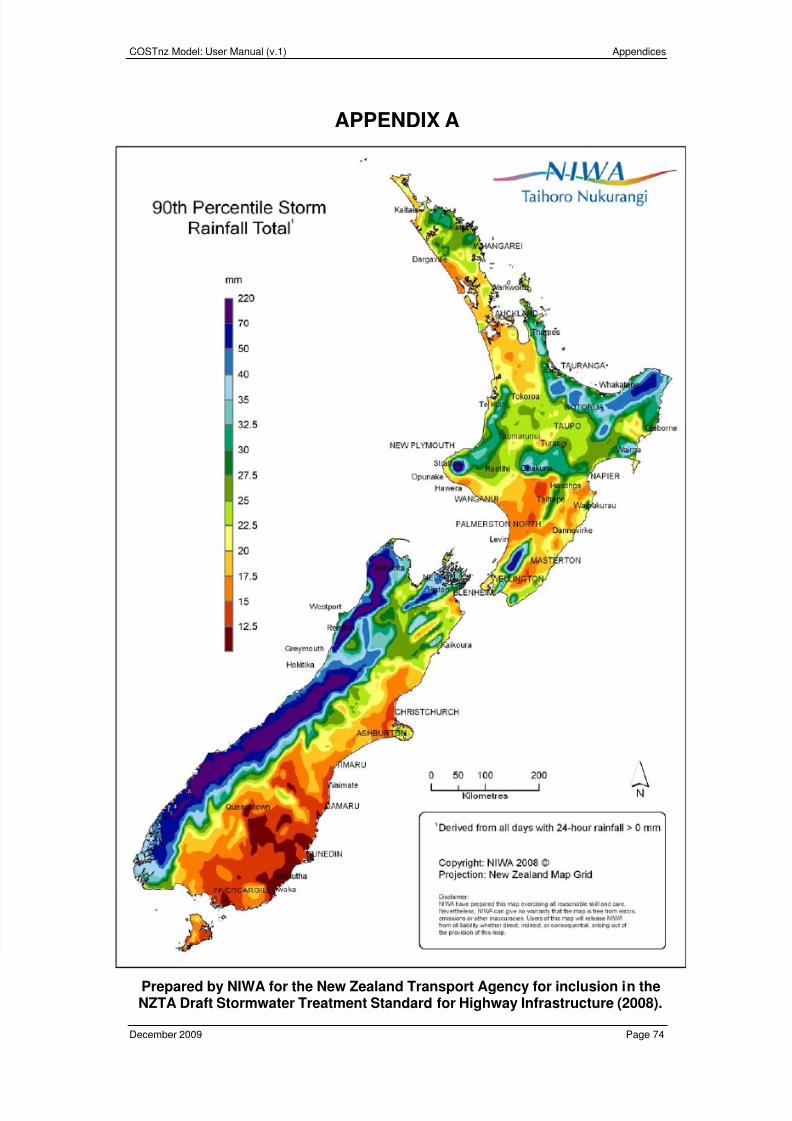
8/3/2019 New Zealand; Corrective Maintenance Costs for Green Infrastructure
http://slidepdf.com/reader/full/new-zealand-corrective-maintenance-costs-for-green-infrastructure 79/79
COSTnz Model: User Manual (v.1) Appendices
APPENDIX A


![P1040-AppR - Food Standards Australia New Zealand · Web view17 December 2015 [32–15] Approval Report –Proposal P1040 Code Revision – Consequential & Corrective Amendments II](https://img.pdfslide.us/doc/110x75/5b1c92067f8b9a2d258feedc/p1040-appr-food-standards-australia-new-web-view17-december-2015-3215.jpg)