Embed Size (px)
Citation preview

© New Zealand Centre for Public Law and contributors
Faculty of Law Victoria University of Wellington
PO Box 600 Wellington New Zealand
June 2009
The mode of citation of this journal is: (2009) 7 NZJPIL (page)
The previous issue of this journal is volume 6 number 2, December 2008
ISSN 11763930
Printed by Geon, Brebner Print, Palmerston North
Cover photo: Robert Cross, VUW ITS Image Services

CONTENTS SPECIAL CONFERENCE ISSUE:MMP AND THE CONSTITUTION
Foreword Dean R Knight........................................................................................................................... vii
"Who's the Boss?": Executive–Legislature Relations in New Zealand under MMP Ryan Malone ............................................................................................................................... 1
The Legal Status of Political Parties under MMP Andrew Geddis .......................................................................................................................... 21
Experiments in Executive Government under MMP in New Zealand: Contrasting Approaches to MultiParty Governance Jonathan Boston and David Bullock........................................................................................... 39
MMP, Minority Governments and Parliamentary Opposition André Kaiser ............................................................................................................................. 77
Public Attitudes towards MMP and Coalition Government Raymond Miller and Jack Vowles............................................................................................... 93
MMP and the Constitution Philip A Joseph ....................................................................................................................... 111
MMP and the Future: Political Challenges and Proposed Reforms Stephen Levine and Nigel S Roberts ......................................................................................... 135
The Best of Both Worlds? MMP Electoral Reform and Constitutional Development in Scotland and Wales Jonathan Bradbury.................................................................................................................. 157
*** Mike Taggart: In Memoriam PG McHugh ........................................................................................................................ …185
*** The symposium at which preliminary versions of these articles were originally presented – "MMP and the Constitution: 15 years past; 15 years forward" – was hosted by the New Zealand Centre for Public Law, in conjunction with Victoria's Institute of Policy Studies and Birkbeck's Centre for New Zealand Studies, and was made possible with the generous support of the New Zealand Law Foundation.

The New Zealand Journal of Public and International Law is a fully refereed journal published by the New Zealand Centre for Public Law at the Faculty of Law, Victoria University of Wellington. The Journal was established in 2003 as a forum for public and international legal scholarship. It is available in hard copy by subscription and is also available on the HeinOnline and Westlaw electronic databases.
NZJPIL welcomes the submission of articles, short essays and comments on current issues, and book reviews. Manuscripts and books for review should be sent to the address below. Manuscripts must be typed and accompanied by an electronic version in Microsoft Word or rich text format, and should include an abstract and a short statement of the author's current affiliations and any other relevant personal details. Authors should see earlier issues of NZJPIL for indications as to style; for specific guidance, see the Victoria University of Wellington Law Review Style Guide, copies of which are available on request. Submissions whose content has been or will be published elsewhere will not be considered for publication. The Journal cannot return manuscripts.
Regular submissions are subject to a doubleblind peer review process. In addition, the Journal occasionally publishes addresses and essays by significant public office holders. These are subject to a less formal review process.
Contributions to NZJPIL express the views of their authors and not the views of the Editorial Committee or the New Zealand Centre for Public Law. All enquiries concerning reproduction of the Journal or its contents should be sent to the Student Editor.
Annual subscription rates are NZ$100 (New Zealand) and NZ$130 (overseas). Back issues are available on request. To order in North America contact:
Gaunt Inc Gaunt Building 3011 Gulf Drive Holmes Beach
Florida 342172199 United States of America email [email protected] ph +1 941 778 5211 fax +1 941 778 5252
Address for all other communications:
The Student Editor New Zealand Journal of Public and International Law
Faculty of Law Victoria University of Wellington
PO Box 600 Wellington New Zealand
email nzjpil[email protected] fax +64 4 463 6365

135
MMP AND THE FUTURE: POLITICAL CHALLENGES AND PROPOSED REFORMS Stephen Levine and Nigel S Roberts*
In 2008 the New Zealand Prime Minister, John Key, announced that the National Party would hold "a binding referendum on MMP by no later than 2011". This article reviews the electoral system options considered at the time of the 1992 indicative electoral referendum in New Zealand and argues that it is unlikely that the country will revert to a first past the post voting system. Likewise, the authors do not expect that either preferential voting or single transferable voting will be regarded as viable alternatives to mixed member proportional (MMP) voting. If MMP were to be discarded, it would most likely be replaced by what was known as "supplementary member" system in 1992, now more usually called the parallel or mixed member majoritarian electoral system. The authors assess what would have occurred had the votes in New Zealand’s first five MMP elections been counted under parallel voting system (supplementary member) rules. They find that there would probably have been singleparty majority governments on three occasions and that, overall, the results of the 1996 to 2008 elections would have been three times more disproportionate than they were in reality under MMP. As a result, the article suggests that any problems with New Zealand’s MMP system – such as its oneseat threshold and the existence of overhang members of Parliament – should be rectified by legislative change, not by referendum.
I INTRODUCTION
In May 2008 the leader of the National Party, John Key, indicated that his party wanted to hold a referendum in 2011 on MMP – New Zealand's mixed member proportional representation electoral system. Key later included the proposal on his "list of 10 important changes that a Nationalled Government [would] make" in his "Blueprint for Change" keynote address at his Party's 2008 annual conference. He said: 1
* Professors, Political Science and International Relations programme, Victoria University of Wellington
1 John Key "National's Blueprint for Change" (Speech to the Annual National Party Conference, Wellington, 3 August 2008).
136 (2009) 7 NZJPIL
[W]e'll open our ears to [New Zealanders'] views on their voting system. New Zealanders have had to
wait long enough for a chance to kick the tyres on MMP. So, National will give them that chance by holding a binding referendum on MMP by no later than 2011. And, if a majority of voters decide MMP is not their preferred electoral system, we will offer them a choice between a range of electoral systems to replace it.
In light of the fact that the National Party clearly won the 2008 New Zealand general election (for even though National won only 58 of the 122 seats in the House of Representatives, it not only holds all the twenty Cabinet posts, but is also well stocked with confidence and supply partners) it is worth taking a close look at the electoral system reforms New Zealanders are likely to be asked to consider.
In doing so, it should be noted that there is a great deal of highly regarded academic literature about electoral systems and their effects on government and politics. For instance, Arend Lijphart's 1994 study Electoral Systems and Party Systems: A Study of TwentySeven Democracies, 19451990 found that "the degree of electoral disproportionality or proportionality responds very sensitively to the rules of the electoral system" 2 – in other words, changes to an electoral system are rapidly reflected in the fairness of election results. Overall, Lijphart's study concluded: 3
[T]he effective threshold is the strongest instrument for influencing proportionality but … the electoral formula and assembly size are also strong and useful instruments [for influencing the results of elections].
Adopt proportional representation and it is virtually certain that the shares of seats that parties win in a legislature will better reflect their vote shares than will be the case under a first past the post (FPP) voting system, or under a preferential voting system (such as the system used to elect members of the Australian House of Representatives) or a two round system (such as that used for elections to the French National Assembly). Increase the size of electoral districts from, say, Spain's average of less than seven members per district to Finland's average of more than 13 members of Parliament per electorate and you are highly likely to produce a more proportional Parliament. Increase the size of a country's legislature and almost without exception the Parliament will become more representative (in terms of matching parties' vote shares and seat shares). David Farrell's Electoral Systems: A Comparative Introduction reaches a similar conclusion by noting simply that "[e]lectoral systems have consequences for the political systems in which they operate." 4 In fact, Farrell even goes so far as to argue that "[i]n some senses, the debate on the proportionality and
2 Arend Lijphart Electoral Systems and Party Systems: A Study of TwentySeven Democracies, 19451990 (Oxford University Press, Oxford, 1994) 139.
3 Ibid.
4 David M Farrell Electoral Systems: A Comparative Introduction (Palgrave, New York, 2001) 153.

MMP AND THE FUTURE 137
party system effects of electoral systems is pretty much complete; it is difficult to see what there is left to say about these issues." 5
However, precisely because we know a lot about the consequences of different electoral systems, debate about the advantages and disadvantages of different systems can be particularly robust. As Bernard Grofman and Shaun Bowler have argued: 6
[O]nce we recognise that electoral systems have multiple effects it becomes a certainty that there will be no system that is best with respect to all possible criteria of evaluation. Once that is admitted, then the
field of normative debate about electoral system choice is significantly broadened and the nature of the debate should be less polemic, as we move to debate the nature of appropriate tradeoffs among multiple competing criteria, all of which have something to recommend them.
Indeed, "multiple competing criteria" for assessing electoral systems were specifically outlined and considered by the New Zealand Royal Commission on the Electoral System when it published its report in 1986. The Royal Commission "adopted 10 criteria against which to test [New Zealand's then] existing plurality [that is, FPP voting] system and other possible systems" 7 , but – at the same time – the Commission argued that: 8
No voting system can fully meet the ideal standards set by the criteria. Nor are the criteria all of equal weight. Some of them, if carried to their full extent, are mutually incompatible. Others overlap and none is independent. If a system is designed to achieve one particular objective, the likelihood of meeting other objectives may thereby be lessened. The best voting system for any country will not be
one which meets any of the criteria completely but will be one which provides the most satisfactory overall balance between them, taking account of that country's history and current circumstances.
Given the extensive electoral systems research carried out since the Royal Commission published its report, it is now possible to evaluate John Key's suggestion that New Zealanders "kick the tyres on MMP".
II BACK TO THE FUTURE
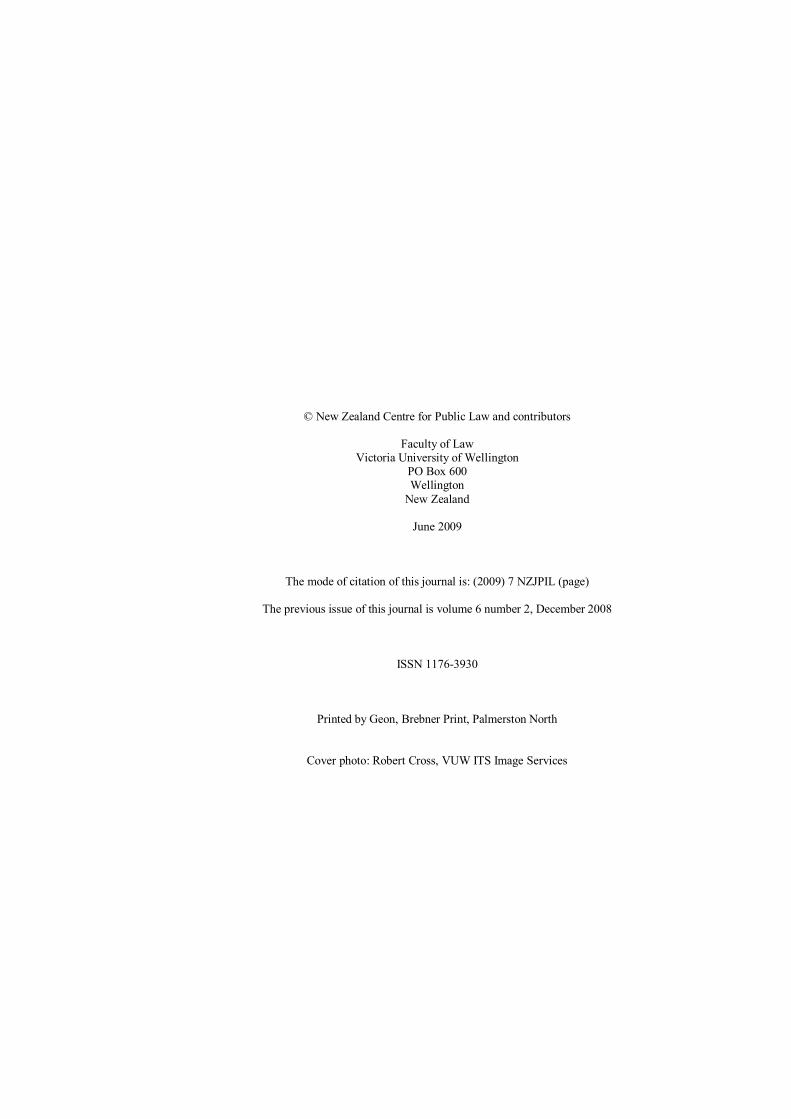
It should be noted initially that John Key's proposal sounds somewhat like a rerun of the process that was used in 1992 and 1993 which led to the adoption of MMP as the country's electoral system. Figure 1 is a picture of a poster that was used to outline the characteristics and consequences of the
5 Ibid, 168.
6 Bernard Grofman and Shaun Bowler "STV's Place in the Family of Electoral Systems: The Theoretical Comparisons and Contrasts" [1996] 34 Representation 43, 47.
7 Royal Commission on the Electoral System "Report of the Royal Commission on the Electoral System: Towards a Better Democracy" (Government Printer, Wellington, 1986) para 2.1 (also cited as [198687] IX AJHR H 3, 11) ["Towards a Better Democracy"].
8 Ibid.
138 (2009) 7 NZJPIL
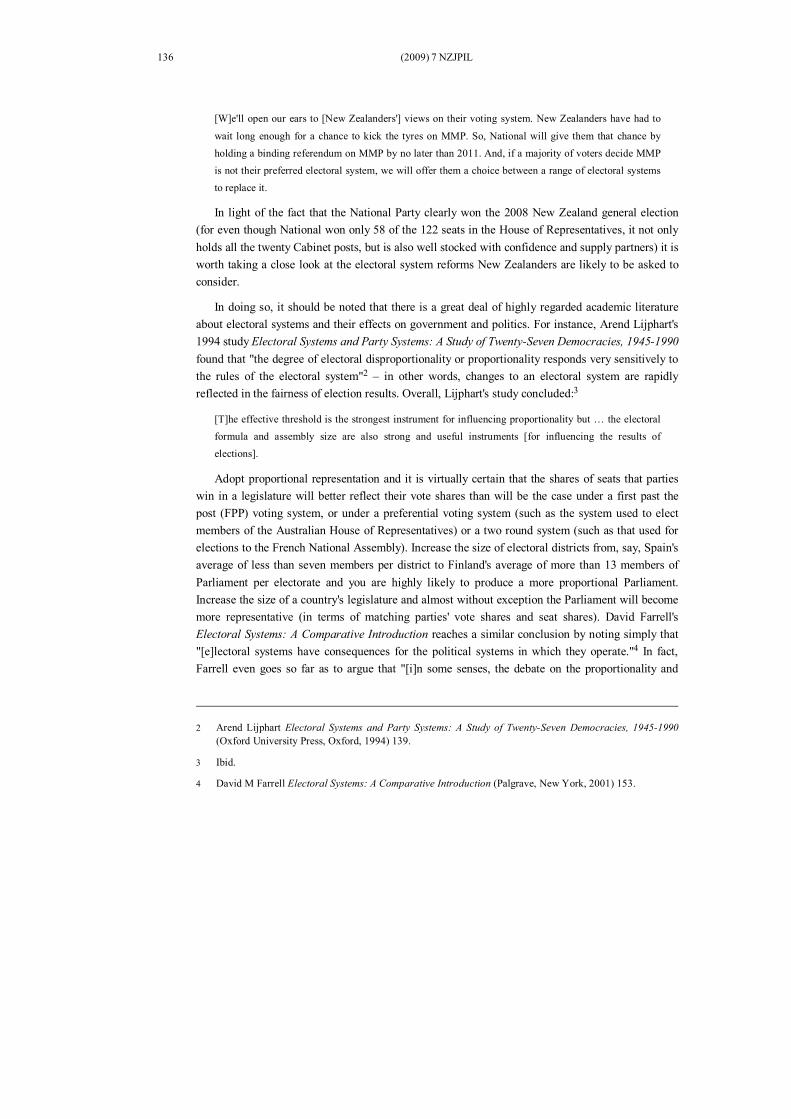
five electoral systems under consideration in the 1992 electoral referendum, while table 1 summarises the results of the referendum.
Figure 1 The choices New Zealand electors had in the 1992 electoral referendum
Source: Photograph by Nigel S Roberts of "The Five Choices You Have on 19 September" poster issued by the Electoral Referendum Panel, Wellington, 1992.
Table 1 Results of the 1992 New Zealand electoral referendum
In light of New Zealand's recent somewhat problematic experience with the use of single transferable voting (STV) for District Health Board elections and the use of preferential voting and STV in some local body elections in both 2004 and 2007, it is highly unlikely that, given the opportunity to do so, New Zealanders would seriously consider switching from MMP either to STV
Part A Part B Retain first past the post Change the voting system
15.3 % 84.7 %
Supplementary member Single transferable voting Mixed member proportional Preferential voting
5.5% 17.4% 70.5% 6.6%
Total 100.0% 100.0%
MMP AND THE FUTURE 139
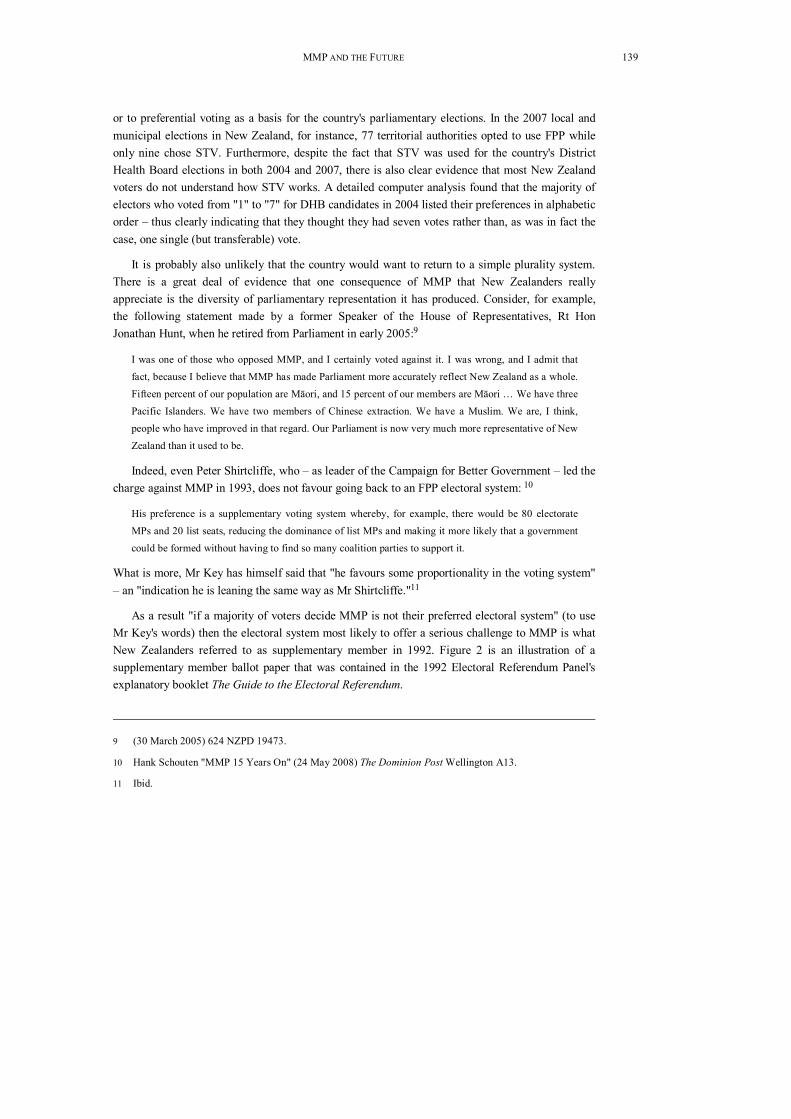
or to preferential voting as a basis for the country's parliamentary elections. In the 2007 local and municipal elections in New Zealand, for instance, 77 territorial authorities opted to use FPP while only nine chose STV. Furthermore, despite the fact that STV was used for the country's District Health Board elections in both 2004 and 2007, there is also clear evidence that most New Zealand voters do not understand how STV works. A detailed computer analysis found that the majority of electors who voted from "1" to "7" for DHB candidates in 2004 listed their preferences in alphabetic order – thus clearly indicating that they thought they had seven votes rather than, as was in fact the case, one single (but transferable) vote.
It is probably also unlikely that the country would want to return to a simple plurality system. There is a great deal of evidence that one consequence of MMP that New Zealanders really appreciate is the diversity of parliamentary representation it has produced. Consider, for example, the following statement made by a former Speaker of the House of Representatives, Rt Hon Jonathan Hunt, when he retired from Parliament in early 2005: 9
I was one of those who opposed MMP, and I certainly voted against it. I was wrong, and I admit that fact, because I believe that MMP has made Parliament more accurately reflect New Zealand as a whole. Fifteen percent of our population are Māori, and 15 percent of our members are Māori … We have three Pacific Islanders. We have two members of Chinese extraction. We have a Muslim. We are, I think, people who have improved in that regard. Our Parliament is now very much more representative of New Zealand than it used to be.
Indeed, even Peter Shirtcliffe, who – as leader of the Campaign for Better Government – led the charge against MMP in 1993, does not favour going back to an FPP electoral system: 10
His preference is a supplementary voting system whereby, for example, there would be 80 electorate MPs and 20 list seats, reducing the dominance of list MPs and making it more likely that a government could be formed without having to find so many coalition parties to support it.
What is more, Mr Key has himself said that "he favours some proportionality in the voting system" – an "indication he is leaning the same way as Mr Shirtcliffe." 11
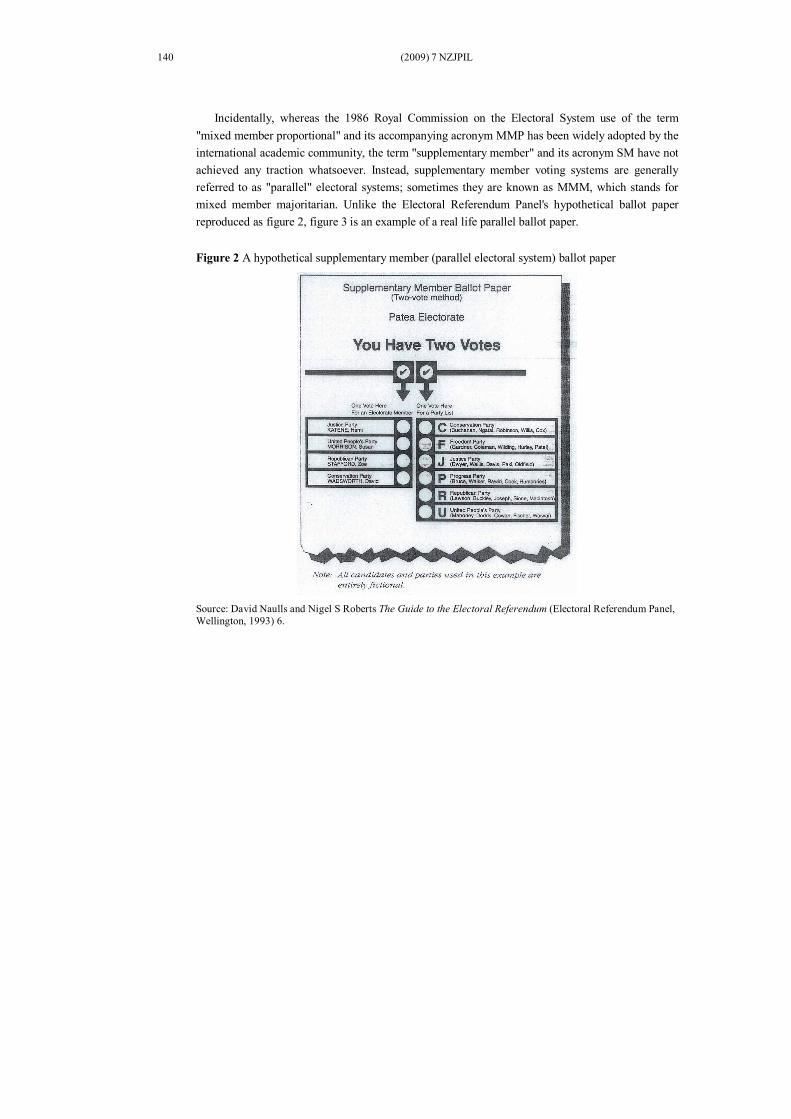
As a result "if a majority of voters decide MMP is not their preferred electoral system" (to use Mr Key's words) then the electoral system most likely to offer a serious challenge to MMP is what New Zealanders referred to as supplementary member in 1992. Figure 2 is an illustration of a supplementary member ballot paper that was contained in the 1992 Electoral Referendum Panel's explanatory booklet The Guide to the Electoral Referendum.
9 (30 March 2005) 624 NZPD 19473.
10 Hank Schouten "MMP 15 Years On" (24 May 2008) The Dominion PostWellington A13.
11 Ibid.
140 (2009) 7 NZJPIL
Incidentally, whereas the 1986 Royal Commission on the Electoral System use of the term "mixed member proportional" and its accompanying acronym MMP has been widely adopted by the international academic community, the term "supplementary member" and its acronym SM have not achieved any traction whatsoever. Instead, supplementary member voting systems are generally referred to as "parallel" electoral systems; sometimes they are known as MMM, which stands for mixed member majoritarian. Unlike the Electoral Referendum Panel's hypothetical ballot paper reproduced as figure 2, figure 3 is an example of a real life parallel ballot paper.
Figure 2 A hypothetical supplementary member (parallel electoral system) ballot paper
Source: David Naulls and Nigel S Roberts The Guide to the Electoral Referendum (Electoral Referendum Panel, Wellington, 1993) 6.

MMP AND THE FUTURE 141
Figure 3 An actual parallel electoral system ballot paper
Source: Andrew Reynolds, Ben Reilly and Andrew Ellis (eds) Electoral System Design: The New International IDEA Handbook (International Institute for Democracy and Electoral Assistance, Stockholm, 2005) 108.
As the two ballot papers show, parallel electoral systems resemble MMP in that there can be (and in fact usually are) electorate votes and party votes in both types of electoral system. This is illustrated in figures 2 and 3, where the electorate vote is on the lefthand side of the ballot papers while the party vote is on the right. However, there is a crucial difference between parallel (or supplementary member) electoral systems and MMP. In MMP, the party vote is predominant: parties win a share of all the seats in Parliament that is based on their shares of the party vote. For example, the Green Party won no electorate seats in the 2008 New Zealand general election, but because it won 6.7 per cent of the party votes cast in the election (which represented 7.2 per cent of the votes of the seven parties that qualified for seats in Parliament) it was entitled to nine seats (all of which were list seats) in Parliament, accounting for 7.4 per cent of all the seats in the House of Representatives. 12
In parallel voting systems, however, the party vote entitles political parties to a share of only the list seats in the legislature – not to a share of all the seats in Parliament. Whereas MMP is
12 Chief Electoral Office "The General Election 2008" [2008] AJHR E 9 1113.

142 (2009) 7 NZJPIL
compensatory, MMM is supplementary (hence the name given to this genre of voting system by New Zealand's Royal Commission on the Electoral System). 13
III HYPOTHETICAL PARALLEL ELECTORAL SYSTEM (OR MMM) RESULTS FROM FIVE GENERAL ELECTIONS
In order to illustrate how a parallel system could function in New Zealand, tables 2 to 6 have recast the votes in the 1996, 1999, 2002, 2005 and 2008 New Zealand parliamentary elections under MMM rules which assume:
(a) that the party vote would affect the distribution of only the list seats in Parliament (that is, the total number of seats in Parliament would not be in proportion to the party vote);
(b) that list seats would be distributed only to parties that gained 5 per cent or more of the party vote (that is, parties that won one or more electorate seats but which failed to cross the 5 per cent party vote threshold would not be entitled to list seats in Parliament); and
(c) that the distribution of the list seats would – as in MMP – be determined by using the Sainte Laguë formula. 14
All five tables show results for Parliaments containing 120 seats as well as for Parliaments with 99 seats (the option that New Zealanders overwhelmingly voted for in a citizens initiated referendum in 1999). It is, of course, important to bear in mind that given different options with different consequences, many people could (and probably would) vote differently. The tables have been constructed to illustrate how a different voting system – MMM rather than MMP – would have produced different outcomes if votes had been cast in the same ways as they were in 1996, 1999, 2002, 2005 and 2008.
13 Royal Commission on the Electoral System "Towards a Better Democracy", above n 7, paras 2.812.83, 2.1012.115.
14 The Sainte Laguë formula is the method used to convert votes into seats in New Zealand. It is one of two main "highest averages" proportional representation formulas. See Lijphart, above n 2, 153155 and Chief Electoral Office "The General Election 2008", above n 12, 1113.

MMP AND THE FUTURE 143
Table 2 Data from the 1996 New Zealand general election recast in a parallel electoral system (MMM) format
Party Electorate seats
Party votes (%)
List seats (out of 55)
Seats in Parliament (out of 120)
List seats (out of 34)
Seats in Parliament (out of 99)
Labour 26 28.2 17 43 10 36 National 30 33.8 20 50 13 43 New Zealand First 6 13.4 8 14 5 11 Alliance 1 10.0 6 7 4 5 ACT 1 6.1 4 5 2 3 United Future 1 0.9 0 1 0 1 Christian Coalition 0 4.3 0 0 0 0 Aotearoa Legalise
Cannabis Party 0 1.7 0 0 0 0 Other parties 0 1.5 0 0 0 0 Total 65 100.0 55 120 34 99
Table 3 Data from the 1999 New Zealand general election recast in a parallel electoral system (MMM) format
Party Electorate seats
Party votes (%)
List seats (out of 53)
Seats in Parliament (out of 120)
List seats (out of 32)
Seats in Parliament (out of 99)
Labour 41 38.7 23 64 14 55 National 22 30.5 18 40 11 33 Alliance 1 7.7 5 6 3 4 ACT 0 7.0 4 4 2 2 Green Party 1 5.2 3 4 2 3 New Zealand First 1 4.3 0 1 0 1 United Future 1 0.5 0 1 0 1 Christian Heritage
Party 0 2.4 0 0 0 0 Other parties 0 3.7 0 0 0 0 Total 67 100.0 53 120 32 99
Table 4 Data from the 2002 New Zealand general election recast in a parallel electoral system (MMM) format
Party Electorate seats
Party votes (%)
List seats (out of 51)
Seats in Parliament (out of 120)
List seats (out of 30)
Seats in Parliament (out of 99)
Labour 45 41.3 22 67 13 58 National 21 20.9 11 32 7 28 New Zealand First 1 10.4 6 7 4 5 ACT 0 7.1 4 4 2 2 Green Party 0 7.0 4 4 2 2 United Future 1 6.7 4 5 2 3 Progressive Coalition 1 1.7 0 1 0 1 Christian Heritage
Party 0 1.4 0 0 0 0 Other parties 0 3.5 0 0 0 0 Total 69 100.0 51 120 30 99

144 (2009) 7 NZJPIL
Table 5 Data from the 2005 New Zealand general election recast in a parallel electoral system (MMM) format
Party Electorate seats
Party votes (%)
List seats (out of 51)
Seats in Parliament (out of 120)
List seats (out of 30)
Seats in Parliament (out of 99)
Labour 31 41.1 22 54 13 44 National 31 39.1 22 53 13 44 New Zealand First 0 5.7 3 3 2 2 Green Party 0 5.3 3 3 2 2 United Future 1 2.7 0 1 0 1 Māori Party 4 2.1 0 4 0 4 ACT 1 1.5 0 1 0 1 Progressive Coalition 1 1.2 0 1 0 1 Other parties 0 1.3 0 0 0 0 Total 69 100.0 51 120 30 99
Table 6 Data from the 2008 New Zealand general election recast in a parallel electoral system (MMM) format
Party Electorate seats
Party votes (%)
List seats (out of 50)
Seats in Parliament (out of 120)
List seats (out of 29)
Seats in Parliament (out of 99)
National 41 44.9 26 67 15 56 Labour 21 34.0 20 41 12 33 Green Party 0 6.7 4 4 2 2 ACT 1 3.7 0 1 0 1 Māori Party 5 2.4 0 5 0 5 Progressive Coalition 1 0.9 0 1 0 1 United Future 1 0.9 0 1 0 1 New Zealand First 0 4.1 0 0 0 0 Other parties 0 2.4 0 0 0 0 Total 70 100 50 120 29 99
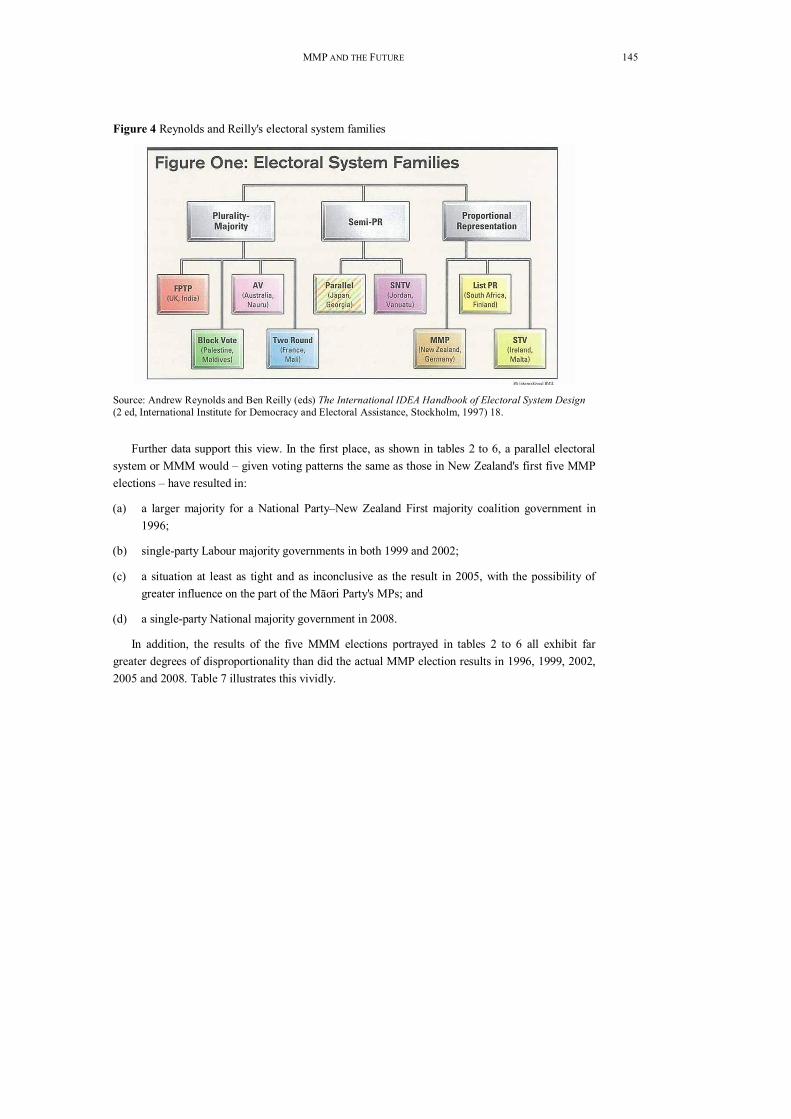
There can be no doubt, of course, that if New Zealand had had a parallel electoral system, the results of the 1996, 1999, 2002, 2005 and 2008 New Zealand general elections would not have been the same as the results portrayed in the data given in tables 2 to 6. Given the context of a different voting system, New Zealanders would – as was explained earlier – undoubtedly have voted differently. At best, therefore, the data in the five tables can be regarded as illustrative scenarios. Nevertheless, the data in tables 2 to 6 clearly show why a change to a parallel – or MMM – voting system does matter and why such voting systems are not regarded as a form of proportional representation. As illustrated in figure 4 (which depicts a range of voting systems falling within each of three broad "electoral system families"), parallel voting systems are classified as semi proportional systems.
MMP AND THE FUTURE 145
Figure 4 Reynolds and Reilly's electoral system families
Source: Andrew Reynolds and Ben Reilly (eds) The International IDEA Handbook of Electoral System Design (2 ed, International Institute for Democracy and Electoral Assistance, Stockholm, 1997) 18.
Further data support this view. In the first place, as shown in tables 2 to 6, a parallel electoral system or MMM would – given voting patterns the same as those in New Zealand's first five MMP elections – have resulted in:
(a) a larger majority for a National Party–New Zealand First majority coalition government in 1996;
(b) singleparty Labour majority governments in both 1999 and 2002;
(c) a situation at least as tight and as inconclusive as the result in 2005, with the possibility of greater influence on the part of the Māori Party's MPs; and
(d) a singleparty National majority government in 2008.
In addition, the results of the five MMM elections portrayed in tables 2 to 6 all exhibit far greater degrees of disproportionality than did the actual MMP election results in 1996, 1999, 2002, 2005 and 2008. Table 7 illustrates this vividly.

146 (2009) 7 NZJPIL
Table 7 Percentage disproportionality in five elections under MMP and MMM (based on MMM Parliaments with 120 MPs)
Year MMP MMM (parallel) 1996 4.36 9.13 1999 3.01 11.53 2002 2.53 12.37 2005 1.14 5.72 2008 3.84 8.95 Average 2.98 9.54
The data in table 7 show how the disproportionality index – which measures the discrepancy between parties' shares of votes and seats – declined in each of New Zealand's first four MMP elections, but rose in the country's fifth MMP election in 2008. To put the data into perspective, it should be borne in mind that the average disproportionality figure in New Zealand for the 17 FPP elections from 1946 through to and including 1993 was 11 per cent – which was more than three and a half times higher than the average disproportionality from 1996 to 2008 under MMP. The MMM data are striking. They clearly show that parallel (or MMM) elections yield high degrees of disproportionality, with an overall (or average) figure far closer to the disproportionality percentages that plurality and majoritarian electoral systems (such as FPP) yield than to data commonly found in proportional representation voting systems. Indeed, the overall disproportionality index for New Zealand's first five MMP elections is not only less than a third of the average disproportionality percentage for MMM elections based on identical levels of party support, but it is also noteworthy that the lowest MMM statistic in table 7 (5.72 per cent) is actually higher than the highest MMP figure (namely, 4.36 per cent).
As a result, the data generated by this research deserve serious consideration by all who propose changing New Zealand's electoral system.
IV LEGISLATIVE CHANGES ARE APPROPRIATE
Consequently, before New Zealand examines alternative voting system solutions, it is not only important but would also make sense to ask just what the problems are with MMP, and then to ask how these problems could be rectified. Equally importantly, New Zealand's public and politicians alike should bear in mind the fact that referenda are not necessary for fixing a range of electoral system problems. The former FPP voting system was not a static electoral system that never changed over time: far from it. However, crucial alterations to the FPP electoral system were made by legislative change – not by referendum, and no one argued that that was either illegitimate or inappropriate.
After the adoption of the Electoral Act 1956 (which entrenched certain features of New Zealand's voting system, making it almost impossible to change them unless the proposed changes were supported by a majority vote in a referendum or by a 75 per cent vote of all the members of
MMP AND THE FUTURE 147
Parliament) important changes were nevertheless made from time to time to the country's FPP system:
(a) in 1965, it was decided that the number of electorates in the South Island would be fixed at 25 and, as a result, the size of the House of Representatives rose incrementally from 80 in 1966 to 99 in 1993 – this change and its consequences were not endorsed by a referendum;
(b) in 1969 the voting age was lowered from 21 to 20, and again in 1974 from 20 to 18 – these changes were not made as a result of votes in referenda; and
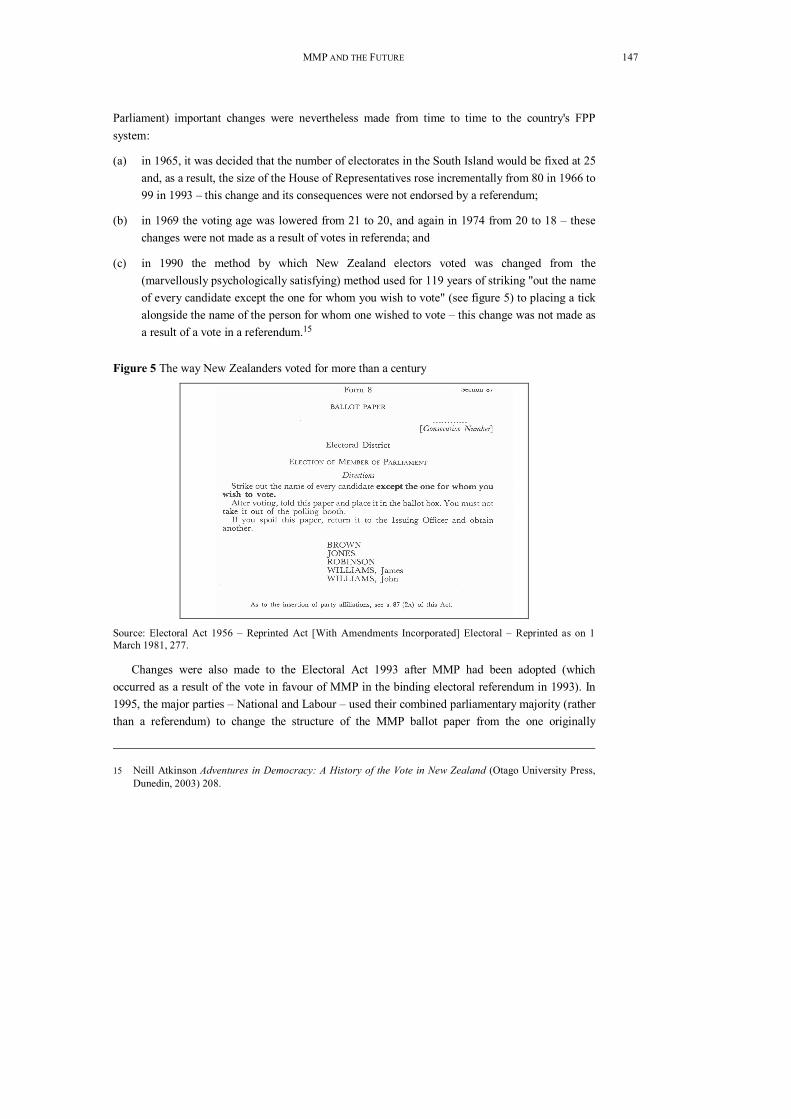
(c) in 1990 the method by which New Zealand electors voted was changed from the (marvellously psychologically satisfying) method used for 119 years of striking "out the name of every candidate except the one for whom you wish to vote" (see figure 5) to placing a tick alongside the name of the person for whom one wished to vote – this change was not made as a result of a vote in a referendum. 15
Figure 5 The way New Zealanders voted for more than a century
Source: Electoral Act 1956 – Reprinted Act [With Amendments Incorporated] Electoral – Reprinted as on 1 March 1981, 277.
Changes were also made to the Electoral Act 1993 after MMP had been adopted (which occurred as a result of the vote in favour of MMP in the binding electoral referendum in 1993). In 1995, the major parties – National and Labour – used their combined parliamentary majority (rather than a referendum) to change the structure of the MMP ballot paper from the one originally
15 Neill Atkinson Adventures in Democracy: A History of the Vote in New Zealand (Otago University Press, Dunedin, 2003) 208.
148 (2009) 7 NZJPIL
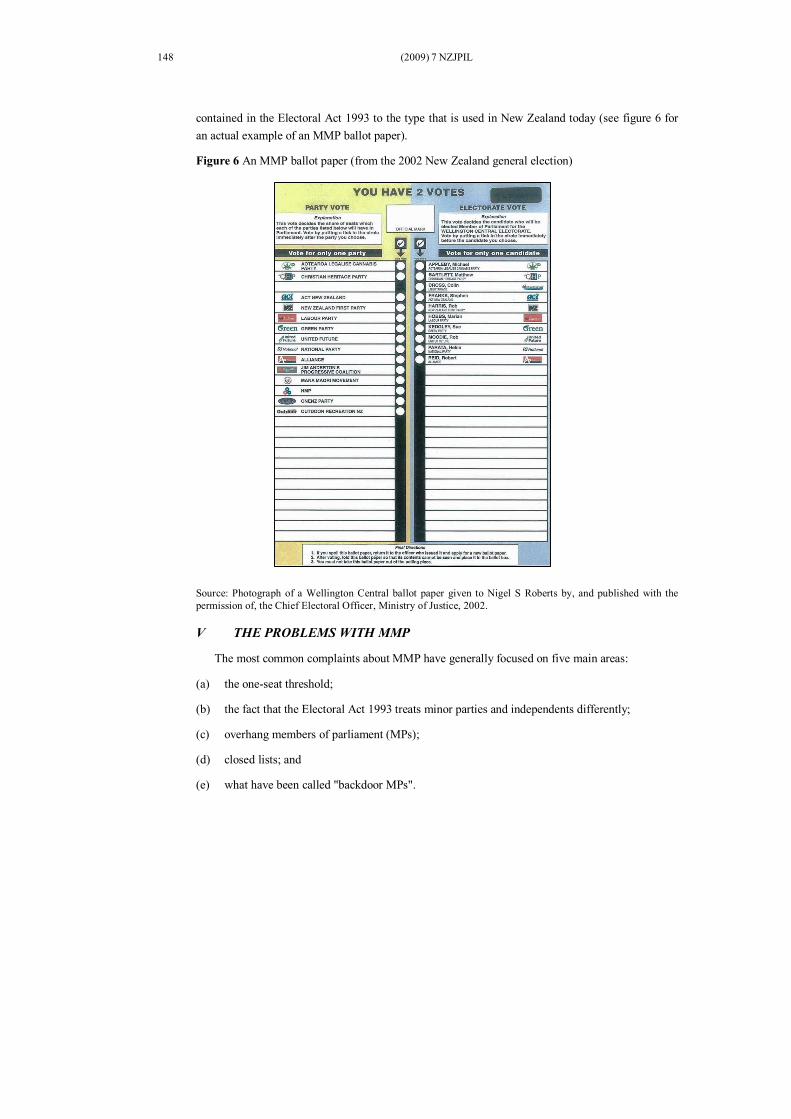
contained in the Electoral Act 1993 to the type that is used in New Zealand today (see figure 6 for an actual example of an MMP ballot paper).
Figure 6 An MMP ballot paper (from the 2002 New Zealand general election)
Source: Photograph of a Wellington Central ballot paper given to Nigel S Roberts by, and published with the permission of, the Chief Electoral Officer, Ministry of Justice, 2002.
V THE PROBLEMS WITH MMP
The most common complaints about MMP have generally focused on five main areas:
(a) the oneseat threshold;
(b) the fact that the Electoral Act 1993 treats minor parties and independents differently;
(c) overhang members of parliament (MPs);
(d) closed lists; and
(e) what have been called "backdoor MPs".

MMP AND THE FUTURE 149
Each of these problems will now be examined in turn.
The oneseat threshold has distorted the intentions of the Electoral Act 1993 and the MMP system to such an extent that in the 2005 election only four of the eight parties elected to the House of Representatives crossed the 5 per cent hurdle, and in 2008 four of the seven parties elected to Parliament in 2008 won fewer than 4 per cent (let alone 5 per cent) of the party votes cast throughout the country as a whole, while New Zealand First – which won 4.1 per cent of the overall party vote – failed to secure any seats at all in Parliament.
The oneseat threshold has also distorted campaigning. If this alternative threshold did not exist, New Zealand undoubtedly would not have seen formulas such as those featured in figure 7 which were placed on prominent billboards in the Epsom electorate in 2005.
Without the oneseat threshold, the two formulas would have been simpler and more appropriate: Hide = only Hide and Worth = only Worth. Criticisms of the oneseat threshold have been made since the very first MMP election, but the parliamentary committee that reviewed MMP in 2000 chose to do nothing about it (no doubt because of the near unanimity rule under which the committee operated, effectively giving all parties a veto over collective decisionmaking).
Figure 7 An ACT party billboard in the Epsom electorate in 2005
A second fault in the legislation governing MMP is that it treats independents and people in unregistered parties differently from candidates representing registered parties. If an independent candidate or a candidate from an unregistered political party were to be elected to Parliament, the Electoral Act 1993 says that only 119 seats – rather than 120 seats – would be allocated by means of the Sainte Laguë formula. However, if a candidate standing under the banner of a registered party were to be elected, then 120 would be the baseline for the allocation of seats in the House of Representatives – even if the party concerned had not garnered enough party votes to be entitled to
150 (2009) 7 NZJPIL
one seat under the Sainte Laguë formula. In this case, of course, the MP would become an overhang MP, whereas the registered party MP's independent (or unregistered) colleague would not and could not be an overhang MP.
Indeed, a related criticism levelled at MMP as it currently stands is that it can produce overhang MPs. The 2005 general election produced the country's first overhang and resulted in a Parliament of 121 seats rather than the 120 envisioned as the basis for the House of Representatives under MMP. The 2008 election also produced an overhang in Parliament: on this occasion 122 MPs were elected. A simple remedy if people are concerned or upset about the overhang provisions in the Electoral Act 1993 would simply be to abolish them. After all, neither the Scottish nor the Welsh assemblies have a provision for an overhang in their MMP legislation. Thus the size of the New Zealand Parliament would be fixed at 120 MPs.
A fourth area of concern for some people is the fact that party lists under MMP are closed. It is something the parties almost certainly like (it gives them, and not the public, control over their party list), but – as occurred in Sweden, for example – public criticism of unchangeable lists can cause parties to think again.
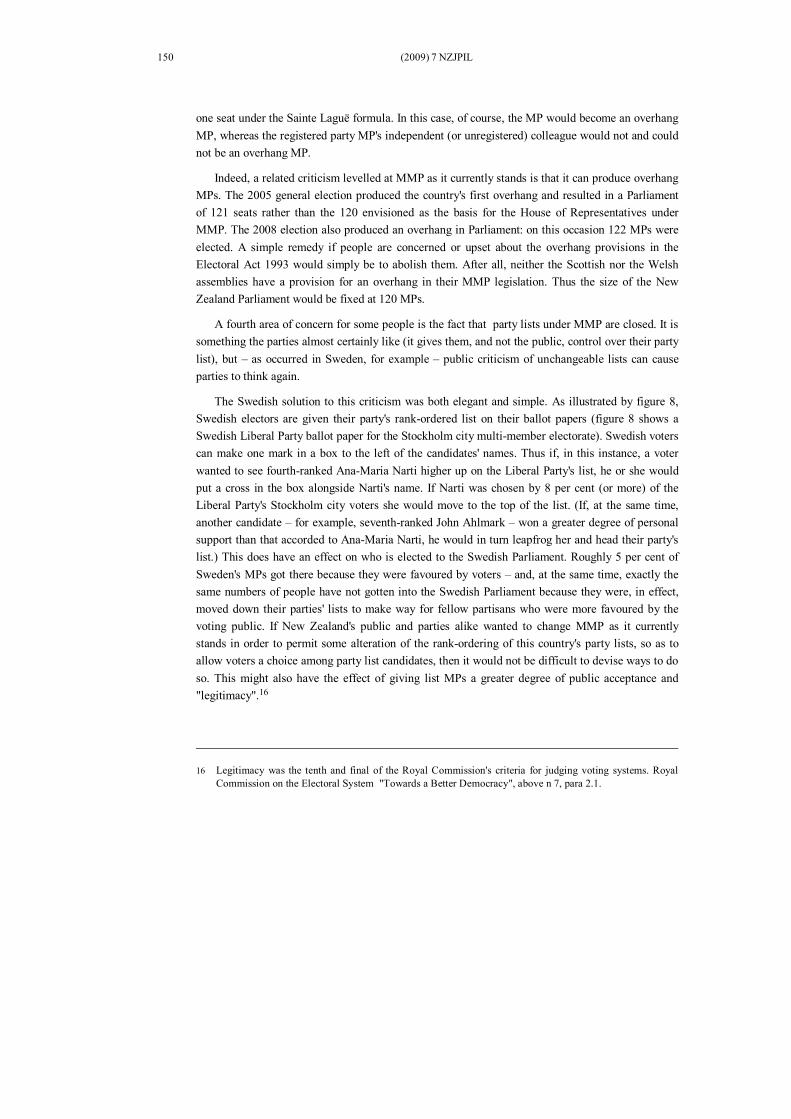
The Swedish solution to this criticism was both elegant and simple. As illustrated by figure 8, Swedish electors are given their party's rankordered list on their ballot papers (figure 8 shows a Swedish Liberal Party ballot paper for the Stockholm city multimember electorate). Swedish voters can make one mark in a box to the left of the candidates' names. Thus if, in this instance, a voter wanted to see fourthranked AnaMaria Narti higher up on the Liberal Party's list, he or she would put a cross in the box alongside Narti's name. If Narti was chosen by 8 per cent (or more) of the Liberal Party's Stockholm city voters she would move to the top of the list. (If, at the same time, another candidate – for example, seventhranked John Ahlmark – won a greater degree of personal support than that accorded to AnaMaria Narti, he would in turn leapfrog her and head their party's list.) This does have an effect on who is elected to the Swedish Parliament. Roughly 5 per cent of Sweden's MPs got there because they were favoured by voters – and, at the same time, exactly the same numbers of people have not gotten into the Swedish Parliament because they were, in effect, moved down their parties' lists to make way for fellow partisans who were more favoured by the voting public. If New Zealand's public and parties alike wanted to change MMP as it currently stands in order to permit some alteration of the rankordering of this country's party lists, so as to allow voters a choice among party list candidates, then it would not be difficult to devise ways to do so. This might also have the effect of giving list MPs a greater degree of public acceptance and "legitimacy". 16
16 Legitimacy was the tenth and final of the Royal Commission's criteria for judging voting systems. Royal Commission on the Electoral System "Towards a Better Democracy", above n 7, para 2.1.
MMP AND THE FUTURE 151
Figure 8 An example of a Swedish parliamentary ballot paper
Source: Photograph of a Swedish Liberal Party (Folkpartiet) parliamentary (Riksdagen) ballot paper given to Nigel S Roberts by, and published with the permission of, the Swedish Liberal Party, 1998.
The fifth and final area of concern about MMP that will be analysed in this article is the problem of what have been called "backdoor MPs". They were perceived to be a problem right from the start, even as far back as when MMP was debated in the lead up to the 1993 electoral referendum. Anti MMP advertisements at the time claimed that the new voting system would see MPs thrown out on Saturday, only to come back to Parliament on Monday via their parties' lists. In the 2005 election, there were as many as 10 incumbent electorate MPs – Rick Barker, Russell Fairbrother, Ann Hartley, David Parker, Winston Peters, Jill Pettis, Mita Ririnui, Dover Samuels, Jim Sutton and Dianne Yates – who recontested their electoral districts and lost, but who were nevertheless all returned to Parliament as list MPs. Likewise, in 2008 Steve Chadwick, Darren Hughes and Lynne Pillay also lost their electorate seats in the House of Representatives but were, nevertheless, returned to Parliament as list MPs. The term "backdoor MPs" is somewhat unfair (after all, MPs like this have all legitimately been elected to Parliament via their parties' lists) but the phrase is mild in comparison with the term used in Japan's parallel electoral system, where such MPs are unflatteringly referred to as "zombies" – parliamentarians who have been brought back from the dead.
152 (2009) 7 NZJPIL
If people are concerned about this aspect of MMP there is – of course – a simple solution. New Zealand could emulate Wales and prohibit dual electorate and list candidacies. 17 It should be pointed out, however, that by including people who are also electorate candidates on party lists in New Zealand, this country's lists tend to give a full and accurate account of the "flavour" of the political parties. Some parties go so far as to insist that all their list candidates must also be electorate candidates; others – such as the National Party – try to ensure that nearly all of their list candidates, with only very few exceptions, are also electorate candidates. If dual candidacies had been outlawed in New Zealand, neither John Key (Helensville) nor Bill English (Clutha–Southland) would have appeared on the National Party's 2008 list and it would have been headed instead by David Carter, Steven Joyce and Georgina Te Heuheu (who were listonly candidates).
VI REPLAYING THE MMP ELECTIONS
The penultimate part of this article asks what the New Zealand Parliament could have looked like had the first three changes to the MMP system outlined in the previous part been implemented – that is if the oneseat threshold did not exist; if minor parties (falling below the 5 per cent threshold but gaining electorate seats) were treated by the Electoral Act in the same way as independents would have been; and if there were no provision for overhang MPs. (Note that the other two changes, involving closed lists and "backdoor MPs", do not affect the distribution of seats).
Tables 8 to 12 take the results of the 1996, 1999, 2002, 2005 and 2008 general elections in terms of the vote shares and the electorate seats won by New Zealand's political parties and calculate what would have happened had the Levine and Roberts revised MMP rules been implemented. The final (the right hand) column in each of the five tables is italicised and contains the actual results of the election.
Once again a note of caution is necessary. If different rules had applied to MMP, voters would have behaved differently. In 1996 for instance, would electors have opted to vote for Richard Prebble in Wellington Central knowing that he would not have brought more ACT MPs into Parliament if the party did not cross the 5 per cent party vote threshold, and – likewise – would electors have given as many party votes to ACT if they had been aware of that fact? These are unanswerable questions. However, we can say for certain what would have occurred under the slightly revised MMP rules had electors cast their votes in the same way as in New Zealand's first five MMP elections.
17 Jonathan Bradbury "MMP, Party Politics and Constitutional Change in the United Kingdom: The Experience of Scotland and Wales and Implications for United Kingdom Electoral Reform" presented at "MMP and the Constitution: 15 years past; 15 years forward" (New Zealand Centre for Public Law, Victoria University of Wellington, 2627 August 2008). See Jonathan Bradbury "The Best of Both Worlds? MMP Electoral Reform and Constitutional Development in Scotland and Wales" (2009) 7 NZJPIL 157.

MMP AND THE FUTURE 153
Table 8 Data from the 1996 New Zealand general election recast under revised MMP rules
Party Electorate seats Party votes (%) List seats (out of 55)
Total seats in Parliament under revised rules
Actual 1996 seats in Parliament
Labour 26 28.2 11 37 37 National 30 33.8 14 44 44 New Zealand First 6 13.4 11 17 17 Alliance 1 10.1 12 13 13 ACT 1 6.1 7 8 8 United Future 1 0.9 0 1 1 Christian Heritage
Coalition 0 4.3 0 0 0 Aotearoa Legalise
Cannabis Party 0 1.7 0 0 0 Other parties 0 1.5 0 0 0 Total 65 100.0 55 120 120
Table 9 Data from the 1999 New Zealand general election recast under revised MMP rules
Party Electorate seats Party votes (%) List seats (out of 53)
Total seats in Parliament under revised rules
Actual 1999 seats in
Parliament Labour 41 38.7 10 51 49 National 22 30.5 19 41 39 Alliance 1 7.7 9 10 10 ACT 0 7.0 9 9 9 Green Party 1 5.2 6 7 7 New Zealand First 1 4.3 0 1 5 United 1 0.5 0 1 1 Christian Heritage
Party 0 2.4 0 0 0 Other parties 0 3.7 0 0 0 Total 67 100.0 53 120 120
Table 10 Data from the 2002 New Zealand general election recast under revised MMP rules
Party Electorate seats Party votes (%) List seats (out of 51)
Total seats in Parliament under revised rules
Actual 2002 seats in
Parliament Labour 45 41.3 8 53 52 National 21 20.9 6 27 27 New Zealand First 1 10.4 12 13 13 ACT 0 7.1 9 9 9 Green Party 0 7.0 9 9 9 United Future 1 6.7 7 8 8 Progressive Coalition 1 1.7 0 1 2 Christian Heritage
Party 0 1.4 0 0 0 Other parties 0 3.5 0 0 0 Total 69 100.0 51 120 120
154 (2009) 7 NZJPIL
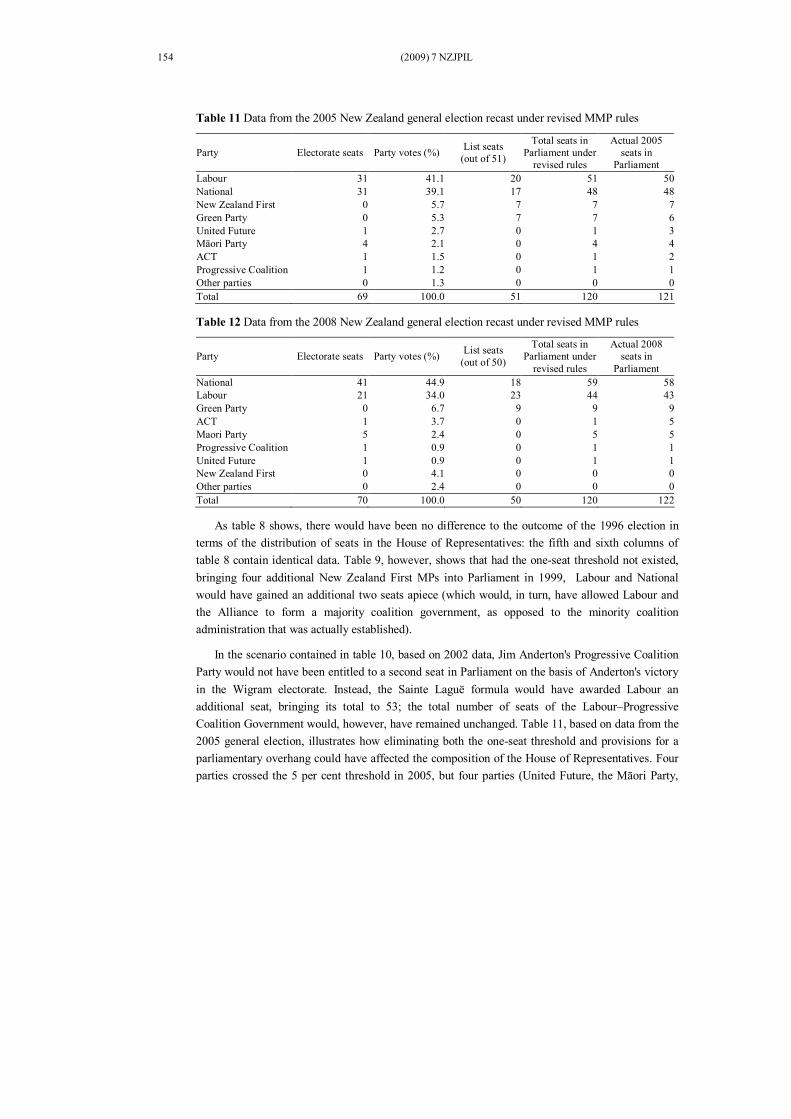
Table 11 Data from the 2005 New Zealand general election recast under revised MMP rules
Party Electorate seats Party votes (%) List seats (out of 51)
Total seats in Parliament under revised rules
Actual 2005 seats in
Parliament Labour 31 41.1 20 51 50 National 31 39.1 17 48 48 New Zealand First 0 5.7 7 7 7 Green Party 0 5.3 7 7 6 United Future 1 2.7 0 1 3 Māori Party 4 2.1 0 4 4 ACT 1 1.5 0 1 2 Progressive Coalition 1 1.2 0 1 1 Other parties 0 1.3 0 0 0 Total 69 100.0 51 120 121
Table 12 Data from the 2008 New Zealand general election recast under revised MMP rules
Party Electorate seats Party votes (%) List seats (out of 50)
Total seats in Parliament under revised rules
Actual 2008 seats in
Parliament National 41 44.9 18 59 58 Labour 21 34.0 23 44 43 Green Party 0 6.7 9 9 9 ACT 1 3.7 0 1 5 Maori Party 5 2.4 0 5 5 Progressive Coalition 1 0.9 0 1 1 United Future 1 0.9 0 1 1 New Zealand First 0 4.1 0 0 0 Other parties 0 2.4 0 0 0 Total 70 100.0 50 120 122
As table 8 shows, there would have been no difference to the outcome of the 1996 election in terms of the distribution of seats in the House of Representatives: the fifth and sixth columns of table 8 contain identical data. Table 9, however, shows that had the oneseat threshold not existed, bringing four additional New Zealand First MPs into Parliament in 1999, Labour and National would have gained an additional two seats apiece (which would, in turn, have allowed Labour and the Alliance to form a majority coalition government, as opposed to the minority coalition administration that was actually established).
In the scenario contained in table 10, based on 2002 data, Jim Anderton's Progressive Coalition Party would not have been entitled to a second seat in Parliament on the basis of Anderton's victory in the Wigram electorate. Instead, the Sainte Laguë formula would have awarded Labour an additional seat, bringing its total to 53; the total number of seats of the Labour–Progressive Coalition Government would, however, have remained unchanged. Table 11, based on data from the 2005 general election, illustrates how eliminating both the oneseat threshold and provisions for a parliamentary overhang could have affected the composition of the House of Representatives. Four parties crossed the 5 per cent threshold in 2005, but four parties (United Future, the Māori Party,
MMP AND THE FUTURE 155
ACT and Progressive) that won a combined total of seven electorate seats did not; thus these parties would have been allocated no lists seats at all. If their MPs had been treated in the same way as independent MPs under current provisions in the Electoral Act 1993, then the Sainte Laguë formula would have been used to distribute 113 seats (not 120). The net result would have been no overhang in the House of Representatives and that Labour and the Green Party would each have been allocated one more seat than was actually the case. In a similar vein, table 12 shows how the revised rules suggested in this article would have eliminated the twoseat overhang in 2008 and, at the same time, awarded one extra seat apiece to New Zealand's two largest parties, National and Labour. This would have meant that National would have had more seats in Parliament than any party has ever had under MMP (including its actual 2008 tally), but it would have been one seat shy of holding exactly half the seats in the House of Representatives and two seats short of having a single party majority in Parliament; coalition deals or confidence and supply arrangements with ACT and United Future would still have been enough to secure a majority for John Key's government.
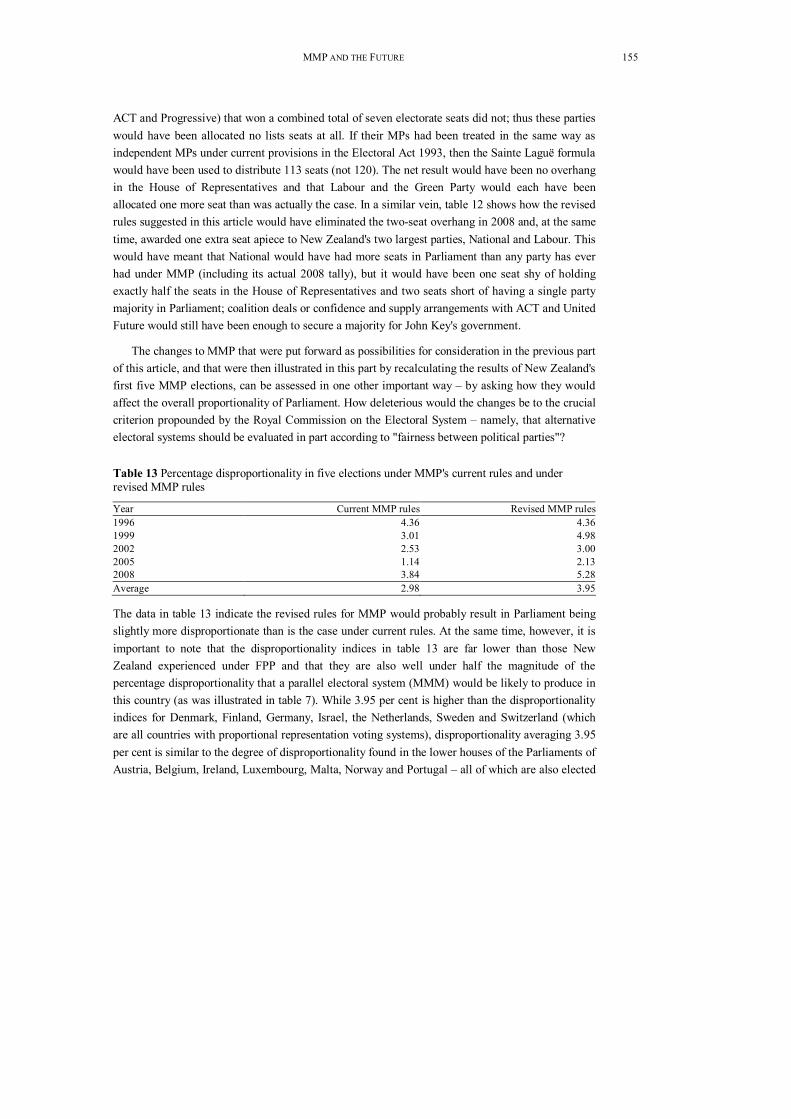
The changes to MMP that were put forward as possibilities for consideration in the previous part of this article, and that were then illustrated in this part by recalculating the results of New Zealand's first five MMP elections, can be assessed in one other important way – by asking how they would affect the overall proportionality of Parliament. How deleterious would the changes be to the crucial criterion propounded by the Royal Commission on the Electoral System – namely, that alternative electoral systems should be evaluated in part according to "fairness between political parties"?
Table 13 Percentage disproportionality in five elections under MMP's current rules and under revised MMP rules
Year Current MMP rules Revised MMP rules 1996 4.36 4.36 1999 3.01 4.98 2002 2.53 3.00 2005 1.14 2.13 2008 3.84 5.28 Average 2.98 3.95
The data in table 13 indicate the revised rules for MMP would probably result in Parliament being slightly more disproportionate than is the case under current rules. At the same time, however, it is important to note that the disproportionality indices in table 13 are far lower than those New Zealand experienced under FPP and that they are also well under half the magnitude of the percentage disproportionality that a parallel electoral system (MMM) would be likely to produce in this country (as was illustrated in table 7). While 3.95 per cent is higher than the disproportionality indices for Denmark, Finland, Germany, Israel, the Netherlands, Sweden and Switzerland (which are all countries with proportional representation voting systems), disproportionality averaging 3.95 per cent is similar to the degree of disproportionality found in the lower houses of the Parliaments of Austria, Belgium, Ireland, Luxembourg, Malta, Norway and Portugal – all of which are also elected
156 (2009) 7 NZJPIL
by proportional representation in one form or another and all of which have average indices of disproportionality of around 3 to 4 per cent. 18
In brief, therefore, the changes canvassed in the previous part of this article could well remove some of the niggling criticisms that New Zealanders have about the operation of the MMP system. These changes would not undermine the key criterion of fairness between parties in New Zealand's voting system and they could all be instituted by legislative change alone. They would obviate the need for what would be in the circumstances, and by legislative precedent, an altogether superfluous referendum.
VII CONCLUSION
In Seats and Votes: The Effects and Determinants of Electoral Systems, an authoritative analysis of the effects of electoral systems, Rein Taagepera and Matthew Soberg Shugart argue that "[m]ajor electoral reforms should not be undertaken lightly." 19 They point out that a "major purpose of elections is to supply a stable institutional framework for the expression of various viewpoints. Even if imperfect, a longestablished existing electoral system may satisfy this purpose better than could a new and unfamiliar system". 20 After endorsing a major change to the country's electoral system in 1993 – a change that was significant and far reaching – New Zealanders would be well advised to approach the prospect of further major reforms with considerable caution. As Taagepera and Shugart also note, "[f]amiliarity breeds stability." 21
The proposals outlined and analysed in this article would not constitute "major" reforms, but they would remove aspects of New Zealand's new electoral system that members of the public find annoying and unsatisfactory. Just as the former FPP voting system was altered and reformed from time to time without destroying the fundamentals of the system, so too should it be expected that the MMP representation electoral system will also need to be modified and changed every now and then without deviating from the fundamental, underlying principles of the system.
As a result, ideas for changing New Zealand's MMP electoral system have been both discussed and assessed in this article. They are practical and feasible. They represent a way of throwing out the bath water without discarding the baby – namely, New Zealand's new voting system – at the same time.
18 Lijphart, above n 2, 160162.
19 Rein Taagepera and Matthew Soberg Shugart Seats and Votes: The Effects and Determinants of Electoral Systems (Yale University Press, New Haven, 1989) 218.
20 Ibid.
21 Ibid.