Embed Size (px)
Citation preview

New York’s Energy Opportunities 2010
Good News and Bad News
1. Historic low energy prices…today.2. Capital Region still pays more than it should3. Cap and Trade upside for NY.4. Energy renewables agenda.5. Energy infrastructure agenda.6. Consumers have the responsibility to
choose.

Why are prices low?
Demand destruction: The Great Recession (Bad news)
Speculators out of market (Good news)
Natural gas supplies are up. Unconventional, shale gas. (Good news)
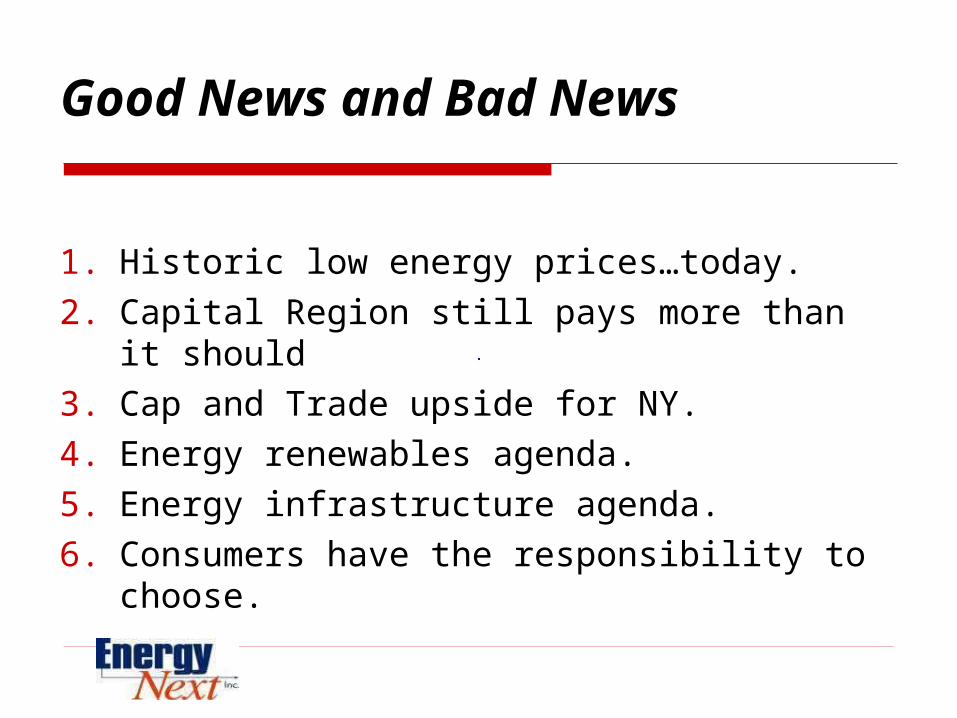
Wholesale Power Prices at Historic Low in 2009 (NYISO)
Load Av.Electric Av.NatGas
GWh $/MWh $/MMBtu2000 428 $58.26 $5.522001 430 $51.22 $4.542002 435 $49.90 $3.852003 433 $62.58 $6.482004 438 $62.80 $6.802005 458 $93.83 $10.012006 444 $76.45 $7.362007 458 $80.29 $8.502008 452 $95.31 $10.132009 435 $48.63 $4.87

Wholesale Electricity Price Trend 2000-2009 (Average, NYS)
Average Wholesale Electric prices $/MWh (NYISO 2010)
$-
$20.00
$40.00
$60.00
$80.00
$100.00
$120.00
2000 2001 2002 2003 2004 2005 2006 2007 2008 2009
Price $/MWh

Wholesale Natural Gas Price Trends 2000-2009 (Average, NYS)
Average NatGas Prices $/MMBtu
$-
$2.00
$4.00
$6.00
$8.00
$10.00
$12.00
2000 2001 2002 2003 2004 2005 2006 2007 2008 2009
NatGas$/MMBtu
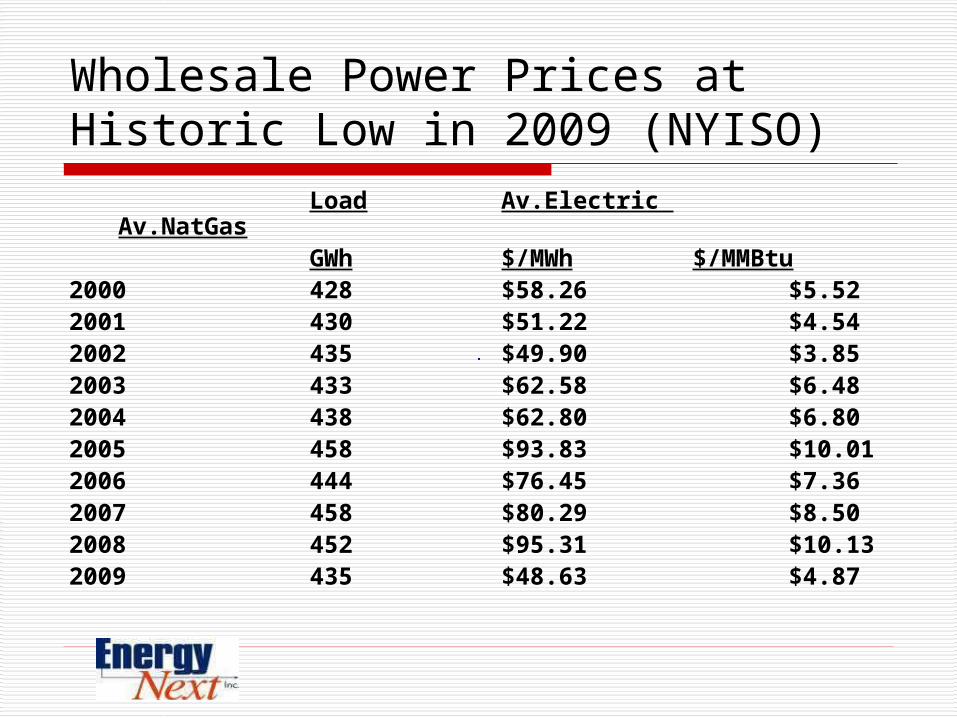
Total Electric DemandNYS 2000-2009
Load GWh (NYISO 2010)
410
415
420
425
430
435
440
445
450
455
460
465
2000 2001 2002 2003 2004 2005 2006 2007 2008 2009
Load GWh

NYMEX Natural Gas Prices

Natural gas storage trend, last 24 months (USEIA)
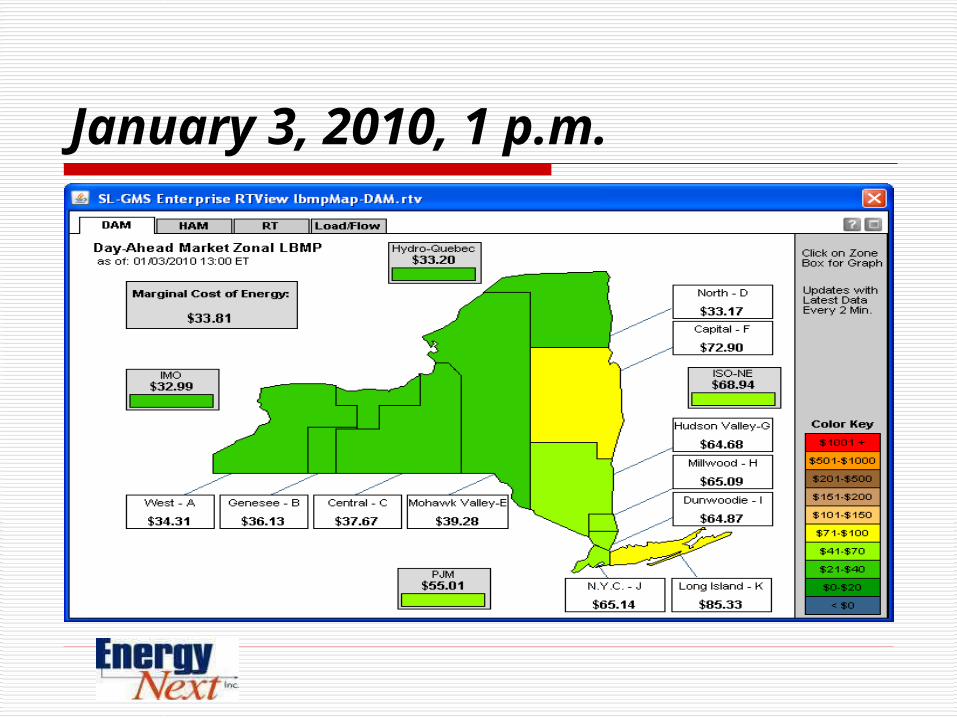
January 3, 2010, 1 p.m.

January 6, 2010, 9 a.m.

Capital Region Pricing Factors
Transmission congestion Insufficient local generation Stable, growing demand (Global Foundries) Cost to region +/- $200,000,000 per year.
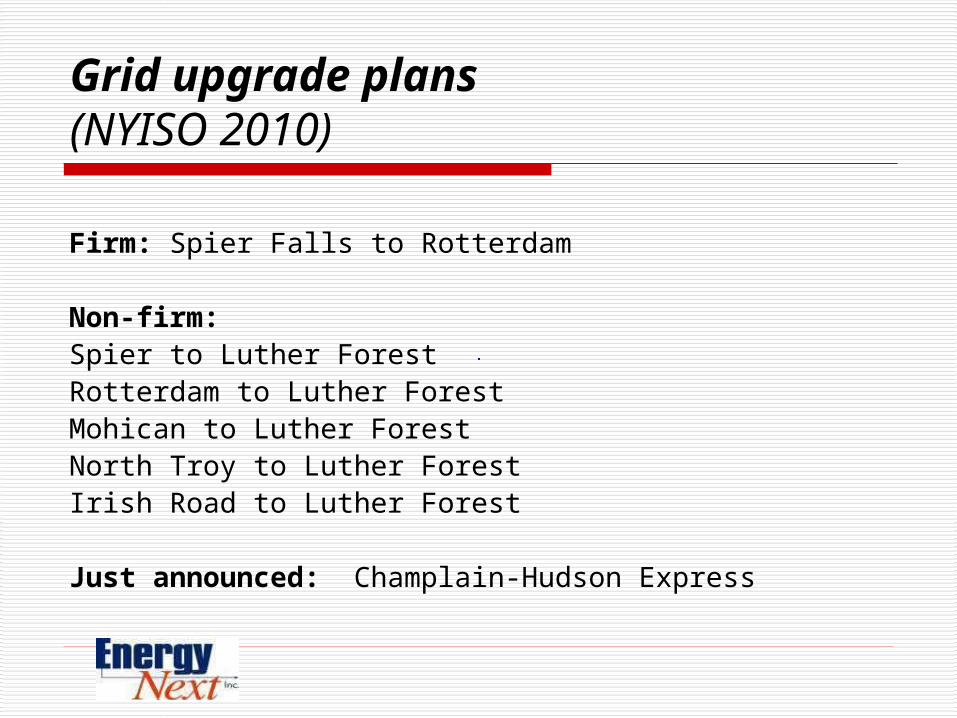
Grid upgrade plans (NYISO 2010)
Firm: Spier Falls to Rotterdam
Non-firm:Spier to Luther ForestRotterdam to Luther ForestMohican to Luther ForestNorth Troy to Luther ForestIrish Road to Luther Forest
Just announced: Champlain-Hudson Express

Cap and Trade: Good News for New York ratepayers
Carbon tax will raise price of coal-fired generation.
Other states are more dependent on coal than New York.
Electric prices will normalize.

New York vs U.S.
New York State 15.27 cents/kwh U.S. average 8.90 cents/kwh

Pennsylvania Electric generation fuel mix, Nov. 2009
Coal
Petroleum
Natural Gas
Nuclear
Renewables

Ohio Electric generation fuel mix Nov. 2009
Coal
Petroleum
Natural Gas
Nuclear
Renewables

NY State Electric generation by fuel source Nov. 2009
Coal
Petroleum
Natural Gas
Nuclear
Renewables
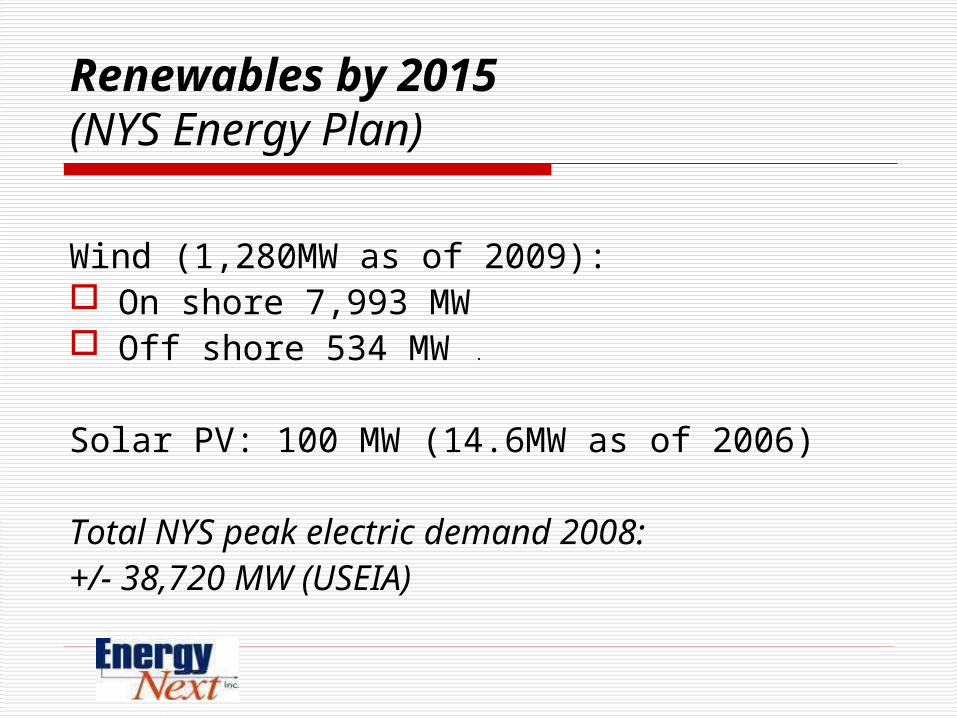
Renewables by 2015 (NYS Energy Plan)
Wind (1,280MW as of 2009): On shore 7,993 MW Off shore 534 MW
Solar PV: 100 MW (14.6MW as of 2006)
Total NYS peak electric demand 2008: +/- 38,720 MW (USEIA)

New York wind resources
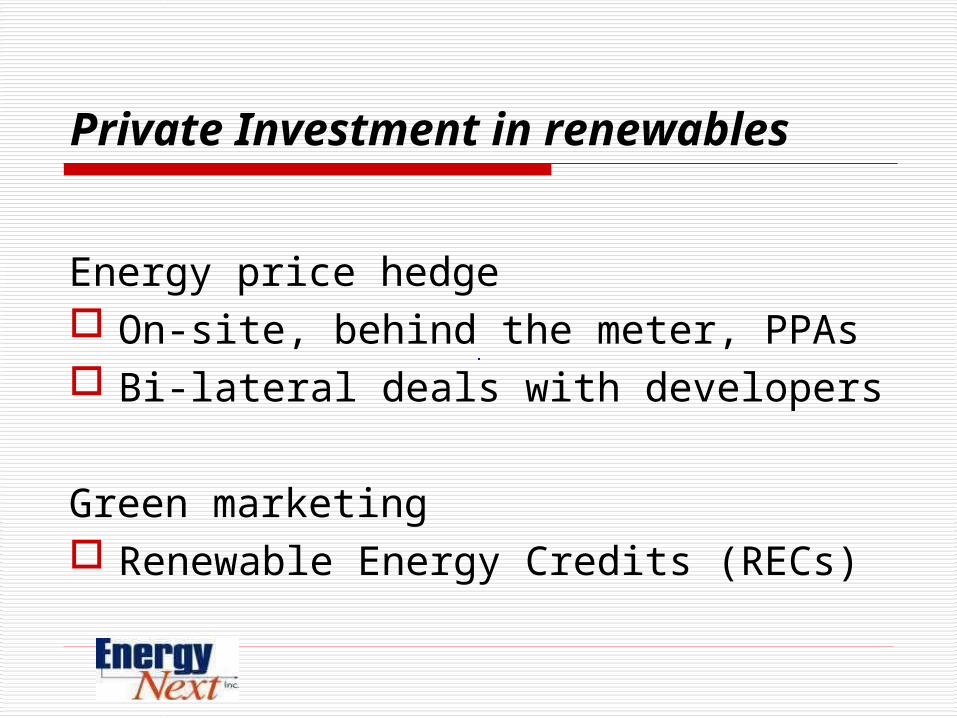
Private Investment in renewables
Energy price hedge On-site, behind the meter, PPAs Bi-lateral deals with developers
Green marketing Renewable Energy Credits (RECs)
…What’s next?
NYS Energy Plan encourages
1. New capacity, both Generation and Transmission.
2. Fuel diversity, especially renewables. 3. Clear signals to consumers from
energy markets to induce efficiency.

Other policy initiatives under way
Smart metering – Installations began 2008. Net metering – Customer sited generation
banking. Article 10 - One-stop permitting expired
2002. Is renewed effort in store? Federal ARRA funding, block grants
Consumer Choices and Responsibilities
Shop for energy supplies, price, rate, tax savings. Pay less.
Energy efficiency, SCR, NYSERDA programs. Use less.
Federal incentives, tax credits for efficiency and renewables