Embed Size (px)
Citation preview

New York University Salomon Center
Leonard N. Stern School of Business
Special Report On
Defaults and Returns in the High-Yield Bond and Distressed Debt
Market:
The Year 2009 in Review and Outlook
By
Edward I. Altman
with
Brenda J. Karlin
February 08, 2010
February 08, 2010 Altman High-Yield Bond Default and Return Report
2
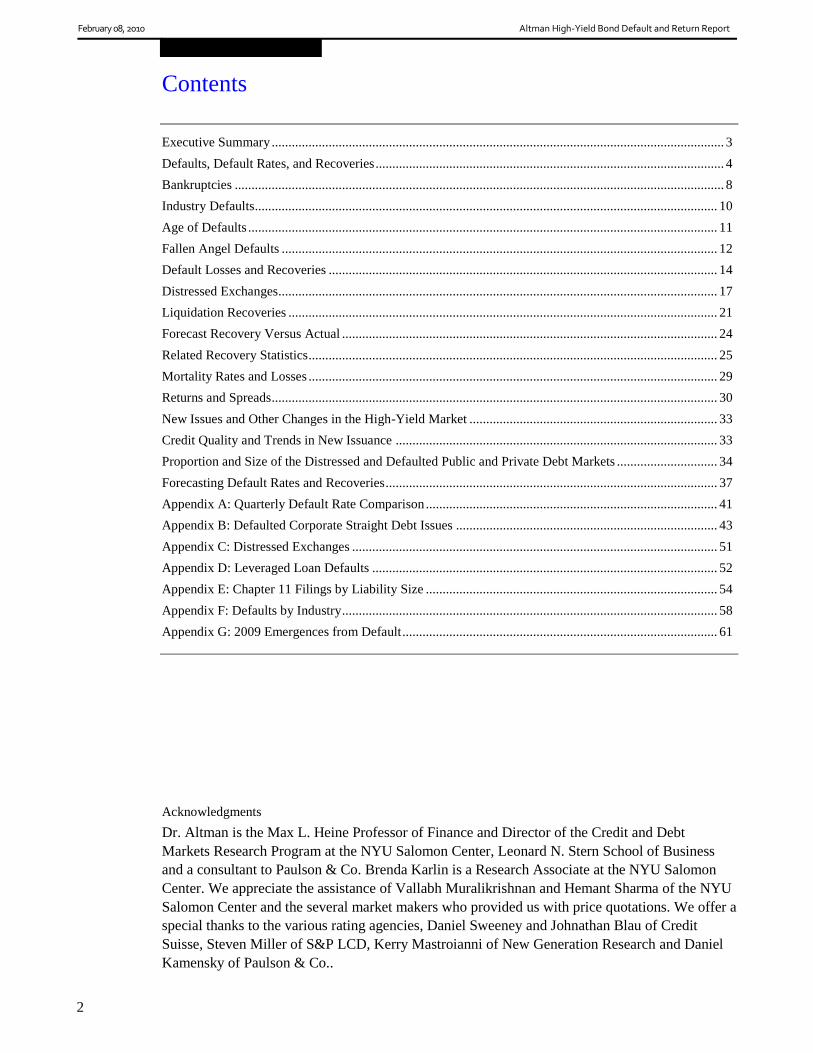
Contents
Executive Summary ....................................................................................................................................... 3
Defaults, Default Rates, and Recoveries ........................................................................................................ 4
Bankruptcies .................................................................................................................................................. 8
Industry Defaults .......................................................................................................................................... 10
Age of Defaults ............................................................................................................................................ 11
Fallen Angel Defaults .................................................................................................................................. 12
Default Losses and Recoveries .................................................................................................................... 14
Distressed Exchanges................................................................................................................................... 17
Liquidation Recoveries ................................................................................................................................ 21
Forecast Recovery Versus Actual ................................................................................................................ 24
Related Recovery Statistics .......................................................................................................................... 25
Mortality Rates and Losses .......................................................................................................................... 29
Returns and Spreads ..................................................................................................................................... 30
New Issues and Other Changes in the High-Yield Market .......................................................................... 33
Credit Quality and Trends in New Issuance ................................................................................................ 33
Proportion and Size of the Distressed and Defaulted Public and Private Debt Markets .............................. 34
Forecasting Default Rates and Recoveries ................................................................................................... 37
Appendix A: Quarterly Default Rate Comparison ....................................................................................... 41
Appendix B: Defaulted Corporate Straight Debt Issues .............................................................................. 43
Appendix C: Distressed Exchanges ............................................................................................................. 51
Appendix D: Leveraged Loan Defaults ....................................................................................................... 52
Appendix E: Chapter 11 Filings by Liability Size ....................................................................................... 54
Appendix F: Defaults by Industry ................................................................................................................ 58
Appendix G: 2009 Emergences from Default .............................................................................................. 61
Acknowledgments
Dr. Altman is the Max L. Heine Professor of Finance and Director of the Credit and Debt
Markets Research Program at the NYU Salomon Center, Leonard N. Stern School of Business
and a consultant to Paulson & Co. Brenda Karlin is a Research Associate at the NYU Salomon
Center. We appreciate the assistance of Vallabh Muralikrishnan and Hemant Sharma of the NYU
Salomon Center and the several market makers who provided us with price quotations. We offer a
special thanks to the various rating agencies, Daniel Sweeney and Johnathan Blau of Credit
Suisse, Steven Miller of S&P LCD, Kerry Mastroianni of New Generation Research and Daniel
Kamensky of Paulson & Co..
February 08, 2010 Altman High-Yield Bond Default and Return Report
3
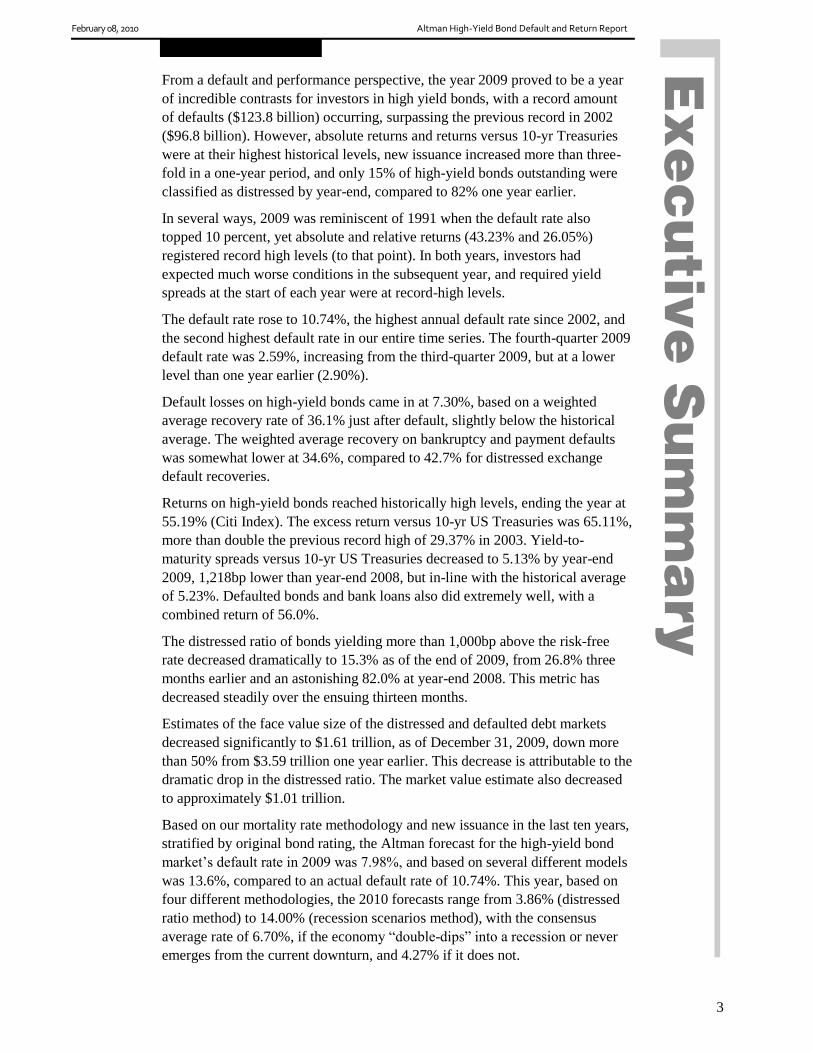
From a default and performance perspective, the year 2009 proved to be a year
of incredible contrasts for investors in high yield bonds, with a record amount
of defaults ($123.8 billion) occurring, surpassing the previous record in 2002
($96.8 billion). However, absolute returns and returns versus 10-yr Treasuries
were at their highest historical levels, new issuance increased more than three-
fold in a one-year period, and only 15% of high-yield bonds outstanding were
classified as distressed by year-end, compared to 82% one year earlier.
In several ways, 2009 was reminiscent of 1991 when the default rate also
topped 10 percent, yet absolute and relative returns (43.23% and 26.05%)
registered record high levels (to that point). In both years, investors had
expected much worse conditions in the subsequent year, and required yield
spreads at the start of each year were at record-high levels.
The default rate rose to 10.74%, the highest annual default rate since 2002, and
the second highest default rate in our entire time series. The fourth-quarter 2009
default rate was 2.59%, increasing from the third-quarter 2009, but at a lower
level than one year earlier (2.90%).
Default losses on high-yield bonds came in at 7.30%, based on a weighted
average recovery rate of 36.1% just after default, slightly below the historical
average. The weighted average recovery on bankruptcy and payment defaults
was somewhat lower at 34.6%, compared to 42.7% for distressed exchange
default recoveries.
Returns on high-yield bonds reached historically high levels, ending the year at
55.19% (Citi Index). The excess return versus 10-yr US Treasuries was 65.11%,
more than double the previous record high of 29.37% in 2003. Yield-to-
maturity spreads versus 10-yr US Treasuries decreased to 5.13% by year-end
2009, 1,218bp lower than year-end 2008, but in-line with the historical average
of 5.23%. Defaulted bonds and bank loans also did extremely well, with a
combined return of 56.0%.
The distressed ratio of bonds yielding more than 1,000bp above the risk-free
rate decreased dramatically to 15.3% as of the end of 2009, from 26.8% three
months earlier and an astonishing 82.0% at year-end 2008. This metric has
decreased steadily over the ensuing thirteen months.
Estimates of the face value size of the distressed and defaulted debt markets
decreased significantly to $1.61 trillion, as of December 31, 2009, down more
than 50% from $3.59 trillion one year earlier. This decrease is attributable to the
dramatic drop in the distressed ratio. The market value estimate also decreased
to approximately $1.01 trillion.
Based on our mortality rate methodology and new issuance in the last ten years,
stratified by original bond rating, the Altman forecast for the high-yield bond
market’s default rate in 2009 was 7.98%, and based on several different models
was 13.6%, compared to an actual default rate of 10.74%. This year, based on
four different methodologies, the 2010 forecasts range from 3.86% (distressed
ratio method) to 14.00% (recession scenarios method), with the consensus
average rate of 6.70%, if the economy ―double-dips‖ into a recession or never
emerges from the current downturn, and 4.27% if it does not.

February 08, 2010 Altman High-Yield Bond Default and Return Report
4
Defaults, Default Rates, and Recoveries
The high-yield bond default rate in 2009 soared to levels unprecedented over the past
seven years. 2009 witnessed the second highest dollar denominated default rate in
our time series (from 1971), lower only than the rate realized in 2002. The rate
increased from 4.65% at year-end 2008 to 10.74% for all of 2009. Defaults include
straight corporate bonds whose firms went bankrupt, missed an interest payment and
did not cure it within the grace or forbearance period, or completed a distressed
exchange. The 2009 rate is based on a mid-year market size of $1.153 trillion, up by
$62 billion from a year earlier. In all, $123.8 billion of defaults, the largest dollar
amount ever, was recorded in 2009 (Figure 1), surpassing 2002 by $27 billion. Note
in Figure 1 that the historical weighted-average annual default rate is 4.55% over the
39 year period (1971-2009). This weighted-average rate is up considerably compared
to 3.94% at the end of 2008. Our weights are based on the par value of high-yield
bonds outstanding in each year. The arithmetic annual average default rate climbed
to 3.33% from 3.14% one year earlier.
In the fourth quarter of 2009, the default rate was 2.59%, larger than one quarter earlier
(0.83%), but lower than both the first two quarters of 2009 as well as the fourth quarter
of 2008 (Figure 2 and Appendix A). Two-thirds of the dollar amount of defaults in the
fourth quarter was related to the bankruptcy filing by CIT Group. Indeed, had this
default not occurred, the quarterly default rate would have been a mere 0.74%, the
lowest since the third-quarter 2008, indicating a slow-down in the rapid pace of defaults
which has plagued the market in the past year. Eighteen issuers defaulted in the fourth
quarter on 76 issues. The most sizeable defaults during the year were CIT, defaulting on
over $22 billion of outstanding bonds, Charter Communications, defaulting on almost
$13 billion, and General Motors, which defaulted on over $10 billion. Abitibi Bowater,
Ford Motor, Harrah’s, Nortel, and R.H. Donnelley each defaulted on outstanding bonds
of more than $3 billion. In all, 119 issuers constituting 405 issues defaulted in 2009
(Appendix B), considerably greater than the 63 issuers and 154 issues that defaulted in
2008. The average dollar amount of defaulting bonds per defaulting issuer in 2009 was
$1.04 billion, compared to $796 million in 2008, and $288 million in 2007. Lehman
Brothers is not included in the 2008 statistics since its bonds were not rated non-
investment grade before defaulting.
In our default statistics, we include those bonds from distressed exchanges actually
tendered. For example, in the Ford Motor Co. exchange, $3.35 billion of bonds were
exchanged of the $8.2 billion outstanding and subject to the exchange offer. In 2009,
there were a record 53 distressed exchanges, involving 45 companies, comprising
$22.9 billion of defaults (18.5% of the total). See Appendix C for the list of 2009
distressed exchanges and later our discussion of these restructurings.
In 2009, S&P and Moody’s issuer-denominated default rates were 10.93% and
13.22%, respectively. Moody’s 16.50% dollar-denominated default rate was greater
than its issuer-denominated rate, as is usually the case in a stressed year. Fitch’s
dollar-denominated default rate for 2009 was 13.70%.
The issuer-based default rate for the last 12 months in the US leveraged loan market
was 8.07% (Figure 3), and 9.61% based on amount of issuance, according to S&P’s
LCD compilations. This is in contrast to the significantly smaller rates of 4.35% and

February 08, 2010 Altman High-Yield Bond Default and Return Report
5
3.75%, respectively, at the end of 2008. Sixty-four leveraged loan issuers defaulted
in 2008 (Appendix D), compared to forty-one in 2008. According to our comparison
between high-yield bond defaults (Appendix B) and leveraged loan defaults
(Appendix D), 27 firms had both bonds and leveraged loans default in 2009.
Since the U.S. economy went into a recession in December 2007, and technically
was still in recession in 2009, both 2008 and 2009 are included as recession years.
Whereas the default rate began increasing two years, or so, before the start of the two
prior recessions, this time the increase in default rates coincided with the beginning
(Figure 4). In all five prior recessions since 1972, it is clear that the default rates
peaked near the end, or soon after the recession. Since 2010’s economic outlook is
highly uncertain, our default rate forecast will be based on both recession and non-
recession scenarios.

February 08, 2010 Altman High-Yield Bond Default and Return Report
6
Figure 1. Historical Default Rates — Straight Bonds Only, Not
Including Defaulted Issues From Par Value Outstanding, 1971–2009
(Dollars in Millions)
Par Value
Year
Outstandinga
($) Defaults ($)
Default Rates
(%)
2009 1,152,952 123,824 10.740
2008 1,091,000 50,763 4.653
2007 1,075,400 5,473 0.509
2006 993,600 7,559 0.761
2005 1,073,000 36,209 3.375
2004 933,100 11,657 1.249
2003 825,000 38,451 4.661
2002 757,000 96,858 12.795
2001 649,000 63,609 9.801
2000 597,200 30,295 5.073
1999 567,400 23,532 4.147
1998 465,500 7,464 1.603
1997 335,400 4,200 1.252
1996 271,000 3,336 1.231
1995 240,000 4,551 1.896
1994 235,000 3,418 1.454
1993 206,907 2,287 1.105
1992 163,000 5,545 3.402
1991 183,600 18,862 10.273
1990 181,000 18,354 10.140
1989 189,258 8,110 4.285
1988 148,187 3,944 2.662
1987 129,557 7,486 5.778
1986 90,243 3,156 3.497
1985 58,088 992 1.708
1984 40,939 344 0.840
1983 27,492 301 1.095
1982 18,109 577 3.186
1981 17,115 27 0.158
1980 14,935 224 1.500
1979 10,356 20 0.193
1978 8,946 119 1.330
1977 8,157 381 4.671
1976 7,735 30 0.388
1975 7,471 204 2.731
1974 10,894 123 1.129
1973 7,824 49 0.626
1972 6,928 193 2.786
1971 6,602 82 1.242
Standard
Deviation (%)
Arithmetic Average
Default Rate
1971 to 2009 3.331 3.224
1978 to 2009 3.636 3.422
1985 to 2009 4.322 3.548
Weighted Average
Default Rateb
1971 to 2009 4.550
1978 to 2009 4.561
1985 to 2009 4.598
Median Annual Default
Rate
1971 to 2009 1.896
a As of midyear.
b Weighted by par value of amount outstanding for each year.
Source: NYU Salomon Center.

February 08, 2010 Altman High-Yield Bond Default and Return Report
7
Figure 2. Quarterly and the Four-Quarter Moving Average Default Rate
1989–2009
0.0%
1.0%
2.0%
3.0%
4.0%
5.0%
6.0%
198919901991199219931994199519961997199819992000200120022003200420052006200720082009
Qu
arte
rly
Def
ault
Rat
e
0.0%
2.0%
4.0%
6.0%
8.0%
10.0%
12.0%
14.0%
16.0%
4 -
Qu
arte
r M
ovin
g A
vera
ge
Quarterly
Moving
Source: NYU Salomon Center.
Figure 3. S&P Leveraged Loan Index 12-Month Moving Average Default
Rate 1998–2009 (Number of Issuers)
0.00%
1.00%
2.00%
3.00%
4.00%
5.00%
6.00%
7.00%
8.00%
9.00%
Dec-98
Jun-99
Dec-99
Jun-00
Dec-00
Jun-01
Dec-01
Jun-02
Dec-02
Jun-03
Dec-03
Jun-04
Dec-04
Jun-05
Dec-05
Jun-06
Dec-06
Jun-07
Dec-07
Jun-08
Dec-08
Jun-09
Dec-09
Source: Standard & Poor’s LCD.
Figure 4. Historical Default Rates and Recession Periods in the US
High-Yield Bond Market, 1972–2009
Periods of Recession: 11/73–3/75, 1/80–7/80, 7/81–11/82, 7/90–3/91, 4/01–12/01, 12/07–
12/09 (still continuing as of 12/09).
Sources: Figure 1 of this report and National Bureau of Economic Research.
0.0%
2.0%
4.0%
6.0%
8.0%
10.0%
12.0%
14.0%
72 74 76 78 80 82 84 86 88 90 92 94 96 98 00 02 04 06 08

February 08, 2010 Altman High-Yield Bond Default and Return Report
8
Bankruptcies
As can be seen in Figure 5, the amount of total liabilities for Chapter 11 bankruptcies
in 2009 was $604.0 billion, based on 234 filings. Where total liabilities exceeded
$100 million, the total liabilities for filings in 2009 are larger than any prior year,
except for last ($720.8 billion), which included the Lehman Brothers’ filing. General
Motors Corp. was the largest bankruptcy filing in 2009, with $172.8 billion in
liabilities. Without Lehman, this past year’s liabilities in bankruptcy would have
exceeded 2008 by almost $500 billion, and would be greater than the previous peak
in 2002 by almost $250 billion.
Appendix E lists this year’s large Chapter 11 bankruptcies. Our bankruptcy list
includes a large number of LBOs. So far this year, there were 74 bankrupt LBOs (six
in which the PE firm had only a minority interest), 25 more than the 49 of such
filings for all of 2008.1
Figure 5. Total Filings and Liabilitiesa of Public Companies Filing
for Chapter 11 Protection, 1989–2009
$0
$100
$200
$300
$400
$500
$600
$700
$800
89 90 91 92 93 94 95 96 97 98 99 00 01 02 03 04 05 06 07 08 (Excl. LEH
)
08 (Incl. LEH
)
2009
$ B
illi
on
0
40
80
120
160
200
240
280
Pre- Petition Liabilities, in $ billions (left axis)
Number of Filings (right axis)
2009
234 filings and liabilities of
$604.0 billion
2008
Excluding Lehman
Brothers
145 filings and
liabilities of
$107.8 billion
Including Lehman
Brothers
146 filings and
liabilities of $720.8
billion
a Minimum $100 million in liabilities.
Sources: Appendix E from the NYU Salomon Center Bankruptcy Filings Database.
The number of billion-dollar bankruptcies in 2009 increased two-fold from 21, last
year, to 43, higher than the 41 recorded in 2002, the prior record year. The majority
of the larger bankruptcies were in the auto/motor carrier, financial services,
communications, and construction/real estate sectors (Appendix D).
According to New Generation Research, the number of public companies filings was
207 (Figure 6). The average of total liabilities for all 234 bankruptcy filings in 2009
was $2.6 billion, down from $4.9 billion one year earlier. The latter figure would
have been just 0.7 billion without Lehman.
1 List compiled by E. Griffith, published on www.pehub.com.

February 08, 2010 Altman High-Yield Bond Default and Return Report
9
Figure 6. Historical Bankruptcy Filings 1980–2008
Year Total Filingsa
Total Filingsb
(>$100
Million)
Total Filings
(≥$1 Billion)
Total
Liabilitiesb
($ MN)
(>100 Million)
Average
Liabilitiesb
($ MN)
(>100 Million)
1980 62 4 0 746.0 186.5
1981 74 6 1 3960.0 660.0
1982 84 12 3 7113.0 592.8
1983 89 14 3 13674.0 976.7
1984 121 12 0 3440.0 286.7
1985 149 14 2 8605.2 614.7
1986 149 11 3 9335.4 850.5
1987 112 12 1 25421.0 2118.4
1988 122 14 2 6905.0 493.2
1989 135 22 10 33538.9 1524.5
1990 115 35 10 41115.1 1174.7
1991 123 51 11 81157.9 1591.3
1992 91 37 14 64224.1 1735.8
1993 86 37 4 17701.1 478.4
1994 70 24 1 8396.0 349.8
1995 85 32 7 27153.0 848.5
1996 86 32 0 11687.0 365.2
1997 83 36 5 18865.9 524.1
1998 122 56 6 32038.3 572.1
1999 145 109 19 70957.1 651.0
2000 179 136 23 98895.8 727.2
2001 263 169 38 228604.1 1352.7
2002 220 135 41 336611.7 2493.4
2003 172 102 26 115171.8 1129.1
2004 92 44 11 39549.7 898.9
2005 86 34 10 141525.2 4162.5
2006 66 32 4 22321.6 697.6
2007 78 38 8 72642.7 1911.7
2008 136 147 21 721009.8 4904.8
2009 207 234 43 603992.3 2581.2
Total 3602 1641 327 2,866,382.3 1,746.7
a Represents both Chapter 7 and 11 public company filings (Source: New Generation
Research). b
Filings of all companies, including private firms, with Total Liabilities
greater than $100 million (Source: NYU Salomon Center Bankruptcy Filings Database). c
Filings with Total Liabilities greater than $1 billion (Source: NYU Salomon Center
Bankruptcy Filings Database).
In Figure 7, we compare the date of default with the Chapter 11 filing date for firms
that defaulted on bonds and also went bankrupt going back to 1981. Based on 833
observations from the NYU Salomon Center Master Default and Bankruptcy
Databases, both events occurred on the same date in 408 instances (49%). In the
remaining 51% of the cases, the lag between the default date and bankruptcy date
varied considerably, with decreasing levels as the two dates became further separated
from each other. Of course, some defaulting issuers never formally file for
bankruptcy as their problems are settled out of court or the default comes as a result
of a distressed exchange, and they do not file for bankruptcy in subsequent years
(many do, however – see our discussion at a later point).

February 08, 2010 Altman High-Yield Bond Default and Return Report
10
Figure 7. Time Differential Between Default and Bankruptcy Filinga
(1981–2009)
0%
10%
20%
30%
40%
50%
60%
0 2 4 6 8 10 12 14 16 18 20 22 24 26 28 29 31 33 35
Number of Months Lag
% o
f the
Tot
al O
bser
vatio
ns
*Based on 833 observations
Source: NYU Salomon Center Default and Bankruptcy Filings Databases
(408)
a
Based on 833 observations.
Source: NYU Salomon Center Default and Bankruptcy Filings Databases.
Industry Defaults
Figure 8 lists the number of high-yield bond defaults by industry. Of the total 119
defaulting issuers in 2009, general manufacturers, communications and media,
leisure and entertainment, and real estate/construction were industries in which a
total of 78 firms defaulted. Nine issuers defaulted in the auto/motor carrier sector,
eight in energy, and seven in both financial services and transportation. The
remaining ten defaulting issuers were spread over various industries. Appendix E
presents a more detailed breakdown of all 119 defaulting issuers.
Figure 9 shows high-yield corporate bond defaults across industries per dollar
amount since 1990. Communications and media ―lead‖ the 2009 totals, due primarily
to the Charter Communications and R.H. Donnelley defaults. As in the past, we
observe that the communications and media sector far outdistanced all other sectors
in the dollar amount of defaulting issues over the last 19 years, primarily the result of
the telecom meltdown during 2000–02, as well as 2009’s defaults due to large-scale
bankruptcies.

February 08, 2010 Altman High-Yield Bond Default and Return Report
11
Figure 8. Corporate Bond Defaults by Industry (Number of Companies)
Industry 1970–89 1990 1991 1992 1993 1994 1995 1996 1997 1998 1999 2000 2001 2002 2003 2004 2005 2006 2007 2008 2009 Total
Auto/Motor
Carrier
6 3 1 1 1 4 3 8 9 36
Conglomerates 5 1 3 3 1 1 1 15
Energy 35 4 2 3 1 1 13 1 8 9 1 1 4 8 91
Financial
Services
21 7 14 3 2 1 2 1 2 6 1 6 4 5 6 2 3 2 5 7 100
Leisure/Entertai
nment
9 8 2 4 3 4 3 1 5 5 8 9 6 5 6 3 10 12 103
General
Manufacturing
26 5 8 8 7 3 8 6 7 6 16 23 43 22 13 17 12 6 7 10 35 288
Health Care 4 2 1 1 1 2 2 8 6 3 4 3 2 1 1 41
Miscellaneous
Industries
16 4 4 3 1 1 1 3 3 16 34 38 25 16 6 1 4 3 4 5 188
Real
Estate/Construct
ion
14 7 5 1 2 1 2 1 4 6 4 3 2 1 6 11 70
REIT 12 1 1 14
Retailing 10 6 15 6 4 5 6 3 6 6 12 7 12 5 5 3 2 2 3 5 5 128
Comm. & Media 17 3 4 1 1 3 2 2 1 6 11 8 39 26 21 6 3 2 4 10 20 190
Transportation
(Non Auto)
9 1 2 2 2 1 8 5 7 7 6 2 5 1 7 65
Utilities 2 1 1 1 1 0 0 6
Total 186 47 62 34 22 19 28 15 29 37 98 107 156 112 86 39 34 23 19 63 119 1,335
Source: NYU Salomon Center.
Figure 9. Corporate Bond Defaults by Industry (Dollars in Millions)
Industry 1990 1991 1992 1993 1994 1995 1996 1997 1998 1999 2000 2001 2002 2003 2004 2005 2006 2007 2008 2009 Total
Auto/Motor
Carrier
468 90 215 300 100 430 120 3,737 285 280 3,573 2,692 1,382 16,872 30,544
Conglomerates 100 690 275 1,065
Energy 60 103 600 75 100 3,812 217 4,200 4,085 11,857 8,895 50 1,511 1,993 37,558
Financial
Services
928 696 536 78 687 700 66 689 375 1,968 5,062 3,803 1,079 110 541 156 26,973 29,274 73,721
Leisure/
Entertainment
498 1,191 159 138 435 293 245 1,100 2,891 3,437 21,242 633 1,286 6,861 715 6,022 10,395 57,541
General
Manufacturing
2,675 3,695 488 118 616 641 123 247 2,092 2,507 3,138 2,455 2,108 225 1,396 1,486 2,379 3,747 25,766 55,902
Health Care 18 1,120 75 125 2,214 1,715 692 115 3,843 360 520 150 10,947
Miscellaneous
Industries
1,968 4,911 1,378 1,056 317 1,286 832 461 1,290 7,615 8,352 9,715 5,594 4,494 1,977 569 409 1,396 1,505 1,787 56,912
Real Estate/
Construction
2,605 417 113 49 75 190 258 383 385 252 1,110 1,088 77 1,783 174 2,158 4,803 15,921
Retailing 4,443 2,937 1,489 18 2,814 395 164 2,504 1,241 2,052 3,081 1,586 4,092 877 749 1,059 332 363 1,412 1,015 32,623
Communications
& Media
460 286 1,549 2,980 5,983 34,827 47,953 7,603 2,551 150 1,496 765 5,904 30,954 143,461
Transportation
(Non Auto)
1,028 1,452 301 562 1,125 310 2,890 1,430 4,711 2,086 2,421 12,376 272 964 31,928
Utilities 1,452 617 85 275 202 75 1,150 1,417
5,273
Total 14,631 18,021 4,883 1,926 3,723 4,536 3,465 4,200 6,994 23,440 29,976 68,934 96,673 36,764 11,657 35,954 7,559 5,473 50,763 123,824 552,801
Source: NYU Salomon Center.
Age of Defaults
Figure 10 shows the age distribution of defaults in 2009 and for the period 1991–
2009. It appears normal that the number of defaults is low in the first year after
issuance. What typically follows is an increase in default rates in years two through
four. Indeed, 2009 essentially mirrors the cumulative default proportions over 1991–
2009, in terms of marginally increasing default frequencies in years one through
three, slightly lower rates in years four and five versus three. There was a somewhat
interesting increase in six-year-old issues and a disproportionately large cohort

February 08, 2010 Altman High-Yield Bond Default and Return Report
12
(15%) of bonds issued ten or more years prior to default. Many bonds that were ten
years or older that defaulted in 2009 were originally investment-grade issues. Again,
as in 2008, a small proportion (5%) defaulted during the first year after issuance. The
historical average is 8%.
Figure 10. Distribution of Years to Default From Original Issuance Date (By Year of
Default), 1991–2009
1991 1992 1993/1994 1995 1996/1997 1998 1999 2000 2001
Years
to No. of % of No. of % of No. of % of No. of % of No. of % of No. of % of No. of % of No. of % of No. of % of
Default Issues Total Issues Total Issues Total Issues Total Issues Total Issues Total Issues Total Issues Total Issues Total
1 0 0 0 0 3 8 1 3 7 14 2 6 32 26 19 10 40 12
2 18 13 0 0 6 16 9 28 7 14 5 15 37 30 51 28 69 21
3 26 19 7 13 5 14 7 22 7 14 10 30 15 12 56 31 87 26
4 29 21 10 19 2 5 3 9 17 36 3 9 14 11 14 8 65 19
5 35 26 8 15 4 11 1 3 4 8 10 30 7 6 13 7 27 8
6 10 7 12 22 8 22 2 6 5 10 2 6 8 6 5 3 14 4
7 4 3 5 9 7 19 2 6 0 0 1 3 10 8 12 7 21 6
8 10 7 4 7 0 0 2 6 0 0 0 0 2 2 4 2 5 1
9 3 2 0 0 0 0 4 13 0 0 0 0 0 0 3 2 4 1
10+ 2 1 8 15 2 5 1 3 2 4 0 0 0 0 6 3 3 1
Total 137 100 54 100 37 100 32 100 49 100 33 100 125 100 183 100 335 100
2002 2003 2004 2005 2006 2007 2008 2009 1991–2009
Years
to
No. of
% of
No. of
% of
No. of
% of
No. of
% of
No. of
% of
No. of
% of
No. of
% of
No. of
% of
No. of
% of
Default Issues Total Issues Total Issues Total Issues Total Issues Total Issues Total Issues Total Issues Total Issues Total
1 29 8 18 9 8 10 16 9 2 4 1 3 9 6 20 5 207 8
2 51 15 30 15 7 9 13 7 4 8 1 3 18 12 39 10 365 15
3 61 18 26 13 8 10 9 6 6 12 6 17 34 22 65 16 435 18
4 56 16 23 11 6 8 22 12 5 10 9 26 30 19 61 15 369 15
5 45 13 40 20 10 13 14 8 4 8 3 9 20 13 51 13 296 12
6 21 6 20 10 16 21 17 9 9 17 4 11 10 6 58 14 221 9
7 8 2 25 12 9 12 13 7 6 12 2 6 9 6 15 4 149 6
8 7 2 3 1 6 8 11 6 7 13 5 14 6 4 18 4 90 4
9 12 3 5 2 1 1 5 3 6 12 1 3 7 5 16 4 67 3
10+ 54 16 13 6 6 8 64 34 3 6 3 9 11 7 62 15 240 10
Total 344 100 203 100 77 100 184 100 52 100 35 100 154 100 405 100 2,439 100
Source: NYU Salomon Center.
Fallen Angel Defaults
Twenty-three issuers (19% of the total in 2009) were responsible for 129 (32% of the
total) defaulting issues that were investment grade at some time prior to default. This
results in a fallen-angel issuer default rate of 8.07%, considerably higher than the
historical average of 3.88% (Figure 11). The fallen-angel default rate for 1985–2009
is slightly below the historical average annual rate for original issue defaults in the
high-yield bond market (4.60%). This differential (3.88% vs. 4.60%), however, is not
statistically significant due to a relatively high standard deviation of around 260bp
per year between the two rates. Figure 12 shows the fallen angel proportion of
defaults from 1977 to the present. In 2009, 32% of defaulted issues were originally
rated investment grade, somewhat above the historical average of 27%.

February 08, 2010 Altman High-Yield Bond Default and Return Report
13
Figure 11. Fallen Angels Versus Original(S&P)Issue and All High
Yield Default Ratesa (In Percent)
Year
Fallen Angel
Average
12-Mo. Default
Rate
Original Issue
Speculative Grade
Default Rates
All Speculative
Grade Bond
Default Rates
Altman Dollar
Weighted Annual
Default Rates
2009 8.07 11.89 10.93 10.74
2008 3.07 4.34 4.02 4.60
2007 0.86 1.00 0.97 0.51
2006 1.40 1.23 1.26 0.76
2005 2.74 3.70 2.48 3.37
2004 0.83 2.65 2.23 1.25
2003 5.88 5.46 5.53 4.66
2002 6.59 8.55 8.32 12.79
2001 8.46 10.14 10.99 9.81
2000 7.01 7.10 7.03 5.07
1999 4.01 5.10 4.62 4.15
1998 3.31 2.75 2.23 1.60
1997 2.04 2.10 1.71 1.25
1996 1.38 2.00 1.71 1.23
1995 0.25 3.90 3.07 1.90
1994 0.00 2.31 1.70 1.45
1993 1.72 1.99 1.79 1.10
1992 4.50 5.48 5.45 3.40
1991 7.53 10.86 11.66 10.27
1990 5.77 8.30 8.20 10.14
1989 3.74 4.93 5.33 4.29
1988 4.25 3.39 3.95 2.66
1987 4.36 2.92 2.41 5.78
1986 2.46 6.29 4.78 3.50
1985 6.77 4.06 3.24 1.71
Arithmetic Average
3.88 4.90 4.62 4.32
Standard Deviation
2.51 2.99 3.15 3.55
a All S&P issuer based except for Altman rates.
Sources: NYU Salomon Center and S&P.

February 08, 2010 Altman High-Yield Bond Default and Return Report
14
Figure 12. Fallen Angel Defaulted Issues by Original Rating, 1977-
2009
Year Total No. Defaulted Issuesa
Originally Rated Investment
Grade (%)
2009 405 32
2008 154 31
2007 35 11
2006 52 13
2005 184 49
2004 79 19
2003 203 33
2002 322 39
2001 258 14
2000 142 16
1999 87 13
1998 39 31
1997 20 0
1996 24 13
1995 29 10
1994 16 0
1993 24 0
1992 59 25
1991 163 27
1990 117 16
1989 66 18
1988 64 42
1987 31 39
1986 55 15
1985 26 4
1984 14 21
1983 7 43
1982 20 55
1981 1 0
1980 4 25
1979 1 0
1978 1 100
1977 2 100
Total 2,704 27%
a Where we could find an original rating from either S&P or Moody's.
Sources: Moody's, NYU Salomon Center, and S&P.
Default Losses and Recoveries
The weighted-average recovery rate (based on market prices just after defaults) on
high-yield bond defaults in 2009 remained below the historic average of 44.8% to
end the year at 36.1%. This is lower than the recovery rate of 42.5% in 2008, and is
the lowest rate since 2002. The default loss rate in 2009, without an adjustment for
fallen angels and including the loss of 0.438% (43.8bp) from lost coupons, was
approximately 730.0bp (Figure 13). If we remove fallen angel defaults (129 issues)
the loss would have been 1,009.2bp on original issue high-yield bonds.
Unlike the prior two quarters, the recovery rate on fallen angels was higher than on
original non-investment grade bonds demonstrating a return to the norm. This was
the result of the CIT defaults, which recovered roughly 65%, diluting the effect of
the GM default earlier in the year, which had recovered only about 10%. Over the
32-year period from 1978 to 2009, the arithmetic average annual loss rate on high-
yield bond defaults is 2.45%, 3.09% on a weighted-average basis (Figure 14).

February 08, 2010 Altman High-Yield Bond Default and Return Report
15
Figure 13. 2009 Default Loss Rate
Unadjusted for
Fallen Angels
(%)
Only Fallen
Angels (%)
All Except
Fallen Angels
(%)
Price Adjusted
for
Fallen Angels
(%)
Background Data
Average Default Rate 10.740 8.070 13.644 11.462
Average Price At Defaulta 36.133 43.224 30.784 35.655
Average Price At Downgradeb 81.04
Average Recovery 36.133 53.337 30.784 39.614
Average Loss Of Principal 63.867 46.663 69.216 60.386
Average Coupon Payment 8.163 5.856 9.504 8.076
Default Loss Computation
Default Rate 10.740 8.070 13.644 11.462
X Loss Of Principal 63.867 46.663 69.216 60.386
Default Loss of Principal 6.859 3.766 9.443 6.921
Default Rate 10.740 8.070 13.644 11.462
X Loss of 1/2 Coupon 4.082 2.928 4.752 4.038
Default Loss of Coupon 0.438 0.236 0.648 0.463
Default Loss of Principal
and Coupon
7.297 4.002 10.092 7.384
a If default date price is not available, end-of-month price is used.
b Downgrade to non-
investment grade. Note: Average Default Rate of “Only Fallen Angels” is based on number
of issuers.
Sources: NYU Salomon Center and various dealer quotes.

February 08, 2010 Altman High-Yield Bond Default and Return Report
16
Figure 14. Default Rates and Losses,a 1978–2009 (Dollars in Millions)
Year
Par Value
Outstandinga
($)
Par Value
of Default
($)
Default
Rate (%)
Weighted
Price After
Default ($)
Weighted
Coupon (%)
Default Loss
(%)b
2009 1,152,952 123,824 10.74 36.1 8.16 7.30
2008 1,091,000 50,763 4.65 42.5 8.23 2.83
2007 1,075,400 5,473 0.51 66.6 9.64 0.19
2006 993,600 7,559 0.76 65.3 9.33 0.30
2005 1,073,000 36,209 3.37 61.1 8.61 1.46
2004 933,100 11,657 1.25 57.7 10.30 0.59
2003 825,000 38,451 4.66 45.5 9.55 2.76
2002 757,000 96,858 12.79 25.3 9.37 10.15
2001 649,000 63,609 9.80 25.5 9.18 7.76
2000 597,200 30,295 5.07 26.4 8.54 3.95
1999 567,400 23,532 4.15 27.9 10.55 3.21
1998 465,500 7,464 1.60 35.9 9.46 1.10
1997 335,400 4,200 1.25 54.2 11.87 0.65
1996 271,000 3,336 1.23 51.9 8.92 0.65
1995 240,000 4,551 1.90 40.6 11.83 1.24
1994 235,000 3,418 1.45 39.4 10.25 0.96
1993 206,907 2,287 1.11 56.6 12.98 0.56
1992 163,000 5,545 3.40 50.1 12.32 1.91
1991 183,600 18,862 10.27 36.0 11.59 7.16
1990 181,000 18,354 10.14 23.4 12.94 8.42
1989 189,258 8,110 4.29 38.3 13.40 2.93
1988 148,187 3,944 2.66 43.6 11.91 1.66
1987 129,557 7,486 5.78 75.9 12.07 1.74
1986 90,243 3,156 3.50 34.5 10.61 2.48
1985 58,088 992 1.71 45.9 13.69 1.04
1984 40,939 344 0.84 48.6 12.23 0.48
1983 27,492 301 1.09 55.7 10.11 0.54
1982 18,109 577 3.19 38.6 9.61 2.11
1981 17,115 27 0.16 72.0 15.75 0.15
1980 14,935 224 1.50 21.1 8.43 1.25
1979 10,356 20 0.19 31.0 10.63 0.14
1978 8,946 119 1.33 60.0 8.38 0.59
Arithmetic Average 1978–2009 3.64 44.79 10.64 2.45
Weighted Average 1978–2009 4.56 3.09
a Excludes defaulted issues.
b Default loss rate adjusted for fallen angels is 9.3% in
2002, 1.82% in 2003, 0.59% in 2004, 1.56% in 2005, 0.039% in 2006, 0.20% in 2007, 3.42%
in 2008, and 7.38% in 2009.
Source: NYU Salomon Center.
Figure 15 lists the average recovery rate by seniority for 1978–2009. The recoveries
on all seniorities were significantly lower than the historical norms. In 2009, 29 of
the defaulting issues were senior secured, with an average recovery rate of 43.70%,
compared to a historical average of 57.8% (57.4% median). This is higher than the
third-quarter recovery of 38.74%, primarily due to a Nortek, Inc. senior secured
default of $750 million with a recovery rate of 101%. Two hundred twenty-six of the
issues were senior unsecured with an average recovery rate of 37.2%, compared to a
historical average of 37.7% (45.6% median). This rate was largely affected by the
low recovery rates of several large, defaulting issuers, including Abitibi Bowater,
General Motors, and Charter Communications.
There were 31 issues that were senior subordinated with an average recovery of
24.1%, compared to a historical average of 30.6% (32.7% median). Four were
subordinated with an average recovery of 12.6%, compared to a historical average of
30.9% (29.7% median). Seven were issued as either discount or zero coupon notes
with an average recovery of 16.8% compared to a historical average of 25.4%
(18.2% median). One hundred eight issues could not be priced. The historic 31-year

February 08, 2010 Altman High-Yield Bond Default and Return Report
17
median for all high-yield bond defaults stayed constant at 41.8%, while the
arithmetic average dropped slightly to 37.6%. These latter statistics are based on a
sample of over 2,500 defaults.
Figure 15. Weighted Average Recovery Rates on Defaulted Debt by Seniority per $100 Face
Amount, 1978–2009
Senior Secured Senior Unsecured
Senior
Subordinated Subordinated
Discount and
Zero Coupon
All
Seniorities
Default
Year No. % $ No. % $ No. % $ No. % $ No. % $ No. $
2009 29 10 43.70 226 76 37.22 31 10 24.06 4 1 12.57 7 2 16.84 297 36.13
2008 18 14 30.52 79 63 49.56 23 18 30.25 4 3 21.09 1 1 2.71 125 42.52
2007 10 36 87.24 10 36 47.70 6 21 63.98 2 7 46.53 0 0 0.00 28 66.65
2006 9 18 90.60 26 52 60.90 8 16 50.24 1 2 60.33 6 12 78.31 50 65.32
2005 67 54 76.50 44 36 45.88 7 6 32.67 0 0 0.00 5 4 74.21 123 61.10
2004 27 39 63.67 33 48 56.77 2 3 37.44 0 0 0.00 7 10 43.06 69 57.72
2003 57 28 53.51 108 53 45.40 29 14 35.98 1 0 38.00 8 4 32.27 203 45.58
2002 37 11 52.81 254 75 21.82 21 6 32.79 0 0 0.00 28 8 26.47 340 25.30
2001 9 3 40.95 187 67 28.84 48 17 18.37 0 0 0.00 37 13 15.05 281 25.62
2000 13 8 39.58 47 29 25.40 61 37 25.96 26 16 26.62 17 10 23.61 164 26.74
1999 14 11 26.90 60 47 42.54 40 31 23.56 2 2 13.88 11 9 17.30 127 27.90
1998 6 18 70.38 21 62 39.57 6 18 17.54 0 0 0.00 1 3 17.00 34 40.46
1997 4 16 74.90 12 48 70.94 6 24 31.89 1 4 60.00 2 8 19.00 25 57.61
1996 4 17 59.08 4 17 50.11 9 38 48.99 4 17 44.23 3 13 11.99 24 45.44
1995 5 15 44.64 9 27 50.50 17 52 39.01 1 3 20.00 1 3 17.50 33 41.77
1994 5 23 48.66 8 36 51.14 5 23 19.81 3 14 37.04 1 5 5.00 22 39.44
1993 2 6 55.75 7 22 33.38 10 31 51.50 9 28 28.38 4 13 31.75 32 38.83
1992 15 22 59.85 8 12 35.61 17 25 58.20 22 33 49.13 5 7 19.82 67 50.03
1991 4 3 44.12 69 44 55.84 37 24 31.91 38 24 24.30 9 6 27.89 157 40.67
1990 12 10 32.18 31 27 29.02 38 33 25.01 24 21 18.83 11 9 15.63 116 24.66
1989 9 12 82.69 16 21 53.70 21 28 19.60 30 39 23.95 76 35.97
1988 13 21 67.96 19 31 41.99 10 16 30.70 20 32 35.27 62 43.45
1987 4 13 90.68 17 55 72.02 6 19 56.24 4 13 35.25 31 66.63
1986 8 14 48.32 11 20 37.72 7 13 35.20 30 54 33.39 56 36.60
1985 2 7 74.25 3 11 34.81 7 26 36.18 15 56 41.45 27 41.78
1984 4 29 53.42 1 7 50.50 2 14 65.88 7 50 44.68 14 50.62
1983 1 13 71.00 3 38 67.72 4 50 41.79 8 55.17
1982 16 80 39.31 4 20 32.91 20 38.03
1981 1 100 72.00 1 72.00
1980 2 50 26.71 2 50 16.63 4 21.67
1979 1 100 31.00 1 31.00
1978 1 100 60.00 1 60.00
Total/Avg
.
389 15 57.82 1332 51 37.75 474 18 30.58 259 10 30.85 164 6 25.45 2,618 36.72
Median 57.42 45.64 32.73 29.69 18.25 41.77
Standard
Deva
18.21 13.35 14.17 17.46 20.37 13.89
a Standard deviations are calculated based on the yearly averages.
Sources: NYU Salomon Center from various dealer quotes.
Distressed Exchanges
Distressed exchanges usually represent a firm’s desperate attempt to avoid a formal
bankruptcy filing or a payment default on outstanding debt. They were particularly
―popular‖ in 2008 and 2009 as the successful outcome of Chapter 11 reorganizations
became very uncertain in a difficult D.I.P. and exit financing Chapter 11
environment. It is also possible, however, that a proposed distressed exchange could
represent a firm’s strategy to extract concessions from creditors when the firm has
little likelihood of failing, despite a stressed macroeconomic environment.
Distressed exchanges take several forms including a debt for debt, cash for debt,
equity for debt exchange, and various other forms that might include multiple new

February 08, 2010 Altman High-Yield Bond Default and Return Report
18
securities in exchange for the more immediate problem security. Over the last two
years, debt for debt exchanges were popular (61 of the 197 exchanged issues), as
well as cash for debt (57) and debt + cash for debt (58). Surprisingly, only 16
involved all or partial equity exchanges, perhaps a reflection of the reluctance on the
part of creditors to accept such a minority claim when the debtor is so weak.
Distressed exchanges (DEs) in 2009 accounted for about 37.8% of the defaulted
issuers (45 out of 119), but only 18.5% of the defaulted dollar amount. From 1984
through 2009, DEs accounted for about 10.6% of all defaulting issuers and 11.9% of
all defaulted dollar amounts (Figure 16). Despite the record number of DEs in 2009,
the pace at which DEs were being sought as a restructuring alternative seems to have
slowed toward the end of the year, as there was no significant exchange offer yet to
be completed.
Figure 16 indicates the ―popular‖ re-emergence of DEs over the last 24 months
compared to the last 25 years. Indeed, during this period, approximately 51% (59 of
116) of all DEs took place, and there is no guarantee that a DE will, in fact, save the
company from a subsequent bankruptcy. As we have compiled in a recent study,
about 46% of all DEs up to 2007 resulted in a subsequent Chapter 11 or Chapter 7
bankruptcy filing and 30% of the DE firms were acquired. The data would appear to
indicate a DE is oftentimes just a short-term fix (see Altman & Karlin, 20092). Note
that we have not tracked the eventual fate of the distressed exchanges in 2008 and
2009 since those firms have not had a significant enough post-exchange period for
our statistics to be relevant.
2 The Re-emergence of Distressed Exchanges in Corporate Restructurings, E. Altman and B. Karlin, NYU Salomon Center Working
Paper, 2009 (see E. Altman’s website) and published in The Journal of Credit Risk, Summer 2009.

February 08, 2010 Altman High-Yield Bond Default and Return Report
19
Figure 16. High Yield Bond Distressed Exchange (D/E) Default and Recovery Statistics,
1984–2009
Year
D/E
Defaults
($)
Total
Defaults ($)
D/E
Defaults
(%)
to Total
$
D/E
Defaults
(No. of
Issuers)
Total
Defaults
(No. of
Issuers)
D/E
Defaults
(%) to
Total No.
of Issuers
D/E
Recovery
Ratea
All
Default
Recovery
Ratea
Difference
Between D/E
& All
Default
Recovery
Rate
2009 22,905.90 123.823.79 18.5 45 119 37.8 42.68 36.13 6.55
2008 30,329.42 50,763.26 59.7 14 64 21.9 52.41 42.50 9.91
2007 146.83 5,473.00 2.7 1 19 5.3 85.17 66.65 18.52
2006 0.00 7,559.00 0.0 0 0 0 NA NA NA
2005 0.00 36,209.00 0.0 0 0 0 NA NA NA
2004 537.88 11,657.00 4.6 5 39 12.8 58.05 57.72 0.33
2003 1,034.94 38,451.00 2.7 7 86 8.1 78.52 45.58 32.94
2002 764.80 96,858.00 0.8 3 112 2.7 61.22 25.30 35.92
2001 1,267.60 63,609.00 2.0 5 156 3.2 33.12 25.62 7.50
2000 50.00 30,295.00 0.2 1 107 0.9 77.00 26.74 50.26
1999 2,118.40 23,532.00 9.0 6 98 6.1 65.39 27.90 37.49
1998 461.10 7,464.00 6.2 2 37 5.4 17.34 40.46 (23.12)
1997 0.00 4,200.00 0.0 0 0 0.0 NA NA NA
1996 0.00 3,336.00 0.0 0 0 0.0 NA NA NA
1995 0.00 4,551.00 0.0 0 0 0.0 NA NA NA
1994 0.00 3,418.00 0.0 0 0 0.0 NA NA NA
1993 0.00 2,287.00 0.0 0 0 0.0 NA NA NA
1992 0.00 5,545.00 0.0 0 0 0.0 NA NA NA
1991 76.00 18,862.00 0.4 1 62 1.6 31.30 40.67 (9.37)
1990 1,044.00 18,354.00 5.7 7 47 14.9 43.15 24.66 18.49
1989 548.90 8,110.00 6.8 7 26 26.9 44.53 35.97 8.56
1988 390.30 3,944.00 9.9 3 24 12.5 28.40 43.45 (15.05)
1987 33.60 7,486.00 0.4 2 15 13.3 40.70 66.63 (25.93)
1986 114.80 3,156.00 3.6 4 23 17.4 47.68 36.60 11.08
1985 323.30 992.00 32.6 2 19 10.5 55.04 41.78 13.26
1984 100.10 344.00 29.1 1 12 8.3 44.12 50.62 (6.50)
Totals/Averages $69,154.04 $580,279.05 11.9% 116 1099 10.6% 51.81b 42.00b 9.82
a Weighted-average recovery rates for each year.
b Arithmetic average of the weighted-average annual recovery rates;
only those years with DEs counted. The arithmetic average of each individual DE (116) for the entire sample period
was 48.24% and the average for the non-DE defaults (983 observations) was 36.72%.
Source: NYU Salomon Center.
Recovery Rates on Distressed Exchanges
Because DEs are not as dramatic a reflection of a firm’s distressed status as a
bankruptcy or nonpayment of cash interest on debt, one might expect the
recovery rate on DE defaults to be higher than other, more serious distressed
situations. Of course, one reason for the larger recoveries in DEs is lenders need
to be offered a ―premium‖ in order to be persuaded to participate in the
exchange.
Figure 16 shows the arithmetic average recovery rate on all DE defaults was 51.8%
for 1984–2009, compared to 42.0% for all defaults, and 36.7% for all non-DE
defaults. In 2008, DEs recovered 52.2%, while non-DE defaults recovered only
27.1%. As the 2009 recovery rate on DEs equaled 42.7% versus 36.1% on all
defaults, the spread has widened significantly since earlier this year, particularly the
first quarter, when the recovery on all defaults was higher than on DEs.
In Figure 17, we calculate a difference in means test between the arithmetic average
recovery rate (48.2%) on the 116 DE issuers (269 issues) during 1984–2009 and the
average recovery rate on all non-DE defaults (36.7%) of the same period. We found
that given the above, the DE recovery rate is significantly higher (t = 7.49) at the 1%
confidence level. It is not surprising that bondholders will choose, in many instances,
to accept a recovery with certainty from a DE, rather than take the chance of holding

February 08, 2010 Altman High-Yield Bond Default and Return Report
20
out for an uncertain — and likely lower — recovery in bankruptcy (see below). Our
results do not include data for situations where a DE offer is rejected.
Figure 17. Difference in Means Test Between Recovery Rates: All
Nondistressed Exchange Defaults Versus Distressed Exchanges (D/E),
1984–2009
All Defaults Excluding D/E
(Issues)
Distressed Exchange
(Issues)
Sample Size 2239 269
Mean Recovery Rate 36.72 48.24
Standard Deviation 25.95 23.59
Variance 673.63 556.27
t-testa 7.48755
a
Sources: NYU Salomon Center, and authors’ compilation.
In Figure 18, we calculate a difference in means test between the weighted average
recovery rate on the announcement date of a DE versus the completion date for both
2008 and 2009. Of the 42 defaulted issues in 2008 due to a DE, in which prices were
available for both the announcement and completion dates, the weighted average
recovery was approximately 13 percentage points higher on the completion date.
Though completion date recoveries also proved to be higher in 2009, they were much
less so, with only a 4.9% difference in pricing between the two dates. So, the prices
of the distressed exchange bonds were significantly higher at the completion of the
exchange than when it was first announced based on the 2008 sample, but the
difference was much less significant in the 2009 cohort. Overall, the completion date
price was higher than the announcement date in 79 of the 148 issues, just over 50%
(53.4%) of the cases.
Figure 18. Distressed Exchange Weighted Average Recovery Rates:
Announcement Date versus Completion Date, 2008–2009
Year
# of
Observations Announcement Date
Completion
Date Difference t-test
2008 42 42.68 55.64 (12.97) 2.69469a
2009 106 36.51 41.41 (4.91) 1.44079b
a Significant at the .01 level. b Significant at the .10 level.
Source: NYU Salomon Center.

February 08, 2010 Altman High-Yield Bond Default and Return Report
21
Liquidation Recoveries
As we, (Altman & Karlin (2009)3), and others have discussed, the recent credit crisis
has heightened the risk that a Chapter 11 filing could result in a failed reorganization,
ultimately culminating in a liquidation of assets and subsequent payment of proceeds
to creditors. As noted earlier, the reduced availability of either debtor-in-possession
(D.I.P.) or exit financing makes a successful reorganization less likely. Even under
more normal conditions, firms may have little or no prospect of generating sufficient
cash flows to cover even a reduced debt burden and, in essence, the liquidation value
of the enterprise is deemed greater than the going-concern value. Given these
prospects, a key question for major stakeholders, particularly creditors, is the likely
recovery given liquidation, and how that value compares with the debt price just after
the filing of the initial Chapter 11. These are the questions we will now examine.
Liquidating Chapter 7’s versus Chapter 11’s4
Liquidations after an initial Chapter 11 filing can take two main forms – either a
conversion to Chapter 7 or a liquidating Chapter 11. The primary differences
between these two forms may affect the expected recovery for creditors from the
estate based on the revenues, timing, costs, and the administration of the liquidation
process. The liquidating Chapter 11 is more popular with some debtors because the
business continues with the incumbent board and management remaining as the
―debtor-in-possession‖ to manage the liquidation, as opposed to the court appointed
Trustee in a Chapter 7. The latter has the task of liquidating the estate as
expeditiously as possible, with limited powers to operate the business.
To illustrate some differences, in a Chapter 11 case, commercial real property leases
may be assumed or rejected up to 210 days (120 days with a possible 90 day
extension) after the initial filing, while in a Chapter 7 they must be assumed or
rejected within 60 days. Thus, a Chapter 7 Trustee is more likely to expedite a sale
process and not explore alternative options to maximize value. The Trustee is usually
paid a percentage (not to exceed 3%) of the total amount dispersed. As such, creditor
distributions will be reduced by the fee, although the proceeds are likely to come
earlier than in a liquidating Chapter 11.
On the other hand, since a committee of unsecured creditors is usually not appointed
in a Chapter 7, this process is not burdened by the delay of having all decisions
reviewed by the committee as well as the need to negotiate with the unsecured
creditors to garner their votes for liquidation without the threat of objections and
lawsuits – not to mention the likely cost of these objections and delays usually borne
by the estate. Another potentially significant cost of the Chapter 11 process is the
professional fees incurred by all constituencies in drafting and reviewing the plan
and disclosure statement, as well as for hearings and objections. A further expense of
the Chapter 11 process is the payment in full, in cash, of any administrative and
priority claims before any funds are distributed to creditors.
3E. Altman and B. Karlin (2009), ―Defaults and Returns in the High Yield Bond Market: The Year 2008 in Review and Outlook‖,
NYU Salomon Center Special Report, February.
4 Thanks to Daniel Kamensky of Paulson & Co. for his helpful comments on the differences between these two processes.

February 08, 2010 Altman High-Yield Bond Default and Return Report
22
In essence, the creditors need to weigh the benefits of greater control of the process
under the Chapter 11 liquidation versus the additional time and expenses. Many
creditors, however, are not experienced enough to do this tradeoff analysis. While a
proceeding under Chapter 11 may involve more costs and delays, limited power to
consider alternatives in a Chapter 7 will oftentimes swing the decision in favor of the
Chapter 11 liquidation, thereby making it more popular, especially when creditors
are more sophisticated and more is at stake.
Indeed, our research shows that over the 20-year period 1990-2009, 92 relatively
large companies with publicly held bonds outstanding liquidated under Chapter 11,
while just 28 companies converted first to a Chapter 7 and then liquidated (about a
3.3:1 ratio). If we expand our sample to include all Chapter 11 filings, regardless if
publicly held bonds were outstanding, the number of Chapter 11 liquidations
increases to 351 vs. 298 Chapter 7 conversions (a 1.2:1 ratio) over the same 20-year
period.5 So, it appears that larger firms with more complex capital structures prefer
the Liquidating Chapter 11 alternative more frequently than do all debtors in
bankruptcy. Figure 19 shows the frequency of Chapter 11 liquidations and Chapter 7
conversions, by year, over the period 1990-2009, with a further distinction being
whether or not the firms had publicly traded bonds outstanding.
Figure 19. Chapter 11 Liquidations versus Chapter 7 Conversions, By
Year and Whether Publicly Owned Bonds Were Outstanding (Number of
Firms), 1990–2009
Year
All Chapter 11
Liquidations
All Chapter 7
Conversions
Chapter 11
Liquidations
w/Bonds Outstanding
Chapter 7
Conversions w/Bonds
Outstanding
2009 20 22 5 2
2008 22 18 3 3
2007 17 9 5 0
2006 19 16 4 2
2005 25 13 7 1
2004 49 12 11 1
2003 66 27 14 4
2002 34 42 9 5
2001 17 33 7 5
2000 25 19 10 4
1999 11 16 2 1
1998 5 12 1 0
1997 4 10 1 0
1996 9 6 3 0
1995 3 9 1 0
1994 9 5 4 0
1993 6 9 1 0
1992 7 8 2 0
1991 1 8 1 0
1990 2 4 1 0
Total 351 298 92 28
Sources: New Generation Research (Boston) and NYU Salomon Center Default Database.
Recoveries
Several key questions are critical for existing creditors and potential distressed debt
investors when a company defaults and files for the right to reorganize under Chapter
5 Thanks to New Generation Research, Boston, MA, for the relevant data accumulations. Data in the first ten years in our time series
(1990-1999) are less certain, especially the Chapter 7 conversions.

February 08, 2010 Altman High-Yield Bond Default and Return Report
23
11. First, and foremost, is whether or not the price of debt securities will increase
during and after the reorganization. Key to that conclusion is the likelihood that the
firm will emerge from bankruptcy as a going concern, and whether the old debt
securities will be exchanged for valuable new debt, equity claims, cash, or a
combination of the aforementioned. Most studies, including Altman and Eberhart
(1994)6 and Keisman (2004)
7, have shown that the average rate of return between the
initial default and the subsequent price at the time of emergence from the
reorganization results in an annualized return between low single digits and 20%-
30%, depending upon the seniority and the sample period. Generally, senior debt
securities do best with significant positive annual returns of 20-30%.
If the company is not able to successfully reorganize, positive returns in the post-
bankruptcy period are less likely since values will no longer be based on a going-
concern concept. Regardless of the outcome, distressed investors usually assume a
―floor‖ value given a downside scenario, and, certainly, liquidation qualifies as an
extremely negative scenario. Also worth noting is the opportunity cost of lost
potential returns given the sale of the securities at default and investment of the
proceeds in alternative securities instead of holding onto the debt. For example,
Altman and Eberhart assumed that the appropriate ―opportunity cost‖ was the return
on an investment in a portfolio of high-yield, junk-bond securities.
We have analyzed a sample of bonds from companies that filed for reorganization
under Chapter 11 and eventually liquidated under a Chapter 7 conversion or a
liquidating Chapter 11. The number of Chapter 7 conversions or Chapter 11
liquidations over the 20-year period 1990-2009 for firms with publicly held bonds
outstanding, for which we had prices at the time of filing, is 87, with 141 individual
issues. Of these, we were able to trace the price of the bonds just prior to liquidation
on 72 of these issues (42 firms, see Figure 20). The average price of the 72 issues at
the time of the initial filing was $20.18 of par value, compared to an average price of
just $13.22 upon liquidation. The difference of just less than seven percentage points
is extremely significant (t-test = 7.1). The average price of the 141 issues upon filing
is essentially the same ($20.65) as the smaller sample of 72 ($20.18) that we were
able to find prices for both at the time of filing and at liquidation. Of the 72
securities, all but 12 (six firms) had a lower price at liquidation than at the time of the
initial filing.
The negative performance of liquidating companies is far more clear for those firms
that converted to a Chapter 7 than those liquidating under a Chapter 11, and the
security prices of the Chapter 7 firms were also considerably lower at the time of the
initial filing. This implies that those firms that eventually liquidate under a Chapter 7
conversion are in far worse shape with fewer reorganization prospects than those
who eventually do liquidate, but under a Chapter 11 process. For example, the
average price of the 15 bonds of Chapter 7 companies at the time of filing is $8.19
compared to just $1.91 upon conversion to Chapter 7 (t = 2.94). The comparable
statistics for the 57 Chapter 11 liquidations were $23.93 and $16.76, respectively.
6 E. Altman and A. Eberhart (1994), ―Do Seniority Provisions Protect Bondholders’ Investments?‖, Journal of Portfolio
Management, Summer.
7 D. Keisman (2004), ―Ultimate Recovery Rates on Bank Loan and Bond Defaults‖, Loss Stats, S&P (NY).

February 08, 2010 Altman High-Yield Bond Default and Return Report
24
While the difference in means prices ($7.17) of the latter is not trivial, the mean
difference is barely significant at the 10% level.
Finally, it is clear that the market understood that those companies that eventually
liquidated were in significantly poorer condition than the average company that
defaults. Indeed, the average price of corporate bonds at the time of default,
approximately $36.78, is significantly higher than the average price ($20.65) of our
141-issue sample that eventually resulted in liquidation. Still, not surprisingly,
despite this relatively low price at filing, the portfolio of liquidating issuers did
poorly between the filing and liquidation dates, indicating that the market
overestimated the prices at the time of filing. This would most likely be due to the
perceived upside potential if the firm eventually overcomes its adversity and either
emerges from the reorganization as a going concern or is sold in a 363 sale or total
enterprise transaction.9
Figure 20. Recovery Rates (Wgt. Prices) on Bonds of Companies That
Filed a Chapter 11 Petition and Later Converted to a Chapter 7 or a
Liquidating Chapter 11, 1990–2009
No. of Bonds
Wgt. Avg. Price at
Filing (F) Chapter 11
Wgt. Avg. Price at
Liquidation (L) t-test
All Liquidations
(Std. Deviation)
72 $20.18
(17.69)
$13.22
(28.83)
1.75c
Chapter 11 Liquidations
(Std. Deviation)
57 $23.93
(19.49)
$16.76
(30.90)
1.48c
Chapter 7
Conversion/Liquidations
(Std. Deviation)
15
$8.19
(7.40)
$1.91
(3.69)
2.94b
a
b Significant at the .01 level. c Significant at the .10 level.
Source: Author Compilation from data supplied from New Generation Research (Boston) and the NYU Salomon Center (NY) Default
Database.
Forecast Recovery Versus Actual
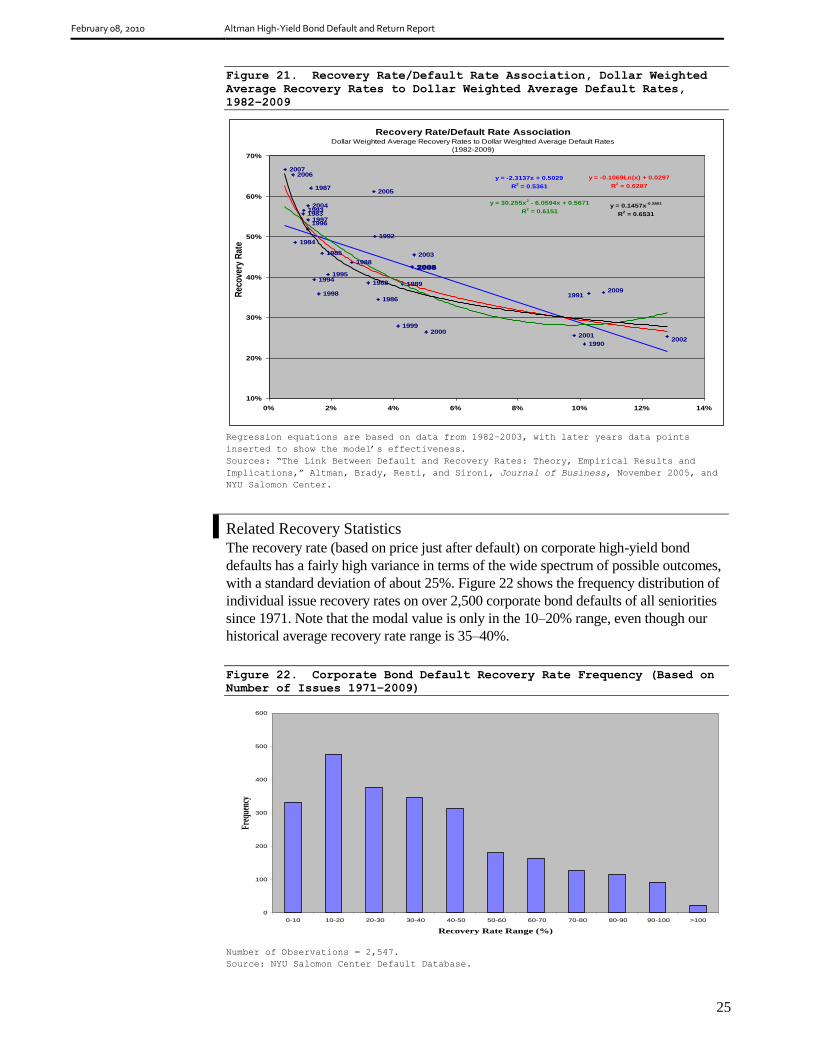
The 2009 weighted-average recovery rate of 36.1% was above our linear or non-
linear regression default/recovery rate forecasting models’ predictions (Figure 21).10
We would have expected the average recovery rate to be closer to the 26%-29%
range, based upon the model used. As noted earlier, the weighted-average recovery
rate was impacted positively (i.e. considerably higher recoveries) by the CIT and
Charter Communications filings.
8 Based on over 2,600 defaulted bond observations for the period 1978-2009 (Figure 15, earlier).
9 We have not assessed the ultimate value of the bonds given a 363 or total enterprise sale.
10 ―The Link Between Default and Recovery Rates: Theory, Empirical Results and Implications,‖ Altman, Brady, Resti and Sironi,
Journal of Business, November 2005.
XF XL
t =
+
t =
√ Var XF Var XL
NF NL
February 08, 2010 Altman High-Yield Bond Default and Return Report
25
Figure 21. Recovery Rate/Default Rate Association, Dollar Weighted
Average Recovery Rates to Dollar Weighted Average Default Rates,
1982–2009
2005
2004
2003
20022001
20001999
1998
19971996
19951994
1993
1992
1991
1990
1989
1988
1987
1986
1985
1984
1983
1982
20062007
2008
2009
y = -2.3137x + 0.5029
R2 = 0.5361
y = -0.1069Ln(x) + 0.0297
R2 = 0.6287
y = 30.255x2 - 6.0594x + 0.5671
R2 = 0.6151
y = 0.1457x-0.2801
R2 = 0.6531
10%
20%
30%
40%
50%
60%
70%
0% 2% 4% 6% 8% 10% 12% 14%
Rec
ove
ry R
ate
Recovery Rate/Default Rate AssociationDollar Weighted Average Recovery Rates to Dollar Weighted Average Default Rates
(1982-2009)
Regression equations are based on data from 1982–2003, with later years data points
inserted to show the model’s effectiveness.
Sources: “The Link Between Default and Recovery Rates: Theory, Empirical Results and
Implications,” Altman, Brady, Resti, and Sironi, Journal of Business, November 2005, and
NYU Salomon Center.
Related Recovery Statistics
The recovery rate (based on price just after default) on corporate high-yield bond
defaults has a fairly high variance in terms of the wide spectrum of possible outcomes,
with a standard deviation of about 25%. Figure 22 shows the frequency distribution of
individual issue recovery rates on over 2,500 corporate bond defaults of all seniorities
since 1971. Note that the modal value is only in the 10–20% range, even though our
historical average recovery rate range is 35–40%.
Figure 22. Corporate Bond Default Recovery Rate Frequency (Based on
Number of Issues 1971–2009)
0
100
200
300
400
500
600
0-10 10-20 20-30 30-40 40-50 50-60 60-70 70-80 80-90 90-100 >100
Recovery Rate Range (%)
Freq
uenc
y
Number of Observations = 2,547.
Source: NYU Salomon Center Default Database.

February 08, 2010 Altman High-Yield Bond Default and Return Report
26
Figure 23 shows the average price at default based on the number of years after
issuance. Although we observe some aging effect with the recovery rate increasing as
the years to default increases, there is not a great deal of difference between the first
and fifth years (32–38%) or between the sixth through ninth years (40–42%). The latter
period is more likely to comprise fallen angel defaults than the former. We note years
seven through nine showed a decrease in recoveries in 2009, compared to 2008,
returning to more normal values.
Figure 23. Average Price at Default by Number of Years After
Issuance (1971–2009)
Years to Default No. of Observations Average Price ($)
1 179 33.44
2 381 34.11
3 472 32.39
4 386 37.68
5 304 37.83
6 261 42.40
7 164 41.79
8 96 42.07
9 63 40.15
10 198 35.06
All 2,504 36.64
Source: NYU Salomon Center.
Figure 24 shows the recovery rate by original rating for the entire corporate bond
default database over the last 39 years. As expected, the higher the original rating,
the greater the average recovery rate, but only in the investment-grade original rating
range — that is, among fallen angels. Once below BBB, the weighted-average
recovery rate varies narrowly, 34–38%. However, we observe the median recovery
rates follow a continuous drop, as the original rating falls, except between the B and
CCC original ratings (both 29%).
Figure 24. Average Price after Default by Original Bond Rating,
1971-2009
Rating
No. of
Observatio
ns
Average
Price ($)
Weighted
Price ($)
Median
Price ($)
Std.
Dev. ($)
Minimum
Price ($)
Maximum
Price ($)
AAA 14 82.55 92.87 95.00 21.92 32.00 106.13
AA 30 65.68 76.84 60.00 26.69 17.80 103.00
A 247 48.45 46.13 44.88 27.36 2.00 100.00
BBB 470 40.16 33.32 39.00 23.89 1.00 103.00
BB 272 38.51 34.71 36.00 23.49 1.00 107.75
B 1294 34.27 32.92 29.00 24.82 0.02 112.00
CCC 298 37.27 35.68 29.00 29.00 0.13 106.75
Total 2625 38.12 36.06 33.00 26.02 0.02 112.00
Source: NYU Salomon Center Default Database.
Earlier we showed that seniority makes a large difference in expected recoveries. It is
true that the likelihood is greater that an investment-grade bond at issuance will have
senior priority (secured or unsecured) than one would expect from noninvestment-
grade original issue bonds. Figure 25 shows the recovery rate by seniority,
contingent upon if the original issue was rated investment grade.

February 08, 2010 Altman High-Yield Bond Default and Return Report
27
Figure 25. Recovery Rates by Seniority and Original Rating, Corporate Bond Defaults (By
Issue, 1971–2009)
Seniority Original Rating
No. of
Issues
Mean Price
($)
Weighted
Price ($)
Median Price
($) STD
Minimum
Price ($)
Maximum
Price ($)
Senior Secured
Investment Grade
145 53.21 57.23 50.50 27.02 3.00 106.13
Non-Investment Grade
270 43.83 44.29 39.00 29.19 1.00 106.75
All 460 46.64 46.99 43.50 28.39 0.05 106.75
Senior Unsecured
Investment Grade
482 43.69 40.28 42.25 25.29 2.00 100.50
Non-Investment Grade
650 36.18 33.10 31.15 24.25 0.02 100.00
All 1243 39.95 36.70 35.00 24.99 0.02 100.50
Senior Subordinated
Investment Grade
16 37.10 34.29 27.31 27.48 1.00 83.75
Non-Investment Grade
432 32.74 29.32 27.37 24.31 0.13 107.75
All 476 32.14 29.30 27.00 24.30 0.13 107.75
Subordinated Investment Grade
21 22.52 6.43 10.00 27.59 2.00 103.00
Non-Investment Grade
204 32.54 29.64 28.92 22.68 1.00 112.00
All 238 31.45 21.97 28.42 23.05 1.00 112.00
Discount Investment Grade
1 13.63 13.63 13.63 13.63
Non-Investment Grade
103 27.48 26.29 17.31 25.16 0.42 102.50
All 130 26.84 26.31 18.00 23.51 0.42 102.50
Source: NYU Salomon Center Default Database.
From Figure 25, we see considerably higher recoveries between investment-grade
and noninvestment-grade bonds for senior secured (53.2% versus 43.8%) and senior
unsecured (43.7% versus 36.2%), less of a difference for the senior subordinated
class (37.1% versus 32.2%), and the reverse for the subordinated class. Likewise, as
seniority is reduced, we see a reduction in recoveries for the investment-grade issues,
but not much difference for the noninvestment-grade securities.
Finally, in Figure 26, we break down recoveries by seniority for different major
industrial sectors. The sectors are the same as itemized earlier when we observed the
incidence of defaults per industrial sectors (Figures 8 and 9). The overall weighted-
average recovery rates are highest for energy (51.9%), utilities (51.8%), and financial
services (47.6%), and lowest for general manufacturinge (29.9%), communications
(28.0%), and auto/motor carrier (25.7%). The rest vary between 32–45%.

February 08, 2010 Altman High-Yield Bond Default and Return Report
28
Figure 26. Recovery Rates by Industry and Seniority (1971–2009)
Industry Seniority
No. of
Issues
Mean Price
($)
Weighted
Price ($)
Median
Price ($) STD
Minimum Price
($)
Maximum
Price ($)
Auto/Motor Carrier Senior Secured 16 30.78 24.96 24.00 24.46 2.71 92.00
Senior Unsecured 74 30.09 26.37 23.91 22.86 4.00 93.60
Senior Sub 20 27.26 21.77 23.50 19.93 3.00 71.00
Subordinated 4 34.28 25.71 27.00 21.25 18.00 65.13
Senior Sub +Sub 24 28.43 22.21 25.00 19.85 3.00 71.00
All 114 29.84 25.75 25.00 22.31 2.71 93.60
Conglomerates Senior Unsecured 3 44.92 47.94 53.38 14.65 28.00 53.38
Senior Sub 1 71.00 71.00 71.00 71.00
Subordinated 2 11.50 15.19 11.50 9.19 5.00 18.00
Senior Sub +Sub 3 31.33 22.52 18.00 34.96 5.00 71.00
All 6 38.13 40.93 40.69 25.10 5.00 71.00
Energy Senior Secured 37 63.25 65.24 64.00 32.44 2.00 104.50
Senior Unsecured 86 44.76 44.99 43.50 21.90 6.75 86.38
Senior Sub 28 38.15 46.60 34.88 23.97 1.00 107.75
Subordinated 26 25.38 25.39 21.13 12.19 9.50 55.00
Discount 1 45.26 45.26 45.26 45.26
Senior Sub +Sub 54 32.00 42.22 27.50 20.11 1.00 107.75
All 178 44.73 51.86 38.94 26.20 1.00 107.75
Financial Services Senior Secured 16 34.44 27.34 23.94 24.31 14.00 94.00
Senior Unsecured 156 49.88 56.01 52.13 28.29 0.02 100.00
Senior
Subordinated
20 31.97 28.85 28.00 24.07 1.00 92.00
Subordinated 28 22.43 9.11 6.00 26.78 1.00 103.00
Senior Sub +Sub 48 26.41 13.05 23.00 25.86 1.00 103.00
All 220 43.63 47.65 39.25 29.14 0.02 103.00
Leisure & Senior Secured 37 50.69 55.86 52.50 25.98 0.05 106.00
Entertainment Senior Unsecured 44 37.66 30.66 27.86 26.79 3.75 100.00
Senior Sub 40 31.07 27.75 23.00 25.34 3.00 99.00
Subordinated 21 46.17 55.78 36.50 29.79 7.00 112.00
Discount 2 18.88 20.74 18.88 9.73 12.00 25.76
Senior Sub +Sub 61 36.27 33.60 29.00 27.67 3.00 112.00
All 144 40.16 38.02 35.00 27.40 0.05 112.00
General Mfg Senior Secured 78 40.75 41.26 39.22 25.64 1.75 106.75
Senior Unsecured 200 33.40 26.61 29.00 21.93 0.25 99.50
Senior Sub 142 31.69 29.04 27.75 23.84 0.75 106.00
Subordinated 65 34.95 27.99 32.00 21.15 2.00 90.88
Discount 12 17.90 27.17 8.72 23.25 0.75 66.50
Senior Sub +Sub 207 32.71 28.76 29.00 23.03 0.75 106.00
All 497 33.89 29.87 29.50 23.27 0.25 106.75
Healthcare Senior Secured 2 91.25 97.38 91.25 10.25 84.00 98.50
Senior Unsecured 12 46.90 49.61 55.50 15.38 8.75 56.00
Senior Sub 33 24.50 21.06 15.50 23.11 0.13 86.00
Subordinated 10 23.77 17.57 23.50 13.41 4.75 39.00
Discount 2 21.05 27.07 21.05 18.32 8.09 34.00
Senior Sub +Sub 43 24.33 20.50 18.00 21.11 0.13 86.00
All 59 31.08 31.72 29.00 24.27 0.13 98.50
Misc. Industries Senior Secured 31 44.24 46.49 43.50 27.26 5.00 93.50
Senior Unsecured 59 51.92 54.99 56.09 25.97 8.00 99.00
Senior Sub 33 35.16 36.40 27.81 26.28 1.00 96.00
Subordinated 8 38.67 17.59 34.07 23.53 4.00 88.00
Discount 5 4.37 4.27 4.03 2.79 0.75 8.00
Senior Sub +Sub 41 35.85 35.12 29.63 25.52 1.00 96.00
All 136 43.58 45.95 40.00 27.46 0.75 99.00
Real Estate Senior Secured 6 50.58 52.55 58.75 34.50 3.00 82.50
& Construction Senior Unsecured 56 47.05 39.70 44.25 22.15 6.00 100.50
Senior Sub 29 25.43 18.22 15.50 25.74 2.00 95.50
Subordinated 11 35.98 25.21 21.88 33.65 2.00 98.25
Discount 3 13.61 20.97 13.63 12.40 1.21 26.00
Senior Sub +Sub 40 28.33 19.37 17.69 28.08 2.00 98.25
All 105 39.16 32.00 32.25 26.84 1.21 100.50

February 08, 2010 Altman High-Yield Bond Default and Return Report
29
Figure 26. Recovery Rates by Industry and Seniority (1971–2009) (Continued)
Industry Seniority
No. of
Issues
Mean Price
($)
Weighted
Price ($)
Median
Price ($) STD
Minimum Price
($)
Maximum
Price ($)
Retailing Senior Secured 28 45.17 38.80 43.50 24.74 2.50 90.00
Senior Unsecured 154 45.20 45.10 43.50 20.38 0.23 98.50
Senior Sub 74 31.89 28.83 25.25 22.68 0.50 94.00
Subordinated 36 27.27 25.44 20.00 18.96 3.38 70.00
Discount 3 35.85 35.51 20.00 33.26 13.48 74.06
Senior Sub +Sub 110 30.38 28.11 23.00 21.55 0.50 94.00
All 295 39.57 36.24 40.00 22.44 0.23 98.50
Communications Senior Secured 61 37.53 36.70 32.00 31.83 1.00 99.00
& Media Senior Unsecured 299 30.43 26.12 24.00 22.74 1.00 95.75
Senior Sub 48 38.05 33.40 34.00 26.16 0.13 97.00
Subordinated 17 32.00 37.86 20.00 25.84 6.50 89.00
Discount 101 28.82 26.59 20.00 23.55 0.42 102.50
Senior Sub +Sub 65 36.47 33.77 30.00 26.01 0.13 97.00
All 526 31.69 28.05 24.00 24.63 0.13 102.50
Transport (Non-
auto)
Senior Secured 121 50.23 60.59 44.00 26.49 2.00 106.13
Senior Unsecured 73 29.39 27.65 24.00 19.05 6.00 99.00
Senior Sub 6 41.71 25.24 36.75 25.99 13.00 83.75
Subordinated 8 29.89 20.50 26.06 21.63 10.00 65.50
Senior Sub +Sub 14 34.96 22.14 33.63 23.42 10.00 83.75
All 208 41.89 44.74 34.25 25.82 2.00 106.13
Utilities Senior Secured 27 56.57 39.27 56.25 24.69 2.00 99.88
Senior Unsecured 27 78.34 65.03 84.00 18.34 28.88 98.63
Senior Sub 2 43.88 52.92 43.88 36.95 17.75 70.00
Subordinated 2 44.00 44.00 44.00 0.00 44.00 44.00
Discount 1 68.00 68.00 68.00 68.00
Senior Sub +Sub 4 43.94 51.51 44.00 21.33 17.75 70.00
All 59 65.87 51.83 77.00 24.36 2.00 99.88
Source: NYU Salomon Center Default Database.
Mortality Rates and Losses
A method we developed in 1989, and updated annually since, to assess the
probability of default of newly issued corporate bonds and also to forecast default
rates (see below) is the mortality rate approach. This default measurement includes
the impact of bond aging by adjusting the base population over time for such
disappearances as defaults, calls, and other noncredit-related events. Results are
calculated based on the rating at birth and the volume of issuance. Similar statistics
for cumulative default rates can be found from rating agency compilations, only the
base is usually the number of issuers. These agency-calculated cumulative default
rates are based on the number of issuers in a certain rating category at the beginning
of the same year, regardless of the rating received when they were issued. Hence,
they are not affected by aging, and the statistics are more appropriate for seasoned
portfolios.

February 08, 2010 Altman High-Yield Bond Default and Return Report
30
Figure 27. Mortality Rates by Original Rating — All Rated Corporate Bondsa (1971–2009)
Years After Issuance
1 2 3 4 5 6 7 8 9 10
AAA Marginal 0.00% 0.00% 0.00% 0.00% 0.03% 0.02% 0.01% 0.00% 0.00% 0.00%
Cumulative 0.00% 0.00% 0.00% 0.00% 0.03% 0.05% 0.06% 0.06% 0.06% 0.06%
AA Marginal 0.00% 0.00% 0.27% 0.12% 0.02% 0.01% 0.00% 0.01% 0.03% 0.01%
Cumulative 0.00% 0.00% 0.27% 0.39% 0.41% 0.42% 0.42% 0.43% 0.46% 0.47%
A Marginal 0.01% 0.08% 0.18% 0.19% 0.15% 0.12% 0.05% 0.22% 0.12% 0.08%
Cumulative 0.01% 0.09% 0.27% 0.46% 0.61% 0.73% 0.78% 1.00% 1.11% 1.19%
BBB Marginal 0.42% 2.86% 1.48% 1.12% 0.68% 0.30% 0.36% 0.19% 0.18% 0.38%
Cumulative 0.42% 3.27% 4.70% 5.77% 6.41% 6.69% 7.02% 7.20% 7.37% 7.72%
BB Marginal 1.09% 2.23% 4.11% 2.18% 2.58% 1.50% 1.57% 1.20% 1.63% 3.30%
Cumulative 1.09% 3.30% 7.27% 9.29% 11.63% 12.96% 14.32% 15.35% 16.73% 19.48%
B Marginal 3.08% 8.05% 8.08% 8.18% 6.11% 4.78% 3.85% 2.35% 1.94% 0.96%
Cumulative 3.08% 10.88% 18.08% 24.78% 29.38% 32.76% 35.34% 36.86% 38.09% 38.68%
CCC Marginal 8.78% 13.02% 18.68% 16.34% 4.64% 12.15% 5.65% 5.11% 0.77% 4.59%
Cumulative 8.78% 20.66% 35.48% 46.02% 48.53% 54.78% 57.33% 59.51% 59.83% 61.67%
a Rated by S&P at issuance based on 2,527 issues.
Sources: S&P and NYU Salomon Center.
Figure 28. Mortality Losses by Original Rating — All Rated Corporate Bondsa (1971–2009)
Years After Issuance
1 2 3 4 5 6 7 8 9 10
AAA Marginal 0.00% 0.00% 0.00% 0.00% 0.01% 0.01% 0.01% 0.00% 0.00% 0.00%
Cumulative 0.00% 0.00% 0.00% 0.00% 0.01% 0.02% 0.03% 0.03% 0.03% 0.03%
AA Marginal 0.00% 0.00% 0.04% 0.04% 0.01% 0.01% 0.00% 0.01% 0.01% 0.01%
Cumulative 0.00% 0.00% 0.04% 0.08% 0.09% 0.10% 0.10% 0.11% 0.12% 0.13%
A Marginal 0.00% 0.03% 0.09% 0.15% 0.09% 0.05% 0.03% 0.05% 0.08% 0.03%
Cumulative 0.00% 0.03% 0.12% 0.27% 0.36% 0.41% 0.44% 0.49% 0.57% 0.60%
BBB Marginal 0.33% 1.92% 1.26% 0.45% 0.44% 0.20% 0.15% 0.11% 0.11% 0.22%
Cumulative 0.33% 2.24% 3.48% 3.91% 4.33% 4.52% 4.67% 4.77% 4.88% 5.09%
BB Marginal 0.63% 1.29% 2.43% 1.27% 1.54% 0.79% 0.86% 0.52% 0.84% 1.18%
Cumulative 0.63% 1.91% 4.30% 5.51% 6.97% 7.70% 8.49% 8.97% 9.74% 10.80%
B Marginal 2.06% 5.63% 5.48% 5.46% 4.03% 2.63% 2.50% 1.32% 1.00% 0.69%
Cumulative 2.06% 7.57% 12.64% 17.41% 20.74% 22.82% 24.75% 25.74% 26.49% 26.99%
CCC Marginal 5.78% 9.34% 13.28% 11.95% 3.28% 9.15% 4.26% 3.96% 0.47% 2.94%
Cumulative 5.78% 14.58% 25.92% 34.78% 36.92% 42.69% 45.13% 47.30% 47.55% 49.09%
a Rated by S&P at issuance based on 2,099 issues.
Sources: S&P and NYU Salomon Center Default Database.
Updated mortality statistics are reported in Figures 27 and 28. Since the 2009 default
rate was the second largest in our time series from 1971–2009, the updated mortality
rate statistics tend to be slightly higher than one year earlier, particularly for issuance
that was originally rated single-A or single-B. For example, the three- and four-year B-
rated category had cumulative mortality rates of 18.08% and 24.78% in 2009
compared to 15.89% and 22.97% in 2008, and the single-A cumulative rate jumped to
61bp (0.61%) for five years from 21bp (0.21%) one year ago. We utilize our mortality
rate statistics in one of our default forecasts at the end of this report.
Mortality losses in Figure 28 indicate a parallel story to the mortality rate statistics.
Most losses are quite similar to — or higher than — the end of 2008, due to the
lower recoveries in 2009, as well as higher defaults.
Returns and Spreads
Figure 29 shows the return on high-yield bonds for 2009 was 55.19%, the highest
annual return ever. The excess return versus 10-yr US Treasury bonds was 65.11%, a
clear reversal of 2008, when the excess return (loss) was –46.21%. Although the

February 08, 2010 Altman High-Yield Bond Default and Return Report
31
average excess return spread dropped to just 65bp at the end of 2008, 2009’s
performance has enabled the average to increase to 2.66%, a more normally expected
excess return.
The spread between the yield-to-maturity on high-yield bonds versus 10-yr
Treasuries decreased by 158bp from 671bp at the end of the third quarter to a year-
end total of 513bp, the lowest in over two years. Figure 30 shows the spread trend
from its all-time low of 260bp in June 2007, to the peak spread of 2,046bp in
December 2008, then its steady decline for the following four quarters, through the
end of 2009.
Due to the exceptionally high absolute and relative returns in 2009, the arithmetic and
geometric average annual return spread versus 10-yr US Treasuries for 1978–2009
increased to 2.66% and 2.22%, respectively, compared to 0.65% and 0.38% one year
earlier (Figure 29). Mentioned as a consideration in last year’s report11
, the low
cumulative historic relative return at the end of 2008 proved to be an excellent
indicator (along with the unprecedented high-yield spread) of the opportunity for
future large returns.
Defaulted Debt Returns
In a subsequent report (to be published shortly), we will analyze the recent risk and
return performance of the distressed debt markets, especially for those investors who
concentrate on defaulted bonds and bank loans. As we will discuss later in this
report, as well as in our subsequent one, distressed markets can include those debt
securities that are trading at large discounts from par value but are still current on
their interest payments as well as those that have already defaulted but still trade.
In 2009, the Defaulted bond and loan securities and private debt facilities realized
record high annual returns. The Altman-NYU Salomon Center Index of Defaulted
Bonds surged in 2009 by a record-high 96.42%, and the Index of Defaulted Loans
also achieved its best year ever, increasing by 32.80%12
. The Combined Index of
Defaulted Bonds and Bank Loans was up by 55.99%, also, of course, a record year.
Other defaulted/bankrupt bond indexes also had record years, including Moody’s
bankrupt bond index return of 269% and Credit Suisse’s defaulted bond index, up
187%, both also astounding increases.
As for distressed debt, hedge-fund indexes, 2009 was also an impressive year,
although not nearly as much as the long-only, 100% invested defaulted debt indexes
reported above. These indexes reflect actual performance averages of samples of
hedge funds. Results were Hennessee’s (42.97%), HFR’s (29.24%), and
Credit Suisse/Tremont’s (20.59%).
11 Altman & Karlin ―Defaults and Returns in the High Yield Market: The Year 2008 in Review and Outlook‖, NYU Salomon Center
Special Report, February 2009.
12 The NYU Salomon Center maintains three defaulted debt indexes and reports these performance statistics on a monthly total return
basis. For more information, call (212) 998-0701.

February 08, 2010 Altman High-Yield Bond Default and Return Report
32
Figure 29. Annual Returns, Yields, and Spreads on 10-Yr Treasury and
High-Yield Bonds,a 1978–2009
Return (%) Yield to Maturity (%)
Year
High
Yield Treasury
Excess
Returns
High
Yield Treasury Spread
2009 55.19 (9.92) 65.11 8.97 3.84 5.13
2008 (25.91) 20.30 (46.21) 19.53 2.22 17.31
2007 1.83 9.77 (7.95) 9.69 4.03 5.66
2006 11.85 1.37 10.47 7.82 4.70 3.11
2005 2.08 2.04 0.04 8.44 4.39 4.05
2004 10.79 4.87 5.92 7.35 4.21 3.14
2003 30.62 1.25 29.37 8.00 4.26 3.74
2002 (1.53) 14.66 (16.19) 12.38 3.82 8.56
2001 5.44 4.01 1.43 12.31 5.04 7.27
2000 (5.68) 14.45 (20.13) 14.56 5.12 9.44
1999 1.73 (8.41) 10.14 11.41 6.44 4.97
1998 4.04 12.77 (8.73) 10.04 4.65 5.39
1997 14.27 11.16 3.11 9.20 5.75 3.45
1996 11.24 0.04 11.20 9.58 6.42 3.16
1995 22.40 23.58 (1.18) 9.76 5.58 4.18
1994 (2.55) (8.29) 5.74 11.50 7.83 3.67
1993 18.33 12.08 6.25 9.08 5.80 3.28
1992 18.29 6.50 11.79 10.44 6.69 3.75
1991 43.23 17.18 26.05 12.56 6.70 5.86
1990 (8.46) 6.88 (15.34) 18.57 8.07 10.50
1989 1.98 16.72 (14.74) 15.17 7.93 7.24
1988 15.25 6.34 8.91 13.70 9.15 4.55
1987 4.57 (2.67) 7.24 13.89 8.83 5.06
1986 16.50 24.08 (7.58) 12.67 7.21 5.46
1985 26.08 31.54 (5.46) 13.50 8.99 4.51
1984 8.50 14.82 (6.32) 14.97 11.87 3.10
1983 21.80 2.23 19.57 15.74 10.70 5.04
1982 32.45 42.08 (9.63) 17.84 13.86 3.98
1981 7.56 0.48 7.08 15.97 12.08 3.89
1980 (1.00) (2.96) 1.96 13.46 10.23 3.23
1979 3.69 (0.86) 4.55 12.07 9.13 2.94
1978 7.57 (1.11) 8.68 10.92 8.11 2.81
Arithmetic Annual Average
1978–2009 11.00 8.34 2.66 12.22 6.99 5.23
Standard Deviation
15.57 11.74 18.34 3.20 2.78 2.95
Compound Annual Average
1978–2009 9.97 7.75 2.22
a Year-end yields.
Sources: Citi Yieldbook and author’s compilations.
Figure 30. Spread Between High-Yield Bonds YTM and 10-Yr Treasury
Notes, 1 Jun 07–31 Dec 09
Source: Citigroup Yieldbook Index Data
200
400
600
800
1,000
1,200
1,400
1,600
1,800
2,000
2,200
6/1/
2007
6/27
/200
7
7/23
/200
7
8/16
/200
7
9/11
/200
7
10/5
/200
7
10/3
1/20
07
11/2
6/20
07
12/2
0/20
07
1/17
/200
8
2/12
/200
8
3/7/
2008
4/2/
2008
4/28
/200
8
5/22
/200
8
6/17
/200
8
7/11
/200
8
8/6/
2008
9/1/
2008
9/25
/200
8
10/2
1/20
08
11/1
4/20
08
12/1
0/20
08
1/7/
2009
2/2/
2009
2/26
/200
9
3/24
/200
9
4/17
/200
9
5/13
/200
9
6/8/
2009
7/2/
2009
7/28
/200
9
8/21
/200
9
9/16
/200
9
10/1
2/20
09
11/5
/200
9
12/1
/200
9
12/2
8/20
09
6/12/07 (260bp)
12/16/08 (2,046bp)
12/31/09 (513bp)

February 08, 2010 Altman High-Yield Bond Default and Return Report
33
New Issues and Other Changes in the High-Yield
Market
New high-yield bond issuance in 2009 increased dramatically to a record $171.9
billion — compared to $50.3 billion in 2008. The vast majority (almost 80%) of the
new issues were for refinancing both existing bonds and, especially, corporate loans.
The latter’s maturities were pushed out to 2013 and 2014, in many cases. New
issuance of leveraged loans diminished in 2009, however, with S&P estimating that
about $75 billion of new, US leveraged loans were issued during the year, down
from $153 billion in 2008. Clearly, the bond market has been the primary venue to
refinance the loan, as well as the bond, market in 2009.
The size of the high-yield bond market, adjusting for fallen angels, rising stars,
defaults, and other changes, was approximately $1.18 trillion at the end of 2009, up
$100 billion, from $1.08 trillion at the end of 2008 (see Figure 31). The increase over
last year is largely attributable to the three-fold increase in new issuance, as well as
the large amount of issues that were downgraded to non-investment grade ($127.6
billion). While the increase in the size of the high-yield bond market due to new
issuance is welcome news, the downgrade versus upgrade differential amount of
$114.9 billion is an indicator of further deterioration in credit fundamentals.
Figure 31. Market Changes in 2009 and Size of the High-Yield Bond
Market (Dollars in Billions)
Size of Market (as of December 2008) $1,083.6
New Issues $171.9
Fallen Angels $127.6 a
Rising Stars $(12.7) b
Defaults $(123.8)
Calls $(19.7)
Repurchases/Tenders $(30.5)
Maturities $(19.2)
Exchanges $5.8
Size of Market (as of December, 2009) $1,183.0
a First downgrade to noninvestment grade from either Moody’s or S&P.
b Must be investment
grade with both Moody’s and S&P.
Sources: Citigroup, Credit Suisse, and NYU Salomon Center.
Credit Quality and Trends in New Issuance
Figure 32 shows the proportion of new issue dollars rated B- or lower by S&P for
2009, and annually for 1993–2009. The proportion of this low-quality segment was
21.56% in 2009, slightly higher than the proportion of 17.49% from a year earlier,
but significantly below the average of 34.87% for the last five years. This trend is
consistent with the demand for quality experienced in all debt markets, and is
indicative of a diminution in the expected default rate for the two- to four-year
horizon. Still, the most recent two quarters of new issuance in 2009 saw a sizeable
increase in all credit quality levels, including the so-called ―bad cohort,‖ B- or lower
category, which went from 11.43% as of June 30 to 21.56% as of the entire year. In
the last six months, this proportion jumped 10.13%.

February 08, 2010 Altman High-Yield Bond Default and Return Report
34
Figure 32. Percentage of New High-Yield Issues Rated B- or Below,
1993–2009 (Based on the Amount of Issuance)
51.25%
17.49%
18.16%
23.35%
19.40%
21.48%
27.27%
40.75%
30.41%
32.97%
13.73%
14.02%
29.55%
39.06%
33.00%
33.57%
21.56%
0.00%
10.00%
20.00%
30.00%
40.00%
50.00%
60.00%
1993 1994 1995 1996 1997 1998 1999 2000 2001 2002 2003 2004 2005 2006 2007 2008 2009
Source: Standard & Poor’s Global Fixed Income Research.
Proportion and Size of the Distressed and Defaulted Public and Private Debt
Markets
The distressed and defaulted debt proportion of the high-yield plus defaulted debt
markets in the United States comprised roughly 31.5 %, as of December 31, 2009
down considerably from 85.2% one year earlier (Figure 33). The primary reason for
the steady decrease since December 31, 2008 was the drop in the distress ratio of
issues trading at least 1,000bp over the 10-yr US Treasury bond. The ―distress ratio‖
fell from 82.0% of high-yield bond market, as of year-end 2008, to 15.3% by the end
of 2009 and from 67% to 12% of the high-yield + defaulted debt markets. As a
result, the distressed segment comprised only 12% of the total high-yield plus
defaulted debt market ($1.463 trillion) as of year-end, while the defaulted segment
increased to 19%, its highest level since 2002, when it was also 19%.
Figure 33. Distresseda and Defaulted Debt, as a Percentage of Total
High Yield Plus the Defaulted Debt Market,b 1990–2009c
14%
26%
15%7% 5% 7%
13%19% 18%
14% 14% 13% 10%18% 19%
28%
17%
8%
6%
3%
9%
31% 22%
21%
5%
3% 4%1% 9%
67%
12%
2%0%
10%
20%
30%
40%
50%
60%
70%
80%
90%
1990 1992 1993 1995 1998 1999 2000 2001 2002 2003 2004 2005 2006 2007 2008 2009
Defaulted Distressed
a
Defined as yield-to-maturity spread greater than or equal to 1,000bp over comparable
Treasuries. b
$1.463 trillion as of December 31, 2009. c
Some years not available as no
survey results are available.
Source: NYU Salomon Center, Merrill Lynch (Bank of America).

February 08, 2010 Altman High-Yield Bond Default and Return Report
35
The defaulted bond amount total is derived by adding the new defaults of 2009
($123.82 billion) to the existing defaulted bonds as of year-end 2008, subtracting
those bonds of firms whose reorganization plans were deemed effective and have
emerged from Chapter 11 ($55.7 billion —Appendix G) and, finally, by deducting
the value of bonds which defaulted as part of a distressed exchange during the year
($22.9 billion). The latter, while part of our defaulted total, do not trade after the
exchange.
Figure 34. Estimated Face and Market Values of Defaulted and
Distressed Debt, 2007–2009 (Dollars in Billions)
Face Value ($) Market Value ($)
31 Dec 07 31 Dec 08 31 Dec 09 31 Dec 07 31 Dec 08 31 Dec 09 Market/
Face Ratiod
Public Debt
Defaulted 127.32 234.36 279.56 a
76.39 40.69 97.85 0.35
Distressed 113.56 888.53 181.00 b
85.17 488.69 135.75 0.75
Total Public 240.88 1,122.89 460.56 161.56 529.38 233.59
Private Debt
Defaulted 331.03 515.59 698.90 c
281.38 299.11 419.34 c
0.60
Distressed 295.26 1,954.76 452.50 c
265.74 1,368.33 362.00 c
0.80
Total Private 626.29 2,470.35 1,151.40 547.11 1,667.44 781.34
Total Public
and Private
867.18 3,593.24 1,611.96 708.68 2,196.82 1,014.93
a Calculated using: (2008 defaulted population) + (2009 defaults) - (2009 Emergences) –
(2009 Distressed Restructurings). b
Based on 15.3% of the size of the high-yield market
($1.183 trillion). c
Based on a private/public ratio of 2.5. d
The market/face value
ratio was 0.25 for public defaulted debt, 0.55 for public distressed debt, 0.60 for
private defaulted debt and 0.70 for private distressed debt in 2008.
Source: NYU Salomon Center and estimates by Professor Edward I. Altman.
Figure 34 shows our estimate of the size of the defaulted and distressed debt markets
for both public and privately issued debt. The estimated face value of distressed
public debt is $181.0 billion, down from $888.5 billion one year earlier. As
previously discussed, this is attributable to the decrease in the ―distressed ratio.‖
We are now using a private-to-public debt ratio of 2.5 times13
(increased from 2.2
times in prior reports) to estimate the amount of defaulted and distressed private debt
(mainly bank loans, mortgages, and trade debt). Applying the 2.5 ratio to our public
debt totals, we estimate the face value of private defaulted and distressed debt is $1.1
trillion. The total face value of public and private, defaulted and distressed debt as of
December 31, 2009, is an estimated $1.6 trillion (Figure 34). This is a staggering
decrease of about $2.0 trillion from one year earlier, due entirely to the decrease in
the distressed ratio. Figure 35 shows that the total face value of distressed and
defaulted debt was well above average in 2009 and higher than any year except
2008, but still decreased significantly from one year earlier.
As indicated in Figure 34, consistent with our observations of both newly defaulted
and existing defaulted loan issues in our NYU Salomon Center Index of Defaulted
Bond and Bank Loan performance, we have chosen to increase our market-to-face
13 Based on an updated sample of over 150 bankrupt firms from 2007-2009.

February 08, 2010 Altman High-Yield Bond Default and Return Report
36
value ratios from year-end 2008. When applied, the market value estimate of
defaulted and distressed debt is about $1.01 trillion — down from the third quarter
and significantly lower than one year earlier.
Figure 35. Size of the Defaulted and Distressed Debt Market, 1990–
2009 (Dollars in Billions)
$-
$500
$1,000
$1,500
$2,000
$2,500
$3,000
$3,500
$4,000
19901992
19931995
19981999
20002001
20022003
20042005
20062007
20082009
Face Value Market Value
Source: Professor Edward I. Altman estimates, NYU Salomon Center.

February 08, 2010 Altman High-Yield Bond Default and Return Report
37
Forecasting Default Rates and Recoveries
Forecasting aggregate default and recovery rates is a tricky exercise that can be based
on a ―bottom-up‖ approach on individual issues and issuers or a macro, ―top-down‖
approach – or both. For practical and track-record reasons, we have chosen the top-
down approach using both aggregate amounts of new issuance over the last decade
stratified by the major ratings categories (mortality statistics) and also point-in-time
proportions of issuers by the major non-investment grade, high-yield bond
categories, but specific to recessionary results (scenario analysis). Finally, we also
analyze the information content of market-based measures, such as yield spreads and
distressed ratios, to forecast the near-term default performance of the market. These
four techniques are then averaged to arrive at our single default rate estimate,
although the range of probable outcomes can be observed as well. Our default rate
estimates are then used as the basis for estimates of aggregate recovery rates on
corporate high-yield bond defaults.
Using our standard mortality rate forecasting method (see our earlier discussion), our
forecast was higher than the actual rate in 2007, when credit markets were
abnormally buoyant. For 2008, we were pleased and a bit surprised that our forecast
of 4.64% for the high-yield bond default rate was remarkably close to the actual
2008 rate, which came in at 4.65% (Figure 36). We then expected our 2009 default
rate forecast to be on the low side, using the same mortality rate methodology. After
all, the mortality rate incidences of the past have been based on six recession periods
(see Figure 4) covering only about six-and-a-half years of the 38 in our sample
period (1971–2008). Therefore, a nonrecessionary, macroeconomic climate
dominates our statistics, and with a severe recession in place coming into 2009, we
expected the mortality rate methodology to underestimate the actual default results.
Indeed, the actual default rate was 10.74% in 2009 compared to our forecast of
7.98%, a respectable under-estimate. For this reason, we also in addition consider
recession scenario analyses and market-based statistics to provide useful estimates of
future results.
2010 Mortality Rate-Based Forecast
Utilizing the updated mortality rate statistics in Figure 27 and inputting new issuance
statistics per rating class over the past ten years, we estimate that the 2010 default
rate will be 5.06%, with a recovery rate of about 35% (Figure 36). Our forecast also
utilizes an estimate of the expected size of the high-yield bond market for 2010.
Figure 36. Mortality Rate-Based Forecasts of Default and Recovery
Rates in the High-Yield Bond Market, 2007–2010
Year Default Rate
Default Amount ($
Billion) Recovery Rate
2007 (Forecast) 2.50% $27.5 59.4%
2007 (Actual) 0.51% $5.5 66.6%
2008 (Forecast) 4.64% $53.1 39.6%a
2008 (Actual) 4.65% $50.2 42.5%
2009(Forecast) 7.98% $92.0 30.0%a
2009 (Actual) 10.74% $123.8 36.1%
2010 (Forecast) 5.06% $62.5 34.9%
a Based on the log-linear and linear default/recovery rate regressions (See Figure 21).
Sources: Mortality Rates (Figure 27), and Authors’ Estimates of Market Size in 2010.

February 08, 2010 Altman High-Yield Bond Default and Return Report
38
Recession Scenario-Based Forecasts
Based on recent work (see last year’s Default Report, Altman & Karlin, 2009), we
observed the behavior of default rates during the two most recent recessions, 1991
and 200114
. Our forecasts are based on the proportional breakdown of the three major
high-yield noninvestment-grade rating categories (Ba, B, and Caa) just before these
recessions (Figure 37) and the subsequent default experience from these categories
(Figure 38). We then applied the breakdown of rating class percentages as of year-
end 2009 to estimate default rates for 2010, given the 1991 and 2001 recession
scenarios.
The resulting default rate forecast for 2009 is 15.8%, given a 1991 default scenario,
and 12.2% given a 2001 scenario, which are much higher than our mortality rate
estimate and assume that factors such as market conditions, structure, etc. will
remain quite similar as in the two prior recessions. Please note that these forecasts
are only relevant if the economy remains in a recessionary state or ―double-dips‖
sometime in the second-half of 2010, assuming the NBER declares that the 2008-
2009 recession ended in late 2009 or early 2010. We will use a 14% expectant
default rate in 2010 for this approach (the mean between 15.8% and 12.2%).
Figure 37. Rating Distributions Prior to Recessions (Percent of
Issuers)
1990 2000 2008a 2009
a
Ba/BB 54 32 43 33
B/B 44 54 35 49
Caa+Ca/C
CCC/CC 2 14 22 18
a Year-end based on Moody’s and S&P ratings in 2008 and 2009 (based on dollar amounts);
Moody’s only in prior years.
Figure 38. Scenario Based Forecasts of Default in the High-Yield
Bond Market, 2009 & 2010
Subsequent One-
Year
1991
Default Rate
2001
2009 Forecastsa
1991/2001
Scenarios
2010 Forecastsa
1991/2001
Scenarios
Ba/BB 4% 2% 1.7% / 0.9% 1.3% / 0.7%
B/B 6% 11% 5.6% / 3.9% 7.8% / 5.4%
Caa+Ca/C
CCC/CC 37% 34% 8.1% / 7.5% 6.7% / 6.1%
H.Y. Default
Rate
11.0% 10.6% 15.4% / 12.3% 15.8% / 12.2%
The total is based on the summation of the three rating category contributions.
Sources: NYU Salomon Center.
Market-Based Methods for Forecasting Defaults
In 2008, we introduced two alternative methods for forecasting default rates. The
first relies on the market’s spread on high-yield bonds compared to 10-yr US
Treasuries. The second utilizes the proportion of high-yield bonds selling at 1,000bp
over 10-yr US Treasuries (distressed ratio). In both cases, we regress the market-
based measure in period (t) and the subsequent one-year default rate in period (t+1).
Based on the yield-spread regression (Figure 39) on December 31, 2007, this method
predicted a 4.62% 2008 default rate, essentially a perfect forecast, and as of the end
14 Martin Fridson first reported this scenario approach in his article in the Distressed Debt Investor, September 28, 2006.

February 08, 2010 Altman High-Yield Bond Default and Return Report
39
of 2008, it predicted an astounding 20.81% default rate. As of the end of 2009, we
estimate through this method that the cumulative default rate for the next 12 months,
ending December 2010, will be 3.89%.
Figure 39. Market-Based Forecast: Default Rate (t+1) Versus
Spreads (t)
Sources: Figures 1 and 29, NYU Salomon Center and authors’ compilation.
A second market-based method utilizes the distressed ratio, that is, the proportion of
the high-yield bond market trading at least 1,000bp over Treasuries. The updated
regression equation for 2008 is shown in Figure 40. Inserting the distressed ratio of
15.30% as of the end of 2009, the model reveals an expected 3.86% default rate for
year-end 2010.
Figure 40. Market-Based Forecast: Default Rate (t+1) Versus
Distressed Ratio (t)
Sources: Merrill Lynch & Co., NYU Salomon Center and authors’ compilation.
Default and Recovery Conclusions
Considering the various forecasting methods, we observe that the forecast range is
between 3.86% (distressed ratio) and 14.00% (recession scenarios). There is no
The regression equation is
Default Rate = - 3.25 + 1.39 * Spread
Predictor Coef SE Coef T P
Constant -3.2490 0.9072 -3.58 0.001
Spread 1.3904 0.1741 7.99 0.000
S = 1.86079 R-Sq = 69.5% R-Sq(adj) = 68.4%
Application
Applying Yield spread (12/31/2007) of 566 bps, PD = -3.25 + 1.39*5.66 = 4.617%Applying Yield spread (12/31/2008) of 1,731 bps, PD = -3.25 + 1.39*17.31 = 20.811%
Applying Yield spread (12/31/2009) of 513 bps, PD = -3.25 + 1.39*5.13 = 3.883%
The regression equation is
Default Rate = 0.942 + 0.190 * Distress Ratio
Predictor Coef SE Coef T P
Constant 0.9422 0.7596 1.24 0.233
Distress Ratio 0.19045 0.03579 5.32 0.000
S = 2.24391 R-Sq = 63.9% R-Sq(adj) = 61.6%
Application
Applying Distress Ratio (12/31/2007) of 10.42%, PD = 0.810 + 0.193*10.42 = 2.820%
Applying Distress Ratio (12/31/2008) of 82.00%, PD = 0.810 + 0.193*82.00 = 16.636%
Applying Distress Ratio (12/31/2009) of 15.30%, PD = 0.942 + 0.190 *15.30 = 3.856%

February 08, 2010 Altman High-Yield Bond Default and Return Report
40
obvious way to reach a consensus from the different techniques, so we simply took
the average of the four to obtain our forecast of 6.70% (Figure 41). Inputting this
estimate into our recovery regression (Figure 21), we estimate that 2010’s high-yield
bond default recovery rate will be 31.8%, based on our log-linear model.
Note that the 6.70% forecast assumes that the recession scenario is relevant. If, as
most economists forecast, the U.S. economy does not experience a recession in 2010,
the three remaining default rate forecasting methods average to 4.27%, with a 36.7%
recovery rate (Figure 41). This implies a fairly normal default rate environment in
2010. Of course, if one assumes that the following year, 2011, will manifest renewed
stress in the economy, the default recession scenario will again be relevant.
Figure 41. 2010 Default and Recovery Forecasts: Summary of Forecast
Models
Model
2009 Default
Rate Forecast as
of 12/31/2008
12/31/2010
Recession Default
Rate Forecast as of
12/31/2009
12/31/2010
No Recession Default
Rate Forecast as of
12/31/2009
Mortality Rate 7.98% 5.06% 5.06%
Recession
Scenarios
14.05% 14.00% n/r
Spread 18.32% 3.89% b
3.89% b
Distressed Ratio 14.16% 3.86% c
3.86% c
Average of Models
(Recovery Rates)a
13.63%
(24.3%)
6.70%
(31.8%)
4.27%
(36.7%)
a Based on the log-linear regression (Figure 21).
b Based on 12/31/2009 yield-spread of
513.16bp. c Based on 12/31/2009 Distressed Ratio of 15.3%.
Sources: All Corporate Bond Issuance, Figures 27, 37-40, and Authors’ Estimates of Market
Size in 2010.
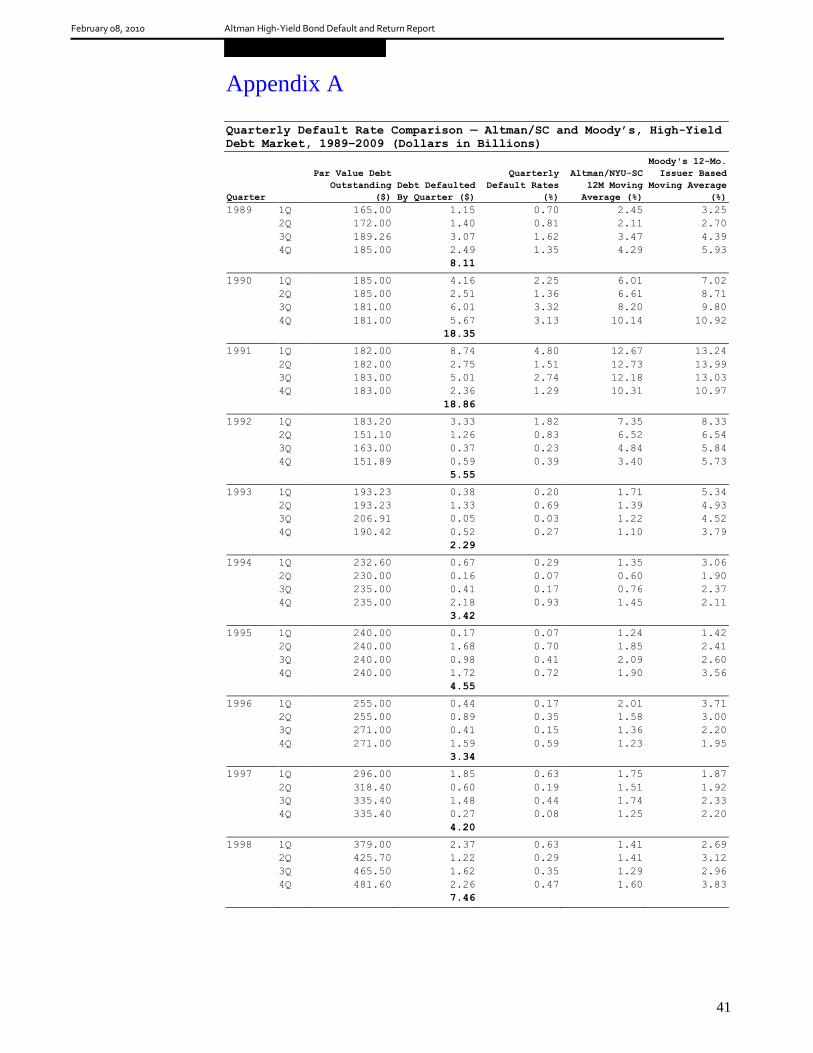
February 08, 2010 Altman High-Yield Bond Default and Return Report
41
Appendix A
Quarterly Default Rate Comparison — Altman/SC and Moody’s, High-Yield
Debt Market, 1989–2009 (Dollars in Billions)
Quarter
Par Value Debt
Outstanding
($)
Debt Defaulted
By Quarter ($)
Quarterly
Default Rates
(%)
Altman/NYU-SC
12M Moving
Average (%)
Moody's 12-Mo.
Issuer Based
Moving Average
(%)
1989 1Q 165.00 1.15 0.70 2.45 3.25
2Q 172.00 1.40 0.81 2.11 2.70
3Q 189.26 3.07 1.62 3.47 4.39
4Q 185.00 2.49 1.35 4.29 5.93
8.11
1990 1Q 185.00 4.16 2.25 6.01 7.02
2Q 185.00 2.51 1.36 6.61 8.71
3Q 181.00 6.01 3.32 8.20 9.80
4Q 181.00 5.67 3.13 10.14 10.92
18.35
1991 1Q 182.00 8.74 4.80 12.67 13.24
2Q 182.00 2.75 1.51 12.73 13.99
3Q 183.00 5.01 2.74 12.18 13.03
4Q 183.00 2.36 1.29 10.31 10.97
18.86
1992 1Q 183.20 3.33 1.82 7.35 8.33
2Q 151.10 1.26 0.83 6.52 6.54
3Q 163.00 0.37 0.23 4.84 5.84
4Q 151.89 0.59 0.39 3.40 5.73
5.55
1993 1Q 193.23 0.38 0.20 1.71 5.34
2Q 193.23 1.33 0.69 1.39 4.93
3Q 206.91 0.05 0.03 1.22 4.52
4Q 190.42 0.52 0.27 1.10 3.79
2.29
1994 1Q 232.60 0.67 0.29 1.35 3.06
2Q 230.00 0.16 0.07 0.60 1.90
3Q 235.00 0.41 0.17 0.76 2.37
4Q 235.00 2.18 0.93 1.45 2.11
3.42
1995 1Q 240.00 0.17 0.07 1.24 1.42
2Q 240.00 1.68 0.70 1.85 2.41
3Q 240.00 0.98 0.41 2.09 2.60
4Q 240.00 1.72 0.72 1.90 3.56
4.55
1996 1Q 255.00 0.44 0.17 2.01 3.71
2Q 255.00 0.89 0.35 1.58 3.00
3Q 271.00 0.41 0.15 1.36 2.20
4Q 271.00 1.59 0.59 1.23 1.95
3.34
1997 1Q 296.00 1.85 0.63 1.75 1.87
2Q 318.40 0.60 0.19 1.51 1.92
3Q 335.40 1.48 0.44 1.74 2.33
4Q 335.40 0.27 0.08 1.25 2.20
4.20
1998 1Q 379.00 2.37 0.63 1.41 2.69
2Q 425.70 1.22 0.29 1.41 3.12
3Q 465.50 1.62 0.35 1.29 2.96
4Q 481.60 2.26 0.47 1.60 3.83
7.46

February 08, 2010 Altman High-Yield Bond Default and Return Report
42
Quarterly Default Rate Comparison — Altman/SC and Moody’s, High-Yield
Debt Market, 1989–2009 (Dollars in Billions) (Continued)
Quarter
Par Value Debt
Outstanding
($)
Debt Defaulted
By Quarter ($)
Quarterly
Default Rates
(%)
Altman/NYU-SC
12M Moving
Average (%)
Moody's 12-Mo.
Issuer Based
Moving Average
(%)
1999 1Q 515.00 4.76 0.92 2.05 3.88
2Q 537.20 8.42 1.57 3.31 5.08
3Q 567.40 5.24 0.92 3.85 5.87
4Q 580.00 5.11 0.88 4.15 5.80
23.53
2000 1Q 584.00 6.06 1.04 4.28 6.36
2Q 595.60 9.97 1.67 4.52 6.61
3Q 597.50 4.32 0.72 4.27 6.64
4Q 608.15 9.95 1.64 5.07 7.03
30.29
2001 1Q 613.20 18.07 2.95 6.96 7.61
2Q 648.60 12.82 1.98 7.37 7.88
3Q 649.00 14.65 2.26 8.56 9.64
4Q 647.70 18.07 2.79 9.80 10.60
63.61
2002 1Q 669.00 18.54 2.77 9.89 11.00
2Q 674.00 27.07 4.02 11.71 10.03
3Q 757.00 37.48 4.95 15.01 8.63
4Q 756.30 13.77 1.82 12.80 6.96
96.86
2003 1Q 750.00 7.62 1.02 11.36 5.57
2Q 774.50 14.54 1.88 9.79 5.80
3Q 825.00 13.25 1.61 6.35 5.77
4Q 856.00 3.04 0.36 4.66 5.48
38.45
2004 1Q 886.00 3.07 0.35 3.96 4.73
2Q 919.60 1.75 0.19 2.38 4.01
3Q 933.10 3.80 0.41 1.27 3.11
4Q 948.50 3.04 0.32 1.25 3.01
11.66
2005 1Q 939.30 1.68 0.18 1.08 3.02
2Q 952.00 1.87 0.20 1.11 2.42
3Q 1,073.00 20.71 1.93 2.87 2.62
4Q 1066.10 11.95 1.12 3.37 2.54
36.21
2006 1Q 1039.00 3.39 0.33 3.56 2.43
2Q 1022.35 0.96 0.09 3.56 2.65
3Q 993.60 1.47 0.15 1.74 2.46
4Q 970.40 1.74 0.18 0.76 2.08
7.56
2007 1Q 1053.90 0.87 0.08 0.52 1.80
2Q 1066.80 1.82 0.17 0.56 1.92
3Q 1075.40 0.88 0.08 0.50 1.67
4Q 1069.90 1.91 0.18 0.51 0.90
5.47
2008 1Q 1089.90 3.57 0.33 0.76 1.74
2Q 1083.40 10.68 0.99 1.56 2.43
3Q 1091.00 5.02 0.46 1.95 3.40
4Q 1086.80 31.49 2.90 4.65 4.43
50.76
2009 1Q 1083.60 39.86 3.68 8.01 8.12
2Q 1082.60 43.86 4.05 11.09 11.60
3Q 1152.95 9.60 0.83 11.53 13.41
4Q 1177.41 30.51 2.59 10.74 13.22
123.82
Sources: Moody's, NYU Salomon Center, and Citi.

February 08, 2010 Altman High-Yield Bond Default and Return Report
43
Appendix B
Defaulted Corporate Straight Debt Issues — 2009 (Dollars in Millions)
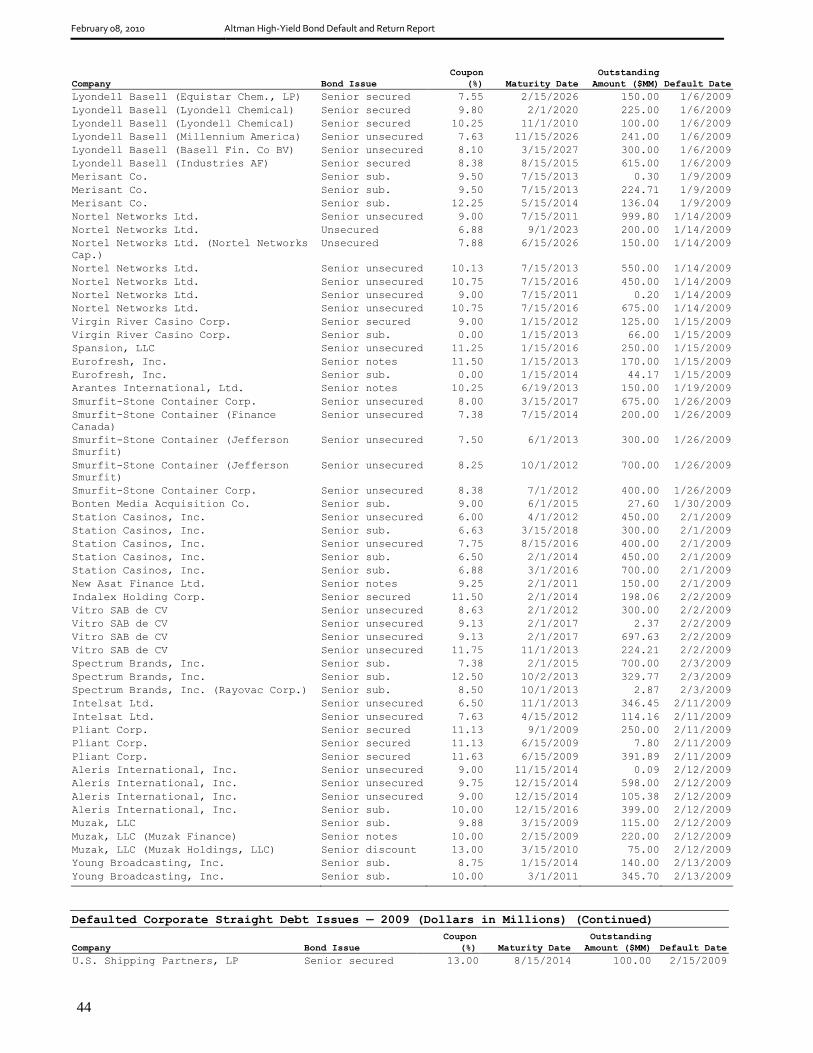
February 08, 2010 Altman High-Yield Bond Default and Return Report
44
Company Bond Issue
Coupon
(%) Maturity Date
Outstanding
Amount ($MM) Default Date
Lyondell Basell (Equistar Chem., LP) Senior secured 7.55 2/15/2026 150.00 1/6/2009
Lyondell Basell (Lyondell Chemical) Senior secured 9.80 2/1/2020 225.00 1/6/2009
Lyondell Basell (Lyondell Chemical) Senior secured 10.25 11/1/2010 100.00 1/6/2009
Lyondell Basell (Millennium America) Senior unsecured 7.63 11/15/2026 241.00 1/6/2009
Lyondell Basell (Basell Fin. Co BV) Senior unsecured 8.10 3/15/2027 300.00 1/6/2009
Lyondell Basell (Industries AF) Senior secured 8.38 8/15/2015 615.00 1/6/2009
Merisant Co. Senior sub. 9.50 7/15/2013 0.30 1/9/2009
Merisant Co. Senior sub. 9.50 7/15/2013 224.71 1/9/2009
Merisant Co. Senior sub. 12.25 5/15/2014 136.04 1/9/2009
Nortel Networks Ltd. Senior unsecured 9.00 7/15/2011 999.80 1/14/2009
Nortel Networks Ltd. Unsecured 6.88 9/1/2023 200.00 1/14/2009
Nortel Networks Ltd. (Nortel Networks
Cap.)
Unsecured 7.88 6/15/2026 150.00 1/14/2009
Nortel Networks Ltd. Senior unsecured 10.13 7/15/2013 550.00 1/14/2009
Nortel Networks Ltd. Senior unsecured 10.75 7/15/2016 450.00 1/14/2009
Nortel Networks Ltd. Senior unsecured 9.00 7/15/2011 0.20 1/14/2009
Nortel Networks Ltd. Senior unsecured 10.75 7/15/2016 675.00 1/14/2009
Virgin River Casino Corp. Senior secured 9.00 1/15/2012 125.00 1/15/2009
Virgin River Casino Corp. Senior sub. 0.00 1/15/2013 66.00 1/15/2009
Spansion, LLC Senior unsecured 11.25 1/15/2016 250.00 1/15/2009
Eurofresh, Inc. Senior notes 11.50 1/15/2013 170.00 1/15/2009
Eurofresh, Inc. Senior sub. 0.00 1/15/2014 44.17 1/15/2009
Arantes International, Ltd. Senior notes 10.25 6/19/2013 150.00 1/19/2009
Smurfit-Stone Container Corp. Senior unsecured 8.00 3/15/2017 675.00 1/26/2009
Smurfit-Stone Container (Finance
Canada)
Senior unsecured 7.38 7/15/2014 200.00 1/26/2009
Smurfit-Stone Container (Jefferson
Smurfit)
Senior unsecured 7.50 6/1/2013 300.00 1/26/2009
Smurfit-Stone Container (Jefferson
Smurfit)
Senior unsecured 8.25 10/1/2012 700.00 1/26/2009
Smurfit-Stone Container Corp. Senior unsecured 8.38 7/1/2012 400.00 1/26/2009
Bonten Media Acquisition Co. Senior sub. 9.00 6/1/2015 27.60 1/30/2009
Station Casinos, Inc. Senior unsecured 6.00 4/1/2012 450.00 2/1/2009
Station Casinos, Inc. Senior sub. 6.63 3/15/2018 300.00 2/1/2009
Station Casinos, Inc. Senior unsecured 7.75 8/15/2016 400.00 2/1/2009
Station Casinos, Inc. Senior sub. 6.50 2/1/2014 450.00 2/1/2009
Station Casinos, Inc. Senior sub. 6.88 3/1/2016 700.00 2/1/2009
New Asat Finance Ltd. Senior notes 9.25 2/1/2011 150.00 2/1/2009
Indalex Holding Corp. Senior secured 11.50 2/1/2014 198.06 2/2/2009
Vitro SAB de CV Senior unsecured 8.63 2/1/2012 300.00 2/2/2009
Vitro SAB de CV Senior unsecured 9.13 2/1/2017 2.37 2/2/2009
Vitro SAB de CV Senior unsecured 9.13 2/1/2017 697.63 2/2/2009
Vitro SAB de CV Senior unsecured 11.75 11/1/2013 224.21 2/2/2009
Spectrum Brands, Inc. Senior sub. 7.38 2/1/2015 700.00 2/3/2009
Spectrum Brands, Inc. Senior sub. 12.50 10/2/2013 329.77 2/3/2009
Spectrum Brands, Inc. (Rayovac Corp.) Senior sub. 8.50 10/1/2013 2.87 2/3/2009
Intelsat Ltd. Senior unsecured 6.50 11/1/2013 346.45 2/11/2009
Intelsat Ltd. Senior unsecured 7.63 4/15/2012 114.16 2/11/2009
Pliant Corp. Senior secured 11.13 9/1/2009 250.00 2/11/2009
Pliant Corp. Senior secured 11.13 6/15/2009 7.80 2/11/2009
Pliant Corp. Senior secured 11.63 6/15/2009 391.89 2/11/2009
Aleris International, Inc. Senior unsecured 9.00 11/15/2014 0.09 2/12/2009
Aleris International, Inc. Senior unsecured 9.75 12/15/2014 598.00 2/12/2009
Aleris International, Inc. Senior unsecured 9.00 12/15/2014 105.38 2/12/2009
Aleris International, Inc. Senior sub. 10.00 12/15/2016 399.00 2/12/2009
Muzak, LLC Senior sub. 9.88 3/15/2009 115.00 2/12/2009
Muzak, LLC (Muzak Finance) Senior notes 10.00 2/15/2009 220.00 2/12/2009
Muzak, LLC (Muzak Holdings, LLC) Senior discount 13.00 3/15/2010 75.00 2/12/2009
Young Broadcasting, Inc. Senior sub. 8.75 1/15/2014 140.00 2/13/2009
Young Broadcasting, Inc. Senior sub. 10.00 3/1/2011 345.70 2/13/2009
Defaulted Corporate Straight Debt Issues — 2009 (Dollars in Millions) (Continued)
Company Bond Issue
Coupon
(%) Maturity Date
Outstanding
Amount ($MM) Default Date
U.S. Shipping Partners, LP Senior secured 13.00 8/15/2014 100.00 2/15/2009
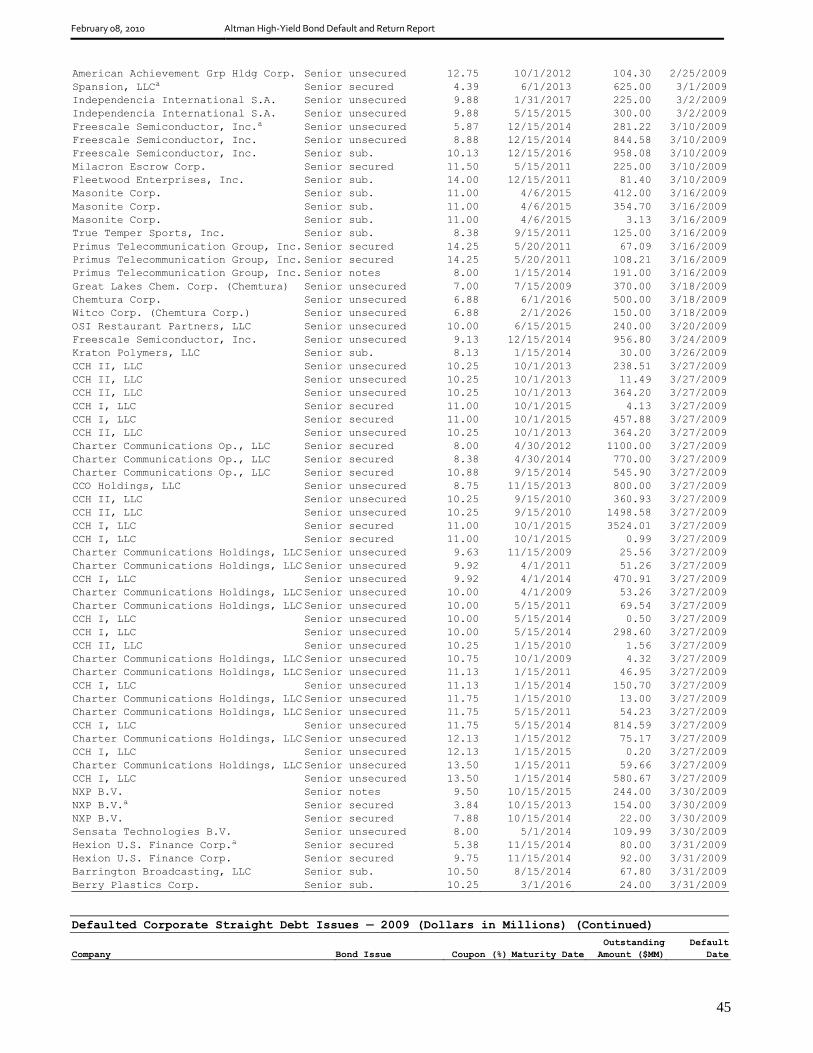
February 08, 2010 Altman High-Yield Bond Default and Return Report
45
American Achievement Grp Hldg Corp. Senior unsecured 12.75 10/1/2012 104.30 2/25/2009
Spansion, LLCa Senior secured 4.39 6/1/2013 625.00 3/1/2009
Independencia International S.A. Senior unsecured 9.88 1/31/2017 225.00 3/2/2009
Independencia International S.A. Senior unsecured 9.88 5/15/2015 300.00 3/2/2009
Freescale Semiconductor, Inc.a Senior unsecured 5.87 12/15/2014 281.22 3/10/2009
Freescale Semiconductor, Inc. Senior unsecured 8.88 12/15/2014 844.58 3/10/2009
Freescale Semiconductor, Inc. Senior sub. 10.13 12/15/2016 958.08 3/10/2009
Milacron Escrow Corp. Senior secured 11.50 5/15/2011 225.00 3/10/2009
Fleetwood Enterprises, Inc. Senior sub. 14.00 12/15/2011 81.40 3/10/2009
Masonite Corp. Senior sub. 11.00 4/6/2015 412.00 3/16/2009
Masonite Corp. Senior sub. 11.00 4/6/2015 354.70 3/16/2009
Masonite Corp. Senior sub. 11.00 4/6/2015 3.13 3/16/2009
True Temper Sports, Inc. Senior sub. 8.38 9/15/2011 125.00 3/16/2009
Primus Telecommunication Group, Inc. Senior secured 14.25 5/20/2011 67.09 3/16/2009
Primus Telecommunication Group, Inc. Senior secured 14.25 5/20/2011 108.21 3/16/2009
Primus Telecommunication Group, Inc. Senior notes 8.00 1/15/2014 191.00 3/16/2009
Great Lakes Chem. Corp. (Chemtura) Senior unsecured 7.00 7/15/2009 370.00 3/18/2009
Chemtura Corp. Senior unsecured 6.88 6/1/2016 500.00 3/18/2009
Witco Corp. (Chemtura Corp.) Senior unsecured 6.88 2/1/2026 150.00 3/18/2009
OSI Restaurant Partners, LLC Senior unsecured 10.00 6/15/2015 240.00 3/20/2009
Freescale Semiconductor, Inc. Senior unsecured 9.13 12/15/2014 956.80 3/24/2009
Kraton Polymers, LLC Senior sub. 8.13 1/15/2014 30.00 3/26/2009
CCH II, LLC Senior unsecured 10.25 10/1/2013 238.51 3/27/2009
CCH II, LLC Senior unsecured 10.25 10/1/2013 11.49 3/27/2009
CCH II, LLC Senior unsecured 10.25 10/1/2013 364.20 3/27/2009
CCH I, LLC Senior secured 11.00 10/1/2015 4.13 3/27/2009
CCH I, LLC Senior secured 11.00 10/1/2015 457.88 3/27/2009
CCH II, LLC Senior unsecured 10.25 10/1/2013 364.20 3/27/2009
Charter Communications Op., LLC Senior secured 8.00 4/30/2012 1100.00 3/27/2009
Charter Communications Op., LLC Senior secured 8.38 4/30/2014 770.00 3/27/2009
Charter Communications Op., LLC Senior secured 10.88 9/15/2014 545.90 3/27/2009
CCO Holdings, LLC Senior unsecured 8.75 11/15/2013 800.00 3/27/2009
CCH II, LLC Senior unsecured 10.25 9/15/2010 360.93 3/27/2009
CCH II, LLC Senior unsecured 10.25 9/15/2010 1498.58 3/27/2009
CCH I, LLC Senior secured 11.00 10/1/2015 3524.01 3/27/2009
CCH I, LLC Senior secured 11.00 10/1/2015 0.99 3/27/2009
Charter Communications Holdings, LLC Senior unsecured 9.63 11/15/2009 25.56 3/27/2009
Charter Communications Holdings, LLC Senior unsecured 9.92 4/1/2011 51.26 3/27/2009
CCH I, LLC Senior unsecured 9.92 4/1/2014 470.91 3/27/2009
Charter Communications Holdings, LLC Senior unsecured 10.00 4/1/2009 53.26 3/27/2009
Charter Communications Holdings, LLC Senior unsecured 10.00 5/15/2011 69.54 3/27/2009
CCH I, LLC Senior unsecured 10.00 5/15/2014 0.50 3/27/2009
CCH I, LLC Senior unsecured 10.00 5/15/2014 298.60 3/27/2009
CCH II, LLC Senior unsecured 10.25 1/15/2010 1.56 3/27/2009
Charter Communications Holdings, LLC Senior unsecured 10.75 10/1/2009 4.32 3/27/2009
Charter Communications Holdings, LLC Senior unsecured 11.13 1/15/2011 46.95 3/27/2009
CCH I, LLC Senior unsecured 11.13 1/15/2014 150.70 3/27/2009
Charter Communications Holdings, LLC Senior unsecured 11.75 1/15/2010 13.00 3/27/2009
Charter Communications Holdings, LLC Senior unsecured 11.75 5/15/2011 54.23 3/27/2009
CCH I, LLC Senior unsecured 11.75 5/15/2014 814.59 3/27/2009
Charter Communications Holdings, LLC Senior unsecured 12.13 1/15/2012 75.17 3/27/2009
CCH I, LLC Senior unsecured 12.13 1/15/2015 0.20 3/27/2009
Charter Communications Holdings, LLC Senior unsecured 13.50 1/15/2011 59.66 3/27/2009
CCH I, LLC Senior unsecured 13.50 1/15/2014 580.67 3/27/2009
NXP B.V. Senior notes 9.50 10/15/2015 244.00 3/30/2009
NXP B.V.a Senior secured 3.84 10/15/2013 154.00 3/30/2009
NXP B.V. Senior secured 7.88 10/15/2014 22.00 3/30/2009
Sensata Technologies B.V. Senior unsecured 8.00 5/1/2014 109.99 3/30/2009
Hexion U.S. Finance Corp.a Senior secured 5.38 11/15/2014 80.00 3/31/2009
Hexion U.S. Finance Corp. Senior secured 9.75 11/15/2014 92.00 3/31/2009
Barrington Broadcasting, LLC Senior sub. 10.50 8/15/2014 67.80 3/31/2009
Berry Plastics Corp. Senior sub. 10.25 3/1/2016 24.00 3/31/2009
Defaulted Corporate Straight Debt Issues — 2009 (Dollars in Millions) (Continued)
Company Bond Issue Coupon (%) Maturity Date
Outstanding
Amount ($MM)
Default
Date

February 08, 2010 Altman High-Yield Bond Default and Return Report
46
Idearc, Inc. Senior unsecured 8.00 11/15/2016 2849.88 3/31/2009
Idearc, Inc. Senior unsecured 8.00 11/15/2016 0.13 3/31/2009
Hollinger International Pub., Inc. Senior unsecured 9.00 12/15/2010 9.40 3/31/2009
Medianews Group, Inc. Senior sub. 6.88 10/1/2013 300.00 4/1/2009
Aventine Renewable Energy Hlds, Inc. Senior unsecured 10.00 4/1/2017 300.00 4/1/2009
Harrah's Operating Co., Inc. Senior unsecured 5.50 7/1/2010 86.80 4/1/2009
Harrah's Operating Co., Inc. (Park Place
Entertainment)
Senior sub. 7.88 3/15/2010 44.19 4/1/2009
Harrah's Operating Co., Inc. Senior unsecured 8.00 2/1/2011 1.44 4/1/2009
Harrah's Operating Co., Inc. (Park Place
Entertainment)
Senior sub. 8.13 5/15/2011 47.09 4/1/2009
Harrah's Operating Co., Inc. Senior unsecured 5.38 12/15/2013 66.23 4/1/2009
Harrah's Operating Co., Inc. Senior unsecured 5.63 6/1/2015 274.13 4/1/2009
Harrah's Operating Co., Inc. Senior unsecured 6.50 6/1/2016 267.17 4/1/2009
Harrah's Operating Co., Inc. Senior unsecured 5.75 10/1/2017 202.95 4/1/2009
Harrah's Operating Co., Inc. Senior unsecured 10.75 2/1/2018 1,104.20 4/1/2009
Harrah's Operating Co., Inc. Senior unsecured 10.75 2/1/2016 3,456.57 4/1/2009
155 E. Tropicana, LLC Senior secured 8.75 4/1/2012 130.00 4/1/2009
CMP Susquehanna Corp. Senior sub. 9.88 5/15/2014 175.46 4/3/2009
Ford Motor Co. Senior unsecured 9.50 6/1/2010 155.56 4/3/2009
Ford Motor Co. Senior unsecured 7.45 7/16/2031 1,904.97 4/3/2009
Ford Motor Co. Senior unsecured 6.50 8/1/2018 120.94 4/3/2009
Ford Motor Co. Senior unsecured 8.88 1/15/2022 92.09 4/3/2009
Ford Motor Co. Senior unsecured 7.13 11/15/2025 86.35 4/3/2009
Ford Motor Co. Senior unsecured 7.50 8/1/2026 56.63 4/3/2009
Ford Motor Co. Senior unsecured 6.63 2/15/2028 20.71 4/3/2009
Ford Motor Co. Senior unsecured 6.63 10/1/2028 103.49 4/3/2009
Ford Motor Co. Senior unsecured 6.38 2/1/2029 171.20 4/3/2009
Ford Motor Co. Senior unsecured 8.90 1/15/2032 231.92 4/3/2009
Ford Motor Co. Senior unsecured 9.95 2/15/2032 69.67 4/3/2009
Ford Motor Co. Senior unsecured 7.75 6/15/2043 76.89 4/3/2009
Ford Motor Co. Senior unsecured 7.40 11/1/2046 39.78 4/3/2009
Ford Motor Co. Senior unsecured 9.98 2/15/1947 26.94 4/3/2009
Ford Motor Co. Senior unsecured 7.70 5/15/2097 196.78 4/3/2009
Energy Partners, Ltd. Senior unsecured 0.00 4/15/2013 150.00 4/15/2009
Energy Partners, Ltd. Senior unsecured 9.75 4/15/2014 300.00 4/15/2009
Broder Brothers Co. Senior notes 11.25 10/15/2010 225.00 4/15/2009
Majestic Holdco, LLC Senior secured 12.50 10/15/2011 63.50 4/15/2009
Six Flags, Inc. Senior unsecured 9.75 4/15/2013 142.44 4/15/2009
French Lick Resorts & Casino, LLC 1st Mortgage 10.75 4/15/2014 31.70 4/15/2009
Abitibi Bowater, Inc. (Abitibi Cons
Canada)
Senior secured 13.75 4/1/2011 413.00 4/16/2009
Abitibi Bowater, Inc. (Bowater, Inc.)a Senior unsecured 4.32 3/15/2010 234.00 4/16/2009
Abitibi Bowater, Inc. (Bowater, Inc.) Senior unsecured 6.50 6/15/2013 400.00 4/16/2009
Abitibi Bowater, Inc. (Abitibi Cons
Finance)
Unsecured 7.88 8/1/2009 7.84 4/16/2009
Abitibi Bowater, Inc. (Bowater CAN
Finance)
Senior notes 7.95 11/15/2011 600.00 4/16/2009
Abitibi Bowater, Inc. (Bowater, Inc.) Senior unsecured 9.00 8/1/2009 248.00 4/16/2009
Abitibi Bowater, Inc. (Bowater, Inc.) Senior unsecured 9.38 12/15/2021 200.00 4/16/2009
Abitibi Bowater, Inc. (Bowater, Inc.) Senior unsecured 9.50 10/15/2012 125.00 4/16/2009
Abitibi Bowater, Inc. (Abitibi Cons CAN)a Senior unsecured 4.81 6/15/2011 200.00 4/16/2009
Abitibi Bowater, Inc. (Abitibi Cons CAN) Senior unsecured 6.00 6/20/2013 350.00 4/16/2009
Abitibi Bowater, Inc. (Abitibi
Consolidated, Inc.)
Senior unsecured 7.40 4/1/2018 100.00 4/16/2009
Abitibi Bowater, Inc. (Abitibi Cons,
Inc.)
Senior unsecured 7.50 4/1/2028 250.00 4/16/2009
Abitibi Bowater, Inc. (Abitibi Cons
Canada)
Senior unsecured 7.75 6/15/2011 200.00 4/16/2009
Abitibi Bowater, Inc. (Abitibi Cons
Canada)
Senior unsecured 8.38 4/1/2015 450.00 4/16/2009
Abitibi Bowater, Inc. (Bowater, Inc.) Senior unsecured 8.50 8/1/2029 250.00 4/16/2009
Abitibi Bowater, Inc. (Abitibi Cons,
Inc.)
Senior unsecured 8.55 8/1/2010 395.00 4/16/2009
Defaulted Corporate Straight Debt Issues — 2009 (Dollars in Millions) (Continued)
Company Bond Issue Coupon Maturity Outstanding Default Date

February 08, 2010 Altman High-Yield Bond Default and Return Report
47
(%) Date Amount ($MM)
Abitibi Bowater, Inc. (Abitibi Cons, Inc.) Senior unsecured 8.85 8/1/2030 450.00 4/16/2009
Abitibi Bowater, Inc. (Abitibi Cons Canada) Senior unsecured 15.50 7/15/2010 292.97 4/16/2009
Abitibi Bowater, Inc. (Bowater Pulp & Paper
Canada)b
Senior unsecured 10.26 1/15/2011 4.40 4/16/2009
Abitibi Bowater, Inc. (Bowater Pulp & Paper
Canada)b
Senior unsecured 10.50 6/15/2010 20.40 4/16/2009
Abitibi Bowater, Inc. (Bowater Pulp & Paper
Canada)b
Senior unsecured 10.60 1/15/2011 70.00 4/16/2009
Abitibi Bowater, Inc. (Bowater Pulp & Paper
Canada)b
Senior unsecured 10.63 6/15/2010 2.70 4/16/2009
Rouse Co. Senior unsecured 3.63 3/15/2049 400.00 4/16/2009
Rouse Co. Senior unsecured 5.38 11/26/2013 450.00 4/16/2009
Rouse Co. (Rouse Co. LP/TRC Co-Issr) Senior unsecured 6.75 5/1/2013 800.00 4/16/2009
Rouse Co. Senior unsecured 7.20 9/15/2012 400.00 4/16/2009
Rouse Co. Senior unsecured 8.00 4/30/2009 200.00 4/16/2009
Dayton Superior Corp. Senior sub. 13.00 6/15/2009 154.73 4/19/2009
Source Interlink Companies, Inc. Senior unsecured 11.25 7/15/2015 465.00 4/21/2009
Chrysler, LLC Senior unsecured 12.38 5/1/2020 20.06 4/30/2009
Sabre Holdings Corp. Senior unsecured 7.35 8/1/2011 76.00 4/30/2009
Thornburg Mortgage, Inc. Senior sub. 18.00 3/31/2015 115.53 5/1/2009
Thornburg Mortgage, Inc. Senior unsecured 8.00 5/15/2013 305.00 5/1/2009
Thornburg Mortgage, Inc. Senior sub. 18.00 3/31/2015 1,133.18 5/1/2009
Thornburg Mortgage, Inc. Senior secured 18.00 3/31/2015 16.82 5/1/2009
Energy Partners, Ltd. Senior notes 8.75 8/1/2010 4.50 5/1/2009
Panolam Industries Intl, Inc. Senior sub. 10.75 10/1/2013 151.00 5/1/2009
Inn of the Mountain Gods Resort & Casino Senior unsecured 12.00 11/15/2010 200.00 5/15/2009
Greentown China Holdings, Ltd. Senior secured 9.00 11/8/2013 361.33 5/19/2009
Ion Media Networks, Inc.a Secured 4.38 1/15/2012 400.00 5/19/2009
Ion Media Networks, Inc. Senior secured 8.38 1/15/2013 448.07 5/19/2009
Harrah's Operating Co., Inc. Senior secured 10.00 12/15/2015 26.65 5/20/2009
Harrah's Operating Co., Inc. Senior secured 10.00 12/15/2018 38.12 5/20/2009
McClatchy Co. (Knight Ridder) Senior unsecured 4.63 11/1/2014 20.00 5/21/2009
McClatchy Co. (Knight Ridder) Senior unsecured 7.13 6/1/2011 130.00 5/21/2009
Visteon Corp. Senior unsecured 12.25 12/31/2016 206.39 5/27/2009
Visteon Corp. Senior unsecured 7.00 3/10/2014 450.00 5/27/2009
Visteon Corp. Senior unsecured 8.25 8/1/2010 206.00 5/27/2009
Metaldyne Corp. Senior sub. 11.00 6/15/2012 34.09 5/27/2009
Metaldyne Corp. Senior unsecured 10.00 11/1/2013 4.60 5/27/2009
R.H. Donnelley Corp. (Dex Media West, LLC) Senior unsecured 5.88 11/15/2011 8.72 5/28/2009
R.H. Donnelley Corp. (Dex Media, Inc.) Senior unsecured 8.00 11/15/2013 500.00 5/28/2009
R.H. Donnelley Corp. (Dex Media West, LLC) Senior unsecured 8.50 8/15/2010 385.00 5/28/2009
R.H. Donnelley Corp. (Dex Media, Inc.) Senior unsecured 9.00 11/15/2013 388.24 5/28/2009
R.H. Donnelley Corp. (Dex Media, Inc.) Senior discount 9.00 11/15/2013 361.00 5/28/2009
R.H. Donnelley Corp. (Dex Media West, LLC) Senior sub. 9.88 8/15/2013 761.70 5/28/2009
R.H. Donnelley, Inc. Senior unsecured 11.75 5/15/2015 412.87 5/28/2009
R.H. Donnelley Corp. Senior unsecured 6.88 1/15/2013 206.79 5/28/2009
R.H. Donnelley Corp. Senior discount 6.88 1/15/2013 320.78 5/28/2009
R.H. Donnelley Corp. Senior discount 6.88 1/15/2013 483.49 5/28/2009
R.H. Donnelley Corp. Senior unsecured 8.88 1/15/2016 1,012.84 5/28/2009
R.H. Donnelley Corp. Senior unsecured 8.88 10/15/2017 4.00 5/28/2009
R.H. Donnelley Corp. Senior unsecured 8.88 10/15/2017 1,235.26 5/28/2009
Hawaii Superferry, Inc. US Government
Gty
5.73 5/30/2027 68.72 5/30/2009
Hawaii Superferry, Inc. US Government
Gty
5.80 2/28/2030 71.01 5/30/2009
Caraustar Industries, Inc. Senior unsecured 7.25 5/1/2010 29.00 5/31/2009
Caraustar Industries, Inc. Senior unsecured 7.38 6/1/2009 189.75 5/31/2009
General Motors Corp. Pass thru Certs 8.95 7/2/2009 19.18 6/1/2009
General Motors Corp. Senior unsecured 6.75 5/1/2028 600.00 6/1/2009
General Motors Corp. Senior unsecured 7.13 7/15/2013 1,000.00 6/1/2009
General Motors Corp. Senior unsecured 7.20 1/15/2011 1,500.00 6/1/2009
General Motors Corp. Senior unsecured 7.38 5/23/2048 425.00 6/1/2009
General Motors Corp. Senior unsecured 7.40 9/1/2025 500.00 6/1/2009

February 08, 2010 Altman High-Yield Bond Default and Return Report
48
Defaulted Corporate Straight Debt Issues — 2009 (Dollars in Millions) (Continued)
Company Bond Issue
Coupon
(%) Maturity Date
Outstanding
Amount ($MM) Default Date
General Motors Corp. Senior unsecured 7.70 4/15/2016 500.00 6/1/2009
General Motors Corp. Senior unsecured 7.75 3/15/2036 377.38 6/1/2009
General Motors Corp. Senior unsecured 8.10 6/15/2024 400.00 6/1/2009
General Motors Corp. Senior unsecured 8.25 7/15/2023 1,250.00 6/1/2009
General Motors Corp. Senior unsecured 8.38 7/15/2033 3,000.00 6/1/2009
General Motors Corp. Senior unsecured 8.80 3/1/2021 524.79 6/1/2009
General Motors Corp. Senior unsecured 9.40 7/15/2021 15.00 6/1/2009
General Motors Corp. Senior unsecured 9.40 7/15/2021 299.80 6/1/2009
General Motors Corp. Senior unsecured 9.45 11/1/2011 48.17 6/1/2009
Six Flags, Inc. Senior unsecured 9.63 6/1/2014 314.79 6/1/2009
Six Flags, Inc. Senior unsecured 9.63 6/1/2014 1.10 6/1/2009
Lear Corp. Senior unsecured 8.75 12/1/2016 589.93 6/1/2009
Lear Corp. Senior unsecured 8.50 12/1/2013 298.00 6/1/2009
Finlay Fine Jewelry Corp. Senior unsecured 8.38 6/1/2012 40.60 6/1/2009
Hawker Beechcraft Acquisition Co.,
LLC
Senior unsecured 8.50 4/1/2015 89.10 6/2/2009
Hawker Beechcraft Acquisition Co.,
LLC
Senior unsecured 8.88 4/1/2015 109.87 6/2/2009
Hawker Beechcraft Acquisition Co.,
LLC
Senior sub. 9.75 4/1/2017 75.50 6/2/2009
William Lyon Homes Inc. Senior unsecured 10.75 4/1/2013 2.38 6/5/2009
William Lyon Homes Inc. Senior unsecured 7.50 2/15/2014 21.71 6/5/2009
William Lyon Homes Inc. Senior unsecured 7.63 12/15/2012 29.05 6/5/2009
Affinity Group, Inc. Senior sub. 9.00 2/15/2012 14.60 6/5/2009
Hexion Specialty Chemicals, Inc. Senior unsecured 7.88 2/15/2023 10.78 6/8/2009
Hexion Specialty Chemicals, Inc. Senior unsecured 8.38 4/15/2016 5.03 6/8/2009
Hexion Specialty Chemicals, Inc. Senior unsecured 9.20 3/15/2021 5.29 6/8/2009
Momentive Performance Matls, Inc. Senior unsecured 9.75 12/1/2014 48.40 6/9/2009
Momentive Performance Matls, Inc. Senior unsecured 10.13 12/1/2014 140.90 6/9/2009
Momentive Performance Matls, Inc. Senior sub. 11.50 12/1/2016 118.10 6/9/2009
Fontainebleau Las Vegas Hldgs, LLC 2nd Mortgage Notes 10.25 6/15/2015 675.00 6/9/2009
Six Flags, Inc. Senior unsecured 8.88 2/1/2010 131.08 6/13/2009
Six Flags, Inc. Senior unsecured 12.25 7/15/2016 400.00 6/13/2009
Buffalo Thunder Development
Authority
Senior secured 9.38 12/15/2014 245.00 6/15/2009
Extended Stay America Senior sub. 9.88 6/15/2011 8.15 6/15/2009
Interactive Health, LLC Senior notes 7.25 4/1/2011 83.97 6/15/2009
Advanta Capital Trust 1 Junior sub. 8.99 12/17/2026 10.80 6/15/2009
McClatchy Co. (Knight Ridder) Senior unsecured 4.63 11/1/2014 11.10 6/25/2009
McClatchy Co. (Knight Ridder) Senior unsecured 5.75 9/1/2017 53.40 6/25/2009
McClatchy Co. (Knight Ridder) Debentures 6.88 3/15/2029 23.80 6/25/2009
McClatchy Co. (Knight Ridder) Senior unsecured 7.13 6/1/2011 3.80 6/25/2009
McClatchy Co. (Knight Ridder) Debentures 7.15 11/1/2027 10.80 6/25/2009
Allis-Chalmers Energy, Inc. Senior unsecured 8.50 3/1/2017 44.20 6/26/2009
Allis-Chalmers Energy, Inc. Senior unsecured 9.00 1/15/2014 30.56 6/26/2009
Beazer Homes USA, Inc. Senior unsecured 8.63 5/15/2011 5.00 6/30/2009
Beazer Homes USA, Inc. Senior unsecured 8.38 4/15/2012 27.40 6/30/2009
Beazer Homes USA, Inc. Senior unsecured 6.50 11/15/2013 17.01 6/30/2009
Beazer Homes USA, Inc. Senior unsecured 6.88 7/15/2015 34.76 6/30/2009
Beazer Homes USA, Inc. Senior unsecured 8.13 6/15/2016 24.33 6/30/2009
Medianews Group, Inc. Senior sub. 6.38 4/1/2014 150.00 7/1/2009
NXP B.V. Senior notes 9.50 10/15/2015 57.50 7/1/2009
NXP B.V.a Senior secured 3.88 10/15/2013 121.60 7/1/2009
NXP B.V. Senior secured 7.88 10/15/2014 90.10 7/1/2009
Lear Corp. Senior unsecured 5.75 8/1/2014 400.00 7/7/2009
Rathgibson, Inc. Senior unsecured 11.25 2/15/2014 200.00 7/13/2009
Hovnanian Enterprises, Inc. Senior unsecured 8.21 4/1/2012 49.43 7/20/2009
Hovnanian Enterprises, Inc. Senior unsecured 6.92 1/15/2014 51.92 7/20/2009
Georgia Gulf Corp. Senior unsecured 9.50 10/15/2014 486.80 7/24/2009
Georgia Gulf Corp. Senior sub. 10.75 10/15/2016 158.10 7/24/2009
Georgia Gulf Corp. Senior unsecured 7.13 12/15/2013 91.00 7/24/2009
Unisys Corp. Senior unsecured 6.88 3/15/2010 235.09 7/28/2009
Unisys Corp. Senior unsecured 8.00 10/15/2012 331.96 7/28/2009

February 08, 2010 Altman High-Yield Bond Default and Return Report
49
Defaulted Corporate Straight Debt Issues — 2009 (Dollars in Millions) (Continued)
Company Bond Issue
Coupon
(%) Maturity Date
Outstanding
Amount ($MM) Default Date
Unisys Corp. Senior unsecured 8.50 10/15/2015 133.99 7/28/2009
Unisys Corp. Senior unsecured 12.50 1/15/2016 59.38 7/28/2009
Haights Cross Communications, Inc. Senior discount 12.50 8/15/2011 135.00 8/1/2009
Commercial Vehicle Group, Inc. Senior notes 8.00 7/1/2013 52.20 8/3/2009
Cooper-Standard Automotive, Inc. Senior unsecured 7.00 12/15/2012 200.00 8/3/2009
Cooper-Standard Automotive, Inc. Senior sub. 8.38 12/15/2014 323.00 8/3/2009
American Achievement Group Hldg
Corp.
Senior unsecured 12.75 10/1/2012 65.34 8/5/2009
Finlay Fine Jewelry Corp. Senior secured 8.38 6/1/2012 173.98 8/5/2009
Finlay Fine Jewelry Corp. Senior secured 11.38 6/1/2012 22.80 8/5/2009
Duane Reade, Inc. Senior sub. 9.75 8/1/2011 143.29 8/6/2009
CIT Group, Inc. Senior unsecured 0.97 8/17/2009 598.10 8/14/2009
Colonial BancGroup, Inc. Subordinated notes 8.88 3/15/1938 250.00 8/14/2009
Colonial BancGroup, Inc. (Colonial
Bank)
Subordinated notes 9.38 6/1/2011 56.80 8/14/2009
Colonial BancGroup, Inc. (Colonial
Bank)
Subordinated notes 6.38 12/1/2015 280.00 8/14/2009
Colonial BancGroup, Inc. (CBG
Florida REIT)
Unsecured 7.11 5/15/1949 300.00 8/14/2009
Novamerican Steel, Inc. Senior secured 11.50 11/15/2015 315.00 8/14/2009
Haights Cross Communications, Inc.
(Operating Co.)
Senior unsecured 11.75 8/15/2011 138.80 8/15/2009
Little Traverse Bay Bands Odawa
Indians
Senior notes 10.25 2/15/2014 122.00 8/15/2009
Stanley-Martin Communities, LLC Senior sub. 9.75 8/15/2010 133.32 8/15/2009
E Trade Financial Corp. Senior unsecured 8.00 6/15/2011 429.62 8/19/2009
E Trade Financial Corp. Senior unsecured 12.50 11/30/2014 1,310.00 8/19/2009
Readers Digest Association, Inc. Senior sub. 9.00 2/15/2017 600.00 8/24/2009
Clear Channel Communications, Inc. Senior unsecured 6.25 3/15/2011 20.20 8/27/2009
Clear Channel Communications, Inc. Senior unsecured 4.40 3/15/2011 56.04 8/27/2009
Clear Channel Communications, Inc. Senior unsecured 5.00 3/15/2012 19.95 8/27/2009
Clear Channel Communications, Inc. Senior unsecured 5.75 1/15/2013 116.40 8/27/2009
Clear Channel Communications, Inc. Senior unsecured 5.50 9/15/2014 199.55 8/27/2009
Beazer Homes USA, Inc. Senior unsecured 8.63 5/15/2011 47.70 9/1/2009
Beazer Homes USA, Inc. Senior unsecured 6.50 11/15/2013 13.50 9/1/2009
Beazer Homes USA, Inc. Senior unsecured 6.88 7/15/2015 31.40 9/1/2009
Beazer Homes USA, Inc. Senior unsecured 8.13 6/15/2016 31.70 9/1/2009
Samsonite Corp. Senior sub. 8.88 6/1/2011 0.26 9/1/2009
MxEnergy Holdings, Inc.a Senior unsecured 8.43 8/1/2011 158.79 9/18/2009
Velocity Express Corp. Senior secured 18.00 12/30/2010 86.01 9/24/2009
Appleton Papers, Inc. Senior sub. 9.75 6/15/2014 109.73 9/25/2009
Appleton Papers, Inc. Senior unsecured 8.13 6/15/2011 91.94 9/25/2009
Citizens Republic Bancorp, Inc. Subordinated 5.75 2/1/2013 108.00 9/25/2009
Newpage Corp. Senior secured 10.00 5/1/2012 22.97 9/25/2009
Newpage Corp.a Senior secured 6.73 5/1/2012 2.24 9/25/2009
Realogy Corp. Senior unsecured 11.00 4/15/2014 220.00 9/30/2009
Fairpoint Communications, Inc. Senior unsecured 13.13 4/1/2018 91.52 10/1/2009
Fairpoint Communications, Inc. Senior unsecured 13.13 4/2/2018 439.57 10/1/2009
Canwest Media, Inc. Senior sub. 8.00 9/15/2012 761.05 10/7/2009
Accuride Corp. Senior sub. 8.50 2/1/2015 275.00 10/8/2009
Hovnanian Enterprises, Inc. Senior unsecured 8.00 4/1/2012 7.95 10/19/2009
Hovnanian Enterprises, Inc. Senior unsecured 6.50 1/15/2014 57.10 10/19/2009
Hovnanian Enterprises, Inc. Senior unsecured 6.38 12/15/2014 23.55 10/19/2009
Hovnanian Enterprises, Inc. Senior unsecured 6.25 1/15/2016 73.59 10/19/2009
Hovnanian Enterprises, Inc. Senior unsecured 6.25 1/15/2015 36.63 10/19/2009
Hovnanian Enterprises, Inc. Senior unsecured 7.50 5/15/2016 0.20 10/19/2009
Stallion Oilfield Services, Inc. Senior unsecured 9.75 2/1/2015 300.00 10/19/2009
Atlantic Express Transportation
Corp.a
Senior secured 7.53 4/15/2012 183.00 10/20/2009
Nortek, Inc. Senior sub. 8.50 9/1/2014 624.50 10/21/2009
Nortek, Inc. Senior sub. 9.88 6/15/2011 10.00 10/21/2009
NTK Holdings, Inc. Discount 10.75 3/1/2014 403.00 10/21/2009
Nortek, Inc. Senior secured 10.00 12/1/2013 750.00 10/21/2009
William Lyon Homes Inc. Senior unsecured 10.75 4/1/2013 23.25 10/23/2009

February 08, 2010 Altman High-Yield Bond Default and Return Report
50
Defaulted Corporate Straight Debt Issues — 2009 (Dollars in Millions) (Continued)
Company Bond Issue
Coupon
(%) Maturity Date
Outstanding
Amount ($MM) Default Date
William Lyon Homes Inc. Senior unsecured 7.63 12/15/2012 31.62 10/23/2009
William Lyon Homes Inc. Senior unsecured 7.50 2/15/2014 17.64 10/23/2009
Capmark Financial Group, Inc. Senior unsecured 5.88 5/10/2012 1,200.00 10/25/2009
Capmark Financial Group, Inc. Senior unsecured 6.30 5/10/2017 500.00 10/25/2009
Capmark Financial Group, Inc. Senior unsecured 0.00 5/10/2010 637.50 10/25/2009
Libbey Glass, Inc. Senior sub. 16.00 12/1/2011 160.86 10/28/2009
Anthracite Capital, Inc. Senior notes 7.22 10/30/2016 50.00 10/30/2009
Anthracite Capital, Inc. Senior unsecured 8.13 7/30/2017 37.50 10/30/2009
Anthracite Capital, Inc. Senior unsecured 7.77 7/30/2017 50.00 10/30/2009
CIT Group, Inc. Senior Unsecured 0.53 12/21/2009 113.00 11/1/2009
CIT Group, Inc. Senior Unsecured 0.42 3/12/2010 1,000.00 11/1/2009
CIT Group, Inc. Senior Unsecured 0.45 3/22/2010 150.00 11/1/2009
CIT Group, Inc. Senior Unsecured 0.77 11/3/2010 474.00 11/1/2009
CIT Group, Inc. Senior Unsecured 0.51 4/27/2011 280.23 11/1/2009
CIT Group, Inc. Senior Unsecured 0.56 7/28/2011 669.50 11/1/2009
CIT Group, Inc. Senior Unsecured 0.70 2/13/2012 654.25 11/1/2009
CIT Group, Inc. Senior Unsecured 0.69 12/21/2012 290.71 11/1/2009
CIT Group, Inc. Senior Unsecured 4.13 11/3/2009 500.00 11/1/2009
CIT Group, Inc. Senior Unsecured 4.25 2/1/2010 750.00 11/1/2009
CIT Group Funding Co. of Canada Senior Unsecured 4.65 7/1/2010 990.49 11/1/2009
CIT Group, Inc. Senior Unsecured 4.75 12/15/2010 750.00 11/1/2009
CIT Group, Inc. Senior Unsecured 5.00 2/13/2014 671.75 11/1/2009
CIT Group, Inc. Senior Unsecured 5.00 2/1/2015 671.14 11/1/2009
CIT Group, Inc. Senior Unsecured 5.13 9/30/2014 638.27 11/1/2009
CIT Group, Inc. Senior Unsecured 5.20 11/3/2010 500.00 11/1/2009
CIT Group Funding Co. of Canada Senior Unsecured 5.20 6/1/2015 657.41 11/1/2009
CIT Group, Inc. Senior Unsecured 5.40 2/13/2012 480.00 11/1/2009
CIT Group, Inc. Senior Unsecured 5.40 3/7/2013 483.52 11/1/2009
CIT Group, Inc. Senior Unsecured 5.40 1/30/2016 604.26 11/1/2009
CIT Group, Inc. Senior Unsecured 5.60 4/27/2011 750.00 11/1/2009
CIT Group Funding Co. of Canada Senior Unsecured 5.60 11/2/2011 487.00 11/1/2009
CIT Group, Inc. Senior Unsecured 5.65 2/13/2017 548.09 11/1/2009
CIT Group, Inc. Senior Unsecured 5.80 7/28/2011 550.00 11/1/2009
CIT Group, Inc. Senior Unsecured 5.80 10/1/2036 316.02 11/1/2009
CIT Group, Inc. Senior Unsecured 5.85 9/15/2016 391.53 11/1/2009
CIT Group, Inc. Senior Unsecured 6.00 4/1/2036 309.02 11/1/2009
CIT Group, Inc. Junior Sub. 6.10 3/15/2067 750.00 11/1/2009
Tyco Capital Corp. Pass thru Certs./
Secured
6.49 1/5/2021 165.46 11/1/2009
CIT Group, Inc. Senior Unsecured 6.88 11/1/2009 300.00 11/1/2009
CIT Group, Inc. Senior Unsecured 7.63 11/30/2012 1,277.65 11/1/2009
CIT Group, Inc. Senior Unsecured 7.75 4/2/2012 259.65 11/1/2009
Alphagen Power, LLC Bond Issue 9.02 6/30/2024 155.17 11/1/2009
CIT Group, Inc. Subordinated 12.00 12/18/2018 1,149.01 11/1/2009
CIT Group, Inc. Senior Unsecured Various Various 3,196.25 11/1/2009
Advanta Capital Trust 1 Junior sub. 8.99 12/17/2026 89.20 11/8/2009
Energy Future Holdings Corp. Senior unsecured 5.55 11/15/2014 17.30 11/10/2009
Energy Future Holdings Corp. Senior unsecured 6.50 11/15/2024 10.20 11/10/2009
Energy Future Holdings Corp. Senior unsecured 6.55 11/15/2034 5.70 11/10/2009
Energy Future Holdings Corp. Senior unsecured 11.25 11/1/2017 11.70 11/10/2009
Energy Future Holdings Corp. Senior unsecured 10.88 11/1/2017 169.50 11/10/2009
Energy Future Holdings Corp. (TCEH) Senior unsecured 10.25 11/1/2015 55.90 11/10/2009
Energy Future Holdings Corp. (TCEH) Senior unsecured 10.25 11/1/2015 87.20 11/10/2009
Energy XXI Gulf Coast, Inc. Senior unsecured 10.00 6/15/2013 347.50 11/11/2009
Simmons Co. Senior discount 0.00 12/15/2014 0.25 11/16/2009
Simmons Co. Senior sub. 7.88 1/15/2014 200.00 11/16/2009
Simmons Co. Senior discount 0.00 12/15/2014 268.75 11/16/2009
GSI Group, Inc. Senior unsecured 11.00 8/15/2013 210.00 11/20/2009

February 08, 2010 Altman High-Yield Bond Default and Return Report
51
Defaulted Corporate Straight Debt Issues — 2009 (Dollars in Millions) (Continued)
Company Bond Issue
Coupon
(%) Maturity Date
Outstanding
Amount ($MM) Default Date
Ahern Rentals, Inc. Senior secured 9.25 8/15/2013 252.47 12/23/2009
USF Corp. (YRC Worldwide, Inc.) Senior unsecured 8.50 4/15/2010 105.00 12/30/2009
Total 123,824
Total Number of Issues 405
Total Number of Companies 119 aFRN.
bYankee bond.
Source: NYU Salomon Center.

February 08, 2010 Altman High-Yield Bond Default and Return Report
52
Appendix C
Distressed Exchanges, 2009
Issuer Name
Distressed
Exchange Date
Amount Exchanged
($ Millions)
Bonten Media Acquisition Co. 1/30/2009 27.60
Intelsat Ltd. 2/11/2009 460.61
American Achievement Group Holding Corp. 2/25/2009 104.30
Freescale Semiconductor, Inc. 3/10/2009 3,040.67
OSI Restaurant Partners, LLC 3/20/2009 240.00
Kraton Polymers, LLC 3/26/2009 30.00
Sensata Technologies B.V. 3/30/2009 109.99
NXP B.V. 3/30/2009 420.00
Berry Plastics Corp. 3/31/2009 24.00
Hexion U.S. Finance Corp. 3/31/2009 172.00
Barrington Broadcasting, LLC 3/31/2009 67.80
Harrah's Operating Co., Inc. 4/01/2009 5,550.78
CMP Susquehanna Corp. 4/03/2009 175.46
Ford Motor Co. 4/03/2009 3,353.91
French Lick Resort & Casino, LLC 4/15/2009 31.70
Sabre Holdings Corp. 4/30/2009 76.00
Greentown China Holdings, Ltd. 5/19/2009 361.33
Harrah's Operating Co., Inc. 5/20/2009 64.77
McClatchy Co. (Knight Ridder) 5/21/2009 150.00
Hawker Beechcraft Acquisition Co., LLC 6/02/2009 274.47
William Lyon Homes, Inc. 6/05/2009 53.14
Affinity Group, Inc. 6/05/2009 14.60
Hexion Specialty Chemicals, Inc. 6/08/2009 21.10
Momentive Performance Materials, Inc. 6/09/2009 307.40
Advanta Capital Trust I 6/15/2009 10.80
Interactive Health, LLC 6/15/2009 83.97
McClatchy Co. (Knight Ridder) 6/25/2009 102.90
Allis-Chalmers Energy, Inc. 6/26/2009 74.76
Beazer USA Homes, Inc. 6/30/2009 108.50
NXP B.V. 7/01/2009 269.20
Hovnanian Enterprises, Inc. 7/20/2009 101.35
Georgia Gulf Corp. 7/24/2009 735.90
Unisys Corp. 7/28/2009 760.41
Commercial Vehicle Group, Inc. 8/03/2009 52.20
American Achievement Group Holding Corp. 8/05/2009 65.34
Duane Reade, Inc. 8/06/2009 143.29
CIT Group, Inc. 8/14/2009 598.10
E Trade Financial Corp. 8/19/2009 1,739.62
Clear Channel Communications, Inc. 8/27/2009 412.13
Beazer USA Homes, Inc. 9/01/2009 124.30
MxEnergy Holdings, Inc. 9/18/2009 158.79
Appleton Papers, Inc. 9/25/2009 201.66
Citizens Republic Bancorp, Inc. 9/25/2009 108.00
Newpage Corp. 9/25/2009 25.20
Realogy Corp. 9/30/2009 220.00
Hovnanian Enterprises 10/19/2009 199.02
Atlantic Express Transportation Corp. 10/20/2009 183.00
William Lyon Homes, Inc. 10/23/2009 72.51
Libbey Glass, Inc. 10/28/2009 160.86
Energy Future Holdings Corp. 11/10/2009 357.50
Energy XXI Gulf Coast, Inc. 11/11/2009 347.50
Ahern Rentals, Inc. 12/23/2009 252.47
USF Corp. (YRC Worldwide, Inc.) 12/30/2009 105.00
Total $ Amount of Distressed Exchanges $22,905.90
Total Number of Issuers 45

February 08, 2010 Altman High-Yield Bond Default and Return Report
53
Appendix D
Leveraged Loan Defaults, 2009
Company Default Date
United States Shipping, LLC 6 Jan 09
LyondellBasell Industries 6 Jan 09
Northeast Biofuels, LLC 14 Jan 09
Foamex International, Inc. 23 Jan 09
Smurfit-Stone Container Corp. 26 Jan 09
Spectrum Brands, Inc. 3 Feb 09
Cygnus Business Media, Inc. 10 Feb 09
Aleris International, Inc. 12 Feb 09
Young Broadcasting, Inc. 17 Feb 09
Bearing Point, Inc. 18 Feb 09
Masonite Corp. 16 Mar 09
General Growth Properties, Inc. 17 Mar 09
True Temper Sports, Inc. 17 Mar 09
Charter Communications Holdings, LLC 27 Mar 09
Idearc, Inc. 31 Mar 09
Riviera Holdings Corp. 1-Apr-09
Rhodes Homes 1-Apr-09
United Subcontractors, Inc. 1-Apr-09
MediaNews Group, Inc. 1-Apr-09
Airborne Health, Inc. 28-Apr-09
Mark IV Industries, Inc. 30-Apr-09
GSC Group, Inc. 5-May-09
November 2005 Land Investors, LLC 12-May-09
Atrium Companies, Inc. 18-May-09
JG Wentworth, LLC 19-May-09
Paxson Communications Television, Inc. 20-May-09
Visteon Corp. 28-May-09
Metaldyne Corp. 28-May-09
R.H. Donnelley Corp. 29-May-09
General Motors Corp. 1-Jun-09
Fontainebleau Resorts, LLC 10-Jun-09
Six Flags, Inc. 14-Jun-09
Building Materials Holding Corp. 16-Jun-09
Wembley 23-Jun-09
Express Energy Services Operating, LP 2-Jul-09
Panolam Industries International, Inc. 2-Jul-09
Lear Corp. 1-Jul-09
J.L. French Automotive Castings, Inc. 13-Jul-09
New Vision Television, LLC 14-Jul-09
Euramax International 14-Jul-09
Wilton Paper Crafts, Inc. 20-Jul-09
Hicks Sports Group, LLC 31-Jul-09
CanWest Media, Inc. 31-Jul-09
Cooper Standard Automotive, Inc. 3-Aug-09
Dynea North America 10-Aug-09
Readers Digest Association, Inc. 25-Aug-09
Trident Exploration Corp. 9-Sep-09
Stallion Oilfield Services, Ltd 21-Sep-09
Targus Group International, Inc. 30-Sep-09
Fairpoint Communications, Inc. 1-Oct-09
Questex Media Group, Inc. 5-Oct-09
Advanstar Communications, Inc. 6-Oct-09
Accuride Corp. 8-Oct-09
Champion Home Builders Co. 15-Oct-09
Metro-Goldwyn-Mayer, Inc. 19-Oct-09
California Coastal Communities, Inc. 28-Oct-09
Centaur, LLC 28-Oct-09
GPX International Tire Corp. 29-Oct-09
Endurance Business Media, Inc. 30-Oct-09
Simmons Co. 16-Nov-09

February 08, 2010 Altman High-Yield Bond Default and Return Report
54
Leveraged Loan Defaults, 2009 (Continued)
Company Default Date
White Birch Paper Co. 17-Nov-09
Quality Home Brands Holdings, LLC 4-Dec-09
Citadel Broadcasting Corp. 21-Dec-09
NextMedia Operating, Inc. 21-Dec-09
Total Number of Companies 64
Source: S&P LCD.

February 08, 2010 Altman High-Yield Bond Default and Return Report
55
Appendix E
Chapter 11 Filings in 2009 — Listed by Liability Size, Liabilities
Greater Than $100 Million (Dollars in Millions)

February 08, 2010 Altman High-Yield Bond Default and Return Report
56
Company
Date of
Filing Liabilities ($)
General Motors Corp. Jun-09 172,810.00
CIT Group, Inc. Nov-09 64,901.20
Chrysler, LLC Apr-09 55,200.00
General Growth Properties, Inc. Apr-09 27,293.73
Thornburg Mortgage, Inc. May-09 24,700.00
Charter Communications, Inc. Mar-09 24,185.67
Capmark Financial Group, Inc. Oct-09 21,000.00
Lyondell Chemical Co. Jan-09 19,337.00
R.H. Donnelley Corp. May-09 12,374.08
Nortel Networks, Inc. Jan-09 10,867.00
Idearc, Inc. Mar-09 9,515.00
Abitibi Bowater, Inc. Apr-09 8,783.00
Extended Stay America, Inc. Jun-09 7,600.00
Station Casinos, Inc. Jul-09 6,482.64
Smurfit-Stone Container Jan-09 5,582.00
Visteon Corp. May-09 5,324.03
Lear Corp. Jul-09 4,536.00
Spectrum Brands, Inc. Feb-09 4,445.81
Aleris International, Inc. Feb-09 4,233.60
Six Flags, Inc. Jun-09 3,431.65
Reader's Digest Association, Inc. Aug-09 3,400.00
Fairpoint Communications, Inc. Oct-09 3,254.47
Erickson Retirement Communities, LLC Oct-09 3,000.00
NTK Holdings, Inc. (Nortek, Inc.) Oct-09 2,778.10
Masonite Corp. Mar-09 2,641.59
Citadel Broadcasting Corp. Dec-09 2,464.31
Spansion, Inc. Mar-09 2,398.00
Bearingpoint, Inc. Feb-09 2,231.84
Source Interlink Companies, Inc. Apr-09 1,995.50
Ion Media Networks, Inc. May-09 1,936.00
Cooper Standard Holdings, Inc. Aug-09 1,785.04
Trump Entertainment Resorts Feb-09 1,737.73
Samsonite Corp. Sep-09 1,500.00
Opus West, LP Jul-09 1,460.00
Hayes Lemmerz International, Inc. May-09 1,405.20
Simmons Co. Nov-09 1,263.55 Herbst Gaming, Inc. Mar-09 1,241.94 Tronox, Inc. Jan-09 1,221.60 Freedom Commuications, Inc. Sep-09 1,077.00 Magnachip Semiconductor, LLC Jun-09 1,041.00 Tarragon Corp. Jan-09 1,035.58 Pliant Corp. Feb-09 1,032.63 Chemtura Corp. Mar-09 1,020.00
a BNC Mortgage, LLC Jan-09 1,000.00
a Crescent Resources, LLC Jun-09 1,000.00
a Fontainebleau Las Vegas Holdings, LLC Jun-09 1,000.00
a Mark IV Industries, Inc. Apr-09 1,000.00
a Qimonda N.A. Corp. Feb-09 1,000.00
a Sea Launch Co., LLC Jun-09 1,000.00
a Taylor, Bean & Whitaker Mortgage Corp. Aug-09 1,000.00 Young Broadcasting, Inc. Feb-09 980.43 Magna Entertainment Corp. Mar-09 958.59 WL Homes, LLC Feb-09 937.00 Apex Silver Mines Ltd. Jan-09 930.91 Metaldyne Corp. May-09 929.00 Accuride Corp. Oct-09 847.02 Fairfield Residential, LLC Dec-09 839.40
Chapter 11 Filings in 2009 — Listed by Liability Size, Liabilities
Greater Than $100 Million (Dollars in Millions) (Continued)
Company
Date of
Filing Liabilities ($)
Sun-Times Media Group, Inc. Mar-09 801.00
Milacron, Inc. Mar-09 752.00
b Bodie Electrical Contractors of Florida, Jan-09 750.00

February 08, 2010 Altman High-Yield Bond Default and Return Report
57
Inc.
b CCS Medical, Inc. Jul-09 750.00
b DBSD North America, Inc. May-09 750.00
b Eastwind Maritime, Inc. Jun-09 750.00
b Good Samaritan Hospice USA, Inc. Feb-09 750.00
b Hawkeye Renewables, LLC Dec-09 750.00
b Plant Insulation Co. May-09 750.00
b Primus Telecommunication Group, Inc. Mar-09 750.00
b QHB Holdings, LLC (Generation Brands) Dec-09 750.00
b Stallion Oilfied Services Ltd. Oct-09 750.00
b Trident Resources Corp. Sep-09 750.00
b UTGR, Inc. Jun-09 750.00
Majestic Star Casino, LLC Nov-09 749.56
Energy Partners Ltd. May-09 708.37
Journal Register Co. Feb-09 706.27
Star Tribune Holdings Corp. Jan-09 661.10
Fleetwood Enterprises, Inc. Mar-09 623.55
US Shipping Partners, LP Apr-09 606.53
Merisant Worldwide, Inc. Jan-09 560.70
BankUnited Financial Corp. May-09 559.74
Champion Enterprises, Inc. Nov-09 532.76
Silicon Graphics, Inc. Apr-09 526.55
Muzak Holdings, LLC Feb-09 503.00
Aventine Renewable Energy Holdings, Inc. Apr-09 490.66
Building Materials Holding Corp. Jun-09 481.31
Sportsman's Warehouse, Inc. Mar-09 452.10
Transmeridian Exploration, Inc. Mar-09 451.68
Vineyard National Bancorp. Jul-09 449.77
Panolam Industries International, Inc. Nov-09 447.50
Eddie Bauer Holding, Inc. Jun-09 426.71
Dayton Superior Corp. Apr-09 405.87
Pacific Energy Resources, Ltd. Mar-09 398.00
Finlay Enterprises, Inc. Aug-09 385.48
Barzel Industries, Inc. Sep-09 384.60 Colonial Bancgroup, Inc. Aug-09 380.00 Foamex International, Inc. Feb-09 379.71 Caraustar Industries, Inc. May-09 376.85 GSI Group, Inc. Nov-09 370.00 Pacific Ethanol, Inc. May-09 347.93 Arclin US Holdings, Inc. Jul-09 347.30 Meruelo Maddux Properties, Inc. Mar-09 342.02
Advanta Corp. Nov-09 331.00
Crusader Energy Group, Inc. Mar-09 325.84
Guaranty Financial Group, Inc. Aug-09 323.41
TXCO Resources, Inc. May-09 322.83
Questex Media Group, Inc. Oct-09 321.00
Rathgibson, Inc. Jul-09 319.20 True Temper Sports, Inc. Oct-09 319.03 Decode Genetics, Inc. Nov-09 313.92 Fortunoff Holdings, LLC Feb-09 305.80 Broadstripe, LLC Jan-09 303.64 Midway Games, Inc. Feb-09 281.03 Hartmarx Corp. Jan-09 261.22
c 2008 Asset Holding Corp. Jun-09 250.00
c Accredited Home Lenders Holding May-09 250.00
c AGT Crunch Acquisition, LLC May-09 250.00
c Amaravathi Ltd. Partnership Apr-09 250.00
c American Housing Foundation Jun-09 250.00

February 08, 2010 Altman High-Yield Bond Default and Return Report
58
Chapter 11 Filings in 2009 — Listed by Liability Size, Liabilities
Greater Than $100 Million (Dollars in Millions) (Continued)
Company
Date of
Filing Liabilities ($) c ARG Enterprises, Inc. Jan-09 250.00
c Axia, Inc. Dec-09 250.00
c Banex 1, LLC Apr-09 250.00
c Basha's, Inc. Jul-09 250.00
c Bethany Rolling Hills, LLC Apr-09 250.00
c Bi-Lo, LLC Mar-09 250.00
c Bruno's Supermarkets, LLC Feb-09 250.00
c Cabi Downtown, LLC Aug-09 250.00
c Cambridge-Lee Holdings, Inc. Dec-09 250.00
c Carver Italia, LLC Jun-09 250.00
c Cascade Grain Products, LLC Jan-09 250.00
c Catholic Diocese Of Wilmington, Inc. Oct-09 250.00
c CCI Funding I, LLC Feb-09 250.00
c CommerceConnect Media Holdings, Inc. Aug-09 250.00
c Coyotes Hockey, LLC May-09 250.00
c Crown Village Farm, LLC May-09 250.00
c Crucible Materials Corp. May-09 250.00
c Deep Marine Technology, Inc. Dec-09 250.00
c Dewey Ranch Hockey, LLC May-09 250.00
c Drug Fair Group, Inc. Mar-09 250.00
c Ennis Homes, Inc. Feb-09 250.00
c Ennis Land Development, Inc. Jul-09 250.00
c Ennstone, Inc. Feb-09 250.00
c Equipment Acquisition Resources, Inc. Oct-09 250.00
c Escada (USA), Inc. Aug-09 250.00
c Eurofresh, Inc. Apr-09 250.00
c Filene's Basement, Inc. May-09 250.00
c First Republic Group Realty, LLC Jun-09 250.00
c Forum Health Outreach Laboratories, Inc. Mar-09 250.00
c FRGR Managing Member, LLC Mar-09 250.00
c Fulton Homes Corp. Jan-09 250.00
c G.I. Joe's Holding Corp. Mar-09 250.00
c Galleria (Hong Kong) Ltd. Sep-09 250.00
c Global Safety Textiles Holdings, LLC Jun-09 250.00
c Goody's, LLC Jan-09 250.00
c GPX Interrnational Tire Corp. Oct-09 250.00
c Greenbrier Hotel Corp. Mar-09 250.00
c GTS Property Portfolios B-3, LLC Mar-09 250.00
c Gulfstream Aptartment Portfolio, LLC Mar-09 250.00
c Hereford Biofuels Holdings, LLC Jan-09 250.00
c Hill Country Galleria, LP May-09 250.00
c Holley Performance Products, Inc. Sep-09 250.00
c HSF Holding, Inc. May-09 250.00
c Indalex Holdings Finance, Inc. Mar-09 250.00
c J.G. Wentworth May-09 250.00
c J.L. French Automotive Castings, Inc. Jul-09 250.00
c KLCG Property, LLC Dec-09 250.00
c L.A. Hotel Venture, LLC Apr-09 250.00
c Lazy Days' RV Center, Inc. Nov-09 250.00
c Lewis Equipment Co., Inc. Sep-09 250.00
c Lifemasters Supported Self Care, Inc. Sep-09 250.00
c MIG, Inc. (Metromedia International Group,
Inc.)
Jun-09 250.00
c MMC Precision Holdings Corp. Mar-09 250.00
c Nexpak Corp. Apr-09 250.00
c Nextmedia Group, Inc. Dec-09 250.00
c November 2005 Land Investors, LLC May-09 250.00
c NV Broadcasting, LLC Jul-09 250.00
c Park Lane I, LLC Apr-09 250.00
c Philadelphia Newspapers, LLC Feb-09 250.00
c Phoenix Kingdom LI, LLC Jul-09 250.00

February 08, 2010 Altman High-Yield Bond Default and Return Report
59
Chapter 11 Filings in 2009 — Listed by Liability Size, Liabilities
Greater Than $100 Million (Dollars in Millions) (Continued)
Company
Date of
Filing Liabilities ($) c Protostar Ltd. Jul-09 250.00
c Provident Royalties, LLC Jun-09 250.00
c PTC Alliance Corp. Oct-09 250.00
c RadLAX Gateway Hotel, LLC Aug-09 250.00
c Recticel Interiors N.A., LLC Oct-09 250.00
c Recycled Paper Greetings Jan-09 250.00
c Regal Jets, LLC Feb-09 250.00
c Renew Energy, LLC Jan-09 250.00
c Ritz Camera Centers, Inc. Feb-09 250.00
c River Woods, LLC May-09 250.00
c Shane Co. Jan-09 250.00
c Taylor-Wharton International, LLC Nov-09 250.00
c Titlemax Holdings, LLC Apr-09 250.00
c Trilogy Development Co., LLC May-09 250.00
c United Subcontractors, Inc. Mar-09 250.00
c Valley View Downs, LP Oct-09 250.00
c White Energy, Inc. May-09 250.00
Latham International, Inc. Dec-09 239.49
Edge Petroleum Corp. Oct-09 234.00
California Coastal Communities, Inc. Oct-09 231.00
The Fairchild Corp. Mar-09 228.10
Monaco Coach Corp. Mar-09 208.82
Wilton Holdings, Inc. Jul-09 208.00
Norwood Promotional Products Holdings, Inc. May-09 205.00
Gottschalks, Inc. Jan-09 197.07
Cynergy Data, LLC Sep-09 186.18
Tierra Del Sol Resort, Inc. May-09 184.00
Oscient Pharmaceuticals Corp. Jul-09 183.28
Northeast Biofuels, LP Jan-09 174.00
Amtrust Financial Corp. Nov-09 169.50
Cabrini Medical Center Jul-09 167.00
TLC Vision Corp. Dec-09 166.85
Heartland Publications, LLC Dec-09 166.20
American Community Newspapers, LLC Apr-09 151.80
Bigler, LP Oct-09 151.00
Grede Foundries, Inc. Jun-09 148.24 Hallwood Energy, LP Mar-09 145.00 Baseline Oil & Gas Corp. Aug-09 138.91 The Penn Traffic Co. Nov-09 136.87 Aurora Oil & Gas Corp. Jul-09 134.39 Proliance International, Inc. Jul-09 133.50 Contech U.S., LLC Jan-09 131.66 St. Mary's Hospital, Passaic, NJ Mar-09 128.00
Velocity Express Corp. Sep-09 120.60
Jackson Green, LLC Jan-09 120.00
St. Lawrence Homes, Inc. Feb-09 116.38
Saratoga Resources, Inc. Mar-09 110.63
Nova Biosource Fuels, Inc. Mar-09 110.54
Meadowcraft, Inc. Mar-09 110.52 Anchor Blue Retail Group, Inc. May-09 107.61 CIB Marine Bancshares, Inc. Sep-09 107.21 Renaissant Lafayette, LLC Dec-09 106.00 Affiliated Foods Southwest, Inc. May-09 101.50 Jones Stephens Corp. Dec-09 101.00 Dixie Pellets, LLC Sep-09 100.00 Everest Holdings, LLC Aug-09 100.00 Total Liabilities 603,992
a Liabilities > $1 billion per petition.
b Liabilities between $500 million and $1
billion according to petition. Midpoint of range used as estimate.
c Liabilities of $100–500 million, according to petition. Midpoint of range used as
estimate.
Sources: NYU Salomon Center and New Generation Research.

February 08, 2010 Altman High-Yield Bond Default and Return Report
60
Appendix F
Defaults by Industry — 2009

February 08, 2010 Altman High-Yield Bond Default and Return Report
61
Company Industry
155 E. Tropicana, LLC Casino Hotels
Abitibi Bowater, Inc. Paper Mills
Accuride Corp. Motor Vehicle Parts & Accessories
Advanta Capital Trust 1 Personal Credit Institutions
Affinity Group, Inc. Amusement & Recreation Services
Ahern Rentals, Inc. Equipment Rental & Leasing, NEC
Aleris International, Inc. Secondary Smelting & Refining of Nonferrous Mtls
Allis-Chalmers Energy, Inc. Oil, Gas Field Services
American Achievement Group Holding
Corp.
Wholesale-Jewelry, Watches, Precious Stones &
Metals
Anthracite Capital, Inc. Real Estate Investment Trusts
Appleton Papers, Inc. Converted Paper & Paperboard Products
Arantes International, Ltd. Beef Cattle Feedlots
Atlantic Express Transportation Corp. Local & Suburban Transit & Interurban Hwy
Passenger Trains
Aventine Renewable Energy Holdings,
Inc.
Industrial Organic Chemicals
Barrington Broadcasting, LLC Television Broadcasting Stations
Beazer Homes USA, Inc. Operative Builders
Berry Plastics Corp. Plastic Products, NEC
Bonten Media Acquisition Co. Television Broadcasting Stations
Broder Brothers Co. Wholesale-Apparel, Goods & Notions
Buffalo Thunder Development Authority Hotels & Motels
Canwest Media, Inc. Television Broadcasting Stations
Capmark Financial Group, Inc. Finance Services
Caraustar Industries, Inc. Paperboard Mills
Charter Communications Holdings, LLC Cable & Other Pay Television Services
Chemtura Corp. Plastic Material, Synth Resin/Rubber, Cellulos (No
Glass)
Chrysler, LLC Motor Vehicles & Passenger Car Bodies
CIT Group, Inc. Finance Lessors
Citizens Republic Bancorp, Inc. National Commercial Banks
Clear Channel Communications, Inc. Radio Broadcasting Stations
CMP Susquehanna Corp. Radio Broadcasting Stations
Colonial BancGroup, Inc. State Commercial Banks
Commercial Vehicle Group, Inc. Motor Vehicle Parts & Accessories
Cooper-Standard Automotive, Inc. Motor Vehicle Parts & Accessories
Dayton Superior Corp. Steel Pipes & Tubes
Duane Reade, Inc. Drug Stores & Proprietary Stores
E Trade Fianancial Corp. Savings Institution, Federally Chartered
Energy Future Holdings Corp. Electric Services
Energy Partners Ltd. Crude Petroleum & Natural Gas
Energy XXI Gulf Coast, Inc. Crude Petroleum & Natural Gas
Eurofresh, Inc. Agricultural Operations
Extended Stay America, Inc. Hotels & Motels
Fairpoint Communications, Inc. Telephone Communications (No Radiophone)
Finlay Fine Jewelry Corp. Jewelry Stores
Fleetwood Enterprises, Inc. Motor Homes
Fontainebleau Las Vegas Holdings, LLC Hotels & Motels
Ford Motor Co. Motor Vehicles & Passenger Car Bodies
Freescale Semincinductor, Inc. Semiconductors & Related Devices
French Lick Resorts & Casino, LLC Casino Hotels
General Motors Corp. Motor Vehicles & Passenger Car Bodies
Defaults by Industry — 2009 (Continued)
Company Industry
Greentown China Holdings, Ltd. Land Subdividers and Developers, Except
Cemetaries

February 08, 2010 Altman High-Yield Bond Default and Return Report
62
GSI Group, Inc. Miscellaneous Electrical Machinery, Equipment &
Supplies
Haights Cross Communications, Inc. Miscellaneous Publishing
Harrah's Operating Co., Inc. Miscellaneous Amusements & Recreation
Hawaii Superferry, Inc. Ferries
Hawker Beechcraft Acquisition Co., LLC Aircraft & Parts
Hexion U.S. Finance Corp./Hexion
Specialty Chemicals, Inc.
Plastics, Materials, Synth Resins & Nonvulcan
Elastomers
Hollinger Publishing International, Inc. Newspapers: Publishing or Publishing & Printing
Hovnanian Enterprises, Inc. Operative Builders
Idearc, Inc. Miscellaneous Publishing
Indalex Holding Corp. Rolling, Drawing & Extruding of Non-ferrous
Materials
Independencia International S.A. Meat Products
Inn of the Mountain Gods Resort & Casino Miscellaneous Amusements & Recreation
Intelsat Ltd. Communication Services, NEC
Interactive Health, LLC Household Furniture
Ion Media Networks, Inc. Television Broadcasting Stations
Kraton Polymers, LLC Plastics, Materials, Synth Resins & Nonvulcan
Elastomers
Lear Corp. Motor Vehicle Parts & Accessories
Libbey Glass, Inc. Glass, Glassware, Pressed or Blown
Little Traverse Bay Bands Odawa Indians Casino Hotels
Lyondell Chemical Co. Industrial Organic Chemicals
Majestic Holdco, LLC Casino Hotels
Masonite Corp. Lumber & Wood Products (No Furniture)
McClatchy Co. Newspapers: Publishing or Publishing & Printing
Medianews Group, Inc Newspapers: Publishing or Publishing & Printing
Merisant Co. Industrial Organic Chemicals
Metaldyne Corp. Motor Vehicle Parts & Accessories
Milacron Escrow Corp. Special Industry Machinery, NEC
Momentive Performance Materials, Inc. Industrial Organic Chemicals
Muzak, LLC Services - Business Services, NEC
MxEnergy Holdings, Inc.a Natural Gas Distribution
New Asat Finance Ltd. Semiconductors & Related Devices
Newpage Corp. Paper Mills
Nortek, Inc. Electric Housewares & Fans
Nortel Networks Ltd. Telephone & Telegraph Apparatus
Novamerican Steel, Inc. Steel Works, Blastfurnaces & Rolling & Finishing
Mills
NXP B.V. Semiconductors & Related Devices
OSI Restaurant Partners, LLC Retail - Eating Places
Panolam Industries International, Inc. Miscellaneous Furniture & Fixtures
Pliant Corp. Plastics, Foil & Coated Paper Bags
Primus Telecommunication Group, Inc. Telephone Communications (No Radiophone)
R.H. Donnelley Corp. Miscellaneous Publishing
Rathgibson, Inc. Steel Pipes & Tubes
Readers Digest Association, Inc. Books: Publishing or Publishing & Printing
Realogy Corp. Real Estate Agents & Managers (For Others)
Rouse Co. Operators of Non-Residential Buildings
Sabre Holdings Corp. Transportation Services
Samsonite Corp. Leather & Leather Products
Sensata Technologies B.V. Industrial Instruments for Measurment, Display &
Control
Simmons Co. Wood Household Furniture (No Upholstered)

February 08, 2010 Altman High-Yield Bond Default and Return Report
63
Defaults by Industry — 2009 (Continued)
Company Industry
Six Flags, Inc. Miscellaneous Amusements & Recreation
Smurfit-Stone Container Corp. Paperboard Mills
Source Interlink Companies, Inc. Direct Mail & Advertising Services
Spansion, LLC Semiconductors & Related Devices
Spectrum Brands, Inc. Miscellaneous Electrical Machinery,
Equipment & Supplies
Stallion Oilfield Services, Inc. Oil, Gas Field Services
Stanley-Martin Communities, LLC Operative Builders
Station Casinos, Inc. Casino Hotels
Thornburg Mortgage, Inc. Real Estate Investment Trusts
True Temper Sports, Inc. Sporting & Athletic Goods, NEC
U.S. Shipping Partners, LP Water Transportation
Unisys Corp. Computer Integrated Systems Design
USF Corp. (YRC Worldwide, Inc.) Trucking (No Local)
Velocity Express Corp. Air Courier Services
Virgin River Casino Corp. Real Estate Operators
Visteon Corp. Motor Vehicle Parts & Accessories
Vitro SAB de CV Glass Containers
William Lyon Homes, Inc. Operative Builders
Young Broadcasting, Inc. Television Broadcasting Stations
Source: NYU Salomon Center.

February 08, 2010 Altman High-Yield Bond Default and Return Report
64
Appendix G
2009 Emergences From Default (Dollars in Millions)
Restructured Bonds ($)
First Quarter
Delta Financial Corp. 150
Key Plastics, LLC 115
Kimball Hill, Inc. 203
Sea Containers, Ltd. 272
Total First Quarter $740
Second Quarter
Buffets Holdings, Inc. 300
Constar International, Inc. 395
Hines Horticulture, Inc. 175
Masonite Corp. 770
Motor Coach Industries Int’l, Inc. 152
Source Interlink Companies, Inc. 465
Total Second Quarter $2,257
Third Quarter
Bally Total Fitness Holding Corp. 479
Caraustar Industries, Inc. 219
Energy Partners Ltd. 450
Primus Telecommunications Group, Inc. 366
Propex, Inc. 150
Quebecor World (USA), Inc. 1,453
Spectrum Brands, Inc. 1,033
Tropicana Entertainment, LLC 960
WCI Communities, Inc. 525
Total Third Quarter $5,634
Fourth Quarter 250
ASARCO, LLC 12,811
Charter Communications, Inc. 22,531
CIT Group, Inc. 155
Dayton Superior Corp. 214
Eurofresh, Inc. 1,200
Hayes Lemmerz International, Inc. 2,850
Idearc, Inc. 848
ION Media Networks, Inc. 123
Lazy Days' RV Center, Inc. 1,288
Lear Corp. 750
MagnaChip Semiconductor, LLC 1,788
NTK Holdings, Inc. (Nortek, Inc.) 151
Panolam Industries International, Inc. 650
Pilgrim's Pride Corp. 650
Pliant Corp. 600
SemGroup, LP 2
Silicon Graphics, Inc. 125
True Temper Sports, Inc. 100
US Shipping Partners, LP 250
Total Fourth Quarter $47,086
Total $55,718
Sources: New Generation Research and NYU Salomon Center Defaulted Bonds Database.

FI02J001