Embed Size (px)
Citation preview
f ~ ~ ~./ t ,
It
~~------ -~- -
OFFICE OF
.JUSTICE SYSTEMS ANALVSIS
THE INCARCERATION OF MINORITY DEFENDANTS: AN IDENTIFICATION OF DISPARITY IN NEW YORK STATE,
1985·1986
JULY,'1991
NEW YORK STATF ........ " .......... .......... ......... . -_ .... ' .~ pr
DIVISION OF CRIMINAL JUSTICE SERVICES
If you have issues viewing or accessing this file, please contact us at NCJRS.gov.

U.S. Department of Justice National Institute of Justice
132569
This document has been reproduced exactly as received from the person or organization originating it. Points of view or opinions stated in this document are those of the authors and do not necessarily represent the official position or policies of the National Institute of Justice.
Permission to reproduce this copyrighted material in microfiche only has been granted by
New York State Djvision of Criminal Justice Services
to the National Criminal Justice Reference Service (NCJRS).
Further reproduction outside of the NCJRS system requires permission of the copyright owner.
Copyright (c) July, 1991 by the New York State Division of Criminal Justice Services. All rights resenveEb worldwide. This publication may be reproduced without the express written permission of the NeaYor~State: Division of Criminal Justice Services provided that this copyright notice appears on all copies or· se~ of the publication.
..
Acknowledgments
Seth Jacobs developed the original proposal for this research. I would like to thank Bruce Frederick, Steven Greenstein, David van Alstyne, Vince Manti, Henry Brownstein, Donna Hall, William Wilbanks, Sherwood Zimmerman, Carl Pope, James Gilmer, and Richard Dehais for helpful comments and critical reviews.
New York State Division of Criminal Justice Services
Richard H. Girgenti Director of Criminal Justice
Office of Justice Systems Analysis Barry C. Sample
Executive Deputy Commissioner
The Incarceration of Minority Defendants: An Identification of Disparity in New York State,
1985-1986
Bureau of Research and Evaluation Bruce Frederick
Chief
July, 1991
Prepared by: James F. Nelson, Ph.D.
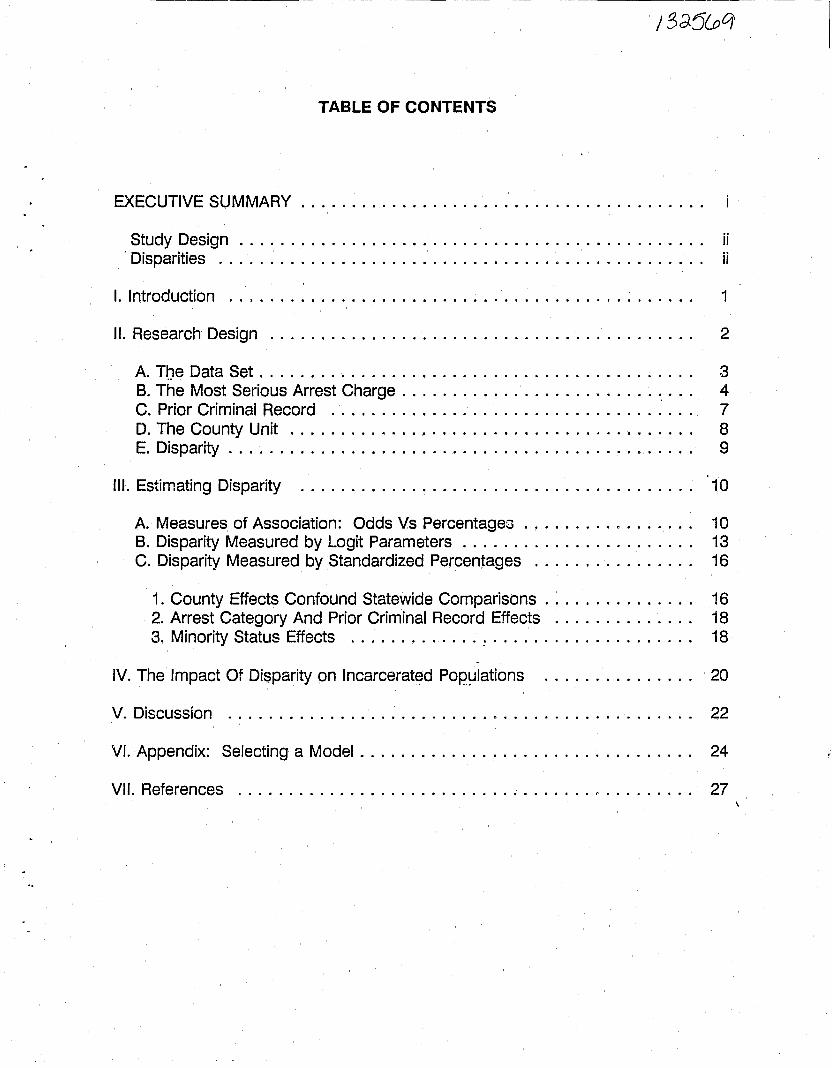
TABLE OF CONTENTS
EXECUTIVE SUMMARY ....................................... .
Study Design .............................................. ii . Disparities ................................................ ii
I. Introduction .............................................. 1
II. Research Design .......................................... 2
A. Toe Data Set . . . . . . . . . . . . . . . . . . . . . . . . . . . . . . . . . . . . . . . . . .. 3 B. The Most Serious Arrest Charge . . . . . . . . . . . . . . . . . . . . . . . . . . . .. 4 C. Prior Criminal Record ................................:... 7 D. The County Unit ............. , ............ 0 •••• 0 0 • • • • • •• 8 Eo Disparity 0 0 • • • • • • • • • • • • • • • • • • • • • • • • • • • 0 • • • • • • • • • • • 0 • • • • 9
III. Estimating Disparity ........ 0 ••• ~ •• 0 •••••• 0 •••••••••••••• o. 10
A. Measures of Association: Odds Vs Percentages 0 ••• 0 • • • • • • • • • • •• 10 B. Disparity Measured by Logit Parameters . . . . . . . . . . . . . . . . . . . . . .. 13 C. Disparity Measured by Standardized Percentages 0 •••••••••••• ".. 16
1. County Effects Confound Statewide Comparisons . . . . . . . . 0 • • • • •• 16 2. Arrest Category And Prior Criminal Record Effects . 0 • • • • • • • • • • •• 18 3. Minority Status Effects ............. :.................... 18
. IV. The Impact Of Disparity on Incarcerated Pop~lations ............... 20
V. Discussion .............................................. 22
VI. Appendix: Selecting a Model . . . . . . . . . . . . . . . . . . . . . . . . . . . . . . . .. 24
VII. References .................................... ,......... 27
-----------------------
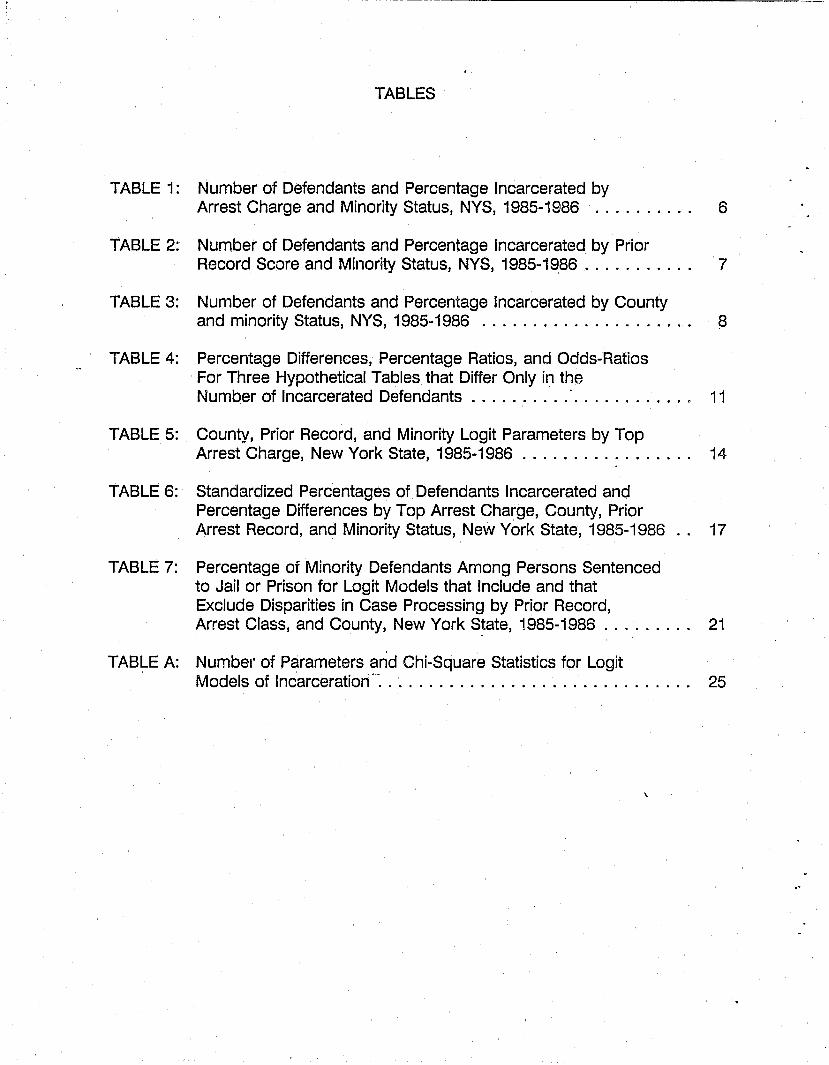
TABLES
TABLE 1: Number of Defendants and Percentage Incarcerated by Arrest Charge and Minority Status, NYS, 1985-1986 .......... 6
TABLE 2: Number of Defendants and Percentage Incarcerated by Prior Record Score and Minority Status, NYS, 1985-1986 . . . . . . . . . .. 7
TABLE 3: Number of Defendants and Percentage Incarcerated by County and minority Status, NYS, 1985-1986 ..................... 8
TABLE 4: Percentage Differences, Percentage Ratios, and Odds-Ratios For Three Hypothetical Tables that Differ Only in the Number of Incarcerated Defendants . . . . . . . . . ... . . . . . . . . . .. 11
TABLE 5: County, Prior Record, and Minority Logit Parameters by Top Arrest Charge, New York State, 1985-1986 . . . . . . . . . . . . . . . .. 14
TABLE 6: Standardized Percentages of Defendants Incarcerated and Percentage Differences by Top Arrest Charge, County, Prior Arrest Record, and Minority Status, New York State, 1985-1986 .. 17
TABLE 7: Percentage of Minority Defendants Among Persons Sentenced to Jail or Prison for Logit Models that Include and that Exclude Disparities in Case Processing by Prior Record, Arrest Class, and County, New York S~ate, 1985-1986 . . . . . . . .. 21
TABLE A: Number of Parameters and Chi-Square Statistics for Logit Models of Incarceratiori-'. . . . . . . . . . . . . . . . . . . . . . . . . . . . . .. 25
T'
I, •
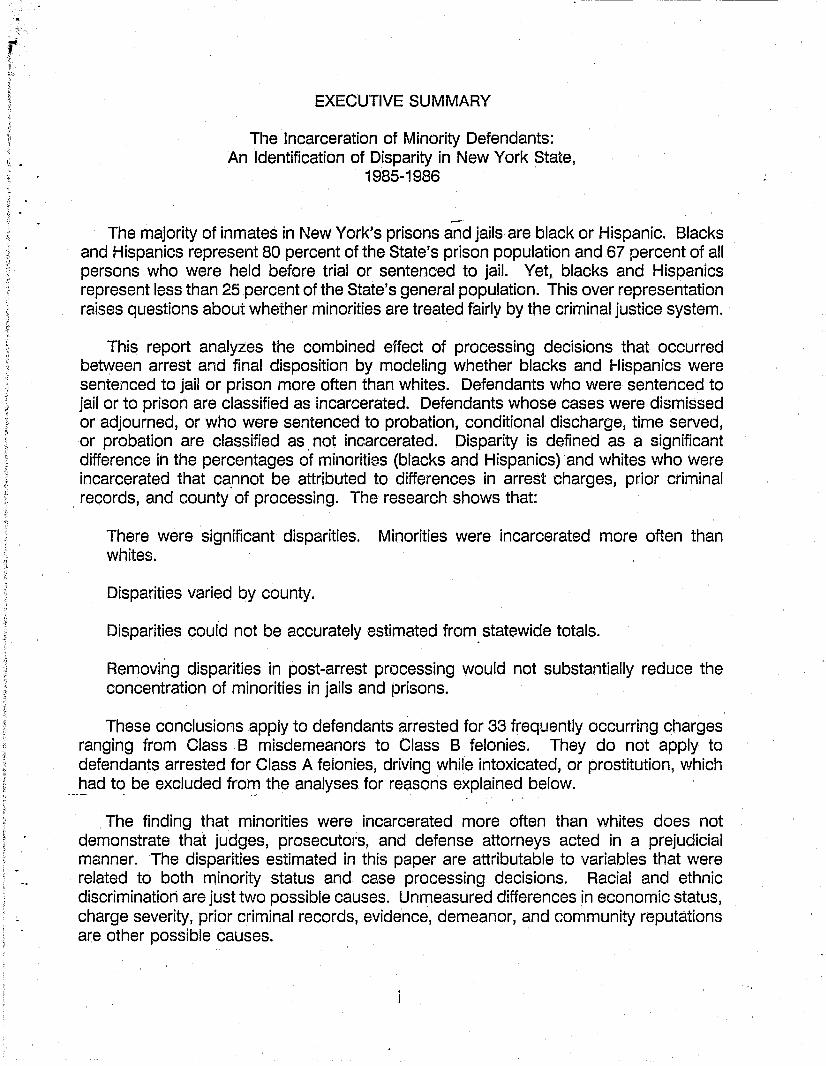
EXECUTIVE SUMMARY
The Incarceration of Minority Defendants: An Identification of Disparity in New York State,
1985-1986
The majority of inmates in New York's prisons and jails are black or Hispanic. Blacks and Hispanics represent 80 percent of the State's prison population and 67 percent of all persons who were held before trial or sentenced to jail. Yet, blacks and Hispanics represent less than 25 percent of the State's general population. This over representation raises questions about whether minorities are treated fairly by the criminal justice system.
This report analyzes the combined effect of processing decisions that occurred between arrest and final disposition by modeling whether blacks and Hispanics were sentenced to jail or prison more often than whites. Defendants who were sentenced to jail or to prison are classified as incarcerated. Defendants whose cases were dismissed or adjourned, or who were sentenced to probation, conditional discharge, time served, or probation are classified as not incarcerated. Disparity is defined as a significant difference in the percentages of minorities (blacks and Hispanics) and whites who were incarcerated that ca.nnot be attributed to differences in arrest charges, prior criminal records, and county of processing. The research shows that:
There were significant disparities. Minorities were incarcerated more often than whites.
Disparities varied by county.
Disparities could not be accurately estimated from statewide totals.
Removing disparities in post-arrest processing would not substantially reduce the concentration of minorities in jails and prisons.
These conclusions apply to defendants arrested for 33 frequently occurring charges ranging from Class B misdemeanors to Class B felonies. They do not apply to defendants arrested for Class A feionies, driving while intoxicated, or prostitution, which
___ ~ad to be excluded from the analyses for reasons explained below. - .
The finding that minorities were incarcerated more often than whites does not demonstrate that judges, prosecutors~ and defense attorneys acted in a prejudicial manner. The disparities estimated in this paper are attributable to variables that were related to both minority status and case processing decisions. Racial and ethnic discrimination are just two possible causes. Unmeasured differences in economic status, charge severity, prior criminal records, evidence, demeanor, and community reputations are other possible causes.

------------ -------------
The arguments and evidence supporting the conclusions of this report are outlined below.
Study Design
The study analyzes incarceration fo.llowing arrest. It is based upon the population of persons who were arrested between January 1, 1985 and December 31, 1986. It is limited to defendants whose cases were disposed by July of 1987. Only the first arrest in this period was analyzed for defendants who were arrested more than once.
Defendants whose racial status was recorded as black or Hispanic were categorized as minority defendants. All other defendants were categorized as white. There were not enough Hispanics arrested outside of New York City to estimate disparities for blacks and Hispanics separately.
Disparities were estimated in the ten most populous counties and in the 52 least populous counties treated as a single unit. There were not enough minorities arrested in these 52 counties to estimate disparities by county.
Disp?lrities were estimated separately for defendants with and without prior arrest records. Differences in the extent and seriousness of prior criminal records were measured by Nelson's (1989) criminal record score variable. This variable summarized arrests and convictions that occurred in the ten year period preceding the instant offense.
The study is limited to persons who were arrested for charges that occurred to both white and minority defendants throughout the state. The most serious arrest charge was coded into 33 frequently occurring charges. The charges ranged in seriousness from Class B felony to Class B misdemeanor charges.
There were not enough comparably situated whites and minorities to be compared within and across counties for class A felony charges, class E felony DWI charges, unclassified misdemeanor DWI charges, or class B misdemeanor prostitution charges. Class A felonies occurred too infrequently to be analyzed. DWI and prostitution charges occurred frequently enough to be analyzed in some counties, but the distributions of these offenses were highly imbalanced. Most of the defendants charged with prostitution were females arrested in New York City. DWI arrests almost exclusively involved whites in counties outside of New York City. In- addition, the prior record score developed for this study was not valid for modeling incarceration for DWI charges (see Nelson, 1989). Including the aforementioned charges in the analyses could have seriously distorted the statistical models used to measure disparity, and could have produced artifactual conclusions that may not have been valid for any crime type.
ii
----------
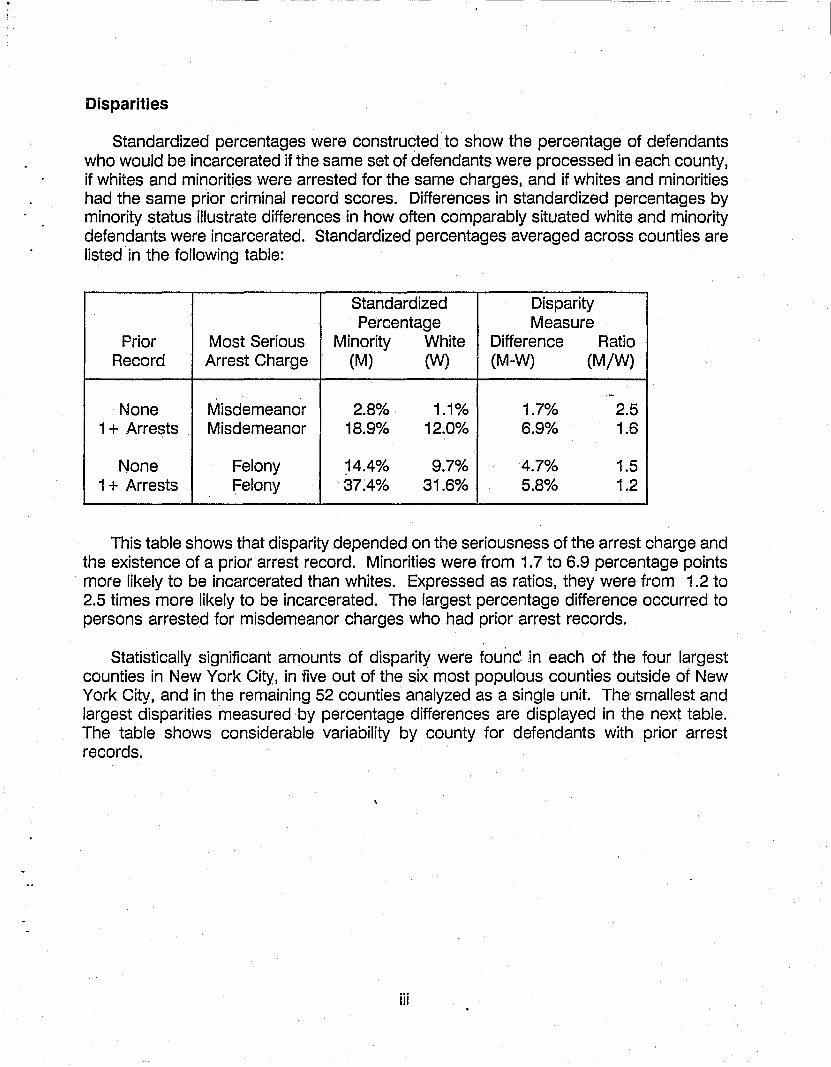
Disparities
Standardized percentages were constructed to show the percentage of defendants who would be incarcerated if the same set of defendants were processed in each county, if whites and minorities were arrested for the same charges, and if whites and minorities had the same prior criminal record scores. Differences in standardized percentages by minority status illustrate differences in how often comparably situated white and minority defendants were incarcerated. Standardized percentages averaged across counties are listed in the following table:
Standardized Disparity Percentage Measure
Prior Most Serious Minority White Difference Ratio Record Arrest Charge (M) (W) (M-W) (M/W)
,-None Misdemeanor 2.8% 1.1% 1.7% 2.5
1 + Arrests Misdemeanor 18.9% 12.0% 6.9% 1.6
None Felony } 4.4% 9.7% 4.7% 1.5 1 + Arrests Felony 37.4% 31.6% 5.8% 1.2
This table shows that disparity depended on the seriousness of the arrest charge and the existence of a prior arrest record. Minorities were from 1.7 to 6.9 percentage points more likely to be incarcerated than whites. Expressed as ratios, they were from 1.2 to 2.5 times more likely to be incarcerated. The largest percentage difference occurred to persons arrested for misdemeanor charges who had prior arrest records.
Statistically significant amounts of disparity were foune', .in each of the four largest counties in New York City, in five out of the six most populous counties outside of New York City, and in the remaining 52 counties analyzed as a single unit. The smallest and largest disparities measured by percentage differences are displayed in the next table. The table shows considerable variability by county for defendants with prior arrest records.
iii
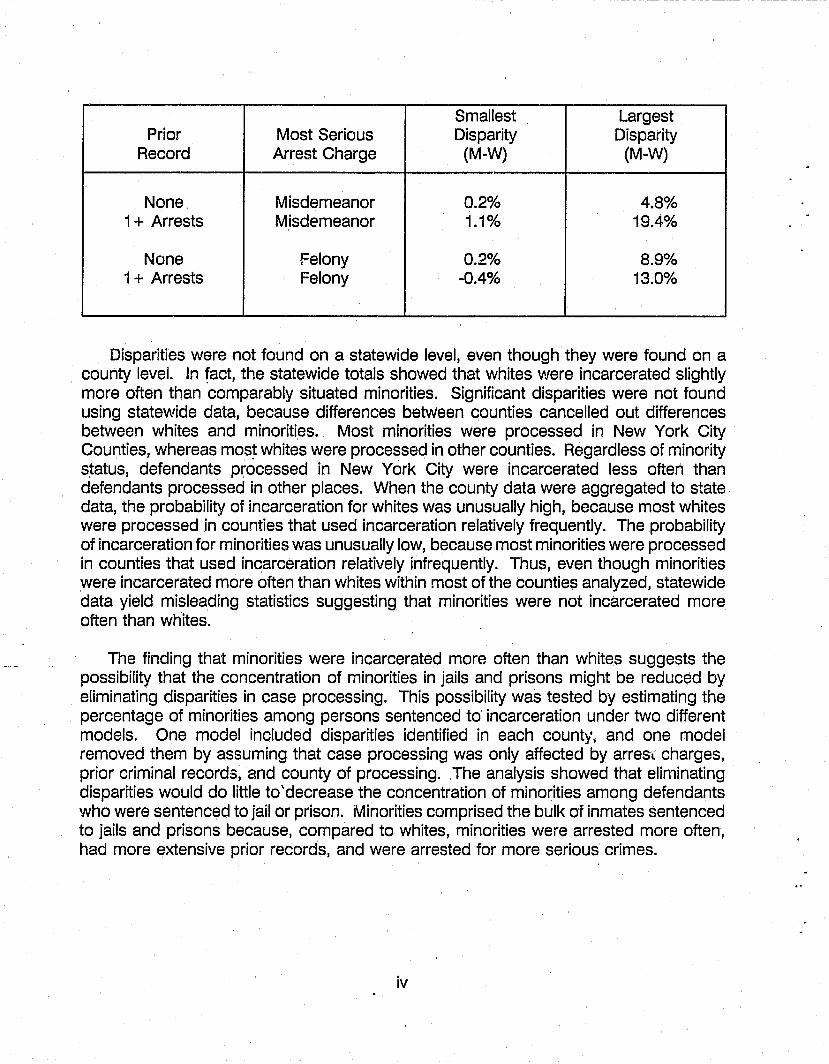
Smallest Largest Prior Most Serious Disparity Disparity
Record Arrest Charge (M-W) (M-W)
None Misdemeanor 0.2% 4.8% 1 + Arrests Misdemeanor 1.1% 19.4%
None Felony 0.2% 8.9% 1 + Arrests Felony -0.4% 13.0%
Disparities were not found on a statewide level, even though they were found on a county level. In fact, the statewide totals showed that whites were incarcerated slightly more often than comparably situated minorities, Significant disparities were not found using statewide data, because differences between counties cancelled out differences between whites and minorities. Most minorities were processed in New York City Counties, whereas mos~ whites were processed in other counties. Regardless of minority status, defendants processed in New York City were incarcerated less often than defendants processed in other places. When the county data were aggregated to state data, the probability of incarceration for whites was unusually high, because most whites were processed in counties that used incarceration relatively frequently. The probability of incarceration for minorities was unusually low, because most minorities were processed in counties that used incarceration relatively infrequently. Thus, even though minorities were incarcerated more often than whites within most of the counties analyzed, statewide data yield misleading statistics suggesting that minorities were not incarcerated more often than whites.
The finding that minorities were incarcerated more often than whites suggests the possibility that the concentration of minorities in jails and prisons might be reduced by eliminating disparities in case processing. This possibility was tested by estimating the percentage of minorities among persons sentenced to incarceration under two different models. One model included disparities identified in each coun~\ and one model removed them by assuming that case processing was only affected by arres'~ charges, prior criminal records, and county of processing. The analysis showed that eliminating disparities would do little to'decrease the concentration of minorities among defendants who were sentenced to jail or prison. Minorities comprised the bulk of inmates sentenced to jails and prisons because, compared to whites, minorities were arrested more often, had more extensive prior records, and were arrested for more serious crimes.
iv

THE INCARCERATION OF MINORITY DEFENDANTS: AN IDENTIFICATION OF DISPARITY IN NEW YORK STATE,
1985-1986
I. Introduction
In 1988, four out of every five inmates in New York State prisons were black or Hispanic. Yet only one out of every four persons in the state was black or Hispanic. This concentration of minorities in prisons has been cited as evidence of racism in New York State (Grossman, 1987; Murphy, 1989; Schulman and Gryta, 1988). Similar concentrations of minorities in prisons across the United States have been cited as evidence of racism in American culture (Christianson, 1981).
The finding that the majority of prisoners are minorities does not, by itself, demonstrate that the criminal justice system is racist. Differences in incarceration rates are due to differences in offending rates, arrest practices, case processing decisions, and parole release decisions. Differences in incarceration rates can be attributed to biases in the criminal justice system to the extent that arrest practices, case processing decisions, and parole decisions unfairly affect how minorities are treated. Differences in offending rates are not usually attributed to decisions made by the criminal justice system.
Most of the research in the 1980's that estimated disparities in post-arrest case processing concluded that there were no disparities, that disparities were relatively small, or that disparities in some decisions were balanced by opposite disparities in other decisions. Blumstein (1982), Hagan and Peterson (1984), Klein et al (1990), Kleck (1981), Myers and Talarico (1987), Petersilia (1983), Pommershein and Wise (1989), Spohn et al (1982), and Wilbanks (1986) found few disparities in case processing. In contrast, Crutchfield and Bridges (1985) found disparities in Washington State. Zimmerman and Frederick (1983) found disparities in some geographical areas of New York State. Albonetti et al (1989) found that socioeconomic status affected bail decisions differently for whites than it did for blacks in federal cases.
The present study analyzes disparities in post-arrest case processing. It asks whether the concentration of blacks and Hispanics in New York State's prisons and jails can be partially accounted for by disparities in how often similarly situated minorities and whites were incarcerated following arrest. Statistical models are used to control for differences in arrest charges, prior criminal records and county of processing. The analysis demonstrates that minorities were incarcerated more often than similarly situated whites in almost all counties studied. However, it also suggests that removing disparities in post-arrest processing would not substantially reduce the concentration of minorities in jails and prisons.
1
II. Research D(Jsign.
This study models incarceration following arrest. It combines all case processing decisions that occurred between arrest and final disposition into an incarceration outcome variable. Defendants who were sentenced to jail or to prison are classified as incarcerated. Defendants whose cases were dismissed or adjourned, or who were sentenced to probation, conditional discharge, time served, or probation are classified as not incarcerated.
This study is not a sentencing study. Sentencing studies begin at conviction. In contrast, the present study begins at arrest. Disparities in incarceration outcomes reflect disparities in sentencing decisions as well as disparities in decisions that occurred between arrest and final disposition. A finding of no disparities in incarceration outcomes does not necessarily mean that minorities and whites were treated in the same manner at all processing stages. For example, minorities could have the same chances of being incarcerated as whites if they were less likely to be convicted, but were more likely to be incarcerated following conviction.
Disparity was measured as a residual variable. It represents all differences in how often white and minority defendants were sentenced to jail or prison that could not be explained by differences in arrest charges, prior criminal records, and county of processing.
The disparities estimated in this paper should not be equated with discriminatory actions based upon racial and ethnic prejudices. The disparities are attributable to variables that were related to both minority status and case processing decisions. Racial and ethnic discrimination are just two possible causes. Unmeasured differences in economic status, charge severity, prior criminal records, evidence, demeanor, and community reputations are other possible causes. .
The problem of equating disparities with prejudices was addressed by Gibson (1978). He demonstrated that prejudicial attitudes were not correlated with disparities in sentencing decisions made by eleven judges. Instead, disparities were correlated to differences in how these judges viewed the importance of criminal records in making sentencing decisions. Judges who sentenced blacks more harshly than whites put more importance on prior criminal records than judges who did not sentence blacks more harshly than whites. Gibson's study shows that disparities are not necessarily due to prejudices. The only way to attribute dir3parities to prejudices is to measure prejudices directly and show that they are independently related to disparities.
2

The inability to identify the causes of disparity is not a problem for the purposes of this study. This study was designed to determine whether minorities were incarcerated more often than whites once differences in arrest charges, prior criminal records, and county of processing were taken into account. Regardless of cause, significant amounts of disparity suggest that there may be a problem with how minorities are processed by the criminal justice system; such findings would warrant additional research to investigate sources of disparity.
Disparity was estimated within counties to ensure that differences among counties in how often defendants were incarcerated were not confounded with differences in how often whites and minorities within the same county were incarcerated. The study does not explain why incarceration was used more often in some counites than in others.
A. The Data Set .-
Arrest and case processing data were obtained from the Computerized .. Criminal History/Offender-Based Transaction Statistics (CCH/OBTS) data system maintained by the New York State Division of Criminal Justice Services. This system recorded arrest information and defendant characteristics for all arrests of persons charged with fingerprintable offenses. The arrest information contained a description of each arrest offense and a summary of how each case was disposed. Fingerprints were used to identify the same defendant over time.
The study is based upon the population of defendants who were arrested between "January 1, 1985 and December 31, 1986. It is limited to defendants whose cases were disposed by July of 1987. For defendants with more than one arrest during this period, the study is limited to the first arrest. Prior criminal histories reflect the defendant's criminal record at the time of instant offense.1
Limiting the analysis to one arrest per defendant removed inconsistencies in the data system. In most jurisdictions, multiple charges were recorded as one arrest. In some jurisdictions, multiple charges were sometimes recordad as separate arrests. Limiting the analysis to one arrest per defendant ensured that multiple charges were treated as one arrest in all jurisdictions.
1 The data f;Le used for this research was produced in July of 1987. This means that the arrests in the sampLe had from 6 to 30 months to be disposed.
Most cases that had finaL dispositions entered in the Computerized CriminaL History System did so within 18 months of the arrest. FinaL dispositions were not recorded for about 20 percent of the arrests between 1978 and 1986.
3
B. The Most Serious Arrest Charge
Arrest charge, prior criminal record, and extent of evidence are frequently cited as the most important legal or legitimate influences affecting case processing. These influences are called legitimate because they have a basis in law and because persons believe they should affect case processing (Hagan and Bumiller, 1983). In contrast, race is called an extra-legal or illegitimate influence because thera is no basis in law for treating minorities differently than whites, and because most persons believe race should not affect case processing.2
The most serious arrest charge was selected to measure both the type of crime and its seriousness. Thirty-three arrest charges were analyzed. They ranged from Class B misdemeanor charges to Class B felony charges. There were too few Class A felony charges to perform the multivariate analyses used in this report.
PersoQs whose most serious arrest charges were driving while intoxicated or prostitution were excluded from analysis because these arrests primarily occurred in certain counties or because they primarily occurred to whites. The decision to exclude these crimes was based upon a preliminary examination of all arrests in 1985 and 1986 that had final dispOSitions recorded in the CCH/OBTS data system by July of 1987. Preliminary examination of these data are summarized below. For some charges, the preliminary data differed substantially from the data analyzed in this report because the preliminary data were based upon all arrests whereas the analyzed data were based upon the first arrest in this period. To simplify discussion, Bronx, Kings, New York, and Queens counties are referred to as New York City Counties, and the remaining 58 counties are referred to as upstate counties.
Felony OWl charges were excluded from analysis because almost all of them occurred in upstate counties. Only 48 arrests in New York City counties were for felony OWl charges. In contrast, 4,375 arrests in upstate counties ~ere for felony OWl charges.
Misdemeanor OWl charges were excluded from analysis because they seldom occurred to minorities. In New York City Counties, only 2 percent of the minorities and 3 percent of the whites who were arrested for misdemeanor crimes were charged with OWl crimes. In contrast, 2 percent of the minorities and 32 percent of the w~ites who were arrested for misdemeanor crimes were charged with OWl crimes. It is impossible to analyze disparities for crimes that seldom cross racial and ethnic lines. OWl arrests almost exclusively occurred to whites in upstate counties.
2 Hagan and Bumiller argue that labeling variables as either legal or extra-legal influences is confusing because legal distinctions are ambiguous and even contradictory. For example, community ties are considered legally relevant variables for bail decisions but not for sentencing decisions.
Hagan and Bumiller replace the distinction between legal and extra-legal influences with the distinction between legitimate and illegitimate influences. Legitimate influences are those factors that persons believe should affect case processing, and illegitimate influences are those factors that persons believe should not affect case processing.
4
An additional. problem with OWl charges is that the prior record score developed for this research (Nelson, 1989) is not valid for OWl arrests. The problem with OWl offenses is that prior criminal records should include arrests and convictions for driving offenses in the analysis of OWl charges, but not necessarily in the analysis of penal law offenses .. Furthermore, it is unclear whether arrests and convictions for penal law crimes should be included in the prior record variable for analyzing OWl processing. The prior record score used in this research is based upon arrests and convictions for penal law crimes.
Arrests based upon misdemeanor prostitution charges were excluded from analysis because almost a" of them occurred in New York City Counties. Fewer than 1 percent of the whites and minorities who were arrested for misdemeanor crimes were charged with prostitution crimes in upstate counties. In contrast, 15 percent of the misdemeanor arrests for minorities and 33 percent for whites were for prostitution in New York City counties. It is impossible to compare disparities across counties to the extent that crimes are only found in particular counties.
Arrests for Class A felony crimes were also excluded from analysis. Only 1 percent of all arrests in New York State were for Class A felony crimes. There weren't enough whites and minorities arrested for these crimes to estimate disparities in case processing.
The percentage of defendants who were incarcerated for each arrest charge by minority status are presented in Table 1. Black and Hispanic defendants are categorized as minority defendants. A" other defendants are categorized as white defendants. Seventy-nine percent of defendants (341,743 out of 430,998) were charged with one of the thirty-three arrest charges presented in this table. The data in this and subsequent tables are based upon the first arrest that occurred in 1985-1986.
The last column in Table 1 displays differences in incarceration percentages for minorities and whites. It shows that minorities were incarcerated more often than whites for 14 out of 21 felony charges and for 11 out of 13 misdemeanor charges. Overall, the differences were larger for felony than for misdemeanor charges.
Table 1 also shows that incarceration percentages varied by crime type within class. incarceration percentages for whites ranged from 18 to 41 percent for B felonies, from 12 to 25 percent for C felonies, from 8 to 23 percent for 0 felonies, and from 1 to 16 percent for E felonies. For minorities, they ranged from 21 to 38 percent for B felonies, from 16 to 30 percent for C felonies, from 8 to 31 percent for 0 felonies, and from 1 to 21 percent for E felonies. These within-class variations suggest that the seriousness of arrest charge is not adequately measured by the class of the charge.
. 5
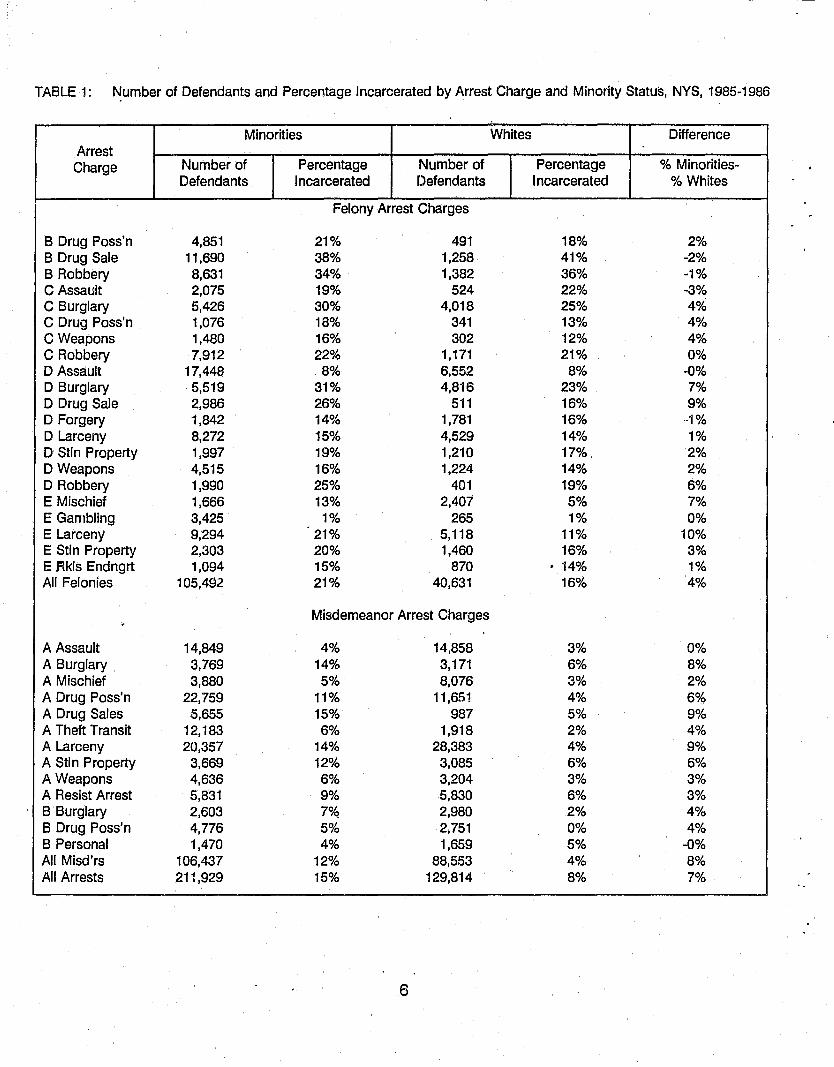
TABLE 1: ~umber of Defendants and Percentage Incarcerated by Arrest Charge and Minority Status, NYS, 1985-1986
Minorities Whites Difference Arrest
Charge Number of Percentage Number of Percentage % Minorities-Defendants Incarcerated Defendants Incarcerated % Whites
Felony Arrest Charges
B Drug Poss'n 4,851 21% 491 18% 2% B Drug Sale 11,690 38% 1,258 41% -2% B Robbery 8,631 34% 1,382 36% -1% C Assault 2,075 19% 524 22% -3% C Burglary 5,426 30% 4,018 25% 4% C Drug Poss'n 1,076 18% 341 13% 4% C Weapons 1,480 16% 302 12% 4% C Robbery 7,912 22% 1,171 21% 0% D Assault 17,448- 8% 6,552 8% -0% D Burglary 5,519 31% 4,816 23% 7% D Drug Sale 2,986 26% 511 16% 9% D Forgery 1,842 14% 1,781 16% -1% D Larceny 8,272 15% 4,529 14% 1% D Stln Property 1,997 19% 1,210 17% 2% D Weapons 4,515 16% 1,224 14% 2% D Robbery 1,990 25% 401 19% 6% E Mischief 1,666 13% 2,407 5% 7% E Gambling 3,425 1% 265 1% 0% E Larceny 9,294 21% 5,118 11% 10% E Stln Property 2,303 20% 1,460 16% 3% E ~kls Endngrt 1,094 15% 870 • 14% 1% All Felonies 105,492 21% 40,631 16% 4%
Misdemeanor Arrest Charges . A Assault 14,849 4% 14,858 3% 0% A Burglary 3,769 14% 3,171 6% 8% A Mischief 3,880 5% 8,076 3% 2% A Drug Poss'n 22,759 11% 11,651 4% 6% A Drug Sales 0,655 15% 987 5% 9% A Theft Transit 12,183 6% 1,918 2% 4% A Larceny 20,357 14% 28,383 4% 9% A Stln Property 3,669 12% 3,085 6% 6% A Weapons 4,636 6% 3,204 3% 3% A Resist Arrest 5,831 9% 5,830 6% 3% B Burglary 2,603 7% 2,980 2% 4% B Drug Poss'n 4,776 5% 2,751 0% 4% B Personal 1,470 4% 1,659 5% -0% All Misd'rs 106,437 12% 88,553 4% 8% All Arrests 211,929 15% 129,814 8% 7%
6

C. Prior Criminal Record
The arrests and convictions that occurred in the ten year period preceding the instant offense were combined into a criminal history score.3 The score ranged from zero (no prior arrests) to ten (two or more prior felony convictions). The criminal history score measure was developed by Nelson ("1989).
Criminal records are frequently based solely upon convictions. Arrests were included in the criminal record score because they influence incarceration decisions, even when the number and seriousness of prior convic;tions are taken into account (Nelson, 1989). If blacks and Hispanics were arrested more often than whites, and if the number of prior arrests affected the chances of being incarcerated, then excluding arrests from the prior record score could introduce a spurious relation between minority status and incarceration.
Basing the criminal record score upon arrests and convictions alleviated some problems with missing dispositions. About 20 percent of all cases in the CCH/OBTS did not have final dispositions. These events would not have affected the criminal record score had the score been based solely upon convictions.
The percentage of defendants who were incarcerated by prior record score and minority status is presented in Table 2. The table shows that incarceration covaried with the criminal history score, and that minorities were incarcerated more often than whites for all but the highest criminal history score.
3Arrests based on misdemeanor prostitution charges or OWl charges are not counted in this measure.
7
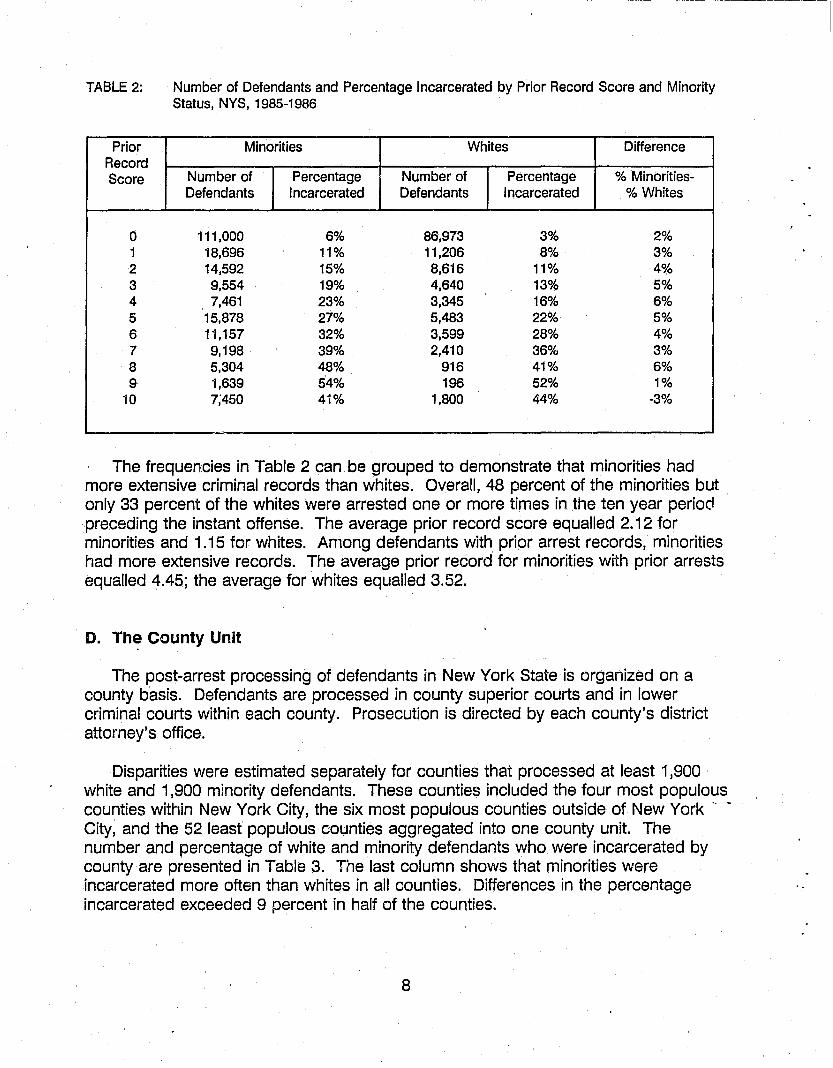
TABLE 2:
Prior Record Score
0 1 2 3 4 5 6 7 8 9
10
Number of Defendants and Percentage Incarcerated by Prior Record Score and Minority Status, NYS, 1985-1986
Minorities Whites Difference
Number of Percentage Number of Percentage % Minorities-Defendants Incarcerated Defendants Incarcerated % Whites
111,000 6% 86,973 3% 2% 18,696 11% 11,206 8% 3% 14,592 15% 8,616 11% 4% 9,554 19% 4,640 13% 5% 7,461 23% 3,345 16% 6%
15,878 27% 5,483 22% 5% 11,157 32% 3,599 28% 4% 9,198 39% 2,410 36% 3% 5,304 48% 916 41% 6% 1,639 54% 196 52% 1% 7;450 41% 1,800 44% -3%
-The frequencies in Table 2 can be grouped to demonstrate that minorities had
more extensive criminal records than whites. Overall, 48 percent of the minorities but only 33 percent of the whites were arrested one or more times in the ten year period preceding the instant offense. The average prior record score equalled 2.12 for minorities and 1.15 for whites. Among defendants with prior arrest records, minorities had more extensive records. The average prior record for minorities with prior arrests equalled 4.45; the average for whites equalled 3.52.
D. The County Unit
The post-arrest processing of defendants in New York State is organized on a county basis. Defendants are processed in county superior courts and in lower criminal courts within each county. Prosecution is directed by each county's district attorney's office.
Disparities were estimated separately for counties that processed at least 1,900 white and 1,900 minority defendants. These counties included the four most populous counties within New York City, the six most populous counties outside of New York o. ~.
City, and the 52 least populous counties aggregated into one county unit. The number and percentage of white and minority defendants who were incarcerated by county are presented in Table 3. The last column shows that minorities were incarcerated more often than whites in a" counties. Differences in the percentage incarcerated exceeded 9 percent in half of the counties.
8

-------------------------------------- -----------
TABLE 3: Number of Defendants and Percentage Incarcerated by County and minority Status, NYS, 1985-1986
Minorities Whites Difference
County Number of Percentage Number of Percentage % Minorities-Defendants Incarcerated Defendants Incarcerated % Whites
Bronx 33,248 17% 3,469 7% 10% Kings 46,979 14% 8,648 6% 8% New York 71,305 13% 15,986 6% 7% Queens 19,706 19% 7,596 9% 10% Erie 6,276 9% 9,092 4% 4% Monroe 4,709 11% 5,729 6% 4% Nassau 5,929 21% 7,728 9% 11% Onondaga 1,939 13% 4,018 7%' 6% Suffolk 3,895 18% 10,077 8% 10% Westchester 5,984 22% 5,572 8% 14% 52 County 11,959 18% 51,269 9% 9%
The frequencies in Table 3 can be grouped to show that most of the minorities (83.8%) were processed in one of the four largest counties of New York City. Most of the whites (72.4%) were processed in other counties. Almost forty percent of the whites but less than 6 percent of the minorities were processed in the 52 county aggregate.
Estimating disparities within counties made it easy to control for differences in how often similarly situated defendants were incarcerated in different counties. No attempt was made to explain why some counties incarcerated defendants more often than other counties. '
E. Disparity
Disparity was defined as a significant relationship between minority status and incarceration that was not due to differences in arrest charges and prior criminal record scores. It was measured by logit parameters and differences in standardized percentages. The importance of the logit parameters was gauged by comparing incarceration percentages for Similarly situated white and minority defendants.
Defendants were categorized as incarcerated if they were sentenced to jail or prison. This definition underestimated the number of defendants who spent time in jail because sentences to "time served" were not categorized as sentences to incarceration.
9
III. Estimating Disparity
Logit models were used to show how incarceration simultaneously depended upon 11 county units, 33 arrest charges, 11 prior criminal record scores, and 2 minority statuses. Without modeling the data, one would have to devise a way of comparing, combining, and contrasting 7,986 incarceration percentages; one percentage for each combination of county, arrest charge, prior record, and minority status variables. The logit models made it possible to describe differences in incarceration by 93 parameters for felony arrest charges and 79 parameters for misdemeanor arrest charges. The variables that were used to estimate the parameters are described in the Appendix. A simple relationship between incarceration and minority status is presented in the next section to illustrate how logit models describe relationships between variables.
A. Measures of Association: Odds vs. Percentages
The parameters in logit models can be understood by comparing how the association between two variables is measured by percentages and odds. Most persons are familiar with measuring association in terms of percentages. Logit models measure association· in terms of odds.
Table 4 contains three hypothetical tables that illustrate differences in how the association between minority status and incarceration percentages can be measured by percentages and odds. To simplify discussion, assume that the minorities and whites within each hypothetical table were arrested for the same charge, had the same prior criminal record, and were processed in the same county.
Table 4A represents a simple relationship betweell minority status and incarceration for 200 defendants. The table is labeled itA Rare Event for Whites" because only one percent of the whites were incarcerated. This table might illustrate the relationship between incarceration and minority status for defendants who did not have a prior record when they were arrested for a misdemeanor crime.
Table 48 was derived from Table 4A by multiplying the first row by 100. It is labeled itA Moderately Frequent Event for Whites" because 50 percent of the whites were incarcerated. This table might describe the relationship between minority status and incarceration for defendants who had extensive criminal records when they were arrested for felony crimes.
Table 4C was obtained from Table 4A by multiplying the first row by 1,000. It is labeled "A Common Event for Whites" because over 90 percent of the whites wePd incarcerated. This table is not likely to occur in the current data set because m~st defendants were not incarcerated.
10
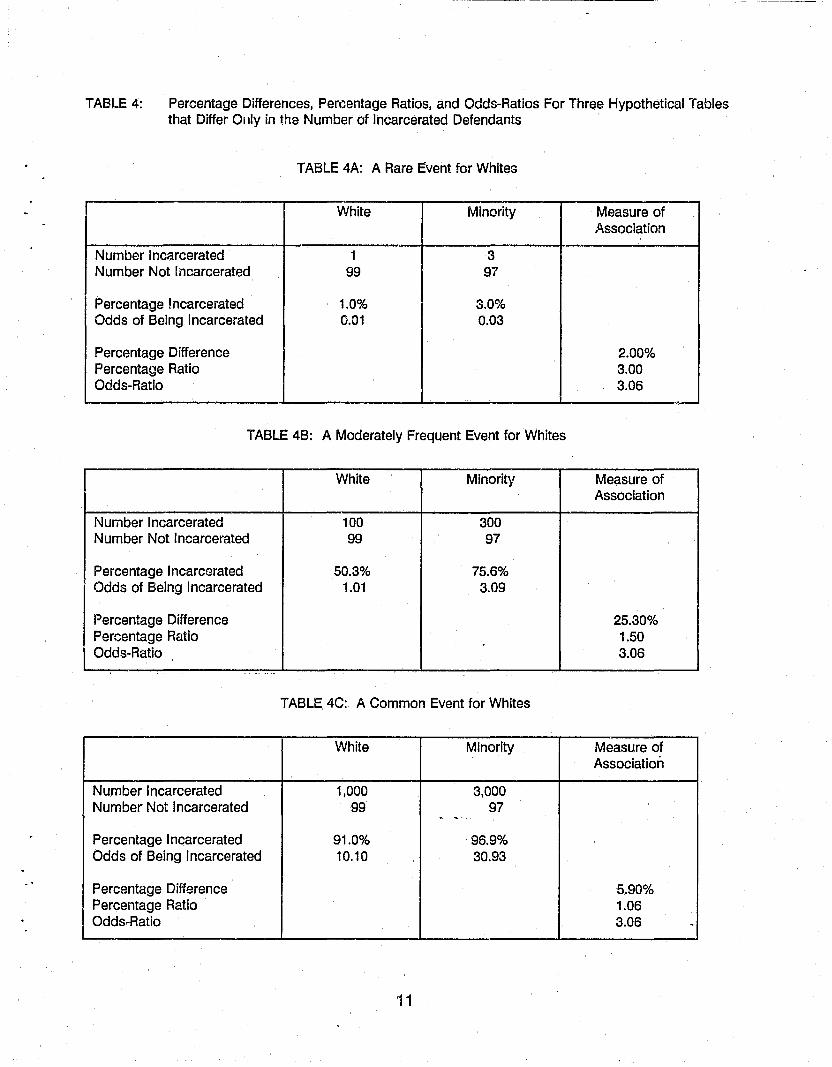
TABLE 4: Percentage Differences, Percentage Ratios, and Odds-Ratios For Three Hypothetical Tables that Differ Only in the Number of Incarcerated Defendants
TABLE 4A: A Rare Event for Whites
White Minority Measure of Association
Number Incarcerated 1 3 Number Not Incarcerated 99 97
Percentage Incarcerated 1.0% 3.0% Odds of Being Incarcerated 0.01 0.03
Percentage Difference 2.00% Percentage Ratio 3.00 Odds-Ratio 3.06
,,-
TABLE 48: A Moderately Frequent Event for Whites
White Minority Measure of Association
Number Incarcerated 100 300 Number Not Incarcerated 99 97
Percentage Incarcerated 50.3% 75.6% Odds of Being Incarcerated 1.01 3.09
Percentage Difference 25.30% Percentage Ratio 1.50 Odds-Ratio 3.06
- -
TABLE 4C: A Common Event for Whites
White Minority Measure of Association
Number Incarcerated 1,000 3,000 Number Not Incarcerated 99 97
'. ~ .-
Percentage Incarcerated 91.0% 96.9% Odds of Being Incarcerated 10.10 30.93
Percentage Difference 5.90% Percentage Ratio 1.06 Odds-Ratio 3.06 -
11
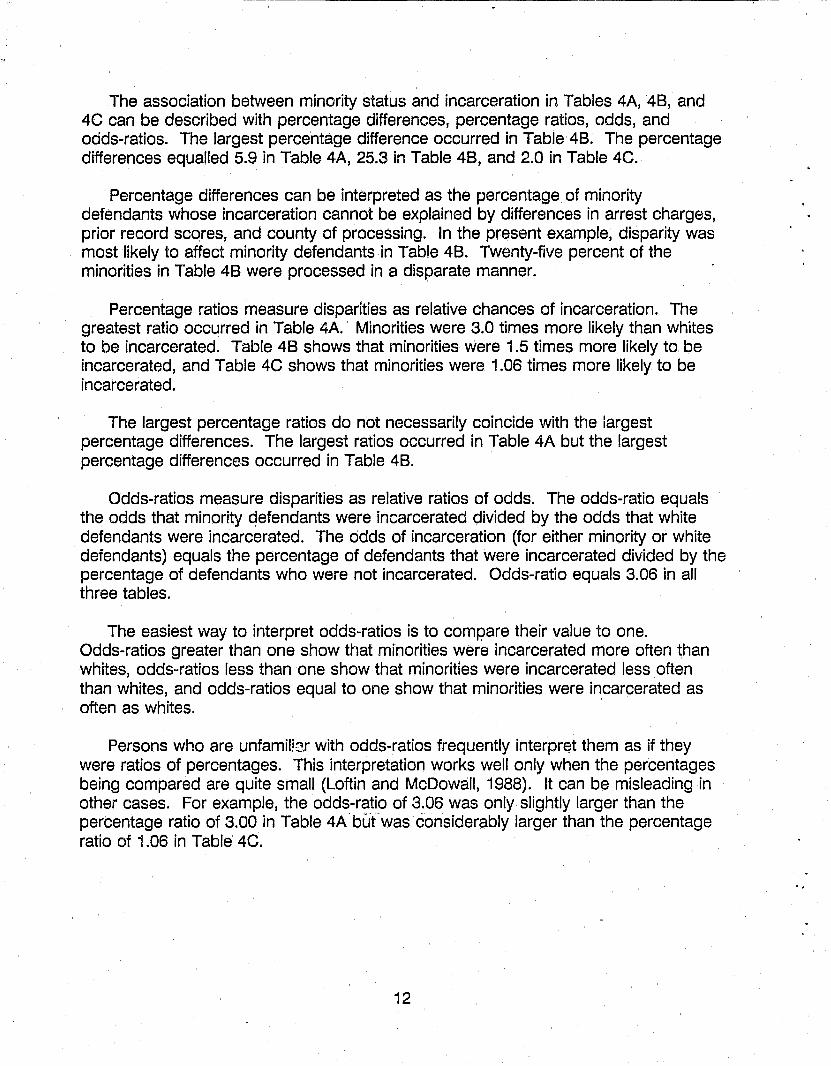
The association between minority status and incarceration in Tables 4A, 48, and 4C can be described with percentage differences, percentage ratios, odds, and odds-ratios. The largest percentage difference occurred in Table 48. The percentage differences equalled 5.9 in Table 4A, 25.3 in Table 48, and 2.0 in Table 4C.
Percentage differences can be interpreted as the percentage of minority defendants whose incarceration cannot be explained by differences in arrest charges, prior record scores, and county of processing. In the present example, disparity was most likely to affect minority defendants in Table 48. Twenty-five percent of the minorities in Table 48 were processed in a disparate manner.
Percentage ratios measure disparities as relative chances of incarceration. The greatest ratio occurred in Table 4A. Minorities were 3.0 times more likely than whites to be incarcerated. Table 48 shows that minorities were 1.5 times more likely to be incarcerated, and Table 4C shows that minorities were 1.06 times more likely to be incarcerated.
The largest percentage ratios do not necessarily coincide with the largest percentage differences. The largest ratios occurred in Table 4A but the largest percentage differences occurred in Table 48.
Odds-ratios measure disparities as relative ratios of odds. The odds-ratio equals the odds that minority defendants were incarcerated divided by the odds that white defendants were incarcerated. The odds of incarceration (for either minority or white defendants) equals the percentage of defendants that were incarcerated divided by the percentage of defendants who were not incarcerated. Odds-ratio equals 3.06 in all three tables.
The easiest way to interpret odds-ratios is to comr:;>are their value to one. Odds-ratios greater than one show that minorities were incarcerated more often than whites, odds-ratios less than one show that minorities were incarcerated less often than whites, and odds-ratios equal to one show that minorities were incarcerated as often as whites.
Persons who are unfamili!J.r with odds-ratios frequently interpret them as if they were ratios of percentages. This interpretation works well only when the percentages being compared are quite sma" (Loftin and McDowall, 1988). It can be misleading in other cases. For example, the odds-ratio of 3.06 was only slightly larger than the percentage ratio of 3.00 in Table 4Abufwas considerably larger than the percentage ratio of i .06 in Table 4C.
12

. '
The effect that minority status had on the odds of being incarcerated can be defined as an odds-ratio. In Tables 4A, 4B, and 4C, the odds that a minority defendant was incarcerated equal the odds that a white was incarcerated times the odds-ratio between minority status and incarceration. For example, the odds that a minority person was incarcerated in Table 4C equals 30.93. This equals the odds that a white was incarcerated, 10.10, times the odds-ratio between minority status and incarceration, 3.06. Because the odds-ratios were the same in all three tables, the effect of minority status on incarceration was the same in all three tables.
The major advantage of measuring relationships with odds-ratios is that they are not affected by the overall probability of incarceration. This makes it possible to use the same measure of association to build statistical models that show how minority status is related to incarceration in a wide variety of situations. This characteristic is not true of percentage ratios or percentage differences. For tables having the same odds-ratios, the as'sociation measured by percentage ratios increases as the smaller perceptage approaches zero. The association measured by percentage differences increases as one of the percentages approaches 50 percent
Logit models were used to describe how the variables in this study simultaneously affected the odds of incarceration. The parameters in these models show how each variable affected the odds of incarceration. The parameters do not necessarily indicate which combinations of arrest charges, prior record scores, and county were most likely to result in disparate incarceration decisions.-- -------.---.. ---
B. Disparity Measured by Logit Parameters
Logit parameters that describe county, prior arrest record, and minority parameters are presented in Table 5. The parameters show multiplicative changes in the odds of incarceration that were associated with specific changes in each variable. The minority status parameters are equivalent to odds-ratios between minority status and incarceration .
13
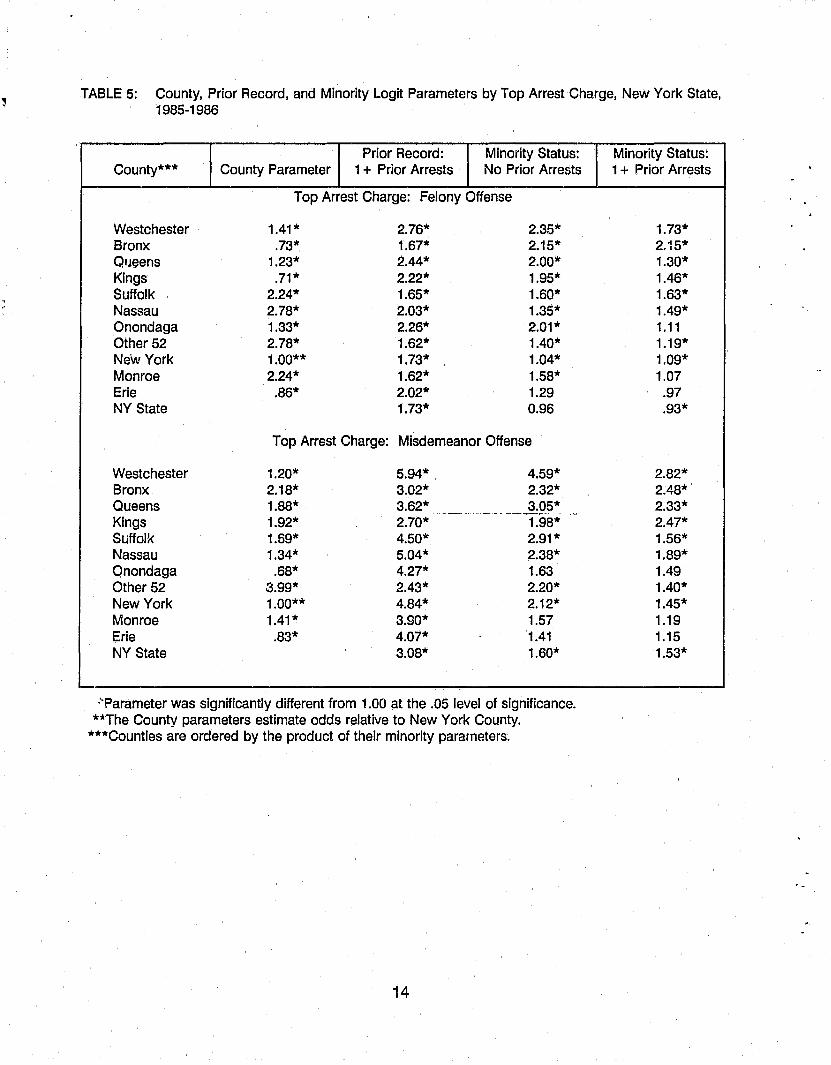
TABLE 5: County, Prior Record, and Minority Logit Parameters by Top Arrest Charge, New York State, 1985-1986
Prior Record: Minority Status: County*** County Parameter 1 + Prior Arrests No Prior Arrests
Top Arrest Charge: Felony Offense
Westchester 1.41* 2.76* 2.35* Bronx .73* 1.67* 2.15* Queens 1.23* 2.44* 2.00* Kings .71* 2.22* 1.95* Suffolk 2.24* 1.65* 1.60* Nassau 2.78* 2.03* 1.35* Onondaga 1.33* 2.26* 2.01* Other 52 2.78* 1.62* 1.40* New York 1.00** 1.73* 1.04* Monroe 2.24* 1.62* 1.58* Erie .86* 2.02* 1.29 NY State 1.73* 0.96
Top Arrest Charge: Misdemeanor Offense
Westchester 1.20* 5.94* 4.59* Bronx 2.18* 3.02* 2.32* Queens 1.88* 3.62* 3.05*
~~.
•• ,,_,_, _~_. ____ ~ ___ h_
Kings 1.92* 2.70* 1.98* Suffolk 1.69* 4.50* 2.91* Nassau 1.34* 5.04* 2.38* Onondaga .68* 4.27* 1.63 Other 52 3.99* 2.43* 2.20* New York 1.00** 4.84* 2.12* Monroe 1.41* 3.90* 1.57 Erie .83* 4.07* 1.41 NY State 3.08* 1.60*
,"--,
'~Parameter was significantly different from 1.00 at the .05 level of significance. *"The County parameters estimate odds relative to New York County.
***Counties are ordered by the product of their minority parameters.
14
Minority Status: 1 + Prior Arrests
1.73* 2.15* 1.30* 1.46* 1.63* 1.49* 1.11 1.19* 1.09* 1.07 .97 .93*
2.82* 2.48* 2.33* 2.47* 1.56* 1.89* 1.49 1.40* 1.45* 1.19 1.15 1.53*
------------------ ~--~~-
The county parameters show how the odds of incarceration in each county differed from the odds of incarceration in New York County.4 For felony offenses, the county parameters ranged from .71 in Bronx County to 2.78 in the 52 county unit. For misdemeanor offenses, these parameters ranged from .68 in Onondaga County to 3.99 in the 52 county unit. In general, the odds of incarceration for a felony crime were particularly low in three of the four most populous counties of New York City (Kings, Bronx, and New York). A similar pattern did not occur for misdemeanor crimes.
The prior record parameters show how the odds of incarceration for persons having prior arrest records differed from the odds of incarceration for persons who were arrested for the first time. These parameters ranged by county from 1.04 to 2.35 for felony charges and from 1.41 to 4.59 for misdemeanor charges. In all counties, parameters were higher for misdemeanor than for felony charges. 5
The minority status parameters show how the odds of incarceration for minorities differed from the odds for whites. Separate parameters were estimated for defendants with and without prior arrest records because preliminary analyses (not presented here) demonstrated that there were significant interactions between minority status, incarceration, and prior arrest record. Most (34 out of 44) of the minority parameters were significantly greater than one, demonstrating that minorities were incarcerated more often than whites. In almost every comparison made within the same county, minority parameters were larger for misdemeanor than for felony charges, and were larger for defendants without than for defendants with prior arrest records.
The product of the four minority parameters (two for felony offenses and two for misdemeanor offenses) was used to rank each county on disparity. The first six counties listed in Table 5 exhibited considerable disparity. The last five counties exhibited less disparity. The least disparity was measured in Erie County. None of its minority parameters were significantly greater than one.
The county labeled "NY State" displays parameters for a model that estimated disparities for the State as a whole. The minority parameters for this model give the misleading impression for felony charges that minorities were incarcerated slightly less often than whites! Reasons for this unexpected relationship are discussed in the next section.
4 Any of the 11 counties could have been selected for comparison.
5Differences in the extent of prior cr-iminal records for defendants with prior arrest records were measured by parameters that treated the prior criminal score variable as a continuous variable. Separate coefficients were estimated within each county. These coefficients demonstrated that the extent of prior records significantly affected incarceration outcomes. However, they are not needed to understand how minority status affected incarceration and consequently are not presented in Table 5.
15
~ ,
C. Disparity Measured by Standardized Percentages
While the logit parameters make it easy to compare how each variable affected the odds of incarceration, they do not show how each variable affected the percentage of defendants who were incarcerated. This effect was estimated from standardized incarceration percentages.
Standardized incarceration percentages were calculated in several steps. First, the 172 logit parameters were used to estimate the percentage of whites and the percentage of minorities who would be incarcerated for the 363 combinations of 33 arrest charges by 11 prior record scores in each county. These 726 percentages (363 for whites and 363 for minorities) show how often whites and minorities who were arrested for the same charges and who had the same prior record scores were incarcerated within each county. There were 11 sets of 726 incarceration percentages. .
Second, a standardized population of defendants was created by counting. the total number of defendants in the state who were arrested for the 363 cqmbinations of 33 arrest charges by 11 prior record scores. The standardized population combined the arrest charges and prior criminal records of whites and minorities into one table.
Third, the standardized population counts were multiplied by the incarceration percentages to estimate the expected number of whites and the expected number of minorities who would be incarcerated in each county. The expected numbers were summed across arrest charges and prior criminal record scores. These summations were used to calculate the standardiz.ed percentages presented in Table 6. These percentages show what would happen if each county processed the same (standardized) population of defendants. Differences betwlgen these percentages are not due to differences in the characteristics of defendants processed in each county. .
1.County Effects Confound Statewide Comparisons
The last column in Table 6 displays the percentage of defendants who would be incarcerated in every county. 6 The percentages demonstrate large differences in the use of incarceration by county. For felony arrests, the percentages would range from 15.6 percent in Erie County to 33.2 percent in Nassau County. Relatively few defendants would be incarcerated in New York, Kings, and Bronx Counties. For misdemeanor arrests, the percentages would range from 3.6 percent in Onondaga County to 17.2 percent in Westchester County. .
6The overall percentages ~ere calculated by weighting each standardized percentage by the proportion of cases it represented in the standardized population. An analysis of the standardized population showed that .1751 of the defendants arrested for felony charges were white with no arrest record, .3652 were minority with no arrest record, .1083 were white with an arrest record, and .3514 were minority~ith an arrest record. The corresponding proportions for misdemeanor charges equalled .3175, .2913, .1367 and .2545, respectively.
16
f
TABLE 6: Standardized Percentages of Defendants Incarcerated and Percentage Differences by Top Arrest Charge, County, Prior Arrest Record, and Minority Status, New York State, 1985-1986
No Prior Arrests At Least 1 Prior Arrest -
Minorities Whites Minoritles- Minorities Whites Minorities- All County Whites Whites Cases
Arrest Category: Felony Charges
Westchester 17.9 9.0 8.9 47,3 35.'7 11.6 28.6 Bronx 10.0 5.1 4.9 33.5 20.5 13.0 18.5 Queens 14.3 8.1 6.2 39.1 33.8 5.3 24.0 Kings 8.9 4.9 4.0 28.9 22.5 6.4 16.7 Suffolk 19.0 13.3 5.7 45.7 35.3 10.4 29.1 Nassau 19.6 15.7 3.9 52.7 44.0 '-8.7 33.2 Onondaga 15.3 8.6 6.7 35.2 33.2 2.0 23.1 52 Counties 20.2 15.7 4.5 43.6 39.8 3.8 29.8 New York 6.9 6.7 .2 28.8 27.2 1.6 16.8 Monroe 18.8 13.3 5.5 30.3 29.0 1.3 23.0 Erie 7.4 5.9 1.5 25.8 26.2 -0.4 15.6
Unweighted Average 14.4 9.7 4.7 37.4 3'1.6 5.8 23.5
.-. -, ~--.-.-----~~ ----
NYS Weighted Average 10.3 10.7 -.4 32.7 34.2 -1.5 20.8
Arrest Category: Misdemeanor Charges
Westchester 6.2 1.4 4.8 45.1 25 .. 7 19.4 17.2 Bronx 3.3 1.4 1.9 20.8 10.1 10.7 8.1 Queens 3.7 1.2 2.5 21.8 11.4 10.4 8.6 Kings 2.5 1.3 1.2 16.6 7.8 8.8 6.4 Suffolk 3.2 1.1 2.1 16.6 11.6 5.0 7.1 Nassau 2.1 .9 1.2 23.7 15.1 8.6 9.0 Onondaga .7 .5 .2 9.2 6.5 2.7 3.6 52 Counties 5.5 2.6 2.9 19.6 .5.2 4.4 9.5 New York 1.4 .7 .7 14.0 10.4 3.6 5.6 Monroe 1.5 .9 .6 10.0 8.7 1.3 4.5 Erie .8 .6 .2 10.6 9.5 1.1 4.4
Unweighted Average 2.8 1.1 1.7 18.9 12.0 6.9 7.6
NY State Weighted Average 2.4 1.5 .9 17.1 12.2 4.9 7.2
17
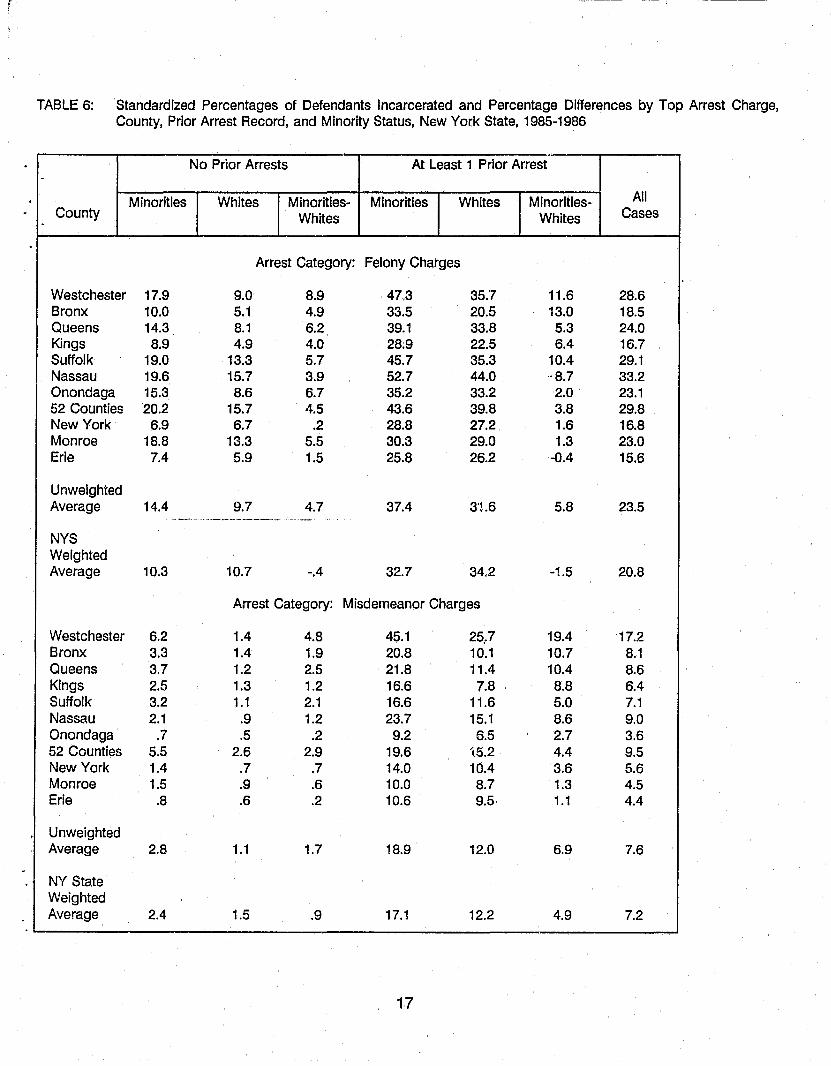
The large differences in the use of incarceration by county made disparity impossible to estimate from statewide totals. The problem with using statewide data is illustrated by the two averages in Table 6. The "Unweighted Average" is a simple average of the percentages in Table 6. These averages do not take into account the fact that most minorities were processed in the New York City area and most whites were processed in other areas. The "NY State Weighted Average" takes the distribution of minority status and arrest charges found within each county into account. These averages were obtained from logit models based upon statewide totals. These models are listed as models H2 and H5 in the Appendix.
Differences between the weighted and unweighted averages are particularly striking for defendants arrested for felony crimes. The unweighted averages show that minorities would be incarcerated more often than whites. These averages reflect the fact that in 21 out of 22 comparisons, minorities with the same case characteristics as whites had higher incarceration percentages. Yet, the weighted averages show the opposite, namely that whites were incarcerated more often than minorities. The statewide pattern occurred because the county effect was slightly larger than the minority status effect. Incarceration percentages for whites outside of New York City were larger than incarceration percentages for minorities within New York City. Yet in both areas, minorities were incarcerated more often than whites. When averaged across counties, minorities appear to have lower incarceration percentages than whites because of overall differences between New York City and the rest of the state in how often defendants were -incarcerated-.- -The possibility of confounding minority status with region was mentioned by Blumstein (1982) and by Zimmerman and Frederick (1983).
2. Arrest Category And Prior Criminal Record Effects
Table 6 demonstrates that incarceration was closely related to the category of the arrest charge and to the existence of an arrest record. Unweighted averages for whites ranged form 1 percent for persons arrested for misdemeanor charges without arrest records to 32 percent for persons arrested for felony c;harges with prior arrest records. For minorities the percentages ranged from 3 to 37 percent, respectively.
In many counties, prior record had a greater influence on incarceration than arrest category. The unweighted averages show that defendants arrested for felony charges without prior arrests would be incarcerated less often than defendants arrested for misdemeanor charges with prior arrest records.
3. Minority Status Effects
Differences in standardized percentages for minorities and whites are presented for defendants without prior arrest records in the 4th column and for defendants with prior arrest records in the 7th column of Table 6. Positive differences occurred in counties that would incarcerate minorities more often than whites, and negative differences occurred
18
in counties that would incarcerate whites more often than minorities. Forty-three out of the 44 differences were positive indicating that minorities would be incarcerated more often than whites. Differences were particularly large in the first six counties listed in each section.
Percentage differences depended upon the category of arrest charge and the extent of prior criminal record. Percentage differences were smallest for defendants arrested for misdemeanor charges who did not have prior arrest records. Perc.entage differences were about as large for defendants arrested for felony crimes (regardless of arrest record)
. as they were for defendants arrested for misdemeanor crimes who had arrest records.
These findings demonstrate the importance of considering percentages when interpreting logit parameters. Using just logit parameters, one might assume that the greatest decreases' in disparities would be achieved by developing programs to reduce the largest minority parameters. This logic would suggest that programs should be designed to remove disparities for persons arrested for misdemeanor crimes who do not have prior arrest records. The problem with this logic is that removing disparities for these defendants would have the least impact on the number of defendants adversely affected by disparities, because few defendants arrested for misdemeanor crimes without prior arrest records are incarcerated.
19
IV. The Impact Of Disparity on Incarcerated Populations
The standardized percentages presented in Table 6 suggest that the concentration of minorities in New York State jails and prisons might be reduced by removing disparities in post-arrest processing. In 1988, blacks and Hispanics represented 80 percent of the . state's prison inmates and 67 percent of all persons who were held before trial or sentenced to jail.7 Yet, blacks and Hispanics represented less than 25 percent of the state's general population.
The effect that disparities had on the percentage of minorities among defendants sentenced to jail or prison was estimated by comparing the percentage of minorities among defendants sentenced to incarceration under two logit models. One model included minority effects and one did not. The one that excluded minority effects shows how defendants would be processed if incarceration were determined solely by arrest charges, prior criminal records, and county of processing. a The observed distributicn of arrest charges, prior criminal records, minority status and county were used to estimate probabilities under both models.
The percentages of defendants sentenced to jail or prison who were minorities are presented in Table 7. The table shows that removing disparities would not change the minority character of jails and prisons. The percentage of persons sentenc.ed to incarceration who were minorities would be reduced from 77.2 to 74.5 percent for defendants arrested for felony charges and from 73.6 to 66.7 percent for defendants arrested for misdemeanor charges. The larger reduction for misdemeanor arrests would not reduce the concentration of minorities in prisons because defendants who were convicted of misdemeanor crimes could not be sentenced to prison.
The largest reductions in the percentage of minorities would occur among defendants who did not have a prior criminal record. The percentage of minorities would decrease from 72.5 to 67.6 percent for defendants arrested for· felony charges and from 60.0 to 46.7 percent for defendants arrested for misdemeanor charges. These decreases wquld have little impact on the percentages of incarcerated persons who were minorities because relatively few persons who were arrested for the first time were incarcerated.9
- - 7The percentage of minorities in jail was based upon admission data. This percentage may not equal the percentage of minorities who were in jail at anyone time because it does not reflect differences in the length of stay.
aTne logit models without disparity parameters are listed as models H3 and H6 in Table A of the Appendix. The models that include disparity parameters are listed as models H1 and H4.
9The model that removed disparities in Table 7 represents an average of the parameters that described how whites were processed and the parameters that described how minorities were processed. The analysis was repeated using a model that processed all defendants by the parameters that described how whites were processed. While this approach changed the expected number of defendants who would be incarcerated, it did not substantially change the percentages in Table 7.
20
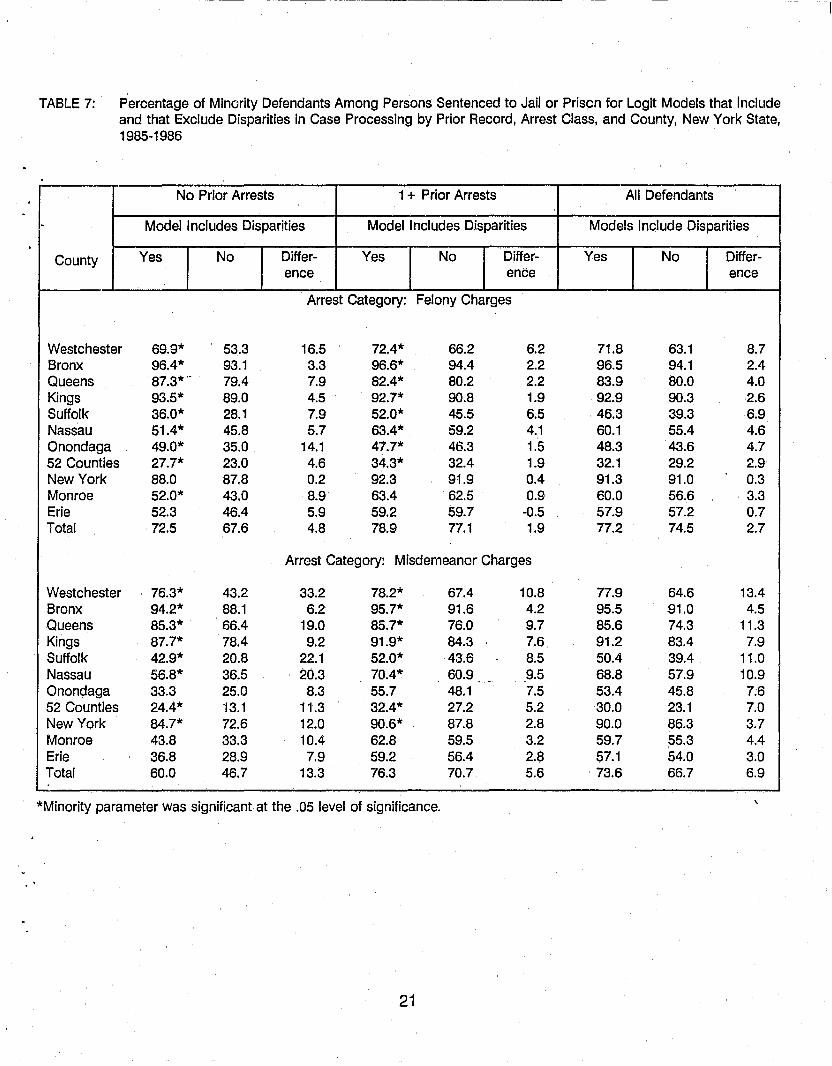
TABLE 7: Percentage of Minority Defendants Among Persons Sentenced to Jail or Prison for Logit Models that Include and that Exclude Disparities in Case Processing by Prior Record, Arrest Class, and County, New York State, 1985-1986
No Prior Arrests 1 + Prior Arrests All Defendants
. Model Includes Disparities Model Includes Disparities Models Include Disparities
County Yes No Differ- Yes No Differ- Yes No Differ-ence ence ence
Arrest Category: Felony Charges
Westchester 69.9* 53.3 16.5 72.4* 66.2 6.2 71.8 63.1 8.7 Bronx 96.4* 93.1 3.3 96.6* 94.4 2.2 96.5 94.1 2.4 Queens 87.3*'· 79.4 7.9 82.4* 80.2 2.2 83.9 80.0 4.0 Kings 93.5* 89.0 4.5 92.7* 90.8 1.9 92.9 90.3 2.6 Suffolk 36.0* 28.1 7.9 52.0* 45.5 6.5 46.3 39.3 6.9 Nassau 51.4* 45.8 5.7 63.4* 59.2 4.1 60.1 55.4 4.6 Onondaga 49.0* 35.0 14.1 47.7* 46.3 1.5 48.3 43.6 4.7 52 Counties 27.7* 23.0 4.6 34.3* 32.4 1.9 32.1 29.2 2.9 New York 88.0 87.8 0.2 92.3 91.9 0.4 91.3 91.0 0.3 Monroe 52.0* 43.0 8.9 63.4 62.5 0.9 60.0 56.6 3.3 Erie 52.3 46.4 5.9 59.2 59.7 -0.5 57.9 57.2 0.7 Total 72.5 67.6 4.8 78.9 77.1 1.9 77.2 74.5 2.7
Arrest Category: Misdemeanor Charges
Westchester 76.3* 43.2 33.2 78.2* 67.4 10.8 77.9 64.6 13.4 Bronx 94.2* 88.1 6.2 95.7* 91.6 4.2 95.5 91.0 4.5 Queens 85.3* 66.4 19.0 85.7* 76.0 9.7 85.6 74.3 11.3 Kings 87.7* 78.4 9.2 91.9* 84.3 7.6 91.2 83.4 7.9 Suffolk 42.9* 20.8 22.1 52.0* 43.6 . 8.5 50.4 39.4 11.0 Nassau 56.8* 36.5 20.3 70.4* 60.9 9.5 68.8 57.9 10.9
_." .. Onondaga 33.3 25.0 8.3 55.7 48.1 7.5 53.4 45.8 7.6 52 Counties 24.4* 13.1 11.3 32.4* 27.2 5.2 30.0 23.1 7.0 New York 84.7* 72.6 12.0 90.6* 87.8 2.8 90.0 86.3 3.7 Monroe 43.8 33.3 10.4 62.8 59.5 3.2 59.7 55.3 4.4 Erie 36.8 28.9 7.9 59.2 56.4 2.8 57.1 54.0 3.0 Total 60.0 46.7 13.3 76.3 70.7 5.6 73.6 66.7 6.9
*Minority parameter was significant at the .05 level of significance.
21
V. Discussion
Minorities were incarcerated more often than whites. Disparities were least likely to affect persons arrested for misdemeanor crimes who did not have prior arrest records. Disparities were about as likely to affect defendants arrested for misdemeanor crimes who had prior arrest records as they were to affect persons arrested for felony crimes.
Disparities varied by county. The smallest disparities occurred in New York and Erie Counties. The largest disparities occurred in Westchester County. The lack of disparity in New York County combined with above average levels of disparity in Bronx, Kings, and
. Queens Counties suggests that the counties of New Yark City should be analyzed separately when estimating disparities .
. _ The finding that minorities were more likely to be incarcerated than whites is at odds with most research undertaken in the 1980's. This prior research, which was based primarily upon sentencing decisions for persons convicted of felony' crimes, suggested that disparities have little if any effect on sentencing decisions. The present study would have supported this conclusion had the analysis been limited to statewide totals for felony arrest charges.
The absence of disparities based in statewide totals combined with the presence of disparities based upon county totals demonstrate that disparities should not be estimated from highly aggregated data. Disparities were impossible to estimate from state level totals because minority populations were concentrated in counties that incarcerated relatively few defendants. Once differences in the seriousness of arrest charges and the extent of prior criminal records were taken into account, the percentage of whites who were incarcerated for felony arrests outside of New York City exceeded the percentage of minorities who were incarcerated for felony arrests ,«ithin New York City. Aggregated to the state level, whites were incarcerated _more often than minorities even though the converse was true at the county level. Similar patterns may occur in other states that process most minorities in a few counties.'
Like previous research, the present analysis suggests that the concentration of minorities in jails and prisons is more closely related to differences in arrest charges and prior criminal records than to disparities in post-arrest case processing. While it would not change the minority character of jails and prisons, removing disparities would slightly decrease the concentration of minorities in jails and prisons. The reduction would be larger for jail than for prison populations.
22

The total impact of removing disparities could be larger than the effect that was estimated in this paper. Removing disparities could reduce the seriousness of prior records for minorities, and this, in turn, could reduce their chances of subsequent incarcerations (see Farrell and Swigert, 1978).
This research demonstrates that minorities were incarcerated more often than comparably situated whites. It does not provide enough detail about how defendants were processed to ~uggest what caused disparities or how they might be reduced.
23
VI. Appendix: Selecting a Model
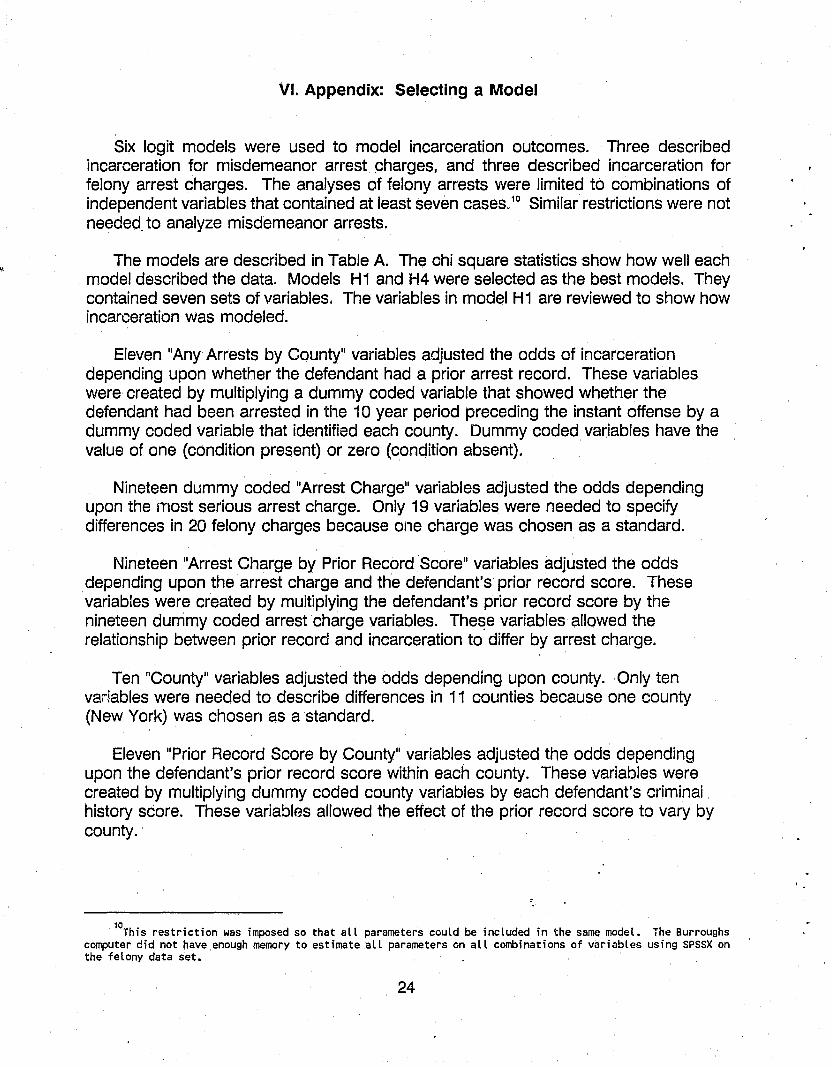
Six log it models were used to model incarceration outcomes. Three described incarceration for misdemeanor arrest .charges, and three described incarceration for felony arrest charges. The analyses of felony arrests were limited to combinations of independent variables that contained at least seven cases. 10 Similar restrictions were not needed. to analyze misdemeanor arrests.
The models are described in Table A. The chi square statistics show how well each model described the data. Models H1 and H4 were selected as the best models. They contained seven sets of variables. The variables in model H1 are reviewed to show how incarceration was modeled.
Eleven "Any Arrests by County" variables adjusted the odds of incarceration depending upon whether the defendant had a prior arrest record. These variables were created by multiplying a dummy coded variable that showed whether the defendant had been arrested in the 10 year period preceding the instant offense by a dummy coded variable that identified each county. Dummy coded variables have the value of one (condition present) or zero (condition absent).
Nineteen dummy coded "Arrest Charge" variables adjusted the odds depending upon the most serious arrest charge. Only 19 variables were needed to specify differences in 20 felony charges because one charge was chosen as a standard.
Nineteen IIArrest Charge by Prior Record Score" variables adjusted the odds depending upon the arrest charge and the defendant's prior record score. These variables were created by multiplying the defendant's prior record score by the nineteen dummy coded arrest charge variables. The~e variables allowed the relationship between prior record and incarceration to differ by arrest charge.
Ten "County" variables adjusted the odds depending upon county. Only ten variables were needed to describe differences in 11 counties because one county (New York) was chosen as a standard.
Eleven "Prior Record Score by County" variables adjusted the odds depending upon the defendant's prior record score within each county. These variables were created by multiplying dummy coded county variables by each defendant's criminal history score. These variables allowed the effect of the prior record score to vary by county.
10This restriction was imposed so that all parameters could be included in the same model. The Burroughs computer did not have enough memory to estimate all parameters on all combinations of variables using SPSSX on the felony data set.
24
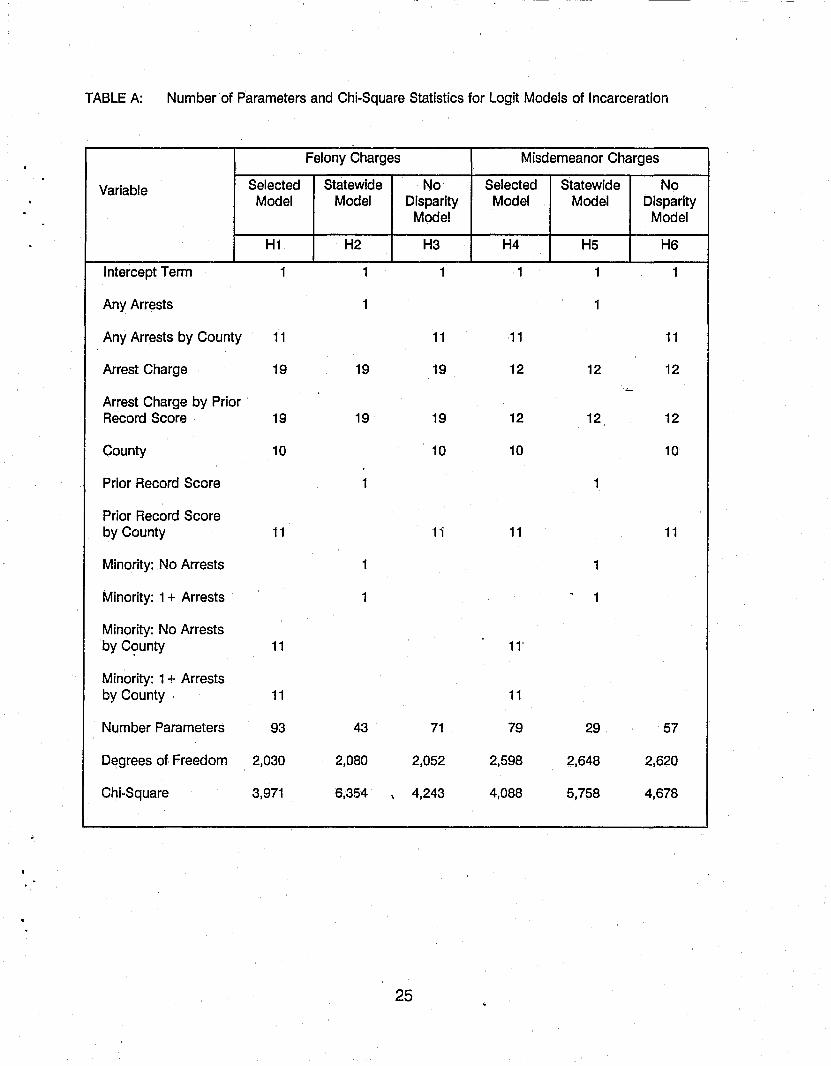
TABLE A: Number of Parameters and Chi-Square Statistics for Logit Models of Incarceration
Felony Charges Misdemeanor Charges
Variable Selected Statewide No Selected Statewide No Model Model Disparity Model Model Disparity
Mode! Model
H1 H2 H3 H4 H5 H6
I ntercept Term 1 1 1 1 1 1
Any Arrests 1 1
Any Arrests by County 11 11 11 11
Arrest Charge 19 19 19 12 12 12 :"-.
Arrest Charge by Prior Record Score 19 19 19 12 12 12
County 10 10 10 10
Prior Record Score 1 1
Prior Record Score by County 11 1i 11 11
Minority: No Arrests 1 1
Minority: 1 + Arrests 1 ,
1
Minority: No Arrests by C,?unty 11 11'
Minority: 1 + Arrests by County 11 11
Number Parameters 93 43 71 79 29 57
Degrees of Freedom 2,030 2,080 2,052 2,598 2,648 2,620
Chi-Square 3,971 6,354 \ 4,243 4,088 5,758 4,678
25

Eleven "Minority: No Arrests by County" variables adjusted the odds of incarceration depending upon minority status for defendants without prior arrest records within each county. These variables were created by multiplying a dummy coded prior arrest record variable (1 if no prior arrest record, 0 otherwise) by a dummy coded minority status variable (1 if minority, 0 if white) by a dummy coded county variable. Eleven "Minority: 1 + Arrests by County" variables were created in a similar manner.
Models H2 and H3 demonstrate that the county and the minority effects in model Hi significantly contributed to model Hi's ability to describe incarceration. Had these effects been weakly related to incarceration, then the chi square statistics in models H2 or H3 would have been only slightly larger than the chi square statistic in model Hi. Likewise, models H5 and H6 demonstrate that the county and minority effects in model H4 significantly contributed to its ability to describe incarceration.
~6
VII. References
Albonetti, C.A, A.M. Hauser, J. Hagan, and I,H. Nagel (1989) "Criminal . Justice Decision Making as a Stratification Process: The Role of Race and
Stratification Resources in Pretrial Release." Journal of Quantitative Criminology 5: 57-82.
Blumstein, A (1982) liOn the Racial Disproportionality of United States' Prison Populations. II Journal of Criminal Law and Criminology 73: 1259-1281.
Christianson, S. (1981) "Our Black Prisons. II Journal of Crime and Delinquency, 364:
Crutchfield, R.D. and G.S. Bridges (1985) "Racial and Ethnic Disparities in Imprisonment: Final Report." Institute for Public Policy and Management, University of Washington, Seattle, WA
Farrell, A.A. and V.L. Swigert (1978) "Prior Offense Record as a Self-Fulfilling Prophecy." 12, Law and Society Review: 437-453.
Grossman, E. (1987) "Prison Study Raises Concern." Poughkeepsie Journal, March 4: 38.
Hagan, J. and K. Bumiller (1983) "Making Sense of Sentencing: A Review and Critique of Sentencing Research," in Research on Sentencing: The Search for Reform." Volume II. by A Blumstein, J. Cohen S. Martin, and M Tonry, National Academy Press, WN DC, 1-54.
Hagan, J. and RD. Peterson (1984) "Changing Conceptions of Race: Towards an Account of Anomalous Findings of Sentencing Research." American Sociological Review 49: 56-70.
Kleck, G. (1985) "Life Support for Ailing Hypotheses: Modes of Summarizing the Evidence for Racial Discrimination in Sentencing. II Law and Human Behavior 9:271-285.
Klein, S.P., S. turner, and J. Petersilia (1988). Racial Equity in Sentencing. Rand Corporation, Santa Monica, CA.
Loftin, C. and D. McDowall (1988) "The Analysis of Case-Control Studies in Criminology'" Journal of Quantitative Criminology 4: 85-98.
Murphy, J. 1989 "A Question of Race: Minority/White Incarceration in New York State." Center for Justice Education, Albany, NY.
27
Myers, A.M. and S.M. Talarico (1987) The Social Contexts of Criminal Sentencing. Springer-Verlag, New York.
Nelson, J.F. (1989) "An Operational Definition of Prior Criminal Record." Journal of Quantitative Criminology 5: 333-352.
Petersilia, J. (1983) "Racial Disparities in the Criminal Justice System." Rand Publication Series, Rand Corp, Santa Monica, CA.
Pommershein, F. and S. Wise (1989). IIDisparate Sentencing in South Dakota." Criminal Justice and Behavior 16: 155-165.
Schulman, S. and M. Gryta (1988). "Poverty's Legacy is a Plague of Crime. II Buffalo News, Nov 15: 35-38
Spohn, C., J. Gruhl, and S. Welch (1982) liThe Effect of Race on Sentencing: A Reexamination of an Unsettled Question." Law and Society Review 16:71-88.
Wilbanks, W. (1986) The Myth of a Racist Criminal Justice System. Brooks/Cole, Monterey, CA.
Zimmerman, S. E. and B.C. Frederick (1983) "Discrimination and the Decision to Incarcerate." New York State Division of Criminal Justice Services, Albany, NY.
28