Embed Size (px)
Citation preview

New York State
Economic and Fiscal Outlook 2014-2015
A Fiscal Policy Institute Report
www.fiscalpolicy.org
I.
February 2014

The Fiscal Policy Institute (FPI) wishes to thank the Ford and Charles Stewart Mott Foundations for their support of the state fiscal analysis work that makes this briefing book and the briefings at which it is being presented possible. FPI also wishes to thank the many organizations, including other foundations, labor unions, faith-based organizations, human services providers and advocates, and community and good government groups that support FPI's work and/or disseminate the results of FPI’s analysis. Additional information on state fiscal and economic issues and copies of the Fiscal Policy Institute’s publications (including a PDF version of this briefing book) are available via the Internet at www.fiscalpolicy.org
Fiscal Policy Institute One Lear Jet Lane
Latham, New York 12110 518-786-3156
11 Park Place, Suite 701 New York, NY 10007
212-721-5624
Frederick G. Floss, Ph.D.
Executive Director
James A. Parrott, Ph.D. Deputy Director and Chief Economist
www.fiscalpolicy.org, [email protected]
February 2014, ver. 8

Table of Contents
I. Executive Budget Proposal ....................................................................... 1 A. Budget Basics .................................................................................... 1 B. Over-Arching Assumptions Underlying the Proposed Budget .......... 4 C. Gap-Closing Cuts and Beyond ......................................................... 13
II. Impact of Proposed Spending Cuts in 2014-2015 ................................. 17 III. Governor’s Tax Policy Proposals ......................................................... 37 IV. The Economic and Social Context ....................................................... 53 V. An Economic Policy Agenda to Address Income Inequality ................ 83 VI. Appendix ............................................................................................. 91

Overview • The proposed 2014-2015 Executive Budget embodies several fundamental assumptions about the
preferred size of New York government, the optimal growth rate of state spending, and the linkage between taxes and New York’s economic performance.
• On the heels of six years of austerity budgets, the Executive Budget proposes another year of spending cuts in a host of areas, and lays out a multi-year plan of steep spending cuts that will extend the austerity measures for three more years, and that will result in an “austerity decade” for New York. One purpose of the multi-year expenditure cutting plan is to create the appearance of a budget “surplus” in order to justify multi-year tax cuts.
• This briefing will assess those proposed tax cuts. In the case of the homeowners’ and renters’ personal income tax credits, more equitable alternatives will be suggested. In the case of the tax cuts geared to big business and the wealthiest New Yorkers, the underlying rationale will be examined, and suggestions made for other reforms.
• Although New York State has fared better than many states during the Great Recession and the weak recovery, income gains have been concentrated at the top and pronounced economic hardships have taken a toll on millions of New Yorkers. The indicators are disturbing: continued high and prolonged unemployment; high mortgage debt burdens; and faltering wages, incomes and living standards, precipitating a rise in poverty, hunger, homelessness, and economic insecurity.
• New York’s policy makers need to use various budget, tax and economic policy levers to address this heightened economic insecurity and the growing income polarization that has spawned that insecurity.

50th Anniversary of the War on Poverty
“Each time a man stands up for an ideal, or acts to improve the lot of others, or strikes out against injustice, he sends forth a tiny ripple of hope, and those ripples build a current which can sweep down the mightiest walls of oppression and resistance.” ― Robert F. Kennedy
We are a country that keeps the promises we’ve made. And in a 21st century economy, we will make sure that as America grows stronger, this recovery leaves no one behind. Because for all that has changed in the 50 years since President Johnson dedicated us to this economic and moral mission, one constant of our character has not: we are one nation and one people, and we rise or fall together.
― President Barack Obama

I. Executive Budget Proposal
A. Budget Basics
1

The proposed Executive Budget reflects the policy choices and priorities of the governor’s administration.
• It sends a message of the administration’s priorities to state residents, businesses, various
organizational entities and those living outside the state.
• Decisions about the appropriate mix of state and local government responsibilities in funding and spending for programs can have major impacts on how programs are implemented and whether they will ultimately succeed.
• The Executive Budget sets a baseline from which the legislative process starts and its premises and major thrusts determine the focus of budget debates.
• The Executive Budget includes proposals for tax actions; tax increases and cuts will impact different groups and affect the progressivity of the system.
• The timing of tax and spending actions, either in the current year or out-years determines how much revenue is available for programs and agencies.
2

Category Description
SFY 2014 Estimated, in Millions
SFY 2015 Proposed, in Millions
Change, in
MillionsPercent Change
Disbursements by Fund
General Fund Spending of state revenues not earmarked for specific purposes. 52,941 54,891 1,950 3.7%
State Special Revenue Funds Spending of state revenues (such as the tuition paid by SUNY students) that are legally restricted to use for specific purposes. 31,457 31,405 (52) -0.2%
Debt Service Funds Payments of principal and interest on long-term debt and payments on lease-purchase agreements and other debt-like contractual obligations. 6,100 5,731 (369) -6.0%
State Operating Funds General Fund spending PLUS State Special Revenue Funds spending PLUS Debt Service Funds spending. 90,498 92,027 1,529 1.7%
State Capital Projects Funds Spending of state funds for capital construction, land acquisition, and payments to local governments to help finance their capital programs. 6,126 6,847 721 11.8%
State Funds State Operating Funds spending PLUS State Capital Projects Funds spending. 96,624 98,874 2,250 2.3%
Federal Special Revenue Funds Spending of aid from the federal government for operating purposes. 42,375 41,588 (787) -1.9%
Federal Capital Projects Funds Spending of aid from the federal government for capital projects. 1,866 1,679 (187) -10.0%
All Funds State Funds spending PLUS Federal Special Revenue Funds spending PLUS Federal Capital Projects Funds spending. 140,865 142,141 1,276 0.9%
Extraordinary Federal Aid Superstorm Sandy aid ($5.1 billion in FY 2014 and $2.4 billion in FY 2015) and aid under the Affordable Care Act ($400 million in FY 2014 and $2.6 billion in FY 2015). 5,515 4,973 (542) -9.8%
All Funds (Excluding Extraordinary Federal Aid) All Funds spending MINUS spending of Extraordinary Federal Aid. 135,350 137,168 1,818 1.3%
All Funds Revenues by Type
Taxes 69,414 70,794 1,380 2.0%
Fees and Other Miscellaneous Receipts 23,850 25,315 1,465 6.1%
Federal Aid 47,506 45,792 (1,714) -3.6%
Total Receipts 140,770 141,901 1,131 0.8%
The Executive Budget is the projected income and expense statement for the state government, as proposed by the Governor. It shows how much revenue the state is projected to receive and how much the Governor is proposing the state to spend during the current and upcoming state fiscal years.
The 2014-15 Executive Budget at a Glance
3
I. Executive Budget Proposal
B. Over-Arching Assumptions Underlying the Proposed Budget
4

Fundamental assumptions shaping the proposed 2014-2015 New York State Executive Budget
• In his budget address, Governor Andrew Cuomo emphasized that for the fifty years until he took office, state spending had grown faster than New York’s total personal income. If spending had grown at the same pace as personal income, the state budget would be $40 billion lower. The implication clearly is that state government is too big relative to our economy.
• For the past three years, state spending growth has been limited to about 2 percent a year (before inflation). The proposed budget sets 2 percent annual growth as “the spending benchmark in each of the next four fiscal years.” This “spending benchmark” is set at 2 percent despite projected average inflation growth of 2.2 percent and higher projections for personal income and tax growth.
• In linking a proposed personal income tax credit to homeowners in jurisdictions that freeze property taxes and that act to consolidate services, the Governor argues that failure to consolidate services and local governments is at the root of the fiscal pressures felt by local governments around New York.
• Nearly half of the value of the fully-phased in proposed tax cuts stems from tax cuts for big
businesses and estate taxes paid by the wealthiest New York households. These cuts are justified on the grounds that they will enhance New York’s economic performance.
5

In what respect have state taxes grown faster than total personal income over the past 50 years?
• In his budget presentation, Governor Cuomo stated that, from 1962 to 2010, state spending grew an average of 6.8% per year while total New York personal income rose by 6.2% per year (inflation averaged 4.1% per year over that period.) He emphasized that it is not sustainable for spending to grow faster than personal income and he implied that this pattern prevailed over the entirety of this 48-year period.
• Other than federal grants (mainly for Medicaid but also for education, public assistance, and human services), state taxes largely fund state spending. It is appropriate, therefore, to examine the Governor’s analysis by comparing the respective growth in state taxes and personal income.
• Using Census Bureau data on state revenues (which are mainly tax collections but include fees and MTA tax collections) and Bureau of Economic Analysis (BEA) data on New York personal income, state tax collections grew faster than personal income from 1962 until 1973. Since then, however, personal income has grown faster than tax revenue.
• New York State government grew rapidly from the mid-1960s to the mid-1970s as the Medicaid program for the poor was established, public assistance expanded, and the number of SUNY facilities dramatically increased. State spending, and the taxes to support that spending, grew rapidly during that period—greater than the rise in personal income.
• For the 39 years from 1973 to 2012, New York personal income has grown by 6.1% a year, faster than the 5.7% annual growth in New York state tax revenues. (If you exclude fees and MTA tax revenues, state tax revenue has grown by 5.6% per year, half of one percent slower than personal income growth.)
• The graph on the following page shows this trend as the ratio of state taxes to personal income. A rising ratio means faster tax growth; a downward sloping ratio shows faster income growth.
• This measure overstates the level of taxation relative to the state’s income base since personal income does not include capital gains and a good share of New York’s income tax is paid by high-income out-of-state residents working in New York.
6

3.5%
4.0%
4.5%
5.0%
5.5%
6.0%
6.5%
7.0%
7.5%
8.0%
8.5%
1962
1964
196
6
196
8
197
0
197
2
197
4
197
6
1978
1980
1982
1984
1986
1988
1990
1992
1994
1996
1998
2000
2002
2004
2006
2008
2010
2012
Tax
Rev
enue
as
a Pe
rcen
t of P
erso
nal I
ncom
e New York State tax revenue grew rapidly as a share of state personal income in the 1960s until the 1970s, and has trended downward since then. From 1973 to 2012, income grew 6.1% per year while state taxes rose annually by 5.7%.
Note: The U.S. Census Bureau includes in its state tax series certain fees (such as motor vehicle license and registration fees) as well as regional taxes (of which MTA taxes are the largest component in NYS.) Source: U.S. Census Bureau and Bureau of Economic Analysis.
7

0.06
0.07
0.08
0.09
0.1
0.11
0.12
1963
1966
1969
1972
1975
1978
1981
1984
1987
1990
1993
1996
1999
2002
2005
2008
2011
S&L
Empl
oym
ent a
s a
Perc
ent o
f Tot
al E
mpl
oym
ent
US State & Local NY State & Local
Source: Bureau of Economic Analysis, REIS data.
The size of New York State's government as measured by state and local employment was larger compared to the rest of the United States in the 1970s, but is now on par with the rest of the country.
8

Is 2% a reasonable benchmark to limit annual growth in state spending?
• When overall inflation runs at 2% per year, as in recent years, and is projected to do so over the next four years, a 2% limit in spending means real spending is flat overall. This spells austerity in the context of unmet needs. And since Medicaid has grown faster than that in recent years and is a sizable part of the state budget, many state programs have experienced several years of real spending cuts.
• An arbitrary adherence to 2 percent spending growth means that in a time of increased hardship, the state is failing to respond to heightened need for child care subsidies, social service safety net supports, and food assistance, and will find it difficult to fund a long-overdue commitment to full-day, high-quality, Pre-K education.
• Local aid, whether for schools or revenue sharing, is a prominent part of the state budget. Budget cuts for state agencies and in local aid have contributed to the loss of more than 70,000 state and local government workers in New York over the past four years. This presents a five percent decrease at a time when average private sector job growth has been less than one percent per year.
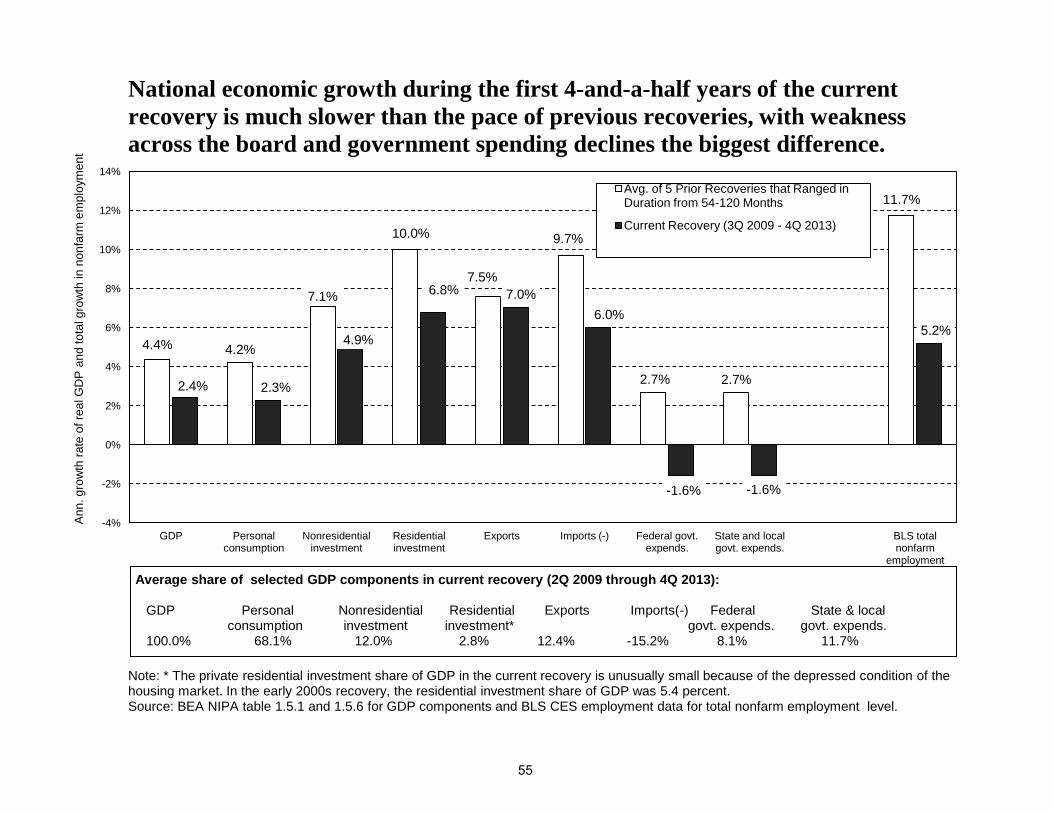
• Most economists agree that the pursuit of austerity federal budgets has hampered the national economy’s recovery. A later chart makes clear that the 1.6 percent average real decline in government spending in this recovery, compared to 2.7 percent growth in spending in prior recoveries, is a major reason for the historically weak current recovery.
• New York needs to pull out from austerity mode. A 2 percent spending limit ignores heightened need and restrains our recovery. At a time when, over the next four years, personal income is projected to grow by 5 percent per year, adjusted gross income by 5.3 percent, and tax collections are forecast to rise by 4.3 percent, there is little basis for 2 percent austerity state budgets.
9

Can consolidation of local governments save substantial amounts of tax dollars without cutting badly needed services in the community? Will overstating the number of actual governments make it harder for communities to work together to find actual savings?
• The budget relies on the number of 10,500 governments in New York State, but a closer look reveals there are: 1,607 General Local Governments, 1,811 Special Purpose Governments, and 1,302 Other Entities for a total of 4,720 non-paper governments.
• The budget estimate includes 5,780 additional special tax districts to get to the 10,500 number; these are nothing more than accounting entries that allow communities to tax certain areas of a town or county for services they receive, such as lighting. There is no government or there are no employees so no potential savings would result from consolidation.
• There is no guarantee that consolidation will save money. If two school districts with no transportation budgets merge and now students are bussed because of the long distances involved, costs go up, not down. Forcing consolidations in a one-size-fits-all manner is not the best way to right size government.
10

Are the proposed “corporate tax reform” and estate tax reductions justifiable on the grounds that they will spur economic growth? • When fully phased in, the proposed business and estate tax cuts will reduce state tax
collections by $1.2 billion a year. This is a bold proposal considering that corporate taxes have been declining as a share of total state taxes over the past two decades. And, given New York’s pronounced income inequality and the overall regressive quality of New York’s state and local taxes, a significant impact would result from the reduction of estate tax collections by 40 percent through enacting the Governor’s estate tax proposal, with most of the benefit flowing to a handful of the wealthiest estates.
• Part III of this briefing will take a close look at these and the other tax proposals in the Executive Budget and will argue that the large Wall Street banks that are the main beneficiaries of the proposed “corporate tax reform” are unlikely to change their location decisions as a result of “corporate tax reform.” This section will also present data on the continued rise in the number of wealthy households in New York under our current estate tax structure and cite a finding by the state’s own tax policy experts that estate tax differences across states do not have a detectable effect at an aggregate level beyond the realm of anecdote.
11

12
I. Executive Budget Proposal
C. Gap-Closing Cuts and Beyond
13

To close the budget gap, the proposed 2014-2015 Executive Budget cuts spending by $2 billion while cutting election-year taxes by $500 million (on top of the $410 million Family Tax Credit enacted last spring.)
• The October mid-year budget update pegged the 2014-2015 budget gap at $1.7 billion. By December 31, 2013, a shortfall in expected bank and insurance taxes was largely offset by settlement payments from two foreign-owned banks for violating international sanctions. The net effect of receipt and expenses changes by the end of December, however, left the gap amount basically unchanged.
• Part of the $1.7 billion gap for 2014-2015 results from the $410 million Family Tax Credit that was
enacted last spring and is scheduled to be sent to taxpayers on the eve of this coming November’s election.
• To close the gap, and to fund about $150M in new initiatives, including a $100M increase for Pre-K, the proposed 2014-2015 Executive Budget cuts agency spending by $360M, and reduces local assistance by $1.6B, for a total of nearly $2B in new cuts in the coming budget year.
• New spending cuts (discussed in Part II of this briefing) exceed the sum of the gap and new initiatives by roughly $150M ($2B cuts -$1.7B gap + $150M new initiatives). This amount is added to a projected $310M surplus from the current 2013-2014 year (along with some smaller items) and results in a projected $486M surplus for 2014-2015.
• The Executive Budget takes the projected surplus of $486M, and proposes a set of new multi-year tax cuts. The 2014-2015 cost of these tax cuts is also $486M. (These new tax cuts will be discussed in Part III.)
14

($ millions) FY 2015 FY 2016 FY 2017 FY 2018
Mid-Year Budget Gap Estimate -$1,742 -$2,889 -$2,948 -$3,887 -$11,466
Tax and Other Resource Changes $286 $31 -$153 -$129 Surplus Available from FY 2014 $310
Total Specified Spending Cuts -$1,982 -$2,684 -$3,257 -$3,446 -$11,369 Agency Operations spending cuts -$358 -$708 -$990 -$1,342 Local Assistance spending cuts -$1,624 -$1,976 -$2,267 -$2,104
Savings on Capital Projects & Debt Management -$116 -$110 -$118 -$158 -$502Initiatives (new spending proposals) $156 $232 $394 $499 $1,281
Adherence to 2% State Operating Funds Spending Benchmark * [resulting in substantial uspecified spending cuts beyond that needed to close the budget gap] -$1,685 -$2,367 -$3,618 -$7,670
TOTAL SPENDING CUTS (specified plus unspecified) -$1,982 -$4,369 -$5,624 -$7,064 -$19,039
SURPLUS BEFORE NEW TAX CUT PROPOSALS Mid-year budget gap + tax and other resource changes + spending cuts + savings on capital - new initiatives $486 $1,389 $2,247 $2,707 $6,829
NEW TAX CUT PROPOSALS -$486 -$1,234 -$2,082 -$2,534 -$6,336
SURPLUS AFTER NEW TAX CUT PROPOSALS $0 $155 $165 $173 $493
Source: FPI analysis based on NYS Division of the Budget, FY 2015 Executive Budget Financial Plan , p. 23.
Cumulative 2015-2018
The proposed FY 2015 Gap Closing Plan cuts spending by $2 billion in 2015, and grows to $7 billion in 2018 in order to make room for substantial new tax cuts.
* FY 2015 Executive Budget: "Savings estimated from limiting annual spending growth in future years to 2 percent. The Governor is expected to propose, and negotiatiate with the Legislature to enact budgets that hold State Operating Funds spending growth to 2 percent. Assumes all savings from holding spending growth are made available to the General Fund."
15
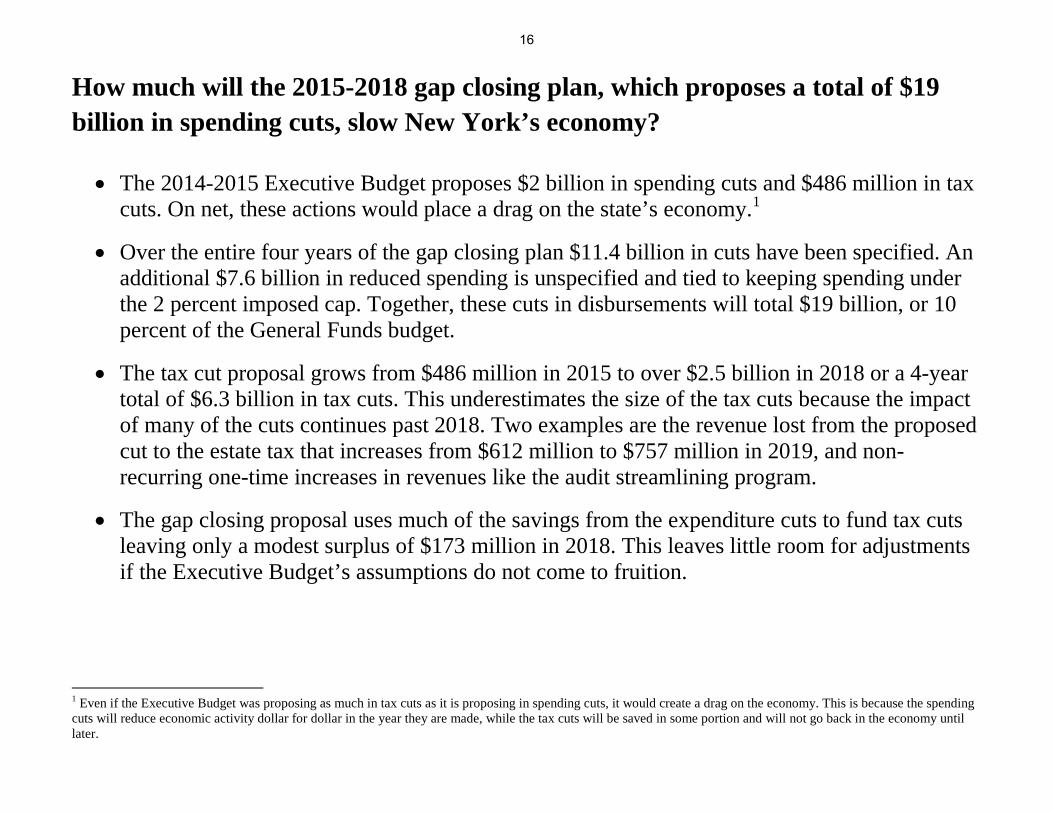
How much will the 2015-2018 gap closing plan, which proposes a total of $19 billion in spending cuts, slow New York’s economy?
• The 2014-2015 Executive Budget proposes $2 billion in spending cuts and $486 million in tax cuts. On net, these actions would place a drag on the state’s economy.1
• Over the entire four years of the gap closing plan $11.4 billion in cuts have been specified. An additional $7.6 billion in reduced spending is unspecified and tied to keeping spending under the 2 percent imposed cap. Together, these cuts in disbursements will total $19 billion, or 10 percent of the General Funds budget.
• The tax cut proposal grows from $486 million in 2015 to over $2.5 billion in 2018 or a 4-year total of $6.3 billion in tax cuts. This underestimates the size of the tax cuts because the impact of many of the cuts continues past 2018. Two examples are the revenue lost from the proposed cut to the estate tax that increases from $612 million to $757 million in 2019, and non-recurring one-time increases in revenues like the audit streamlining program.
• The gap closing proposal uses much of the savings from the expenditure cuts to fund tax cuts leaving only a modest surplus of $173 million in 2018. This leaves little room for adjustments if the Executive Budget’s assumptions do not come to fruition.
1 Even if the Executive Budget was proposing as much in tax cuts as it is proposing in spending cuts, it would create a drag on the economy. This is because the spending cuts will reduce economic activity dollar for dollar in the year they are made, while the tax cuts will be saved in some portion and will not go back in the economy until later.
16
II. Impact of Proposed Spending Cuts 2014-2015
17

Education
Universal Pre-Kindergarten • The Executive Budget proposes to commit $1.5 billion over the next five years to provide universal pre-
kindergarten to New York children.
• This amount represents the cumulative total over five years and not the amount provided in the fifth year of this proposal. This is insufficient to provide high-quality universal pre-kindergarten across the state. New York City Mayor DeBlasio estimates that provision of universal Pre-K in New York City alone would cost $340 million per year. And at the current level of Pre-K in New York, the state and local school districts together spend close to $500 million per year.
School Aid • The budget proposes to freeze the implementation of Foundation Aid and makes a minimal $323 million reduction
in the Gap Elimination Adjustment.
• State aid, as a percentage of total school spending, fell from 40 percent in 2008-2009 to 35 percent or less of school costs in each of the last three years; this is its lowest level in 65 years.
• Six years of austerity budgets in New York State have undone the promise of the Campaign for Fiscal Equity (CFE) settlement legislation and have left school districts just about where they were in 2006-2007, and far behind where they were supposed to be by 2010-2011. In the 2014-15 Executive Budget, proposed total Foundation Aid is $5 billion below what it would have been if this aid had been fully implemented after enactment of the CFE settlement legislation.
• If Governor Cuomo is serious about increasing the statewide average graduation rate, he should support the full implementation of the CFE settlement legislation’s aid increases and its accountability requirements. What we have learned from NCLB at the federal level is that accountability without resources does not work.
18

32%
34%
36%
38%
40%
42%
44%
State Aid as a percent of Total General Fund and Special Aid Fund Expenditures
Even though total elementary and secondary school spending, when adjusted for inflation, has been virtually flat since 2008-2009, state aid as a percentage of those expenditures has fallen to 35% or less since 2010-2011. Including STAR, state revenue fell from almost 47% to 40% since 2008-2009.
Source: New York State Department of Education, Analysis of School Finances in New York State School Districts, January 2014.
19

New York City Albany Brentwood
2006-07: Base Year State Aid
2007-08: First Year
2008-09: Second Year Target
2009-10: Third Year Target
2010-11: Fourth Year Target (Fully Phased-In)
2006-07: Base Year State Aid $5,851.0 $49.2 $161.3
2010-11: Fourth Year Target (Fully Phased-In) $7,918.0 $77.9 $233.8
The "STATE Gap Elimination Adjustment" has been a "Local Gap Creation Adjustment" for the state's school children. Now it is one of the Governor's "STATE Surplus Creation Adjustments."
The 2007 Promise: Foundation Aid Under the Campaign for Fiscal Equity Settlement Legislation
$5,063.4 $42.6 $139.6
$6,061.4 $55.5 $173.3
In millions
$5,533.0 $48.6 $155.5
Foundation Aid, as Enacted
Adjusted for Inflation, 2014 Dollars
$6,707.1 $63.8 $195.1
$7,411.5 $72.9 $218.8
20

New York City Albany Brentwood
Actual Foundation Aid $6,374.4 $57.4 $168.2
Actual Gap Elimination Adjustment (GEA) ($502.6) ($7.6) ($7.5)
Actual Current Bottom Line: Foundation Aid Minus GEA $5,871.9 $49.9 $160.7
New York City Albany Brentwood
$20.8 $0.7 ($0.6)
0.36% 1.35% -0.40%
($2,046.2) ($28.0) ($73.1)
-25.84% -35.98% -31.27%
Actual Situation Now for the 2013-14 School Year
Freezing Foundation Aid and Applying an Across-the-Board Cut Called the Gap Elimination Adjustment: Impact on Children and Taxpayers in Three School Districts
Difference between now and situation in 2006-2007 (2013-14 Foundation Aid Minus GEA VS. Adjusted 2006-07 Base Year State Aid)
Difference between now and where district should be based on objective standards (2013-14 Foundation Aid Minus GEA VS. Adjusted 2010-11 Projected Foundation Aid)
21

50%
62%
71%
73%
80%
92%
48%
63%
72%
74%
81%
92%
49%
65%
73%
75%
83%
93%
53%
65%
74%
76%
84%
94%
50%
65%
74%
77%
85%
94%
40%
50%
60%
70%
80%
90%
100%
High Need Large Cities
High Need Urban-Suburban
Statewide Average High Need Rural Average Need Low Need
Perc
ent o
f stu
dent
s gr
adua
ting
in fo
ur y
ears
2008 2009 2010 2011 2012
New York's statewide graduation rate is a weighted average of many districts with relatively high graduation rates and a smaller number of large districts with very low graduation rates.
Note: The students in the above cohorts started ninth grade four years prior to the cohort year. For example, students in the 2012 cohort started ninth grade in 2008 and graduated in June 2012. Source: New York State Education Department, Graduation Rates: Students Who Started 9th Grade In 2004, 2005, 2006, 2007, and 2008, June 2013.
22

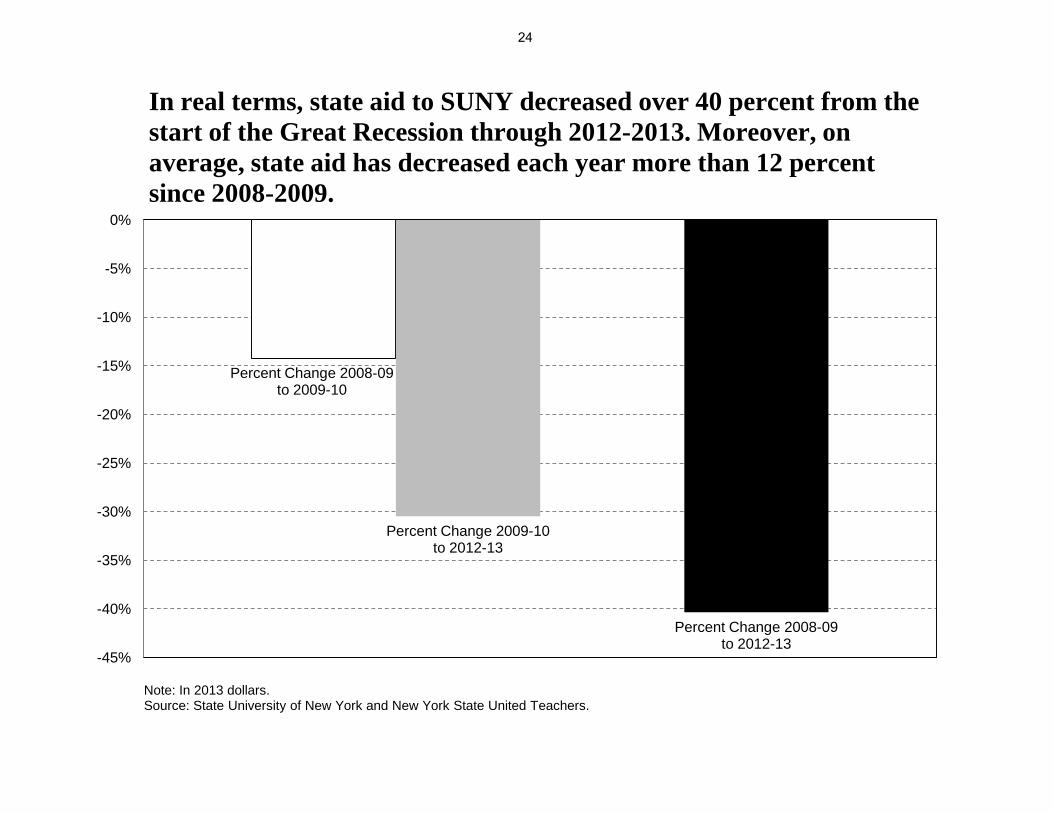
Higher Education • As state aid for SUNY has decreased since 2006-2007, tuition for in-state and out-of-state students
has increased. Adjusted for inflation, state support went down 40 percent from 2008-2009 to 2012-2013. During this same period, in-state tuition went up almost 17 percent, and out-of-state tuition rose more than 28 percent.
• TAP grants have not kept pace with the rising costs of tuition. And even though the Executive Budget provides $8 million in funding for a new tuition scholarship program1, the proposed increase for the total Tuition Assistance Payment program in FY 2014-2015 from the current budget year is two-thirds of one percent.
• Over time, the percentage of total SUNY faculty represented by full-time faculty has gone down while the percentage of part-time faculty has increased. The modest changes from the start of the Great Recession through 2011-2012 (available data) masks the significant decrease in full-time faculty that has occurred over time. From 1995-1996 to 2011-2012, the percentage of full-time faculty decreased by over one-sixth, from over 72 percent of total faculty to less than 60 percent. By contrast, the percentage of part-time faculty increased by almost half, from almost 28 percent of total faculty to 45 percent.
1 The Executive Budget provides $8 million in new funding for a full tuition scholarship program for the top ten percent of high school graduates that pursue degrees and careers in the Science, Technology, Engineering and Math (STEM) sector and commit to work in New York for five years.
23
Percent Change 2008-09 to 2009-10
Percent Change 2009-10 to 2012-13
Percent Change 2008-09 to 2012-13
-45%
-40%
-35%
-30%
-25%
-20%
-15%
-10%
-5%
0%
In real terms, state aid to SUNY decreased over 40 percent from the start of the Great Recession through 2012-2013. Moreover, on average, state aid has decreased each year more than 12 percent since 2008-2009.
Note: In 2013 dollars. Source: State University of New York and New York State United Teachers.
24

140,000
150,000
160,000
170,000
180,000
190,000
200,000
210,000
220,000 19
85
1986
1987
1988
1989
1990
1991
1992
1993
1994
1995
1996
1997
1998
1999
2000
2001
2002
2003
2004
2005
2006
2007
2008
2009
2010
2011
2012
2013
Num
ber o
f ful
l tim
e eq
uiva
lent
(FTE
) em
ploy
ees
The modest overall reduction in state government staffing reported in the 2014-2015 Executive Budget masks substantial cuts and dislocations and comes on the heels of a 30 percent reduction in staffing between the late 1980s and 2013.
Note: Uses a four-quarter moving average; excludes SUNY & CUNY. Source: New York State Office of the State Comptroller.
25

State Fiscal Year New York CPI General Fund Special Revenue Funds Total
1989-90 130.0 $9,049.4 $5,173.8 $14,223.2
1994-95 155.3 $7,224.8 $6,030.8 $13,255.6
2005-06 208.1 $6,736.9 $5,840.6 $12,577.5
2006-07 215.2 $7,596.0 $5,598.6 $13,194.6
2007-08 222.0 $7,372.4 $5,750.8 $13,123.2
2008-09 228.9 $6,621.2 $6,914.1 $13,535.3
2009-10 230.1 $7,061.1 $7,257.2 $14,318.3
2010-11 233.9 $6,463.2 $7,305.9 $13,769.1
2011-12 241.2 $5,885.9 $7,022.5 $12,908.5
2012-13 245.7 $6,129.7 $6,881.9 $13,011.6
2013-14 249.5 $5,618.3 $7,220.8 $12,833.2
2014-15 254.1 $5,684.9 $7,092.8 $12,874.4
2015-16 259.6 $5,677.7 $7,084.1 $13,055.2
2016-17 265.9 $5,508.9 $6,936.7 $12,880.9
2017-18 272.6 $5,374.3 $6,811.4 $12,566.2
-$3,431.2 $2,047.0 -$1,390.1
-$244.0 -$409.4 -$267.0
Source: Estimates for 2014-2015 and projections for 2015-2016 through 2017-2018 are from the 2014-2015 Executive Budget. Historical data is from the NYS Office of the State Comptroller's annual reports to the Legislature on the cash basis of accounting.
Since 1990, New York State's expenditures for employee wages and salaries have declined in real terms by almost $1.4 billion. By 2017-2018, inflation-adjusted expenditures are projected to decrease by another $267 million.
Personal Service expenditures in millions of SFY 2013 dollars
2013-14 to 2017-18 Change
1989-90 to 2013-14 Change
26

-6.8%
-12.3%
-40.3%
-33.0%
-1.8%
4.1%
-5.5%
0.7%
25.0%
-6.6%
-19.1%
-13.8%
-50%
-40%
-30%
-20%
-10%
0%
10%
20%
30%
Total OCFS HCR DHR DOL OTDA
Percent change from FY 2011 to FY 2014
Percent change from FY 2014 to FY 2018
The Executive Budget projects a decrease of almost 5.5 percent from current state spending for social welfare through FY 2018. This is before the Governor's second round of budget cuts for the out-years and on top of a 7 percent reduction in state spending for these services since the Governor took office.
Note: Adjusted for inflation, 2013 dollars. Includes the following agencies: Office of Children and Family Services, Division of Housing and Community Renewal, Division of Human Rights, Department of Labor, Office of Temporary and Disability Assistance. Source: Executive Budget Financial Plan, FYs 2012-2013, 2013-14, 2014-2015.
27

Human Services Actions Proposed in the Executive Budget Housing
The Executive Budget provides significant funding for housing by maintaining or expanding the following programs:
State Spending, in millions FY 2013-14 FY 2014-15 Percent change Homeless Housing Assistance Program (capital development) $30 $63 + 110.0% Housing Trust Fund $32.2 $46.7 + 45.0% Homeless Housing Prevention Services Program $30.3 $30.3 0
MRT Supportive Housing Fund $86 $100 + 16.3%
Federal Spending, in millions Housing Trust Fund Corporation (capital development) 0 $100 New (‘Sandy’ funds)
• However, the discontinued funding by New York State of the New York City Advantage Voucher
program, as of FY 2012-2013, has precluded access to rent assistance by homeless families that would have otherwise enabled these families to move from shelters to permanent housing.
• Also, current and proposed funding for the Division of Homes and Community Renewal Tenant Protection Unit is $5.7 million. This is insufficient to address the existing level of tenant abuse in New York City.
28
Child Care
• The Executive Budget proposes an increase of $85 million to approximately $245 million in state spending for child care subsidies to counteract the $64 million reduction from $374 million to $310 million in federal Temporary Assistance for Needy Families (TANF) block grant dollars for this purpose. The resulting net increase of $21 million in General Fund spending will be used to meet the increase in market rates for child care.
• This level of funding is not sufficient to meet the needs of the approximately 600,000 eligible children in New York State (in families with incomes under 200% of the federal poverty level) for such assistance. Even though up to half of these children may not use a subsidy, only 129,700 subsidies were available in 2012. Since TANF public assistance recipients are automatically eligible for child care subsidies, shortages of child care funding reduce the availability of subsidies for the working poor. In response, a number of counties have lowered eligibility thresholds in order to reduce the number of families that qualify for this support.
29

Other Human Services Programs
• Defunded Programs
o OTDA-Administered ‘TANF’ Initiatives – $18.5 million (federal TANF block grant dollars) for 20 programs including the Nurse-Family Partnership program, Non-Residential Domestic Violence Services, and Advanced Technology Training and Information Networking (ATTAIN).
o OCFS-Administered Community Initiatives - $7.7 million for 14 programs including Community Reinvestment and Safe Harbor for Sexually Exploited Children.
• Funding Reductions
o Advantage After-School Program - $500,000: decrease from $17.75 to $17.25 million. o Youth Development and Delinquency Program - $1.3 million: decrease from $15.4 to $14.1
million. o Child Advocacy Centers - $750,000: reduction from $5.98 to $5.23 million. o DOL-Administered Community Initiatives – total decrease of $8.6 million for various programs
including the Displaced Homemakers Program (some programs eliminated). o Low-Income Housing Trust Fund Program –$500,000: decrease from $3 to $2.5 million.
30

Other Human Services Programs (continued)
• Other
o Summer Youth Employment Program – even though funding for this program increases 10% to $27.5 million in the FY 2014-2015 budget, this may not be sufficient to serve the same number of youth as currently given the increase in the minimum wage.
o Open-ended Preventive Funding – the state share of this program to prevent foster care placement of children decreased in the current budget year from 65% to 62%; counties would be able to serve more families if the state share returned to its former level.
o Deferment of the Human Services cost-of-living-adjustment of 2 percent in FY 2014-2015 – this is the sixth year of deferment and results in difficulties for providers to meet the increase in the minimum wage.
31

Health and Medicaid • The Executive Budget proposes to continue the Medicaid Global Cap through SFY 2015-2016 and to distribute
‘available’ Medicaid Global Cap savings to Medicaid providers. Medicaid spending growth is limited to the 10-year rolling average of the medical component of the CPI, currently 3.8 percent.
• New York is expected to receive the following additional funding: o $2 billion during FY 2014-2015 (total $10 billion over five years), as a result of the Federal Medicaid Waiver.
This will be used for alternative care models, primary care access and health workforce development. o $2 billion during FY 2013-2014 through FY 2016-2017, due to the Affordable Care Act’s enhanced matching
rates for single childless adults on Medicaid; local districts, or counties, will receive $875 million during this same period.
• The Executive Budget proposes creation of the Basic Health Program (BHP) that will provide health insurance
coverage to people with incomes between 133 and 200 percent of the federal poverty level. o Approximately 600,000 people would likely enroll, including 200,000 legal immigrants for whom the state
presently pays full costs of care. The ACA-authorized BHP would provide coverage for these individuals along with a federal share of costs. While estimates are not available yet, State savings from this shift are expected. However, individuals who enroll for coverage under BHP instead of New York’s marketplace exchange may reduce the pool of ‘covered lives’ there affecting premium costs for all.
• The current Executive Budget proposal for consolidation of 36 health and awareness programs into 10 pools of
similarly-comprised programs maintains the current total level of funding for these programs. While any funding shifted within these pools would impact relevant programs, this structure may increase flexibility for human service providers.
32

Local Government Assistance Counties
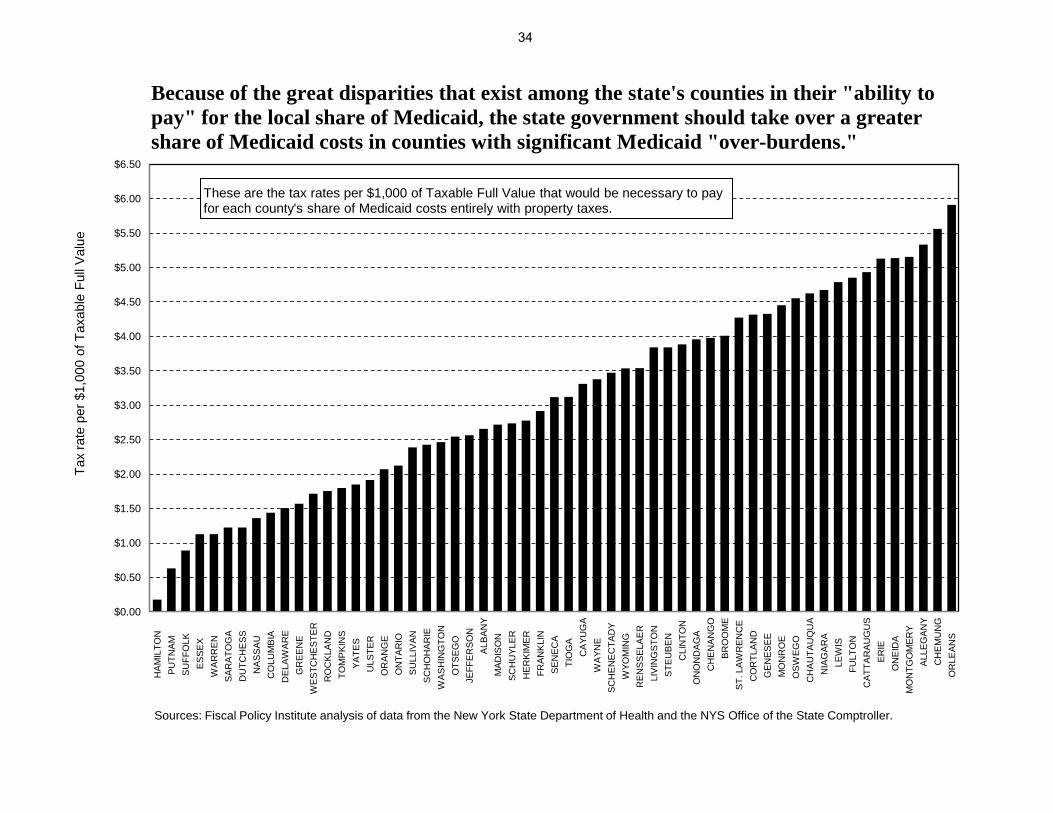
• The state’s counties vary greatly in terms of the local property tax effort necessary to cover the local share of Medicaid costs. Some counties simply have much less taxable value per capita and per needy resident than do others. The cap in the growth of local Medicaid costs institutionalizes this inequity.
• Counties’ share of public assistance benefit costs for the state and locally-funded Safety Net Assistance program is imposing greater costs on local social services districts (or counties, with the exception of New York City which is the local social service district for the five counties which compose it) since the local share of these costs was increased from 50 percent to 71 percent three years ago.
• In SFY 2014-2015, the counties and New York City will receive $2 billion in relief as the result of the 3% Medicaid growth cap, together with the state’s further takeover of all the growth in counties’ Medicaid expenditures and the state’s assumption of the local share of Family Health Plus costs.
Cities, Towns and Villages
• While counties have received some fiscal relief, school districts and general purpose municipalities also have service obligations. It is good that the state has provided relief to counties in the form of taking over growth in their Medicaid costs, but this does not make up for cuts in school aid and revenue-sharing, the unrestricted aid that cities, towns and villages receive from the state (now Aid and Incentives for Municipalities, AIM). So we need effective property tax relief for all classes of local governments.
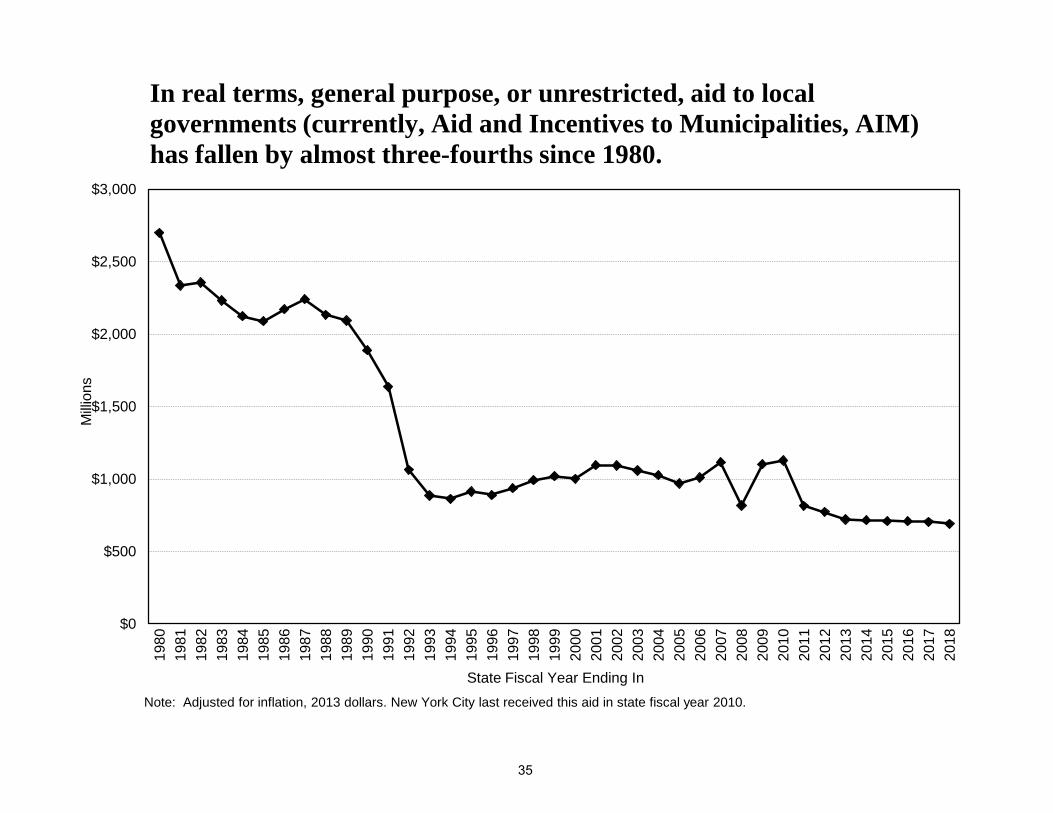
• Even without adjusting for inflation, revenue-sharing in FY 2012-2013 was lower than in FY 1979-1980; $721 million and $829 million respectively. Taking into account changes in the cost of living, the decrease is much more dramatic; total revenue-sharing in 1980 was $2.7 billion compared to $721 million in 2012-2013.
• Of the total $715 million AIM allocation proposed in the FY 2014-2015 budget, cities receive 90.5 percent, towns receive 6.7 percent and villages receive 2.7 percent of funds.
33
$0.00
$0.50
$1.00
$1.50
$2.00
$2.50
$3.00
$3.50
$4.00
$4.50
$5.00
$5.50
$6.00
$6.50 H
AM
ILTO
N
P
UTN
AM
S
UFF
OLK
ES
SE
X
WA
RR
EN
S
AR
ATO
GA
DU
TCH
ES
S
N
AS
SA
U
CO
LUM
BIA
DE
LAW
AR
E
G
RE
EN
E
WE
STC
HE
STE
R
RO
CK
LAN
D
TO
MP
KIN
S
YA
TES
U
LSTE
R
OR
AN
GE
O
NTA
RIO
SU
LLIV
AN
SC
HO
HA
RIE
WA
SH
ING
TON
OTS
EG
O
JEFF
ER
SO
N
A
LBA
NY
MA
DIS
ON
SC
HU
YLE
R
H
ER
KIM
ER
FRA
NK
LIN
SE
NE
CA
TI
OG
A
CA
YUG
A
WA
YNE
S
CH
EN
EC
TAD
Y
WYO
MIN
G
R
EN
SS
ELA
ER
LIV
ING
STO
N
S
TEU
BE
N
C
LIN
TON
O
NO
ND
AG
A
C
HE
NA
NG
O
BR
OO
ME
S
T. L
AW
RE
NC
E
CO
RTL
AN
D
G
EN
ES
EE
MO
NR
OE
O
SW
EG
O
CH
AU
TAU
QU
A
NIA
GA
RA
LEW
IS
FULT
ON
C
ATT
AR
AU
GU
S
ER
IE
ON
EID
A
MO
NTG
OM
ER
Y
ALL
EG
AN
Y C
HE
MU
NG
O
RLE
AN
S
Tax
rate
per
$1,
000
of T
axab
le F
ull V
alue
These are the tax rates per $1,000 of Taxable Full Value that would be necessary to pay for each county's share of Medicaid costs entirely with property taxes.
Sources: Fiscal Policy Institute analysis of data from the New York State Department of Health and the NYS Office of the State Comptroller.
Because of the great disparities that exist among the state's counties in their "ability to pay" for the local share of Medicaid, the state government should take over a greater share of Medicaid costs in counties with significant Medicaid "over-burdens."
34
$0
$500
$1,000
$1,500
$2,000
$2,500
$3,000
1980
19
81
1982
19
83
1984
19
85
1986
19
87
1988
19
89
1990
19
91
1992
19
93
1994
19
95
1996
19
97
1998
19
99
2000
20
01
2002
20
03
2004
20
05
2006
20
07
2008
20
09
2010
20
11
2012
20
13
2014
20
15
2016
20
17
2018
Milli
ons
State Fiscal Year Ending In
In real terms, general purpose, or unrestricted, aid to local governments (currently, Aid and Incentives to Municipalities, AIM) has fallen by almost three-fourths since 1980.
Note: Adjusted for inflation, 2013 dollars. New York City last received this aid in state fiscal year 2010.
35

0
1,000
2,000
3,000
4,000
5,000
6,000
1980
1981
1982
1983
1984
1985
1986
1987
1988
1989
1990
1991
1992
1993
1994
1995
1996
1997
1998
1999
2000
2001
2002
2003
2004
2005
2006
2007
2008
2009
2010
2011
2012
2013
Milli
ons
Shortfall in aid from the 8% of total state tax collections standard
Unrestricted aid to local governments
As a percentage of total state tax collections, unrestricted aid to local governments, now AIM, has decreased by more than 80 percent since 1989. Cumulative funded aid since that time represents only one-third of what cumulative aid would have been if New York met the former 8 percent of total state tax collections 'standard'.
Note: Adjusted for inflation, 2013 dollars. New York City last received this aid in state fiscal year 2010.
36

III. Governor’s Tax Policy Proposals
37

(in millions)2014‐15 2015‐16 2016‐17 2017‐18 Cumulative
Personal Income Tax $ (325) $ (735) $ (1,248) $ (1,658) (3,966)$ Close the Resident Trust Loophole 75 225 150 150 600 Establish the Real Property Tax Freeze Personal Income Tax Credit (400) (976) (475) - (1,851) Establish the Residential Real Property Personal Income Tax Credit - (200) (525) (1,000) (1,725) Establish a Renter's Personal Income Tax Credit - (200) (400) (400) (1,000) Other - 416 2 (408) 10
Business Taxes $ 67 $ (118) $ (271) $ (267) (589)$ Streamline Corporate Audit Procedures (Administrative)* - 172 172 172 516 Reform the Investment Tax Credit 65 65 65 65 260 Repeal the Financial Services Investment Tax Credit 30 30 30 30 120
Subtotal Total Business Tax Increases 95 267 267 267 896 Corporate Tax Reform - (205) (346) (346) (897)
Establish a 20 Percent Real Property Tax Credit For Manufacturers - (136) (136) (136) (408)
Eliminate the Net Income Tax On Upstate Manufacturers (24) (24) (25) (25) (98)
Subtotal Other Business Tax Decreases (24) (365) (507) (507) (1,403)Other Business Tax Cuts (4) (20) (31) (27) (82) Other Actions $ (40) $ (183) $ (375) $ (612) (1,210)$ Reform the Estate Tax** (33) (175) (371) (612) (1,191) Other (7) (8) (4) - (19)
Total All Funds Legislation Change $ (298) $ (1,036) $ (1,894) $ (2,537) $ (5,765)
* After 2018, the streamline audit saving will sunset and not reoccur.** Estate Taxes continue to rise in the outyears, in 2019 these cuts will be 757 millionSource: 2014-15 Executive Briefing Book (p. 67) and FPI calculations.
The tax freeze is ill-conceived and will send more money to wealthier localities, the circuit breaker and the renter's credit are ineffectively targeted, the bank tax repeal is a windfall for large banks, and New York simply can’t afford costly estate tax cuts.
38

There is a real question whether New York can afford sizable multi-year tax cuts while enduring 4 more years of austerity budgets on top of the past 6. In addition, the specific tax changes proposed are all highly problematic.
• We will discuss the proposed tax cuts in three categories: o A real property tax “freeze” as a personal income tax credit o Two personal income tax credits, with one geared to provide property tax relief to low- and
middle-income homeowners (defined as those with total incomes up to $200,000), and the other geared to renters with federal adjusted gross incomes up to $100,000
o Repeal of the bank tax and other business tax cuts, and a substantial estate tax reduction
• The 2-year property tax “freeze” costs $1.8 billion over the next three fiscal years. It adds a perverse incentive to the pressure already created by the statewide 2% property tax cap enacted 3 years ago. This pressure already has forced drastic cuts in schools and other important public services. Under the new proposal, a homeowner only gets an income tax credit in the first year for taxes levied by jurisdictions that stay within the 2 percent property tax cap. In the second year, local governments or school districts must continue to stay within the cap and must develop a plan for sharing or consolidating services to achieve savings.
• Because the property tax cap is instituted as a percentage limit on the growth of a locality’s tax levy, the property tax increases possible under the cap are greater for wealthy school districts than for needy school districts. Under the freeze proposal, benefits likely will be concentrated in wealthier districts. Poor and rural governments will receive less because they have greater needs, smaller tax bases and fewer opportunities for consolidation.
39
Household income range Less than 10% of income
10% to 19.99% of income
20% or more of income**
10% or more of income
Total number of households in income range
$50,000 or less 539,479 250,948 237,677 488,625 1,028,104
$25,000 or less 152,513 101,865 153,013 254,878 407,391
Above $25,000 but not above $50,000 386,966 149,083 84,664 233,747 620,713
Above $50,000 but not above $100,000*** 832,026 N/A N/A 213,667 1,045,693
TOTAL: All $100,000 or less 1,371,505 N/A N/A 702,292 2,073,797
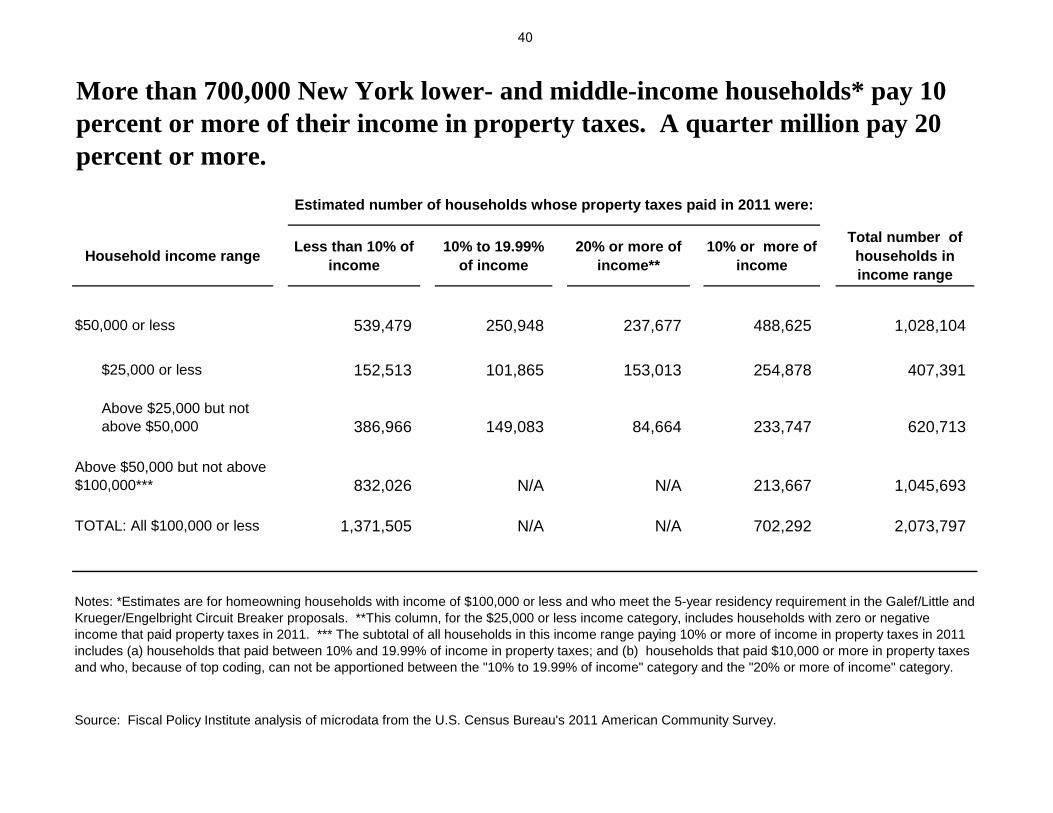
More than 700,000 New York lower- and middle-income households* pay 10 percent or more of their income in property taxes. A quarter million pay 20 percent or more.
Estimated number of households whose property taxes paid in 2011 were:
Source: Fiscal Policy Institute analysis of microdata from the U.S. Census Bureau's 2011 American Community Survey.
Notes: *Estimates are for homeowning households with income of $100,000 or less and who meet the 5-year residency requirement in the Galef/Little and Krueger/Engelbright Circuit Breaker proposals. **This column, for the $25,000 or less income category, includes households with zero or negative income that paid property taxes in 2011. *** The subtotal of all households in this income range paying 10% or more of income in property taxes in 2011 includes (a) households that paid between 10% and 19.99% of income in property taxes; and (b) households that paid $10,000 or more in property taxes and who, because of top coding, can not be apportioned between the "10% to 19.99% of income" category and the "20% or more of income" category.
40

How “Circuit Breaker” credits work and why they make sense. • A property tax Circuit Breaker is a targeted form of property tax relief. It provides relief to households on
the basis of the household’s property tax bill (or, its property tax equivalent, for a household that rents its primary residence) and the household’s income and the relationship between those two factors.
• The name “Circuit Breaker” is used to describe this type of tax credit since it works to prevent households from being overburdened by property taxes just as an electrical circuit breaker interrupts the flow of current when a circuit becomes overloaded.
• A statute establishing a property tax Circuit Breaker has several key elements. o It sets an “affordability threshold” as a percentage of a household’s income and it usually defines
income very broadly to include all the income available to a household to pay its property taxes. o It sets a “credit percentage” and provides for a credit equal to that “credit percentage” times the
portion of the household’s property taxes in excess of the “affordability threshold” percentage of its income. By not providing a credit for 100% of a household’s property tax overburden, households still have a stake in the efficiency and effectiveness of their local governments. But setting the credit percentage too low undercuts the ability of the circuit breaker to provide a meaningful amount of relief to those households that are truly overburdened.
o It can set a residency requirement (such as the 5-year residency requirement in the most widely supported legislative bills) to ensure that the existence of the Circuit Breaker does not encourage people to buy homes or rent apartments that they cannot afford while still ensuring that relief is available for households whose property taxes have become an inordinate share of their income through no fault of their own because of losing a job or becoming disabled or becoming too old to work.
41
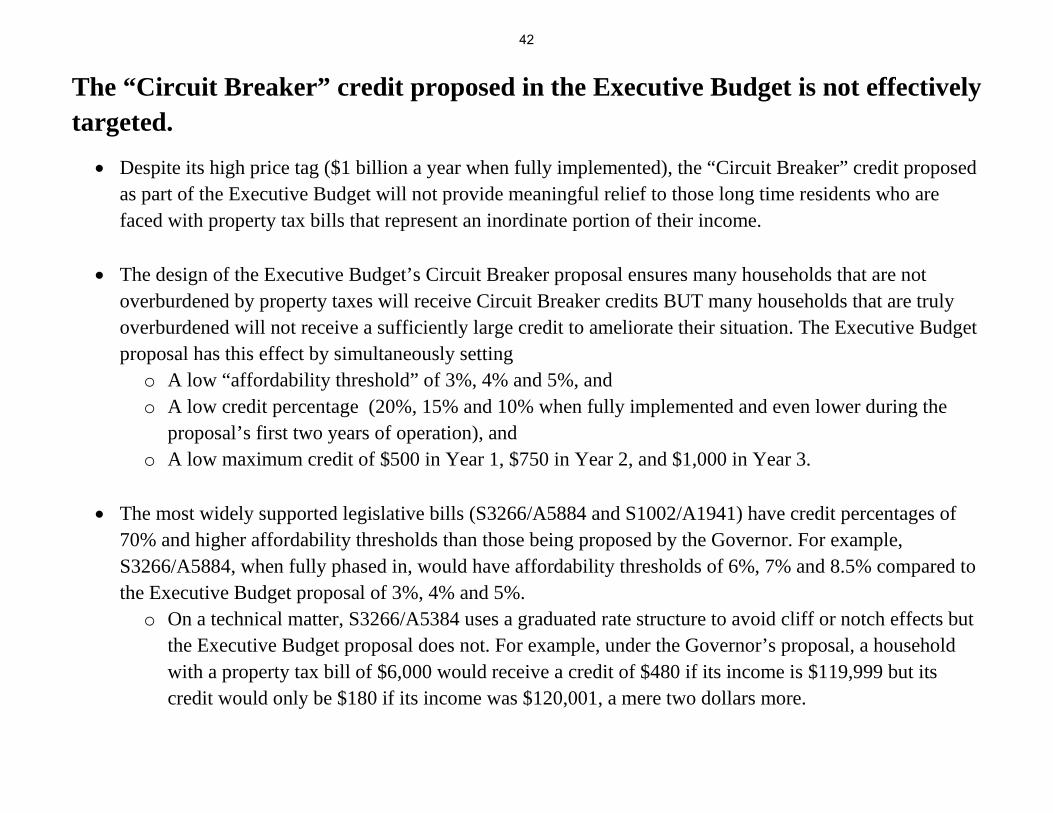
The “Circuit Breaker” credit proposed in the Executive Budget is not effectively targeted.
• Despite its high price tag ($1 billion a year when fully implemented), the “Circuit Breaker” credit proposed as part of the Executive Budget will not provide meaningful relief to those long time residents who are faced with property tax bills that represent an inordinate portion of their income.
• The design of the Executive Budget’s Circuit Breaker proposal ensures many households that are not overburdened by property taxes will receive Circuit Breaker credits BUT many households that are truly overburdened will not receive a sufficiently large credit to ameliorate their situation. The Executive Budget proposal has this effect by simultaneously setting
o A low “affordability threshold” of 3%, 4% and 5%, and o A low credit percentage (20%, 15% and 10% when fully implemented and even lower during the
proposal’s first two years of operation), and o A low maximum credit of $500 in Year 1, $750 in Year 2, and $1,000 in Year 3.
• The most widely supported legislative bills (S3266/A5884 and S1002/A1941) have credit percentages of
70% and higher affordability thresholds than those being proposed by the Governor. For example, S3266/A5884, when fully phased in, would have affordability thresholds of 6%, 7% and 8.5% compared to the Executive Budget proposal of 3%, 4% and 5%. o On a technical matter, S3266/A5384 uses a graduated rate structure to avoid cliff or notch effects but
the Executive Budget proposal does not. For example, under the Governor’s proposal, a household with a property tax bill of $6,000 would receive a credit of $480 if its income is $119,999 but its credit would only be $180 if its income was $120,001, a mere two dollars more.
42

The “Renter’s Credit” proposed in the Executive Budget is even more poorly targeted.
• Rather than including renters in the proposed circuit breaker credit through the establishment of a “property tax equivalent” similar to the one included in New York State’s decades old low-income Circuit Breaker credit (see the New York State tax form IT-214 and the accompanying instructions), the Executive Budget proposes a stand- alone renter’s credit. In Circuit Breaker statutes, the property tax equivalent for renters is usually established as a percentage of a household’s rent.
• While the Executive Budget calls its proposal a “Renter’s Credit,” the determination of a household’s credit under this proposal would not take the amount of rent paid by the household into consideration in any way, let alone by a comparison to the household’s income. The amount of a taxpayer’s credit is based on his or her, age and number of dependents for federal income tax purposes. Taxpayers younger than 65 are not eligible unless they have more than one dependent.
• By using Federal Adjusted Gross Income as the measure of income for determining eligibility for this credit, rather than a broader definition of income as in the circuit breaker, this Executive Budget proposal leaves open the possibility that high income households with income that is not included in FAGI will benefit.
• Victor Bach, Senior Housing Policy Analyst for the Community Service Society, in testimony prepared for the joint legislative budget hearings, characterized the renter’s credit as “an arbitrary ‘scattershot’ approach to rent relief that is unrelated to household need—something nearly for everyone, like STAR, a squandering of scarce state resources on an unidentified problem.”
• Based on this and numerous other technical policy and technical shortcomings, Bach recommends a “circuit breaker” approach to rent relief which scales the benefit in proportion to need and that integrates rent relief into a comprehensive circuit breaker approach that includes homeowner relief.
43

Affordability Threshold
Credit Percentage
Maximum Credit
Affordability Threshold
Credit Percentage
Maximum Credit
$0 - $100,000 3% 20% $1,000 6% 70% $5,000
$100,000 - $120,000 3% 20% $1,000 7% 70% $5,000
$120,000 - $150,000 4% 15% $1,000 7% 70% $5,000
$150,000 - $200,000 5% 10% $1,000 8.5% 70% $5,000
$200,000 - $250,000 - - - 8.5% 70% $5,000
$250,000 and above - - - - - -
Inco
me
Bra
cket
sThe Executive Budget's proposed Circuit Breaker is not effectively targeted.
Comparison of Parameters of Executive Budget Circuit Breaker and Composite of Most Widely Supported Legislative Proposals (S3266, A5834, S1002, A1941), When Fully Phased-In
Executive Budget Proposal Brackets From S3266/A5834 and Maximum Credit From S1002/A1941
44
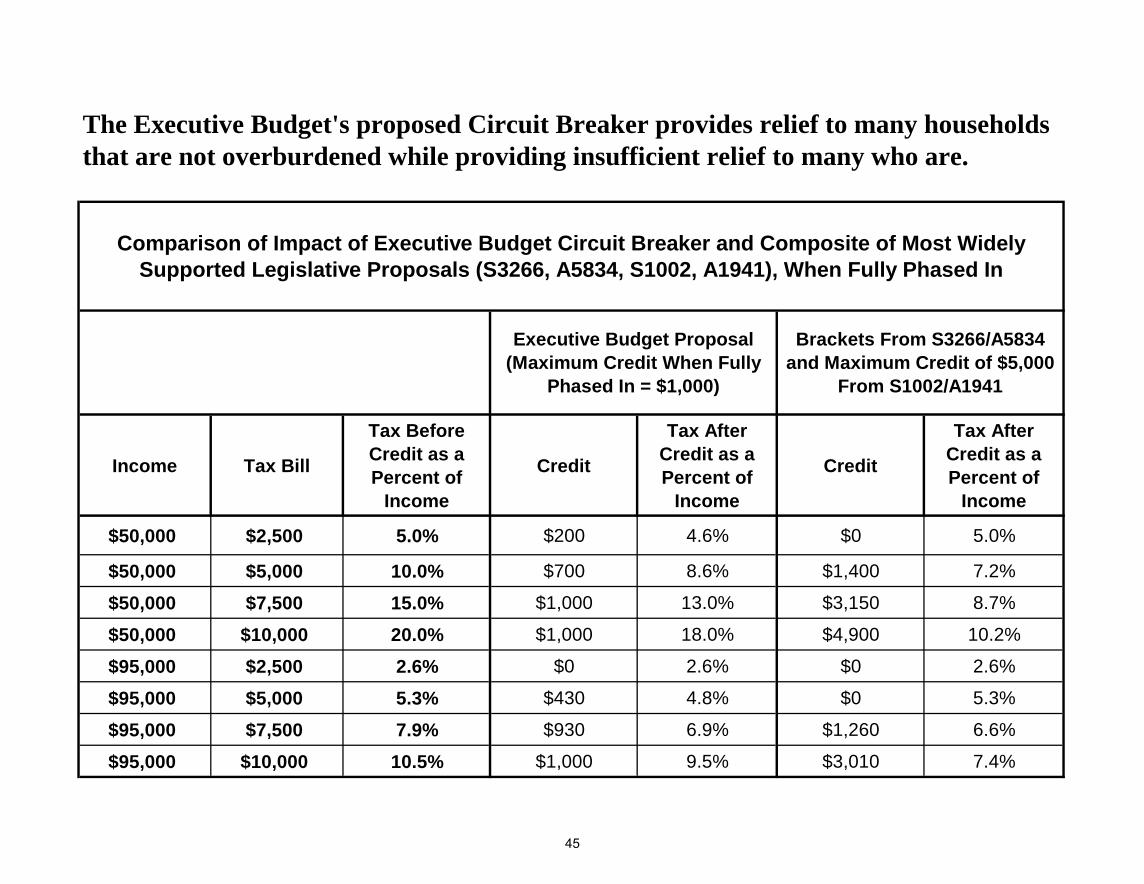
Income Tax Bill
Tax Before Credit as a Percent of
Income
Credit
Tax After Credit as a Percent of
Income
Credit
Tax After Credit as a Percent of
Income
$50,000 $2,500 5.0% $200 4.6% $0 5.0%
$50,000 $5,000 10.0% $700 8.6% $1,400 7.2%
$50,000 $7,500 15.0% $1,000 13.0% $3,150 8.7%
$50,000 $10,000 20.0% $1,000 18.0% $4,900 10.2%
$95,000 $2,500 2.6% $0 2.6% $0 2.6%
$95,000 $5,000 5.3% $430 4.8% $0 5.3%
$95,000 $7,500 7.9% $930 6.9% $1,260 6.6%
$95,000 $10,000 10.5% $1,000 9.5% $3,010 7.4%
Comparison of Impact of Executive Budget Circuit Breaker and Composite of Most Widely Supported Legislative Proposals (S3266, A5834, S1002, A1941), When Fully Phased In
The Executive Budget's proposed Circuit Breaker provides relief to many households that are not overburdened while providing insufficient relief to many who are.
Executive Budget Proposal (Maximum Credit When Fully
Phased In = $1,000)
Brackets From S3266/A5834 and Maximum Credit of $5,000
From S1002/A1941
45

The “corporate tax reform” component of the Governor’s multi-year tax cut package will cost roughly $400M a year when fully phased in.
• The key elements of the tax program affecting business taxes, include:
o Corporate tax reform: -$346M in 2017-2018
Main component is repeal of the bank tax and switching banks to the Corporation Franchise Tax. This enables the large NYC-based banks to benefit from the Single Sales Factor net income allocation basis.
Reduce corporate tax rate from 7.1% to 6.5%, effective for tax year 2016. The MTA receives roughly $1B a year levied as a surcharge on businesses operating in the MTA area. The
surcharge rate will be raised to maintain the amount of MTA funding.
o Tax cuts targeted to manufacturers: -$161M in 2017-2018
The corporate income tax rate would be reduced to zero for upstate manufacturers, and manufacturers statewide would receive a refundable 20% real property tax credit.
o Changes that raise revenues: +$267M in 2017-2018 (but dropping to $95M in 2018-2019)
Streamline corporate audit procedures: changes intended to improve voluntary compliance will effectively
accelerate the receipt of taxes that otherwise would be collected during audits in subsequent years. This affects the timing of collections, but doesn’t raise taxes.
The tax proposal includes reforming the general Investment Tax Credit (ITC) to save $65M a year, and repealing the financial services ITC to save $30M annually.
• Even before this new round of business tax cuts, total state business tax collections have fallen dramatically as a share of total state taxes. See the chart on the next page. Current tax forecasts, assuming the implementation of the proposed cuts, will reduce the business share of state taxes from 10% in 2013 to 8% in 2017, a level about half of the average that prevailed during most of the 1980s and mid-1990s.
• Projected corporate and bank tax collections for 2014-2015 are forecast to decline by several hundred million dollars because of the “payback” of business tax credits that were deferred during the years 2010-2012 to provide the state with temporary budget relief.
46
Is it justifiable to further reduce New York’s corporate income taxes?
• The Governor’s Tax Reform and Fairness Commission, chaired by investment banker Peter Solomon and former Comptroller H. Carl McCall, closely examined the burgeoning array of New York’s business tax incentives. An in-depth analysis prepared for the Commission by economists Don Boyd and Marilyn Rubin documented the explosion in credits from 33 in 2005 to 50 in 2013, with the annual cost of business tax credits rocketing from $600M in 2005 to nearly three times that, $1.7B, in 2013. [see “New York State Business Tax Credits: Analysis and Evaluation,” November 2013, at www.pjsolomon.com/news/media/2013-11-13-Tax_Incentive_Study_Final.pdf]
• Among other findings of the Boyd-Rubin report: o Business tax credits adjusted for inflation were 9 times larger in 2013 than 20 years earlier in
1994; o Benefits are highly concentrated among a small number of firms—only 1 percent of general
corporation tax filers are credit users. Lower taxes for some businesses mean higher effective tax rates for the vast majority of taxpayers;
o Despite the high and growing cost, New York’s tax credits are “rarely evaluated rigorously and independently against their goals;”
o Refundable credits accounted for 92% of all credits in 2013. Under a refundable tax credit, if the benefit exceeds the business’ tax liability, the state writes a check to the business for the difference. The state has been busy writing more and more such checks.
• Boyd and Rubin also emphasize that despite the sharp rise in the cost of New York’s business tax credits, “there is no conclusive evidence from research studies conducted since the mid-1950s to show that business tax incentives have an impact on net economic gains to the states above and beyond the level that would have been attained absent the incentives.”
• It is no surprise that the Solomon-McCall Tax Reform and Fairness Commission recommended that New York curtail the use of business tax credits.
47

7%
8%
9%
10%
11%
12%
13%
14%
15%
16%
17% 19
80
1981
19
82
1983
19
84
1985
19
86
1987
19
88
1989
19
90
1991
19
92
1993
19
94
1995
19
96
1997
19
98
1999
20
00
2001
20
02
2003
20
04
2005
20
06
2007
20
08
2009
20
10
2011
20
12
2013
NYS
cor
pora
te ta
x re
venu
e as
a p
erce
nt o
f tot
al N
YS ta
x re
venu
e
Note: Includes bank tax, insurance tax, corporate franchise tax, and corporations & utilities tax. Source: New York State Department of Taxation and Finance; U.S. Bureau of Economic Analysis (NYS GDP data).
State corporate tax revenues have also declined significantly as a share of total state tax revenues.
48

$0
$200
$400
$600
$800
$1,000
$1,200
$1,400
$1,600
$1,800
$2,000
Note: Actual data 1994-2010, New York State Department of Tax and Finance; 2011 to 2014 estimated jointly by the NYS Department of Tax and Finance and the New York State Division of the Budget, subject to revision. Source: Marilyn M. Rubin and Donald J. Boyd, New York State Business Tax Credits: Analysis and Evaluation, A Report Prepared for the New York State Tax Reform and Fairness Commission, November 2013. Updated Feb. 2014 based on 2014-2015 Tax Expenditure Report.
The Taxpayer Cost of NYS Business Tax Credits Has Tripled since 2005, and Now Exceeds $1.8 billion.
In M
illion
s
49

Bank tax reform provides an unnecessary windfall to the largest banks based in New York
• The rationale behind repealing the bank tax is that financial de-regulation has eliminated most distinctions between commercial and investment banks, and entities historically subject to the bank tax are at a disadvantage since New York adopted single sales factor (SSF) as the basis for apportioning business profits for state tax purposes.
o Banks are currently subject to a 3-factor apportionment basis that includes payroll, deposits and receipts. o If the bank tax is repealed and banks then file under the Corporate Franchise Tax, they would be able to use
SSF (receipts) to apportion net income to New York for tax purposes. o In effect, extending SSF to banks that have a large presence and payroll in New York allows them the
potential to reduce their tax liability if the share of their customer base (by dollar volume) in New York is less than the firm’s payroll share.
• The Budget Division has not indicated how much of the projected tax loss resulting from corporate tax reform is due to the repeal of the bank tax versus reducing the corporate tax rate from 7.1% to 6.5%. It could be that the tax loss associated with bank tax repeal is much greater than the net future-year tax $364M loss because other corporate taxpayers might end up paying more as a result of other changes in the corporate franchise tax.
• A provision of the tax reform legislation submitted by the Governor allows financial institutions to use a “fixed percentage method” in lieu of identifying the address of all their customers under a traditional SSF approach. The legislation specifies the “fixed percentage method” number as 8%, apparently determined by New York’s share of GDP. However, given the fact that New York has such a concentration of financial activities and that many transactions are between financial institutions, 8% seems like a low figure to use as a proxy for the share of financial business transacted in New York. A more appropriate proxy might be New York State’s share of the total securities business nationally—in 2011, that was 39%.
50

Proposed estate tax reductions will cost $800M or more when phased in
• There are three main elements in the estate tax proposal: o Raising the exemption from estate taxation from the current $1 million to $5.25M, the current federal
exemption level; o Reducing the top rate in stages from 16 to 10%; and o Require the value of gifts to be added back to the estate tax (New York State eliminated its gift tax years
ago).
• The estate tax has been generating $800M to $1.2B a year in revenue for New York so a proposal that rises in costs to $612M in 2017-18 and $757M in 2018-19 will seriously erode the estate tax as a significant revenue source for the state. Because of increasing income concentration at the top, in the absence of the proposed reductions in the estate tax, the estate tax would be the fastest growing source of tax revenue for New York State. Before the tax cuts, the estate tax is estimated to double between 2013 and 2019, to $2 billion. The tax cuts will reduce that amount by roughly 40%.
• Because the estate exemption is being raised, all estates paying taxes will pay less. The reduction in the top tax rate from 16 to 10% will be heavily concentrated among a relatively small number (150-200) of very large estates (greater than $10 million.) These large estates likely will see an average tax reduction of $1.5 million or more.
• While the Executive Budget states that “the state’s current estate tax policy encourages elderly New Yorkers to leave …,” in a report prepared for the Solomon-McCall Tax Commission, the state’s own tax policy experts concluded: “Migration studies regarding the impact of taxes such as the estate tax have shown that taxes generally are not a major factor in the decision of where to live or retire. … These papers generally show that taxes have very little impact on cross-state migration and estate tax revenues.”
• As the table on the following page shows, federal tax data clearly indicate that the number and total incomes of millionaires are rising much faster in New York than in the U.S. overall. Thus, it appears that New York’s estate and personal income tax policies are not having a detectable effect in discouraging millionaires from living in New York.
51

2000 2011New York State
Total population 18,976,457 19,465,197 2.6%
Number of tax returns with AGI of $1 millon and over 25,780 38,240 48.3%
Total income on returns of $1 millon and over $85,466,363,000 $139,387,527,000 63.1%
United States
Total population 281,421,906 311,591,917 10.7%
Number of tax returns with AGI of $1 millon and over 241,068 304,118 26.2%
Total income on returns of $1 millon and over $760,954,547,000 $947,002,288,000 24.4%
New York State share of United States
Total population 6.7% 6.2%
Number of tax returns with AGI of $1 millon and over 10.7% 12.6%
Total income on returns of $1 millon and over 11.2% 14.7%
Note: AGI = Adjusted Gross IncomeSource: Tax data from Internal Revenue Service, population from the U.S. Census Bureau.
2000 to 2011
Even though New York's share of U.S. population declined slightly from 2000 to 2011, New York's share of millionaires rose, and the total income of millionaires rose much faster in New York than in the U.S.
52

IV. The Economic and Social Context
53

While we’re in the fifth year of “recovery,” this has been the weakest since the 1930s. Unemployment has started to come down, but pronounced income inequality has restrained growth and recovery in living standards.
• In the context of the weakest national recovery, New York State has fared about average in terms of the growth in jobs, total personal income, and GDP. Statewide job growth has trailed the nation over the last two years, but that is not surprising considering that NYS lost fewer jobs in the downturn so the rebound here is muted. NYS was spared the worst of the national recession largely because of the massive taxpayer-supported financial bailout.
• Unemployment started to recede in 2013 but high and long-term unemployment persists with 500,000 New Yorkers either experiencing long-term unemployment and/or too discouraged to continue looking for work.
• New York City’s job growth is faring much better than the suburbs and upstate. However, most of the net job growth in NYC and around the state has been in low-wage jobs, and low- and middle-income workers everywhere have suffered.
• Federal and state budget austerity policies have sharply reduced government employment with some areas in the Hudson Valley and the Southern Tier seeing 10% declines. Private sector job growth has been weakest in areas where government employment has declined the most.
• Most of the income growth is going to the top while median wages and median family income have fallen and poverty stays high.
54
4.4% 4.2%
7.1%
10.0%
7.5%
9.7%
2.7% 2.7%
11.7%
2.4% 2.3%
4.9%
6.8% 7.0% 6.0%
-1.6% -1.6%
5.2%
-4%
-2%
0%
2%
4%
6%
8%
10%
12%
14%
GDP Personal consumption
Nonresidential investment
Residential investment
Exports Imports (-) Federal govt. expends.
State and local govt. expends.
BLS total nonfarm
employment
Ann
. gro
wth
rate
of r
eal G
DP
and
tota
l gro
wth
in n
onfa
rm e
mpl
oym
ent
Avg. of 5 Prior Recoveries that Ranged in Duration from 54-120 Months Current Recovery (3Q 2009 - 4Q 2013)
Note: * The private residential investment share of GDP in the current recovery is unusually small because of the depressed condition of the housing market. In the early 2000s recovery, the residential investment share of GDP was 5.4 percent. Source: BEA NIPA table 1.5.1 and 1.5.6 for GDP components and BLS CES employment data for total nonfarm employment level.
Average share of selected GDP components in current recovery (2Q 2009 through 4Q 2013): GDP Personal Nonresidential Residential Exports Imports(-) Federal State & local consumption investment investment* govt. expends. govt. expends. 100.0% 68.1% 12.0% 2.8% 12.4% -15.2% 8.1% 11.7%
National economic growth during the first 4-and-a-half years of the current recovery is much slower than the pace of previous recoveries, with weakness across the board and government spending declines the biggest difference.
55

88
90
92
94
96
98
100
102
104
Inde
x D
ec. 2
007
= 10
0
New York State
United States
Percent change in total nonfarm employment
NYS U.S . Dec. 07 - Dec. 09 -3.2% -6.3% Dec. 09 - Dec. 11 2.9% 2.4% Dec. 11 - Dec. 12 0.8% 1.7% Dec. 12 - Dec. 13 1.1% 1.6%
While NYS's job growth trailed the nation's in 2012 and 2013, NYS lost fewer jobs in the recession and now has more jobs than 6 years ago.
Source: FPI analysis of Bureau of Labor Statistics and NYS Department of Labor employment data; FPI seasonal adjustment of NYS employment data.
56

86
88
90
92
94
96
98
100
102
104
106
108
Inde
x D
ec. 2
007
= 10
0
New York City
Balance of state
United States
NYC's job growth in the recovery has been substantial, but the rest of NYS and the U.S. are not back to their pre-recession levels.
Percent change in total nonfarm employment
NYC BOS U.S. Dec.07 - Dec.09 -2.7% -3.6% -6.3% Dec.09 - Dec.11 4.3% 1.8% 2.4% Dec.11 - Dec.12 1.5% 0.2% 1.7% Dec.12 - Dec.13 2.4% 0.1% 1.6%
Source: FPI analysis of Bureau of Labor Statistics and NYS Dept. of Labor employment data; FPI seasonal adjustment of NYC and BOS employment data.
57

NYS, 5.2%
NYS, 12.7%
NYS, 6.6%
U.S., 5.8%
U.S., 13.7%
U.S., 6.7%
0%
2%
4%
6%
8%
10%
12%
14%
16%
Payroll employment, Dec. 2009 - Dec. 2013
Personal income, 2009 - 2012
Real GDP, 2009 - 2012
Gro
wth
rate
in p
erce
nt
Sources: FPI analysis of Bureau of Labor Statistics and Bureau of Economic Analysis data.
New York's growth rank among 50 states
Payroll employment 22 Personal income 27 Real GDP 21
On the 3 top measures of economic growth, NYS's performance is on a par with the nation's during the recovery, and the state ranks favorably compared to other states.
58

Metropolitan area Per capita income 2009
Per capita income 2012
Growth rate, 2009-12
Growth ranking among
381 metros
United States (metropolitan portion) $40,816 $45,188 10.7%
Glens Falls, NY $35,260 $40,058 13.6% 49
Buffalo-Niagara Falls, NY $38,063 $42,788 12.4% 76
Syracuse, NY $37,247 $41,774 12.2% 86
Rochester, NY $39,047 $43,780 12.1% 88
Kingston, NY $38,442 $42,937 11.7% 106
Ithaca, NY $34,839 $38,852 11.5% 114
Elmira, NY $34,127 $38,056 11.5% 115
New York-Northern New Jersey-Long Island, NY-NJ-PA $52,846 $58,403 10.5% 165
Binghamton, NY $35,024 $38,365 9.5% 219
Utica-Rome, NY $34,657 $37,949 9.5% 222
Albany-Schenectady-Troy, NY $43,626 $47,763 9.5% 224
Seven out of 11 of New York State's metro areas, including many upstate, ranked higher than the national average in per capita personal income growth, 2009-2012
Note: Ranking among total 381 Metropolitan Statistical Areas by 2009-12 growth rate in per capita personal income.
Source: FPI analysis of MSA personal income data from Bureau of Economic Analysis.
59

8,400,000
8,500,000
8,600,000
8,700,000
8,800,000
8,900,000
9,000,000
9,100,000
Source: Payroll employment, seasonally adjusted, from NYS DOL Current Employment Statistics. Population 16 and over from U.S. BLS, at http://www.bls.gov/lau/ststdsadata.txt. The apparent April, 2010, discontinuity is due to the decennial Census population adjustments. In December 2007, payroll employment was at 57.7% of state population 16 years old and over; in December 2013, it was 56.9%.
Actual payroll employment
What employment would have been if it had kept up with population growth
NYS still has a 120,000 "Jobs Deficit." That is the number of additional jobs needed for the state to re-gain its pre-recession (Dec. 2007) employment rate relative to the working age population.
60

1,240,000
1,250,000
1,260,000
1,270,000
1,280,000
1,290,000
1,300,000
1,310,000
1,320,000
1,330,000
6,800,000
6,850,000
6,900,000
6,950,000
7,000,000
7,050,000
7,100,000
7,150,000
7,200,000
7,250,000
7,300,000 New
York state & local govt. employm
ent, 4-quarter moving average N
ew Y
ork
Stat
e al
l priv
ate
empl
oym
ent,
4-qu
arte
r mov
ing
aver
age
All Private (left axis)
State & Local gov't (right axis)
Source: Fiscal Policy Institute's analysis of New York State Department of Labor QCEW data, 1Q 2008-2Q 2013.
New York State lost 71,000 state and local government jobs between Q2 of 2009 and Q2 of 2013. Since the recovery began, state and local government employment has fallen by 4.9% while the number of private sector jobs grew by 5.4% through mid-2013.
61
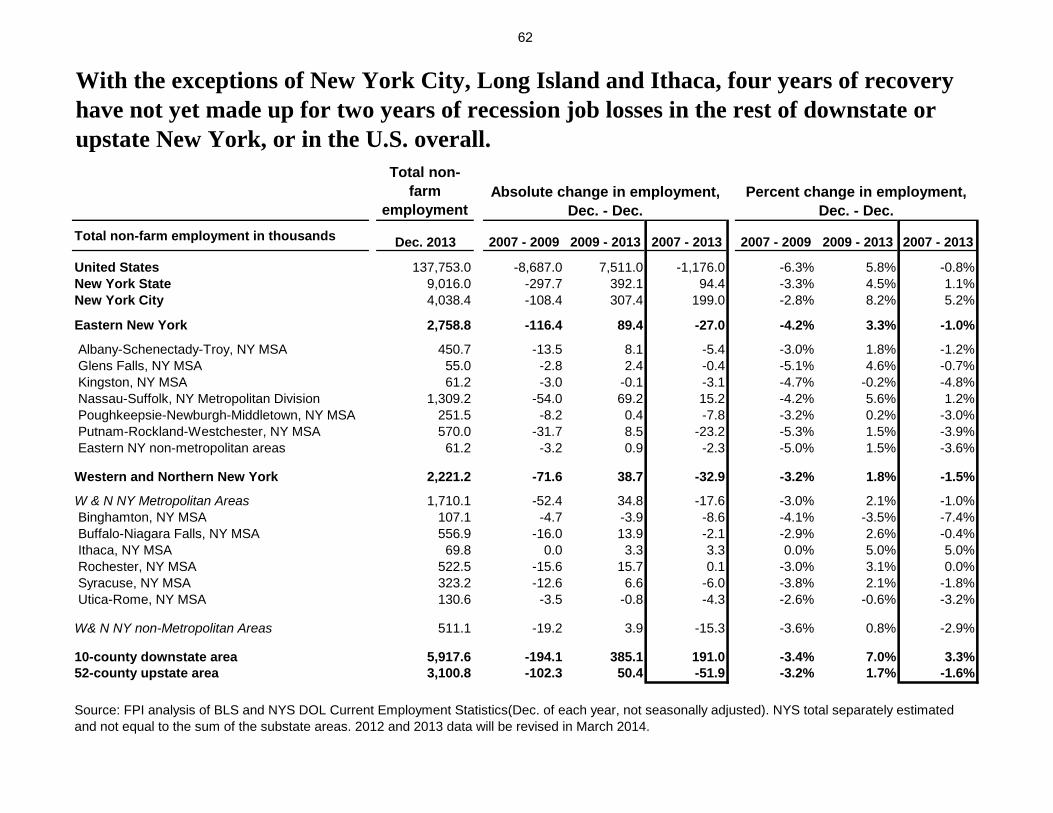
Total non-farm
employmentTotal non-farm employment in thousands Dec. 2013 2007 - 2009 2009 - 2013 2007 - 2013 2007 - 2009 2009 - 2013 2007 - 2013
United States 137,753.0 -8,687.0 7,511.0 -1,176.0 -6.3% 5.8% -0.8%New York State 9,016.0 -297.7 392.1 94.4 -3.3% 4.5% 1.1%New York City 4,038.4 -108.4 307.4 199.0 -2.8% 8.2% 5.2%
Eastern New York 2,758.8 -116.4 89.4 -27.0 -4.2% 3.3% -1.0%
Albany-Schenectady-Troy, NY MSA 450.7 -13.5 8.1 -5.4 -3.0% 1.8% -1.2% Glens Falls, NY MSA 55.0 -2.8 2.4 -0.4 -5.1% 4.6% -0.7% Kingston, NY MSA 61.2 -3.0 -0.1 -3.1 -4.7% -0.2% -4.8% Nassau-Suffolk, NY Metropolitan Division 1,309.2 -54.0 69.2 15.2 -4.2% 5.6% 1.2% Poughkeepsie-Newburgh-Middletown, NY MSA 251.5 -8.2 0.4 -7.8 -3.2% 0.2% -3.0% Putnam-Rockland-Westchester, NY MSA 570.0 -31.7 8.5 -23.2 -5.3% 1.5% -3.9% Eastern NY non-metropolitan areas 61.2 -3.2 0.9 -2.3 -5.0% 1.5% -3.6%
Western and Northern New York 2,221.2 -71.6 38.7 -32.9 -3.2% 1.8% -1.5%
W & N NY Metropolitan Areas 1,710.1 -52.4 34.8 -17.6 -3.0% 2.1% -1.0% Binghamton, NY MSA 107.1 -4.7 -3.9 -8.6 -4.1% -3.5% -7.4% Buffalo-Niagara Falls, NY MSA 556.9 -16.0 13.9 -2.1 -2.9% 2.6% -0.4% Ithaca, NY MSA 69.8 0.0 3.3 3.3 0.0% 5.0% 5.0% Rochester, NY MSA 522.5 -15.6 15.7 0.1 -3.0% 3.1% 0.0% Syracuse, NY MSA 323.2 -12.6 6.6 -6.0 -3.8% 2.1% -1.8% Utica-Rome, NY MSA 130.6 -3.5 -0.8 -4.3 -2.6% -0.6% -3.2%
W& N NY non-Metropolitan Areas 511.1 -19.2 3.9 -15.3 -3.6% 0.8% -2.9%
10-county downstate area 5,917.6 -194.1 385.1 191.0 -3.4% 7.0% 3.3%52-county upstate area 3,100.8 -102.3 50.4 -51.9 -3.2% 1.7% -1.6%
Source: FPI analysis of BLS and NYS DOL Current Employment Statistics(Dec. of each year, not seasonally adjusted). NYS total separately estimated and not equal to the sum of the substate areas. 2012 and 2013 data will be revised in March 2014.
Absolute change in employment, Dec. - Dec.
Percent change in employment, Dec. - Dec.
With the exceptions of New York City, Long Island and Ithaca, four years of recovery have not yet made up for two years of recession job losses in the rest of downstate or upstate New York, or in the U.S. overall.
62

December 2008, government share of employment Total Private Gov't.
United States 16.9% 1.8% 2.8% -3.1%New York State 17.4% 1.9% 3.4% -5.1%New York City 14.8% 5.5% 7.1% -4.0%
Eastern New York (Downstate suburbs and Hudson Valley) 18.8% 0.7% 2.4% -6.5% Albany-Schenectady-Troy, NY MSA 24.5% -0.6% 1.4% -6.9% Glens Falls, NY MSA 20.7% 2.8% 4.5% -3.6% Kingston, NY MSA 25.0% -2.4% -1.1% -6.4% Nassau-Suffolk, NY Metropolitan Division 16.4% 3.1% 4.4% -3.5% Poughkeepsie-Newburgh-Middletown, NY MSA 20.8% -1.8% 0.5% -10.9% Putnam-Rockland-Westchester, NY MSA 17.0% -2.0% -0.4% -9.8% Columbia County 25.2% 0.5% 4.5% -11.3% Greene County 30.9% 0.0% 0.0% 0.0% Sullivan County 26.0% -3.5% -1.0% -10.4%
Western and Northern New York 20.0% -0.7% 0.0% -3.6%
Metropolitan Areas 18.0% -0.5% 0.0% -2.6% Binghamton, NY MSA 22.7% -6.8% -6.0% -9.6% Buffalo-Niagara Falls, NY MSA 17.5% 0.1% 1.2% -5.1% Elmira, NY MSA 18.0% -2.0% 0.3% -12.2% Ithaca, NY MSA 13.4% 5.4% 3.5% 18.0% Rochester, NY MSA 16.0% 0.6% 0.6% 0.2% Syracuse, NY MSA 18.1% -1.0% -1.4% 1.2% Utica-Rome, NY MSA 26.0% -2.8% -1.4% -6.9%
Non-Metropolitan Areas 26.7% -1.7% -0.2% -5.7%
10-county downstate area 15.4% 4.2% 5.8% -4.6%52-county upstate area 21.0% -0.8% 0.3% -4.9%
Source: FPI analysis of Bureau of Labor Statistics (U.S. total) and NYS Department of Labor Current Employment Statistics (CES).
Employment change Dec. 2008-Dec. 2013
In the Hudson Valley, Binghamton, Elmira and Utica metro areas, government job declines over the past four years have been in the 6-to-12 percent range, much steeper than at the national level.
63
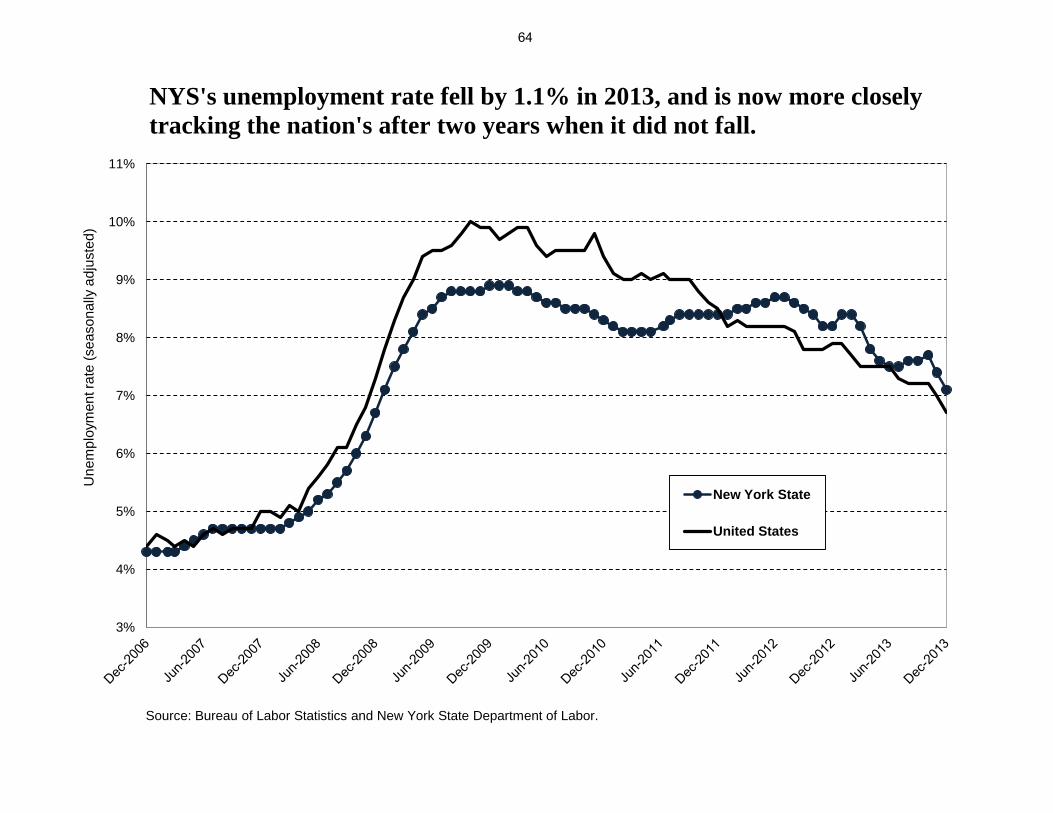
3%
4%
5%
6%
7%
8%
9%
10%
11%
Une
mpl
oym
ent r
ate
(sea
sona
lly a
djus
ted)
New York State
United States
Source: Bureau of Labor Statistics and New York State Department of Labor.
NYS's unemployment rate fell by 1.1% in 2013, and is now more closely tracking the nation's after two years when it did not fall.
64
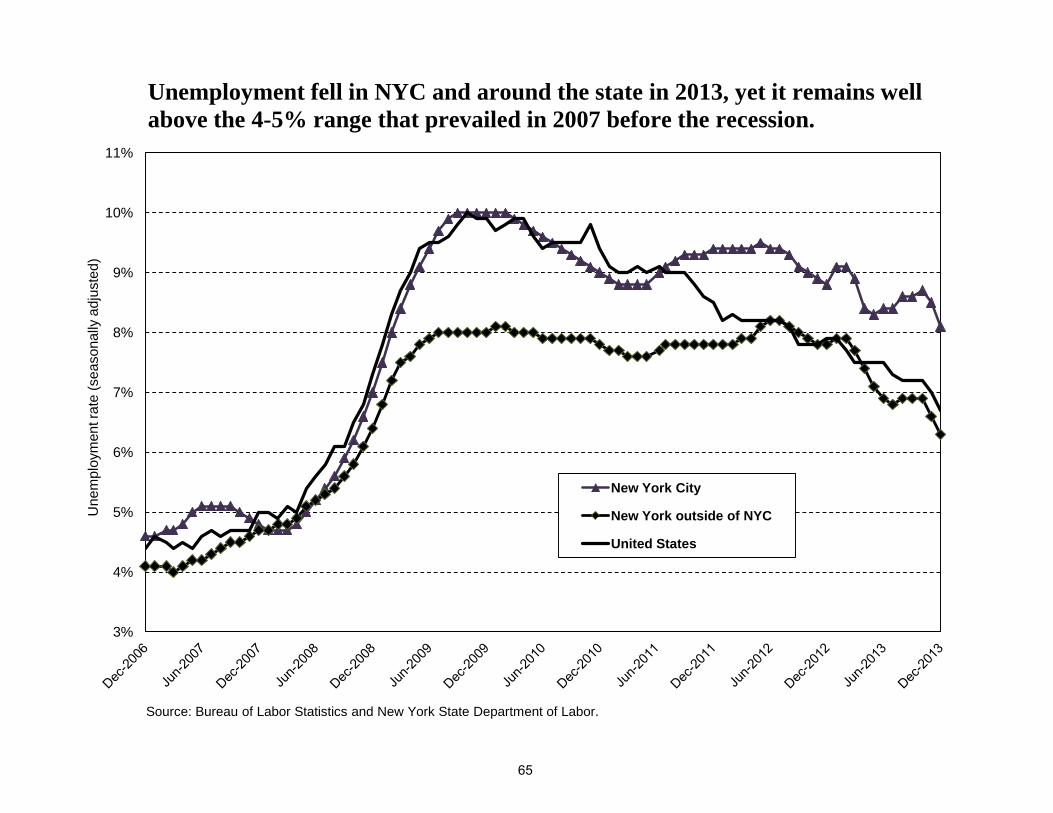
3%
4%
5%
6%
7%
8%
9%
10%
11%
Une
mpl
oym
ent r
ate
(sea
sona
lly a
djus
ted)
New York City
New York outside of NYC
United States
Source: Bureau of Labor Statistics and New York State Department of Labor.
Unemployment fell in NYC and around the state in 2013, yet it remains well above the 4-5% range that prevailed in 2007 before the recession.
65

Labor force statistics, 2H, 2013 Labor force Employed Unemployed Unempl. rateUpstate Metropolitan Areas (MSAs)Albany-Schenectady-Troy, NY MSA 445,367 418,650 26,717 6.0%
Albany city 46,967 43,683 3,283 7.0%Schenectady city 30,850 28,467 2,350 7.6%Troy city 23,817 21,850 1,950 8.2%Outside of cities 343,733 324,650 19,133 5.6%
Binghamton, NY MSA 114,917 106,500 8,400 7.3%Binghamton city 19,967 18,383 1,567 7.8%Outside of city 94,950 88,117 6,833 7.2%
Buffalo-Niagara Falls, NY MSA 575,650 535,333 40,317 7.0%Buffalo city 115,900 105,117 10,800 9.3%Niagara Falls city 22,783 20,750 2,050 9.0%Outside of cities 436,967 409,467 27,467 6.3%
Rochester, NY MSA 521,467 486,700 34,783 6.7%Rochester city 93,250 84,567 8,683 9.3%Outside of city 428,217 402,133 26,100 6.1%
Syracuse, NY MSA 320,467 298,067 22,367 7.0%Syracuse city 63,033 57,750 5,267 8.4%Outside of city 257,433 240,317 17,100 6.6%
Five major upstate NY MSAs 1,977,867 1,845,250 132,583 6.7%Cities 416,567 380,567 35,950 8.6%Outside of cities 1,561,300 1,464,683 96,633 6.2%
New York City 4,061,750 3,721,233 340,517 8.4%
Five NYC suburban counties 2,188,850 2,061,933 126,900 5.8%Nassau county 701,217 662,417 38,817 5.5%Putnam county 54,033 51,117 2,933 5.4%Rockland county 157,700 148,783 8,883 5.6%Suffolk county 799,450 751,383 48,050 6.0%Westchester county 476,450 448,233 28,217 5.9%
10 downstate counties 6,250,600 5,783,167 467,417 7.5%
Total of six major metropolitan areas 8,228,467 7,628,417 600,000 7.3%Rest of State 1,430,783 1,330,133 100,700 7.0%New York State 9,659,250 8,958,550 700,700 7.3%
United States 155,512,500 144,602,500 10,909,667 7.0%Source: FPI analysis of New York State Department of Labor Local Area Unemployment Statistics, not seasonally adjusted.
Unemployment remains high in the upstate cities and in New York City, and higher than in suburban areas.
66
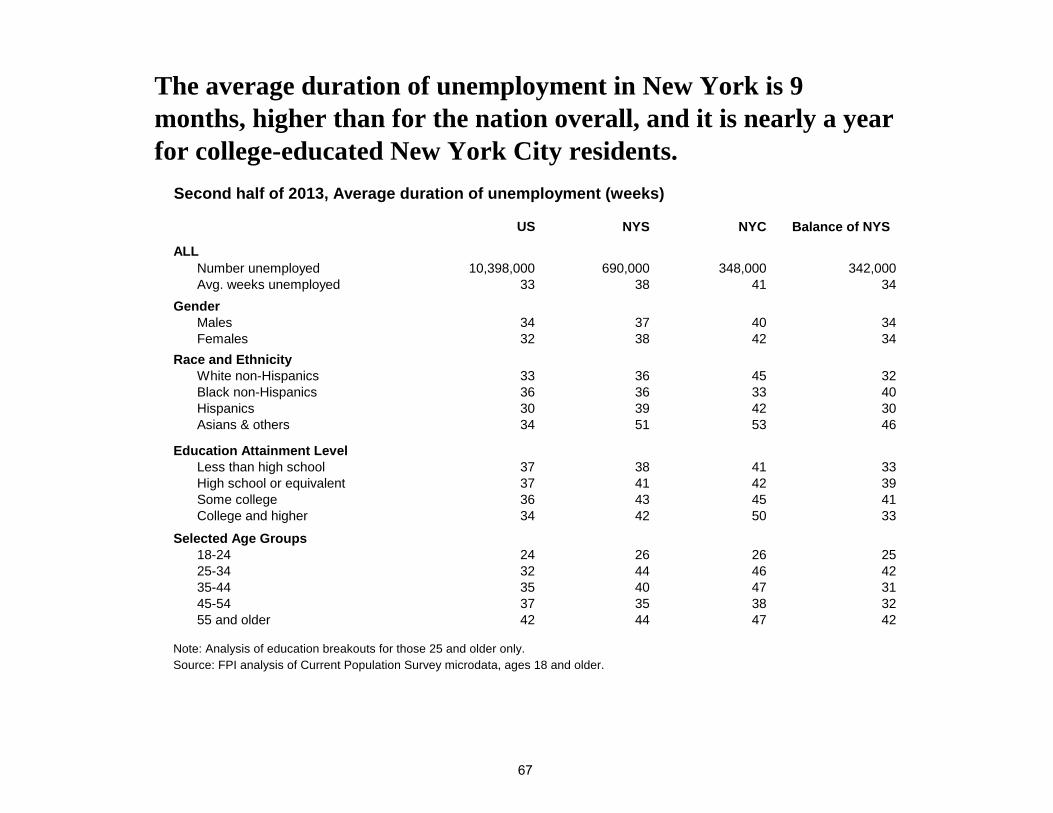
US NYS NYC Balance of NYS
ALLNumber unemployed 10,398,000 690,000 348,000 342,000Avg. weeks unemployed 33 38 41 34
GenderMales 34 37 40 34Females 32 38 42 34
Race and EthnicityWhite non-Hispanics 33 36 45 32Black non-Hispanics 36 36 33 40Hispanics 30 39 42 30Asians & others 34 51 53 46
Education Attainment LevelLess than high school 37 38 41 33High school or equivalent 37 41 42 39Some college 36 43 45 41College and higher 34 42 50 33
Selected Age Groups18-24 24 26 26 2525-34 32 44 46 4235-44 35 40 47 3145-54 37 35 38 3255 and older 42 44 47 42
Note: Analysis of education breakouts for those 25 and older only.Source: FPI analysis of Current Population Survey microdata, ages 18 and older.
The average duration of unemployment in New York is 9 months, higher than for the nation overall, and it is nearly a year for college-educated New York City residents.
Second half of 2013, Average duration of unemployment (weeks)
67

2H of 2008
2H of 2013
Change in pct. point
2H of 2008
2H of 2013
Change in pct. point
2H of 2008
2H of 2013
Change in pct. point
2H of 2008
2H of 2013
Change in pct. point
ALL 5.9% 7.5% 1.6% 6.1% 8.5% 2.4% 5.8% 7.5% 1.7% 6.4% 7.1% 0.7%
Gender Males 6.5% 8.3% 1.8% 6.8% 9.3% 2.5% 6.3% 7.7% 1.4% 6.8% 7.3% 0.5% Females 5.3% 6.6% 1.3% 5.4% 7.6% 2.2% 5.2% 7.3% 2.1% 6.0% 6.9% 1.6%
Race and Ethnicity White non-Hispanics 4.7% 5.5% 0.8% 3.6% 5.3% 1.7% 5.2% 6.6% 1.4% 5.3% 5.6% 0.4% Black non-Hispanics 11.2% 13.3% 2.2% 11.0% 12.0% 1.0% 11.1% 10.3% -0.8% 11.4% 12.9% 1.4% Hispanics 7.1% 10.8% 3.7% 7.0% 11.3% 4.3% 7.0% 13.4% 6.4% 8.4% 9.0% 0.6% Asians & others 4.2% 6.0% 1.9% 3.6% 6.6% 3.0% 5.5% 7.8% 2.3% 5.7% 7.1% 1.4%
Educational Attainment Level* Less than high school 8.6% 13.4% 4.7% 9.0% 13.4% 4.5% 7.9% 12.9% 5.1% 9.9% 10.4% 0.6% High school or equiv. 5.4% 8.1% 2.7% 5.4% 10.9% 5.6% 5.5% 7.9% 2.4% 6.3% 7.2% 0.9% Some college 5.5% 6.1% 0.6% 6.5% 7.0% 0.5% 4.9% 5.9% 1.0% 5.2% 6.2% 1.0% College and higher 3.5% 4.5% 1.0% 3.7% 5.0% 1.2% 3.3% 3.7% 0.4% 3.1% 3.6% 0.6%
Selected Age Groups16-19 17.0% 18.5% 1.5% 21.0% 24.0% 3.0% 16.2% 25.3% 9.0% 19.4% 21.2% 1.8%20-24 10.1% 12.6% 2.6% 11.3% 12.1% 0.8% 9.5% 14.5% 5.0% 11.0% 12.2% 1.1%25-34 6.2% 7.2% 1.0% 6.0% 7.6% 1.6% 6.4% 6.6% 0.2% 6.5% 7.4% 0.8%35-44 5.1% 5.3% 0.2% 5.0% 7.0% 1.9% 5.2% 5.7% 0.4% 5.3% 5.6% 0.3%45-54 4.2% 7.0% 2.7% 5.7% 8.3% 2.6% 3.2% 5.8% 2.6% 4.6% 5.5% 0.9%55 and older 4.2% 6.2% 2.0% 4.4% 8.1% 3.7% 4.1% 5.7% 1.5% 4.4% 5.1% 0.7%
*Analysis by educational attainment restricted to those 25 and older.Note: Adjusted to 6-month average LAUS for state, city, and balance of NYS.Source: FPI analysis of Current Population Survey and New York State Department of Labor Local Area Unemployment Statistics (LAUS).
New York (statewide) New York City NYS outside of NYC United States
After four years of recovery, unemployment is still much higher than before the recession; black and Hispanic unemployment is twice or more that for non-Hispanic whites.
68
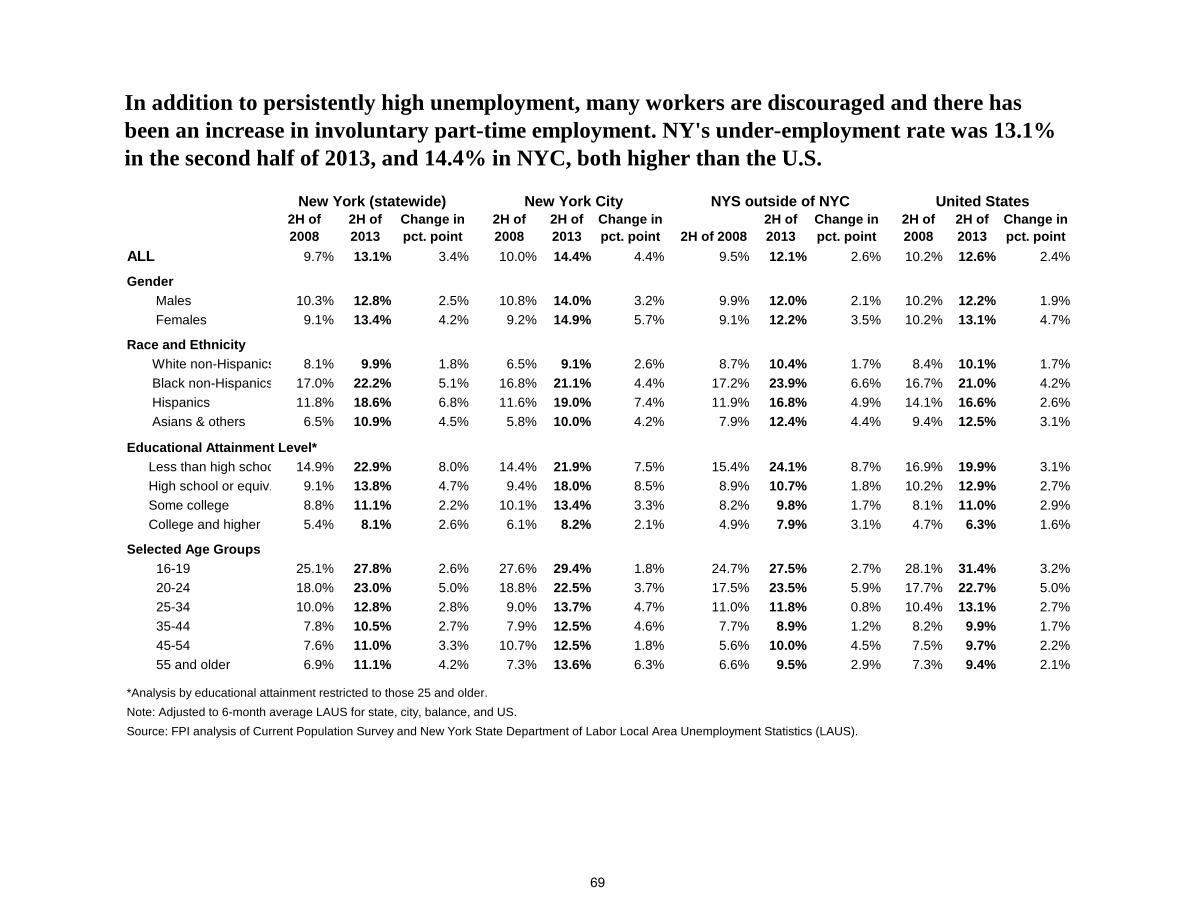
2H of 2008
2H of 2013
Change in pct. point
2H of 2008
2H of 2013
Change in pct. point 2H of 2008
2H of 2013
Change in pct. point
2H of 2008
2H of 2013
Change in pct. point
ALL 9.7% 13.1% 3.4% 10.0% 14.4% 4.4% 9.5% 12.1% 2.6% 10.2% 12.6% 2.4%
Gender Males 10.3% 12.8% 2.5% 10.8% 14.0% 3.2% 9.9% 12.0% 2.1% 10.2% 12.2% 1.9% Females 9.1% 13.4% 4.2% 9.2% 14.9% 5.7% 9.1% 12.2% 3.5% 10.2% 13.1% 4.7%
Race and Ethnicity White non-Hispanics 8.1% 9.9% 1.8% 6.5% 9.1% 2.6% 8.7% 10.4% 1.7% 8.4% 10.1% 1.7% Black non-Hispanics 17.0% 22.2% 5.1% 16.8% 21.1% 4.4% 17.2% 23.9% 6.6% 16.7% 21.0% 4.2% Hispanics 11.8% 18.6% 6.8% 11.6% 19.0% 7.4% 11.9% 16.8% 4.9% 14.1% 16.6% 2.6% Asians & others 6.5% 10.9% 4.5% 5.8% 10.0% 4.2% 7.9% 12.4% 4.4% 9.4% 12.5% 3.1%
Educational Attainment Level* Less than high schoo 14.9% 22.9% 8.0% 14.4% 21.9% 7.5% 15.4% 24.1% 8.7% 16.9% 19.9% 3.1% High school or equiv. 9.1% 13.8% 4.7% 9.4% 18.0% 8.5% 8.9% 10.7% 1.8% 10.2% 12.9% 2.7% Some college 8.8% 11.1% 2.2% 10.1% 13.4% 3.3% 8.2% 9.8% 1.7% 8.1% 11.0% 2.9% College and higher 5.4% 8.1% 2.6% 6.1% 8.2% 2.1% 4.9% 7.9% 3.1% 4.7% 6.3% 1.6%
Selected Age Groups16-19 25.1% 27.8% 2.6% 27.6% 29.4% 1.8% 24.7% 27.5% 2.7% 28.1% 31.4% 3.2%20-24 18.0% 23.0% 5.0% 18.8% 22.5% 3.7% 17.5% 23.5% 5.9% 17.7% 22.7% 5.0%25-34 10.0% 12.8% 2.8% 9.0% 13.7% 4.7% 11.0% 11.8% 0.8% 10.4% 13.1% 2.7%35-44 7.8% 10.5% 2.7% 7.9% 12.5% 4.6% 7.7% 8.9% 1.2% 8.2% 9.9% 1.7%45-54 7.6% 11.0% 3.3% 10.7% 12.5% 1.8% 5.6% 10.0% 4.5% 7.5% 9.7% 2.2%55 and older 6.9% 11.1% 4.2% 7.3% 13.6% 6.3% 6.6% 9.5% 2.9% 7.3% 9.4% 2.1%
*Analysis by educational attainment restricted to those 25 and older.Note: Adjusted to 6-month average LAUS for state, city, balance, and US.Source: FPI analysis of Current Population Survey and New York State Department of Labor Local Area Unemployment Statistics (LAUS).
New York (statewide) New York City NYS outside of NYC United States
In addition to persistently high unemployment, many workers are discouraged and there has been an increase in involuntary part-time employment. NY's under-employment rate was 13.1% in the second half of 2013, and 14.4% in NYC, both higher than the U.S.
69

-150,000 -100,000 -50,000 0 50,000 100,000 150,000 200,000 250,000 300,000
Note: Low wage industries have annual average wages below $45,000. Middle wage industries have annual average wages of $45,000-$75,000. High wage industries are those with annual average wages over $75,000. Source: FPI seasonal adjustment of Current Employment Statistics data and QCEW 2012 annual average wage data from NYSDOL.
High-wage industries -49,800
Middle-wage industries -106,600
New York State's net job gains since the recession began have been concentrated in industries with low average wages while there are more than 100,000 fewer jobs in middle-wage industries.
Low-wage industries +226,200
70

2013 2014 2015 2016 2017
United States
Real Gross Domestic Product -0.3 -3.1 2.4 1.8 2.8 1.9 2.7 2.9 2.9 2.8
Personal income 4.6 -4.8 3.8 5.1 4.2 2.9 4.3 5.3 5.3 5.1
Total wages 2.0 -4.3 2.1 4.0 4.3 3.1 4.5 5.6 5.4 4.9
Employment -0.6 -4.4 -0.7 1.2 1.7 1.6 1.7 2.0 1.9 1.7
Unemployment rate 6.1 9.9 10.2 8.9 8.1 7.4 6.8 6.3 5.9 5.7
New York State
Personal income 3.7 -4.9 5.6 4.5 3.1 1.9 5.2 4.9 5.0 5.1
Total wages 2.1 -6.9 4.4 3.8 2.9 1.6 5.4 4.6 4.6 4.6
Employment 0.7 -2.7 0.1 1.3 1.3 1.2 1.2 1.2 1.2 1.1
Unemployment rate 5.3 8.3 8.6 8.2 8.5 7.7 7.5 6.8 6.2 5.8
Source: Bureau of Economic Analysis, Bureau of Labor Statistics, and NYS Division of the Budget, 2014-2015 Executive Budget Economic and Revenue Outlook , p.136.
While 2013 wage and income growth was less than in 2012, the unemployment rate fell more than expected, and the outlook is for moderate growth over the next four years.
Forecast2008 actual
2009 actual
2010 actual
Calendar years, annual percent changes
2011 actual
2012 actual
71

Pronounced income inequality persists in NY with most of the income gains in the recent years going to the very top. Median wages and family incomes have fallen, and poverty and hardships have risen since the recession began.
• An unusually large proportion of the increase in GDP in the recovery has gone to corporate profits rather than labor compensation which, in a normal recovery, fuels hiring and wage gains. The top 1% receive over half of corporate dividends and 90 percent of capital gains. According to economist Emanuel Saez, 95% of national income growth in this recovery has gone to the wealthiest top 1%.
• Nobel-laureate economist Joseph Stiglitz notes four reasons inequality retards growth: o Stagnant incomes and high debt burdens make it hard for the middle class to support
consumer spending, which accounts for two-thirds of the economy. o The hollowing out of the middle class job structure has eroded economic security and
made it difficult to invest in the future. o Tax revenues have faltered because of weak middle class incomes and because those at
the top have been able to keep their taxes low. This has made it difficult for government to invest in infrastructure, education, research and health crucial for long-term growth.
o Extreme inequality is associated with financial speculation and frequent and more severe boom-and-bust cycles.
72

Although New York State fared better than many states during the Great Recession, economic hardships have been pronounced and have taken an enormous toll on millions of New Yorkers.
• The number of New Yorkers receiving food stamps jumped by 1.34 million, or by 74%,
since the recession began, and outside of NYC, the increase was 86%.
• Over 13 percent of New York households experienced food insecurity in 2010-12, according to the U.S. Department of Agriculture in their most recent national survey. The USDA defines food insecurity as “at times during the year, these households were uncertain of having, or unable to acquire, enough food to meet the needs of all their members because they had insufficient money or other resources for food.”
• More than 1.2 million New Yorkers were added to the Medicaid rolls from August 2007 to August 2013, bringing the total to 5.34 million, or more than 27% of state residents.
• The number of people receiving public assistance grew by one-third outside of New York City over the past 5 years, while the previous administration in NYC discouraged people from accessing public assistance.
• New York has better protections than most states to help people slow the mortgage
foreclosure process and stay in their homes. Even though foreclosures were not as severe as in many states during the worst of the 2008-2012 housing crisis, nearly 10 percent of New York home mortgage debt is more than 90 days overdue, more than twice the national average.
73
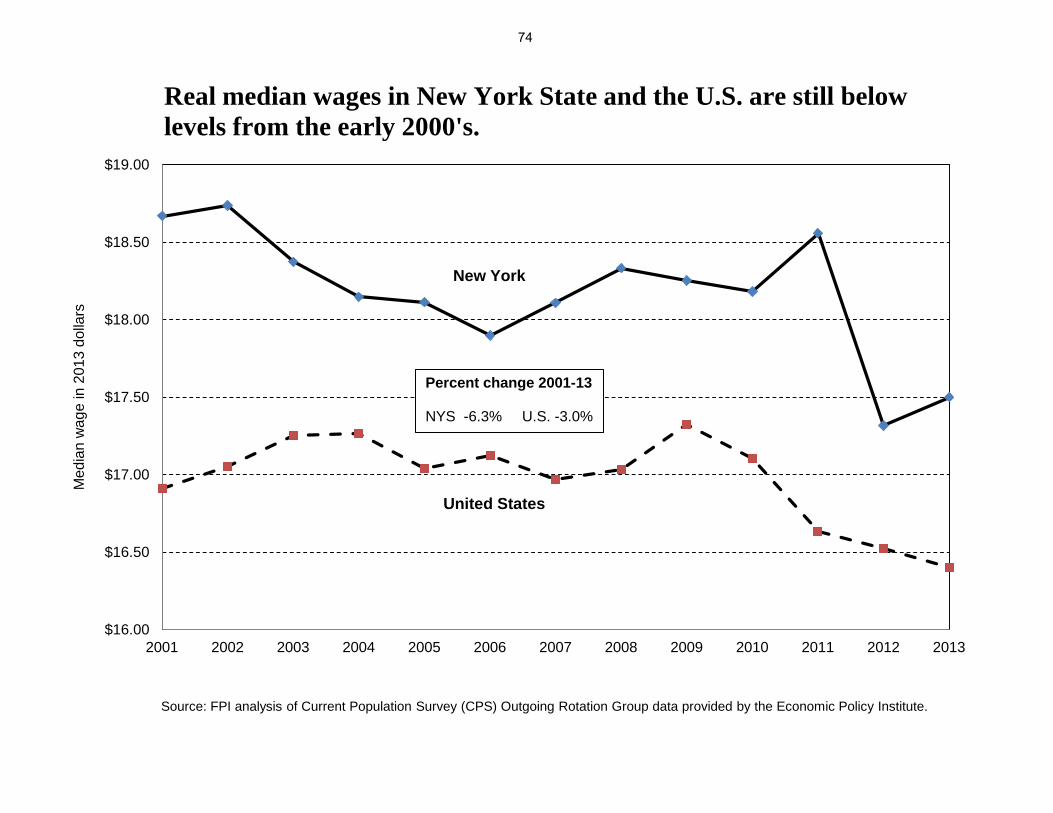
$16.00
$16.50
$17.00
$17.50
$18.00
$18.50
$19.00
2001 2002 2003 2004 2005 2006 2007 2008 2009 2010 2011 2012 2013
Med
ian
wag
e in
201
3 do
llars
Source: FPI analysis of Current Population Survey (CPS) Outgoing Rotation Group data provided by the Economic Policy Institute.
New York
United States
Real median wages in New York State and the U.S. are still below levels from the early 2000's.
Percent change 2001-13 NYS -6.3% U.S. -3.0%
74

$9.80
$10.00
$10.20
$10.40
$10.60
$10.80
$11.00
$11.20
2001 2002 2003 2004 2005 2006 2007 2008 2009 2010 2011 2012 2013
20th
per
cent
ile w
age
in 2
013
dolla
rs
Source: FPI analysis of Current Population Survey Outgoing Rotation Group data provided by EPI
Real hourly wages for the typical low-wage worker in NYS and the U.S. have fallen more since 2001 than for median-wage workers.
New York
United States
Percent change 2001-13 NYS -8.9% U.S. -5.8%
75

$67,572
$72,382
$60,306
$65,369
$71,586
$59,988
$63,816
$69,384
$56,429
$62,727
$68,235
$55,454
$50,000
$55,000
$60,000
$65,000
$70,000
$75,000
United States New York State New York City
Changes in median family income 2008-12 (constant 2012 dollars)
U.S. NYS NYC -7.5% -5.5% -8.4%
Source: FPI analysis of the American Community Survey (ACS) data for 2008-2012 1-year estimates.
2008 2009 2010 2011
Inflation-adjusted median family income has fallen sharply nationally and in New York State and City since the 2008-09 Great Recession.
$62,527
$68,395
$55,240
2012
76

0%
5%
10%
15%
20%
25%
30%
35%
40%
45%
50% 19
80
1982
1984
1986
1988
1990
1992
1994
1996
1998
2000
2002
2004
2006
2008
2010
2012
Top
1% in
com
e sh
are
in p
erce
nt New York State
New York City
United States
Source: Piketty and Saez's top 1% income share for the US and FPI analysis of NYS Department of Tax and Finance and Division of the Budget data for NYS and NYC top 1% income share, 2011-2012 projected.
The income share of the top 1% in the U.S. and New York rose sharply in 2012; in NYS, the top 1% has 30% of all income, three times its 1980 share.
77

Extreme income polarization dates from the late 1970s and results from policy choices, not technological change or globalization.
• Income polarization is more extreme in the U.S. than in 20 other developed economies, according to Professor Janet Gornick of the Luxembourg Income Study and CUNY Grad Center. (Analysis of income after taxes and transfers, based on data for 2003-2010.)
• For 35 years after W.W. II, the richest 1% in the U.S. had a remarkably stable 10% share of national income. Since the late 1970s, the income share going to the top 1% has steadily risen to 22.5% in 2012, although the share tends to rise and fall around the upward trend line due to the volatility of capital gains. (Piketty and Saez data.)
• Political scientists Jacob Hacker and Paul Pierson trace the roots of the pronounced income
polarization in the U.S. to a series of public policy choices made in Washington in their new classic, Winner-Take-All Politics: How Washington Made the Rich Richer—And Turned Its Back on the Middle Class. Some of the major policy changes they point to that re-wrote the social contract involved de-regulation (including financial de-regulation), international trade, taxes, executive pay, minimum wages, and labor unions.
• NYS tracks the national trend although income polarization is more pronounced here, partly
because of the concentration of the finance sector (the sector with the highest compensation) and the large poverty populations in NYC and the upstate cities.
78

Taking stock of the War on Poverty, and of how well our economy enables people to achieve economic security.
• The War on Poverty has made a huge difference in addressing poverty and in keeping millions of Americans out of poverty. Yet, nearly 50 million people (including 3 million New Yorkers) were poor in 2012, with 13 million children (1 million in New York) living in poverty. Large racial disparities remain, with child poverty much higher and the share of blacks with a college degree much lower than among whites. The Center on Budget and Policy Priorities (CBPP) also notes that poverty is much higher in the U.S. than in other wealthy nations largely because our safety net does less to lift people out of poverty.
• The nation’s record in fighting poverty is mixed. On the one hand, our safety net along with rising education levels, higher female employment, and smaller families have helped to reduce poverty. On the other hand, rising numbers of single-parent families, growing income inequality, and worsening labor market prospects for less-educated workers have pushed in the other direction.
• Using the Census Bureau’s Supplemental Poverty Measure (which factors in critical safety net programs like
low-income tax credits and non-cash assistance like SNAP), CBPP analysts calculated the effect of the safety net in keeping 40 million people out of poverty, including 2.4 million New Yorkers.
o Social Security kept 26 million people above the poverty line; o The EITC kept 6.1 million people out of poverty, and is the most effective program other than Social
Security in lifting children out of poverty (3.1 million); o The SNAP Program kept 4.7 million Americans out of poverty; and o Unemployment insurance helped 3.5 million people stay above the poverty line in 2011.
• In a new report from the Stanford Center on Poverty & Inequality looking at the persistence of poverty in the
U.S., researchers found that the main culprit is that our “economy is failing to deliver the jobs, a failure that then generates much poverty, that exposes the safety net to demands well beyond its capacity to meet them, that produces too many children poorly prepared for school, and that places equally harsh demands on our healthcare, penal, and retirement systems.”
79
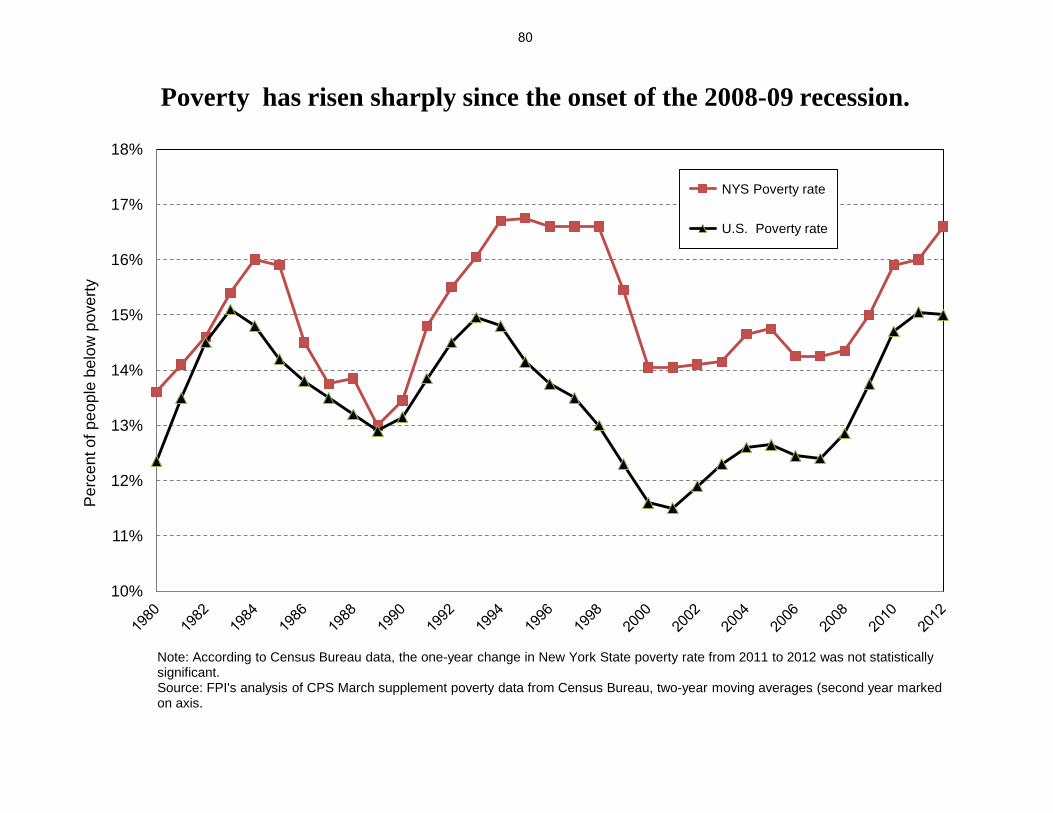
10%
11%
12%
13%
14%
15%
16%
17%
18%
Per
cent
of p
eopl
e be
low
pov
erty
NYS Poverty rate
U.S. Poverty rate
Note: According to Census Bureau data, the one-year change in New York State poverty rate from 2011 to 2012 was not statistically significant. Source: FPI's analysis of CPS March supplement poverty data from Census Bureau, two-year moving averages (second year marked on axis.
Poverty has risen sharply since the onset of the 2008-09 recession.
80

15.9%
21.2%
38.2%
31.6% 30.9%
21.5%
26.8%
22.6%
31.1%
54.3%
48.7%
44.9%
37.2% 34.5%
0%
10%
20%
30%
40%
50%
60%
New York State New York City Syracuse city Rochester city Buffalo city Schenectady city Albany city
Per
cent
of p
opul
atio
n liv
ing
belo
w th
e fe
dera
l pov
erty
line
All people
Children
Poverty rates for all persons and for children are much higher in the major upstate cities than in New York City and New York State overall.
Source: American Community Survey (ACS) 2012 single-year estimate data.
81

82

IV. An Economic Policy Agenda to Address Income Inequality
83

This overview of New York’s performance during this historically weak recovery points up the critical need for New York’s policy makers to use various state budget, tax and economic policy levers to address the current economic insecurity experienced by millions of New Yorkers.
• Fundamentally, New York needs to enact policies that boost economic and job growth and that
improve and enforce labor standards and opportunities for advancement. Accelerating the increase in the minimum wage creates a more meaningful floor under the labor market.
• Continued self-inflicted austerity budget policies are counter-productive: they weaken current job growth and by forcing under-investment in education they undermine New York’s long-term growth prospects.
• Rather than walking away from our safety net, we should reinvest in it to give those disadvantaged through no fault of their own a leg up so they can better make their way out of poverty with the job market preparation, skills and education they need.
• Rather than more pointless tax cuts for big business and the wealthy, New York should start directing needed resources to a range of priorities, including fulfilling its long-standing commitment to fund a sound, basic education; fully funding quality statewide pre-K; expanding the availability of subsidized child care; and enhancing the state’s EITC.
84

In addition to smart budget and tax policies, New York’s policy makers should enact measures that address income inequality by putting a better floor under the labor market, expanding opportunities, and improving living standards. 1. Increase the Minimum Wage: Accelerate the increase in New York’s minimum wage, end the separate treatment of
tipped workers, and repeal the fatally flawed Minimum Reimbursement Tax Credit.
2. Establish Paid Family Leave Insurance and Raise the Temporary Disability Insurance (TDI) Benefit: Establish a paid family leave insurance program and raise the maximum benefit under the state’s existing TDI program.
3. Raise the NYS Earned Income Tax Credit (EITC): Raise the state’s EITC to 40 percent of the federal EITC from 30 percent helps boost the disposable income of low-income working families with children.
4. Reform Unemployment Insurance (UI) Partial Benefits: Correct the shortcomings in how NYS structures UI benefits for the growing ranks of part-time workers.
5. Raise the Maximum Award under New York’s Tuition Assistance Program (TAP): Raise the $5,000 maximum TAP benefit to $6,500. It has not been raised for over a decade, while tuition and other costs have increased, forcing students to rely more heavily on loans to finance higher education.
6. Increase Labor Standards Enforcement: Increase Labor Department enforcement staff to curb wage theft and the rampant abusive misclassification of de-facto employees as independent contractors.
7. Better Integrate Workforce Development into the Regional Economic Development Councils: Increase the state’s commitment to investing in its workforce, assist the re-employment of 500,000 long-term unemployed New Yorkers, and link living wage, prevailing standards, and new-hiring targets to government subsidies to business.
8. Expand Transitional and Public Service Jobs and Improve Low-Wage Jobs in the Non-Profit Social Service Agencies Working under State Contract: Expand transitional employment programs to better assist welfare recipients and the unemployed while protecting against the displacement of existing public sector workers, and increase funding in state human service contracts to provide long overdue wage increases to low-wage workers providing essential services.
85

60%
70%
80%
90%
100%
110%
120%
1960
1962
1964
1966
1968
1970
1972
1974
1976
1978
1980
1982
1984
1986
1988
1990
1992
1994
1996
1998
2000
2002
2004
2006
2008
2010
2012
2014
2016
Min
imum
wag
e in
com
e fo
r a fu
ll-tim
e, fu
ll-ye
ar w
orke
r as
a sh
are
of 3
-per
son
fam
ily fe
dera
l pov
erty
thre
shol
d
Source: FPI analysis. Poverty threshold for 2013 projected using 2012-2013 CPI change; 2014-2016 projected assuming 2% per year change in CPI.
At $8.00 an hour, a full-time minimum wage New York worker will be at only 88% of the 3-person poverty threshold. The enacted increases at the end of this year ($8.75) and next ($9.00) will not lift a full-time minimum wage worker above 96% of that (inadequate) threshold.
86
NYS should enact Family Leave Insurance and raise the TDI benefit • New York currently does not have a family leave insurance program. This impacts low- and moderate-income families
who more often lack the financial resources to take unpaid time off during family health crises or in conjunction with the birth or adoption of new children which require leave from work.
• New York's current Temporary Disability Insurance (TDI) benefits are much less than the benefits in the other states with such programs.
• Proposed legislation would increase the maximum benefit and establish a family leave insurance program that would be financed through employee payroll contributions with no cost to employers.
• Experience under the paid family leave program in California (implemented in 2004) has shown that it results in lower employee turnover, higher morale, and decreases reliance on public assistance since employees remain in the workforce. Additionally, a large majority of businesses have found that paid family leave has not resulted in cost increases and has had a positive or no noticeable effect on productivity. (See E. Appelbaum & R. Milkman, Leaves that Pay: Employer and Worker Experiences with Paid Family Leave in California, CEPR (Jan. 2011), E. Rudd, Family Leave: A Policy Concept Made in America, Sloan Work and Family Research Network, 2004; and A. Dube & E. Kaplan, Paid Family Leave in California: An Analysis of Costs and Benefits, Labor Project for Working Families (July 2002.)
• New York City and Rhode Island enacted paid sick day and paid family leave programs, respectively over the last year. Other cities and states, such as Newark and Connecticut, are taking steps toward similar actions. On January 14, 2014, Senator Kirsten Gillibrand introduced the Family and Medical Insurance Leave Act to establish a national paid family and medical leave insurance program.
87

40%
50%
60%
70%
80%
90%
100% 19
90
1991
1992
1993
1994
1995
1996
1997
1998
1999
2000
2001
2002
2003
2004
2005
2006
2007
2008
2009
2010
2011
2012
2013
2014
2015
2016
2017
The current Temporary Disability Insurance (TDI) maximum weekly benefit has lost more than 50% of its purchasing power since it was raised to $170 in 1989.
Calendar Year
Note: Inflation-adjusted maximum weekly benefit as a percent of 1990 maximum weekly benefit, 2013 dollars.
88

$0
$200
$400
$600
$800
$1,000
$1,200
New York, current Hawaii New Jersey New York, proposed Rhode Island California
Max
imum
ben
efit
as o
f 201
2
Temporary Disability Insurance
Family Leave Insurance
Note: 2013 Assembly bill 1793, sponsored by Assemblywoman Catherine Nolan. When fully phased-in (year 4 of the proposal), New York's maximum weekly benefit will be half of the state's average weekly wage; that amount in 2012 would be approximately $603. Source: Fiscal Policy Institute analysis of state agency information and proposed legislation.
A legislative proposal would increase New York's maximum weekly benefit for the Temporary Disability Insurance program, and add a family leave insurance component.
89

90

VI. Appendix
91

Tax Year
Liability, Top 1 %
Liability, 99%
Liability, All
Taxpayers
Top 1%'s Share of Liability
Liability, Top 1 %
Liability, 99%
Liability, All Taxpayers
Top 1%'s Share of Liability
Liability, Top 1 %
Liability, 99%
Liability, All
Taxpayers
Top 1%'s Share of Liability
1998 6,654 12,332 18,986 35.0% - - - - - - - -
1999 7,462 13,515 20,977 35.6% - - - - - - - -
2000 9,644 15,089 24,733 39.0% - - - - - - - -
2001 7,864 14,542 22,406 35.1% - - - - - - - -
2002 6,681 14,050 20,731 32.2% - - - - - - - -
2003 7,146 14,027 21,173 33.8% 933 350 1,283 72.7% 8,079 14,377 22,456 36.0%
2004 8,487 15,731 24,218 35.0% 1,120 431 1,551 72.2% 9,607 16,162 25,769 37.3%
2005 9,794 16,947 26,741 36.6% 1,299 444 1,743 74.5% 11,093 17,391 28,484 38.9%
2006 11,539 18,048 29,587 39.0% 0 0 - - - - - -
2007 15,195 20,020 35,215 43.1% 0 0 - - - - - -
2008 11,890 19,731 31,621 37.6% 0 0 - - - - - -
2009 9,138 18,384 27,522 33.2% 3,056 584 3,640 84.0% 12,194 18,968 31,162 39.1%
2010 10,548 19,801 30,349 34.8% 3,734 753 4,487 83.2% 14,282 20,554 34,836 41.0%
2011 10,733 20,863 31,596 34.0% 3,780 920 4,700 80.4% 14,513 21,783 36,296 40.0%
2012* 12,983 22,414 35,397 36.7% 3,331 -682 2,649 125.7% 16,314 21,732 38,046 42.9%
2013* 13,017 23,026 36,043 36.1% 3,222 -871 2,351 137.0% 16,239 22,155 38,394 42.3%
2014* 13,849 24,828 38,677 35.8% 3,479 -1,511 1,968 176.8% 17,328 23,317 40,645 42.6%
2015* 14,759 26,603 41,362 35.7% 3,733 -1,679 2,054 181.7% 18,492 24,924 43,416 42.6%
Permanent Law Temporary Higher Rates ** Permanent Law Plus Temporary Higher Rates **
Source: FPI analysis of data from Executive Budget, Economic and Revenue Outlook , Table 7, volumes 2010-2011 through 2014-2015.
2014-2015 Executive Budget Estimates of Personal Income Tax Liability, by Tax Year, With and Without Temporary Rate Increases (in Millions of Dollars)
Note: * Estimated; ** For 2012-2015, in addition to an increase in the top rate to 8.82%, rates were slightly reduced for other taxpayers, e.g., married couples filing jointly with incomes from $40,000.
92

$15
$20
$25
$30
$35
$40
$45
1998 1999 2000 2001 2002 2003 2004 2005 2006 2007 2008 2009 2010 2011 2012 2013 2014 2015
Pers
onal
inco
me
tax
liabi
lity
in b
illion
s
Calendar (tax) years
Permanent Law Temporary Law
Note: Shows impact of surcharges enacted for 2003-2005, in 2009 AND as modified and extended in 2011 and 2013; temporary top PIT rates will expire at the end of 2017. Estimates for 2012 forward. Source: Executive Budget, Economic and Revenue Outllook,Table 7, volumes 2010-2011 through 2014-2015.
The temporary PIT surcharge, projected to bring in an additional $21.9 billion in revenue to New York State from 2009 through 2015, has not only been beneficial to the state coming out of the Great Recession but is essential given the overall regressivity of New York's state and local taxes.
93

$0
$20
$40
$60
$80
$100
$120
$140
$160
$180
Billi
ons
All Other Revenues Federal Aid
State Fiscal Year
Note: The federal aid projected for 2014-2015 and beyond could be affected by receipt of any federal storm recovery funds, efforts to reduce the federal government's operating deficit,and by recovery of federal funds for payments of Medicaid services in excess of federal requirements.
The substantial amounts of aid New York State receives from the federal government could be reduced by federal actions currently under consideration.
94

0%
5%
10%
15%
20%
25%
30%
35%
40%
1972
1974
1976
1978
1980
1982
1984
1986
1988
1990
1992
1994
1996
1998
2000
2002
2004
2006
2008
2010
2012
Employees Retirement System
Police and Fire Retirement System
Source: New York State and Local Retirement System.
Em
ploy
er c
ontri
butio
n ra
te a
s pe
rcen
tage
of s
alar
y Retirement system contribution rates for New York State and local government employers have risen to 1970s levels due to investment losses from the financial sector meltdown.
95

y = 0.0026x + 0.0148 R² = 0.5716
1.25%
1.50%
1.75%
2.00%
2.25%
2.50%
2.75%
3.00%
3.25%
$0.00 $1.00 $2.00 $3.00 $4.00 $5.00 $6.00 $7.00 Med
ian
resi
dent
ial p
rope
rty ta
xes
paid
as
a pe
rcen
t of m
edia
n ow
ner-
occu
pied
hom
e va
lue
[1]
Tax rate per $1,000 of 2011 taxable full value necessary to cover county's 2011-2012 Medicaid costs
There is a very strong correlation between (a) counties' Medicaid costs relative to the strength of their tax bases and (b) the relationship of residential property tax bills to home values.
[1] Uses 2008-12 American Community Survey county level data. Does not include Westchester County where the ACS estimate for median real estate taxes paid is "$10,000+".
96

0
500,000
1,000,000
1,500,000
2,000,000
2,500,000
3,000,000
3,500,000
Num
ber o
f foo
d st
amps
reci
pien
ts
New York State
New York City
Rest of state (ROS)
Source: NYS Office of Temporary and Disability Assistance.
Close to 3.2 million New Yorkers now receive food stamps, a number that has increased by three-fourths since the start of the 2008-2009 recession.
Percent increase in food stamp recipients, Oct. 2007 - Oct. 2013
NYS NYC ROS 73.6% 65.7% 86.1%
97

73.6%
16.1%
29.6% 27.2%
0%
10%
20%
30%
40%
50%
60%
70%
80%
90%
% change in recipients/enrollees Oct. 2007-Aug. 2013 Recipients/enrollees as share of NYS population
Food stamps/SNAP recipients
Medicaid enrollees
Note: *The federal food stamp program is now called Supplemental Nutrition Assistance Program (SNAP). Source: FPI's analysis of data from NYS Office of Temporary and Disability Assistance and NYS Department of Health.
Participation in food stamps* and Medicaid has risen sharply since the start of the Great Recession. One in six New York State residents now receive food stamps, and more than one in four are enrolled in Medicaid.
98

0
100,000
200,000
300,000
400,000
500,000
600,000
700,000
800,000
900,000
Num
ber o
f fam
ily a
ssis
tanc
e an
d sa
fety
net
ass
ista
nce
reci
pien
ts
New York State
New York City
Rest of New York State (ROS)
Source: NYS Office of Temporary and Disability Assistance (http://otda.ny.gov/resources/caseload/).
Percent changes, Oct. 2008-Oct. 2013 NYS NYC ROS 12.4% 1.4% 34.1%
The number of public assistance recipients grew by a third in NYS outside of NYC over the past 5 years. City policy under the previous administration discouraged needy NYC residents from applying for help.
99
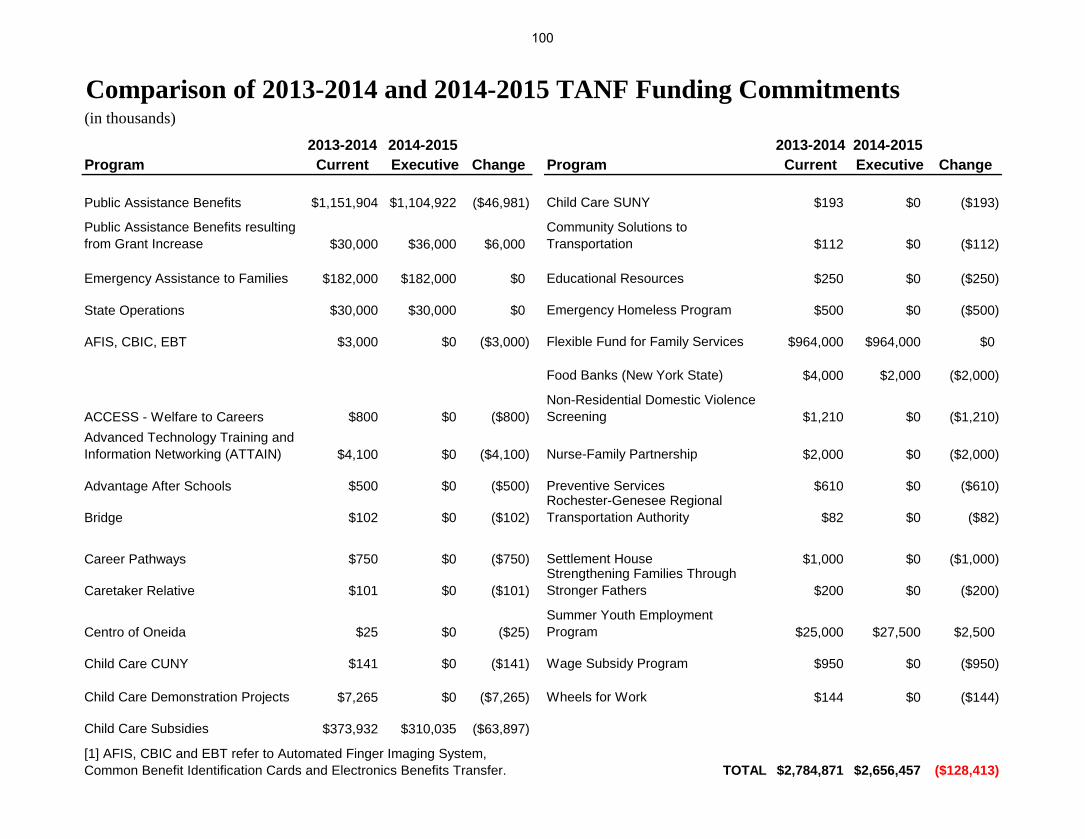
2013-2014 2014-2015 2013-2014 2014-2015 Program Current Executive Change Program Current Executive Change
Public Assistance Benefits $1,151,904 $1,104,922 ($46,981) Child Care SUNY $193 $0 ($193)
Public Assistance Benefits resulting from Grant Increase $30,000 $36,000 $6,000
Community Solutions to Transportation $112 $0 ($112)
Emergency Assistance to Families $182,000 $182,000 $0 Educational Resources $250 $0 ($250)
State Operations $30,000 $30,000 $0 Emergency Homeless Program $500 $0 ($500)
AFIS, CBIC, EBT $3,000 $0 ($3,000) Flexible Fund for Family Services $964,000 $964,000 $0
Food Banks (New York State) $4,000 $2,000 ($2,000)
ACCESS - Welfare to Careers $800 $0 ($800)Non-Residential Domestic Violence Screening $1,210 $0 ($1,210)
Advanced Technology Training and Information Networking (ATTAIN) $4,100 $0 ($4,100) Nurse-Family Partnership $2,000 $0 ($2,000)
Advantage After Schools $500 $0 ($500) Preventive Services $610 $0 ($610)
Bridge $102 $0 ($102)Rochester-Genesee Regional Transportation Authority $82 $0 ($82)
Career Pathways $750 $0 ($750) Settlement House $1,000 $0 ($1,000)
Caretaker Relative $101 $0 ($101)Strengthening Families Through Stronger Fathers $200 $0 ($200)
Centro of Oneida $25 $0 ($25)Summer Youth Employment Program $25,000 $27,500 $2,500
Child Care CUNY $141 $0 ($141) Wage Subsidy Program $950 $0 ($950)
Child Care Demonstration Projects $7,265 $0 ($7,265) Wheels for Work $144 $0 ($144)
Child Care Subsidies $373,932 $310,035 ($63,897)
TOTAL $2,784,871 $2,656,457 ($128,413)
(in thousands)Comparison of 2013-2014 and 2014-2015 TANF Funding Commitments
[1] AFIS, CBIC and EBT refer to Automated Finger Imaging System, Common Benefit Identification Cards and Electronics Benefits Transfer.
100

Progressive, Proportional and Regressive Tax Systems
10.02% 10.37%
11.89% 11.42% 11.04% 11.00%
6.85%
4%
6%
8%
10%
12%
14%
16%
Lowest 20%
Second 20%
Middle 20%
Fourth 20%
Next 15%
Next 4% Top 1%
New York
5.52% 6.52%
7.52% 8.52%
9.52% 10.52%
11.52%
4%
6%
8%
10%
12%
14%
16%
Lowest 20%
Second 20%
Middle 20%
Fourth 20%
Next 15%
Next 4% Top 1%
Progressive
9.74% 9.74% 9.74% 9.74% 9.74% 9.74% 9.74%
4%
6%
8%
10%
12%
14%
16%
Lowest 20%
Second 20%
Middle 20%
Fourth 20%
Next 15%
Next 4% Top 1%
Proportional
13.97% 12.97%
11.97% 10.97%
9.97% 8.97%
7.97%
4%
6%
8%
10%
12%
14%
16%
Lowest 20%
Second 20%
Middle 20%
Fourth 20%
Next 15%
Next 4% Top 1%
Regressive
101

NYS seasonally adjusted employment Mar-2008 Dec-2013Change 03/08 - 12/13
% change 03/08 - 12/13
2012 avg. ann. wage
High wage industries (>$75,000)Finance and Insurance 541,702 500,928 -40,774 -7.5% $200,669Management of Companies and Enterprises 132,067 133,565 1,498 1.1% $144,487Utilities 38,460 35,774 -2,687 -7.0% $109,061Information 270,049 255,880 -14,169 -5.2% $100,346Professional and Technical Services 580,310 607,881 27,571 4.8% $96,222Performing Arts and Spectator Sports 49,031 49,214 183 0.4% $85,163Wholesale Trade 355,766 334,386 -21,379 -6.0% $77,874Sub-total high-wage industries 1,967,385 1,917,628 -49,757 -2.5%Middle-wage industries ($45,000-$75,000)Hospitals 341,237 358,635 17,397 5.1% $65,292Private colleges and universities * 237,420 296,598 59,178 24.9% $64,040Construction 363,038 317,027 -46,011 -12.7% $62,461Ambulatory Health Care (ex. Home Health)* 285,207 319,773 34,566 12.1% $61,640Manufacturing 539,593 442,857 -96,736 -17.9% $61,025Real Estate 159,141 153,646 -5,495 -3.5% $60,100Government 1,507,433 1,440,911 -66,521 -4.4% $56,252Transportation and Warehousing 238,632 235,702 -2,930 -1.2% $45,435Sub-total middle-wage industries 3,671,701 3,565,149 -106,552 -2.9%Low-wage industries (<$45,000)Museums, Parks and Historical Sites 16,734 18,050 1,317 7.9% $43,993Administrative and Waste Services 443,408 454,885 11,477 2.6% $43,778Accommodation 82,041 86,966 4,926 6.0% $42,210Educ. Serv. (ex. private colleges & univs.)* 134,295 144,453 10,158 7.6% $39,875Other Services 367,295 384,096 16,800 4.6% $34,879Nursing and Residential Care Facilities 231,052 237,259 6,207 2.7% $33,288Retail Trade 904,209 939,385 35,176 3.9% $30,734Home Health Care Services* 95,242 144,457 49,215 51.7% $27,686Social Assistance 296,825 327,359 30,534 10.3% $26,206Amusement, Gambling & Recreation 74,794 77,916 3,122 4.2% $23,310Food Services and Drinking Places 493,584 590,807 97,222 19.7% $20,519Sub-total low-wage industries 3,139,478 3,405,634 266,156 8.5%Sum of sub-totals 8,778,565 8,888,411 109,846 1.3%
Share of high wage industries in total jobs 22.3% 21.5%Share of middle wage industries in total jobs 41.6% 40.0%Share of low wage industries in total jobs 35.6% 38.2%
Total Private 7,306,082 7,476,317 170,236 2.3%Total Nonfarm 8,817,714 8,920,234 102,520 1.2%
Note: Low wage industry: ann. avg. wage is below $45K; high wage industry is those whose ann. avg. wage is above $75K. The middle wage industry is in between.
Source: FPI's seasonal adjustment of CES employment data and QCEW annual average wage data from NYSDOL.
*Because the New York State Department of Labor stopped reporting annual wages at this industry level in 2012, 2011 annual wage levels used for the purposes of assigning these industries to a wage group.
New York State's net job gains since the recession began have been concentrated in industries with low average wages while there are more than 100,000 fewer jobs in middle-wage industries.
102

0
5
10
15
20
25
30
1Q 2006
3Q 2006
1Q 2007
3Q 2007
1Q 2008
3Q 2008
1Q 2009
3Q 2009
1Q 2010
3Q 2010
1Q 2011
3Q 2011
1Q 2012
3Q 2012
1Q 2013
3Q 2013
Per
cent
of h
ome
mor
tgag
e de
bt
National Avg. CA
FL NJ
NV NY
Source: Federal Reserve Bank of New York, Percent of Mortgage Debt 90+ days late by state, Quarterly Report on Household Debt and Credit, November 2013.
While New York has homeowner protections to slow the foreclosure process, the percentage of home mortgage debt that is more than 90 days late is double the national average.
103