Embed Size (px)
Citation preview
New York Science Journal 2012;5(12) http://www.sciencepub.net/newyork
217
Integrated Geophysical Investigation to Identify Um-Bogma Formation in Wadi El-Dabbabat, Abu-Zeneima Area, Southwestern Sinai, Egypt
Mahmoud I. Mira, Ahmed A. Nigm and Mohamed A. S. Youssef
Nuclear Materials Authority, P. O. Box 530, El Maadi, Cairo, Egypt
Abstract: Due to its economical importance as a source of manganese ores and the uraniferous zones in Abu-Zeneima area, Um-Bogma Formation comes in the fist as a valuable target for the workers in the field of nuclear raw materials. The geophysical field observations proved that Um-Bogma Formation is preserved in subsurface in Wadi El-Dabbabat area. The geoelectric, shallow seismic refraction and magnetic tools are used in the study area to detect, identify and delineate Um-Bogma Formation since it represents the main target of the study. The Vertical Electrical Sounding (VES) data were analyzed using two 1D software packages; Ato program (Zohdy and Bisdorf, 1989) and Resist program (Velpen, 1987). The shallow refraction seismic data were analyzed using the delay time method and the resulting depth velocity models were generated using the advanced finite difference (FD) technique. A geomagnetic model was established by the GM-Sys software package. The results obtained from the three methods are integrated in order to verify each other. The average depth to the basement rocks is calculated from the magnetic model as 220 m which is nearly comparable with that obtained from VES data as 202 m. The VES data revealed also that the lithology of the area is composed of four subsurface geoelectric layers overlying the basement and Um-Bogma formation appears at average depth of 31.6 m with average thickness reaches to 22.2 m and average resistivity value 145.5 Ohm.m. The shallow refraction seismic method could distinguish the lithologic units of upper sandstone series as well as Um-Bogma formation which appear at varying depth with an average value 36 m. while; its average thickness reaches to 20 m. The p-wave velocity characterizing Um-Bogma formation varies between 4600 – 5000 m/s. [Mahmoud I. Mira, Ahmed A. Nigm and Mohamed A. S. Youssef. Integrated Geophysical Investigation to Identify Um-Bogma Formation in Wadi El-Dabbabat, Abu-Zeneima Area, Southwestern Sinai, Egypt. N Y Sci J 2012;5(12):217-226]. (ISSN: 1554-0200). http://www.sciencepub.net/newyork. 35 Keywords: Ves, Seismic Refraction Survey and Um-Bogma Formation 1. Introduction:
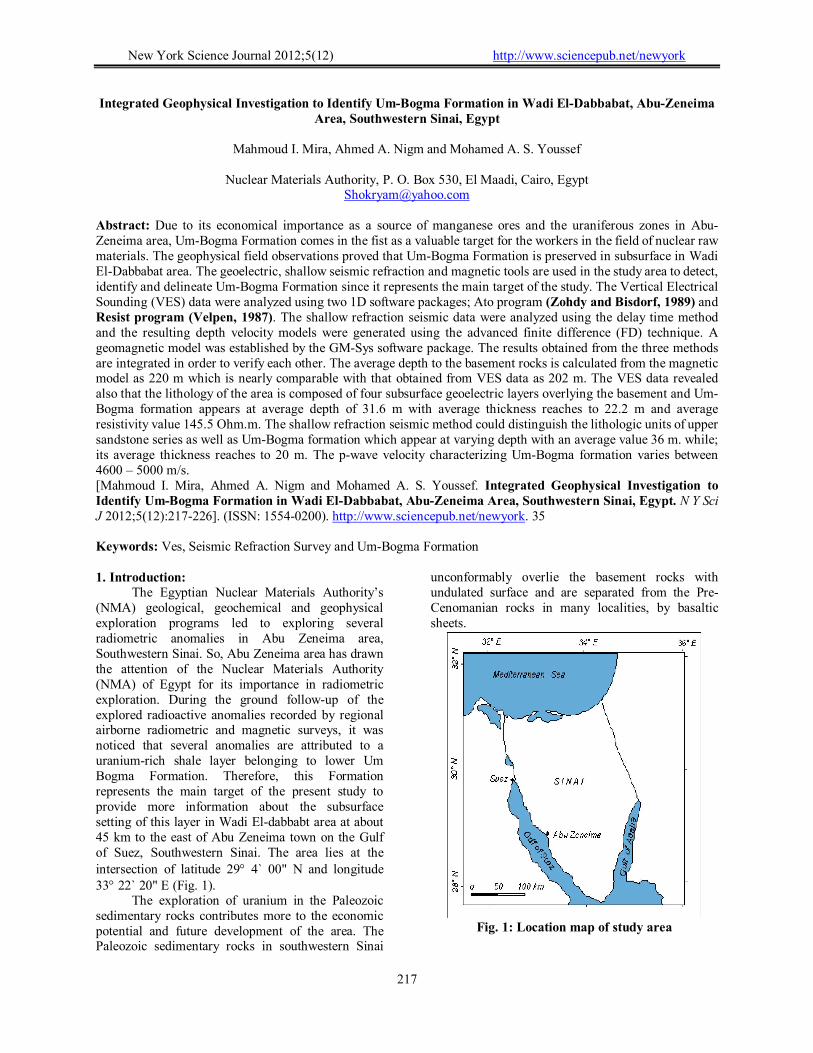
The Egyptian Nuclear Materials Authority’s (NMA) geological, geochemical and geophysical exploration programs led to exploring several radiometric anomalies in Abu Zeneima area, Southwestern Sinai. So, Abu Zeneima area has drawn the attention of the Nuclear Materials Authority (NMA) of Egypt for its importance in radiometric exploration. During the ground follow-up of the explored radioactive anomalies recorded by regional airborne radiometric and magnetic surveys, it was noticed that several anomalies are attributed to a uranium-rich shale layer belonging to lower Um Bogma Formation. Therefore, this Formation represents the main target of the present study to provide more information about the subsurface setting of this layer in Wadi El-dabbabt area at about 45 km to the east of Abu Zeneima town on the Gulf of Suez, Southwestern Sinai. The area lies at the intersection of latitude 29 4` 00" N and longitude 33 22` 20" E (Fig. 1).
The exploration of uranium in the Paleozoic sedimentary rocks contributes more to the economic potential and future development of the area. The Paleozoic sedimentary rocks in southwestern Sinai
unconformably overlie the basement rocks with undulated surface and are separated from the Pre-Cenomanian rocks in many localities, by basaltic sheets.
Fig. 1: Location map of study area
New York Science Journal 2012;5(12) http://www.sciencepub.net/newyork
218
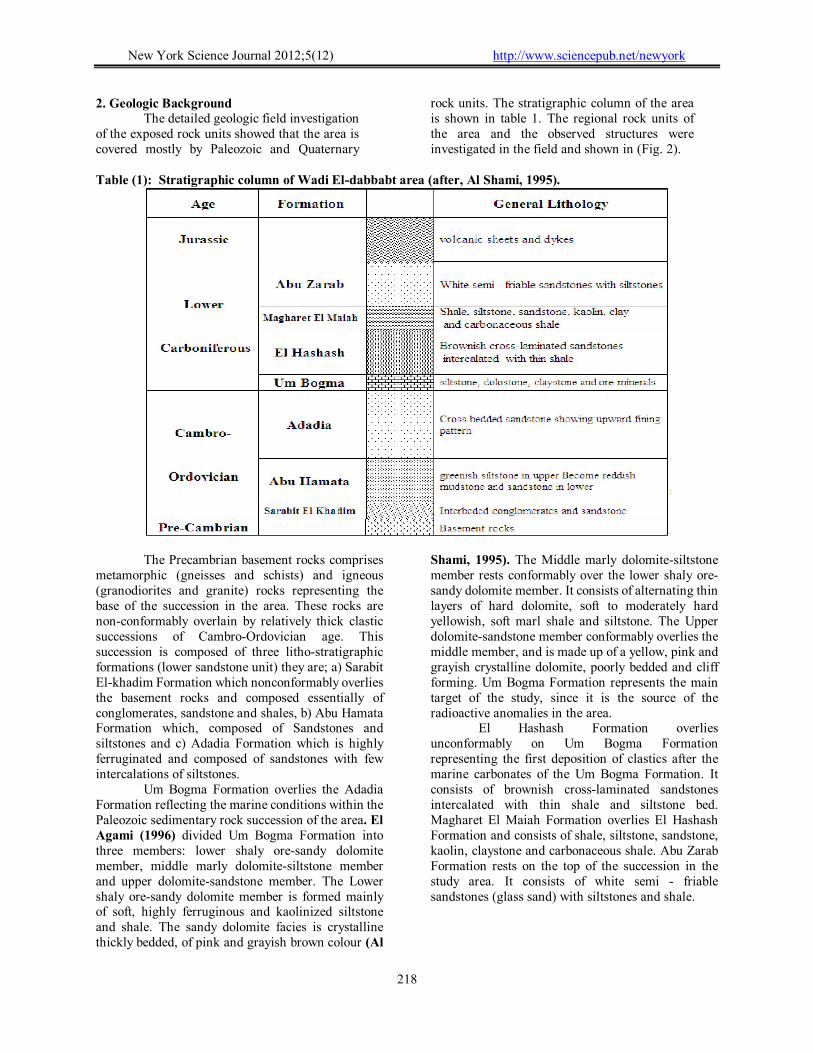
2. Geologic Background The detailed geologic field investigation
of the exposed rock units showed that the area is covered mostly by Paleozoic and Quaternary
rock units. The stratigraphic column of the area is shown in table 1. The regional rock units of the area and the observed structures were investigated in the field and shown in (Fig. 2).
Table (1): Stratigraphic column of Wadi El-dabbabt area (after, Al Shami, 1995).
The Precambrian basement rocks comprises metamorphic (gneisses and schists) and igneous (granodiorites and granite) rocks representing the base of the succession in the area. These rocks are non-conformably overlain by relatively thick clastic successions of Cambro-Ordovician age. This succession is composed of three litho-stratigraphic formations (lower sandstone unit) they are; a) Sarabit El-khadim Formation which nonconformably overlies the basement rocks and composed essentially of conglomerates, sandstone and shales, b) Abu Hamata Formation which, composed of Sandstones and siltstones and c) Adadia Formation which is highly ferruginated and composed of sandstones with few intercalations of siltstones. Um Bogma Formation overlies the Adadia Formation reflecting the marine conditions within the Paleozoic sedimentary rock succession of the area. El Agami (1996) divided Um Bogma Formation into three members: lower shaly ore-sandy dolomite member, middle marly dolomite-siltstone member and upper dolomite-sandstone member. The Lower shaly ore-sandy dolomite member is formed mainly of soft, highly ferruginous and kaolinized siltstone and shale. The sandy dolomite facies is crystalline thickly bedded, of pink and grayish brown colour (Al
Shami, 1995). The Middle marly dolomite-siltstone member rests conformably over the lower shaly ore-sandy dolomite member. It consists of alternating thin layers of hard dolomite, soft to moderately hard yellowish, soft marl shale and siltstone. The Upper dolomite-sandstone member conformably overlies the middle member, and is made up of a yellow, pink and grayish crystalline dolomite, poorly bedded and cliff forming. Um Bogma Formation represents the main target of the study, since it is the source of the radioactive anomalies in the area.
El Hashash Formation overlies unconformably on Um Bogma Formation representing the first deposition of clastics after the marine carbonates of the Um Bogma Formation. It consists of brownish cross-laminated sandstones intercalated with thin shale and siltstone bed. Magharet El Maiah Formation overlies El Hashash Formation and consists of shale, siltstone, sandstone, kaolin, claystone and carbonaceous shale. Abu Zarab Formation rests on the top of the succession in the study area. It consists of white semi - friable sandstones (glass sand) with siltstones and shale.
New York Science Journal 2012;5(12) http://www.sciencepub.net/newyork
219
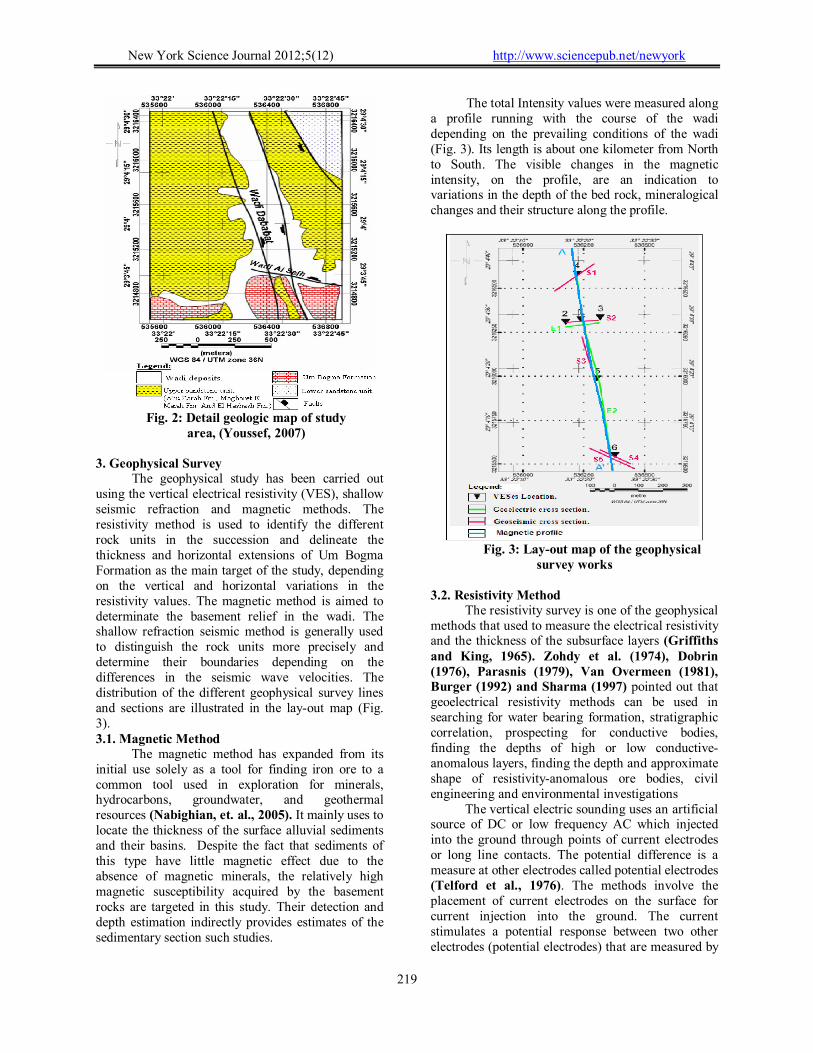
Fig. 2: Detail geologic map of study
area, (Youssef, 2007) 3. Geophysical Survey
The geophysical study has been carried out using the vertical electrical resistivity (VES), shallow seismic refraction and magnetic methods. The resistivity method is used to identify the different rock units in the succession and delineate the thickness and horizontal extensions of Um Bogma Formation as the main target of the study, depending on the vertical and horizontal variations in the resistivity values. The magnetic method is aimed to determinate the basement relief in the wadi. The shallow refraction seismic method is generally used to distinguish the rock units more precisely and determine their boundaries depending on the differences in the seismic wave velocities. The distribution of the different geophysical survey lines and sections are illustrated in the lay-out map (Fig. 3). 3.1. Magnetic Method
The magnetic method has expanded from its initial use solely as a tool for finding iron ore to a common tool used in exploration for minerals, hydrocarbons, groundwater, and geothermal resources (Nabighian, et. al., 2005). It mainly uses to locate the thickness of the surface alluvial sediments and their basins. Despite the fact that sediments of this type have little magnetic effect due to the absence of magnetic minerals, the relatively high magnetic susceptibility acquired by the basement rocks are targeted in this study. Their detection and depth estimation indirectly provides estimates of the sedimentary section such studies.
The total Intensity values were measured along a profile running with the course of the wadi depending on the prevailing conditions of the wadi (Fig. 3). Its length is about one kilometer from North to South. The visible changes in the magnetic intensity, on the profile, are an indication to variations in the depth of the bed rock, mineralogical changes and their structure along the profile.
Fig. 3: Lay-out map of the geophysical
survey works 3.2. Resistivity Method
The resistivity survey is one of the geophysical methods that used to measure the electrical resistivity and the thickness of the subsurface layers (Griffiths and King, 1965). Zohdy et al. (1974), Dobrin (1976), Parasnis (1979), Van Overmeen (1981), Burger (1992) and Sharma (1997) pointed out that geoelectrical resistivity methods can be used in searching for water bearing formation, stratigraphic correlation, prospecting for conductive bodies, finding the depths of high or low conductive-anomalous layers, finding the depth and approximate shape of resistivity-anomalous ore bodies, civil engineering and environmental investigations
The vertical electric sounding uses an artificial source of DC or low frequency AC which injected into the ground through points of current electrodes or long line contacts. The potential difference is a measure at other electrodes called potential electrodes (Telford et al., 1976). The methods involve the placement of current electrodes on the surface for current injection into the ground. The current stimulates a potential response between two other electrodes (potential electrodes) that are measured by
New York Science Journal 2012;5(12) http://www.sciencepub.net/newyork
220
a voltmeter. Resistivity (measured in ohm-m) can be calculated from the geometry and spacing of the electrodes, the current injected, and the voltage response.
Vertical electrical sounding (VES) is designed to provide vertical profiles of resistivity versus depth. Although most electrode configurations can be used for VES, the Schlumberger arrangement (Fig. 4) offers an advantage where only two electrodes can be moved at a time. The mid-point of the array is kept fixed while the current and potential electrodes are maintained at the same relative spacing and the whole spread is progressively expanded about the center. Consequently, readings are taken as the current reaches progressively greater depths. The total of 6 soundings was carried out in this wadi using a French instrument "Elrec-T" which has a transmitter and receiver in the same unit with high power signals.
Fig. 4: Schematic diagram showing
Schlumberger Array geometry
3.3. Shallow Refraction Seismic Method Seismic refraction method has a wide
application in geological, geotechnical and archaeological applications as well as groundwater exploration. In the present study, the main application of the seismic refraction is to delineate subsurface layering and structures depending on the velocities of seismic waves. The shallow seismic survey was carried out using, 24 channels seismograph Model-1125E McSEIS-SX, 24 highly sensitive vertical geophones and Dina-source (EWG-Seismic Trigger Radio Link RL-100), with one ton drop. Two offend spreads (forward and reverse) were designed for this survey according to the geological information and the aim of the study.
Five geoseismic cross sections are constructed in the study area; these sections reflect the number of layers penetrated by the seismic waves. Also, the type of lithology of each layer is determined according to the values of velocities of seismic waves through layers and the geologic structures that may affect the shallow subsurface section. 4. Interpretation and Discussion 4.1. Magnetic Modeling
Inversion algorithms within a software program; GM-SYS was used to compute an earth model based on the observed field data and a user-specified starting model. The inversion is used to
optimize the initial model. The forward model incorporates a two-dimensional, flat earth model that is based on geological constrains; the difference between the observed magnetic data and calculated magnetic response to this model (Talwani and Heirtzler, 1964) is minimized by reshaping the model, or by altering the susceptibility of the structural units. Measured susceptibility can constrain the models to geologically reasonable ones. The most geologically reasonable model that fit the data is chosen.
The 2-d interactive magnetic modeling was carried out on the magnetic profile A-A' which is measured longitudinally from the North to the South direction. This process aims to map the basement relief in order to confirm the depths of basement rocks calculated from the resistivity data.
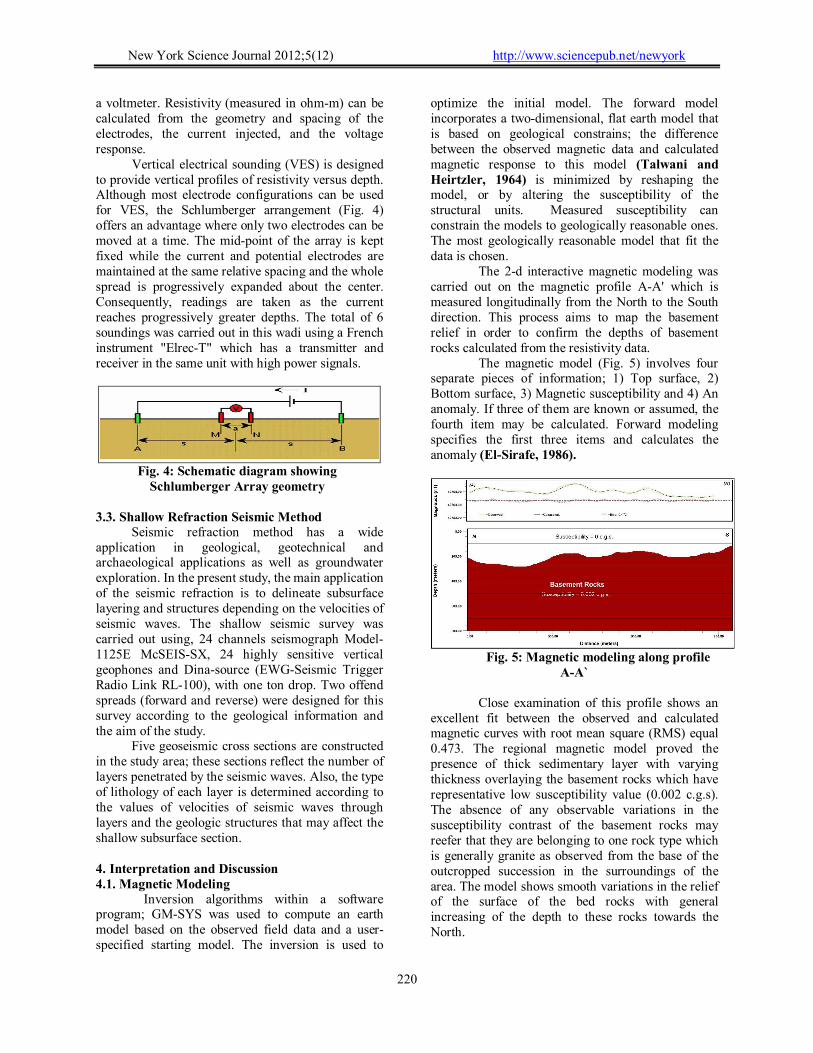
The magnetic model (Fig. 5) involves four separate pieces of information; 1) Top surface, 2) Bottom surface, 3) Magnetic susceptibility and 4) An anomaly. If three of them are known or assumed, the fourth item may be calculated. Forward modeling specifies the first three items and calculates the anomaly (El-Sirafe, 1986).
Fig. 5: Magnetic modeling along profile
A-A`
Close examination of this profile shows an excellent fit between the observed and calculated magnetic curves with root mean square (RMS) equal 0.473. The regional magnetic model proved the presence of thick sedimentary layer with varying thickness overlaying the basement rocks which have representative low susceptibility value (0.002 c.g.s). The absence of any observable variations in the susceptibility contrast of the basement rocks may reefer that they are belonging to one rock type which is generally granite as observed from the base of the outcropped succession in the surroundings of the area. The model shows smooth variations in the relief of the surface of the bed rocks with general increasing of the depth to these rocks towards the North.
New York Science Journal 2012;5(12) http://www.sciencepub.net/newyork
221
4.2. Vertical Electrical Sounding (VES) The VES field data were treated to reduce the
different segments of the sounding curve into a continuous curve, to clean out the noise from the curve and to plot the corrected sounding curve. Therefore, the data analysis was performed using suitable modern two geoelectric software to obtain the equivalent true resistivity models for each sounding. The first is the Ato program of Zohdy and Bisdorf (1989), that is used to convert the values of (AB/2) and (ρa) into a multi-layer model. It is a fully automated, fast iterative method based on obtaining interpreted depths and true formation resistivities from shifted electrode spacing and adjusted apparent resistivities respectively. The n-layer model can provide additional information about the subsurface variations within any suggested geoelectric layer (Sadek, et al., 1989). Due to the lack of subsurface geological information in this area, the n-layer model can be used to construct an initial model to feed the second 1D modeling program (Resist of Velpen, 1987) and helps to obtain the equivalent true resistivity models for each sounding. It is an automated and interactive semi-automated program for vertical electrical sounding interpretation. The justification of the final model is controlled by calculating the root mean square error (RMS error) between the resistivity data resulted from the preliminary curve and the calculated one.
It is worth to mention that, the simplified interpreted curves of the Ato program (Zohdy and Bisdorf, 1989), in addition to the regional background on the geology of the area, are used to construct a preliminary model that would fairly fit the observed field curves. This is after a minimum number of non-automatic iterations, which in turns represent the input model for the Resist program.
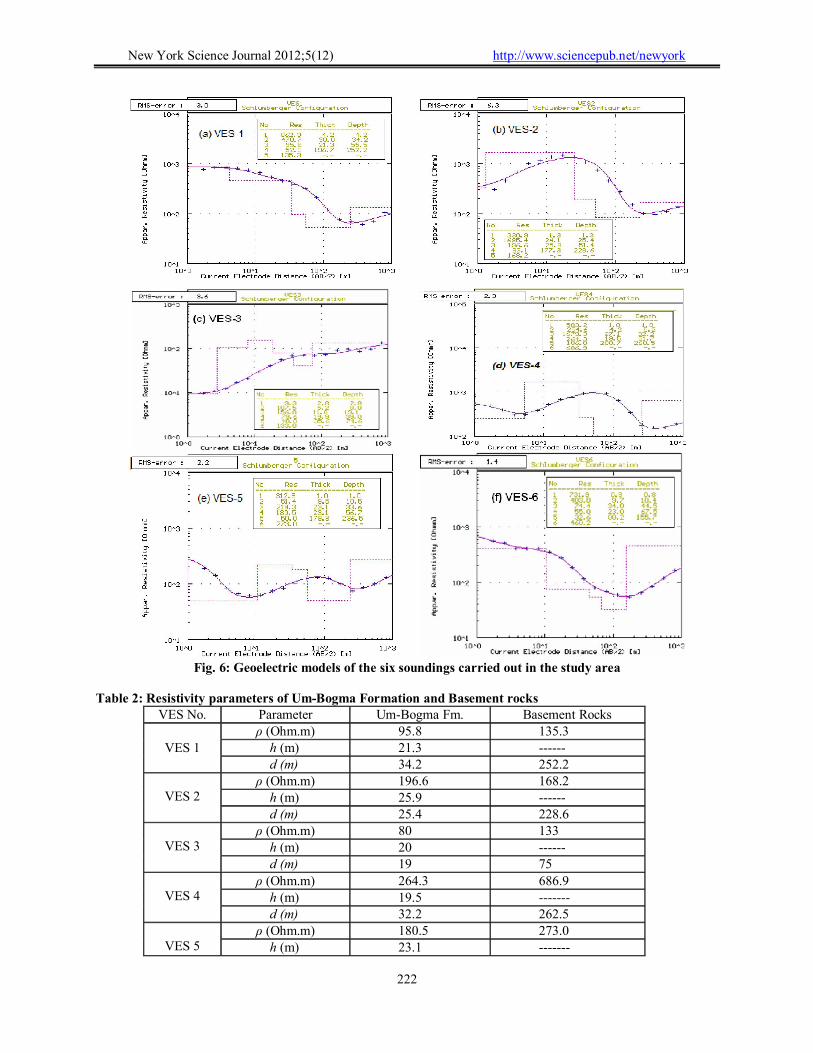
Because an interpreter has no a prior information about the exact number of layers which constitute the geoelectric section at a locality, it is customary to assume a number of layers ranging between three and six at the most. If the geoelectric section is made of many more layers than has been assumed, each of the interpreted layers would represent a grouping together of several layers (Kunetz, 1966). Accordingly, the resultant iterative resistivity models for the total six soundings consists of five to six layers, however the first look on the curve types could classify most of them into four layers (Fig. 6). The absence of actual well logs in the study area, led the interpreter to take into consideration the geological background of the area. It was observed from the behavior of the six soundings that they area completely different. This
observation may be attributed to a big variation in the composition of the lithological rock units and their contents of intercalations.
The layering models (Fig. 6) enable the interpreter to calculate the different parameters; resistivity values, depth and thickness of each layer. Since the main target of the study is Um Bogma Formation, the obtained data of this formation and that of basement as the last layer are summarized and presented in table 2.
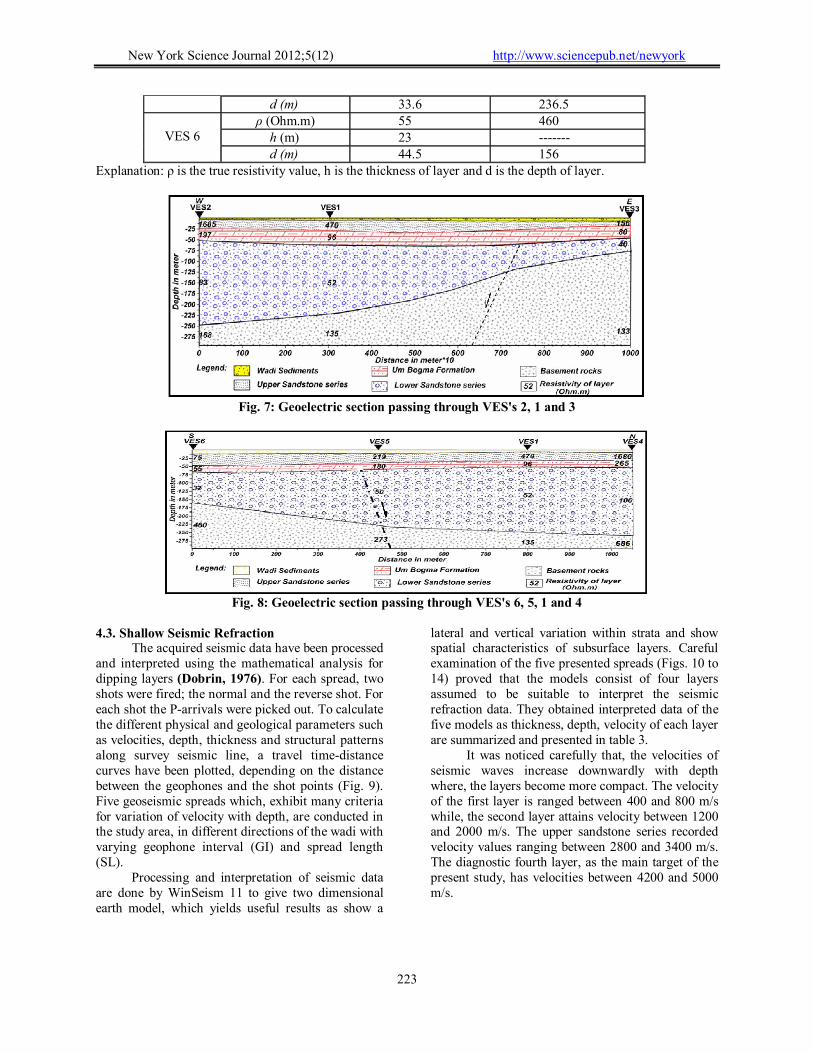
In order to facilitate the interpretation, two subsurface geoelectric cross section were graphically generated along and across the wadi (Figs 7 and 8). In this regard, the authors follow Bisdorf (1982), who stated that the resistivity cross sections are generated from individual sounding interpretations. Each sounding interpretation is sampled in a manner to approximate a continuous vertical distribution of resistivity with depth. Triangles on the upper surface of the cross section designate the sounding locations.
Close examination of the six VES models show that they are differ in their shape and behavior, hence, the resistivity values, layer thicknesses and depth are relatively different for a layer. In spite of most soundings have models more than four layers overlying the basement rocks, the first layer which attains high resistivity value (490 Ohm.m. as average value) and little thickness (1.8 m as average value), reflects dry wadi sediments. The upper sandstone series reaches to 20.5 m thickness and follows the wadi sediments at nearly 1.8 m depth as the second layer. It split into two layers in the four soundings nos. 3, 4, 5 and 6 due to its varying composition with intercalated constituents.
The Um-Bogma Formation could be distinguished as the third or fourth layer at average depth of 31.6 m with average resistivity value 145.5 Ohm.m and average thickness 22.2 m (table 2). The Adadia, Sarabit El-khadim andAbu Hamata formations are grouped as one layer underlies the Um-Bogma Formation and overlies the basement rocks. This layer appears at average depth about 54 m with average thickness about 147.7 m. It has low resistivity (60 Ohm.m as average value) due to its huge thickness with clay and shales as main constituents especially, in Sarabit El-khadim andAbu Hamata. The last layer of basement rocks appears at 202 m depth; however, its depth remarkably decreases at the location of VES 3 to reach 75 m due to a probable faulting with downthrown towards the West direction and at the location of VES 6 (155.7 m) due to a probable faulting also with downthrown towards the North.
New York Science Journal 2012;5(12) http://www.sciencepub.net/newyork
222
Fig. 6: Geoelectric models of the six soundings carried out in the study area
Table 2: Resistivity parameters of Um-Bogma Formation and Basement rocks
VES No. Parameter Um-Bogma Fm. Basement Rocks
VES 1 ρ (Ohm.m) 95.8 135.3
h (m) 21.3 ------ d (m) 34.2 252.2
VES 2
ρ (Ohm.m) 196.6 168.2 h (m) 25.9 ------ d (m) 25.4 228.6
VES 3
ρ (Ohm.m) 80 133 h (m) 20 ------ d (m) 19 75
VES 4
ρ (Ohm.m) 264.3 686.9 h (m) 19.5 ------- d (m) 32.2 262.5
VES 5
ρ (Ohm.m) 180.5 273.0 h (m) 23.1 -------
New York Science Journal 2012;5(12) http://www.sciencepub.net/newyork
223
d (m) 33.6 236.5
VES 6 ρ (Ohm.m) 55 460
h (m) 23 ------- d (m) 44.5 156
Explanation: ρ is the true resistivity value, h is the thickness of layer and d is the depth of layer.
Fig. 7: Geoelectric section passing through VES's 2, 1 and 3
Fig. 8: Geoelectric section passing through VES's 6, 5, 1 and 4
4.3. Shallow Seismic Refraction
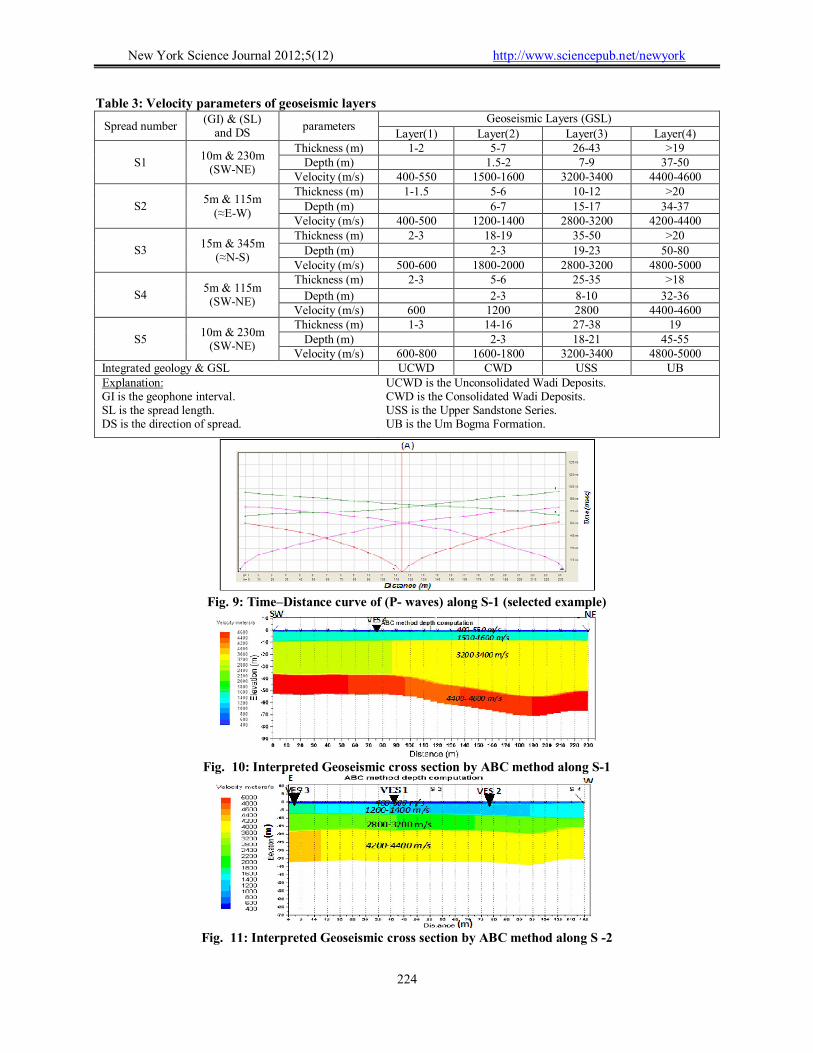
The acquired seismic data have been processed and interpreted using the mathematical analysis for dipping layers (Dobrin, 1976). For each spread, two shots were fired; the normal and the reverse shot. For each shot the P-arrivals were picked out. To calculate the different physical and geological parameters such as velocities, depth, thickness and structural patterns along survey seismic line, a travel time-distance curves have been plotted, depending on the distance between the geophones and the shot points (Fig. 9). Five geoseismic spreads which, exhibit many criteria for variation of velocity with depth, are conducted in the study area, in different directions of the wadi with varying geophone interval (GI) and spread length (SL).
Processing and interpretation of seismic data are done by WinSeism 11 to give two dimensional earth model, which yields useful results as show a
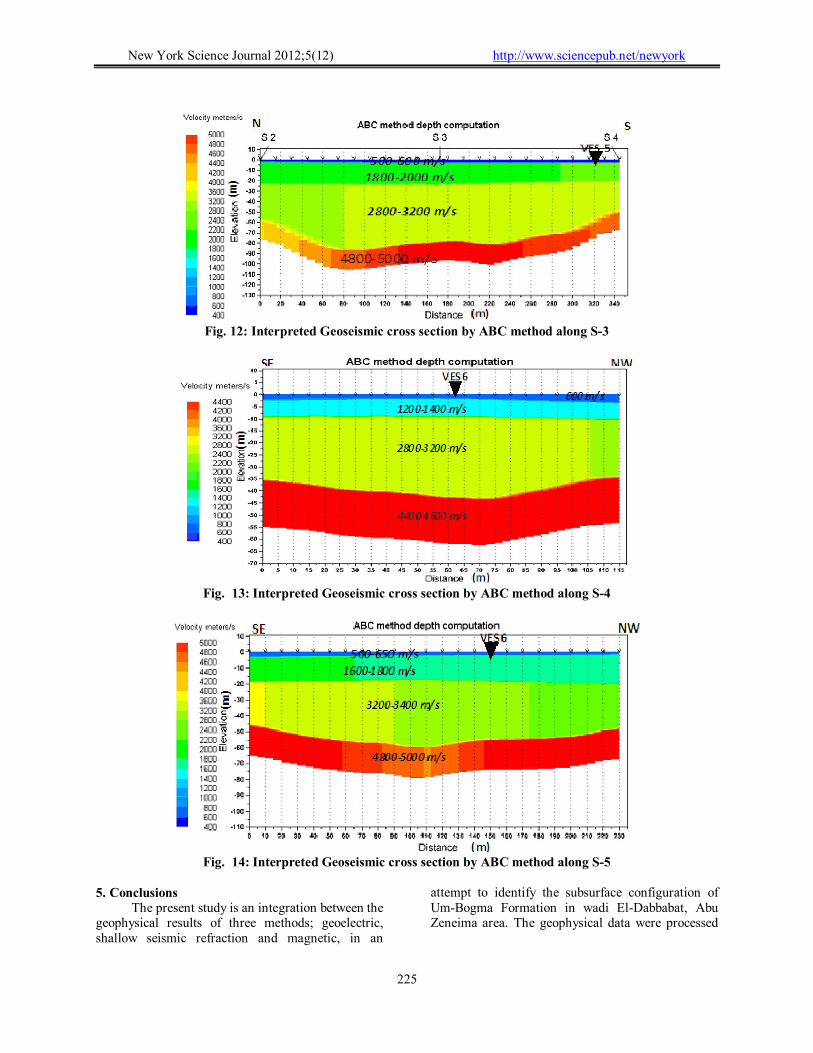
lateral and vertical variation within strata and show spatial characteristics of subsurface layers. Careful examination of the five presented spreads (Figs. 10 to 14) proved that the models consist of four layers assumed to be suitable to interpret the seismic refraction data. They obtained interpreted data of the five models as thickness, depth, velocity of each layer are summarized and presented in table 3.
It was noticed carefully that, the velocities of seismic waves increase downwardly with depth where, the layers become more compact. The velocity of the first layer is ranged between 400 and 800 m/s while, the second layer attains velocity between 1200 and 2000 m/s. The upper sandstone series recorded velocity values ranging between 2800 and 3400 m/s. The diagnostic fourth layer, as the main target of the present study, has velocities between 4200 and 5000 m/s.
New York Science Journal 2012;5(12) http://www.sciencepub.net/newyork
224
Table 3: Velocity parameters of geoseismic layers
Spread number (GI) & (SL)
and DS parameters
Geoseismic Layers (GSL)
Layer(1) Layer(2) Layer(3) Layer(4)
S1 10m & 230m
(SW-NE)
Thickness (m) 1-2 5-7 26-43 >19 Depth (m) 1.5-2 7-9 37-50
Velocity (m/s) 400-550 1500-1600 3200-3400 4400-4600
S2 5m & 115m
(≈E-W)
Thickness (m) 1-1.5 5-6 10-12 >20 Depth (m) 6-7 15-17 34-37
Velocity (m/s) 400-500 1200-1400 2800-3200 4200-4400
S3 15m & 345m
(≈N-S)
Thickness (m) 2-3 18-19 35-50 >20 Depth (m) 2-3 19-23 50-80
Velocity (m/s) 500-600 1800-2000 2800-3200 4800-5000
S4 5m & 115m
(SW-NE)
Thickness (m) 2-3 5-6 25-35 >18
Depth (m) 2-3 8-10 32-36 Velocity (m/s) 600 1200 2800 4400-4600
S5 10m & 230m
(SW-NE)
Thickness (m) 1-3 14-16 27-38 19 Depth (m) 2-3 18-21 45-55
Velocity (m/s) 600-800 1600-1800 3200-3400 4800-5000 Integrated geology & GSL UCWD CWD USS UB
nation:Expla GI is the geophone interval. SL is the spread length. DS is the direction of spread.
UCWD is the Unconsolidated Wadi Deposits. CWD is the Consolidated Wadi Deposits. USS is the Upper Sandstone Series. UB is the Um Bogma Formation.
Fig. 9: Time–Distance curve of (P- waves) along S-1 (selected example)
Fig. 10: Interpreted Geoseismic cross section by ABC method along S-1
Fig. 11: Interpreted Geoseismic cross section by ABC method along S -2
New York Science Journal 2012;5(12) http://www.sciencepub.net/newyork
225
Fig. 12: Interpreted Geoseismic cross section by ABC method along S-3
Fig. 13: Interpreted Geoseismic cross section by ABC method along S-4
Fig. 14: Interpreted Geoseismic cross section by ABC method along S-5
5. Conclusions
The present study is an integration between the geophysical results of three methods; geoelectric, shallow seismic refraction and magnetic, in an
attempt to identify the subsurface configuration of Um-Bogma Formation in wadi El-Dabbabat, Abu Zeneima area. The geophysical data were processed
New York Science Journal 2012;5(12) http://www.sciencepub.net/newyork
226
and analyzed using modern software packages in order to facilitate the interpretation.
The results obtained from the three methods are integrated and confirmed each other. The geoelectric sounding showed that the target of the study appears at an average depth about 31.6 m with moderate resistivity value 145.5 Ohm.m and average thickness 22.2 m. The shallow refraction seismic method succeeded to clearly distinguish Um-Bogma formation which records 4600 – 5000 m/s for the p-wave velocity at 36 m. depth with an average thickness 20 m. The magnetic model shows smooth variations in the basement relief with general increasing of the depth due North with 220 m as an average depth. References Al Shami, A. S., 1995: Studies on geology and
uranium occurrences of some Paleozoic rocks, Wadi Allouga area, Sinai, Egypt. M.Sc. Thesis, Faculty of Science, Zagazig University, 156 p.
Burger, H. R., 1992: Exploration geophysics of the shallow subsurface, Prentice and Hall, 489 p.
Bisdorf, R. J., 1982: Schlumberger sounding investigations in the Date Creek Basin, Arizona: U.S. Geological Survey Open-File Report 82-953, 55 p.
Dobrin, M. B., 1976: Introduction to geophysical prospecting. McGraw- Hill Book Co., New York, USA, 630 p.
El Sirafie, A. M., 1986: Application of aeromagnetic aeroradiometric and gravimetric survey data in the interpretation of the geology of Cairo- Bahariya area. north western desert , Egypt . Ph.D. Thesis, Ain Shams Univ.
El Agami, N. L., 1996: Geology and radioactivity studies on the Paleozoic rock units in the Sinai Peninsula, Egypt. Ph.D. Thesis, Fac. of Science, Mansoura Univ., Egypt, 302p.
Griffiths, D. H., and King, R. F., 1965: Applied geophysics for Engineering and geologists, Pergamon press, Oxford, New York, Toronto, 221p
Kunetz, G., 1966: Principles of direct current resistivity prospecting. Gebruder Borntraeger, Berlin-Nikolassee, 103 p.
Nabighian, M. N., Grauch, V. J. S., Hansen, R. O., La Fehr, T. R , Li, Y., Peirce, J. W., Phillips, J. D., and Ruder, M. E., 2005: The historical development of the magnetic
method in exploration. Geophysics, 70 (6), p 33-61.
Parasins, D. S., 1979: Applied geophysics: 3rd ed., Capman and Hall, London, 269 P.
Sadek, H. S., Soliman, S. A. and Abdulhadi, H. M., 1989: A correlation between the different models of resistivity sounding data to discover new fresh water fields in El Sadat City, Western Desert of Egypt. Proc. of the 7th International Mathematical Geophysics Seminar, Free University of Berlin, 8-11 Feb., 1989, 329-346.
Sharma, P. V., 1997: Environmental and engineering geophysics, United Kingdom, Cambridge University, 475p.
Talwani, M., and Heirtzler, J. R., 1964: Computation of magnetic anomalies caused by two-dimensional bodies of arbitrary shape, in Parks, G. A., Ed., Computers in the mineral industries, Part 1: Stanford Univ. Publ., Geological Sciences, v. 9, 464-480.
Telford, W. M., Geldart, L. P., Sheriff, R. E., and Keys, D. A., 1976: Applied geophysics: Cambridge, Cambridge University Press, 860 p.
Velpen, B. P. A., 1987: Resist program, V. 1.0. MSc Research project, ITC, Holland.
Van Overmeern, R. A., 1981: A combination of electrical resistivity, seismic refraction and gravity measurements for groundwater exploration in sudan : Geophysics. Vol. 46, No. 9, pp. 1304-1313.
Youssef, M. A. S., 2007: Shallow Seismic and Geoelectric Investigations for the Assessment of Radioactive Mineral-Bearing Horizon in Wadi Al Seih - Baba Area, Southwestern Sinai, Egypt. M.Sc. Thesis, Faculty of Science, Cairo University, 186 p.
Zohdy, A. A. R., Eaton, G. P., and Mabey, D. R., 1974: Application of surface geophysics to ground-water investigations: U.S. Geological Survey Water-Resources Investigations, book 2, chap. D1, 86 p.
Zohdy, A. A. R., and Bisdorf, R. 1989: A program for automatic processing and interpretation of Schlumberger sounding curves in Quick Basic 4.0. U. S. Geological Survey open - file report, 89-137, 67 p.
12/5/2012
![Figure S1 L nma-1 Col-0 nma-3 - Plant physiology · Scale bar = 5 cm Ler-0 nma-1 Col-0 nma-3 Figure S1 [number of cells] 30 20 10 25 15 5 nma-1 n=15 Ler-0 n=15 ssp-2 n=15 Col-0 n=15](https://img.pdfslide.us/doc/110x75/5e0429ca56391179c77bad89/figure-s1-l-nma-1-col-0-nma-3-plant-scale-bar-5-cm-ler-0-nma-1-col-0-nma-3-figure.jpg)