Embed Size (px)
Citation preview
New York/ New Jersey Harbor: Alternative Methods for Ex-Situ Sediment Decontamination and Environmental Manufacturing
Prepared by
Jessica L. Wargo Massachusetts Institute of Technology Washington Summer Intern
Compiled June-August 2002
Prepared for
U.S. Environmental Protection Agency Office of Solid Waste and Emergency Response
Technology Innovation Office Washington D.C. http://clu-in.org
NOTICE
This document was prepared by a student intern under the Massachusetts Institute of Technology Washington Summer Internship Program for the U.S. Environmental Protection Agency (EPA). This report was not subject to EPA peer review or technical review. The EPA makes no warranties, expressed or implied, including without limitation, warranty for completeness, accuracy, or usefulness of the information, warranties as to the merchantability, or fitness for a particular purpose. Moreover, the listing of any technology, corporation, company, person, or facility in this report does not constitute endorsement, approval, or recommendation by the EPA.
About the MIT Washington Summer Internship Program
The Washington Summer Internship Program, sponsored by the Massachusetts Institute of Technology (MIT) Department of Political Science, provides technically oriented undergraduates the opportunity to apply their scientific and technical training to public policy issues.
MIT students work at a minimum of two months in policy-related internships at various organizations in the Washington, DC area. Participating organizations include federal government agencies, congressional offices, think tanks, and advocacy groups. Program staff and participating organizations assist students in identifying internship possibilities.
Participating students receive stipends by the program. In some cases, students receive salaries by their internship host. The program also requires students to attend a seminar on the policy-making process. Students must be enrolled as an undergraduate at MIT and meet other eligibility criteria to participate.
About this Report
Prepared by a MIT undergraduate student, this report is intended to provide a basic summary and current status on the New York/New Jersey Harbor Sediment Decontamination Project. The scope of the report was developed by EPA‘s Technology Innovation Office.
The report contains information gathered from a range of currently available sources, including project documents, reports, periodicals, Internet searches, and personal communication with involved parties. No attempts were made to independently confirm the resources used. It has been reproduced to help provide federal agencies, states, consulting engineering firms, private industries, and technology developers with information on the current status of this project.
ii
TABLE OF CONTENTS
Abstract………………………………………………………………… 1
Background…………………………………………………………….. 2
Report Information……………………………………………………... 7
Pilot Study Overviews
Biogenesis………………………………………………………………. 13
Westinghouse…………………………………………………………… 18
GTI……………………………………………………………………… 25
NUIEG………………………………………………………………….. 30
Metcalf & Eddy…………………………………………………………. 34
References………………………………………………………………. 42
iii
APPENDICES
Appendix A: Biogenesis Sediment Washing Process
Appendix B: Westinghouse Plasma Vitrification Process
Appendix C: GTI Cement-Lock Technology Process
Appendix D: NUIEG Sediment Decontamination and Processing Procedure
Appendix E: Metcalf & Eddy Integrated Sediment Decontamination System
Appendix F: 2,3,7,8 TCDD and Dioxin Decontamination Analysis
Appendix G: Metal Decontamination Analysis
Appendix H: PCB Decontamination Analysis
Appendix I: Semi-Volatile Organic Compound (SVOC) Decontamination Analysis
Appendix J: Comprehensive Cost Analysis
iv
FIGURES
Figure 1: Map of the New York and New Jersey Harbor………………… 2
Figure 2: Contaminant Concentrations for Select Locations in the………. 4 NY/NJ Harbor and Applicable Standards
Figure 3: Contaminants and Corresponding Standards and General……... 9
Figure 4: Economic Analysis of the Biogenesis Process………………… 18
Figure 5: Economic Analysis of the Westinghouse Process……………... 24
Figure 6: GTI Waste Components and Their Modified Forms…………… 27
Figure 7: Comparison of Cement-Lock Cement Strength v. ASTM……... 28
Figure 8: Economic Analysis of the GTI Process………………………... 29
Figure 9: Economic Analysis of the NUIEG Process……………………. 33
Figure 10: Metcalf & Eddy Process Combinations and Specific………... 34 Required Materials and End-Use Materials
Figure 11: Unconfined Compressive Strength (UCS) Test on…………... 40 SOLFIX Final Products
Figure 12: Economic Analysis of Three Production Option for………… 41 Metcalf & Eddy
v
ACKNOWLEDGEMENTS
I would like to thank the Technology Innovation Office (TIO) of the EPA for giving me the opportunity to write this paper. I wish to extend a special thank-you to Kelly Madalinski (TIO), Mary McDonald from Triangle Labs, and Eric Stern from the Region 2 Office of the EPA.
AUTHOR INFORMATION
I am currently a junior planning to major in Environmental Engineering and Political Science and minor in Toxicology and Environmental Health at the Massachusetts Institute of Technology. I can be contacted via email at [email protected].
vi
Abstract
The natural accumulation of sediment in the NY/NJ harbor reduces its depth and prevents
ships from navigating through it. In order to allow the ships to travel in the harbor and
facilitate commerce, approximately 3 to 5 million cubic yards of sediment must be
dredged from the harbor annually. Until the early 1990s, this sediment was disposed of
in the ocean or other areas surrounding the harbor. Throughout the 1990s, growing
concern over high levels of contamination in the harbor resulted in the implication of
higher costs and more stringent regulations on ocean disposal. As a result of the new
standards, 70-80% of the dredged sediment was unacceptable for ocean disposal.
Increased costs also partially eliminated ocean disposal as an option for the storage of the
contaminated sediment. Congress addressed the situation by creating the Water
Resources Development Acts (WRDA), which created steps to establish a plan to
manufacture a beneficial use product from the dredged sediment. WRDA invoked the
help of the Region 2 Office of the EPA and the U.S. Army Corps of Engineers. The EPA
and the USACE selected the Brookhaven National Laboratory (BNL) as the managing
project lead for the NY/NJ Harbor endeavor. A similar project, headed by the New
Jersey Maritime Resources, took place on the state level. Both the state and federal
programs conducted small-scale studies of a variety of decontamination and
environmental manufacturing methods developed by several companies.
This report provides an overview of the pilot studies of five different firms considered by
the state and/or federal program(s). Between the two programs, twelve firms completed
pilot studies. However, due to time constraints and the availability of these reports, only
five firms are discussed in this report. These five firms include Biogenesis, the
Westinghouse Science and Technology Center, the Institute of Gas Technology (GTI),
NUI Environmental Group (NUIEG), and Metcalf & Eddy. Descriptions of each firm‘s
decontamination and product conditioning process, along with the process‘
decontamination efficiency and by-products are included in this paper. The nature of the
beneficial use product and a simple economic analysis comparing the costs and credits
associated with each firm are also discussed.
1
Background
Harbor Background
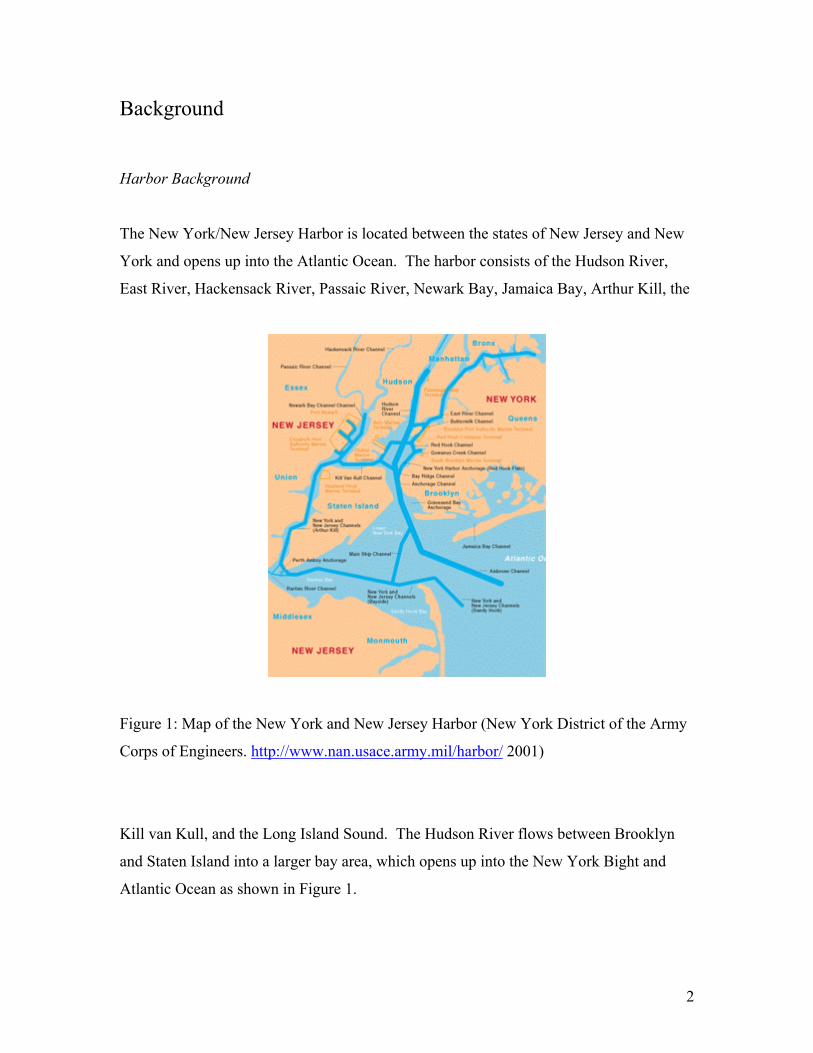
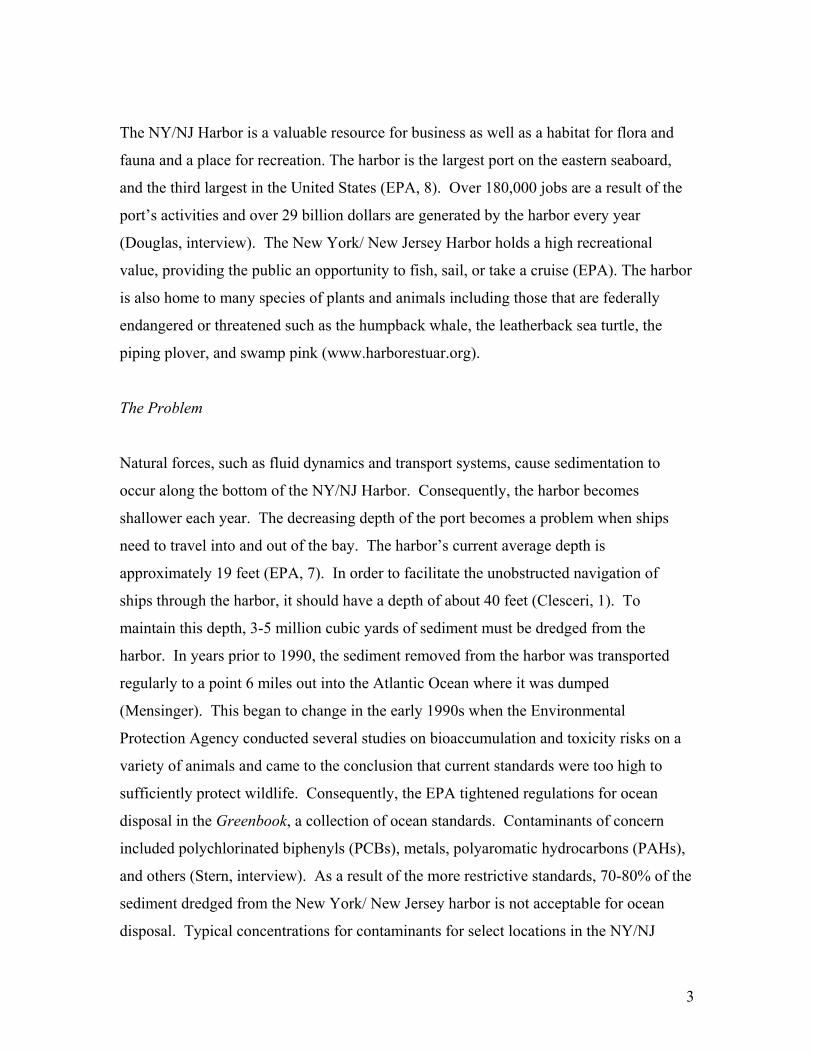
The New York/New Jersey Harbor is located between the states of New Jersey and New
York and opens up into the Atlantic Ocean. The harbor consists of the Hudson River,
East River, Hackensack River, Passaic River, Newark Bay, Jamaica Bay, Arthur Kill, the
Figure 1: Map of the New York and New Jersey Harbor (New York District of the Army
Corps of Engineers. http://www.nan.usace.army.mil/harbor/ 2001)
Kill van Kull, and the Long Island Sound. The Hudson River flows between Brooklyn
and Staten Island into a larger bay area, which opens up into the New York Bight and
Atlantic Ocean as shown in Figure 1.
2
The NY/NJ Harbor is a valuable resource for business as well as a habitat for flora and
fauna and a place for recreation. The harbor is the largest port on the eastern seaboard,
and the third largest in the United States (EPA, 8). Over 180,000 jobs are a result of the
port‘s activities and over 29 billion dollars are generated by the harbor every year
(Douglas, interview). The New York/ New Jersey Harbor holds a high recreational
value, providing the public an opportunity to fish, sail, or take a cruise (EPA). The harbor
is also home to many species of plants and animals including those that are federally
endangered or threatened such as the humpback whale, the leatherback sea turtle, the
piping plover, and swamp pink (www.harborestuar.org).
The Problem
Natural forces, such as fluid dynamics and transport systems, cause sedimentation to
occur along the bottom of the NY/NJ Harbor. Consequently, the harbor becomes
shallower each year. The decreasing depth of the port becomes a problem when ships
need to travel into and out of the bay. The harbor‘s current average depth is
approximately 19 feet (EPA, 7). In order to facilitate the unobstructed navigation of
ships through the harbor, it should have a depth of about 40 feet (Clesceri, 1). To
maintain this depth, 3-5 million cubic yards of sediment must be dredged from the
harbor. In years prior to 1990, the sediment removed from the harbor was transported
regularly to a point 6 miles out into the Atlantic Ocean where it was dumped
(Mensinger). This began to change in the early 1990s when the Environmental
Protection Agency conducted several studies on bioaccumulation and toxicity risks on a
variety of animals and came to the conclusion that current standards were too high to
sufficiently protect wildlife. Consequently, the EPA tightened regulations for ocean
disposal in the Greenbook, a collection of ocean standards. Contaminants of concern
included polychlorinated biphenyls (PCBs), metals, polyaromatic hydrocarbons (PAHs),
and others (Stern, interview). As a result of the more restrictive standards, 70-80% of the
sediment dredged from the New York/ New Jersey harbor is not acceptable for ocean
disposal. Typical concentrations for contaminants for select locations in the NY/NJ
3
--- --- --- --- --- --- --- --- ---
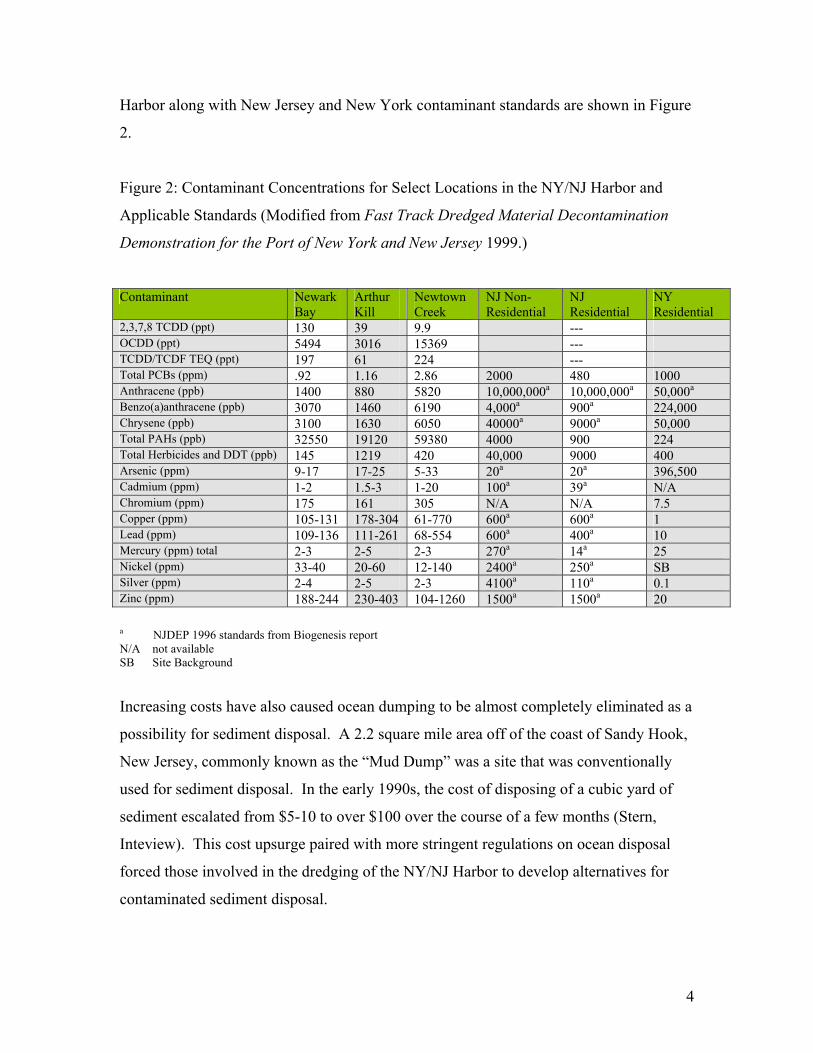
Harbor along with New Jersey and New York contaminant standards are shown in Figure
2.
Figure 2: Contaminant Concentrations for Select Locations in the NY/NJ Harbor and
Applicable Standards (Modified from Fast Track Dredged Material Decontamination
Demonstration for the Port of New York and New Jersey 1999.)
Contaminant Newark Bay
Arthur Kill
Newtown Creek
NJ Non-Residential
NJ Residential
NY Residential
2,3,7,8 TCDD (ppt) 130 39 9.9 OCDD (ppt) 5494 3016 15369 TCDD/TCDF TEQ (ppt) 197 61 224 Total PCBs (ppm) .92 1.16 2.86 2000 480 1000 Anthracene (ppb) 1400 880 5820 10,000,000a 10,000,000a 50,000a
Benzo(a)anthracene (ppb) 3070 1460 6190 4,000a 900a 224,000 Chrysene (ppb) 3100 1630 6050 40000a 9000a 50,000 Total PAHs (ppb) 32550 19120 59380 4000 900 224 Total Herbicides and DDT (ppb) 145 1219 420 40,000 9000 400 Arsenic (ppm) 9-17 17-25 5-33 20a 20a 396,500 Cadmium (ppm) 1-2 1.5-3 1-20 100a 39a N/A Chromium (ppm) 175 161 305 N/A N/A 7.5 Copper (ppm) 105-131 178-304 61-770 600a 600a 1 Lead (ppm) 109-136 111-261 68-554 600a 400a 10 Mercury (ppm) total 2-3 2-5 2-3 270a 14a 25 Nickel (ppm) 33-40 20-60 12-140 2400a 250a SB Silver (ppm) 2-4 2-5 2-3 4100a 110a 0.1 Zinc (ppm) 188-244 230-403 104-1260 1500a 1500a 20
a NJDEP 1996 standards from Biogenesis report N/A not available SB Site Background
Increasing costs have also caused ocean dumping to be almost completely eliminated as a
possibility for sediment disposal. A 2.2 square mile area off of the coast of Sandy Hook,
New Jersey, commonly known as the —Mud Dump“ was a site that was conventionally
used for sediment disposal. In the early 1990s, the cost of disposing of a cubic yard of
sediment escalated from $5-10 to over $100 over the course of a few months (Stern,
Inteview). This cost upsurge paired with more stringent regulations on ocean disposal
forced those involved in the dredging of the NY/NJ Harbor to develop alternatives for
contaminated sediment disposal.
4
The Search for Alternatives to Ocean Disposal of Dredged Sediment
Several groups including the United States Army Corp of Engineers (USACE), the Port
Authority of New York and New Jersey (PANYNJ), the State of New Jersey, EPA, the
Harbor Estuary Program (Douglas), and the New Jersey Office of Maritime Resources
(NJMR) of the New Jersey Department of Transportation (NJDOT) took an interest in
investigating alternative methods for contaminated sediment remediation (Jones, 127). In
response to the growing concern over the status of the harbor, Congress began to take
action through the Water Resources Development Acts (WRDA) and assigned the task of
solving the NY/NJ Harbor problem to the Region 2 office of the U.S. EPA and the New
York District of the USACE (Stern, interview)
Congress passed the first of the WRDA acts, Phase 1: Study of Alternative Methods for
Disposal of Dredged Material, in 1990. This act fostered a demonstration project to find
alternatives to disposing of the dredged sediment in the ocean. Some of the proposed
alternatives included using the sediment for capping of more contaminated materials,
storing it on a containment island, and cleaning it with new decontamination technologies
(EPA, 2). The second phase, Bench- and Pilot-Scale Demonstrations, was passed in
1992. The purpose of this phase was to demonstrate the effectiveness and applicability of
the variety of decontamination technologies. Issues that were to be considered in the
bench and pilot studies were cost, possible manufacturing of a beneficial end-use product,
decontamination efficiency, and feasibility of expanding the technology to a full-scale
facility. In 1996 the last phase of WRDA, Full-Scale Dredged-Material
Decontamination Demonstration, one or more decontamination technologies were to be
selected for application in a full-scale facility that would process a minimum of 500,000
cubic yards of contaminated sediment each year. In 1999, Congress passed section 218,
an amendment section to WRDA which provided for the manufacturing of —practical end-
use products“ from the decontaminated sediment. (Stern, interview).
5
In 1993, a federally funded program, involving the United States Army Corps of
Engineers and the EPA was established in order to meet the goals established by WRDA.
The federal government granted $20 million to the two groups involved in order to
support the program efforts. After receiving funding, the USACE and Region 2 of the
EPA agreed to employ the U.S. Department of Energy Brookhaven National Laboratory
(BNL) to be the technical lead managing the NY/NJ Harbor project. The USACE and the
EPA developed a six-step plan to establish a full-scale sediment remediation and
beneficial use plant (EPA, vii).
The plan consisted of three main steps: a bench-scale study, pilot-scale study, and full
scale implementation of one or more decontamination technologies. Planning and
preliminary evaluations took place before each of these major steps. In the first step of
the plan, the USACE and the EPA reviewed information on and sent requests for
proposals to over 500 treatment technologies. Twenty-six firms responded and eight
completed bench-scale studies. After the EPA and USACE reviewed the results of the
bench studies, seven firms were selected to demonstrate their technologies at the pilot-
scale level: Marcor, Metcalf & Eddy, Gas Technology Institute (GTI), Westinghouse
Science and Technology, BioGenesis, International Technology, and BioSafe (Stern,
interview).
A program parallel to the federal efforts took place at the state level. In 1996, New York
and New Jersey developed the Joint Dredging Plan for the Port of New York & New
Jersey, which proposed several possible solutions to the sediment problem. The
possibilities included constructing confined disposal facilities to store the dredged
sediment and implementing alternative treatment technologies to decontaminate the
sediment. In support of the dredging plan, PANYNJ promised $130 million to the project.
The state of New Jersey pledged an additional $205 million to the project through the
Harbor Revitalization and Dredging Bond Act of 1996 (Douglas). To ensure that
sufficient man-hours would be dedicated to achieve the goals of the Joint Dredging Plan
for the Port of New York & New Jersey, Governor Christine Todd Whitman created the
New Jersey Office of Maritime Resources (NJMR).
6
The state-funded program run by the NJMR followed a similar plan to select technologies
suitable for operation on the full-scale level. However, unlike the federal program, the
state program did not test the technologies on the bench-scale level. Instead, it
accelerated five technologies from five different firms to complete pilot-scale studies.
These companies include: GTI, Biogenesis, JCI/Upcycle, NUIEG, and BEM to pilot-
scale testing. Note that the federal program also selected GTI and Biogenesis to
complete pilot studies.
Once the pilot study phase was finished by both the state and federal programs, the two
programs formed a technical review committee consisting of representatives from
Rochester Institute of Technology (RIT), the Stevens Institute, the New Jersey Institute of
Technology (NJIT), Rensselaer Polytechnic Institute (RPI), and others (Stern, interview)
The committee selected three technologies out of the nine different technologies that
completed pilot tests to construct full-scale facilities. The technologies that have been
chosen to construct full-scale facilities are BioGenesis, GTI, and JCI/Upcycle. The state
and federal programs continue to keep their funds separate, although they are both
funding and managing the NY/NJ project. Currently, Biogenesis is in the first stages of
constructing a full-scale facility. GTI and JCI/Upcycle will begin constructing
processing plants soon.
Report Information
Purpose of this Report
This report gives a summary of five of the seven technologies for which pilot-studies
were performed. The information presented in this paper is based on the pilot study
reports and personal interviews with representatives from each of the firms. The five
firms included in this report are BioGenesis, Westinghouse Science and Technology, Gas
Technology Institute, Metcalf & Eddy, and NUIEG. Each of the firms that participated
in the pilot study processed between 1.5 and 500 cubic meters (approximately 2 and 654
7
cubic yards). (Jones, 127) The sediment that was used in the pilot study was dredged
from the Stratus Petroleum Site, located in the Upper Newark Bay.
The purpose of this report is to give information on the technologies developed by these
five firms. The following topics are covered in this paper: information on the process,
the beneficial use product, the decontamination efficiency, waste, and economics of the
technology. It is important to realize that these technologies are still developing and thus
the information in this report is bound to change as the technology matures. Also, the
steps of the process, cost figures, contaminant removal efficiencies, and other information
from the pilot-scale study may not be directly applicable to the full-scale facility. For
example, on a pilot-scale, a firm may choose to have its waste processed by an outside
firm because it is a cost-effective and feasible option for an operation of a small size.
However, on a full-scale, the same firm may choose to purchase the equipment to treat
the waste on-site, because economies of scale make the cost of processing the waste
onsite less than sending the waste off-site for treatment.
Outline of Report Components
The Process
The process section of the report explains the different components of the
decontamination and product conditioning procedures. A schematic is included with
each of the processes. It is recommended that one follow the schematic while reading the
description of the process.
Residuals
This section addresses the issue of waste by-products resulting from the sediment
decontamination and conditioning processes. This portion describes the nature of the by-
8
products produced by the various steps in the procedure and how the waste is treated.
The amount of waste produced is also provided in this portion of the report contingent on
its availability.
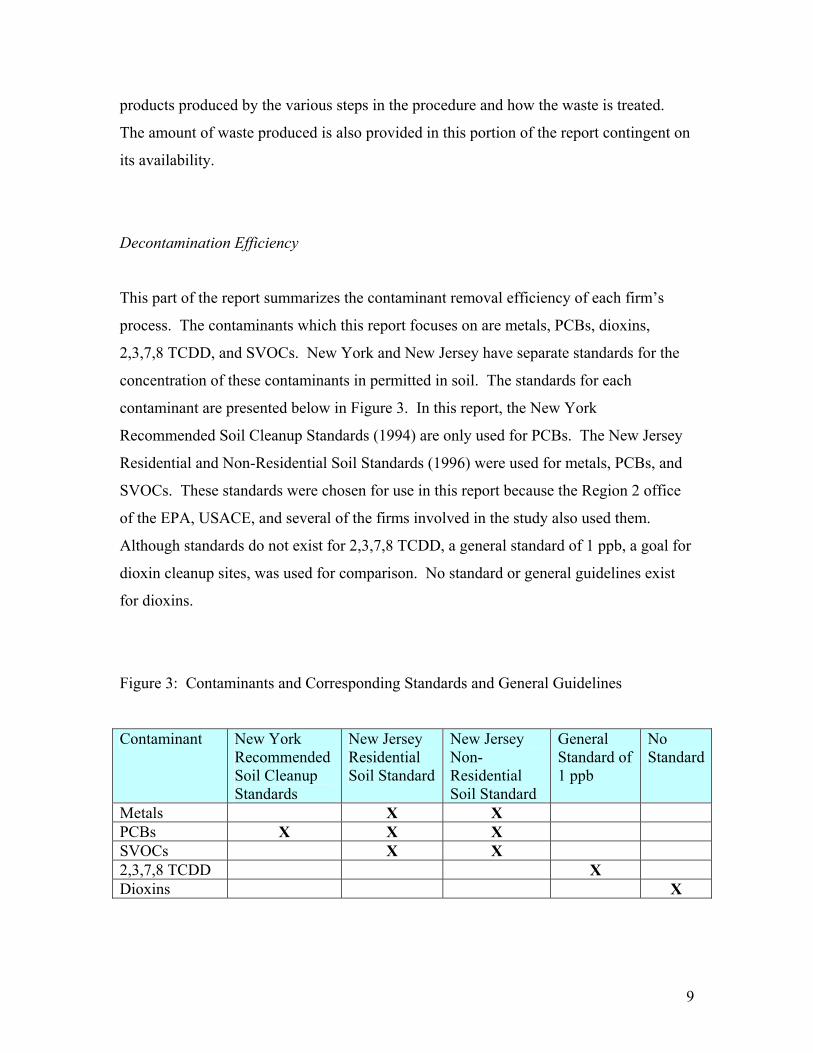
Decontamination Efficiency
This part of the report summarizes the contaminant removal efficiency of each firm‘s
process. The contaminants which this report focuses on are metals, PCBs, dioxins,
2,3,7,8 TCDD, and SVOCs. New York and New Jersey have separate standards for the
concentration of these contaminants in permitted in soil. The standards for each
contaminant are presented below in Figure 3. In this report, the New York
Recommended Soil Cleanup Standards (1994) are only used for PCBs. The New Jersey
Residential and Non-Residential Soil Standards (1996) were used for metals, PCBs, and
SVOCs. These standards were chosen for use in this report because the Region 2 office
of the EPA, USACE, and several of the firms involved in the study also used them.
Although standards do not exist for 2,3,7,8 TCDD, a general standard of 1 ppb, a goal for
dioxin cleanup sites, was used for comparison. No standard or general guidelines exist
for dioxins.
Figure 3: Contaminants and Corresponding Standards and General Guidelines
Contaminant New York Recommended Soil Cleanup Standards
New Jersey Residential Soil Standard
New Jersey Non-Residential Soil Standard
General Standard of 1 ppb
No Standard
Metals X X PCBs X X X SVOCs X X 2,3,7,8 TCDD X Dioxins X
9
The phrase, —regulated RCRA metals“ is used throughout the report. New Jersey
Residential and Non-Residential Soil Standards exist for twelve out of the thirteen RCRA
metals. For simplicity these twelve metals are referred to as —regulated RCRA metals“.
The standards, along with the contaminant concentrations of the untreated and treated
sediment for each firm, are present in the Appendix for each contaminant. The
Decontamination Efficiency section states which standards, if any, the treated sediment
failed to meet.
It is important to note that not all of the beneficial-use materials produced by the firms
are soil-type products. As a result, the New York and New Jersey soil standards do not
directly apply to products that are not soil. The specific standards, which the end-use
product must meet, can be found through the American Society for Testing and Materials
(ASTM), the EPA, and other sources.
Beneficial-Use Product
The nature of the end-use product is described in this section. The properties of the
material are also discussed and in some cases data on product quality testing are included.
For many of the firms, the conditioning processes can be modified to manufacture
different products. Variations in the processes as well as the different characteristics of
the beneficial-use products are discussed in this section. In many cases, which
beneficial-use product will be manufactured from the decontaminated sediment depends
on many factors including the chemical composition of the dredged sediment, product
marketability, production costs, and feasibility of manufacturing on a large-scale. For
instance, deviations in the chemical makeup of the sediment may make one product
manufacturing process extremely difficult, while it may be ideal for another process.
Likewise, one product may be more saleable, easier to produce, or cheaper to
manufacture than another product. The three firms chosen to construct full-scale
10
facilities are still completing cost-analysis, market research, and sediment composition
tests to determine exactly what product or products to manufacture. These variables are
discussed in the Economic Analysis portion of the report.
Economic Analysis
The purpose of this portion of the report is to give a rough idea of the relative magnitudes
of the manufacturing costs and end-use product price. This comparison is done to show
that one should not discount a manufacturing process because it is cost-intensive, for the
beneficial-use material may be able to be sold for a high price and offset production
costs. Conversely, a firm that produces a material that will not sell on the market for a
high price, may still be profitable if the processing costs are relatively low.
The tipping fee, mentioned in the report, is the amount of money that the state of New
Jersey will pay the firms to dispose of the dredged sediment. $35 per cubic yard of
dredged sediment is the target dollar amount that the state of New Jersey plans to pay the
processing plants in the long term. This tipping fee is equal to the cost of disposing of
the dredged sediment in the ocean. The tipping fee in the pilot study, $55 per cubic yard
of dredged sediment, was greater than that which the State will pay in full-scale
processing because of economies of scale (Stern, interview).
The figure labeled —processing cost“ in the cost analysis portions of this report includes
all of the materials needed for processing and conditioning the contaminated sediment
(water, chemicals, electricity, etc.), labor, facility costs (construction, maintenance,
property, etc), loan interest, and equipment (purchase and maintenance). Marketing costs
are not taken into account in the processing cost figure.
The end-use product price is the estimated value that the material could be sold for in the
NY/NJ or surrounding areas. This value was estimated differently for each of the firms.
Some of the values were actual estimates made by the company while other values were
11
obtained by researching the current market for a similar product. The way in which the
end-use product price was attained for each respective firm is noted in the Economic
Analysis section.
As mentioned in the Beneficial-Use Product section, determining the processing costs
and market price of the product is difficult because most of the firms that participated in
the pilot-study do not know which product they will manufacture. Different products can
be sold on the market for different prices. Even for a single product, the product price,
marketability, and even production costs can vary greatly. As a result of these
uncertainties, the precise production costs and market price for the product cannot be
determined. The market price and the processing cost, which are used in the economic
analysis portion, are estimated values, the sources of which are explained in the end-use
product section. The purpose of the figures is not to give an exact amount of profit a firm
will make, but rather to give the reader an idea of how cost-intensive a process is.
12
Biogenesis
The Process
The BioGenesis Sediment Washing Process consists of four main steps followed by
dewatering1. The four major steps of the process are pre-processing, aeration, sediment
washing, and oxidation and cavitation. These steps are labeled in the schematic of the
process in Appendix A. Pre-processing, begins by screening the sediment to remove
oversized materials. The raw screened sediment is then mixed with chelating agents,
select surfactants, and proprietary BioGenesis washing chemicals. The chelating agents
remove the metals present in the sediment by drawing them into heterocyclic rings. The
surfactants have the ability to adsorb various contaminants present in the sediment
(National Research Council, 120). The affinity between the sediment and the
contaminants, solids, and organic matter is reduced by the washing chemicals, which
facilitates their future removal.
After the pre-processing chemicals are added to the raw sediment, high-pressure water is
injected tangentially to further homogenize the mixture. This washing also causes the
naturally occurring organic material (NOM) coating of the sediment to dissociate and
enter into water phase and large clumps of sediment, which may hinder the process, to
break apart.
During aeration, ambient air is bubbled through the sediment slurry thus causing the
bonds between the sediment particles and the contaminants to be weakened. Once these
bonds are sufficiently weakened, organics and other contaminants break free from the
sediment and enter into the aqueous phase. Buoyant organics and other aqueous
contaminants can be skimmed off of the top of the slurry. Gas that escapes from the
mixture is trapped and treated with granular activated carbon (GAC) and later tested for
thirty-nine volatile compounds using gas chromatography/ mass spectrometry (GC/MS).
1 For more information on the Biogenesis process see U.S. Patent 6,325,079B1, Apparatus and Method for Removing Contaminants from Fine Grained Soil, Clay, Silt, and Sediment Particles“
13
A listing of the compounds and their concentrations in the air stream can be found in
Table D-11 of the Biogenesis Sediment Washing Technology Final Report. In the pilot
study, the gas was determined to be in compliance with NJDEP standards for these
volatile compounds.
In the sediment-washing portion of the process, high-pressure water is directed
perpendicularly to the flow of the sediment to cause collisions between the sediment
particles. The impact between the sediment particles causes the remaining NOM, humic
contamination, and microorganisms to dissociate from the sediment. After separating
from the sediment, the contaminants enter the water phase.
Hydrogen peroxide is then added to the sediment slurry to oxidize it, and then the mixture
is cavitated. During cavitation, vapor bubbles are blown into the sediment mixture to
facilitate the breakdown of organic molecules to weak acids, water, and carbon dioxide.
After cavitation and oxidation, the slurry is separated into two phases: decontaminated
sediment in solid form and NOM, inorganic and organic contaminants, and residual
sediment particles in the liquid phase. Two centrifuges are then used to separate the
solids from the liquids. Although a hydrocyclone was not used in the pilot study, it may
be used in order to remove larger particles that may cause the balance of the centrifuge to
be disrupted.
Residuals
The waste produced by the Biogenesis process can be categorized into wastewater, solids,
and gases. In this pilot study, 298,000 gallons of wastewater were produced in the
decontamination of 700 cubic yards of dredged material. (Biogeneisis, 1-1 and 3-29).
Biogenesis contracted an outside company, PVSC, to dispose of the wastewater. The
wastewater consisted of stormwater and other residual fluids collected from the floor
drain in the processing area, aqueous centrate from the liquid/solid separation process,
14
and wash water and other cleaning fluids produced during the decontamination of the
sampling and processing equipment.
Solid waste, both potentially-hazardous and non-hazardous materials, was also produced
by the process. The non-hazardous construction debris and domestic trash were disposed
of in a local landfill. Biogenesis contracted SK Services to properly dispose of the
potentially hazardous materials which consisted of personal protective equipment (PPE),
plastic sheeting, chemical containers, and other materials that may have contacted
process streams (Biogenesis, 3-30).
Other solid waste materials were also produced in the decontamination process. Most of
the oversized material, which was removed during preprocessing, could be disposed of in
a non-hazardous landfill. If the oversized material did in fact contain significant levels of
contamination, it was first rinsed with water before it was sent it to a non-hazardous
landfill (Wilde, interview). Organic materials skimmed off of the sediment after the
aeration step were transported to an on-site filter press, where they were dewatered.
After dewatering, the solid was tested and then sent to an appropriate landfill.
The gas component of the waste by-products was that which was emitted from the
aeration step and other holding and processing containers. These offgases were filtered
through a granulated activated carbon filter (GAC) before they were released into the
atmosphere.
Decontamination Efficiency
The removal efficiency analysis was completed by using the average inlet sediment,
listed in the report as RAW-SD, as the untreated sediment, and the average treated
sediment, PSD-SL, as the treated sediment. Biogenesis treated 700 cubic yards of
dredged sediment. The decontaminated sediment or end-use product resulting from the
Biogenesis‘ decontamination process passed all of the standards and general guidelines
considered in this report with the exception of the New Jersey standards for five SVOCs.
15
The soil or fill product passed all of the metal and PCB standards and general guidelines
for dioxins and 2,3,7,8 TCDD.
The decontamination analysis for 2,3,7,8 TCDD and dioxins is in Appendix F. The
average removal efficiency for three dioxins: PeCDD, HxCDD, HpCDD, was about 51%.
The removal efficiency for TCDD was roughly 5%. The removal efficiency for 2,3,7,8
TCDD was approximately 61%. The concentration of 2,3,7,8 TCDD in the treated
sediment was 35.3 ppt, which is below the general standard of 1 ppb.
The decontaminated sediment passed all of the New Jersey Residential and Non-
Residential Standards for metals, as shown in Appendix G. On average, the metal
concentrations in the treated sediment were more than 89% below the New Jersey
Residential and Non-Residential Standard.
As shown in Appendix H, the PCB concentration of the treated sediment was found to be
203 ppb, which is below the New York Recommended Soil Standard, 1000 ppb, and the
New Jersey Residential and Non-Residential Soil Standards, 480 and 2000 ppb,
respectively.
The standards that the end-product did not pass were the New Jersey Residential Soil
Standards for benzo(a)anthracene, benzo(a)pyrene, benzo(b)fluoranthene,
benzo(k)fluoranthene, and indeno(1,2,3-cd)pyrene. The soil or fill also did not pass the
New Jersey Non-Residential Soil Standard for benzo(a)pyrene2. Data was missing for
three of the nine SVOCs considered in this study: N-Nitrosodiphenylamine, bis-2-
ethylhexylphthlate, and di-n-butyl phthalate. The remaining six SVOC concentrations of
the untreated sediment were an average of 42% above the New Jersey Residential Soil
Standards and 36% below the New Jersey Non-Residential Soil Standards. The
concentrations of these five out of these six SVOCs were below the detection limit in the
untreated sediment. These data can be found in Appendix I.
2 The New Jersey Non-Residential and Residential Soil Standards are the same.
16
End-Use Product
After the contaminated sediment goes through the Biogenesis process, the
decontaminated sediment is used to produce a beneficial-use product. Biogenesis has
chosen to manufacture a soil or fill product (Biogenesis, 3-17).
New York and New Jersey have an annual demand for approximately 15-18 million bags
of soil and as much as 6 million cubic yards of wholesale bulk soil (Biogenesis, 4-63). It
is estimated that the current market price of the end-use soil or fill product is between $2-
$4 per cubic yard, although future estimate that the value may climb as high as $10 per
cubic yard (Wilde, interview).
The more —contaminant-free“ the processed sediment is, the more valuable it is on the
market. However, removing a larger proportion of the contaminants from the sediment
costs more. As a result, Biogenesis must complete a cost-benefit analysis of the
treatment cost against the market price to determine the extent to which the sediment
should be decontaminated (Biogenesis, 5-4). The level of decontamination that will yield
the largest profit-margin, where the market price for the treated sediment excedes the
processing costs by the largest amount, will be selected for production.
Economic Analysis
The full-scale processing facility, built to decontaminate the sediment in the NY/NJ
Harbor, will treat approximately 500,000 cubic yards of material each year. The tipping
fee paid to the firm by the state is $35 per cubic yard. The Biogenesis sediment washing
treatment costs approximately $32, as shown in Figure 4. According to a Biogenesis
representative, the approximate product price of the end-use material is between $2 and
17
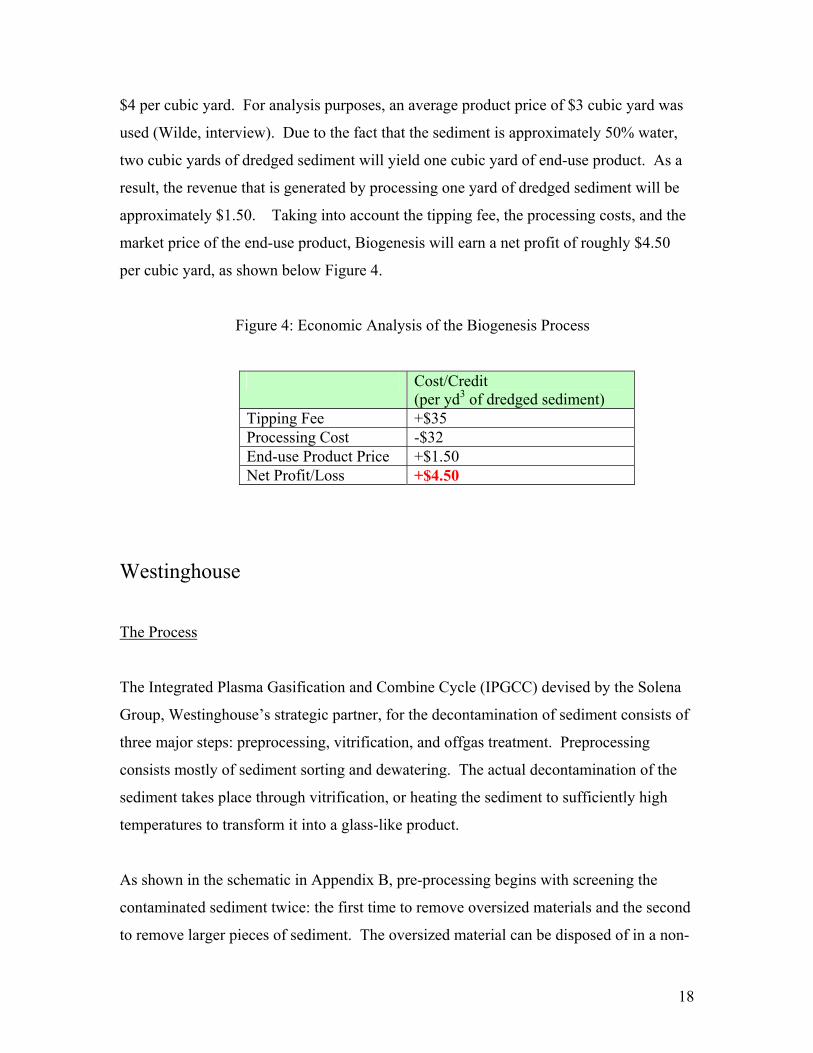
$4 per cubic yard. For analysis purposes, an average product price of $3 cubic yard was
used (Wilde, interview). Due to the fact that the sediment is approximately 50% water,
two cubic yards of dredged sediment will yield one cubic yard of end-use product. As a
result, the revenue that is generated by processing one yard of dredged sediment will be
approximately $1.50. Taking into account the tipping fee, the processing costs, and the
market price of the end-use product, Biogenesis will earn a net profit of roughly $4.50
per cubic yard, as shown below Figure 4.
Figure 4: Economic Analysis of the Biogenesis Process
Cost/Credit (per yd3 of dredged sediment)
Tipping Fee +$35 Processing Cost -$32 End-use Product Price +$1.50 Net Profit/Loss +$4.50
Westinghouse
The Process
The Integrated Plasma Gasification and Combine Cycle (IPGCC) devised by the Solena
Group, Westinghouse‘s strategic partner, for the decontamination of sediment consists of
three major steps: preprocessing, vitrification, and offgas treatment. Preprocessing
consists mostly of sediment sorting and dewatering. The actual decontamination of the
sediment takes place through vitrification, or heating the sediment to sufficiently high
temperatures to transform it into a glass-like product.
As shown in the schematic in Appendix B, pre-processing begins with screening the
contaminated sediment twice: the first time to remove oversized materials and the second
to remove larger pieces of sediment. The oversized material can be disposed of in a non-
18
hazardous landfill while the larger sediment particles can be broken down and processed.
The purpose of screening the sediment is to create a finer mix of sediment, which can be
pressed and processed more easily and efficiently (Miller, interview). Large materials
may clog the equipment, whereas smaller particles pass through without difficulty.
Once the sediment has passed through the second one millimeter grid screen, the
sediment enters a mixing tank to which dilution water and hydrated lime are added. Lime
is added to dry out the sediment, in order to increase the efficiency of vitrification. In
some instances, water can be decanted from the sediment, however, this process was not
used in this pilot study.
After screening, the sediment is then transferred into a filter press, where more water is
removed from the sediment. The filter press blows air through the sediment, driving off
excess water and leaving behind a sediment filter cake. The filtrate is captured in a
storage container, labeled —frac tank“ in the schematic, and is later analyzed and disposed
of properly.
The filter cake then enters a delumper hopper, where lime and soda ash are mixed with
the cake in order to achieve a metal oxide loading of 83% in the final glass melt
(Westinghouse, 5-11). Sufficient water is added so that this dewatered sediment can be
fed into the Plasma Melter via a vitrification tuyere. If the water content of the sediment
is too low, it will be unable to flow into the Plasma Melter.
In the Plasma Melter, rapid mixing of the sediment with the 5000°C plasma torch flame
occurs as a result of sediment moisture flashing from the sediment and to brisk air
circulation from the tuyere. PCBs, dioxin, and other refractory organic carbon
compounds volatalize, and leave the sediment. This offgas is trapped and later treated.
Vitrification transforms the sediment into a molten product. This molten material can be
conditioned in preparation for manufacturing into a beneficial use product. To prepare the
molten glass for rock wool fabrication, it is put into a centrifuge with glass fibers
19
(Westinghouse, 4-3). In order to produce uniform roofing granules, the molten material
is granulated. The molten glass may also be shattered by quenching it with water to form
aggregate.
The offgas produced by the vitrification process is treated through a system of scrubbers,
a demister/separator, and exhauster. The Venturi scrubber first cools the gas stream,
eliminates sulfur oxides, and condenses volatile salts. Condensed particulates are
removed from the stream by the scrubber. The separator/demister then performs two
major tasks: removing additional aerosols and solid particulates and treating exhaust.
The separator/demister scrubs the stream from the exhaust, then traps and sends water
soluble offgas products to a holding tank. The offgas then goes to one of two places.
The majority of the stream is composed of of innocuous offgases such as N2, O2, and CO2
which are allowed to escape into ambient air. The gas, that does not meet the standards
to be released into the atmosphere, is sent back to the scrubber for further processing.
Residuals
Six residuals are produced by the Westinghouse Plasma Vitrification Process. Three of
the six by-products are solid waste, two are clean water, and one is clean offgases. 2200
tons of gypsum (calcium sulfate), 400 tons of oversized material, 90 tons of precipitated
metals (from the scrubber water), 52 million gallons of filtrate and rinse water, 700,000
gallons of scrubber water bleed, and 2.4 billion standard cubic feet of clean offgases are
estimated to be produced from processing 100,000 cubic yards of contaminated sediment
each year.
The three solid waste by-products: gypsum, oversized material, and precipitated metals,
can be disposed of in a non-hazardous landfill. Precipitated metals must first be
encapsulated before they are put in a landfill. Alternatives to disposal in a landfill also
exist for each of the three forms of solid waste. Gypsum can be used, oversized material
20
can be plasma vitrified to produce a slag, and precipitated metals can be further processed
to recover heavy metals.
Both wastewater products, the scrubber water bleed and the filtrate and rinse water, can
be disposed of in a regular sewer, although the scrubber water bleed must first be treated
for heavy metals.
Decontamination Efficiency
Two samples, one untreated (WP-R1-01-01B) and one treated (WV-03-02-01B), were
used for removal efficiency analysis for the specific contaminants considered in this
report.
The sediment treated with the Westinghouse Plasma Vitrification passed the SVOC,
PCB, 2,3,7,8 TCDD, and metal standards with the exception of the New Jersey
Residential and Non-Residential Soil Standards for copper and thallium.
The PCB concentration of the decontaminated sediment was 0.83 ppt which falls below
the New York Recommended Soil Cleanup Standard, and both the New Jersey
Residential and Non-Residential Soil Cleanup Standards, as shown in Appendix H. The
levels of 2,3,7,8 TCDD in the treated sediment, 0.9 ppt, was less than that of the general
standard, 1 ppb.
The average reduction in the concentrations of TCDD and three different dioxins:
PeCDD, HxCDD, HpCDD, was 100%, as shown in Appendix F.
Six of the nine SVOC concentrations were below the detection limit of 333 ppb. The
remaining three SVOC concentration were an average of 98% and 100% below the New
Jersey Residential and Non-Residential Soil Standards, respectively. The concentration
of N-Nitrosodiphenylamine, was greater in the treated sediment than in the untreated
sediment. This data is in Appendix I.
21
The treated sediment passed ten standards out of the twelve standards set for the RCRA
metals. The copper and thallium concentrations in the decontaminated sediment both
exceeded the standard. The copper concentration was approximately 1000 ppm, which is
roughly 67% greater than the standard New Jersey Residential and Non-Residential
Standard of 600 ppm. The treated sediment also contained a thallium concentration of
approximately 4.97 ppm, nearly two and a half times the New Jersey standard of 2 ppm.
The other metal concentrations, however, were an average of 66% and 77% below the
New Jersey Residential and Non-Residential Standards respectively.
When comparing the contaminant concentration of the treated sediment to the standard,
one must take into account that the decontaminated material produced by the
Westinghouse Plasma Vitrification is a glass product not soil. As a result, the New
Jersey soil standards do not directly apply to the treated sediment, although they do
provide a rough basis of comparison between the technologies. The actual standards that
apply to the glass material will vary by the product which Westinghouse chooses to
manufacture. These standards are available through the EPA and American Society for
Testing and Materials (ASTM).
End-Use Product
The molten glass material produced by the Westinghouse Plasma Vitrification Process
can be used to make a variety of products including, but not limited to, glass fiber, glass
tiles, rock wool, aggregates, solar glass, and roofing granules. The preliminary phases for
creating aggregate, roofing granules, and rock wool are listed in The Process section.
Rock wool can be made by shooting a stream of air at a revolving wheel covered in
molten glass product to produce wool fibers. Steel mill slag is usually used to make rock
wool. However, new sulfur emission limits have deterred steel mills from producing
rock wool. The supply of rock wool has decreased, but the demand for rock wool has
remained relatively constant. As a result, where the demand used to be met by the
22
supply, the demand now excedes the supply. Westinghouse hopes to fill this gap between
the supply and demand for rock wool because its product does not contain or emit high
levels of sulfur in its production. The market density of rock wool in the NY/NJ is also
sufficiently low so that shipping rock wool produced by Westinghouse distances of more
than 100 to 200 miles would be profitable (Westinghouse, 9-3).
The molten slag produced by the Westinghouse Plasma Vitrification Process can also be
used to produce roofing granules, which can serve as a barrier against ultraviolet
degradation on asphalt roofs and shingles. The production of roofing granules is slightly
more difficult than that of rock wool, because specific oxidation-reduction potentials
must be retained to ensure ultraviolet absorption by the roofing granules. The high
Fe3+/Fe2+ ratio in the sediment product is desirable because it allows for high levels of
ultraviolet absorption.
Westinghouse would have to complete a cost-benefit analysis to determine which end-use
product it should manufacture. The chemical composition of the decontaminated
sediment must be analyzed to determine which additives are needed to create a beneficial
end-use product. The cost of the additives and product conditioning must be weighed
against the revenue generated by the sale of the beneficial-use material to determine
which product will produce the greatest margin of profit. The Solena Group is
considering the possibility of partnering with a tile company to produce tiles from the
sediment (Miller, interview).
Economic Analysis
Approximately 177,000 tons or 79,300 cubic yards3 of molten glass material are expected
to be produced from the vitrification of 500,000 cubic yards of sediment. As mentioned
before, this molten product can be used to manufacture a variety of products. It is
estimated that both glass fiber and glass tiles could be sold for on the order of hundreds
3 Using a standard density of 2650 kg/m3 for sediment
23
of dollars per ton. The market price for rock wool is roughly $200 per ton. The price and
market for aggregates, solar glass and roofing granules has not been researched.
Due to the fact that Westinghouse could produce a variety of products from the molten
glass product, the beneficial-use product price is difficult to determine. According to
Westinghouse estimates, the range of revenue generated by the sale of the end-use
product may vary from $7 to $180 per cubic yard (Westinghouse, 12-17). The processing
cost per cubic yard of contaminated sediment is approximated to be between $99 to $126.
The processing cost depends on several factors including the level of contamination of
the sediment and the variable costs associated with building a new processing plant. For
economic analysis, the averages of the upper and lower bounds of the processing costs
and end-use product price were used for simplicity sake. Consequently, the estimated
beneficial use product price is approximately $93.50 per cubic yard. One must also take
into account that the dredged sediment is approximately 50% water, which is not used in
the manufacturing of the final product. As a result, two cubic yards of contaminated
sediment are used to make one cubic yard of product. Therefore, the revenue generated
by the sale of the beneficial use product per cubic yard of contaminated sediment is about
$47 per cubic yard.
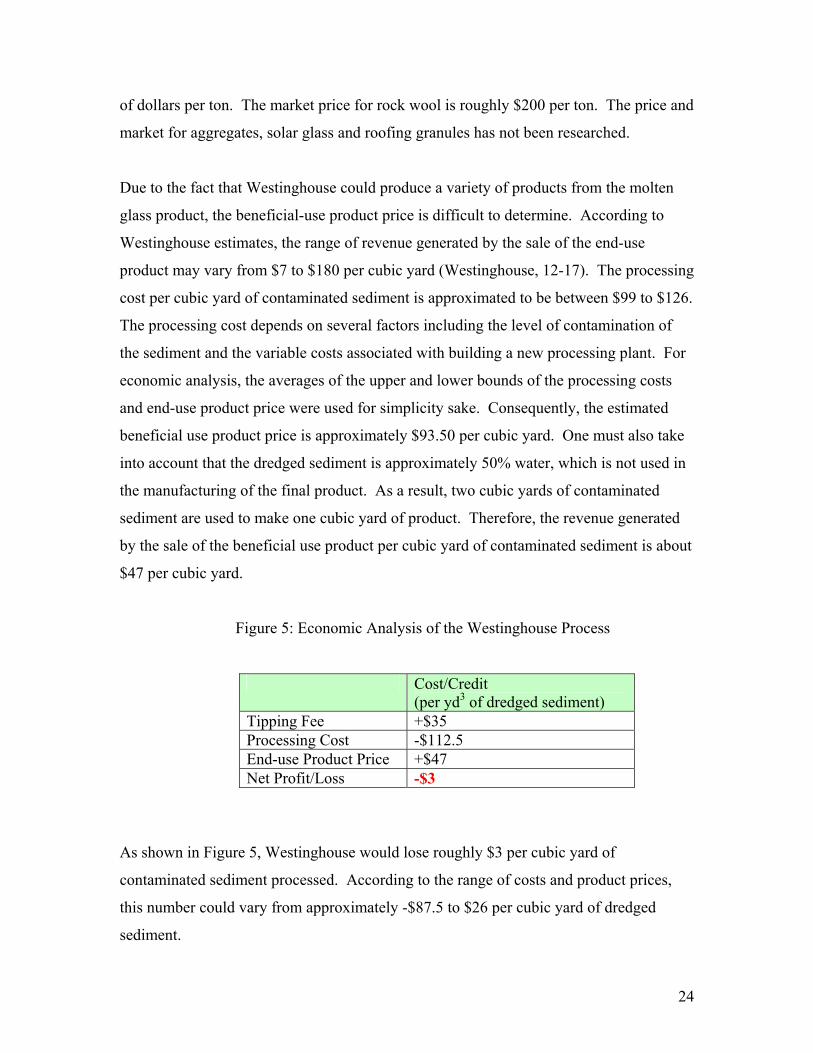
Figure 5: Economic Analysis of the Westinghouse Process
Cost/Credit (per yd3 of dredged sediment)
Tipping Fee +$35 Processing Cost -$112.5 End-use Product Price +$47 Net Profit/Loss -$3
As shown in Figure 5, Westinghouse would lose roughly $3 per cubic yard of
contaminated sediment processed. According to the range of costs and product prices,
this number could vary from approximately -$87.5 to $26 per cubic yard of dredged
sediment.
24
GTI
The Process
The four main steps of GTI‘s Cement-LockR Technology process are pre-treatment,
sediment melting, end-product processing, and offgas treatment. A schematic of the
process can be found in Appendix C. The contaminated sediment is first sifted through a
vibrating screen to remove any oversized material. Propietary modifiers, used to enhance
the cementitious characteristics of the sediment, are added to the screened sediment. The
mixture is then fed into a rotary kiln melter.
The melter exposes the sediment and modifier mix to temperatures between 1200° and
1400°C. At these temperatures, the sediment and proprietary modifiers are melted
completely and form a matrix melt. Organic contaminants and volatile compounds in the
sediment, including sodium and potassium chlorides, vaporize as a result of the elevated
temperatures of the melter. The organic compounds, which are released from melting the
sediment, are naturally converted by heat to environmentally acceptable gases, carbon
dioxide (CO2) and water (H2O). To ensure that all of the organic compounds are
destroyed, the flue gas enters a secondary combustion chamber (SCC) where it is exposed
to the same temperatures of the melter for two periods of two seconds each.
The flue gas, containing the SVOCs and other volatile contaminants, leaves the SCC and
is cooled by a 204°C direct water injection to prevent the formation of furan and dioxin
precursors. Hydrogen chloride, formed by the heating of any chlorines which may have
been originally in the sediment, also must be treated. Powdered lime is injected to
capture the hydrogen chloride, sulfur dioxide (SO2), and other acid gases. Not all of the
chlorine is trapped by this process; some of it is locked into the matrix of the melt.
Sodium and potassium chlorides, which transpired out of the sediment, along with spent
lime and fine particulates are captured in a bag house, sent through a carbon column, and
then released into the atmosphere.
25
Metal contaminants present in the dredged sediment, however, are not removed by the
melting process. Instead, the metals remain in the cement mixture. When the cement
product is made into concrete, the metals are locked into place. The concrete made with
GTI‘s cement product must pass specific leachability tests, such as the toxicity
characteristic leaching procedure (TCLP), before it can be marketed.
In the product-conditioning portion of the Cement-Lock Technology, the matrix melt is
either diffused into micrometer-sized fibers or pulverized into granules by freezing it with
a stream of quench water or high-velocity air. Special additives can be combined with
granulated fibers or pulverized matrix melt to create construction-grade cement.
Residuals
The residuals resulting from the GTI process can be categorized into two types: metals
and organic compounds. Most of the metal components are locked into the end-product,
the Ecomelt, while the majority of the organic compounds leave are converted to
innocuous gases, water, or salts.
Nine out of the thirteen RCRA metals, barium, cadmium, chromium, copper, lead, nickel,
silver, selenium, and zinc are locked into the end-use product (32). Two of the remaining
RCRA metals, arsenic and mercury are adsorbed into activated carbon, solidified, and
immobilized.
The organic contaminants, which may or may not be present in the sediment, include
polyaromatic hydrocarbons (PAHs), organochlorine pesticides, PCBs, and 2,3,7,8-
chlorine substituted PCDD/PCDF isomers. These compounds are transformed into
hydrogen, chloride, SO2, nitrogen, and organic carbon by the GTI process. These waste
components are then altered so that they can be released into the environment. All of the
modified forms of the waste components are innocuous, with two exceptions. These two
26
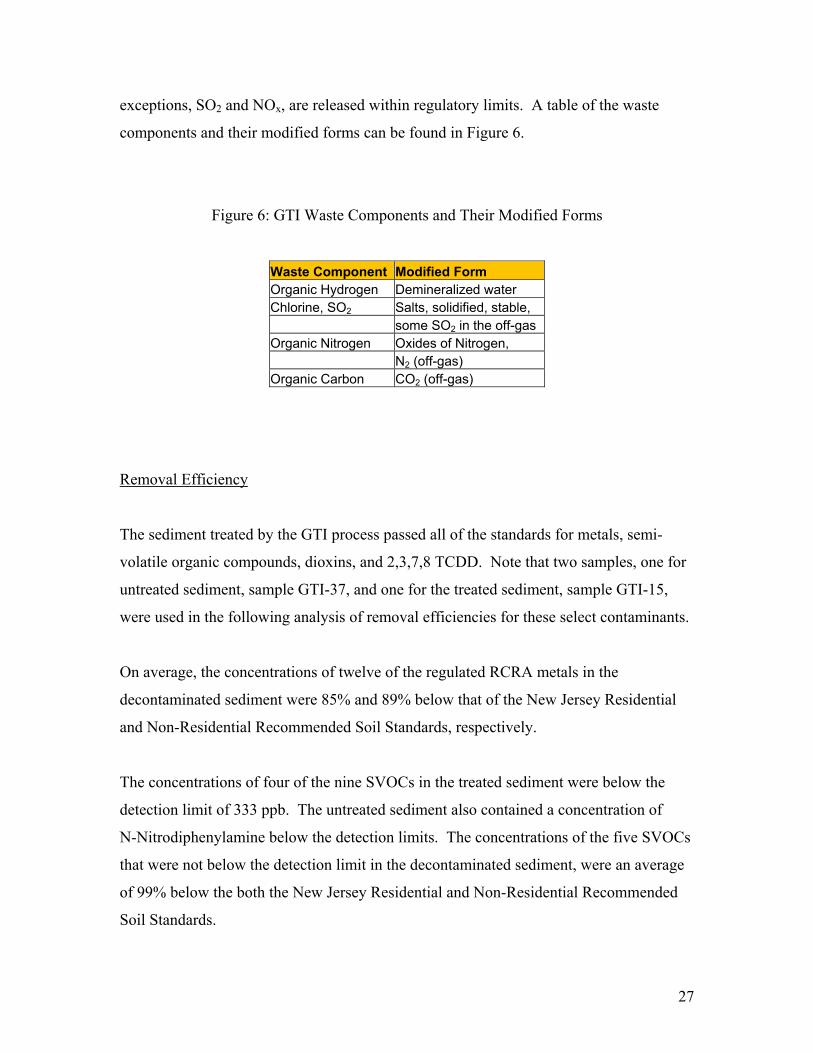
exceptions, SO2 and NOx, are released within regulatory limits. A table of the waste
components and their modified forms can be found in Figure 6.
Figure 6: GTI Waste Components and Their Modified Forms
Waste Component Modified Form Organic Hydrogen Demineralized water Chlorine, SO2 Salts, solidified, stable,
some SO2 in the off-gas Organic Nitrogen Oxides of Nitrogen,
N2 (off-gas) Organic Carbon CO2 (off-gas)
Removal Efficiency
The sediment treated by the GTI process passed all of the standards for metals, semi-
volatile organic compounds, dioxins, and 2,3,7,8 TCDD. Note that two samples, one for
untreated sediment, sample GTI-37, and one for the treated sediment, sample GTI-15,
were used in the following analysis of removal efficiencies for these select contaminants.
On average, the concentrations of twelve of the regulated RCRA metals in the
decontaminated sediment were 85% and 89% below that of the New Jersey Residential
and Non-Residential Recommended Soil Standards, respectively.
The concentrations of four of the nine SVOCs in the treated sediment were below the
detection limit of 333 ppb. The untreated sediment also contained a concentration of
N-Nitrodiphenylamine below the detection limits. The concentrations of the five SVOCs
that were not below the detection limit in the decontaminated sediment, were an average
of 99% below the both the New Jersey Residential and Non-Residential Recommended
Soil Standards.
27
The GTI process removed an average of 100% of PeCDD, HxCDD, HpCDD, and TCDD
as shown in Appendix F. The treated sediment also contained levels of 2,3,7,8 TCDD
below the detection limit of 1 ppt, which is below the recommended standard of 1ppb.
End-Use Product
The end-use material produced by GTI is not portland cement, rather it is a cement
product with properties similar to those of portland cement, to which sand, gravel, and
water must be added in order to create concrete (25). The cement product resulting from
the sediment decontamination is coined Ecomelt by GTI. Compressive strength tests
were performed on the Cement-lock cement to determine whether it met ASTM standards
C-595 for blended cement and C-150 for Portland cement. Water and Ottawa sand were
blended with the cement in a standard ratio specified by ASTM. In accordance with the
ASTM standard testing method, the samples were allowed to cure for 3, 7, and 28 days.
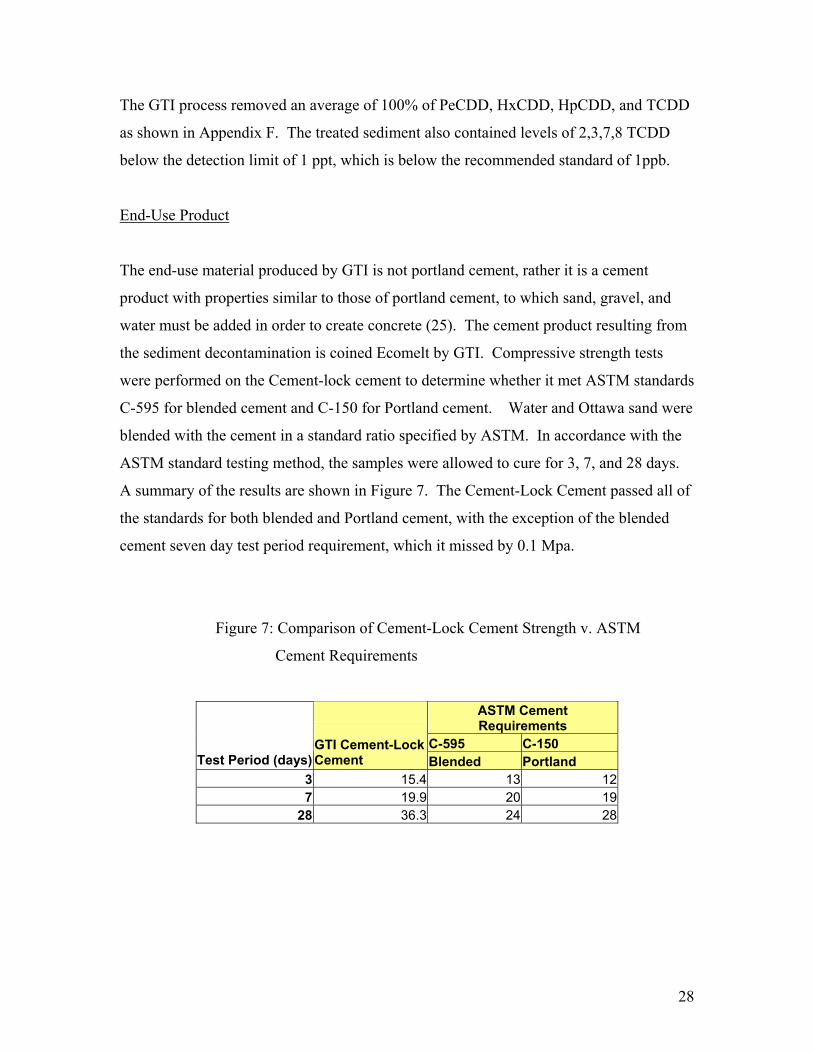
A summary of the results are shown in Figure 7. The Cement-Lock Cement passed all of
the standards for both blended and Portland cement, with the exception of the blended
cement seven day test period requirement, which it missed by 0.1 Mpa.
Figure 7: Comparison of Cement-Lock Cement Strength v. ASTM
Cement Requirements
ASTM Cement Requirements
C-595 C-150 Test Period (days)
GTI Cement-Lock Cement Blended Portland
3 15.4 13 12 7 19.9 20 19
28 36.3 24 28
28
Economic Analysis
The United States uses approximately 105 million metric tons of powdered cement each
year. Roughly 25 million tons of the powdered cement are imported. GTI hopes to fill
part of the gap between the supply of domestically-produced powdered cement and the
domestic demand for powdered cement.
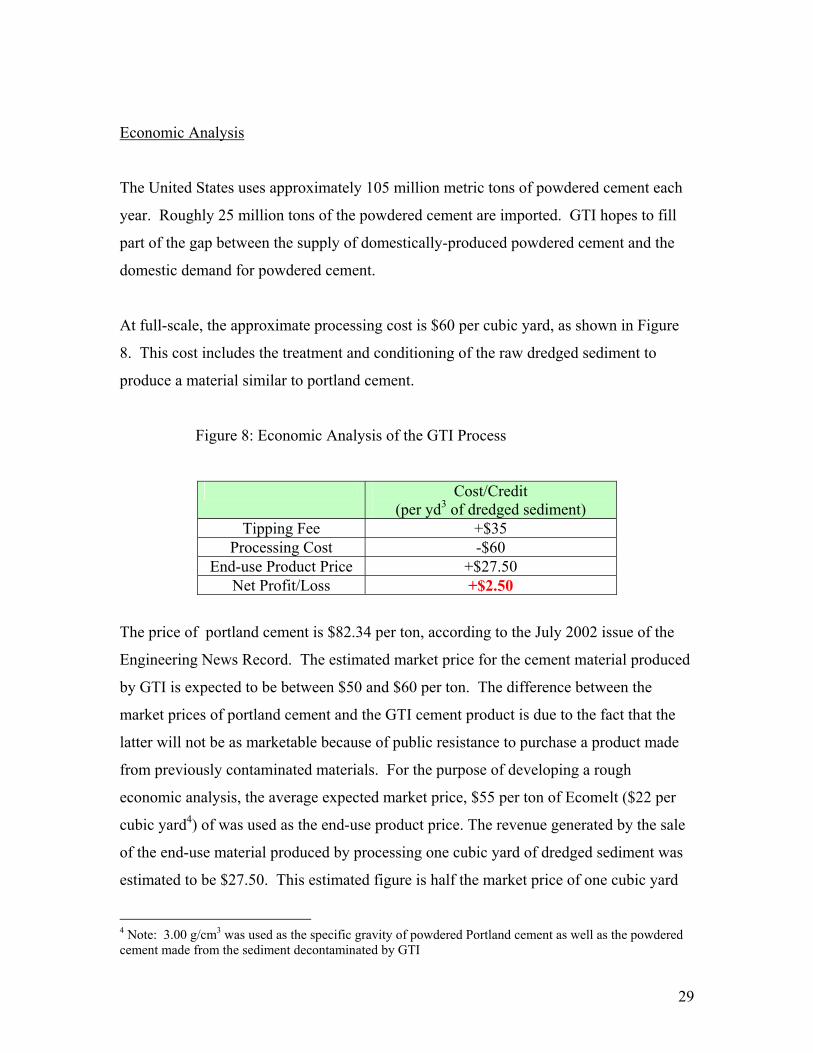
At full-scale, the approximate processing cost is $60 per cubic yard, as shown in Figure
8. This cost includes the treatment and conditioning of the raw dredged sediment to
produce a material similar to portland cement.
Figure 8: Economic Analysis of the GTI Process
Cost/Credit (per yd3 of dredged sediment)
Tipping Fee +$35 Processing Cost -$60
End-use Product Price +$27.50 Net Profit/Loss +$2.50
The price of portland cement is $82.34 per ton, according to the July 2002 issue of the
Engineering News Record. The estimated market price for the cement material produced
by GTI is expected to be between $50 and $60 per ton. The difference between the
market prices of portland cement and the GTI cement product is due to the fact that the
latter will not be as marketable because of public resistance to purchase a product made
from previously contaminated materials. For the purpose of developing a rough
economic analysis, the average expected market price, $55 per ton of Ecomelt ($22 per
cubic yard4) of was used as the end-use product price. The revenue generated by the sale
of the end-use material produced by processing one cubic yard of dredged sediment was
estimated to be $27.50. This estimated figure is half the market price of one cubic yard
4 Note: 3.00 g/cm3 was used as the specific gravity of powdered Portland cement as well as the powdered cement made from the sediment decontaminated by GTI
29
of end-product because approximately 50% of the dredged sediment is water and thus
will not be used in the actual manufacturing of the end-use product. Taking into account
the processing fee, the tipping fee, and the market price for the end-use product, the
estimated profit, per cubic yard of dredged sediment is $2.50, as shown in Figure 8.
NUIEG
The Process
The NUIEG sediment processing procedure consists of three core steps: pre-processing,
oxidation, and end-use product conditioning. A schematic of the NUIEG process can be
found in Appendix D. The first step in pre-processing is screening the sediment for
materials over ³“ in size. The isolated oversized material is then disposed of in a
landfill. Although not used in the pilot-scale, recycled filtrate water would be added to
the sediment to aid in the screening process in a full-scale facility.
After the sediment is screened, it must be dewatered in order for the decontamination
process to run smoothly. The water content of the sediment is reduced by a recycling
drying procedure. In this process, a portion of the sediment is dried by normal exposure
to air and manual mixing. This dried sediment is then added to wet sediment. The two
portions are mixed together, dried, and then added to more wet sediment. The purpose of
using this recycling process is to accelerate drying (NUIEG, 10). In the full-scale facility,
the water that evaporates from the wet sediment will be salvaged and used as filtrate
water in the screening process.
Once the sediment is dewatered, the sediment is transferred to a mortar mixer where it is
oxidized through the addition of an oxidant, potassium permanganate (KMnO4).
Potassium permanganate reacts with the contaminants in the soil to produce non-
hazardous compounds. In the pilot study, KMnO4 was added to the weight of the dried
sediment until a concentration of approximately 6,000 ppm was achieved.
30
After sediment decontamination, the additives, including fly ash and cement, can be
mixed in with the treated sediment to create a variety of products. Pozzolanic additives
can also be added to the decontaminated sediment in order to stabilize it, although they
were not added in this pilot study.
NUIEG is concerned that using KMnO4 as the oxidant may result in unacceptably high
levels of magnesium in the benficial-use product. As a result, they are researching
alternative oxidants, including hydrogen peroxide (H2O2).
Residuals
The only waste produced by the NUIEG process is wastewater generated by the
dewatering process of the sediment. A fraction of this water is recycled and used to ease
the initial screening of the sediment. The remainder of the water can either be
transported to a Public-Owned Treatment Works (POTW) or discharged under a point
source discharge permit (NJPDES) (NUIEG, 56). On a full-scale, NUIEG may chose to
construct an on-site facility to treat the wastewater. However, on a pilot-scale, it is more
cost-effective to send the wastewater to a POTW.
Decontamination Efficiency
Missing data make this analysis of the decontamination efficiency of the NUIEG process
incomplete. The treated and untreated sediment contaminant concentrations are averaged
over two runs, which contained nine samples each. This data can be found in the
—Analytical Qualifiers“ section of NUIEG‘s pilot study report.
From the data that is provided, the treated sediment met all but the New Jersey standards
for benzo(a)pyrene. The decontaminated sediment met the standards and general safety
guidelines for PCBs, eight out of the twelve RCRA regulated metals, and seven out of the
nine SVOCs considered in this analysis. Data is missing for three RCRA regulated
31
metals: beryllium, selenium, and thallium. The concentration for the remaining regulated
RCRA metal, silver, was found to be indeterminable. The concentration for di-n-butyl
phthalate, a SVOC, is also missing. No data exists for dioxin or 2,3,7,8 TCDD.
As shown in Appendix I, the treated sediment did not meet the standard for one SVOC,
benzo(a)pyrene. The concentration in the decontaminated sediment was found to be
3820 ppb, nearly five times the New Jersey Residential and Non-Residential Soil
Standard5 of 600 ppb. Overall, the treated sediment contained SVOC concentrations
approximately 68% and 88% below the New Jersey Residential and Non-Residential Soil
Standards, respectively.
The metal concentrations in the treated sediment were an average of 32% and 83% below
the New Jersey Residential and Non-Residential Soil Standards, respectively. These
averages are calculated from the eight metals for which data existed. The data used to
compute these averages can be found in Appendix G.
The NUIEG process removed approximately 24% of the PCBs present in the untreated
sediment. The treated sediment contained 358 ppb of PCBs, which meets the New York
and New Jersey standards, which are listed in Appendix H.
End-Use Product
As mentioned in The Process section of this report, the treated sediment produced by the
NUIEG decontamination process can be used to create a variety of products. Which
material NUIEG actually chooses to manufacture depends on the production costs and
marketability of the potential product. Different ratios and amounts of ash, cement, and
other additives can be added to the treated sediment in order to create a wide range of
products, including a material similar to portland cement. Without the addition of these
chemicals, the treated sediment alone can be used as fill or capping material.
5 The New Jersey Residential and Non-residential Soil Standards are both 600 ppb for benzo(a)pyrene
32
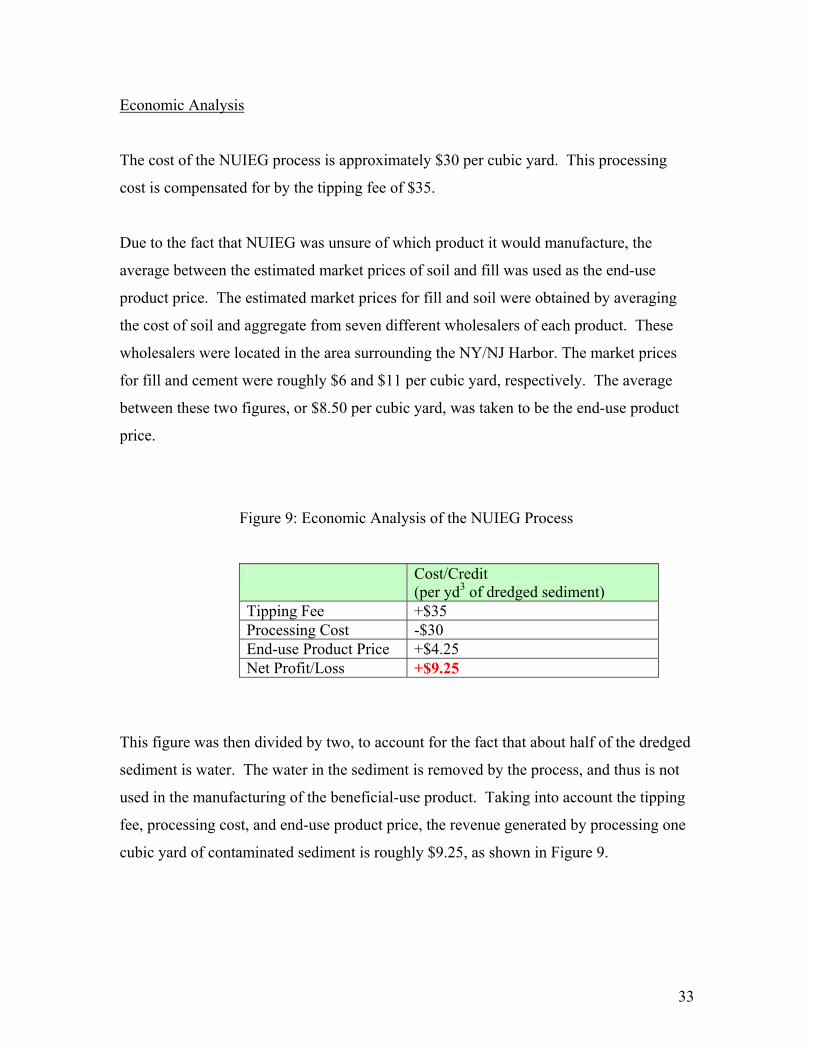
Economic Analysis
The cost of the NUIEG process is approximately $30 per cubic yard. This processing
cost is compensated for by the tipping fee of $35.
Due to the fact that NUIEG was unsure of which product it would manufacture, the
average between the estimated market prices of soil and fill was used as the end-use
product price. The estimated market prices for fill and soil were obtained by averaging
the cost of soil and aggregate from seven different wholesalers of each product. These
wholesalers were located in the area surrounding the NY/NJ Harbor. The market prices
for fill and cement were roughly $6 and $11 per cubic yard, respectively. The average
between these two figures, or $8.50 per cubic yard, was taken to be the end-use product
price.
Figure 9: Economic Analysis of the NUIEG Process
Cost/Credit (per yd3 of dredged sediment)
Tipping Fee +$35 Processing Cost -$30 End-use Product Price +$4.25 Net Profit/Loss +$9.25
This figure was then divided by two, to account for the fact that about half of the dredged
sediment is water. The water in the sediment is removed by the process, and thus is not
used in the manufacturing of the beneficial-use product. Taking into account the tipping
fee, processing cost, and end-use product price, the revenue generated by processing one
cubic yard of contaminated sediment is roughly $9.25, as shown in Figure 9.
33
Metcalf & Eddy
The Process
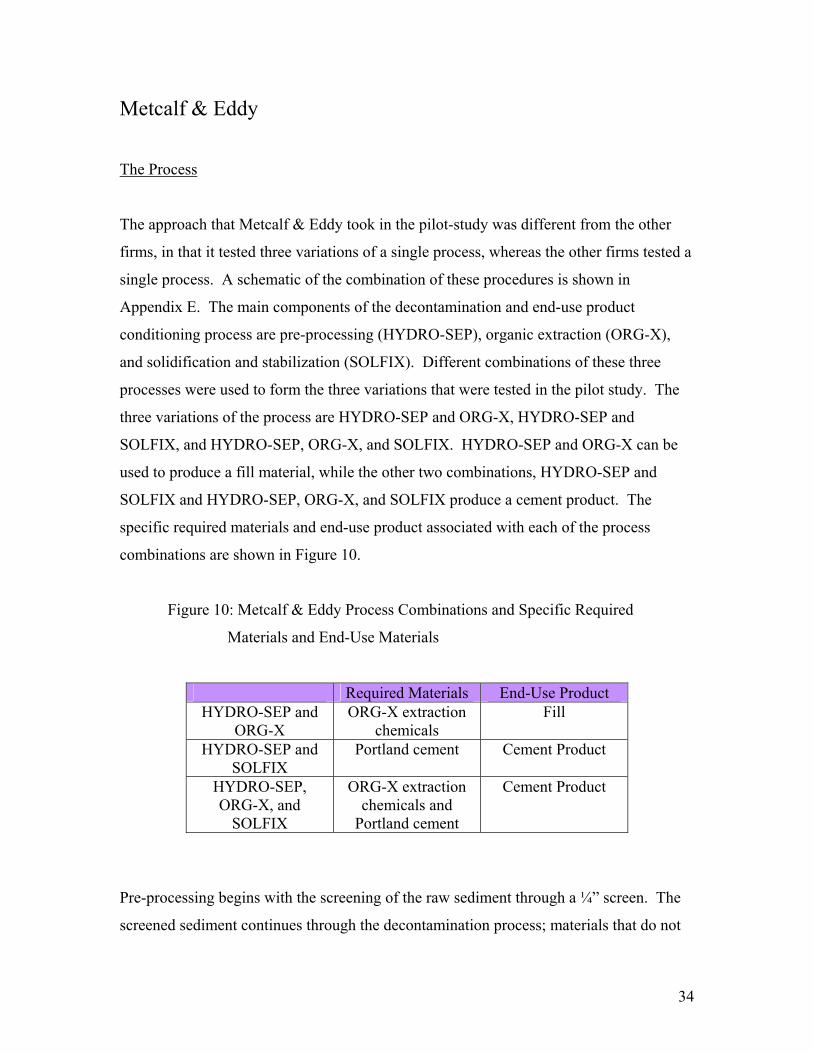
The approach that Metcalf & Eddy took in the pilot-study was different from the other
firms, in that it tested three variations of a single process, whereas the other firms tested a
single process. A schematic of the combination of these procedures is shown in
Appendix E. The main components of the decontamination and end-use product
conditioning process are pre-processing (HYDRO-SEP), organic extraction (ORG-X),
and solidification and stabilization (SOLFIX). Different combinations of these three
processes were used to form the three variations that were tested in the pilot study. The
three variations of the process are HYDRO-SEP and ORG-X, HYDRO-SEP and
SOLFIX, and HYDRO-SEP, ORG-X, and SOLFIX. HYDRO-SEP and ORG-X can be
used to produce a fill material, while the other two combinations, HYDRO-SEP and
SOLFIX and HYDRO-SEP, ORG-X, and SOLFIX produce a cement product. The
specific required materials and end-use product associated with each of the process
combinations are shown in Figure 10.
Figure 10: Metcalf & Eddy Process Combinations and Specific Required
Materials and End-Use Materials
Required Materials End-Use Product HYDRO-SEP and
ORG-X ORG-X extraction
chemicals Fill
HYDRO-SEP and SOLFIX
Portland cement Cement Product
HYDRO-SEP, ORG-X, and
SOLFIX
ORG-X extraction chemicals and
Portland cement
Cement Product
Pre-processing begins with the screening of the raw sediment through a ³“ screen. The
screened sediment continues through the decontamination process; materials that do not
34
make it through the screen are set aside and are later treated by the HYDRO-SEP
washing process. HYDRO-SEP uses water to rinse away the contaminants on the
oversized material, thus making it acceptable for disposal in a non-hazardous landfill.
The washwater used in the HYDRO-SEP procedure can be recycled and used again.
The screened sediment, meanwhile, is cleansed by ORG-X solvent extraction. Both
batch and continuous extraction processes of the ORG-X procedure were tested in this
pilot study. In the batch procedure, the screened sediment is transferred to a mixer-settler
extractor tank containing new solvent or solvent which has been recycled from a previous
batch. The mixer-settler tank is equipped with a three-blade impeller and a two-bar
bottom scrapper propeller mixer (Metcalf & Eddy, 2-6). After the addition of the
screened sediment to the mixer-settler extractor, nitrogen is flushed through the vessel in
order to clean it. Extraction solvent heated to between 100° and 140°F is then added to
the tank until the ratio between the screened sediment and the extraction solvent is 1:1.
After fifteen minutes of agitation with the mixer and ten minutes of settling, the tank
consists of a bottom layer of solvent-saturated sediment, and a top layer of solvent
containing organic contaminants. The contaminated solvent layer is decanted from the
tank and treated. A bag filter is used to trap the small amount of sediment that is present
in the solvent layer. The extraction process is repeated on the bottom layer of solvent-
saturated sediment until the desired amount of the various organic compounds have been
removed from the sediment.
The treated sediment layer is dried using a steam jacket. The propeller mixer is kept
rotating in order to increase heat transfer through the sediment, which in turn accelerates
the drying process. The solvent and water azeotrope is trapped, condensed, and returned
to the extractor where it is used for future extractions. The decontaminated sediment is
then exposed to the vapor temperature of water, 212°F, to ensure that all of the solvent
has been removed from the sediment.
The second layer from the extraction, the azeotrope water and solvent mixture, is
separated into its aqueous and solvent components using distillation. The solvent and
35
water mixture is heated to 172 to 185°F, a span of temperatures which corresponds to the
range of boiling points of typical azeotrope solvent-water mixtures (2-8). As a result,
when the azeotrope is heated to these temperatures, it volatilizes. The azeotrope vapor is
then condensed into waste oil and a 2-layer liquid, which consists of a top layer of
solvent and an aqueous bottom layer. An oil polisher is used to remove the residual
solvent present in the waste oil. The polished waste oil is sent to an off-site facility to be
incinerated or disposed of in some other manner (Cardoni, interview). The solvent layer
of the azeotrope can be decanted off of the aqueous layer and used in the extraction
process. The water layer is drained from the vessel and is steam stripped to remove
residual solvents (Metcalf & Eddy, 2-9).
The wastewater layer is transported to a stripper column where any residual solvents are
removed by steam stripping. Organic compounds with lower boiling points can be
isolated by injecting steam into the sediment. Other organic compounds can be removed
from the wastewater or condensate by feeding water, just below the azeotropic boiling
point through the feed preheater. A portion of this feedwater vaporizes upon entering the
top of the column, and the remainder is stripped of residual solvents by upflowing steam
(2-10). The vapors produced by the stripping process are condensed and used again as
solvent in the extraction process.
The continuous solvent extraction process is identical to the batch solvent extraction
process, with a few modifications. The sediment must be screened to 1/8“ instead of
1/4“. Also, instead of periodically decanting the solvent and water azeotropic layer from
the sediment after extraction, the continuous process separates the two layers without
interruption during extraction. In the continuous process, the sediment is allowed to
escape through the bottom of the column, and the solvent is removed through the top of
the column. The solvent recovery, organic separation, and water stripping steps are the
same for both extraction processes.
The final step in the process, the SOLFIX solidification and stabilization step, involves
the addition of Portland cement to the sediment. As mentioned in The Process portion of
36
this section, the SOLFIX process was performed on both the raw dredged sediment and
ORG-X extracted sediment. Due to the high water content of the raw sediment, excess
water had to be decanted from it in order to ensure the production of a quality product.
Portland cement was added to the raw sediment in 1:10, 1:5, and 1:2.5 ratios and to the
treated sediment in 1:6.67 and 1:3.33 ratios. The sediment and Portland cement mixture
can then be poured into desired molds to make solid concrete.
Residuals
The waste by-products resulting from the Metcalf & Eddy process fall into four
categories: spent solvent, organic waste oil, gas mixtures, and water. The used solvent
and the organic waste oil are shipped to an outside source to be processed by a fuel-blend
incinerator and regular incinerator, respectively. The gas that is discharged from the
batch and continuous extractions consists of mostly nitrogen purge gas, small amounts of
oxygen, other atmospheric gases, and traces of solvents and water. Although only small
amounts of solvent exist in the vent gas, an activated carbon scavenger downstream of
the vent destroys any remaining organic vapors before the gas is released into the
atmosphere. Before the wastewater is sent to a public-owned treatment works (POTW)
for disposal, it is tested to ensure that it does not contain concentrations of organic
solvents in excess of the POTW‘s standard for acceptance. In the pilot-study, the
wastewater was found to contain less than 0.1 percent organic solvents, a level acceptable
for disposal in a POTW.
The condensate from the steam stripping traps does not come in contact with any
contaminated substances or waste streams, so it can be disposed of a sewer. The city
water, which is used in the vent condenser, can also be discharged into the sewer. In the
pilot-study, the city water flow into the sewer was less than .5 gallons per minute.
Decontamination Efficiency
37
To complete the decontamination efficiency evaluation, two samples were considered.
One of these samples, MEP-1-1, was an —as-dredged“ sediment sample, which was used
as the untreated sediment. The other sample, MEPP-10-1, which was treated using the
continuous ORG-X decontamination process, was used as the treated sediment. As
mentioned in The Process portion of this report, Portland cement was added to the treated
sediment in ratios of 1:3.33 and 1:6.67. Because the beneficial use end-product consists
of both decontaminated sediment and Portland cement, adjustments to the data had to be
made. A Portland cement to treated sediment ratio of 1:3.33 was assumed. Using this
ratio, approximately 76.9% of the end-product is actually treated sediment. The
concentrations of the treated sediment, MEPP-10-1, were multiplied times a factor of
.76905 to reflect the actual contaminant concentrations in the beneficial-use material.
The treated sediment did not meet the standards for three of the twelve RCRA metal
standards: arsenic, copper, and lead. The arsenic concentration was 53.2 ppm and the
New Jersey Residential and Non-Residential Standards is 20 ppm. The copper
concentration of the treated sediment, 823 ppm, exceeded the residential and non-
residential standard, which are both 600 ppm. In this case, the copper concentration of
the untreated sediment, 1410 ppm, was higher than that of the treated sediment. The
treated sediment contained concentrations of lead greater than the New Jersey Residential
Standard. The standard is 400 ppm and the treated sediment had a concentration of 461
ppm. The concentrations for the nine metals that did meet the standards were an average
of 53.3% and 75.4% below the New Jersey Residential and Non-Residential Soil
Standards, respectively.
The treated sediment contained PCB concentrations below the New York Recommended
Soil Cleanup Standard and the New Jersey Residential and Non-Residential Standards, as
shown in Appendix H. The Metcalf & Eddy process reduced the PCB concentration in
the sediment by nearly 98%, reducing it from 5,440 to 109 ppb.
The average removal efficiencies for TCDD and three dioxins: PeCDD, HxCDD, and
HpCDD were 96% and 99% respectively. The concentration of 2,3,7,8 TCDD was found
38
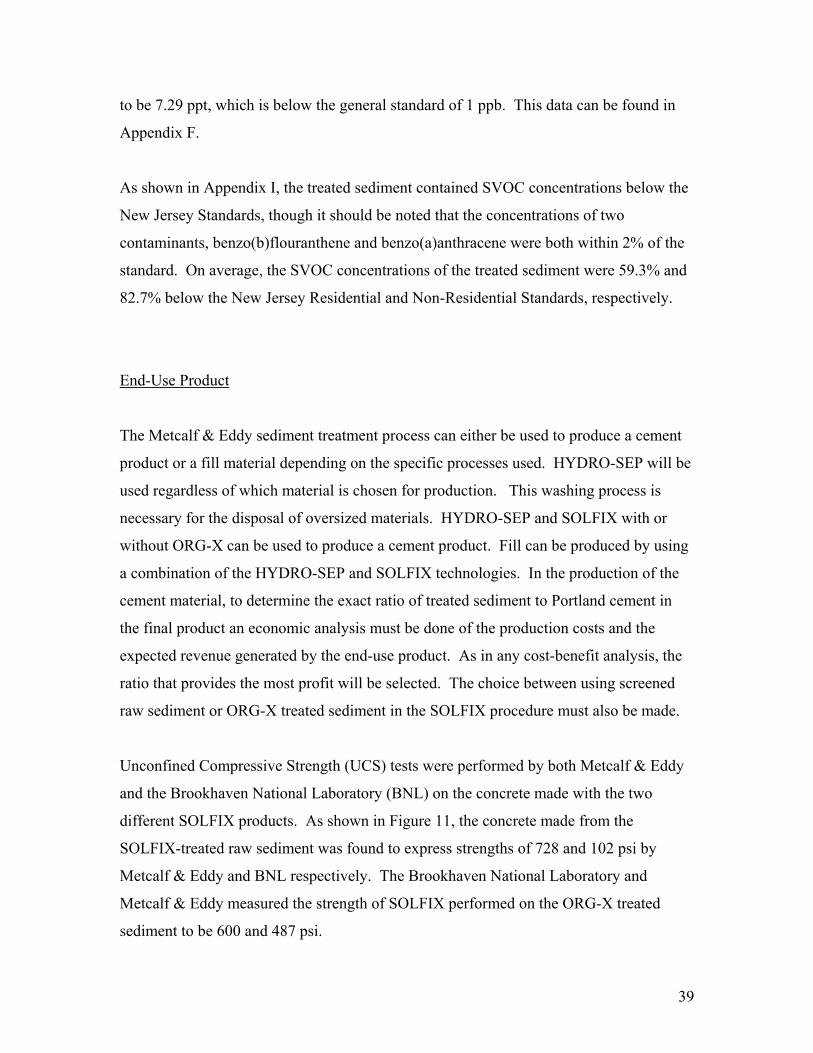
to be 7.29 ppt, which is below the general standard of 1 ppb. This data can be found in
Appendix F.
As shown in Appendix I, the treated sediment contained SVOC concentrations below the
New Jersey Standards, though it should be noted that the concentrations of two
contaminants, benzo(b)flouranthene and benzo(a)anthracene were both within 2% of the
standard. On average, the SVOC concentrations of the treated sediment were 59.3% and
82.7% below the New Jersey Residential and Non-Residential Standards, respectively.
End-Use Product
The Metcalf & Eddy sediment treatment process can either be used to produce a cement
product or a fill material depending on the specific processes used. HYDRO-SEP will be
used regardless of which material is chosen for production. This washing process is
necessary for the disposal of oversized materials. HYDRO-SEP and SOLFIX with or
without ORG-X can be used to produce a cement product. Fill can be produced by using
a combination of the HYDRO-SEP and SOLFIX technologies. In the production of the
cement material, to determine the exact ratio of treated sediment to Portland cement in
the final product an economic analysis must be done of the production costs and the
expected revenue generated by the end-use product. As in any cost-benefit analysis, the
ratio that provides the most profit will be selected. The choice between using screened
raw sediment or ORG-X treated sediment in the SOLFIX procedure must also be made.
Unconfined Compressive Strength (UCS) tests were performed by both Metcalf & Eddy
and the Brookhaven National Laboratory (BNL) on the concrete made with the two
different SOLFIX products. As shown in Figure 11, the concrete made from the
SOLFIX-treated raw sediment was found to express strengths of 728 and 102 psi by
Metcalf & Eddy and BNL respectively. The Brookhaven National Laboratory and
Metcalf & Eddy measured the strength of SOLFIX performed on the ORG-X treated
sediment to be 600 and 487 psi.
39
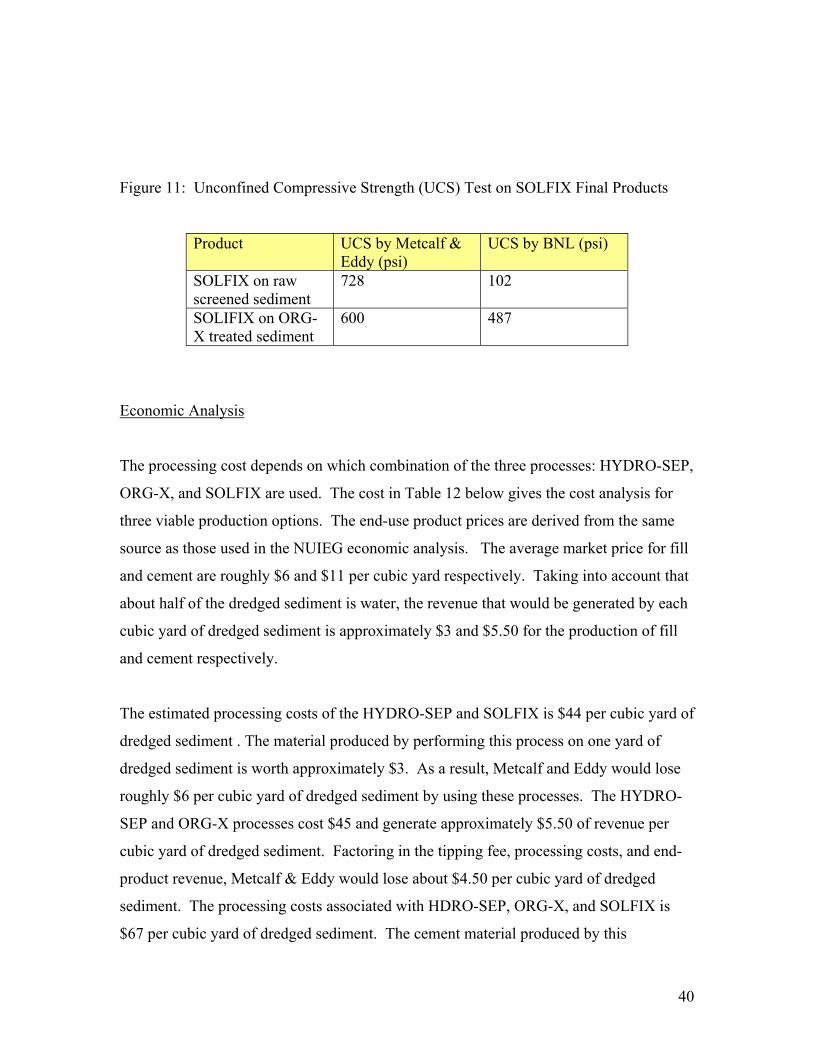
Figure 11: Unconfined Compressive Strength (UCS) Test on SOLFIX Final Products
Product UCS by Metcalf & Eddy (psi)
UCS by BNL (psi)
SOLFIX on raw screened sediment
728 102
SOLIFIX on ORG-X treated sediment
600 487
Economic Analysis
The processing cost depends on which combination of the three processes: HYDRO-SEP,
ORG-X, and SOLFIX are used. The cost in Table 12 below gives the cost analysis for
three viable production options. The end-use product prices are derived from the same
source as those used in the NUIEG economic analysis. The average market price for fill
and cement are roughly $6 and $11 per cubic yard respectively. Taking into account that
about half of the dredged sediment is water, the revenue that would be generated by each
cubic yard of dredged sediment is approximately $3 and $5.50 for the production of fill
and cement respectively.
The estimated processing costs of the HYDRO-SEP and SOLFIX is $44 per cubic yard of
dredged sediment . The material produced by performing this process on one yard of
dredged sediment is worth approximately $3. As a result, Metcalf and Eddy would lose
roughly $6 per cubic yard of dredged sediment by using these processes. The HYDRO-
SEP and ORG-X processes cost $45 and generate approximately $5.50 of revenue per
cubic yard of dredged sediment. Factoring in the tipping fee, processing costs, and end-
product revenue, Metcalf & Eddy would lose about $4.50 per cubic yard of dredged
sediment. The processing costs associated with HDRO-SEP, ORG-X, and SOLFIX is
$67 per cubic yard of dredged sediment. The cement material produced by this
40
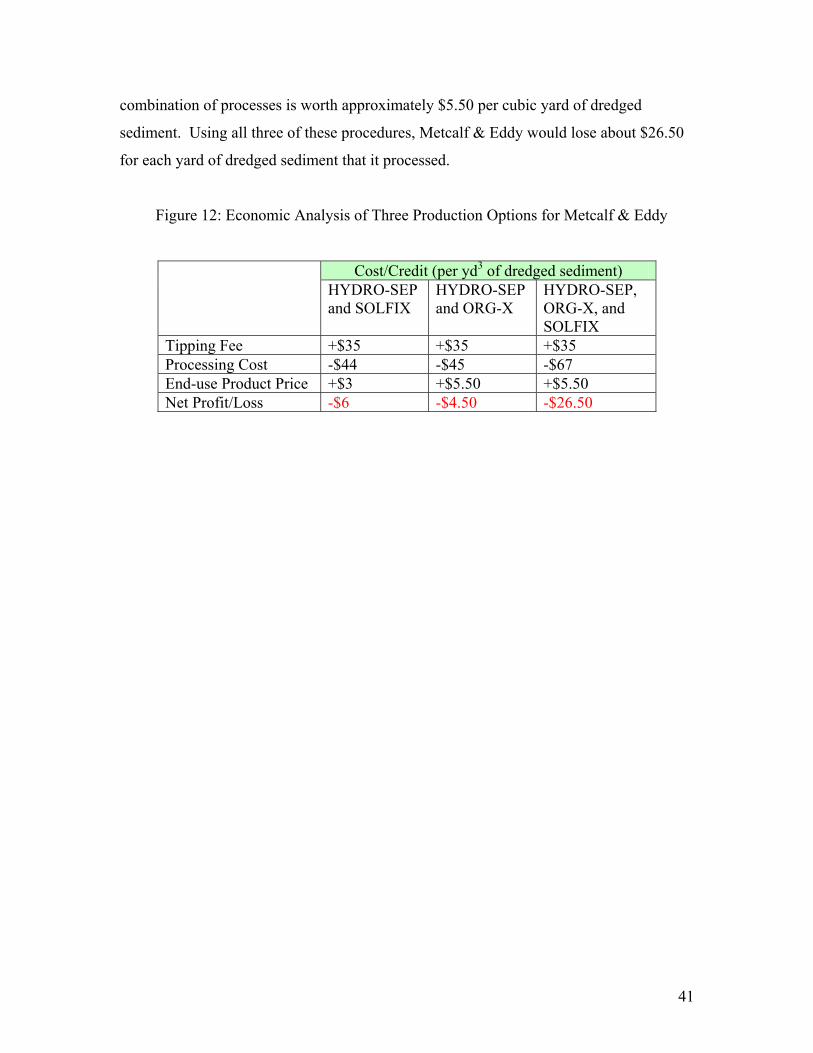
combination of processes is worth approximately $5.50 per cubic yard of dredged
sediment. Using all three of these procedures, Metcalf & Eddy would lose about $26.50
for each yard of dredged sediment that it processed.
Figure 12: Economic Analysis of Three Production Options for Metcalf & Eddy
Cost/Credit (per yd3 of dredged sediment) HYDRO-SEP and SOLFIX
HYDRO-SEP and ORG-X
HYDRO-SEP, ORG-X, and SOLFIX
Tipping Fee +$35 +$35 +$35 Processing Cost -$44 -$45 -$67 End-use Product Price +$3 +$5.50 +$5.50 Net Profit/Loss -$6 -$4.50 -$26.50
41
REFERENCES
Amirin, Mohsen C. —Advanced Sediment Washing for Decontamination of New York/New Jersey Harbor“.
Biogenesis. BioGenesis Sediment Washing Technology: Final Report on the PilotDemonstration Project. 1999.
Cardoni. John. 2002. Interview. Metcalf & Eddy.
Clesceri, Nicholas L. et al. —Decontaminating and Processing Dredged Material for Beneficial Use“. 2000.
Douglas, Scott W. et al. —A Comprehensive Strategy for Managing Contaminated Dredged Materials in the Port of New York And New Jersey“.
Edwards, Daniel. 2002. Interview. NUI Environmental Group.
EPA 000-0-99000 Fast Track Dredged Material Decontamination Demonstration for the Port of New York and New Jersey. 1999.
Institute of Gas Technology (Amir Rehmat) Cement-Lock Technology forDecontaminating Dredged Estuarine Sediments, Phase II: Pilot Scale Studies. 1999.
Jones, Keith W. et al. “Dredged material decontamination demonstration for the port of New York/ New Jersey“ Journal of Hazardous Materials 85 (2001) pp 127-143.
Mensinger, Michael. 2002. Interview. Institute of Gas Technology.
Metcalf & Eddy. Report on Pilot Plant Study for Integrated Sediment Decontamination System. 1997.
Miller, Dennis. 2002. Interview. Solena Group.
New York/New Jersey Harbor Estuary Program Habitat Workgroup. www.harborestuary.com (1 August 2002).
NUI Environmental Group Sediment Decontamination Demonstration Project: Final Pilot Study Report. 2002.
Stern, Eric A. 2002. Interview. EPA-Region 2.
Wilde, Charles. 2002. Interview. Biogenesis.
42
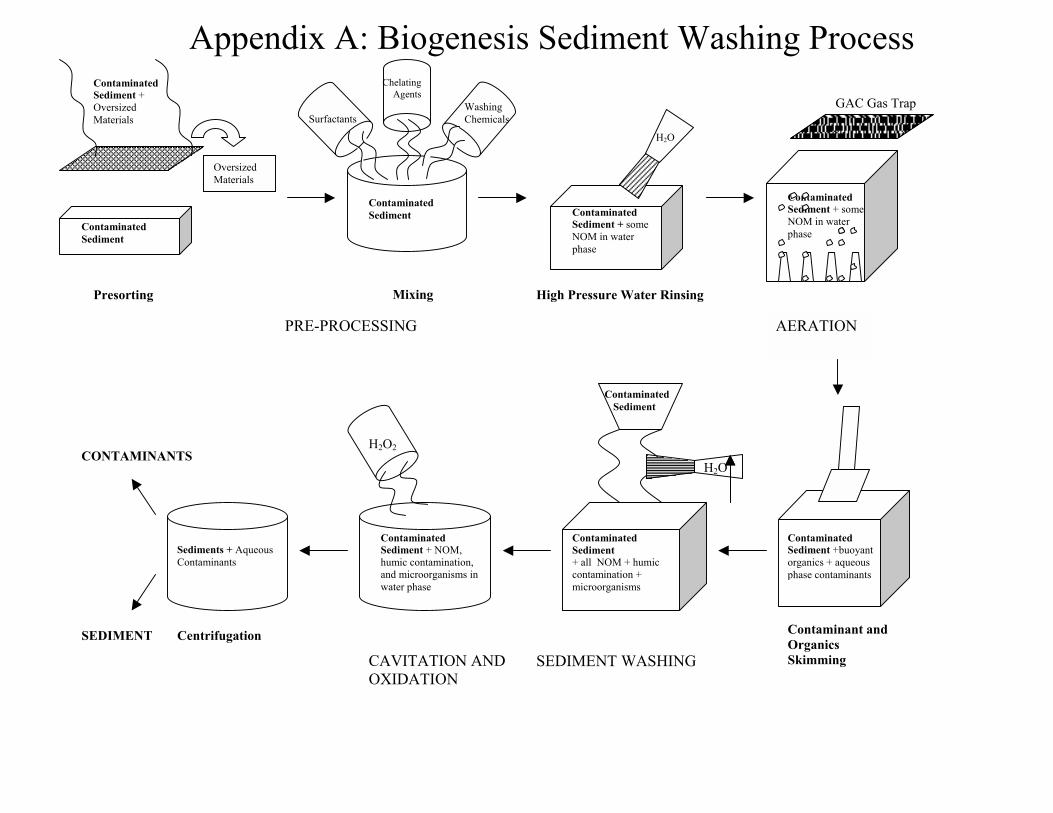
Appendix A: Biogenesis Sediment Washing Process
GAC Gas Trap Contaminated Sediment + Oversized Materials
Oversized Materials
Contaminated Sediment
Contaminated Sediment
Surfactants
Chelating Agents
Washing Chemicals
Contaminated Sediment + some NOM in water phase
H2O
Contaminated Sediment + some NOM in water phase
Presorting Mixing High Pressure Water Rinsing
PRE-PROCESSING
CONTAMINANTS
Contaminated Sediment + NOM, humic contamination, and microorganisms in water phase
H2O2
Contaminated Sediment +buoyant organics + aqueous phase contaminants
H2O
Contaminated Sediment
Contaminated Sediment + all NOM + humic contamination + microorganisms
AERATION
Sediments + Aqueous Contaminants
SEDIMENT Centrifugation Contaminant and Organics
CAVITATION AND SEDIMENT WASHING Skimming OXIDATION
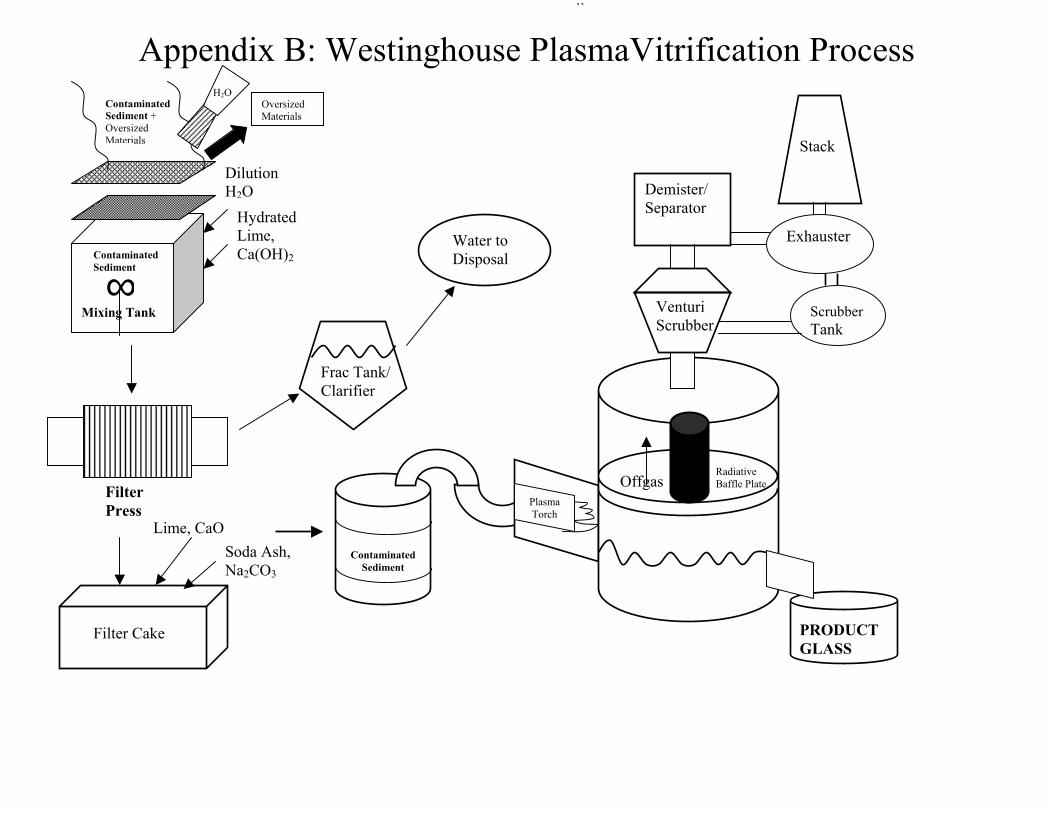
``
Contaminated Sediment
PRODUCT GLASS
Filter Press
Filter Cake
Lime, CaO Soda Ash, Na2CO3
Frac Tank/ Clarifier
Water to Disposal
Contaminated Sediment + Oversized Materials
Oversized Materials
Contaminated Sediment
H2O
Dilution H2O
Hydrated Lime, Ca(OH)2
∞ Venturi Scrubber
Demister/ Separator
Scrubber Tank
Exhauster
Stack
Appendix B: Westinghouse PlasmaVitrification Process
Plasma Torch
Offgas
Mixing Tank
Radiative Baffle Plate
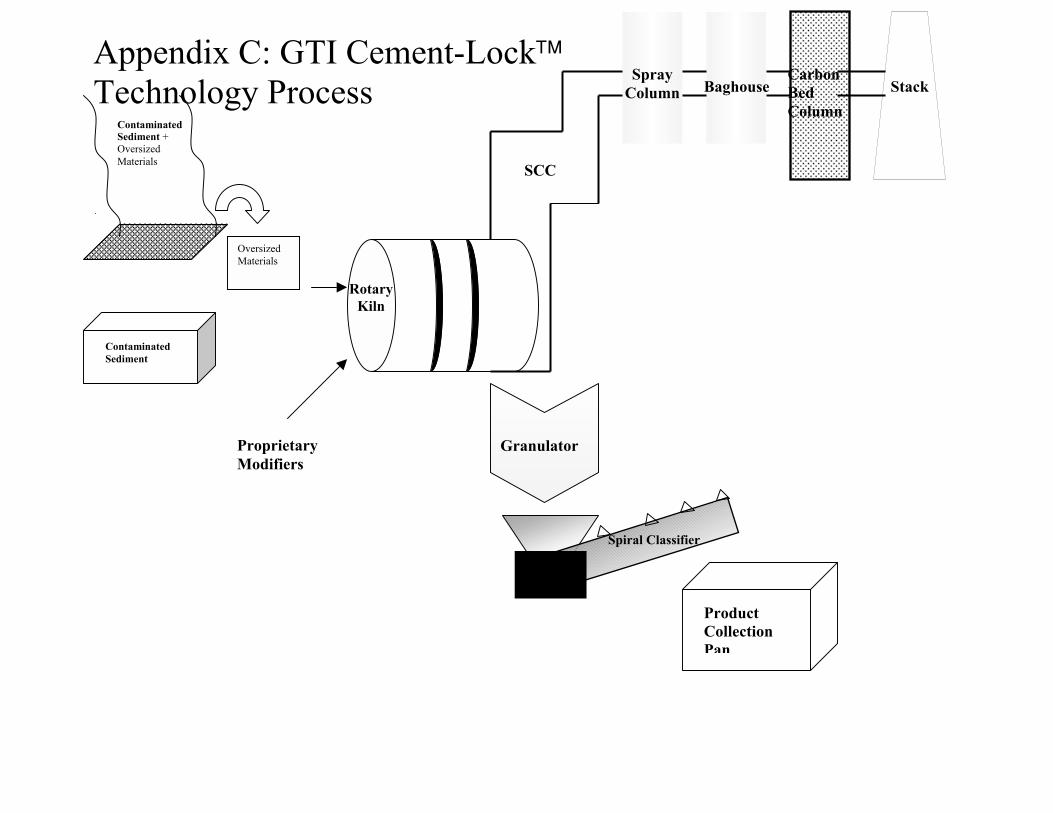
Contaminated Sediment + Oversized Materials
Oversized Materials
Spray Column Baghouse
Carbon Bed Column
Stack
Granulator
Product Collection Pan
Spiral Classifier
Proprietary Modifiers
Rotary Kiln
Contaminated Sediment
SCC
Appendix C: GTI Cement-Lock Technology Process
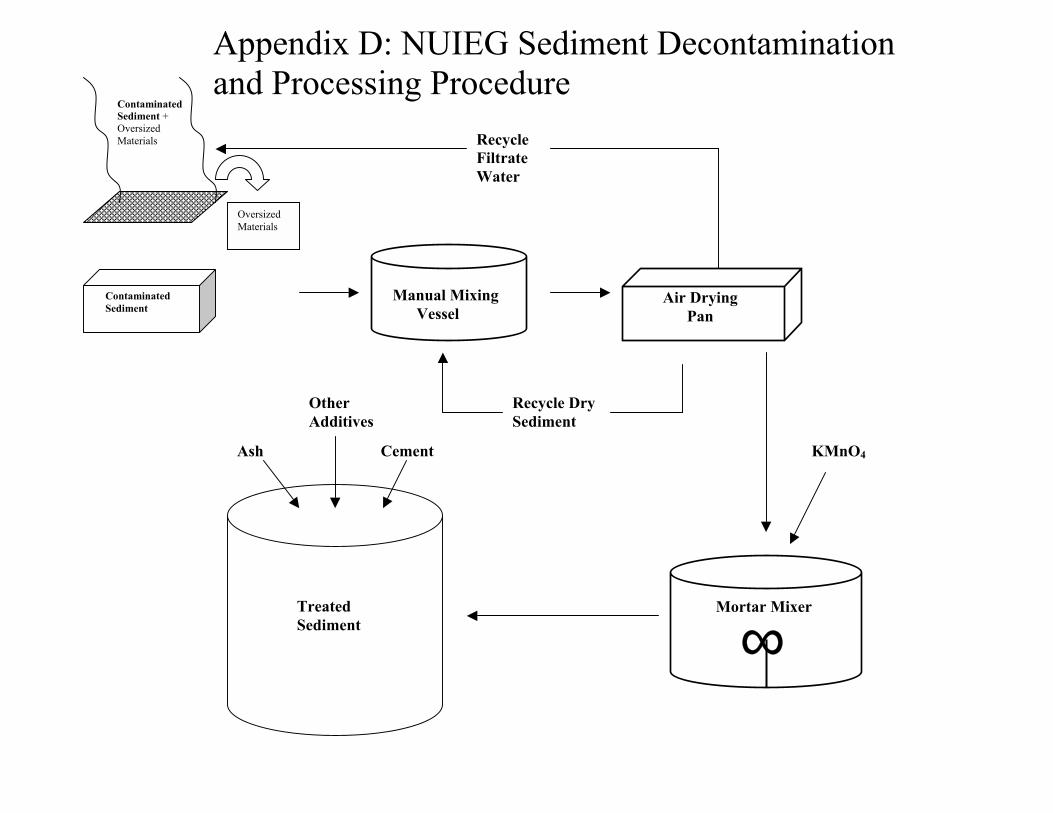
Appendix D: NUIEG Sediment Decontamination Contaminated Sediment + Oversized Materials
Oversized Materials
Contaminated Sediment
Manual Mixing Vessel
Air Drying Pan
Recycle Filtrate Water
and Processing Procedure
Other Recycle Dry Additives Sediment
Treated Sediment
Ash Cement
Mortar Mixer
∞
KMnO4
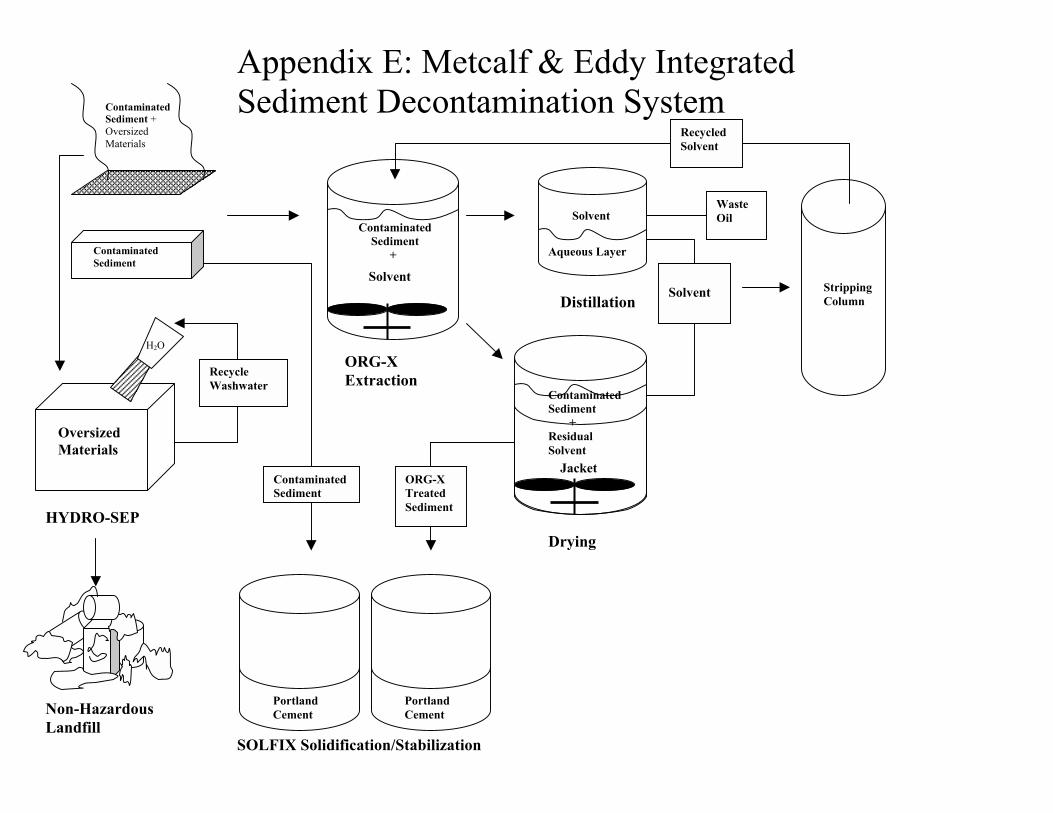
Appendix E: Metcalf & Eddy Integrated Contaminated Sediment + Oversized Materials
Contaminated Sediment
Oversized Materials
H2O
Recycle Washwater
Non-Hazardous Landfill
HYDRO-SEP
Solvent
Contaminated Sediment
+
Distillation
Aqueous Layer
Solvent Waste Oil
Jacket
Contaminated Sediment
+ Residual Solvent
Solvent Stripping Column
Drying
Recycled Solvent
Sediment Decontamination System
ORG-X Extraction
Contaminated Sediment
ORG-X Treated Sediment
Portland Cement
Portland Cement
SOLFIX Solidification/Stabilization
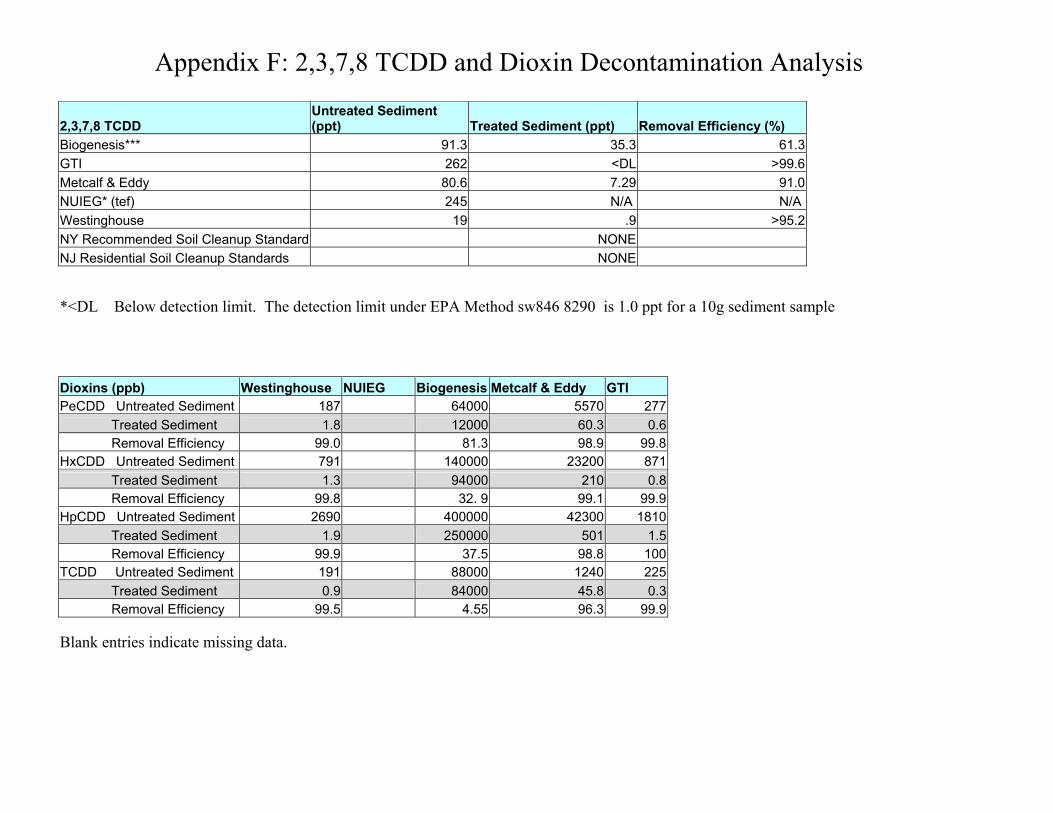
Appendix F: 2,3,7,8 TCDD and Dioxin Decontamination Analysis
2,3,7,8 TCDD Untreated Sediment (ppt) Treated Sediment (ppt) Removal Efficiency (%)
Biogenesis*** 91.3 35.3 61.3 GTI 262 <DL >99.6 Metcalf & Eddy 80.6 7.29 91.0 NUIEG* (tef) 245 N/A N/A Westinghouse 19 .9 >95.2 NY Recommended Soil Cleanup Standard NONE NJ Residential Soil Cleanup Standards NONE
*<DL Below detection limit. The detection limit under EPA Method sw846 8290 is 1.0 ppt for a 10g sediment sample
Dioxins (ppb) Westinghouse NUIEG Biogenesis Metcalf & Eddy GTI PeCDD Untreated Sediment 187 64000 5570 277
Treated Sediment 1.8 12000 60.3 0.6 Removal Efficiency 99.0 81.3 98.9 99.8
HxCDD Untreated Sediment 791 140000 23200 871 Treated Sediment 1.3 94000 210 0.8 Removal Efficiency 99.8 32. 9 99.1 99.9
HpCDD Untreated Sediment 2690 400000 42300 1810 Treated Sediment 1.9 250000 501 1.5 Removal Efficiency 99.9 37.5 98.8 100
TCDD Untreated Sediment 191 88000 1240 225 Treated Sediment 0.9 84000 45.8 0.3 Removal Efficiency 99.5 4.55 96.3 99.9
Blank entries indicate missing data.
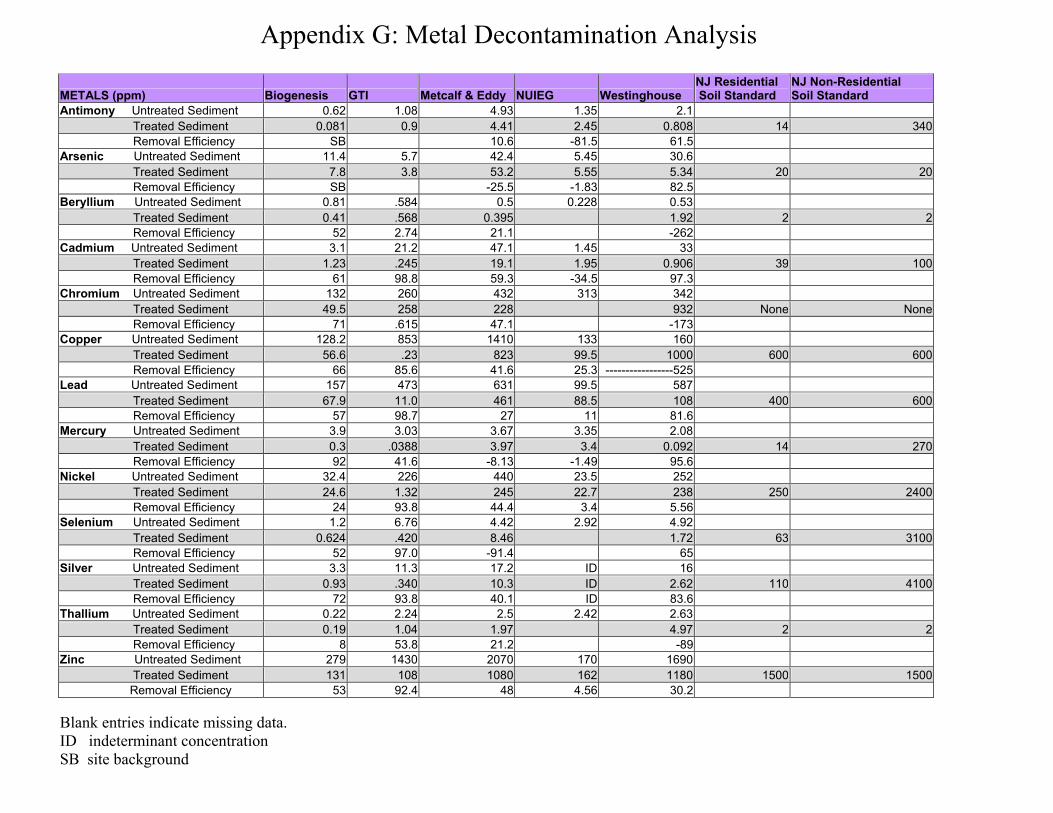
Appendix G: Metal Decontamination Analysis
METALS (ppm) Biogenesis GTI Metcalf & Eddy NUIEG Westinghouse NJ Residential Soil Standard
NJ Non-Residential Soil Standard
Antimony Untreated Sediment 0.62 1.08 4.93 1.35 2.1 Treated Sediment 0.081 0.9 4.41 2.45 0.808 14 340 Removal Efficiency SB 10.6 -81.5 61.5 Arsenic Untreated Sediment 11.4 5.7 42.4 5.45 30.6 Treated Sediment 7.8 3.8 53.2 5.55 5.34 20 20 Removal Efficiency SB -25.5 -1.83 82.5 Beryllium Untreated Sediment 0.81 .584 0.5 0.228 0.53 Treated Sediment 0.41 .568 0.395 1.92 2 2 Removal Efficiency 52 2.74 21.1 -262 Cadmium Untreated Sediment 3.1 21.2 47.1 1.45 33 Treated Sediment 1.23 .245 19.1 1.95 0.906 39 100 Removal Efficiency 61 98.8 59.3 -34.5 97.3 Chromium Untreated Sediment 132 260 432 313 342 Treated Sediment 49.5 258 228 932 None None Removal Efficiency 71 .615 47.1 -173 Copper Untreated Sediment 128.2 853 1410 133 160 Treated Sediment 56.6 .23 823 99.5 1000 600 600 Removal Efficiency 66 85.6 41.6 25.3 -----------------525 Lead Untreated Sediment 157 473 631 99.5 587 Treated Sediment 67.9 11.0 461 88.5 108 400 600 Removal Efficiency 57 98.7 27 11 81.6 Mercury Untreated Sediment 3.9 3.03 3.67 3.35 2.08 Treated Sediment 0.3 .0388 3.97 3.4 0.092 14 270 Removal Efficiency 92 41.6 -8.13 -1.49 95.6 Nickel Untreated Sediment 32.4 226 440 23.5 252 Treated Sediment 24.6 1.32 245 22.7 238 250 2400 Removal Efficiency 24 93.8 44.4 3.4 5.56 Selenium Untreated Sediment 1.2 6.76 4.42 2.92 4.92 Treated Sediment 0.624 .420 8.46 1.72 63 3100 Removal Efficiency 52 97.0 -91.4 65 Silver Untreated Sediment 3.3 11.3 17.2 ID 16 Treated Sediment 0.93 .340 10.3 ID 2.62 110 4100 Removal Efficiency 72 93.8 40.1 ID 83.6 Thallium Untreated Sediment 0.22 2.24 2.5 2.42 2.63 Treated Sediment 0.19 1.04 1.97 4.97 2 2 Removal Efficiency 8 53.8 21.2 -89 Zinc Untreated Sediment 279 1430 2070 170 1690 Treated Sediment 131 108 1080 162 1180 1500 1500 Removal Efficiency 53 92.4 48 4.56 30.2
Blank entries indicate missing data. ID rminant concentration SB
indetesite background
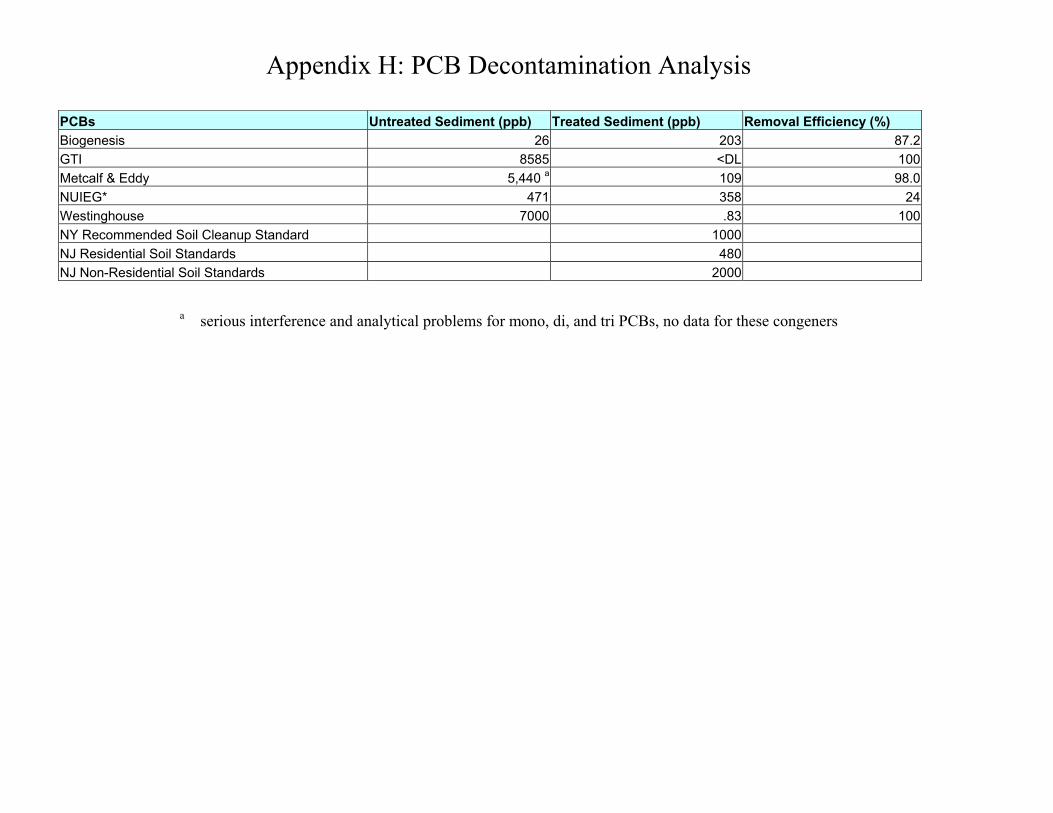
Appendix H: PCB Decontamination Analysis
PCBs Untreated Sediment (ppb) Treated Sediment (ppb) Removal Efficiency (%) Biogenesis 26 203 87.2 GTI 8585 <DL 100 Metcalf & Eddy 5,440 a 109 98.0 NUIEG* 471 358 24 Westinghouse 7000 .83 100 NY Recommended Soil Cleanup Standard 1000 NJ Residential Soil Standards 480 NJ Non-Residential Soil Standards 2000
a serious interference and analytical problems for mono, di, and tri PCBs, no data for these congeners
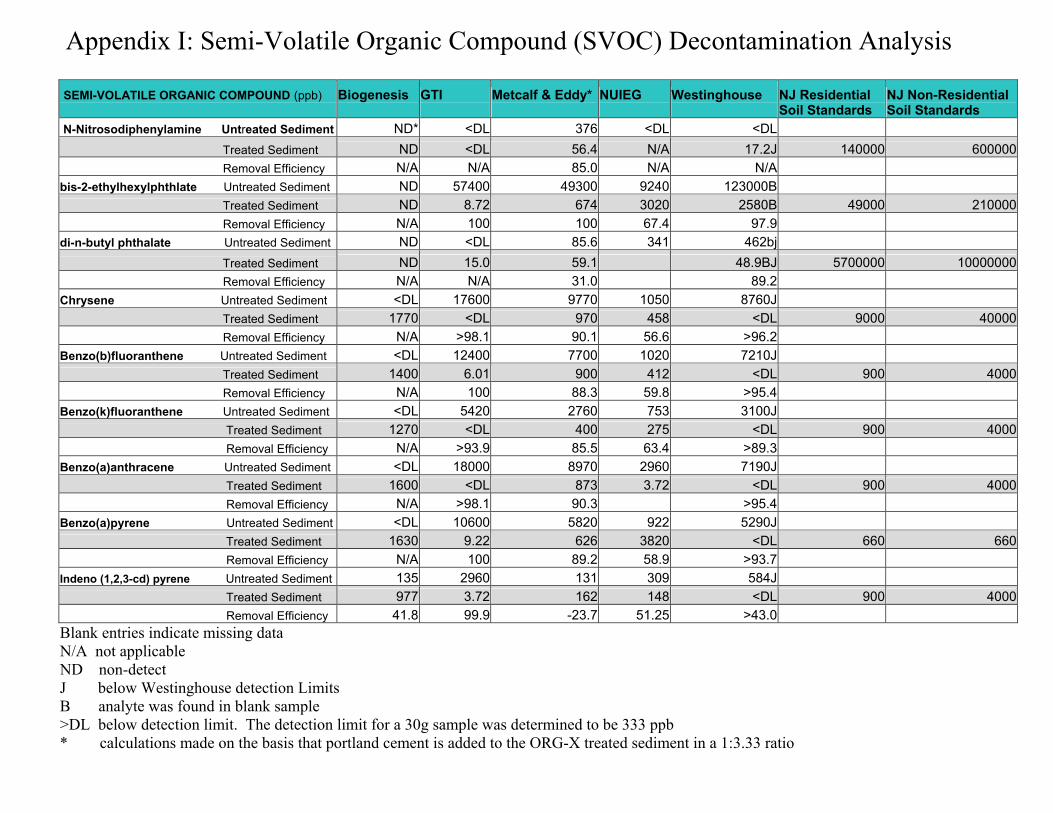
Appendix I: Semi-Volatile Organic Compound (SVOC) Decontamination Analysis
SEMI-VOLATILE ORGANIC COMPOUND (ppb) Biogenesis GTI Metcalf & Eddy* NUIEG Westinghouse NJ Residential Soil Standards
NJ Non-Residential Soil Standards
N-Nitrosodiphenylamine Untreated Sediment ND* <DL 376 <DL <DL Treated Sediment ND <DL 56.4 N/A 17.2J 140000 600000 Removal Efficiency N/A N/A 85.0 N/A N/A
bis-2-ethylhexylphthlate Untreated Sediment ND 57400 49300 9240 123000B Treated Sediment ND 8.72 674 3020 2580B 49000 210000 Removal Efficiency N/A 100 100 67.4 97.9
di-n-butyl phthalate Untreated Sediment ND <DL 85.6 341 462bj Treated Sediment ND 15.0 59.1 48.9BJ 5700000 10000000 Removal Efficiency N/A N/A 31.0 89.2
Chrysene Untreated Sediment <DL 17600 9770 1050 8760J Treated Sediment 1770 <DL 970 458 <DL 9000 40000 Removal Efficiency N/A >98.1 90.1 56.6 >96.2
Benzo(b)fluoranthene Untreated Sediment <DL 12400 7700 1020 7210J Treated Sediment 1400 6.01 900 412 <DL 900 4000 Removal Efficiency N/A 100 88.3 59.8 >95.4
Benzo(k)fluoranthene Untreated Sediment <DL 5420 2760 753 3100J Treated Sediment 1270 <DL 400 275 <DL 900 4000 Removal Efficiency N/A >93.9 85.5 63.4 >89.3
Benzo(a)anthracene Untreated Sediment <DL 18000 8970 2960 7190J Treated Sediment 1600 <DL 873 3.72 <DL 900 4000 Removal Efficiency N/A >98.1 90.3 >95.4
Benzo(a)pyrene Untreated Sediment <DL 10600 5820 922 5290J Treated Sediment 1630 9.22 626 3820 <DL 660 660 Removal Efficiency N/A 100 89.2 58.9 >93.7
Indeno (1,2,3-cd) pyrene Untreated Sediment 135 2960 131 309 584J Treated Sediment 977 3.72 162 148 <DL 900 4000 Removal Efficiency 41.8 99.9 -23.7 51.25 >43.0
Blank entries indicate missing data N/A not applicable ND non-detect J below Westinghouse detection Limits B analyte was found in blank sample >DL below detection limit. The detection limit for a 30g sample was determined to be 333 ppb * calculations made on the basis that portland cement is added to the ORG-X treated sediment in a 1:3.33 ratio
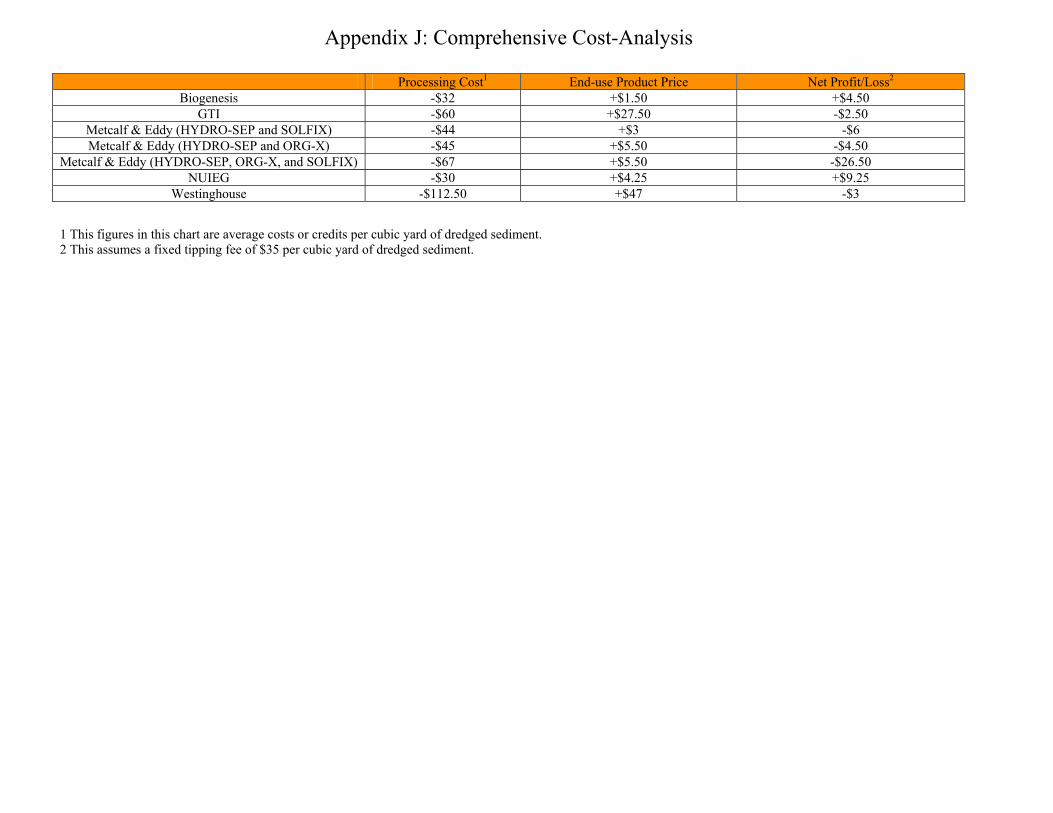
Appendix J: Comprehensive Cost-Analysis
Processing Cost1 End-use Product Price Net Profit/Loss2
Biogenesis -$32 +$1.50 +$4.50 GTI -$60 +$27.50 -$2.50
Metcalf & Eddy (HYDRO-SEP and SOLFIX) -$44 +$3 -$6 Metcalf & Eddy (HYDRO-SEP and ORG-X) -$45 +$5.50 -$4.50
Metcalf & Eddy (HYDRO-SEP, ORG-X, and SOLFIX) -$67 +$5.50 -$26.50 NUIEG -$30 +$4.25 +$9.25
Westinghouse -$112.50 +$47 -$3
1 This figures in this chart are average costs or credits per cubic yard of dredged sediment. 2 This assumes a fixed tipping fee of $35 per cubic yard of dredged sediment.