Embed Size (px)
Citation preview
New York City Transit Authority Consolidated Financial Statements as of and for the Years Ended December 31, 2014 and 2013, Required Supplementary Information, and Independent Auditors’ Report
NEW YORK CITY TRANSIT AUTHORITY
TABLE OF CONTENTS
Page
INDEPENDENT AUDITORS’ REPORT 1–2
MANAGEMENT’S DISCUSSION AND ANALYSIS (UNAUDITED) 3–14
CONSOLIDATED FINANCIAL STATEMENTS AS OF AND FOR THE YEARS ENDED DECEMBER 31, 2014 AND 2013: Statements of Net Position 15–16 Statements of Revenues, Expenses, and Change in Net Position 17–18 Statements of Cash Flows 19–20 Notes to Consolidated Financial Statements 21–59
REQUIRED SUPPLEMENTARY INFORMATION (UNAUDITED): 60 Schedule of Funding Progress for the MaBSTOA Pension Plan 61
Schedule of Funding Progress for the New York City Transit Postemployment Benefit Plan 62
INDEPENDENT AUDITORS’ REPORT
To the Members of the Board of Metropolitan Transportation Authority Report on the Consolidated Financial Statements We have audited the accompanying consolidated statements of net position of the New York City Transit Authority (the “Authority”), a public benefit corporation which is part of the related financial reporting group of the Metropolitan Transportation Authority (“MTA”), as of December 31, 2014 and 2013, and the related consolidated statements of revenues, expenses, and changes in net position and consolidated cash flows for the years then ended, and the related notes to the consolidated financial statements, which collectively comprise the Authority’s consolidated financial statements, as listed in the table of contents. Management’s Responsibility for the Consolidated Financial Statements Management is responsible for the preparation and fair presentation of these consolidated financial statements in accordance with accounting principles generally accepted in the United States of America; this includes the design, implementation, and maintenance of internal control relevant to the preparation and fair presentation of the consolidated financial statements that are free from material misstatement, whether due to fraud or error. Auditors’ Responsibility Our responsibility is to express an opinion on these consolidated financial statements based on our audits. We conducted our audits in accordance with auditing standards generally accepted in the United States of America. Those standards require that we plan and perform the audits to obtain reasonable assurance about whether the consolidated financial statements are free from material misstatement. An audit involves performing procedures to obtain audit evidence about the amounts and disclosures in the consolidated financial statements. The procedures selected depend on the auditors’ judgment, including the assessment of the risks of material misstatement of the consolidated financial statements, whether due to fraud or error. In making those risk assessments, the auditor considers internal control relevant to the Authority’s preparation and fair presentation of the consolidated financial statements in order to design audit procedures that are appropriate in the circumstances, but not for the purposes of expressing an opinion on the effectiveness of the Authority’s internal control. Accordingly, we express no such opinion. An audit also includes evaluating the appropriateness of accounting policies used and the reasonableness of significant accounting estimates made by management, as well as evaluating the overall presentation of the consolidated financial statements. We believe that the audit evidence we have obtained is sufficient and appropriate to provide a basis for our audit opinion.
Deloitte & Touche LLP 30 Rockefeller Plaza New York, NY 10112-0015 USA
Tel: +1 212 492 4000 Fax: +1 212 492 5000 www.deloitte.com
Member of Deloitte Touche Tohmatsu
- 2 -
Opinion In our opinion, the consolidated financial statements referred to above present fairly, in all material respects, the consolidated net position of the Authority as of December 31, 2014 and 2013, and the respective changes in the consolidated net position and consolidated cash flows thereof for the years then ended in accordance with accounting principles generally accepted in the United States of America. Emphasis of a Matter As discussed in the notes to the consolidated financial statements, the Authority is a public benefit corporation that requires significant subsidies from and has material transactions with the MTA, The City of New York and the State of New York. Our opinion is not modified with respect to this matter. Other Matters Accounting principles generally accepted in the United States of America require that the Management’s Discussion and Analysis on pages 3 through 14, the Schedule of Funding Progress for the MaBSTOA Pension Plan on page 61 and the Schedule of Funding Progress for the New York City Transit Postemployment Benefit Plan on page 62 be presented to supplement the consolidated financial statements. Such information, although not a part of the consolidated financial statements, is required by the Governmental Accounting Standards Board who considers it to be an essential part of financial reporting for placing the consolidated financial statements in an appropriate operational, economic, or historical context. We have applied certain limited procedures to the required supplementary information in accordance with auditing standards generally accepted in the United States of America, which consisted of inquiries of management about the methods of preparing the information and comparing the information for consistency with management’s responses to our inquiries, the consolidated financial statements, and other knowledge we obtained during our audits of the consolidated financial statements. We do not express an opinion or provide any assurance on the information because the limited procedures do not provide us with sufficient evidence to express an opinion or provide any assurance.
April 29, 2015
- 3 -
NEW YORK CITY TRANSIT AUTHORITY MANAGEMENT’S DISCUSSION AND ANALYSIS (UNAUDITED) FOR THE YEARS ENDED DECEMBER 31, 2014 AND 2013
1. OVERVIEW OF THE CONSOLIDATED FINANCIAL STATEMENTS
Introduction to the Annual Report:
This annual report consists of three parts: Management’s Discussion and Analysis, Consolidated Financial Statements and Notes to the Consolidated Financial Statements and Required Supplementary Information.
Management’s Discussion and Analysis:
The following is a narrative overview and analysis of the financial activities of the Authority for the years ended December 31, 2014 and 2013. This management discussion and analysis (MD&A) is intended to serve as an introduction to the Authority’s basic consolidated financial statements. It provides an assessment of how the Authority’s position has improved or deteriorated and identifies the factors that, in management’s view, significantly affected the Authority’s overall financial position. It may contain opinions, assumptions or conclusions by the Authority’s management that should not be considered a replacement for, and must be read in conjunction with, the consolidated financial statements described below.
The Consolidated Financial Statements Include:
The Consolidated Statements of Net Position provide information about the nature and amounts of resources with present service capacity that New York City Transit Authority (the Authority) presently controls (assets), consumption of net assets by the Authority that is applicable to a future reporting period (deferred outflow of resources), present obligations to sacrifice resources that the Authority has little or no discretion to avoid (liabilities), and acquisition of net assets by the Authority that is applicable to a future reporting period (deferred inflow of resources) with the difference between assets/deferred outflows of resources and liabilities/deferred inflows of resources being reported as net position.
The Consolidated Statements of Revenues, Expenses and Changes in Net Position show how the Authority’s net position changed during each year. They account for all of the current year’s revenues and expenses, measures the financial results of the Authority’s operations over the past year and can be used to determine how the Authority has funded its costs.
The Consolidated Statements of Cash Flows provide information about the Authority’s cash receipts, cash payments and net changes in cash resulting from operations, non-capital financing, capital and related financing and investing activities.
The Notes to the Consolidated Financial Statements:
The notes provide information that is essential to understanding the basic consolidated financial statements, such as the Authority’s accounting methods and policies, details of cash and investments, capital assets, employee benefits, lease transactions, and future commitments and contingencies of the Authority, and information about other events or developing situations that could materially affect the Authority’s financial position.
- 4 -
Required Supplementation Information:
The Required Supplementary Information provides information concerning the Authority’s progress in funding its obligation to provide pension benefits and other postemployment benefits to its employees.
2. FINANCIAL REPORTING ENTITY
The New York City Transit Authority and its subsidiary, Manhattan and Bronx Surface Transit Operating Authority (MaBSTOA) (collectively, the Authority) are public benefit corporations established pursuant to the New York State (the State) Public Authorities Law, to operate public subway, bus and paratransit services within The City of New York (The City). The Authority is a part of the financial reporting group of the Metropolitan Transportation Authority (MTA), which is a component unit of the State, and whose mission is to continue, develop and improve public transportation and to develop and implement a unified public transportation policy in the New York Metropolitan area.
3. CONDENSED FINANCIAL INFORMATION
All amounts are in millions, except as noted.
The following sections will discuss the significant changes in the Authority’s financial position for the years ended December 31, 2014 and 2013. Additionally, an examination of major economic factors and industry trends that have contributed to these changes is provided. It should be noted that for purposes of the MD&A, summaries of the consolidated financial statements and the various exhibits presented conform to the Authority’s consolidated financial statements, which are presented in accordance with accounting principles generally accepted in the United States of America.
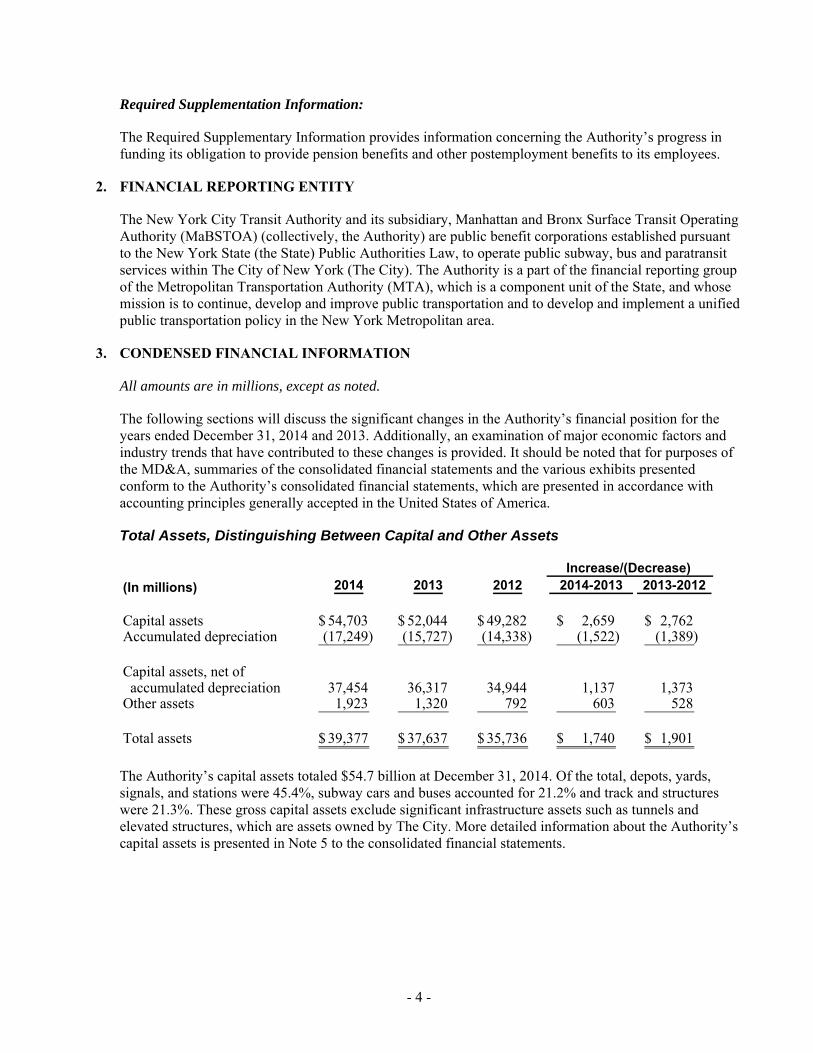
Total Assets, Distinguishing Between Capital and Other Assets
(In millions) 2014 2013 2012 2014-2013 2013-2012
Capital assets 54,703$ 52,044$ 49,282$ 2,659$ 2,762$ Accumulated depreciation (17,249) (15,727) (14,338) (1,522) (1,389)
Capital assets, net of accumulated depreciation 37,454 36,317 34,944 1,137 1,373 Other assets 1,923 1,320 792 603 528
Total assets 39,377$ 37,637$ 35,736$ 1,740$ 1,901$
Increase/(Decrease)
The Authority’s capital assets totaled $54.7 billion at December 31, 2014. Of the total, depots, yards, signals, and stations were 45.4%, subway cars and buses accounted for 21.2% and track and structures were 21.3%. These gross capital assets exclude significant infrastructure assets such as tunnels and elevated structures, which are assets owned by The City. More detailed information about the Authority’s capital assets is presented in Note 5 to the consolidated financial statements.
- 5 -
Significant changes in assets include:
December 31, 2014 versus 2013
Capital assets increased from December 31, 2013 to December 31, 2014 by $2,662, or 5.2%. This increase was primarily due to station rehabilitation work of $1,777, track and structures of $586, new subway cars of $430 and signals enhancements of $297. Accumulated depreciation has increased by $1,518, or 9.8%, due to annual depreciation expense of $1,520, partly offset by normal retirements of $2.
Other assets increased by $603, or 45.7%, compared with the prior year. This increase was mostly due to higher current receivables from MTA and constituent authorities of $256 and increased MTA investment pool assets of $195.
December 31, 2013 versus 2012
Gross capital assets increased from December 31, 2012 to December 31, 2013 by $2,762, or 5.6%. This increase was primarily due to additions of $2,835, including mostly station rehabilitation work of $1,270, track and structures of $423, depots and yards of $291 and new buses of $104. Accumulated depreciation has increased by $1,389, or 9.7%, due to annual depreciation expense of $1,421, offset by normal retirements of $14 and asset impairment losses attributable to Tropical Storm Sandy of $18 (see Note 6 to the consolidated financial statements).
Other assets increased by $528, or 66.7%, compared with the prior year. This increase was mostly due to higher current receivables from MTA and constituent authorities of $273, increased MTA investment pool assets of $92, and an increase in long-term MTA receivables for the purchase of capital assets of $105.
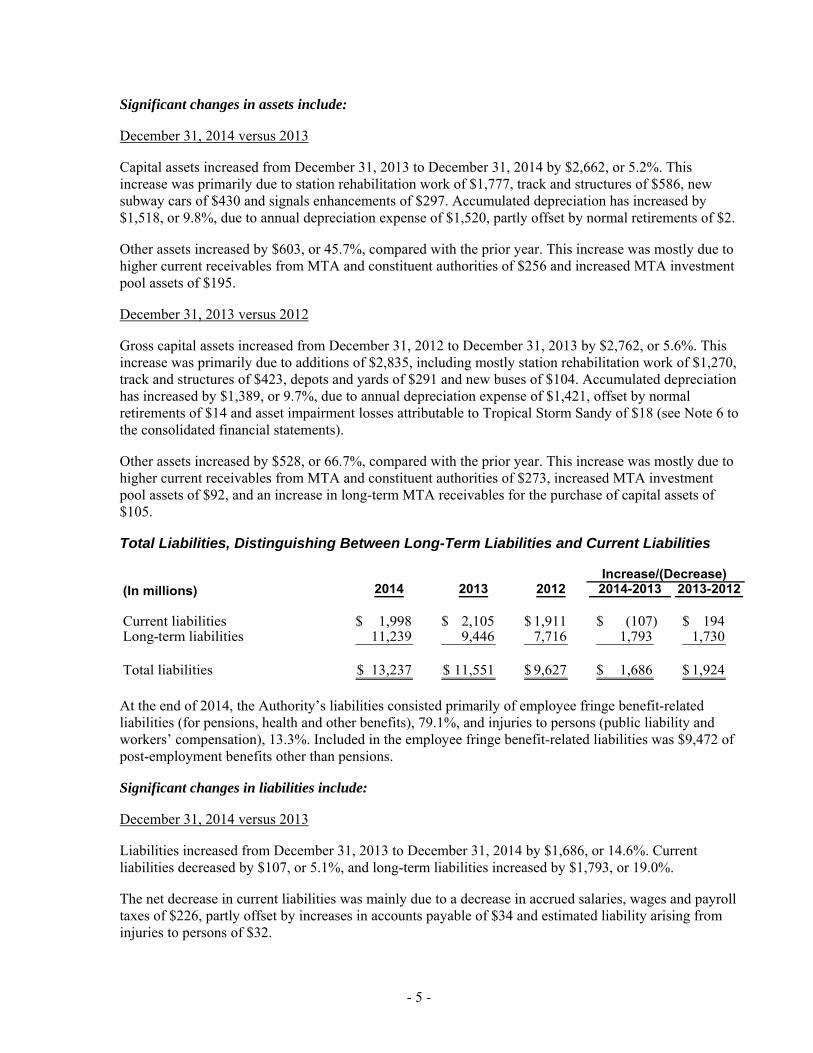
Total Liabilities, Distinguishing Between Long-Term Liabilities and Current Liabilities
(In millions) 2014 2013 2012 2014-2013 2013-2012
Current liabilities 1,998$ 2,105$ 1,911$ (107)$ 194$ Long-term liabilities 11,239 9,446 7,716 1,793 1,730
Total liabilities 13,237$ 11,551$ 9,627$ 1,686$ 1,924$
Increase/(Decrease)
At the end of 2014, the Authority’s liabilities consisted primarily of employee fringe benefit-related liabilities (for pensions, health and other benefits), 79.1%, and injuries to persons (public liability and workers’ compensation), 13.3%. Included in the employee fringe benefit-related liabilities was $9,472 of post-employment benefits other than pensions.
Significant changes in liabilities include:
December 31, 2014 versus 2013
Liabilities increased from December 31, 2013 to December 31, 2014 by $1,686, or 14.6%. Current liabilities decreased by $107, or 5.1%, and long-term liabilities increased by $1,793, or 19.0%.
The net decrease in current liabilities was mainly due to a decrease in accrued salaries, wages and payroll taxes of $226, partly offset by increases in accounts payable of $34 and estimated liability arising from injuries to persons of $32.
- 6 -
The increase in long-term liabilities was primarily the result of the addition of $1,638 of post-employment benefits other than pensions based upon an updated OPEB actuarial valuation.
December 31, 2013 versus 2012
Liabilities increased from December 31, 2012 to December 31, 2013 by $1,924, or 20.0%. Current liabilities increased by $194, or 10.2%, and long-term liabilities increased by $1,730, or 22.4%.
The increase in current liabilities was mainly due to increases in accrued retirement and death benefits of $157 and accrued salaries, wages and payroll taxes of $183, partly offset by a reduction in payables to MTA and constituent authorities of $139.
The increase in long-term liabilities was primarily the result of the addition of $1,554 of post-employment benefits other than pensions based upon an updated OPEB actuarial valuation and $177 of increased liabilities arising from injuries to persons, also based on the most recent actuarial valuation.
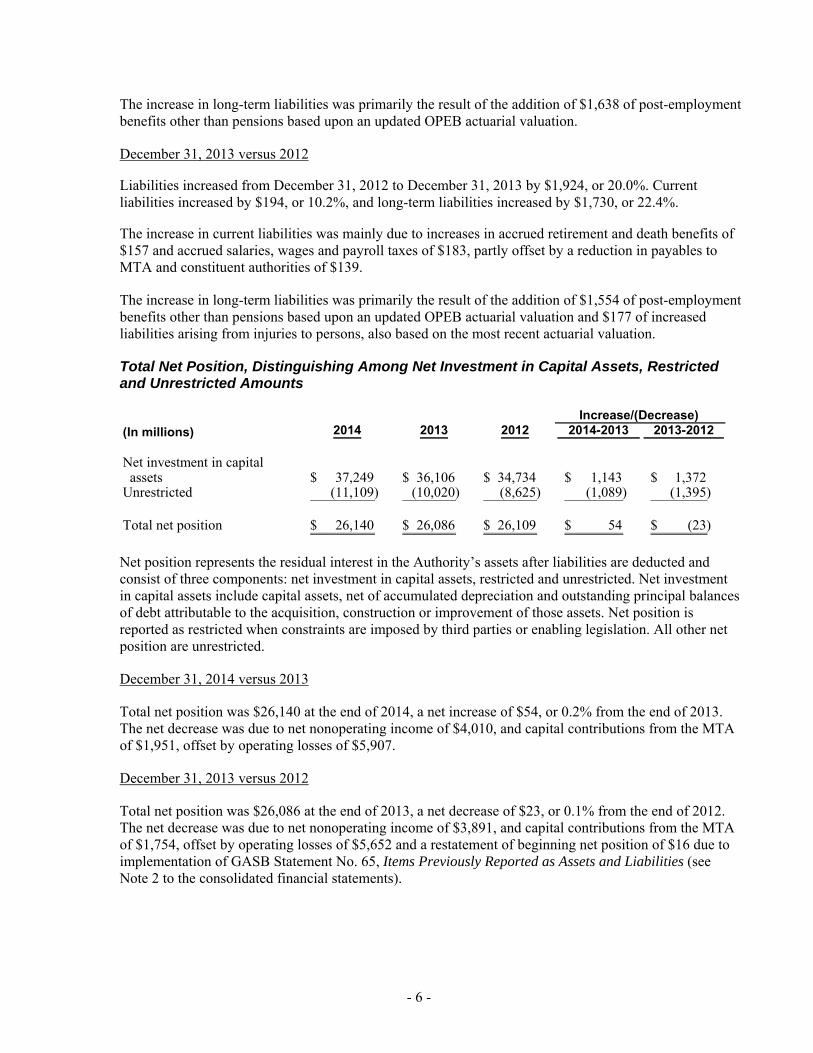
Total Net Position, Distinguishing Among Net Investment in Capital Assets, Restricted and Unrestricted Amounts
(In millions) 2014 2013 2012 2014-2013 2013-2012
Net investment in capital assets 37,249$ 36,106$ 34,734$ 1,143$ 1,372$ Unrestricted (11,109) (10,020) (8,625) (1,089) (1,395)
Total net position 26,140$ 26,086$ 26,109$ 54$ (23)$
Increase/(Decrease)
Net position represents the residual interest in the Authority’s assets after liabilities are deducted and consist of three components: net investment in capital assets, restricted and unrestricted. Net investment in capital assets include capital assets, net of accumulated depreciation and outstanding principal balances of debt attributable to the acquisition, construction or improvement of those assets. Net position is reported as restricted when constraints are imposed by third parties or enabling legislation. All other net position are unrestricted.
December 31, 2014 versus 2013
Total net position was $26,140 at the end of 2014, a net increase of $54, or 0.2% from the end of 2013. The net decrease was due to net nonoperating income of $4,010, and capital contributions from the MTA of $1,951, offset by operating losses of $5,907.
December 31, 2013 versus 2012
Total net position was $26,086 at the end of 2013, a net decrease of $23, or 0.1% from the end of 2012. The net decrease was due to net nonoperating income of $3,891, and capital contributions from the MTA of $1,754, offset by operating losses of $5,652 and a restatement of beginning net position of $16 due to implementation of GASB Statement No. 65, Items Previously Reported as Assets and Liabilities (see Note 2 to the consolidated financial statements).
- 7 -
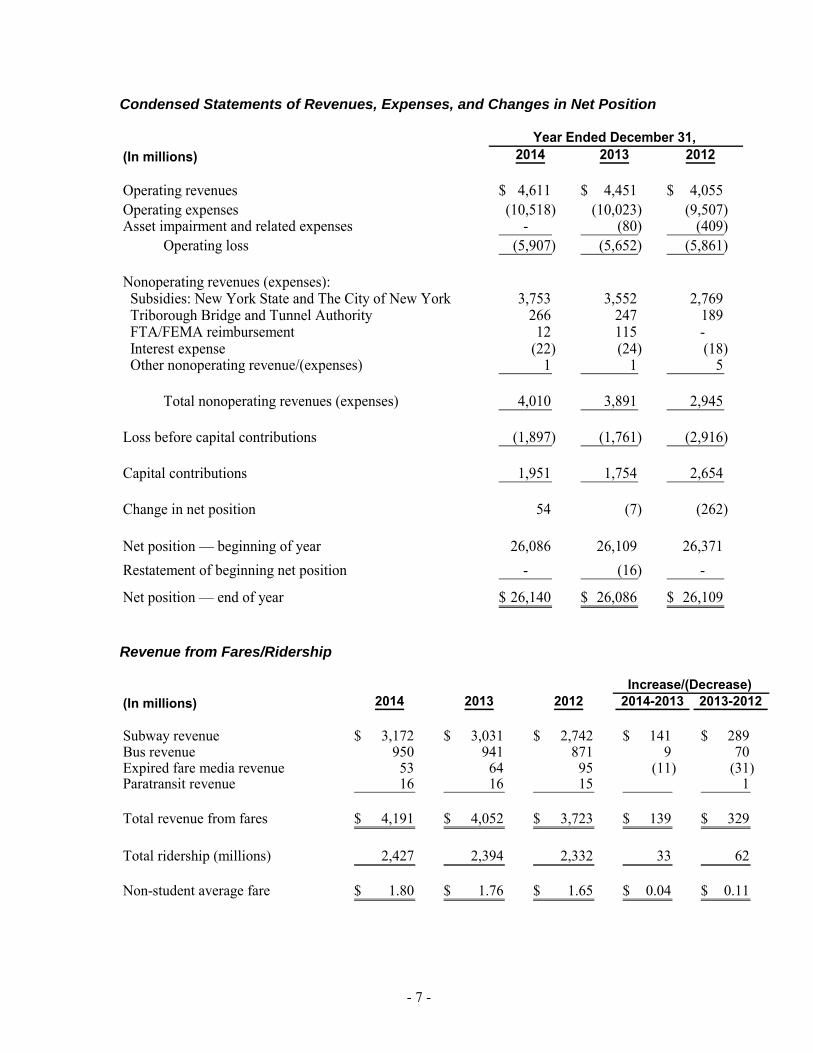
Condensed Statements of Revenues, Expenses, and Changes in Net Position
(In millions) 2014 2013 2012
Operating revenues 4,611$ 4,451$ 4,055$ Operating expenses (10,518) (10,023) (9,507) Asset impairment and related expenses - (80) (409) Operating loss (5,907) (5,652) (5,861)
Nonoperating revenues (expenses): Subsidies: New York State and The City of New York 3,753 3,552 2,769 Triborough Bridge and Tunnel Authority 266 247 189 FTA/FEMA reimbursement 12 115 - Interest expense (22) (24) (18) Other nonoperating revenue/(expenses) 1 1 5
Total nonoperating revenues (expenses) 4,010 3,891 2,945
Loss before capital contributions (1,897) (1,761) (2,916)
Capital contributions 1,951 1,754 2,654
Change in net position 54 (7) (262)
Net position — beginning of year 26,086 26,109 26,371 Restatement of beginning net position - (16) -
Net position — end of year 26,140$ 26,086$ 26,109$
Year Ended December 31,
Revenue from Fares/Ridership
(In millions) 2014 2013 2012 2014-2013 2013-2012
Subway revenue 3,172$ 3,031$ 2,742$ 141$ 289$ Bus revenue 950 941 871 9 70 Expired fare media revenue 53 64 95 (11) (31) Paratransit revenue 16 16 15 1
Total revenue from fares 4,191$ 4,052$ 3,723$ 139$ 329$
Total ridership (millions) 2,427 2,394 2,332 33 62
Non-student average fare 1.80$ 1.76$ 1.65$ 0.04$ 0.11$
Increase/(Decrease)
- 8 -
2014 versus 2013
Total revenue from fares was $4,191 in 2014, an increase of $139 or 3.4%. This increase was due mostly to higher subway ridership and the annualization of the March 2013 fare increase. Total ridership was 2,427, an increase of 33, or 1.4% from 2013.
2013 versus 2012
Total revenue from fares was $4,052 in 2013, an increase of $329 or 8.8%. After including $51 of lost revenue from Sandy in 2012, 2013 revenue from fares increased by $278 or 7.4%. This adjusted increase was due mostly to the March 2013 fare increase. Total ridership was 2,394, an increase of 62, or 2.7% from 2012. After including 44 of lost ridership from Sandy in 2012, 2013 ridership increased by an adjusted 0.8%, with a subway ridership increase of 19, or 1.1% and virtually no change in bus ridership.
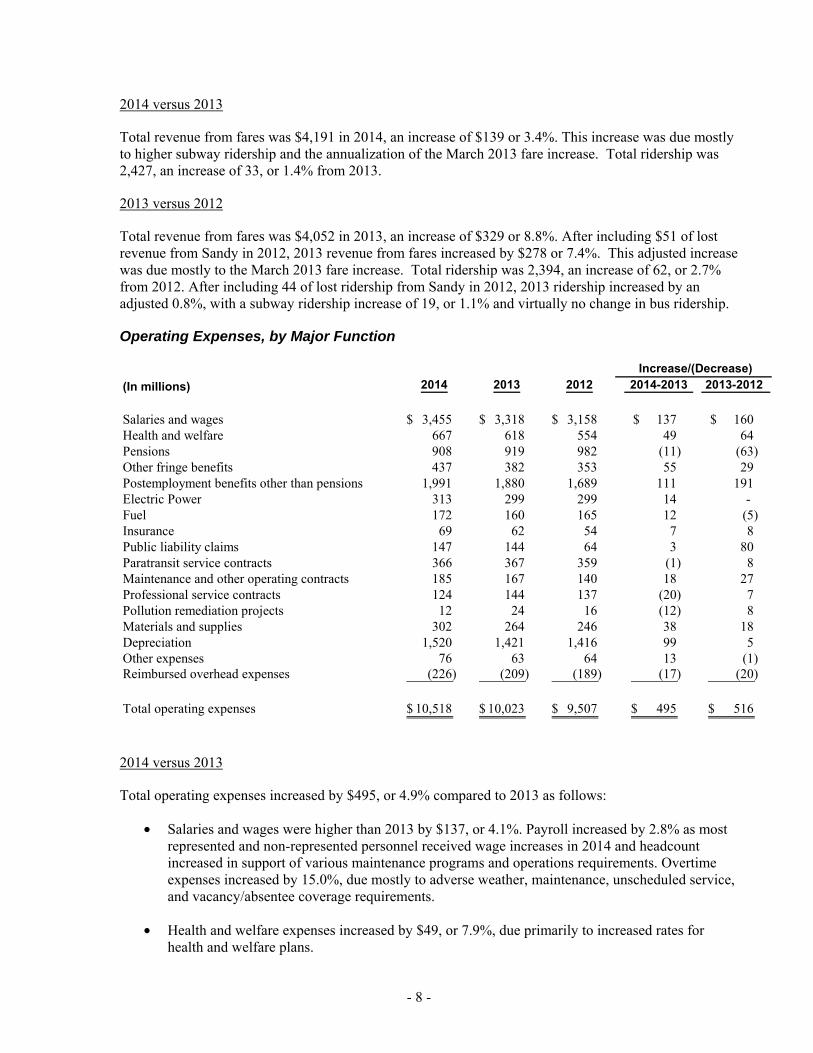
Operating Expenses, by Major Function
(In millions) 2014 2013 2012 2014-2013 2013-2012
Salaries and wages 3,455$ 3,318$ 3,158$ 137$ 160$ Health and welfare 667 618 554 49 64 Pensions 908 919 982 (11) (63) Other fringe benefits 437 382 353 55 29 Postemployment benefits other than pensions 1,991 1,880 1,689 111 191 Electric Power 313 299 299 14 - Fuel 172 160 165 12 (5) Insurance 69 62 54 7 8 Public liability claims 147 144 64 3 80 Paratransit service contracts 366 367 359 (1) 8 Maintenance and other operating contracts 185 167 140 18 27 Professional service contracts 124 144 137 (20) 7 Pollution remediation projects 12 24 16 (12) 8 Materials and supplies 302 264 246 38 18 Depreciation 1,520 1,421 1,416 99 5 Other expenses 76 63 64 13 (1) Reimbursed overhead expenses (226) (209) (189) (17) (20)
Total operating expenses 10,518$ 10,023$ 9,507$ 495$ 516$
Increase/(Decrease)
2014 versus 2013
Total operating expenses increased by $495, or 4.9% compared to 2013 as follows:
• Salaries and wages were higher than 2013 by $137, or 4.1%. Payroll increased by 2.8% as most represented and non-represented personnel received wage increases in 2014 and headcount increased in support of various maintenance programs and operations requirements. Overtime expenses increased by 15.0%, due mostly to adverse weather, maintenance, unscheduled service, and vacancy/absentee coverage requirements.
• Health and welfare expenses increased by $49, or 7.9%, due primarily to increased rates for health and welfare plans.
- 9 -
• Other fringe benefit expenses increased by $55, or 14.4%, due primarily to higher Workers’ Compensation reserve requirements based upon the current actuarial valuation.
• Post-employment benefits other than pensions increased by $111, or 5.9%, based on the most recent actuarial valuation.
• Maintenance and other operating contracts increased by $18, or 10.8%, due mostly to increases in vehicle purchases, safety equipment, security services, water and sewage, and rent.
• Professional service contract expenses decreased by $20, or 13.9%, due primarily to a reduction in Workers’ Compensation Board administrative expenses, based on new legislation.
• Pollution remediation project costs, which have decreased by $12 to $12 in 2014, are being expensed in accordance with the provisions of GASB Statement No. 49. Project encumbrances (expenses) for 2014 were lower than 2013 (see Note 16).
• Materials and supplies expenses increased by $38, or 14.4%, due largely to additional maintenance material requirements for both vehicles and facilities.
• Depreciation expenses increased by $99, or 7.0%, due to the capitalization of new station rehabilitations, trackwork, signal enhancements and new subway cars in 2014.
2013 versus 2012
Total operating expenses increased by $516, or 5.4% compared to 2012 as follows:
• Salaries and wages were higher than 2012 by $160, or 5.1%, due mostly to the retroactive wage accrual for the tentative TWU Local 100 settlement. In addition, headcount increased due to support of various maintenance programs and operations requirements and increased overtime expenses due mostly to maintenance, unscheduled service, and vacancy/absentee coverage requirements.
• Health and welfare expenses increased by $64, or 11.6%, due primarily to increased rates for health and welfare plans.
• Pension expenses decreased by $63, or 6.4%, due largely to actuarial assumptions changes made by NYCERS in 2012.
• Other fringe benefit expenses increased by $29, or 8.2%, due primarily to higher Workers’ Compensation reserve requirements based upon current actuarial determination.
• Post-employment benefits other than pensions increased by $191, or 11.3%, based on the most recent actuarial valuation.
• Public liability claims expenses increased by $80, or 125.0%, due to a significant increase in the 2013 annual actuarial valuation attributable to record claim payment levels and the rapid growth in large case reserves.
• Maintenance contract expenses increased by $27, or 19.3%, due largely to increased revenue vehicle maintenance and repairs, paratransit vehicle purchases, and operating contract and building-related requirements.
- 10 -
• Pollution remediation project costs, which have increased by $8 to $24 in 2013, are being expensed in accordance with the provisions of GASB Statement No. 49. Project encumbrances (expenses) for 2013 were greater compared to 2012 (see Note 16).
• Materials and supplies expenses increased by $18, or 7.3%, due largely to additional maintenance material requirements for both vehicles and facilities.
• Reimbursable overhead expense credits have increased by $20, or 10.6%, due largely to increased capital project labor requirements.
Nonoperating Revenues and Expenses
The Authority receives a variety of tax-supported subsidies from New York State and The City of New York. These subsidies represent a State Mobility Tax and corporate franchise, sales, energy, mortgage recording and real estate taxes and are impacted by the strength of the State and City economies and prevailing interest rates.
Operating assistance subsidies from New York State and The City have been maintained at the same level each year.
The Triborough Bridge & Tunnel Authority, another affiliate of the MTA, distributes to the Authority, each year, funds that vary based upon its operating surplus.
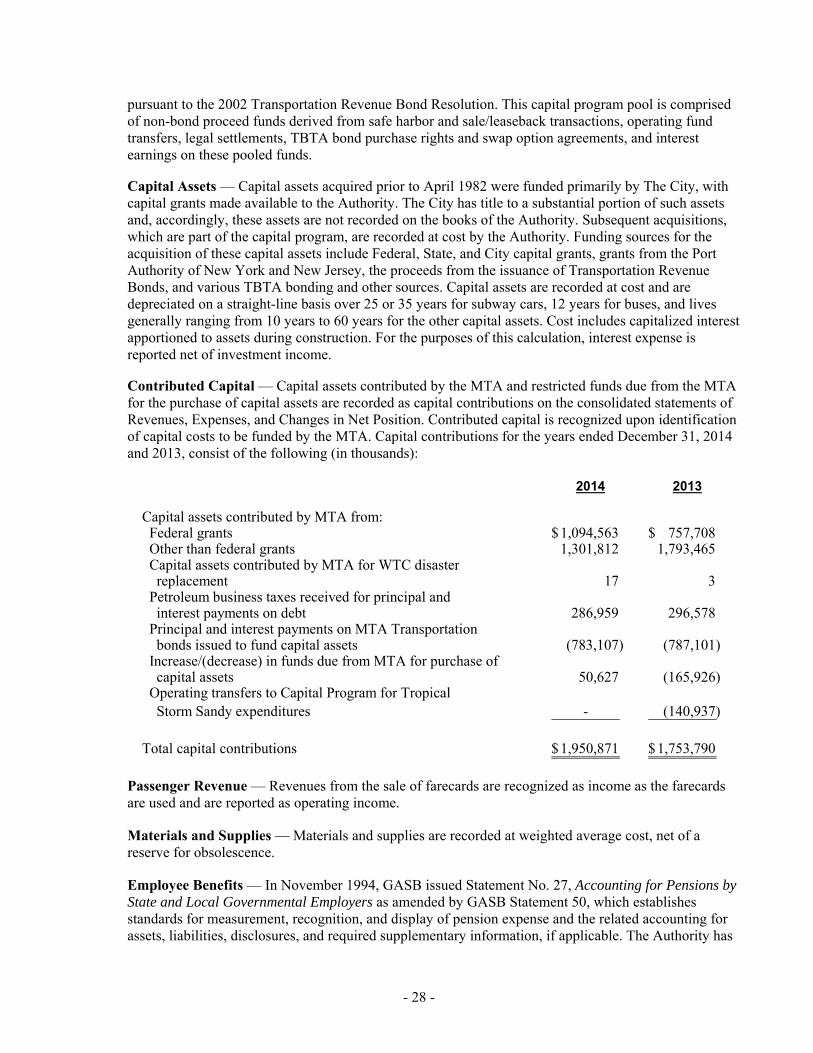
Capital contributions from the MTA of $1,951 in 2014 and $1,754 in 2013, represent capital program funding from several sources including bonds, Federal, State and City funding.
Changes in Net Position
The change in net position represents the net total of capital contributions, operating losses and nonoperating income. Net position increased by $54 in 2014 and decreased by $23 in 2013. The change in net position for both years was due to capital contributions from the MTA and nonoperating income, less operating losses.
Budget Highlights
Total operating revenues in 2014 of $4,611 were higher than budget by $67, or 1.5%. Total revenue from fares exceeded budget by $56, or 1.4%, including higher subway and expired farecard revenue and lower bus and paratransit fare revenue. Other operating revenue exceeded budget by $11, or 2.7%, mainly due to higher advertising revenue.
Total operating expenses in 2014 of $10,518 were higher than budget by $352, or 3.5%. Labor-related expenses of $7,231 exceeded budget by $308, or 4.4%. This result was largely due to an increase in other fringe benefits of $149, or 51.7%, due mostly to additional Workers’ Compensation reserve requirements; an actuarial-based increase in postemployment benefits other than pensions of $90, or 4.7%; a payroll expense increase of $95, or 3.2%, mostly represented by pattern labor adjustments based on a TWU local 100 labor contract agreement reached in 2014; and an increase in overtime expenses of $87, or 26.5%, caused by adverse weather and maintenance and vacancy/absentee coverage requirements. Non-labor expenses of $3,287 were over budget by $44, or 1.4%, represented primarily by an increase of $55, or 59.8% based on public liability claims reserve requirements.
- 11 -
4. OVERALL FINANCIAL POSITION, RESULTS OF OPERATIONS AND IMPORTANT ECONOMIC CONDITIONS
Economic Conditions
Metropolitan New York is the most transit-intensive region in the United States. A financially sound and reliable transportation system is critical to the region’s economic well-being. The average level of seasonally adjusted non-agricultural employment in New York City for the fourth quarter was higher in 2014 than in 2013 by 87.3 thousand jobs (up 2.2%). On a quarter-to-quarter basis, New York City employment has increased in each of the last sixteen quarters – the last decline occurred in the third quarter of 2010 – and is higher than at any time since 1950, when nonagricultural employment levels for New York City were first recorded by the Bureau of Labor Statistics. The employment gain for New York City in the second quarter is consistent with an improving national economy. Fourth quarter Real Gross Domestic Product (RGDP) grew at an annualized rate of 2.6%, according to the most recent advance estimate released by the Bureau of Economic Analysis. The increase primarily reflected contributions from personal consumption expenditures, exports, state and local government spending, non-residential fixed investment, and private inventory investment, partially offset by a decline in federal government spending and an increase in imports. Fourth quarter RGDP growth slowed relative to third quarter growth as federal government spending, nonresidential fixed investment and exports fell, while imports rose. The national economy has now grown in twenty of the last twenty-two quarters. The New York City metropolitan area’s price inflation of 0.6% was lower than the national average of 1.0% in the fourth quarter of 2014. A 7.8% fall in the price of energy products dampened the overall rise in consumer prices: the Consumer Price Index (CPI) exclusive of energy products increased by 1.5% in the New York-New Jersey-Long Island area. Consistent with the fall in overall energy prices, spot prices for New York Harbor conventional gasoline fell by 22.8% from an average price of $2.698 to an average of $2.082 per gallon between the fourth quarters of 2013 and 2014. In June 2014, the Federal Reserve Bank announced that the Federal Open Market Committee (FOMC) would continue targeting the Federal Funds rate to the range of 0% to 0.25%, a range consistent with its statutory dual mandate to foster maximum employment within a context of price stability. The Federal Funds rate has remained in this range since late 2008, when then financial and housing market crises deepened. In fact, the Federal Reserve Bank began to pursue expansionary intervention more than a year earlier as a response to the impending economic downturn: since the third quarter of 2007, the Federal Reserve Bank has sought to mitigate the consequences of a recession by loosening the tight credit conditions that resulted from the national mortgage crisis. Confronting stubbornly high unemployment rates with no scope to reduce further the Federal Funds rate, in March 2009 the Federal Reserve Bank began a program of large scale purchases of government guaranteed assets. The objective of the program, which was expanded in November 2010, was to raise the price of long-term securities, thereby lowering interest rates in order to stimulate investment in the economy. In spite of the steady improvement in economic activity in the second, third and fourth quarters of 2014, the FOMC elected in December to maintain an accommodative stance by continuing to target a Federal Funds rate in the range of 0% to 0.25%, noting that, partly because of the decline in energy prices, inflation rates remained below the Committee’s long-run objective; while labor markets evinced signs of improvement, the FOMC observed that recovery in the housing sector remained slow. In addition to maintaining the Federal Funds rate, the FOMC announced additional measures to foster conditions amenable to financial markets, including the continuation of its policy of reinvesting principal payments
- 12 -
from its holdings of agency debt and mortgage-backed securities and of rolling over maturing Treasury securities at auction. The influence of Federal Reserve monetary policy on the mortgage market is a matter of interest to NYCT, since variability of mortgage rates can affect the number of real estate transactions and can thereby impact receipts from the Urban Tax, an important source of NYCT revenue. Results of Operations and Overall Financial Position
Total revenue from fares was $4,191 in 2014, an increase of $139 or 3.4% from 2013. Total ridership was 2,427 million, an increase of 33 or 1.4% from 2013. Total operating expenses, including depreciation, other post-employment benefits and environmental remediation expenses, were $10,518 in 2014, an increase of 4.9%.
Going forward, the stability of the Authority’s financial position is subject to certain risks, requiring the efficient management of costs, including the establishment of new cost reduction programs, in order to counteract any adverse impacts to revenue streams or cost increases.
5. SIGNIFICANT CAPITAL ASSET ACTIVITY
Capital Program
The MTA has ongoing programs on behalf of the Authority and other affiliated agencies, subject to approval by the New York State Metropolitan Transportation Authority Capital Program Review Board (the State Review Board), which are intended to improve public transportation in the New York Metropolitan area.
2000-2004 Capital Program — The 2000-2004 Capital Program, which was approved by the State Review Board in May 2000, provided for $17.1 billion in capital expenditures, of which the Authority’s portion was $10.3 billion. In May and December of 2002, the MTA Board approved amendments to the program reflecting changes to budgets, schedules, funding and added to the infrastructure and facilities security programs. In December 2003, the MTA Board approved a general update to the plan to incorporate changes and authorized its submission to the MTA Capital Program Review Board (CPRB). In January 2004, the MTA Board approved a further modification to that program to support the accelerated purchase of additional commuter railcars. In December 2004, the MTA Board approved an amendment that incorporated the creation of the MTA Bus Company, and included additional funding from The City for the #7 Extension design work, as well as additional security grant funding. In December 2005, the MTA Board approved an amendment that increased the overall capital program total to $19.9 billion, of which the Authority’s share was $10.2 billion. This amendment included additional federal funds for the Fulton Street Transit Center, South Ferry Station, a new Bus Depot on Staten Island and CCTV installation in NYCT stations. In December 2006, the MTA Board approved an amendment that increased the overall capital program total to $21.2 billion, of which the Authority’s share was increased to $10.3 billion. In 2009, the capital program received $0.2 billion in federal stimulus funding. Reallocation between programs resulted in an additional $0.4 billion to the 2000-2004 Capital Program, increasing the overall total plan to $21.7 billion, of which the Authority’s share is $10.4 billion. Among the projects included in the 2000-2004 Transit Capital Program and subsequent amendments are the following: rebuilding the 1/9 line track and structures destroyed by the September 11, 2001 attacks on the World Trade Center, design and initiation of construction of the full-length Second Avenue Subway, acquisition of 1,210 new subway cars, replacing 927 existing cars and expanding the fleet by 283 cars, acquisition of 985 new buses, including 135 CNG buses, rehabilitation of 70 stations, provision of full Americans with Disability Act (ADA) accessibility at 23 stations, replacement of 20 escalators at various
- 13 -
stations, replacement of approximately 42 miles of mainline track and 212 mainline switches, signal modernization, communications improvements, and improvements to shops, yards, and depots.
The combined funding sources for the 2000-2004 Capital Program are comprised of $7.4 billion in bonds, $7.4 billion in federal funds, $4.6 billion from debt restructuring, and $2.3 billion from other sources.
As part of the 2000-2004 Capital Program, the MTA, the TBTA and the Authority have refunded and defeased substantially all of their outstanding debt and consolidated most of their existing credits.
At December 31, 2014, $10.4 billion has been committed to Authority projects from the 2000-2004 approved plan, of which approximately $10.3 billion has been expended.
2005-2009 Capital Program — The MTA Capital Program for 2005-2009 was approved by the CPRB in July 2005 and amended in July 2006. The 2005-2009 Program, as approved, provided for $20.1 billion in capital expenditures, of which the Authority’s share was $11.2 billion. In February 2007, the MTA Board further amended the Program to add $1.2 billion of Federal East Side Access Full Funding Grant Agreement (FFGA) funds to the East Side Access project, which relates to the Capital Construction Company’s capital program. In July 2008, the MTA Board further amended the Program to add an additional $267 million of Federal East Side Access FFGA funds and $764 million in Federal Second Avenue Subway FFGA funds relating to the Capital Construction Company’s capital program. Also included in this amendment were the rollover of unused LaGuardia Airport Project funds from the 2000-2004 Capital Program and other miscellaneous funding adjustments. In 2009, the capital program received $0.7 billion in federal stimulus funding.
The 2005-2009 Capital Program is designed to continue a program of capital expenditures that would support on-going maintenance and provide needed improvements to enhance services to its customers. Reallocation between programs, subsequent to the amendments and federal stimulus funding noted above, resulted in the overall plan totaling $24.6 billion, of which the Authority’s share is $11.6 billion. The Authority’s portion of the capital program excludes $7.7 billion of approved capital projects managed by the MTA Capital Construction Company on behalf of the Transit Authority and the Long Island Rail Road. Among the projects in the 2005-2009 Transit Capital Program are the following: normal replacement of 1,002 B Division Cars, fleet growth of 23 A Division Cars, the purchase of 1,236 new buses including 1,043 standard, 90 articulated and 103 express buses, the purchase of 1,387 new paratransit vehicles, rehabilitation of 36 stations, replacement of 23 escalators, replacement of 52 miles of mainline track and 143 mainline switches, signal modernization, communications improvements, and improvements to shops, yards, and depots.
The combined funding sources for the 2005-2009 Capital Program are comprised of $9.1 billion in federal funds, $1.5 billion from the New York State voter approved State-Wide Transportation Bond Act, $9.9 billion in bonds, and $4.1 billion from other sources.
At December 31, 2014, $11.3 billion has been committed to Authority projects from the 2005-2009 approved plan, of which approximately $10.9 billion has been expended.
2010-2014 Capital Program — The 2010-2014 Capital Program was approved by the MTA Board in September 2009. The program totaling approximately $25.6 billion was subsequently submitted to the NYS Capital Program Review Board (CPRB) for their review and approval. The submitted Program was vetoed without prejudice by the Review Board in December 2009. Subsequently, the resubmitted 2010-2014 Program, totaling $26.3 billion was approved by the CPRB in June 2010, of which the Authority’s share is $12.8 billion. The approved CPRB program fully funded only the first two years of the plan, with a commitment to come back to CPRB with a funding proposal for the last three years. On December 21, 2011, the MTA Board approved an amendment to the 2010-2014 Program that funds the
- 14 -
last three years of the program through a combination of self-help (efficiency improvements and real estate initiatives), participation by our funding partners and innovative and pragmatic financing arrangements. The Authority’s share of the $24.3 billion revised program is $11.6 billion. On December 19, 2012, the MTA Board approved an amendment to the 2010-2014 Capital Programs to add projects for the repair and restoration of MTA agency assets damaged as a result of Tropical Storm Sandy, which struck the region on October 29, 2012. The revised programs provide for an additional $4.8 billion in Sandy recovery-related capital expenditures, of which the Authority’s share is $3.3 billion. On January 23, 2013, the amended program as submitted was deemed approved by the CPRB. On July 22, 2013, the MTA Board approved a further amendment to the 2010-2014 Capital Programs for the Transit, Commuter and Bridges and Tunnels systems to include specific revisions to planned projects and to include new resilience/mitigation initiatives, totaling $5.8 billion in response to Tropical Storm Sandy. The Authority’s share of the new initiative is $5.1 billion. On August 27, 2013, the CPRB deemed approved those amended 2010-2014 Capital Programs for the Transit and Commuter systems as submitted.
The combined funding sources for the 2010-2014 Capital Program are comprised of $12.7 billion in MTA bonds, $6.3 billion in federal funds, $2.1 billion in Bridges and Tunnels dedicated funds, $0.1 billion in MTA Bus Federal and City Match, $0.8 billion in State Assistance, $0.8 billion in City Capital Funds, and $1.5 billion from other sources. The funding strategy for Tropical Storm Sandy repair and restoration assumes the receipt of $9.4 billion in insurance and federal reimbursement proceeds (including interim borrowing by MTA to cover delays in the receipt of such proceeds), $0.2 billion in Pay-as-you-go capital, supplemented, to the extent necessary, by external borrowing of up to $0.9 billion in additional MTA and MTA Bridges and Tunnels bonds.
At December 31, 2014, $9.0 billion has been committed to Authority projects from the 2010-2014 approved plan, of which approximately $4.5 billion has been expended.
The federal government has a contingent equity interest in assets acquired by the MTA with federal funds and upon disposal of such assets, the federal government may have a right to its share of the proceeds from the sale. This provision has not been a substantial impediment to the MTA’s operation.
Among the projects in the 2010-2014 Transit Capital Program are significant customer enhancements in the areas of new fare payment technologies, subway customer information and station accessibility improvements. In addition, core infrastructure investments include: purchase of 403 subway cars to replace and expand the fleet; the purchase of 2,166 new buses, including 1,127 standard, 649 articulated and 390 express buses; the purchase of 192 new paratransit vehicles; elimination of station defects at 39 stations as well as campaign component improvements at 100+ additional locations; replacement of 21 elevators; replacement of approximately 56 miles of mainline track and 126 mainline switches; signal modernization; communications improvements and improvements to shops, yards, and depots.
6. CURRENTLY KNOWN FACTS, DECISIONS, OR CONDITIONS
The Authority’s February 2015 Financial Plan includes certain risks such as possible lower investment returns on pensions and chronic cost issues relating to Workers’ Compensation, public liability claims and overtime. These risks need to be addressed in order to be able to balance future year budgets. To assist in achieving this, the ongoing identification and implementation of sustainable new savings programs and gap closing actions will be required.
The full funding of the 2015-2019 Capital Program is necessary in order to meet all important requirements.
* * * * * *
- 15 -
NEW YORK CITY TRANSIT AUTHORITY
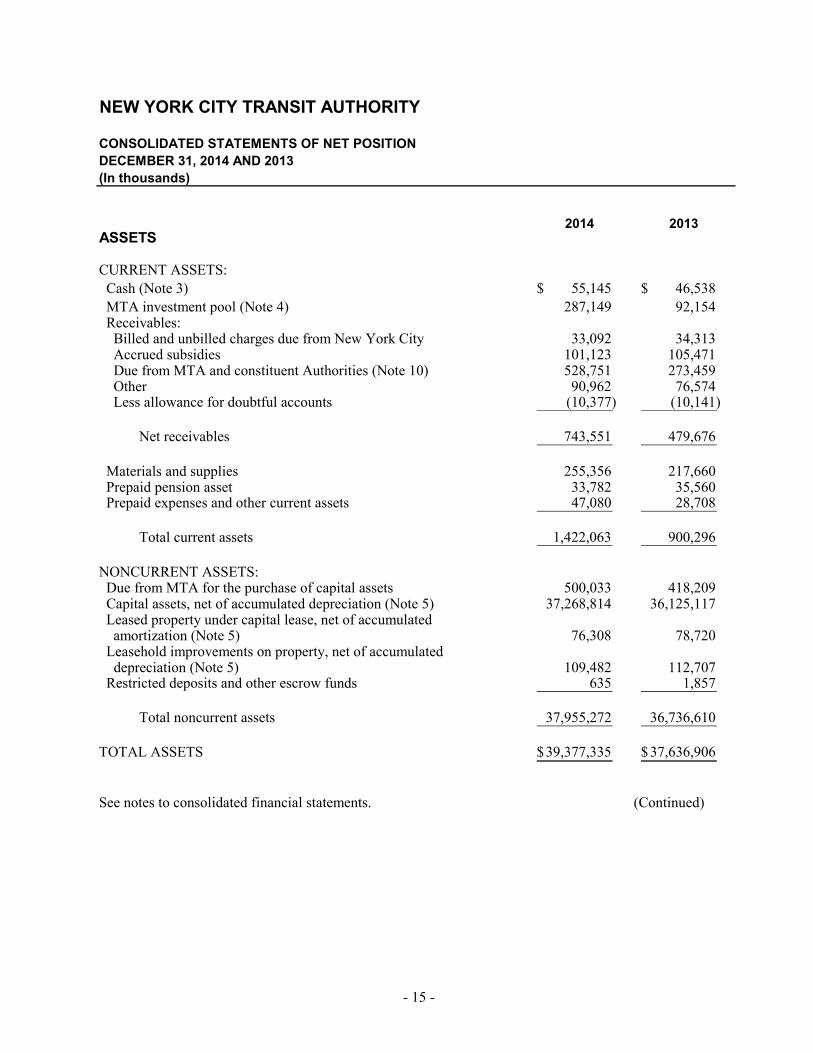
CONSOLIDATED STATEMENTS OF NET POSITIONDECEMBER 31, 2014 AND 2013(In thousands)
2014 2013ASSETS
CURRENT ASSETS: Cash (Note 3) 55,145$ 46,538$ MTA investment pool (Note 4) 287,149 92,154 Receivables: Billed and unbilled charges due from New York City 33,092 34,313 Accrued subsidies 101,123 105,471 Due from MTA and constituent Authorities (Note 10) 528,751 273,459 Other 90,962 76,574 Less allowance for doubtful accounts (10,377) (10,141)
Net receivables 743,551 479,676
Materials and supplies 255,356 217,660 Prepaid pension asset 33,782 35,560 Prepaid expenses and other current assets 47,080 28,708
Total current assets 1,422,063 900,296
NONCURRENT ASSETS: Due from MTA for the purchase of capital assets 500,033 418,209 Capital assets, net of accumulated depreciation (Note 5) 37,268,814 36,125,117 Leased property under capital lease, net of accumulated amortization (Note 5) 76,308 78,720 Leasehold improvements on property, net of accumulated depreciation (Note 5) 109,482 112,707 Restricted deposits and other escrow funds 635 1,857
Total noncurrent assets 37,955,272 36,736,610
TOTAL ASSETS 39,377,335$ 37,636,906$
See notes to consolidated financial statements. (Continued)
- 16 -
NEW YORK CITY TRANSIT AUTHORITY
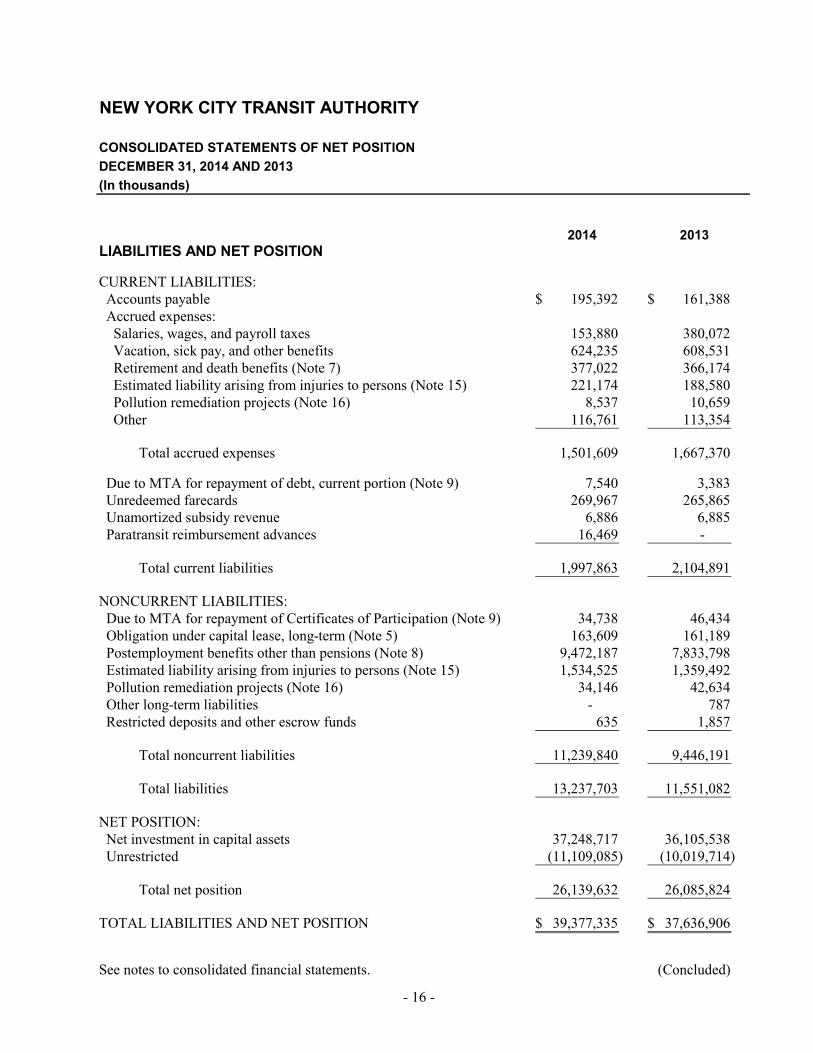
CONSOLIDATED STATEMENTS OF NET POSITIONDECEMBER 31, 2014 AND 2013(In thousands)
2014 2013LIABILITIES AND NET POSITION
CURRENT LIABILITIES: Accounts payable 195,392$ 161,388$ Accrued expenses: Salaries, wages, and payroll taxes 153,880 380,072 Vacation, sick pay, and other benefits 624,235 608,531 Retirement and death benefits (Note 7) 377,022 366,174 Estimated liability arising from injuries to persons (Note 15) 221,174 188,580 Pollution remediation projects (Note 16) 8,537 10,659 Other 116,761 113,354
Total accrued expenses 1,501,609 1,667,370
Due to MTA for repayment of debt, current portion (Note 9) 7,540 3,383 Unredeemed farecards 269,967 265,865 Unamortized subsidy revenue 6,886 6,885 Paratransit reimbursement advances 16,469 -
Total current liabilities 1,997,863 2,104,891
NONCURRENT LIABILITIES: Due to MTA for repayment of Certificates of Participation (Note 9) 34,738 46,434 Obligation under capital lease, long-term (Note 5) 163,609 161,189 Postemployment benefits other than pensions (Note 8) 9,472,187 7,833,798 Estimated liability arising from injuries to persons (Note 15) 1,534,525 1,359,492 Pollution remediation projects (Note 16) 34,146 42,634 Other long-term liabilities - 787 Restricted deposits and other escrow funds 635 1,857
Total noncurrent liabilities 11,239,840 9,446,191
Total liabilities 13,237,703 11,551,082
NET POSITION: Net investment in capital assets 37,248,717 36,105,538 Unrestricted (11,109,085) (10,019,714)
Total net position 26,139,632 26,085,824
TOTAL LIABILITIES AND NET POSITION 39,377,335$ 37,636,906$
See notes to consolidated financial statements. (Concluded)
- 17 -
NEW YORK CITY TRANSIT AUTHORITY
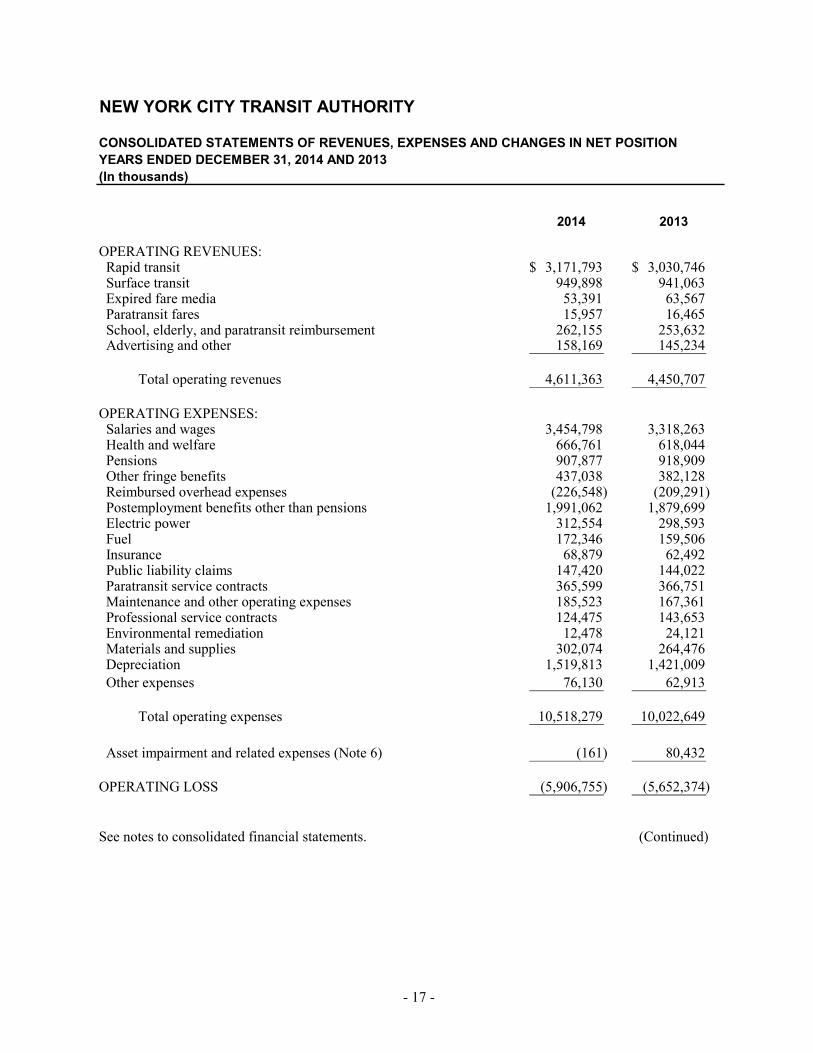
CONSOLIDATED STATEMENTS OF REVENUES, EXPENSES AND CHANGES IN NET POSITIONYEARS ENDED DECEMBER 31, 2014 AND 2013(In thousands)
2014 2013
OPERATING REVENUES: Rapid transit 3,171,793$ 3,030,746$ Surface transit 949,898 941,063 Expired fare media 53,391 63,567 Paratransit fares 15,957 16,465 School, elderly, and paratransit reimbursement 262,155 253,632 Advertising and other 158,169 145,234
Total operating revenues 4,611,363 4,450,707
OPERATING EXPENSES: Salaries and wages 3,454,798 3,318,263 Health and welfare 666,761 618,044 Pensions 907,877 918,909 Other fringe benefits 437,038 382,128 Reimbursed overhead expenses (226,548) (209,291) Postemployment benefits other than pensions 1,991,062 1,879,699 Electric power 312,554 298,593 Fuel 172,346 159,506 Insurance 68,879 62,492 Public liability claims 147,420 144,022 Paratransit service contracts 365,599 366,751 Maintenance and other operating expenses 185,523 167,361 Professional service contracts 124,475 143,653 Environmental remediation 12,478 24,121 Materials and supplies 302,074 264,476 Depreciation 1,519,813 1,421,009 Other expenses 76,130 62,913
Total operating expenses 10,518,279 10,022,649
Asset impairment and related expenses (Note 6) (161) 80,432
OPERATING LOSS (5,906,755) (5,652,374)
See notes to consolidated financial statements. (Continued)
- 18 -
NEW YORK CITY TRANSIT AUTHORITY
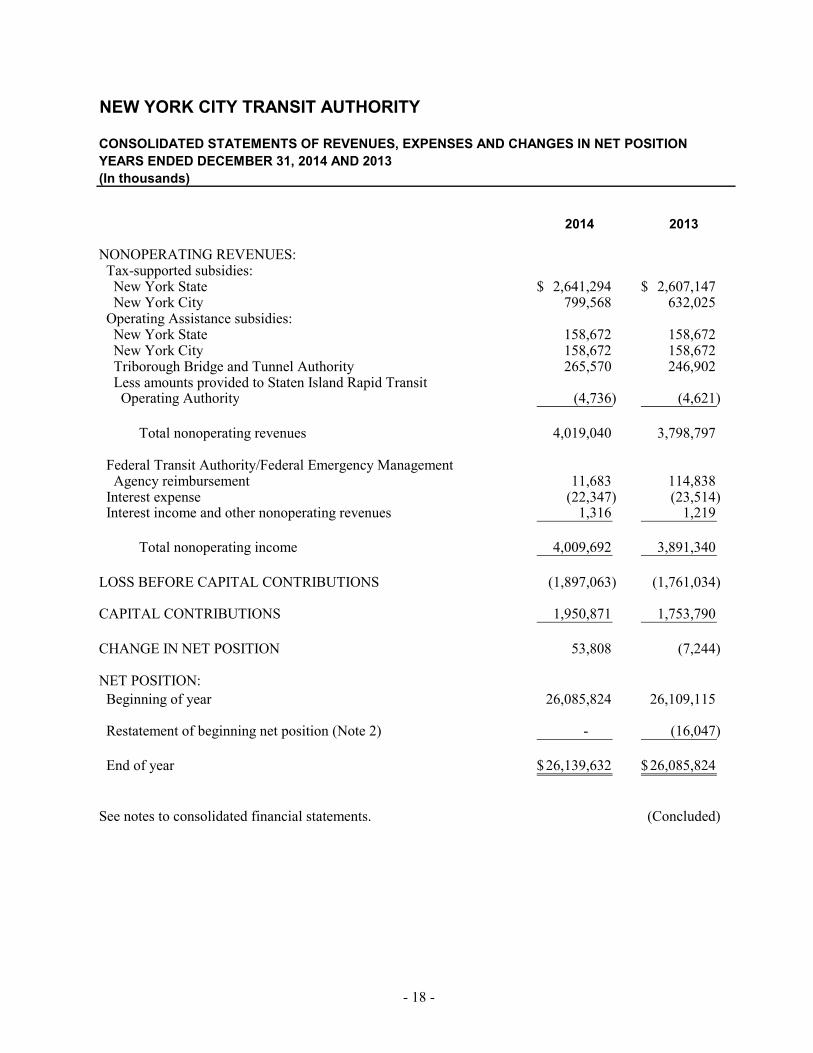
CONSOLIDATED STATEMENTS OF REVENUES, EXPENSES AND CHANGES IN NET POSITIONYEARS ENDED DECEMBER 31, 2014 AND 2013(In thousands)
2014 2013
NONOPERATING REVENUES: Tax-supported subsidies: New York State 2,641,294$ 2,607,147$ New York City 799,568 632,025 Operating Assistance subsidies: New York State 158,672 158,672 New York City 158,672 158,672 Triborough Bridge and Tunnel Authority 265,570 246,902 Less amounts provided to Staten Island Rapid Transit Operating Authority (4,736) (4,621)
Total nonoperating revenues 4,019,040 3,798,797
Federal Transit Authority/Federal Emergency Management Agency reimbursement 11,683 114,838 Interest expense (22,347) (23,514) Interest income and other nonoperating revenues 1,316 1,219
Total nonoperating income 4,009,692 3,891,340
LOSS BEFORE CAPITAL CONTRIBUTIONS (1,897,063) (1,761,034)
CAPITAL CONTRIBUTIONS 1,950,871 1,753,790
CHANGE IN NET POSITION 53,808 (7,244)
NET POSITION: Beginning of year 26,085,824 26,109,115 Restatement of beginning net position (Note 2) - (16,047)
End of year 26,139,632$ 26,085,824$
See notes to consolidated financial statements. (Concluded)
- 19 -
NEW YORK CITY TRANSIT AUTHORITY
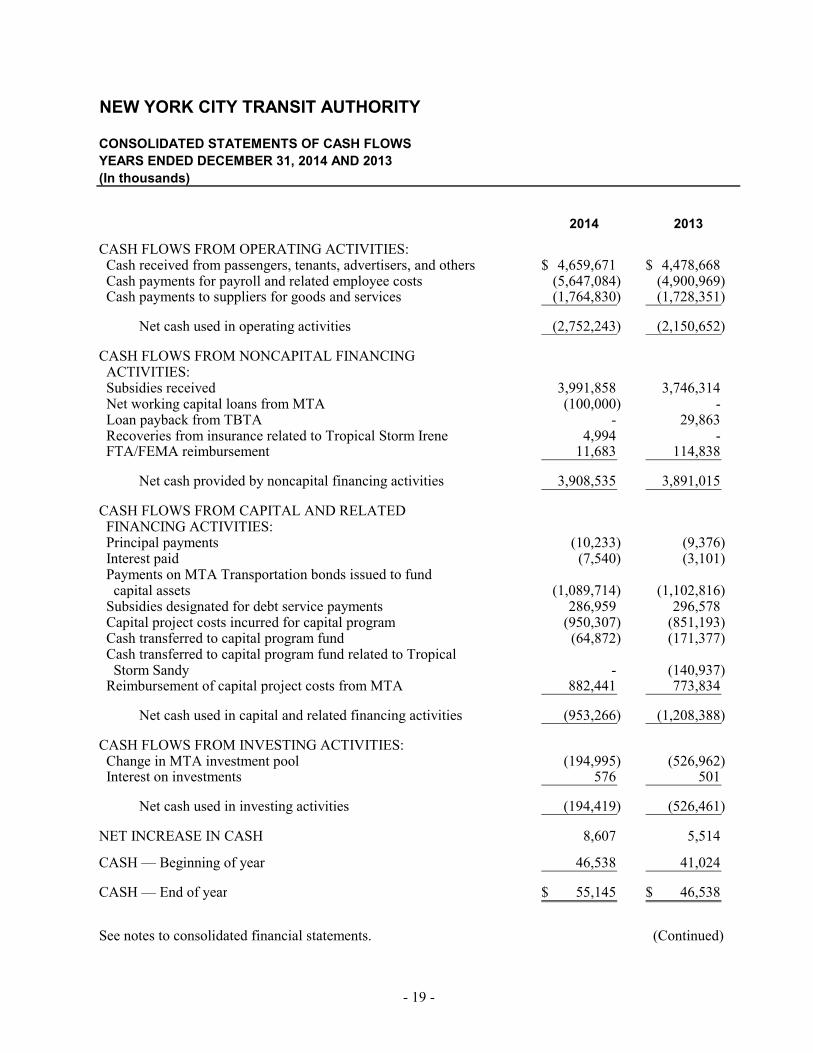
CONSOLIDATED STATEMENTS OF CASH FLOWSYEARS ENDED DECEMBER 31, 2014 AND 2013(In thousands)
2014 2013
CASH FLOWS FROM OPERATING ACTIVITIES: Cash received from passengers, tenants, advertisers, and others 4,659,671$ 4,478,668$ Cash payments for payroll and related employee costs (5,647,084) (4,900,969) Cash payments to suppliers for goods and services (1,764,830) (1,728,351)
Net cash used in operating activities (2,752,243) (2,150,652)
CASH FLOWS FROM NONCAPITAL FINANCING ACTIVITIES: Subsidies received 3,991,858 3,746,314 Net working capital loans from MTA (100,000) - Loan payback from TBTA - 29,863 Recoveries from insurance related to Tropical Storm Irene 4,994 - FTA/FEMA reimbursement 11,683 114,838
Net cash provided by noncapital financing activities 3,908,535 3,891,015
CASH FLOWS FROM CAPITAL AND RELATED FINANCING ACTIVITIES: Principal payments (10,233) (9,376) Interest paid (7,540) (3,101) Payments on MTA Transportation bonds issued to fund capital assets (1,089,714) (1,102,816) Subsidies designated for debt service payments 286,959 296,578 Capital project costs incurred for capital program (950,307) (851,193) Cash transferred to capital program fund (64,872) (171,377) Cash transferred to capital program fund related to Tropical Storm Sandy - (140,937) Reimbursement of capital project costs from MTA 882,441 773,834
Net cash used in capital and related financing activities (953,266) (1,208,388)
CASH FLOWS FROM INVESTING ACTIVITIES: Change in MTA investment pool (194,995) (526,962) Interest on investments 576 501
Net cash used in investing activities (194,419) (526,461)
NET INCREASE IN CASH 8,607 5,514
CASH — Beginning of year 46,538 41,024
CASH — End of year 55,145$ 46,538$
See notes to consolidated financial statements. (Continued)
- 20 -
NEW YORK CITY TRANSIT AUTHORITY
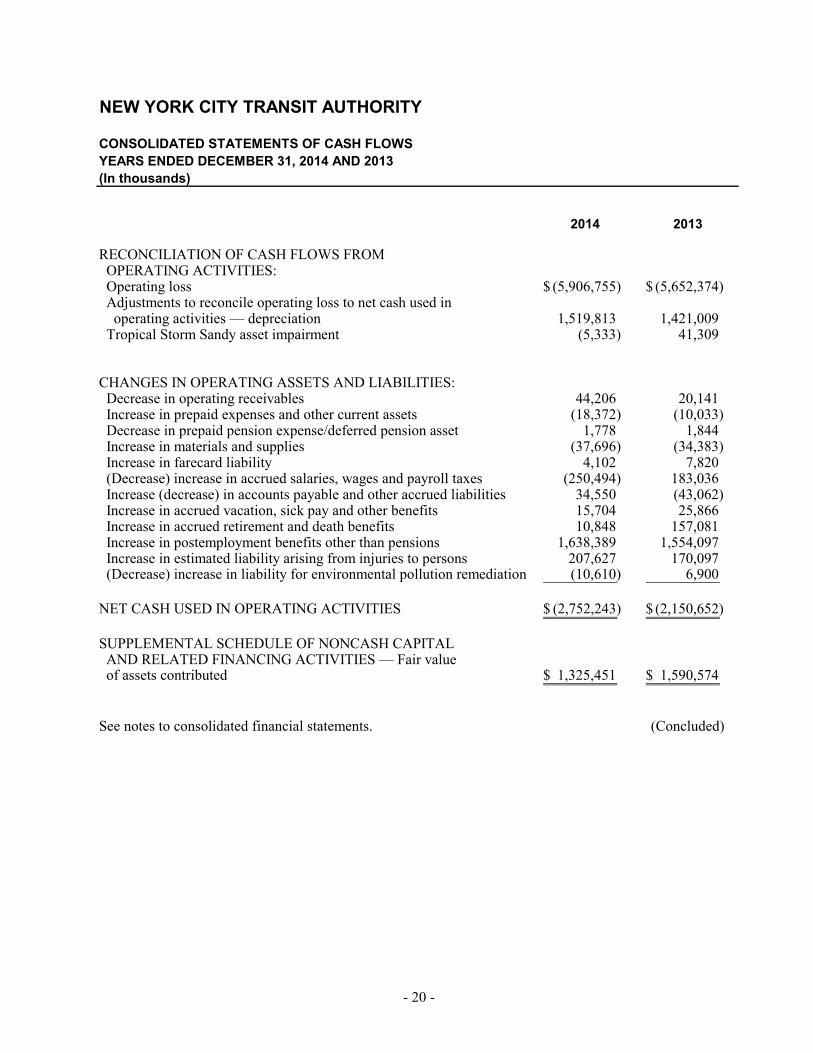
CONSOLIDATED STATEMENTS OF CASH FLOWSYEARS ENDED DECEMBER 31, 2014 AND 2013(In thousands)
2014 2013
RECONCILIATION OF CASH FLOWS FROM OPERATING ACTIVITIES: Operating loss (5,906,755)$ (5,652,374)$ Adjustments to reconcile operating loss to net cash used in operating activities — depreciation 1,519,813 1,421,009 Tropical Storm Sandy asset impairment (5,333) 41,309
CHANGES IN OPERATING ASSETS AND LIABILITIES: Decrease in operating receivables 44,206 20,141 Increase in prepaid expenses and other current assets (18,372) (10,033) Decrease in prepaid pension expense/deferred pension asset 1,778 1,844 Increase in materials and supplies (37,696) (34,383) Increase in farecard liability 4,102 7,820 (Decrease) increase in accrued salaries, wages and payroll taxes (250,494) 183,036 Increase (decrease) in accounts payable and other accrued liabilities 34,550 (43,062) Increase in accrued vacation, sick pay and other benefits 15,704 25,866 Increase in accrued retirement and death benefits 10,848 157,081 Increase in postemployment benefits other than pensions 1,638,389 1,554,097 Increase in estimated liability arising from injuries to persons 207,627 170,097 (Decrease) increase in liability for environmental pollution remediation (10,610) 6,900
NET CASH USED IN OPERATING ACTIVITIES (2,752,243)$ (2,150,652)$
SUPPLEMENTAL SCHEDULE OF NONCASH CAPITAL AND RELATED FINANCING ACTIVITIES — Fair value of assets contributed 1,325,451$ 1,590,574$
See notes to consolidated financial statements. (Concluded)
- 21 -
NEW YORK CITY TRANSIT AUTHORITY
NOTES TO CONSOLIDATED FINANCIAL STATEMENTS DECEMBER 31, 2014 AND 2013
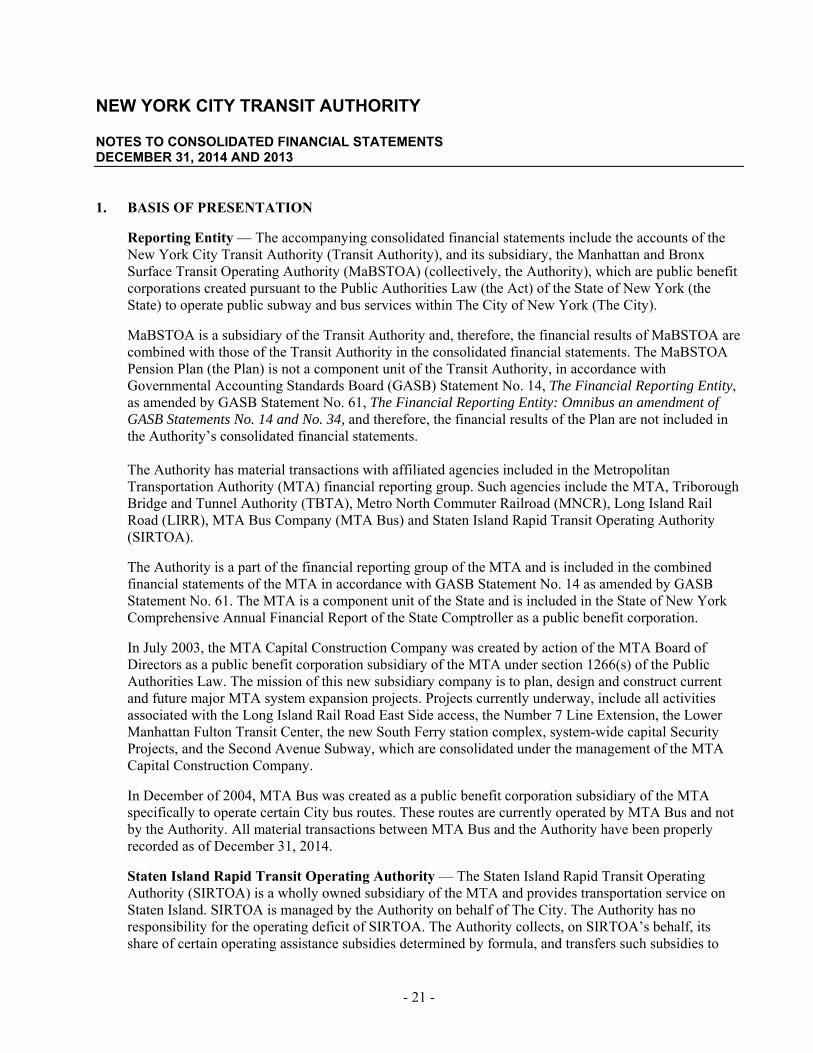
1. BASIS OF PRESENTATION
Reporting Entity — The accompanying consolidated financial statements include the accounts of the New York City Transit Authority (Transit Authority), and its subsidiary, the Manhattan and Bronx Surface Transit Operating Authority (MaBSTOA) (collectively, the Authority), which are public benefit corporations created pursuant to the Public Authorities Law (the Act) of the State of New York (the State) to operate public subway and bus services within The City of New York (The City).
MaBSTOA is a subsidiary of the Transit Authority and, therefore, the financial results of MaBSTOA are combined with those of the Transit Authority in the consolidated financial statements. The MaBSTOA Pension Plan (the Plan) is not a component unit of the Transit Authority, in accordance with Governmental Accounting Standards Board (GASB) Statement No. 14, The Financial Reporting Entity, as amended by GASB Statement No. 61, The Financial Reporting Entity: Omnibus an amendment of GASB Statements No. 14 and No. 34, and therefore, the financial results of the Plan are not included in the Authority’s consolidated financial statements.
The Authority has material transactions with affiliated agencies included in the Metropolitan Transportation Authority (MTA) financial reporting group. Such agencies include the MTA, Triborough Bridge and Tunnel Authority (TBTA), Metro North Commuter Railroad (MNCR), Long Island Rail Road (LIRR), MTA Bus Company (MTA Bus) and Staten Island Rapid Transit Operating Authority (SIRTOA).
The Authority is a part of the financial reporting group of the MTA and is included in the combined financial statements of the MTA in accordance with GASB Statement No. 14 as amended by GASB Statement No. 61. The MTA is a component unit of the State and is included in the State of New York Comprehensive Annual Financial Report of the State Comptroller as a public benefit corporation.
In July 2003, the MTA Capital Construction Company was created by action of the MTA Board of Directors as a public benefit corporation subsidiary of the MTA under section 1266(s) of the Public Authorities Law. The mission of this new subsidiary company is to plan, design and construct current and future major MTA system expansion projects. Projects currently underway, include all activities associated with the Long Island Rail Road East Side access, the Number 7 Line Extension, the Lower Manhattan Fulton Transit Center, the new South Ferry station complex, system-wide capital Security Projects, and the Second Avenue Subway, which are consolidated under the management of the MTA Capital Construction Company.
In December of 2004, MTA Bus was created as a public benefit corporation subsidiary of the MTA specifically to operate certain City bus routes. These routes are currently operated by MTA Bus and not by the Authority. All material transactions between MTA Bus and the Authority have been properly recorded as of December 31, 2014.
Staten Island Rapid Transit Operating Authority — The Staten Island Rapid Transit Operating Authority (SIRTOA) is a wholly owned subsidiary of the MTA and provides transportation service on Staten Island. SIRTOA is managed by the Authority on behalf of The City. The Authority has no responsibility for the operating deficit of SIRTOA. The Authority collects, on SIRTOA’s behalf, its share of certain operating assistance subsidies determined by formula, and transfers such subsidies to
- 22 -
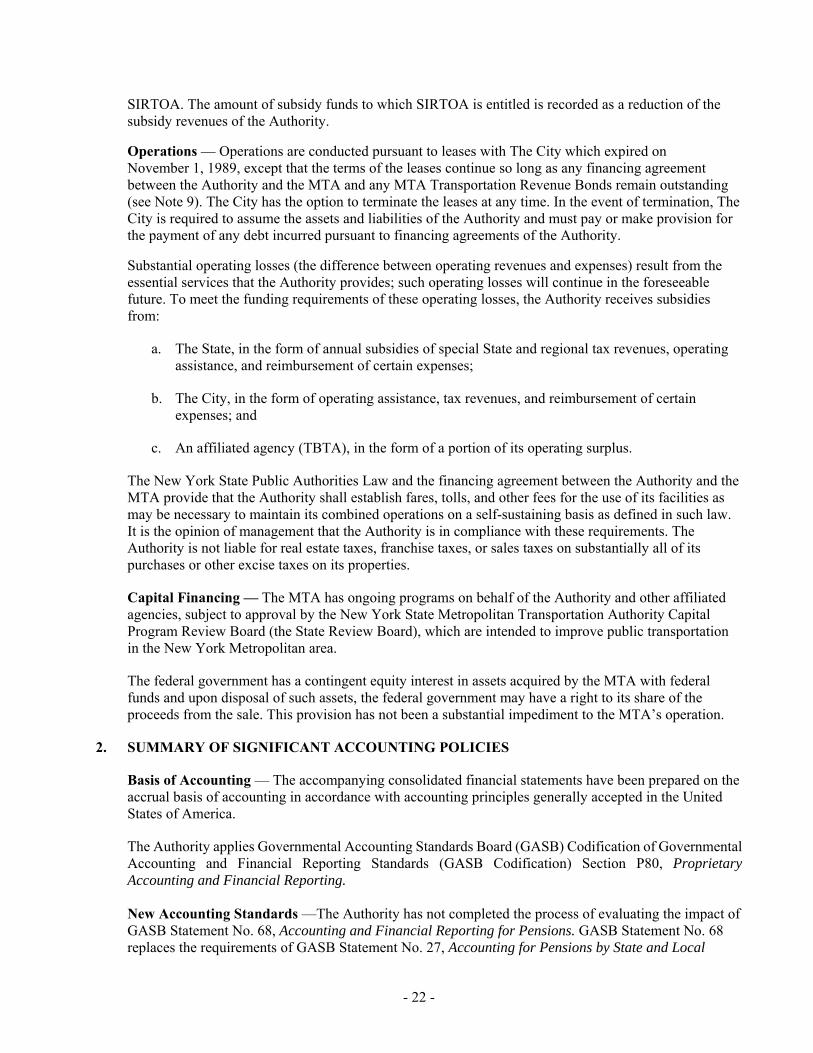
SIRTOA. The amount of subsidy funds to which SIRTOA is entitled is recorded as a reduction of the subsidy revenues of the Authority.
Operations — Operations are conducted pursuant to leases with The City which expired on November 1, 1989, except that the terms of the leases continue so long as any financing agreement between the Authority and the MTA and any MTA Transportation Revenue Bonds remain outstanding (see Note 9). The City has the option to terminate the leases at any time. In the event of termination, The City is required to assume the assets and liabilities of the Authority and must pay or make provision for the payment of any debt incurred pursuant to financing agreements of the Authority.
Substantial operating losses (the difference between operating revenues and expenses) result from the essential services that the Authority provides; such operating losses will continue in the foreseeable future. To meet the funding requirements of these operating losses, the Authority receives subsidies from:
a. The State, in the form of annual subsidies of special State and regional tax revenues, operating assistance, and reimbursement of certain expenses;
b. The City, in the form of operating assistance, tax revenues, and reimbursement of certain expenses; and
c. An affiliated agency (TBTA), in the form of a portion of its operating surplus.
The New York State Public Authorities Law and the financing agreement between the Authority and the MTA provide that the Authority shall establish fares, tolls, and other fees for the use of its facilities as may be necessary to maintain its combined operations on a self-sustaining basis as defined in such law. It is the opinion of management that the Authority is in compliance with these requirements. The Authority is not liable for real estate taxes, franchise taxes, or sales taxes on substantially all of its purchases or other excise taxes on its properties.
Capital Financing — The MTA has ongoing programs on behalf of the Authority and other affiliated agencies, subject to approval by the New York State Metropolitan Transportation Authority Capital Program Review Board (the State Review Board), which are intended to improve public transportation in the New York Metropolitan area.
The federal government has a contingent equity interest in assets acquired by the MTA with federal funds and upon disposal of such assets, the federal government may have a right to its share of the proceeds from the sale. This provision has not been a substantial impediment to the MTA’s operation.
2. SUMMARY OF SIGNIFICANT ACCOUNTING POLICIES
Basis of Accounting — The accompanying consolidated financial statements have been prepared on the accrual basis of accounting in accordance with accounting principles generally accepted in the United States of America.
The Authority applies Governmental Accounting Standards Board (GASB) Codification of Governmental Accounting and Financial Reporting Standards (GASB Codification) Section P80, Proprietary Accounting and Financial Reporting. New Accounting Standards —The Authority has not completed the process of evaluating the impact of GASB Statement No. 68, Accounting and Financial Reporting for Pensions. GASB Statement No. 68 replaces the requirements of GASB Statement No. 27, Accounting for Pensions by State and Local
- 23 -
Governmental Employers and GASB Statement No. 50, Pension Disclosures – an amendment of GASB Statements No. 25 and No. 27, as they relate to governments that provide pensions through pension plans administered as trusts or similar arrangements that meet certain criteria. GASB Statement No. 68 requires governments providing defined benefit pensions to recognize their long-term obligation for pension benefits as a liability for the first time, and to more comprehensively and comparably measure the annual costs of pension benefits. The Statement also enhances accountability and transparency through revised and new note disclosures and RSI. The provisions in GASB Statement No. 68 are effective for fiscal years beginning after June 15, 2014. The Authority has completed the process of evaluating the impact of GASB Statement No. 69, Government Combinations and Disposals of Government Operations. GASB Statement No. 69 establishes accounting and financial reporting standards related to government combinations and disposals of government operations. GASB Statement No. 69 requires the use of carrying values to measure the assets and liabilities in a government merger and requires measurements of assets acquired and liabilities assumed generally to be based upon their acquisition values. GASB Statement No. 69 also provides guidance for transfers of operations that do not constitute entire legally separate entities and in which no significant consideration is exchanged. GASB Statement No. 69 provides accounting and financial reporting guidance for disposals of government operations that have been transferred or sold. GASB Statement No. 69 requires disclosures to be made about government combinations and disposals of government operations to enable financial statement users to evaluate the nature and financial effects of those transactions. The Authority has determined that GASB Statement No. 69 had no impact on its financial position, results of operations, and cash flows. The Authority has completed the process of evaluating the impact of GASB Statement No. 70, Accounting and Financial Reporting for Nonexchange Financial Guarantees, which requires a state or local government guarantor that offers a nonexchange financial guarantee to another organization or government to recognize a liability on its financial statements when it is more likely than not that the guarantor will be required to make a payment to the obligation holders under the agreement. GASB Statement No. 70 also requires a government guarantor to consider qualitative factors when determining if a payment on its guarantee is more likely than not to be required. Such factors may include whether the issuer of the guaranteed obligation is experiencing significant financial difficulty or initiating the process of entering into bankruptcy or financial reorganization. GASB Statement No. 70 further requires an issuer government that is required to repay a guarantor for guarantee payments made to continue to report a liability unless legally released. When a government is released, the government would recognize revenue as a result of being relieved of the obligation. This Statement also requires a government guarantor or issuer to disclose information about the amounts and nature of nonexchange financial guarantees. The Authority has determined that GASB Statement No. 70 had no impact on its financial position, results of operations, and cash flows. The Authority has not completed the process of evaluating the impact of GASB Statement No. 71, Pension Transition for Contributions Made Subsequent to the Measurement Date. The objective of GASB Statement No. 71 is to address an issue regarding application of the transition provisions of GASB Statement No. 68, Accounting and Financial Reporting for Pensions. The issue relates to amounts associated with contributions, if any, made by a state or local government employer or non-employer contributing entity to a defined benefit pension plan after the measurement date of the government’s beginning net pension liability. The requirements of this Statement will eliminate the source of a potential significant understatement of restated beginning net position and expense in the first year of implementation of GASB Statement No. 68 in the accrual-basis financial statements of employers and non-employer contributing entities. This benefit will be achieved without the imposition of significant additional costs. The requirements of this Statement should be applied simultaneously with
- 24 -
the provisions of GASB Statement No. 68 and are effective for fiscal years beginning after June 15, 2014.
The Authority has not completed the process of evaluating the impact of GASB Statement No. 72, Fair Value Measurement and Application. The objective of GASB Statement No. 72 is to improve financial reporting by clarifying the definition of fair value for financial reporting purposes, establishing general principles for measuring fair value, providing additional fair value application guidance, and enhancing disclosures about fair value measurements. These improvements are based in part on the concepts and definitions established in Concepts Statement No. 6, Measurement of Elements of Financial Statements, and other relevant literature. The provisions in GASB Statement No. 72 are effective for fiscal periods beginning after June 15, 2015.
Net Position — The Authority follows the “business type” activity requirements of GASB 34, Basic Financial Statements and Management’s Discussion and Analysis for State and Local Governments which requires that resources be classified for accounting and reporting purposes into the following three net position categories:
• Net investment in capital assets: Capital assets, net of accumulated depreciation and outstanding principal balances of debt attributable to the acquisition, construction or improvement of those assets.
• Restricted:
Nonexpendable — Net position subject to externally imposed stipulations such that the Authority maintains them permanently. For the years ended December 31, 2014 and 2013, the Authority did not have nonexpendable net position.
Expendable — Net position whose use by the Authority is subject to externally imposed stipulations that can be fulfilled by actions of the Authority pursuant to those stipulations or that expire with the passage of time. For the years ended December 31, 2014 and 2013, the Authority did not have expendable net position
• Unrestricted: Net position that are not subject to externally imposed stipulations. Unrestricted net position may be designated for specific purposes by actions of management or the Board of Directors or may otherwise be limited by contractual agreements with outside parties.
Subsidies — The Authority receives subsidies from various sources, including the State and The City, which are included in nonoperating revenues. In general, these subsidies are subject to annual appropriations by the governmental units and periodic approval of the continuation of the taxes supporting the subsidies.
The principal funding sources for the Authority are as follows:
Operating Assistance Appropriations and Grants — The Authority receives, subject to annual appropriations, State and City operating assistance funds. The funds received under the State transit operating assistance program are fully matched by contributions from The City. State and City operating assistance subsidies are recognized as non-operating revenue in the amount of the respective annual appropriation when such appropriation becomes effective.
Triborough Bridge and Tunnel Authority — The New York State Public Authorities law requires the TBTA to transfer its annual operating surplus, as defined, to the Authority and the MTA. The initial
- 25 -
$24 million of the operating surplus is provided to the Authority and the balance is divided equally between the Authority and the MTA. However, the amounts transferred to the Authority and the MTA are net of a provision for debt service on TBTA bonds issued to finance the acquisition of facilities under their respective portions of the Capital Program. For the years ended December 31, 2014 and 2013, $242.7 million and $267.3 million, respectively, were paid from the operating surplus of the TBTA to satisfy the Authority’s portion of debt service requirements.
Mortgage Recording Taxes — Under New York State law, the MTA receives operating and capital assistance from the State Mortgage Recording Tax, which is collected by The City and the seven counties within the MTA transportation region, at the rate of three-tenths of 1% of the debt secured by certain real estate mortgages. Such legislation governs the use of the funds from this revenue source whereby the proceeds of this tax are first used by the MTA to meet the operating costs of the MTA headquarters, with the remaining funds allocated 55% to the Authority and 45% to the commuter railroads for their capital and operating needs. The Authority recognizes such sources of funds when designated by the MTA for the Authority’s use. The portion of this subsidy attributable to the Authority is reported in “Tax-supported subsidies: New York State” in the accompanying consolidated statements of Revenues, Expenses, and Changes in Net Position. The Authority records the portion of its State Mortgage Recording Tax subsidy which funds principal and interest payments on long-term debt, net of investment earnings on unexpended proceeds, used to construct capital assets as capital contributions.
In addition, the State designated for the MTA’s use an additional mortgage recording tax (the Additional Mortgage Recording Tax) of one-quarter of 1% of mortgages secured by real estate improved or to be improved by structures containing one to six dwelling units in the MTA transportation region. The funds from this additional tax are available, after satisfying debt service requirements, to meet the capital and operating needs of the Authority and the commuter railroads to be disbursed at MTA’s discretion.
No funds from the Additional Mortgage Recording Tax were disbursed to the Authority in 2014 and 2013.
The Authority receives operating assistance directly from The City through The City Mortgage Recording Tax at the rate of five-eighths of 1% of the debt secured by certain real estate mortgages and through the Real Property Transfer Tax at the rate of 1% of certain properties’ assessed value (collectively referred to as Urban Tax Subsidies). These Urban Tax Subsidies are reflected in Tax supported subsidies: New York City, in the accompanying consolidated statements of Revenues, Expenses, and Changes in Net Position. These funds are recognized as revenue, based upon the reported amount of taxes collected by The City from underlying transactions, within the Authority’s fiscal year.
New York State Regional Mass Transit Taxes — The Authority receives, subject to annual appropriations, revenues from taxes enacted by the State legislature from various taxing sources.
In 1980, the State enacted a series of taxes, portions of which are deposited in the Metro Mass Transportation Operating Account (MMTOA), to fund the operating deficits of State mass transportation systems. MMTOA taxes currently include a business privilege tax imposed on petroleum business in the State, a one-quarter of 1% sales and use tax on certain personal property and services, a corporate franchise tax imposed on transportation and transmission companies, and a temporary franchise tax surcharge on certain corporations, banks, insurance, utility, and transportation companies attributable to business activity carried on in the State. MMTOA taxes are subject to annual appropriation, availability of sufficient tax collections, and determination of operating need by the State for the MTA. They are recognized as revenue in the amount of the annual appropriation when such appropriation becomes effective.
- 26 -
Under New York State law, subject to annual appropriation, the MTA receives operating and capital assistance through a portion of petroleum business tax receipts, certain motor fuel taxes, and certain motor vehicle fees, which are collected by the State. Such assistance is required by law to be allocated, after provision for debt service on any bonds secured by such taxes, 85% to the Authority and 15% to the commuter railroads for their operating and capital needs. MTA Dedicated Tax Fund Bonds (DFT Bonds) are secured by certain petroleum business tax receipts. The Authority recognizes such sources of funds when designated by the MTA for the Authority’s use. A portion of the petroleum business tax receipts collected by the MTA is used to satisfy the debt service requirements for the DTF Bonds and is recorded as capital contributions.
Metropolitan Commuter Transportation Mobility Tax — In June 2009, Chapter 25 of the Laws of 2009 added Article 23, which established the Metropolitan Commuter Transportation Mobility Tax (MCTMT). This tax is administered by the NYS Tax Department, and the proceeds from this tax are distributed to the MTA. This tax is imposed on certain employers and self-employed individuals engaging in business within the Metropolitan Commuter Transportation District (MCTD), which includes all counties in New York City, and the counties of Rockland, Nassau, Suffolk, Orange, Putnam, Duchess, and Westchester. This tax requires certain employers that have payroll expenses within the MCTD to pay at a rate of 0.34% of an employer’s payroll expenses for all covered employees for each calendar quarter. The effective date of this tax was March 1, 2009 for employers other than public schools districts; September 1, 2009 for public schools districts, and January 1, 2009 for individuals. Also in 2009, several amendments to the existing tax law provided the MTA supplemental revenues to be deposited into the MTA’s Aid Trust Account. These amendments imposed a supplemental fee of one dollar for each six month period of validity of a learner’s permit or a driver’s license issued to a person residing in the MCTD, a supplemental fee of twenty-five dollars per year on the registration and renewals of registrants of motor vehicles who reside within the MCTD, imposed on taxicab owners a tax of fifty cents per ride on taxicab rides originating in New York City and terminating within the MCTD, and a supplemental tax of five percent of the cost of rentals of automobiles rented within the MCTD. The supplemental Aid Tax receipts are included in the Mobility Tax amounts for reporting purposes.
The composition of New York State tax-supported subsidies for 2014 and 2013 is as follows (in thousands)
2014 2013
Petroleum business tax* 268,057$ 217,069$ Metro mass tax 1,035,757 1,002,907 Payroll Mobility tax 1,337,480 1,387,171
2,641,294$ 2,607,147$
* Net of $286,959 and $296,578 for debt service payments in 2014 and 2013, respectively.
Accrued Revenue
Paratransit — Pursuant to an agreement between The City and the MTA, the Authority, effective July 1, 1993, assumed operating responsibility for all paratransit service required by the Americans with Disability Act of 1990. Services are provided by private vendors under contract with the Authority. The City reimburses the Authority for the lesser of 33% of net paratransit operating expenses defined as labor, transportation, and administrative costs less fare revenues and 6% of gross urban tax proceeds as described above, or an amount that is 20% greater than the amount paid by The City for the preceding calendar year. Fare revenues and The City reimbursement aggregated approximately $194.1 million in
- 27 -
2014 and $186.1 million in 2013. Total paratransit expenses, including paratransit service contracts, were $455.0 million and $450.1 million in 2014 and 2013, respectively.
Operating and Non-operating Expenses — Operating and non-operating expenses are recognized in the accounting period in which the liability is incurred. All expenses related to operating the Authority (e.g. salaries, insurance, depreciation, etc.) are reported as operating expenses. All other expenses (e.g. interest on long-term debt, fuel hedge transactions, etc.) are reported as non-operating expenses.
Reimbursement of Expenditures — Engineering and labor costs incurred by the Authority for capital projects are reimbursed under the capital program by the MTA to the extent that they relate to approved expenditures applicable to capital projects primarily initiated after April 1, 1982. They are reimbursed by The City to the extent they relate to amounts approved for prior projects. In 2014 and 2013, reimbursements were netted against gross operating expenses on the consolidated statements of Revenues, Expenses, and Changes in Net Position.
Fare and Service Reimbursement from the State and City — In 1995, The City ceased reimbursing the Authority for the full costs of the free/reduced fare program for students. Beginning in 1996, the State and The City each began paying $45 million per annum to the Authority toward the cost of the program. In 2009, the State reduced their $45 million reimbursement to $6.3 million. Beginning in 2010, the State increased their annual commitment to $25.3 million while The City’s annual commitment remained at $45 million. These commitments have been met by both the State and The City for both 2013 and 2014. As of December 31, 2014, the Authority collected $70.3 million from the State and The City.
Prior to April 1995, The City was obligated to reimburse the Authority for the transit police force. As a result of the April 1995 merger of the transit police force into the New York City Police Department, The City no longer reimburses the Authority for the costs of policing the Transit System on an ongoing basis since policing of the Transit System is being carried out by the New York City Police Department at The City’s expense. The Authority continues to be responsible for certain capital costs and support services related to such police activities, a portion of which is reimbursed by The City. The Authority received approximately $2.1 million and $5.4million in 2014 and 2013, respectively for the reimbursement of transit police costs.
MTA Investment Pool — The MTA, on behalf of the Authority, invests funds which are not immediately required for Authority’s operations in securities permitted by the State Public Authorities Law, including repurchase agreements collateralized by U.S. Treasury securities, U.S. Treasury notes and U.S. Treasury zero-coupon bonds. All investments are held by the MTA’s agent in custody accounts in the name of the MTA.
Due to/from MTA and Constituent Authorities — Due to/from MTA and constituent Authorities consists of reimbursements due from the MTA Capital Program for billed and unbilled charges relating to capital projects, farecards and intercompany operating receivables, payables, and inter-agency loan transactions.
Prepaid Expenses and Other Current Assets — The Authority prepaid $16.9 million to the New York Health Insurance Plan (NYSHIP), $26.5 million in risk management related insurance coverage, and $3.2 million to the NYC Water Board during 2014. The Authority prepaid $15.8 million to the New York Health Insurance Plan (NYSHIP), $7.0 million in risk management related insurance coverage, and $5.5 million to the Authority’s prescription drug provider during 2013.
Due from MTA for Purchase of Capital Assets — Due from MTA for purchase of capital assets consists of funds held by the MTA which are restricted for capital asset acquisitions by the Authority
- 28 -
pursuant to the 2002 Transportation Revenue Bond Resolution. This capital program pool is comprised of non-bond proceed funds derived from safe harbor and sale/leaseback transactions, operating fund transfers, legal settlements, TBTA bond purchase rights and swap option agreements, and interest earnings on these pooled funds.
Capital Assets — Capital assets acquired prior to April 1982 were funded primarily by The City, with capital grants made available to the Authority. The City has title to a substantial portion of such assets and, accordingly, these assets are not recorded on the books of the Authority. Subsequent acquisitions, which are part of the capital program, are recorded at cost by the Authority. Funding sources for the acquisition of these capital assets include Federal, State, and City capital grants, grants from the Port Authority of New York and New Jersey, the proceeds from the issuance of Transportation Revenue Bonds, and various TBTA bonding and other sources. Capital assets are recorded at cost and are depreciated on a straight-line basis over 25 or 35 years for subway cars, 12 years for buses, and lives generally ranging from 10 years to 60 years for the other capital assets. Cost includes capitalized interest apportioned to assets during construction. For the purposes of this calculation, interest expense is reported net of investment income.
Contributed Capital — Capital assets contributed by the MTA and restricted funds due from the MTA for the purchase of capital assets are recorded as capital contributions on the consolidated statements of Revenues, Expenses, and Changes in Net Position. Contributed capital is recognized upon identification of capital costs to be funded by the MTA. Capital contributions for the years ended December 31, 2014 and 2013, consist of the following (in thousands):
2014 2013
Capital assets contributed by MTA from: Federal grants 1,094,563$ 757,708$ Other than federal grants 1,301,812 1,793,465 Capital assets contributed by MTA for WTC disaster replacement 17 3 Petroleum business taxes received for principal and interest payments on debt 286,959 296,578 Principal and interest payments on MTA Transportation bonds issued to fund capital assets (783,107) (787,101) Increase/(decrease) in funds due from MTA for purchase of capital assets 50,627 (165,926) Operating transfers to Capital Program for Tropical Storm Sandy expenditures - (140,937)
Total capital contributions 1,950,871$ 1,753,790$
Passenger Revenue — Revenues from the sale of farecards are recognized as income as the farecards are used and are reported as operating income.
Materials and Supplies — Materials and supplies are recorded at weighted average cost, net of a reserve for obsolescence.
Employee Benefits — In November 1994, GASB issued Statement No. 27, Accounting for Pensions by State and Local Governmental Employers as amended by GASB Statement 50, which establishes standards for measurement, recognition, and display of pension expense and the related accounting for assets, liabilities, disclosures, and required supplementary information, if applicable. The Authority has
- 29 -
adopted this standard for its pension plans. Pension cost is required to be measured and disclosed using the accrual basis of accounting. Annual pension cost should be equal to the annual required contributions (ARC) to the pension plan, calculated in accordance with certain parameters.
In 2003, and as a result of collective bargaining, the Authority assumed responsibility for providing health benefits to its employees who are members of the TWU Local 100, as well as to retirees who were members of the TWU Local 100 and reach normal retirement age while working for the Authority. During 2005, the Authority also began providing health benefits for active and retired members of the ATU Local 1056 and Local 726. Previously, these benefits were being provided by the TWU and ATU Health Benefits Trusts (the Trusts) with the Authority required to make monthly contributions to the Trusts on behalf of the participants on a ‘pay as you go’ basis. The majority of the benefits provided under the plan are self-insured with administrative services provided by various health insurance companies.
The Authority has recorded a liability for claims incurred but not reported (IBNR). The liability represents those estimated future payments that are attributable, under the plan’s provisions, to services rendered to participants prior to year end. The estimated liability of claims includes benefits expected to be paid to retired or terminated employees or their beneficiaries and present employees or their beneficiaries, as applicable. The estimated liability for claims incurred but not reported or paid is $71.8 million and $74.3 million as of December 31, 2014 and 2013, respectively.
In June 2004, the GASB issued Statement No. 45, Accounting and Financial Reporting by Employers for Postemployment Benefits Other Than Pensions. This Statement establishes standards for the measurement, recognition, and display of OPEB expense / expenditures and related liabilities (assets), note disclosures, and if applicable required supplementary information (RSI) in the financial reports of state and local governmental employers. In June 2005, GASB issued Statement No. 47, Accounting for Termination Benefits. This Statement establishes accounting standards for termination benefits. For termination benefits provided through an existing defined benefit OPEB plan, the provisions of this Statement should be implemented simultaneously with the requirements of Statement No. 45. The Authority has adopted these standards for its Postemployment Benefits Other Than Pensions.
Receivables — Receivables are recorded as amounts due to the Authority, reduced by an allowance for doubtful accounts, to report the receivables at their net realizable value.
Pollution Remediation Projects — Pollution remediation costs are being expensed in accordance with the provisions of GASB Statement No. 49, Accounting and Financial Reporting for Pollution Remediation Obligations (see Note 16). An operating expense provision and corresponding liability measured at current value using the expected cash flow method has been recognized for certain pollution remediation obligations, which previously may not have been required to be recognized, have been recognized earlier than in the past or are no longer able to be capitalized as a component of a capital project. Pollution remediation obligations occur when any one of the following obligating events takes place: the Authority is in violation of a pollution prevention-related permit or license; an imminent threat to public health due to pollution exists; the Authority is named by a regulator as a responsible or potentially responsible party to participate in remediation; the Authority voluntarily commences or legally obligates itself to commence remediation efforts; or the Authority is named or there is evidence to indicate that it will be named in a lawsuit that compels participation in remediation activities.
Use of Management’s Estimates — The preparation of consolidated financial statements in conformity with accounting principles generally accepted in the United States of America requires management to make estimates and assumptions. These estimates and assumptions affect the reported amounts of assets and liabilities and disclosure of contingent assets and liabilities at the date of the consolidated financial
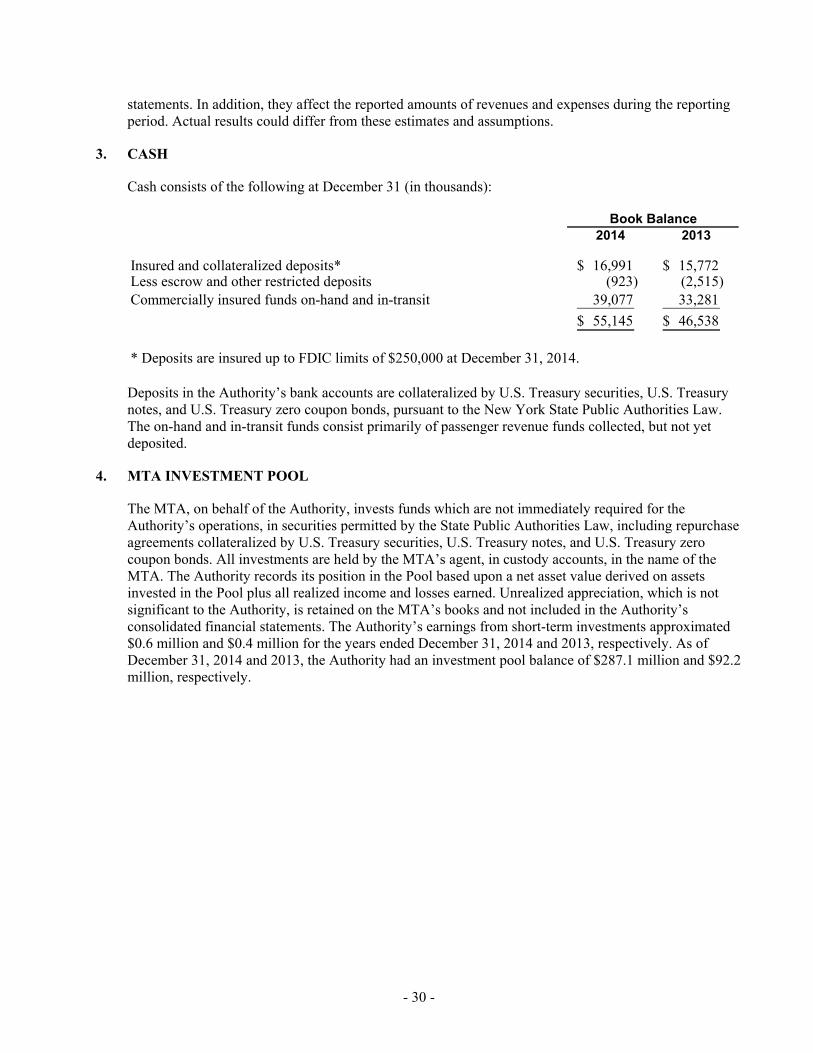
- 30 -
statements. In addition, they affect the reported amounts of revenues and expenses during the reporting period. Actual results could differ from these estimates and assumptions.
3. CASH
Cash consists of the following at December 31 (in thousands):
2014 2013
Insured and collateralized deposits* 16,991$ 15,772$ Less escrow and other restricted deposits (923) (2,515) Commercially insured funds on-hand and in-transit 39,077 33,281
55,145$ 46,538$
* Deposits are insured up to FDIC limits of $250,000 at December 31, 2014.
Book Balance
Deposits in the Authority’s bank accounts are collateralized by U.S. Treasury securities, U.S. Treasury notes, and U.S. Treasury zero coupon bonds, pursuant to the New York State Public Authorities Law. The on-hand and in-transit funds consist primarily of passenger revenue funds collected, but not yet deposited.
4. MTA INVESTMENT POOL
The MTA, on behalf of the Authority, invests funds which are not immediately required for the Authority’s operations, in securities permitted by the State Public Authorities Law, including repurchase agreements collateralized by U.S. Treasury securities, U.S. Treasury notes, and U.S. Treasury zero coupon bonds. All investments are held by the MTA’s agent, in custody accounts, in the name of the MTA. The Authority records its position in the Pool based upon a net asset value derived on assets invested in the Pool plus all realized income and losses earned. Unrealized appreciation, which is not significant to the Authority, is retained on the MTA’s books and not included in the Authority’s consolidated financial statements. The Authority’s earnings from short-term investments approximated $0.6 million and $0.4 million for the years ended December 31, 2014 and 2013, respectively. As of December 31, 2014 and 2013, the Authority had an investment pool balance of $287.1 million and $92.2 million, respectively.
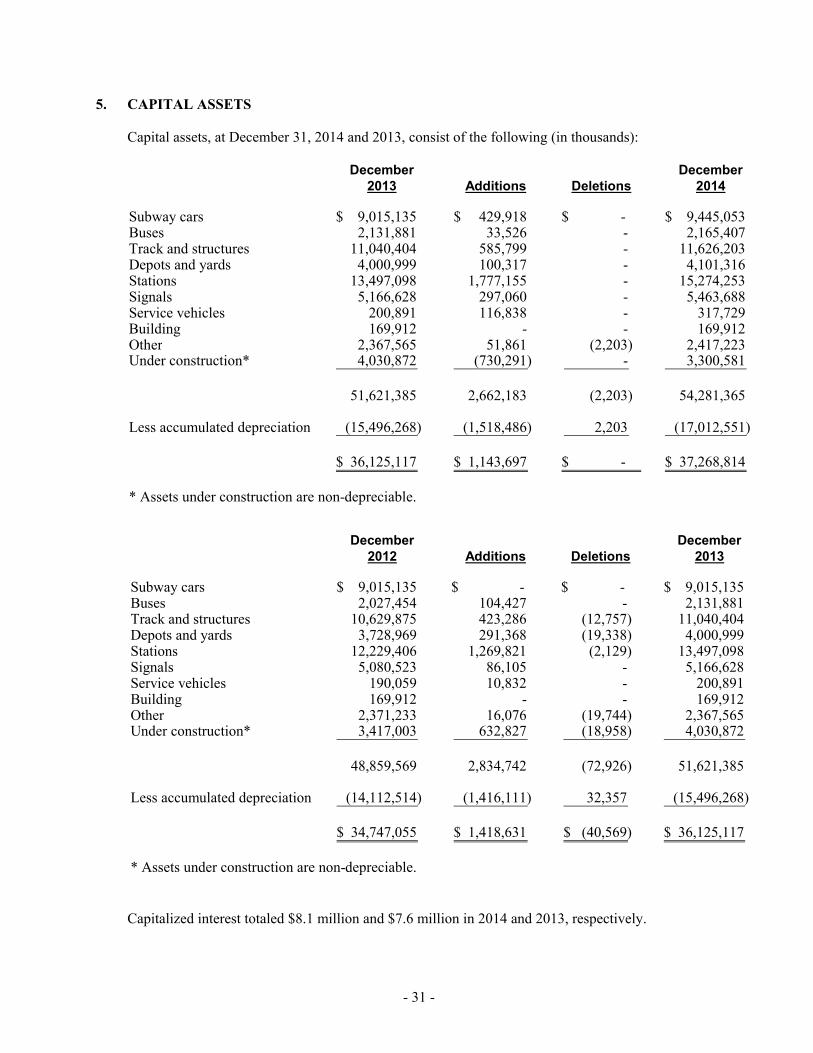
- 31 -
5. CAPITAL ASSETS
Capital assets, at December 31, 2014 and 2013, consist of the following (in thousands):
December December2013 Additions Deletions 2014
Subway cars 9,015,135$ 429,918$ -$ 9,445,053$ Buses 2,131,881 33,526 - 2,165,407 Track and structures 11,040,404 585,799 - 11,626,203 Depots and yards 4,000,999 100,317 - 4,101,316 Stations 13,497,098 1,777,155 - 15,274,253 Signals 5,166,628 297,060 - 5,463,688 Service vehicles 200,891 116,838 - 317,729 Building 169,912 - - 169,912 Other 2,367,565 51,861 (2,203) 2,417,223 Under construction* 4,030,872 (730,291) - 3,300,581
51,621,385 2,662,183 (2,203) 54,281,365
Less accumulated depreciation (15,496,268) (1,518,486) 2,203 (17,012,551)
36,125,117$ 1,143,697$ -$ 37,268,814$
* Assets under construction are non-depreciable.
December December2012 Additions Deletions 2013
Subway cars 9,015,135$ -$ -$ 9,015,135$ Buses 2,027,454 104,427 - 2,131,881 Track and structures 10,629,875 423,286 (12,757) 11,040,404 Depots and yards 3,728,969 291,368 (19,338) 4,000,999 Stations 12,229,406 1,269,821 (2,129) 13,497,098 Signals 5,080,523 86,105 - 5,166,628 Service vehicles 190,059 10,832 - 200,891 Building 169,912 - - 169,912 Other 2,371,233 16,076 (19,744) 2,367,565 Under construction* 3,417,003 632,827 (18,958) 4,030,872
48,859,569 2,834,742 (72,926) 51,621,385
Less accumulated depreciation (14,112,514) (1,416,111) 32,357 (15,496,268)
34,747,055$ 1,418,631$ (40,569)$ 36,125,117$
* Assets under construction are non-depreciable.
Capitalized interest totaled $8.1 million and $7.6 million in 2014 and 2013, respectively.
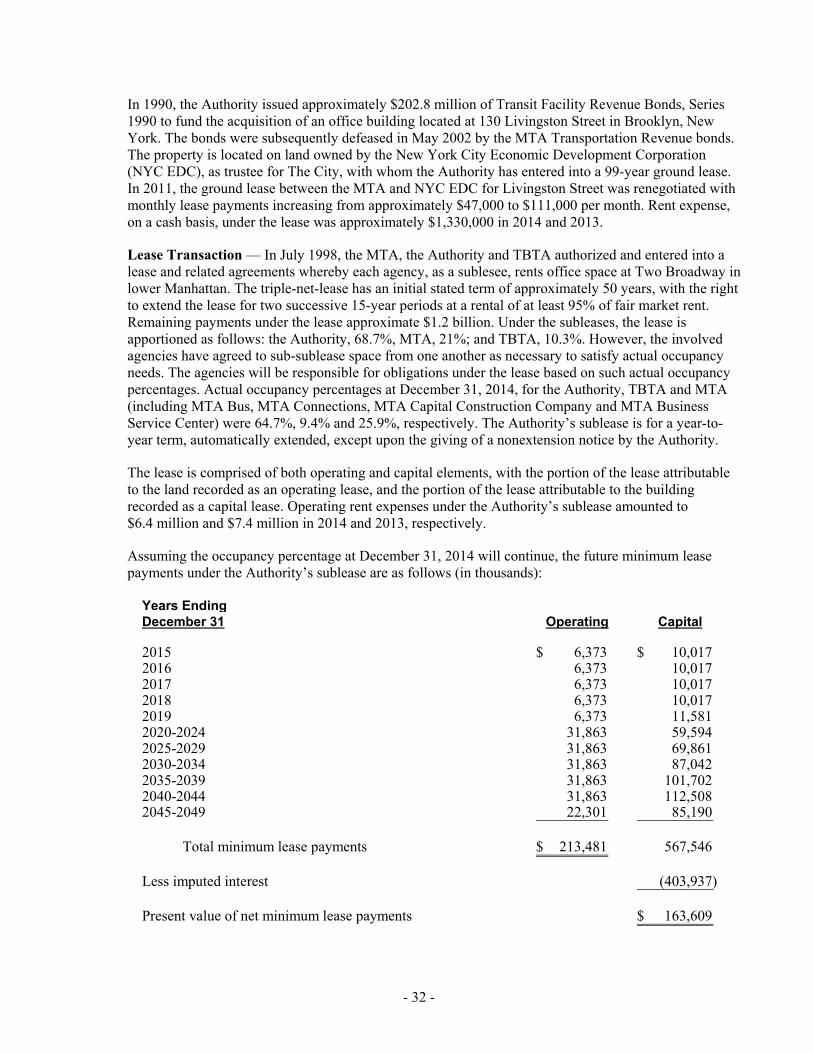
- 32 -
In 1990, the Authority issued approximately $202.8 million of Transit Facility Revenue Bonds, Series 1990 to fund the acquisition of an office building located at 130 Livingston Street in Brooklyn, New York. The bonds were subsequently defeased in May 2002 by the MTA Transportation Revenue bonds. The property is located on land owned by the New York City Economic Development Corporation (NYC EDC), as trustee for The City, with whom the Authority has entered into a 99-year ground lease. In 2011, the ground lease between the MTA and NYC EDC for Livingston Street was renegotiated with monthly lease payments increasing from approximately $47,000 to $111,000 per month. Rent expense, on a cash basis, under the lease was approximately $1,330,000 in 2014 and 2013.
Lease Transaction — In July 1998, the MTA, the Authority and TBTA authorized and entered into a lease and related agreements whereby each agency, as a sublesee, rents office space at Two Broadway in lower Manhattan. The triple-net-lease has an initial stated term of approximately 50 years, with the right to extend the lease for two successive 15-year periods at a rental of at least 95% of fair market rent. Remaining payments under the lease approximate $1.2 billion. Under the subleases, the lease is apportioned as follows: the Authority, 68.7%, MTA, 21%; and TBTA, 10.3%. However, the involved agencies have agreed to sub-sublease space from one another as necessary to satisfy actual occupancy needs. The agencies will be responsible for obligations under the lease based on such actual occupancy percentages. Actual occupancy percentages at December 31, 2014, for the Authority, TBTA and MTA (including MTA Bus, MTA Connections, MTA Capital Construction Company and MTA Business Service Center) were 64.7%, 9.4% and 25.9%, respectively. The Authority’s sublease is for a year-to-year term, automatically extended, except upon the giving of a nonextension notice by the Authority.
The lease is comprised of both operating and capital elements, with the portion of the lease attributable to the land recorded as an operating lease, and the portion of the lease attributable to the building recorded as a capital lease. Operating rent expenses under the Authority’s sublease amounted to $6.4 million and $7.4 million in 2014 and 2013, respectively.
Assuming the occupancy percentage at December 31, 2014 will continue, the future minimum lease payments under the Authority’s sublease are as follows (in thousands):
Years EndingDecember 31 Operating Capital
2015 6,373$ 10,017$ 2016 6,373 10,017 2017 6,373 10,017 2018 6,373 10,017 2019 6,373 11,581 2020-2024 31,863 59,594 2025-2029 31,863 69,861 2030-2034 31,863 87,042 2035-2039 31,863 101,702 2040-2044 31,863 112,508 2045-2049 22,301 85,190
Total minimum lease payments 213,481$ 567,546
Less imputed interest (403,937)
Present value of net minimum lease payments 163,609$
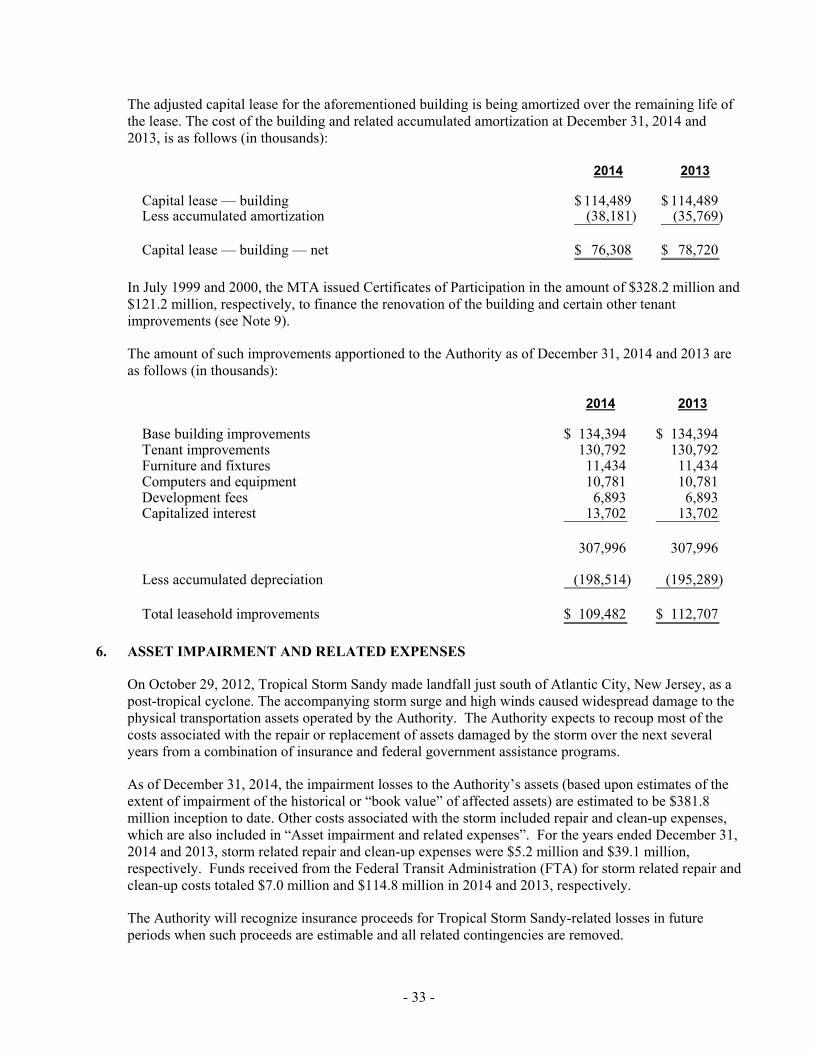
- 33 -
The adjusted capital lease for the aforementioned building is being amortized over the remaining life of the lease. The cost of the building and related accumulated amortization at December 31, 2014 and 2013, is as follows (in thousands):
2014 2013
Capital lease — building 114,489$ 114,489$Less accumulated amortization (38,181) (35,769)
Capital lease — building — net 76,308$ 78,720$
In July 1999 and 2000, the MTA issued Certificates of Participation in the amount of $328.2 million and $121.2 million, respectively, to finance the renovation of the building and certain other tenant improvements (see Note 9).
The amount of such improvements apportioned to the Authority as of December 31, 2014 and 2013 are as follows (in thousands):
2014 2013
Base building improvements 134,394$ 134,394$ Tenant improvements 130,792 130,792 Furniture and fixtures 11,434 11,434 Computers and equipment 10,781 10,781 Development fees 6,893 6,893 Capitalized interest 13,702 13,702
307,996 307,996
Less accumulated depreciation (198,514) (195,289)
Total leasehold improvements 109,482$ 112,707$
6. ASSET IMPAIRMENT AND RELATED EXPENSES
On October 29, 2012, Tropical Storm Sandy made landfall just south of Atlantic City, New Jersey, as a post-tropical cyclone. The accompanying storm surge and high winds caused widespread damage to the physical transportation assets operated by the Authority. The Authority expects to recoup most of the costs associated with the repair or replacement of assets damaged by the storm over the next several years from a combination of insurance and federal government assistance programs.
As of December 31, 2014, the impairment losses to the Authority’s assets (based upon estimates of the extent of impairment of the historical or “book value” of affected assets) are estimated to be $381.8 million inception to date. Other costs associated with the storm included repair and clean-up expenses, which are also included in “Asset impairment and related expenses”. For the years ended December 31, 2014 and 2013, storm related repair and clean-up expenses were $5.2 million and $39.1 million, respectively. Funds received from the Federal Transit Administration (FTA) for storm related repair and clean-up costs totaled $7.0 million and $114.8 million in 2014 and 2013, respectively.
The Authority will recognize insurance proceeds for Tropical Storm Sandy-related losses in future periods when such proceeds are estimable and all related contingencies are removed.
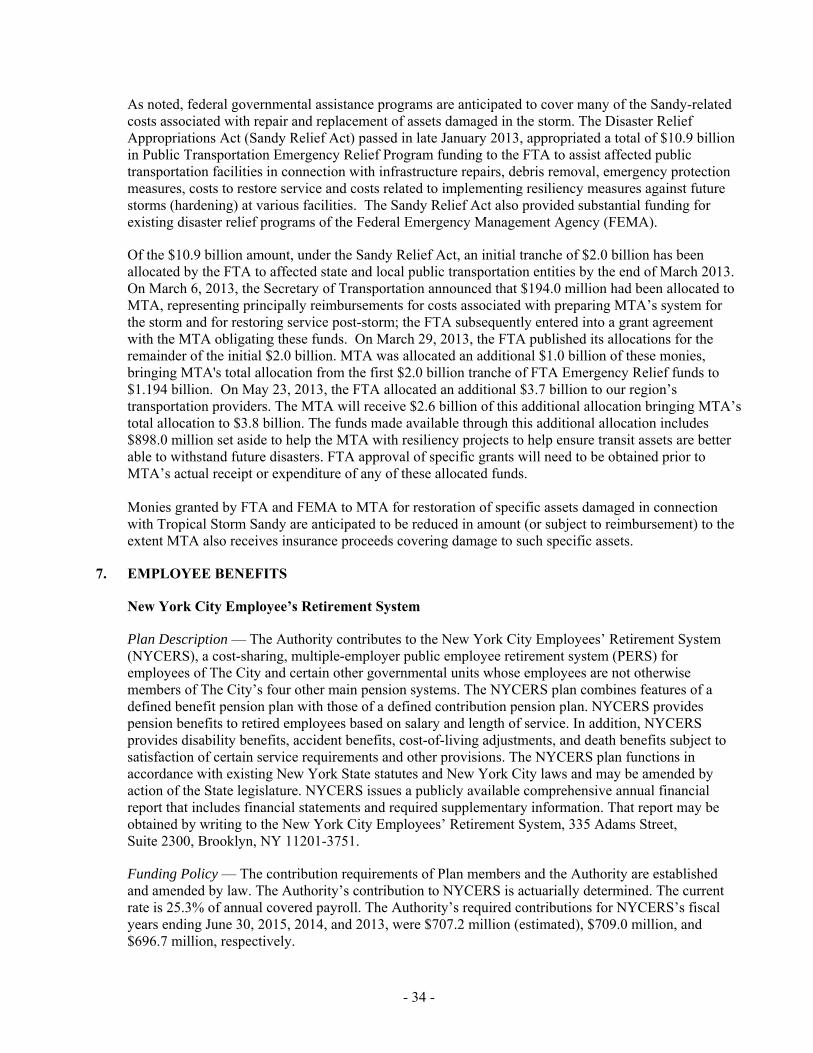
- 34 -
As noted, federal governmental assistance programs are anticipated to cover many of the Sandy-related costs associated with repair and replacement of assets damaged in the storm. The Disaster Relief Appropriations Act (Sandy Relief Act) passed in late January 2013, appropriated a total of $10.9 billion in Public Transportation Emergency Relief Program funding to the FTA to assist affected public transportation facilities in connection with infrastructure repairs, debris removal, emergency protection measures, costs to restore service and costs related to implementing resiliency measures against future storms (hardening) at various facilities. The Sandy Relief Act also provided substantial funding for existing disaster relief programs of the Federal Emergency Management Agency (FEMA).
Of the $10.9 billion amount, under the Sandy Relief Act, an initial tranche of $2.0 billion has been allocated by the FTA to affected state and local public transportation entities by the end of March 2013. On March 6, 2013, the Secretary of Transportation announced that $194.0 million had been allocated to MTA, representing principally reimbursements for costs associated with preparing MTA’s system for the storm and for restoring service post-storm; the FTA subsequently entered into a grant agreement with the MTA obligating these funds. On March 29, 2013, the FTA published its allocations for the remainder of the initial $2.0 billion. MTA was allocated an additional $1.0 billion of these monies, bringing MTA's total allocation from the first $2.0 billion tranche of FTA Emergency Relief funds to $1.194 billion. On May 23, 2013, the FTA allocated an additional $3.7 billion to our region’s transportation providers. The MTA will receive $2.6 billion of this additional allocation bringing MTA’s total allocation to $3.8 billion. The funds made available through this additional allocation includes $898.0 million set aside to help the MTA with resiliency projects to help ensure transit assets are better able to withstand future disasters. FTA approval of specific grants will need to be obtained prior to MTA’s actual receipt or expenditure of any of these allocated funds.
Monies granted by FTA and FEMA to MTA for restoration of specific assets damaged in connection with Tropical Storm Sandy are anticipated to be reduced in amount (or subject to reimbursement) to the extent MTA also receives insurance proceeds covering damage to such specific assets.
7. EMPLOYEE BENEFITS
New York City Employee’s Retirement System
Plan Description — The Authority contributes to the New York City Employees’ Retirement System (NYCERS), a cost-sharing, multiple-employer public employee retirement system (PERS) for employees of The City and certain other governmental units whose employees are not otherwise members of The City’s four other main pension systems. The NYCERS plan combines features of a defined benefit pension plan with those of a defined contribution pension plan. NYCERS provides pension benefits to retired employees based on salary and length of service. In addition, NYCERS provides disability benefits, accident benefits, cost-of-living adjustments, and death benefits subject to satisfaction of certain service requirements and other provisions. The NYCERS plan functions in accordance with existing New York State statutes and New York City laws and may be amended by action of the State legislature. NYCERS issues a publicly available comprehensive annual financial report that includes financial statements and required supplementary information. That report may be obtained by writing to the New York City Employees’ Retirement System, 335 Adams Street, Suite 2300, Brooklyn, NY 11201-3751.
Funding Policy — The contribution requirements of Plan members and the Authority are established and amended by law. The Authority’s contribution to NYCERS is actuarially determined. The current rate is 25.3% of annual covered payroll. The Authority’s required contributions for NYCERS’s fiscal years ending June 30, 2015, 2014, and 2013, were $707.2 million (estimated), $709.0 million, and $696.7 million, respectively.
- 35 -
For most Transit Authority employees hired prior to July 27, 1976, NYCERS is noncontributory. Certain employees who entered qualifying service after July 27, 1976, commonly referred to as Tier 4, contribute 3% of their salary (see Chapter 10 and 126 of the Laws of 2000 below).
55/25 and Age 57 Pension Elections — In 1994, hourly employees and certain operating supervisors participating in the NYCERS plan were given the opportunity to elect the Transit 55/25 option, which enabled such employees to become eligible for pension benefits upon reaching 25 years of service and at least 55 years of age. Employees hired after July 26, 1994, in the above titles are mandated into the Transit 55/25 option. All participants were required to make an additional employee contribution of 2.3%.
In 1995, managerial employees and certain other employees participating in the NYCERS plan were given the opportunity to elect a 25 Year Early Retirement plan, which enabled such employees to become eligible for pension benefits upon reaching 25 years of service and at least 55 years of age. Managerial and certain other employees entering after June 28, 1995, were mandated into the Age 57 option. Legislation finalized in 2000 changed the 57/10 plan to allow service retirement after age 57 and completion of five years of service (five-year vesting). Employees electing these options must contribute an additional 2.85% of their gross salary.
Legislation passed in 1999 enabled elective participants in the Transit 55/25 and the 25 Year Early Retirement plans who, by age 62 would not have 25 years of allowable service with the Authority, to withdraw from the applicable plan and revert back to their previous plan.
Amendments enacted by State legislation in 2000 reflect the more recent significant changes to the plan and are summarized as follows:
For operating employees (Chapter 10 of the Laws of 2000):
• All operating employees are automatically included in the Transit 55/25 plan, except those who are in the age 57 plan who elect to remain in that plan.
• Elimination of the 2.3% additional employees contributions applicable to members of the Transit 55/25 plan.
• Reduction in the Tier 3 and 4 employee contribution rate from 3.0% to 2.0%.
For nonoperating employees (Chapter 126 of the Laws of 2000):
• Vesting under the Age 57 plan requires only five years of service.
• As of October 1, 2000, regular Tier 3 and 4 employee contributions cease after the completion of ten years of credited service.
For retired members (Chapter 125 of the Laws of 2000):
- 36 -
• Automatic COLAs. The COLAs apply to retired members as follows:
Retired or ReceivingRetirees at Least Age Benefits for at Least
62 5 years65 10Disabled retirees 5Accidental death beneficiaries 5
• Initial COLA payable September 30, 2000 based on the first $18,000 of the maximum retirement allowance.
• Thereafter, annual COLAs of 50% of the increase in the consumer price index (CPI), but not less than 1% or more than 3% of the first $18,000 of maximum retirement allowance will be payable.
These benefit enhancements, as well as the automatic COLA for retirees, were reflected in the actuarial valuation beginning with the June 30, 2000 valuation.
The Plan adopted several amendments during 2002 as a result of State legislation. Amendments include changes to the definition of active service for Tier 1 and Tier 2 members, extension of the phase in period from five years to ten years for funding liabilities created by the benefits provided by Chapter 125 of the Laws of 2000 and increases in accidental disability benefits for Tier 3 and Tier 4 members.
During 2006, pursuant to legislative amendment, the NYCERS Plan enacted significant changes in actuarial assumptions used to determine employer contributions. The more salient changes were the adoption of new demographic assumptions, the actuarial asset valuation method changed from a five-year moving average to six-year, which had the effect of smoothing 2001-2003 investment losses, and the shortening of the amortization period for the 2000 COLA. In addition, the One-Year Lag Methodology was adopted, which used June 30, 2004, payroll data to determine the June 30, 2006, employer contribution.
In September 2006 and June 2007, pursuant to legislation (Chapter 734 of the Laws of 2006 and Chapter 379 of the Laws of 2007), current and former members of the ATU 726/1056 and the TWU Local 100, respectively, who had an accumulated balance of additional member contributions (AMC) made in accordance with the NYC Transit 55/25 Plan enacted in 1994, were allowed to apply for a refund of such contributions. Beginning in the first quarter of 2008, current and former members of the TSO Local 106 were also allowed to receive a refund of their additional member contributions. Refunds of employee contributions from the Transit 55/25 Plan amounted to approximately $139.6 million through December 31, 2014.
In March 2012, pursuant to Chapter 18 of the Laws of 2012, individuals joining NYCERS or the MaBSTOA Pension Plan on or after April 1, 2012 will be subject to the provisions of Tier VI. The highlights of Tier VI include:
• Increases in employee contribution rates. The rate varies depending on salary, ranging from 3% to 6% of gross wages. Contributions are made until retirement or separation from service.
• The retirement age increase to 63 and includes early retirement penalties, which reduce pension allowances by 6.5 percent for each year of retirement prior to age 63.
- 37 -
• Vesting after 10 years of credited service; increased from 5 years of credited service under Tier III and Tier IV.
• Adjustments of the Pension Multiplier for calculating pension benefits (excluding Transit Operating Employees): the multiplier will be 1.75 percent for the first 20 years of service, and 2 percent starting in the 21st year; for an employee who works 30 years, their pension will be 55 percent of final average salary under Tier VI, instead of 60 percent under Tier IV.
• Adjustments to the Final Average Salary (FAS) Calculation: the computation changed from an average of the final 3 years to an average of the final 5 years. Pensionable overtime will be capped at $15,000 per year plus an inflation factor.
• Pension buyback in Tier VI will be at a rate of 6% of the wages earned during the period of buyback, plus 5% compounded annually from the date of service until date of payment.
Pursuant to Chapter 3 of the Laws of 2013, various actuarial assumptions and methods were adopted as a result of the NYCERS February 2012 Experience Study. Major provisions include:
• The Actuarial Interest Rate used by the Actuary to calculate employer contributions was reduced to 7% (previously 8%) until June 30, 2016;
• The interest rate for Tier III, IV and VI pension loans was reduced to 6% effective July 1, 2011;
• The Funding Method used by the Actuary to calculate employer contributions was changed from the Frozen Initial Liability Method to the Entry Age Cost Method, a method generally predicated on funding benefits over members’ working lifetimes.
- 38 -
Actuarial Assumptions — The more significant actuarial assumptions and methods used in the calculation of employer contributions to NYCERS for the plan’s fiscal years ended June 30, 2014 and 2013, are as follows:
Valuation Dates June 30, 2012 (Lag)(1) June 30, 2011 (Lag)(1)
Actuarial cost method Entry age Entry age
Amortization method for Unfunded Actuarial Accrued Liabilities (UAAL) Initial Unfunded Increasing dollar Increasing dollar Post-2010 Unfundeds Level dollar Level dollar Remaining amortization period Initial Unfunded 20-years for reestablished UAAL 21-years for reestablished UAAL Post-2010 Unfundeds None None
Actuarial Asset Valuation Method (AAVM) Modified six-year moving average Modified six-year moving average of market values with a "Market of market values with a "Market Value Restart" as of June 30, 2011. Value Restart" as of June 30, 2011. The June 30, 2010 AAVM is The June 30, 2010 AAVM is defined to recognize Fiscal year defined to recognize Fiscal year 2011 investment performance. 2011 investment performance.
Assumed rate of return on investments 7.0% per annum,(2) 7.0% per annum,(2)
net of investment expenses net of investment expenses
Postretirement mortality Tables adopted by Board of Tables adopted by Board of Trustees during Fiscal Year 2012. Trustees during Fiscal Year 2012.
Active service, withdrawal, death, disability, Tables adopted by Board of Tables adopted by Board of service retirement Trustees during Fiscal Year 2012. Trustees during Fiscal Year 2012.
Salary increases In general, merit and promotion In general, merit and promotion increases plus assumed general increases plus assumed general wage increase of 3.0% wage increase of 3.0%
per annum(2) per annum(2)
Cost-of-living adjustments(2) 1.5% per annum for Tier 1, Tier 2 and Tier 4.2.5% per annum for Tier 3.
1.5% per annum for Tier 1, Tier 2 and Tier 4.2.5% per annum for Tier 3.
(1) Under the One-Year Lag Methodology, the actuarial valuation determines the employer contribution for the second following fiscal year (June 30, 2012 valuation data used for fiscal year June 30, 2014 contribution).(2) Developed assuming a long-term consumer price inflation assumption of 2.5% per year.
NYCERS adopted GASB Statement No. 67, Financial Reporting for Pension Plans, for the year ended June 30, 2014. As a result, modifications were made to certain actuarial assumptions used in determining the total pension liability in order to conform with the provisions of GASB Statement No. 67. Such changes included the determination of projected benefit payments, the use of a single discount rate, and the sole use of the entry age actuarial cost method. The Authority’s required contribution for the year ended June 30, 2014 was not affected by the adoption of GASB Statement No. 67.
- 39 -
Manhattan and Bronx Surface Transit Operating Authority
Plan Description — The Authority contributes to the Manhattan and Bronx Surface Transit Operating Authority (MaBSTOA) Plan, a single employer governmental retirement plan. MaBSTOA provides retirement, disability, and death benefits to plan members and beneficiaries which are similar to those benefits provided by NYCERS to similarly situated Transit Authority employees. Article 12.08 of the MaBSTOA Plan assigns the authority to establish and amend the benefit provisions to the MaBSTOA Board. MaBSTOA issues a publicly available financial report that includes financial statements and required supplementary information for the plan. That report may be obtained by writing to MaBSTOA Pension Plan, New York City Transit Authority, Operations Accounting, 2 Broadway, 10th Floor, New York, NY 10004.
Funding Policy — The contribution requirements of plan members are established and may be amended only by the MaBSTOA Board in accordance with Article 10.01 of the MaBSTOA Plan. MaBSTOA’s funding policy for periodic employer contributions is to provide for actuarially determined amounts that are designed to accumulate sufficient assets to pay benefits when due. It is MaBSTOA’s policy to fund, at a minimum, the current year’s normal pension cost plus amortization of the unfunded actuarial accrued liability.
The Authority’s contributions to the MaBSTOA Plan for the years ended December 31, 2014, 2013, and 2012, were $226.4 million, $234.5 million, and $228.9 million, respectively, equal to the annual required contributions for each year. During 2006, the Authority made additional contributions totaling $100.3 million to the Plan. The $100.3 million in contributions had the effect of reducing the net pension obligation of $54.9 million at December 31, 2005, to zero and recognizing a deferred pension asset of $47.5 million at December 31, 2006. The amortized value of this deferred pension asset was $33.8 million at December 31, 2014.
For employees, the Plan has both contributory and noncontributory requirements depending on the date of entry into service. Employees entering qualifying service on or before July 26, 1976, are non-contributing (Tiers 1 and 2). Certain employees entering qualifying service on or after July 27, 1976, are required to contribute 3% of their salary (Tiers 3 and 4). See 2000 Plan amendments.
The MaBSTOA Pension Plan includes the Tier III and IV 62/5 Plan, Transit 55/25 Plan, the 25 Year Early Retirement Plan, the Age 57/5 Plan, and the 2000 amendments under the same terms and conditions as NYCERS. In addition, Tier VI was adopted for members hired on or after April 1, 2012.
The MaBSTOA Plan also adopted the legislative provisions of Chapter 379 regarding the refunding of additional member contributions for certain TWU Local 100 and TSO Local 106 employees. Refunds of employee contributions from Plan assets amounted to approximately $0.4 million, $0.7 million, and $0.5 million in 2014, 2013, and 2012, respectively. Inception to date gross refunds of employee contributions amounted to approximately $23.6 million through December 31, 2014.
In a recent development, NYCERS had determined that the Tier IV segment of operating employees are and have been eligible for a post retirement death benefit retroactive to 1986. Since NYCERS has implemented this change as to applicable Transit Authority employees, the MaBSTOA Plan, which is patterned after the NYCERS Plan, was amended during 2012 to provide the same death benefits. This postretirement death benefits provision increased the unfunded actuarial accrual liability by approximately $5.6 million and the employer contribution payable at December 31, 2012 by $11.0 million. Total postretirement death benefits paid during 2014 and 2013 were $4.4 million and $1.4 million, respectively.
- 40 -
The cost of additional benefit enhancements to the Plan will be funded by an increase in the employer’s normal contribution rate.
Annual Pension Cost and Net Pension (Asset) Obligation — The Authority’s annual pension cost and net pension (asset) obligation for MaBSTOA for the years ended December 31, 2014 and 2013, were as follows (in thousands):
2014 2013
Annual required contribution 226,374$ 234,474$ Interest on net pension asset (2,489) (2,618) Adjustment to annual required contribution 4,267 4,462
Annual pension cost 228,152 236,318
Contributions made (226,374) (234,474)
Decrease in net pension asset 1,778 1,844
Net pension asset — beginning of year (35,560) (37,404)
Net pension asset — end of year (33,782)$ (35,560)$
The Authority’s annual pension cost, the percentage of annual pension cost contributed, and the net pension asset for the current year and each of the two preceding years (in thousands):
Annual Percentage ofPension Cost APC Net Pension
Year Ending (APC) Contributed Asset
12/31/2014 228,152$ 99.2 % (33,782)$12/31/2013 236,318 99.2 (35,560) 12/31/2012 230,800 99.2 (37,404)
The Authority’s funding progress information as of December 31, 2014, is as follows (in millions):
ActuarialAccrued (UAAL)Liability As a
Actuarial Actuarial (AAL) Unfunded PercentageValuation Value of Initial Entry (AAL) Funded Covered of CoveredDate Assets Age (UAAL) Ratio Payroll Payroll
(a) (b) (b-a) (a/b) (c) ((b-a)/c)
1/1/14 2,028.0$ 2,892.6$ 864.6$ 70.11 % 616.4$ 140.3 %
The schedule of funding progress, presented as Required Supplementary Information (RSI) following the notes to the consolidated financial statements, present multiyear trend information about whether the actuarial value of plan assets are increasing or decreasing over time relative to the actuarial accrued liability for benefits.
- 41 -
Actuarial Assumptions — There were no changes to the January 1, 2014 actuarial valuation from the prior year.
The January 1, 2013 valuation reflects the adoption by the Authority of the January 1, 2006 – December 31, 2011 Experience Study. The experience study modified demographic assumptions such as the rates of withdrawal, retirement and disability as well as economic assumptions such as the salary increase and cost-of-living assumptions to better reflect anticipated experience.
In addition, the interest rate assumption was reduced from 7.5% on a gross basis to 7% on a net basis, as the explicit investment expense assumption was eliminated and assumed to be covered by investment income.
These changes increased the unfunded actuarial accrued liability by $142.5 million, which is being amortized over 10 years. The employer contribution payable increased by $20.2 million as of December 31, 2013.
The January 1, 2012 valuation reflected a change to the interest rate assumption from 8% to 7.5% as well as modifications to the postretirement mortality assumption to assume longer life expectancies for members who retire with a service retirement and their beneficiaries. These changes increased the unfunded actuarial accrued liability by $205.6 million, which is being amortized over 10 years, and the employer contribution payable December 31, 2012 by $30.0 million.
- 42 -
The more significant actuarial assumptions and methods used in the calculation of employer contributions to the MaBSTOA Plan for the years ended December 31, 2014 and 2013, are as follows:
Valuation Dates January 1, 2014 January 1, 2013
Actuarial cost method Frozen initial liability(1) Frozen initial liability(1)
Amortization method for UAAL 30-year level dollar 30-year level dollar
Period closed or open Closed Closed
Actuarial asset valuation Market value restart as of 1/1/96, then Market value restart as of 1/1/96, then method five-year moving average of five-year moving average of
market values market values
Interest rate 7.0% per annum(2), net of expenses 7.0% per annum(2), net of expenses
Provision for expenses Two-year average of administrative Two-year average of administrative charges added to the normal cost charges added to the normal cost
Deaths after retirement Tables based on recent experience Tables based on recent experience
Separations other than for normal retirement Tables based on recent experience Tables based on recent experience
Rates of normal retirement Tables based on recent experience Tables based on recent experience
Salary increases In general, merit and promotion increases In general, merit and promotion increases plus assumed general wage increases of plus assumed general wage increases of 3.5% to 15.0% for operating employees 3.5% to 15.0% for operating employees and 4.0% to 7.0% for nonoperating and 4.0% to 7.0% for nonoperating employees per year, depending on employees per year, depending on years of service years of service
Overtime Except for managerial employees, Except for managerial employees, 8.5% of base salary for operating 8.5% of base salary for operating employees and 2.0% of base salary for employees and 2.0% of base salary for nonoperating employees, with nonoperating employees, with different assumptions used in the year different assumptions used in the year before retirement before retirement
Cost-of-living adjustments 1.375% per annum(2) 1.375% per annum(2)
(1) Under this actuarial method, the initial liability has been established by the Entry Age Actuarial Cost Method, but with not less than zero.(2) Assumes a long-term consumer price inflation assumption of 2.5% per annum.
Deferred Compensation Plans — As permitted by Internal Revenue Code Section 457, the Authority has established a trust or custodial account to hold plan assets for the exclusive use of the participants and their beneficiaries. Plan assets and liabilities are not reflected on the Authority’s consolidated statements of net position.
Certain Authority employees are participants in a second deferred compensation plan established in accordance with Internal Revenue Code Section 401(k). Participation in the plan is available to all nonunion and certain other employees. All amounts of compensation deferred under the plan, and all income attributable to such compensation, are solely the property of the participants; accordingly, this plan is not reflected in the accompanying consolidated statements of net position. The Authority is not require to contribute to the plan.
- 43 -
8. OTHER POSTEMPLOYMENT BENEFITS
The Authority has implemented GASB Statement No. 45, Accounting and Financial Reporting for Employers for Postemployment Benefits Other Than Pensions (GASB 45). This Statement establishes the standards for the measurement, recognition, and display of Other Postemployment Benefits (OPEB) expense/expenditures and related liabilities (assets), note disclosures, and, if applicable, required supplementary information (RSI) in the financial reports of state and local governmental employers.
Postemployment benefits are part of an exchange of salaries and benefits for employee services rendered. Most OPEB have been funded on a pay-as-you-go basis and have been reported in financial statements when the promised benefits are paid. GASB 45 requires state and local government’s financial reports to reflect systematic, accrual-basis measurement and recognition of OPEB cost (expense) over a period that approximates employees’ years of service and provides information about actuarial accrued liabilities associated with the OPEB and to what extent progress is being made in funding the plan.
Plan Description — The benefits provided by the Authority include medical, pharmacy, dental, vision and life insurance, plus monthly supplements for Medicare Part B or Medicare supplemental plan reimbursement and welfare fund contributions. The different types of benefits provided vary by employee type (represented employees versus management). All benefits are provided upon retirement as stated in the applicable pension plan (NYCERS and the MaBSTOA Plan). The Authority provides benefits to some members if terminated within 5 years of attaining retirement eligibility.
The Authority participates in the New York State Health Insurance Program (NYSHIP) to provide medical and prescription drug benefits, including Medicare Part B reimbursements to many of its members. NYSHIP provides a PPO plan and several HMO plans. Represented and other New York City Transit employees who retired prior to January 1, 1996 or January 1, 2001, do not participate in NYSHIP. These benefits are provided either through a self-insured health plan, a fully insured or an HMO.
The Authority is a participating employer in NYSHIP. The NYSHIP financial report can be obtained by writing to NYS Department of Civil Services, Employee Benefits Division, Alfred E. Smith Office Building, 805 Swan Street, Albany, NY 12239.
In 2003 and as a result of collective bargaining agreements, the Authority assumed responsibility for directly providing health care benefits to TWU retirees or their beneficiaries, rather than via the TWU Health & Welfare Trust Fund. In 2005, the Authority also began to administer health care benefits for ATU Local 1056 and Local 726 retirees or their beneficiaries as their respective health and welfare trust funds were dissolved.
GASB 45 requires employers to perform periodic actuarial valuations to determine annual accounting costs, and to keep a running tally of the extent to which these amounts are over or under funded. The valuation must be performed at least biennially. The most recent biennial valuation was performed for the year ended December 31, 2013 and was performed with a valuation date of January 1, 2012. The total number of plan participants as of December 31, 2014 receiving retirement benefits was 28,765.
During 2012, MTA funded $250 million into a Trust allocated between Headquarters and New York City Transit. In addition, $50 million was funded during 2013 allocated between Long Island Railroad and Metro-North Railroad. No Trust contributions were made in 2014. Under GASB 45, the discount rate is based on the assets in a trust, the assets of the employer or a blend of the two based on the anticipated funding levels of the employer. For this valuation, the discount rate reflects a blend of Trust assets and employer assets. The assumed return on Trust assets is 6.5% whereas the assumed return on employer assets is 3.5% resulting in a discount rate under GASB 45 of 3.75%, which is slightly lower than the discount rate of 4% used in the prior valuation. This decrease is primarily due to the decrease in
- 44 -
Treasury yields and thus, returns on employer assets since the prior valuation. The Authority’s transfer to the Trust fund inception to date is $162.5 million. In determining the Actuarial Value of Assets, these amounts were discounted to the valuation date at the interest rate assumption. These assets decreased the Authority’s normal cost by approximately $15.3 million.
Annual OPEB Cost (AOC) and Net OPEB Obligation — The Authority’s annual OPEB cost (expense) represents the accrued cost for postemployment benefits under GASB 45. Currently, the Authority expenses the actual benefits paid during a year. The cumulative difference between the annual OPEB cost (new method) and the benefits paid during a year (old method) will result in a net OPEB obligation (the Net OPEB Obligation), included on the consolidated statements of net position. The annual OPEB cost is equal to the annual required contribution (the ARC) less adjustments if a Net OPEB Obligation exists and plus the interest on Net OPEB Obligation. The ARC is equal to the normal cost plus an amortization of the unfunded liability.
Actuarial Cost, Amortization Methods and Assumptions — For determining the ARC, the Authority has chosen to use the Frozen Initial Liability (the FIL Cost Method) cost method, one of the cost methods in accordance with the parameters of GASB 45. The initial liability is amortized over a 22-year period. The remaining amortization period at December 31, 2014, is 15 years.
In order to recognize the liability over an employee’s career, an actuarial cost method divides the present value into three pieces: the part that is attributed to past years (the Accrued Liability or Past Service Liability), the part that is being earned this year (the Normal Cost), and the part that will be earned in future years (the Future Service Liability). Under the FIL Cost Method, an initial past service liability is determined based on the Entry Age Normal (EAN) Cost Method and is amortized separately. This method determines the past service liability for each individual based on a level percent of pay. The Future Service Liability is allocated based on the present value of future compensation for all members combined to determine the Normal Cost. In future years, actuarial gains/losses will be incorporated into the Future Service Liability and amortized through the Normal Cost.
The Frozen Unfunded Accrued Liability is determined each year as the Frozen Unfunded Accrued Liability for the prior year, increased with interest, reduced by the end-of-year amortization payment and increased or decreased by any new bases established for the current year.
The difference between the Actuarial Present Value of Benefits and the Frozen Unfunded Accrued Liability equals the Present Value of Future Normal Cost. The Normal Cost equals the Present Value of Future Normal Cost divided by the present value of future compensation and multiplied by the total of current compensation for members less than certain retirement age.
The ARC is equal to the sum of the Normal Cost and the amortization for the Frozen Unfunded Accrued Liability with appropriate interest adjustments. Any difference between the ARC and actual plan contributions from the prior year are considered an actuarial gain/loss and thus, are included in the development of the Normal Cost. This methodology differs from the approach used for the pension plan where the difference between the ARC and actual plan contributions from the prior year, if any, will increase or decrease the Frozen Unfunded Accrued Liability and will be reflected in future amortization payments. A different approach was applied to the OPEB benefits because these benefits are not actuarially funded.
Valuation Date — The valuation date is the date that all participant and other pertinent information is collected and liabilities are measured. This date may not be more than 24 months prior to the beginning of the fiscal year. The valuation date for this valuation is January 1, 2012 which is 24 months prior to the
- 45 -
beginning of the 2014 fiscal year. Census data for the next full valuation will be based on a valuation date of January 1, 2014.
Inflation Rate — 2.5% per annum compounded annually.
Discount Rate — GASB 45 provides guidance to employers in selecting the discount rate. The discount rate should be based on the estimated long-term investment yield on the investments that are expected to be used to finance the benefits. If there are no plan assets, assets of the employer should be used to derive the discount rate. This would most likely result in a lower discount rate and thus, liabilities significantly higher than if the benefits are prefunded. In recognition of the decrease in short-term investment yields partially offset by the establishment of a trust, the discount rate for this valuation has been lowered from 4.0% to 3.75%.
Healthcare Reform — The valuation reflects the actuaries understanding of the impact in future health costs due to the Affordable Care Act (ACA) passed into law in March 2010. An excise tax for high cost health coverage or “Cadillac” health plans was included in ACA. The provision levies a 40% tax on the value of health plan costs that exceed certain thresholds for single coverage or family coverage. If, between 2010 and 2018, the cost of health care insurance rises more than 55%, the threshold for the excise tax will be adjusted. Also included in ACA are various fees (including, but not limited to, the Patient-Centered Outcomes Research Institute fee, Transitional Reinsurance Program fee, and the Health Insurer fee) associated with the initiation of health exchanges in 2014. The OPEB-specific actuarial assumptions used in the most recent biennial valuations are as follows:
Valuation date January 1, 2012Actuarial cost method Frozen Initial LiabilityDiscount rate 3.75%Price inflation 2.5% per annum, compounded annuallyPer-Capita retiree contributions *Amortization method Frozen Initial LiabilityAmortization period 15 yearsPeriod closed or open Closed
* In general, all coverages are paid for by the Authority.
Actuarial valuation involve estimates of the value of reported amounts and assumptions about the probability of events far into the future, and that actuarially determined amounts are subject to continual revision as actual results are compared to past expectations and new estimates are made about the future.
Per Capita Claim Costs (PCCC) — Use of a blended premium rate for active employees and retirees under age 65 is a common practice. Health costs generally increase with age, so the blended premium rate is higher than the true underlying cost for actives and the blended premium is lower than the true underlying cost for retirees. For retirees, this difference is called the implicit rate subsidy. Since GASB 45 only requires an actuarial valuation for retirees, it requires the plan sponsor to determine the costs of these benefits by removing the subsidy. However, a plan sponsor may use the premiums without adjustment for age if the employer participates in a community-rated plan, in which the premium rates reflect projected health claims experience of all participating employers, or if the insurer would offer the same premium rate if only non-Medicare-eligible retirees were covered.
Based on a 2006 report from the Department of Civil Service of the State of New York regarding recommended actuarial assumptions used for New York State/SUNY’s GASB 45 valuation sent to all participating employers, it stated that the Empire Plan of NYSHIP is community-rated for all
- 46 -
participating employers. Each MTA Agency participating in NYSHIP is no more than approximately 1%, and in total, the MTA is approximately 3% of the total NYSHIP population. Thus, we believe that the actual experience of the MTA will have little or no impact on the actual premium and, that it is reasonable to use the premium rates without age adjustments as the per capita claims cost.
The medical and pharmacy benefits provided to TWU Local 100, ATU 1056 and ATU 726 represented Transit members are self-insured as well as some Pre-NYSHIP Transit members. For these benefits, we developed per capita claims cost relativity factors that varied by benefit, age and gender for retirees of the TWU Local 100, ATU Local 726 and ATU Local 1056 unions for 2012. These were then combined to match the aggregate claim experience provided by the Authority and MTA. Claims were increased by an incurred versus paid claim adjustment of 2.7% for health benefits and (0.3)% for pharmacy benefits. Finally, an administrative load was applied equal to 5.8% for Empire BCBS medical benefits, 3.8% for United Healthcare medical benefits and 0.6% for pharmacy benefits.
The following charts detail the monthly 2012 PCCCs used in the valuation:
Empire Blue Empire BlueCross / United Cross / United
Blue Shield Healthcare Pharmacy Blue Shield Healthcare Pharmacy
Age
30–34 $481.70 $921.70 $141.22 $633.31 $1,211.79 $158.7035–39 697.73 1,335.04 243.03 812.97 1,555.54 242.67 40–44 825.11 1,578.78 290.18 853.83 1,633.73 299.31 45–49 666.26 1,274.83 243.63 717.19 1,372.28 280.55 50–54 607.73 1,162.84 213.80 638.21 1,221.16 269.44 55–59 717.11 1,372.12 241.25 659.79 1,262.45 298.08 60–64 840.40 1,608.02 263.29 746.74 1,428.81 312.32 65–69 117.36 N/A 292.93 117.42 N/A 296.48 70–74 146.33 N/A 309.94 140.45 N/A 317.82 75–79 179.85 N/A 315.56 165.16 N/A 330.96 80–84 207.25 N/A 318.11 187.84 N/A 337.91 85+ 239.19 N/A 311.64 216.39 N/A 332.93
30–34 $255.72 $489.29 $74.97 $350.22 $670.12 $87.7635–39 301.98 577.82 105.18 382.82 732.50 114.27 40–44 359.62 688.11 126.47 426.70 816.44 149.58 45–49 407.91 780.49 149.16 465.67 891.02 182.16 50–54 479.38 917.25 168.64 518.28 991.69 218.81 55–59 575.69 1,101.54 193.67 567.95 1,086.72 256.58 60–64 749.46 1,434.02 234.80 688.17 1,316.75 287.82 65–69 117.36 N/A 292.93 117.42 N/A 296.48 70–74 146.33 N/A 309.94 140.45 N/A 317.82 75–79 179.85 N/A 315.56 165.16 N/A 330.96 80–84 207.25 N/A 318.11 187.84 N/A 337.91 85+ 239.19 N/A 311.64 216.39 N/A 332.93
Male Employees Female Employees
Male Dependents Female Dependents
Medicare Part B Premiums — The Medicare Part B premium reimbursement was included in the 2012 premium for those members covered by NYSHIP. Medicare Part B reimbursements were assumed to
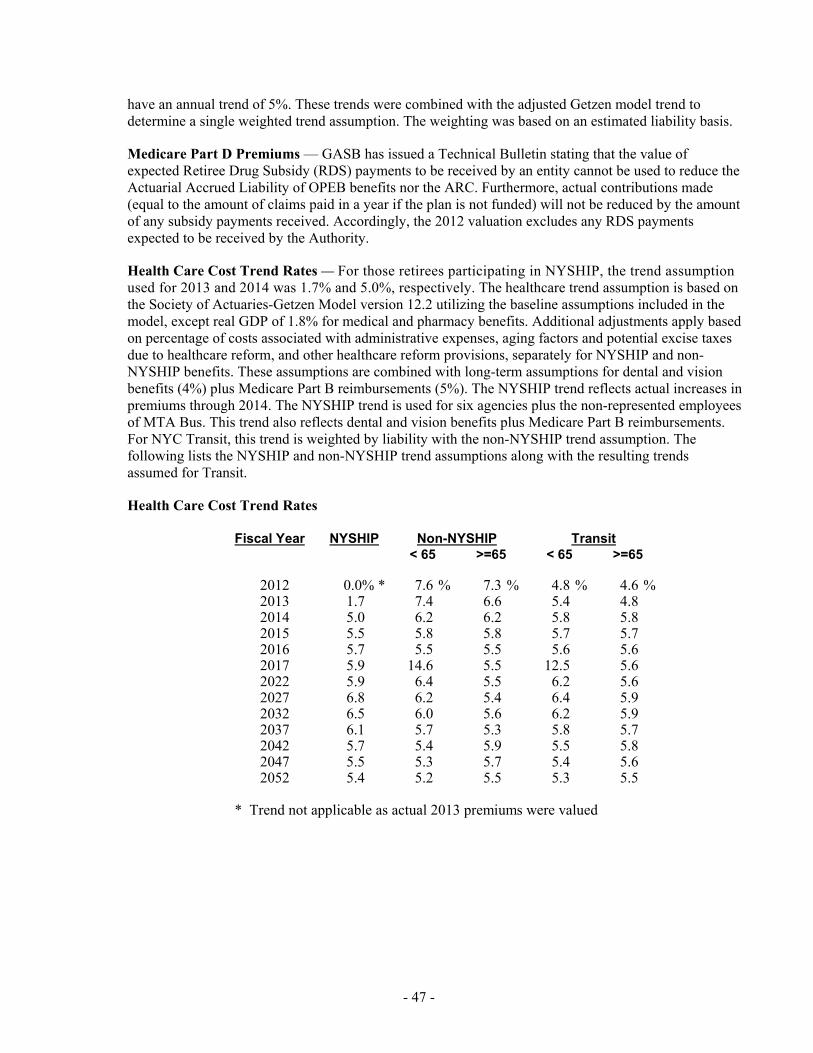
- 47 -
have an annual trend of 5%. These trends were combined with the adjusted Getzen model trend to determine a single weighted trend assumption. The weighting was based on an estimated liability basis.
Medicare Part D Premiums — GASB has issued a Technical Bulletin stating that the value of expected Retiree Drug Subsidy (RDS) payments to be received by an entity cannot be used to reduce the Actuarial Accrued Liability of OPEB benefits nor the ARC. Furthermore, actual contributions made (equal to the amount of claims paid in a year if the plan is not funded) will not be reduced by the amount of any subsidy payments received. Accordingly, the 2012 valuation excludes any RDS payments expected to be received by the Authority.
Health Care Cost Trend Rates — For those retirees participating in NYSHIP, the trend assumption used for 2013 and 2014 was 1.7% and 5.0%, respectively. The healthcare trend assumption is based on the Society of Actuaries-Getzen Model version 12.2 utilizing the baseline assumptions included in the model, except real GDP of 1.8% for medical and pharmacy benefits. Additional adjustments apply based on percentage of costs associated with administrative expenses, aging factors and potential excise taxes due to healthcare reform, and other healthcare reform provisions, separately for NYSHIP and non-NYSHIP benefits. These assumptions are combined with long-term assumptions for dental and vision benefits (4%) plus Medicare Part B reimbursements (5%). The NYSHIP trend reflects actual increases in premiums through 2014. The NYSHIP trend is used for six agencies plus the non-represented employees of MTA Bus. This trend also reflects dental and vision benefits plus Medicare Part B reimbursements. For NYC Transit, this trend is weighted by liability with the non-NYSHIP trend assumption. The following lists the NYSHIP and non-NYSHIP trend assumptions along with the resulting trends assumed for Transit.
Health Care Cost Trend Rates
Fiscal Year NYSHIP Non-NYSHIP Transit< 65 >=65 < 65 >=65
2012 0.0% * 7.6 % 7.3 % 4.8 % 4.6 % 2013 1.7 7.4 6.6 5.4 4.8 2014 5.0 6.2 6.2 5.8 5.8 2015 5.5 5.8 5.8 5.7 5.7 2016 5.7 5.5 5.5 5.6 5.6 2017 5.9 14.6 5.5 12.5 5.6 2022 5.9 6.4 5.5 6.2 5.6 2027 6.8 6.2 5.4 6.4 5.9 2032 6.5 6.0 5.6 6.2 5.9 2037 6.1 5.7 5.3 5.8 5.7 2042 5.7 5.4 5.9 5.5 5.8 2047 5.5 5.3 5.7 5.4 5.6 2052 5.4 5.2 5.5 5.3 5.5
* Trend not applicable as actual 2013 premiums were valued
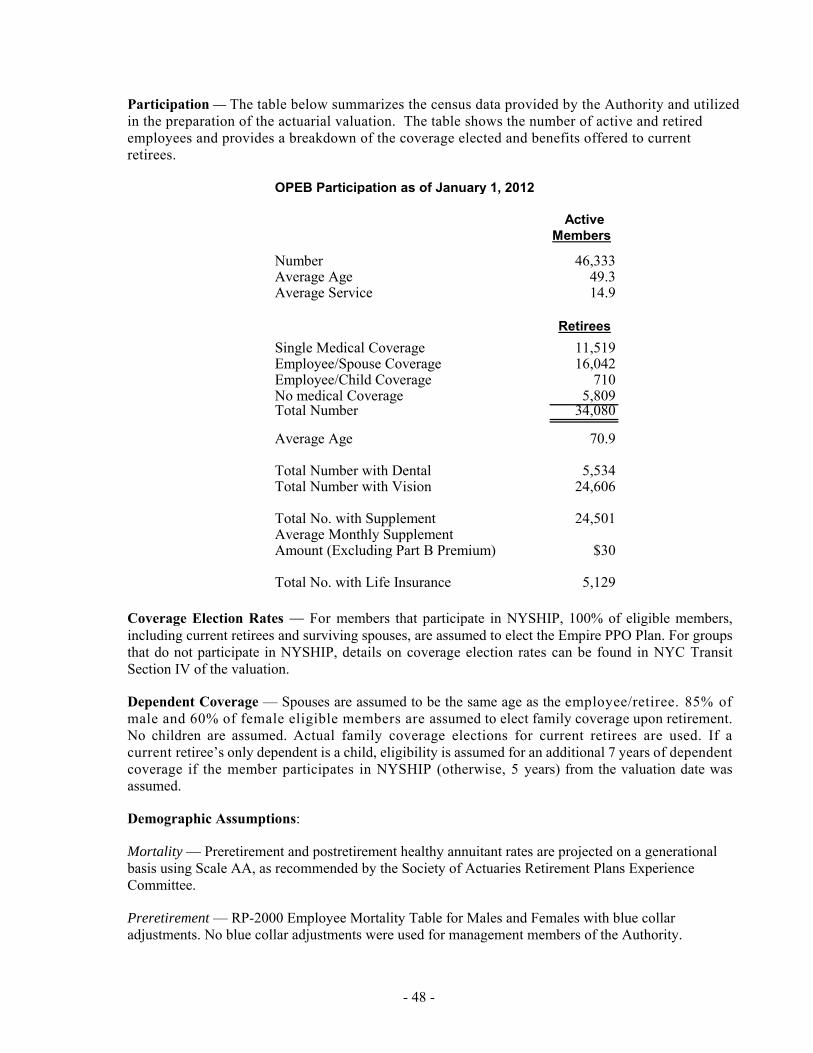
- 48 -
Participation — The table below summarizes the census data provided by the Authority and utilized in the preparation of the actuarial valuation. The table shows the number of active and retired employees and provides a breakdown of the coverage elected and benefits offered to current retirees.
OPEB Participation as of January 1, 2012
ActiveMembers
Number 46,333Average Age 49.3Average Service 14.9
RetireesSingle Medical Coverage 11,519Employee/Spouse Coverage 16,042Employee/Child Coverage 710No medical Coverage 5,809Total Number 34,080
Average Age 70.9
Total Number with Dental 5,534Total Number with Vision 24,606
Total No. with Supplement 24,501Average Monthly SupplementAmount (Excluding Part B Premium) $30
Total No. with Life Insurance 5,129
Coverage Election Rates — For members that participate in NYSHIP, 100% of eligible members, including current retirees and surviving spouses, are assumed to elect the Empire PPO Plan. For groups that do not participate in NYSHIP, details on coverage election rates can be found in NYC Transit Section IV of the valuation.
Dependent Coverage — Spouses are assumed to be the same age as the employee/retiree. 85% of male and 60% of female eligible members are assumed to elect family coverage upon retirement. No children are assumed. Actual family coverage elections for current retirees are used. If a current retiree’s only dependent is a child, eligibility is assumed for an additional 7 years of dependent coverage if the member participates in NYSHIP (otherwise, 5 years) from the valuation date was assumed.
Demographic Assumptions:
Mortality — Preretirement and postretirement healthy annuitant rates are projected on a generational basis using Scale AA, as recommended by the Society of Actuaries Retirement Plans Experience Committee.
Preretirement — RP-2000 Employee Mortality Table for Males and Females with blue collar adjustments. No blue collar adjustments were used for management members of the Authority.
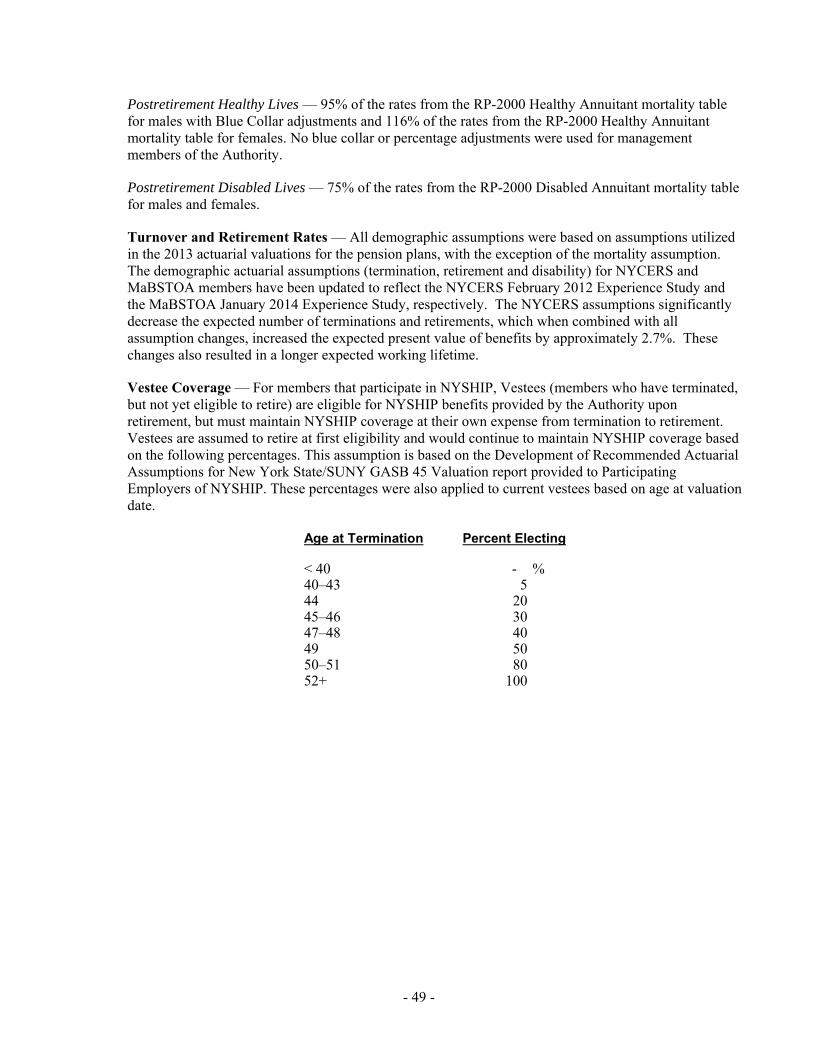
- 49 -
Postretirement Healthy Lives — 95% of the rates from the RP-2000 Healthy Annuitant mortality table for males with Blue Collar adjustments and 116% of the rates from the RP-2000 Healthy Annuitant mortality table for females. No blue collar or percentage adjustments were used for management members of the Authority.
Postretirement Disabled Lives — 75% of the rates from the RP-2000 Disabled Annuitant mortality table for males and females.
Turnover and Retirement Rates — All demographic assumptions were based on assumptions utilized in the 2013 actuarial valuations for the pension plans, with the exception of the mortality assumption. The demographic actuarial assumptions (termination, retirement and disability) for NYCERS and MaBSTOA members have been updated to reflect the NYCERS February 2012 Experience Study and the MaBSTOA January 2014 Experience Study, respectively. The NYCERS assumptions significantly decrease the expected number of terminations and retirements, which when combined with all assumption changes, increased the expected present value of benefits by approximately 2.7%. These changes also resulted in a longer expected working lifetime.
Vestee Coverage — For members that participate in NYSHIP, Vestees (members who have terminated, but not yet eligible to retire) are eligible for NYSHIP benefits provided by the Authority upon retirement, but must maintain NYSHIP coverage at their own expense from termination to retirement. Vestees are assumed to retire at first eligibility and would continue to maintain NYSHIP coverage based on the following percentages. This assumption is based on the Development of Recommended Actuarial Assumptions for New York State/SUNY GASB 45 Valuation report provided to Participating Employers of NYSHIP. These percentages were also applied to current vestees based on age at valuation date.
Age at Termination Percent Electing
< 40 - % 40–43 5 44 20 45–46 30 47–48 40 49 50 50–51 80 52+ 100
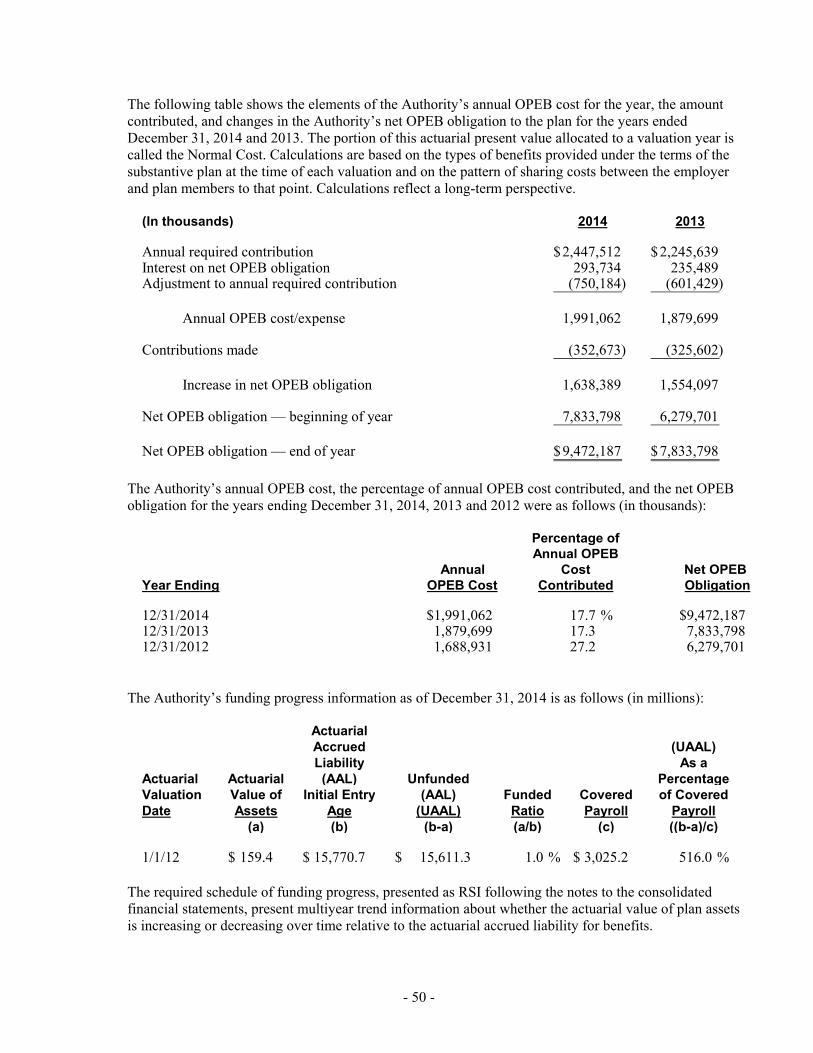
- 50 -
The following table shows the elements of the Authority’s annual OPEB cost for the year, the amount contributed, and changes in the Authority’s net OPEB obligation to the plan for the years ended December 31, 2014 and 2013. The portion of this actuarial present value allocated to a valuation year is called the Normal Cost. Calculations are based on the types of benefits provided under the terms of the substantive plan at the time of each valuation and on the pattern of sharing costs between the employer and plan members to that point. Calculations reflect a long-term perspective.
(In thousands) 2014 2013
Annual required contribution 2,447,512$ 2,245,639$Interest on net OPEB obligation 293,734 235,489 Adjustment to annual required contribution (750,184) (601,429)
Annual OPEB cost/expense 1,991,062 1,879,699
Contributions made (352,673) (325,602)
Increase in net OPEB obligation 1,638,389 1,554,097
Net OPEB obligation — beginning of year 7,833,798 6,279,701
Net OPEB obligation — end of year 9,472,187$ 7,833,798$
The Authority’s annual OPEB cost, the percentage of annual OPEB cost contributed, and the net OPEB obligation for the years ending December 31, 2014, 2013 and 2012 were as follows (in thousands):
Percentage ofAnnual OPEB
Annual Cost Net OPEB Year Ending OPEB Cost Contributed Obligation
12/31/2014 $1,991,062 17.7 % $9,472,18712/31/2013 1,879,699 17.3 7,833,79812/31/2012 1,688,931 27.2 6,279,701
The Authority’s funding progress information as of December 31, 2014 is as follows (in millions):
ActuarialAccrued (UAAL)Liability As a
Actuarial Actuarial (AAL) Unfunded PercentageValuation Value of Initial Entry (AAL) Funded Covered of CoveredDate Assets Age (UAAL) Ratio Payroll Payroll
(a) (b) (b-a) (a/b) (c) ((b-a)/c)
1/1/12 159.4$ 15,770.7$ 15,611.3$ 1.0 % 3,025.2$ 516.0 %
The required schedule of funding progress, presented as RSI following the notes to the consolidated financial statements, present multiyear trend information about whether the actuarial value of plan assets is increasing or decreasing over time relative to the actuarial accrued liability for benefits.
- 51 -
9. DUE TO MTA FOR REPAYMENT OF DEBT
Transit Facilities Revenue Bonds — Prior to December 31, 2002, the Authority recognized as a liability in the accompanying consolidated statements of net position the portion of the bond proceeds pledged to the Authority by the MTA for the acquisition of capital assets to the extent of the Authority’s expenditure of such bond proceeds. As a result of the MTA’s bond restructuring during fiscal year 2002, except for the Authority’s portion of the Certificates of Participation, the Authority no longer records a liability to the MTA for the portion of the bonds utilized to fund the Authority’s Capital Program.
The Authority is required to deposit all of its pledged revenues with a trustee for the bondholders. Such funds are first applied to meet all obligations under the revenue bonds, and the remainder is returned to the Authority for its operating needs.
The MTA is responsible for all payments from these bond proceeds and for administering the debt service reserve funds, if any, and the unexpended bond funds and has recorded the liability for these bonds. Prior to the debt restructuring, the Authority had recorded a liability to the MTA to the extent of the Authority’s expenditure of such bond proceeds. Debt service paid by the Authority is net of the amount provided from the MTA’s investment of the unexpended bond funds.
Certificates of Participation — In June 1999 and 2000, the MTA issued approximately $328.2 million and $121.2 million, respectively, of its Series 1999A and Series 2000A Certificates of Participation, which were substantially defeased with the issuance of the Series 2004A variable rate Certificates of Participation totaling $357.9 million in September 2004. The proceeds from these issuances were used to finance certain building and leasehold improvements to an office building at Two Broadway to be occupied by the Authority, the MTA or its subsidiaries, and the TBTA. In November 2011, the MTA issued Transportation Revenue Refunding Bonds, Series 2011C, which refunded existing fixed rate Transportation Revenue Bonds. Debt service monies derived from this refunding were used to retire $237.0 million of the 2004A variable rate COPS and $15.0 million of the Series 1999A and 2000A fixed rate COPS. The Authority’s payable to the MTA for its aggregate portion of COPS debt was reduced by approximately $168.8 million. The 1999A, 2000A, and 2004A series represent proportionate interests in the principal and interest components of base rent paid severally, but not jointly, by the Authority, the MTA, and the TBTA pursuant to a Leasehold Improvement Sublease Agreement dated as of June 1, 1999. The Authority, the MTA, and the TBTA are obligated to pay 68.7%, 21.0%, and 10.3%, respectively, of the base rent under the Leasehold Improvement Sublease. The Authority’s payable to the MTA for its portion of the Certificates of Participation is $42.3 million as of December 31, 2014. The Authority’s share of future debt service payments to the MTA for the Certificates of Participation totals approximately $121.3 million at December 31, 2014.
Interest paid on the Certificates of Participation amounted to $8.1 million and $7.9 million in 2014 and 2013, respectively.
10. RELATED PARTY TRANSACTIONS
The Authority receives support services from the MTA in the areas of budget, cash management, finance, legal, real estate, treasury, risk and insurance management, and other services, most of which are charged back to the Authority through intercompany billings. The MTA also provides funding for the Authority’s capital program via MTA debt issuance, federal capital grant pass-throughs, and proceeds from the sale of tax benefits on leasing transactions. The Authority recognizes funds contributed to Transit capital programs as contributed capital in the consolidated statements of revenues, expenses, and changes in net position. State and City tax –supported subsidies received by the Authority
- 52 -
from the MTA to support operations are recorded as nonoperating revenues. The MTA also provides short-term loans, as required, to supplement the Authority’s working capital needs.
The Authority has intercompany transactions with MNCR, LIRR, MTA Bus, TBTA, and SIRTOA related to farecard settlements, service agreements, shared operating contracts, inter-agency loan transactions, and other operating receivables and payables.
The resulting receivables and payables from the above transactions are recorded in Due from MTA and constituent authorities included in the accompanying consolidated statements of net position.
Due from MTA and constituent authorities consist of the following at December 31, 2014 and 2013 (in thousands):
Receivable (Payable) Receivable (Payable)
MTA 4,823,565$ (4,413,956)$ 4,141,857$ (3,994,607)$ Constituent authorities 130,316 (11,174) 138,268 (12,059)
Total MTA and constituent authorities 4,953,881$ (4,425,130)$ 4,280,125$ (4,006,666)$
2014 2013
11. ADVERTISING AND OTHER INCOME
Advertising and other income for the years ended December 31, 2014 and 2013, consist of (in thousands):
2014 2013
Advertising revenue 105,841$ 95,493$ Metrocard green fee surcharge 24,578 23,455 Transit Adjudication Bureau collections 9,637 8,216 Station income 8,818 9,143 Rental income 4,555 3,463 Fare media transaction fees 4,491 4,440 All other 249 1,024
158,169$ 145,234$
- 53 -
12. OTHER EXPENSES
Other expenses for the years ended December 31, 2014 and 2013, consist of (in thousands):
2014 2013
Credit and debit card fees for fare media sales 39,426$ 36,862$ Fare media sales commissions 11,824 11,808 NYS MCTMT expense 13,045 11,724 Print and office supplies 5,272 4,816 Allowance for uncollectible accounts 925 1,238 Business travel, meetings, and conventions 423 1,224 Dues and subscriptions 1,781 1,335 Other miscellaneous expenses 3,434 (6,094)
76,130$ 62,913$
13. MAINTENANCE AND OTHER OPERATING EXPENSES
Maintenance and other operating expenses for the years ended December 31, 2014 and 2013, consist of (in thousands):
2014 2013
Operating maintenance and repair services 58,831$ 55,109$ Facility maintenance and repairs 13,832 13,624 Real estate rentals (including 2 Broadway operating expenses) 22,056 17,708 Security services 12,656 10,418 Refuse and recycling 8,500 8,152 Telephone services 10,781 8,817 Tire and tube rentals 9,342 10,234 Janitorial and custodial services 5,315 6,243 Water and sewage 11,417 9,272 Specialized equipment 2,445 5,018 Bridge, tunnel and highway tolls 4,619 4,391 Uniforms 3,421 2,407 Ticket stock material 3,386 4,083 Safety equipment and supplies 10,399 7,793 Other miscellaneous expenses 8,523 4,092
185,523$ 167,361$ 14. FUEL HEDGE
MTA partially hedges its fuel cost exposure using financial hedges. The hedging strategy consists of a fixed-rate lock on forward delivery of NYMEX No. 2 heating oil. This commodity remains highly correlated to the fuel type being used by MTA, ultra-low sulfur diesel, (ULSD). MTA executed twenty-three separate hedges during 2014. All MTA fuel hedges provide for 24 monthly settlements. The table below summarizes the twenty-three active ULSD hedges:
- 54 -
Counterparty
JPM - Ventures Energy Corp
JPM - Ventures Energy Corp
JPM - Ventures Energy Corp
J. Aron & Company
J. Aron & Company
JPM - Ventures Energy Corp
Trade Date 12/19/2012 2/21/2013 4/23/2013 4/23/2013 6/6/2013 8/9/2013Effective Date 12/1/2013 1/1/2014 5/1/2013 5/1/2013 5/1/2014 6/1/2014Termination Date 12/31/2014 1/31/2015 3/31/2015 3/31/2015 4/30/2015 7/31/2015Price/Gal $2.87 $2.94 $2.77 $2.77 $2.81 $2.83Notional Qnty (Gal) 15,981,638 11,027,445 4,494,141 4,494,141 7,702,834 18,420,266
CounterpartyJ. Aron & Company
JPM - Ventures Energy Corp
JPM - Ventures Energy Corp
Bank of America Merrill Lynch
JPM - Ventures Energy Corp
JPM - Ventures Energy Corp
Trade Date 9/10/2013 10/11/2013 11/19/2013 1/29/2014 2/26/2014 3/31/2014Effective Date 8/1/2014 9/1/2014 11/1/2014 12/1/2014 2/1/2015 3/1/2015Termination Date 8/31/2015 9/30/2015 10/31/2015 12/31/2015 1/31/2016 2/29/2016Price/Gal $2.82 $2.82 $2.79 $2.77 $2.84 $2.81Notional Qnty (Gal) 8,439,456 15,441,167 7,636,954 15,299,678 7,892,588 7,810,490
Counterparty
JPM - Ventures Energy Corp
Bank of America Merrill Lynch
Bank of America Merrill Lynch
J. Aron & Company
J. Aron & Company
Bank of America Merrill Lynch
Trade Date 4/30/2014 5/15/2014 6/25/2014 7/2/2014 7/2/2014 7/29/2014Effective Date 4/1/2015 7/1/2014 6/1/2015 7/1/2014 7/1/2014 7/1/2015Termination Date 3/31/2016 4/30/2016 5/31/2016 1/31/2015 2/28/2015 6/30/2016Price/Gal $2.82 $2.86 $2.93 $2.90 $2.88 $2.86Notional Qnty (Gal) 7,850,843 12,865,827 8,644,395 5,852,793 4,074,192 8,461,232
CounterpartyJ. Aron & Company
J. Aron & Company
Bank of America Merrill Lynch
Bank of America Merrill Lynch
JPM - Ventures Energy Corp
Trade Date 8/27/2014 9/24/2014 10/29/2014 11/25/2014 12/23/2014Effective Date 8/1/2015 4/1/2015 10/1/2015 11/1/2015 12/1/2015Termination Date 7/31/2016 8/31/2016 9/30/2016 10/31/2016 11/30/2016Price/Gal $2.82 $2.74 $2.55 $2.40 $2.03Notional Qnty (Gal) 8,322,340 8,050,125 7,487,723 7,029,766 5,970,231
The monthly settlements are based on the daily prices of the respective commodities whereby MTA will either receive a payment, or make a payment to the various counterparties depending on the average monthly price of the commodities in relation to the contract prices. At December 31, 2014, the total outstanding notional value of the ULSD contracts was 54,304,131 gallons with a decrease in fair market value of $48.2 million.
The Transit Authority recognized a fuel hedge loss of $4.4 million in 2014 and $0.6 million gain in 2013.
- 55 -
15. RISK MANAGEMENT
The Authority is exposed to various risks of loss related to torts; theft of, damage to, and destruction of its assets; injuries to persons, including employees; and natural disasters.
The Authority is self-insured up to certain per occurrence limits for liability claims arising from injuries to persons, excluding employees. For claims arising from incidents that occurred on or after November 1, 2001, but before November 1, 2006, the self-insured retention limit was $7 million per occurrence. Claims arising on or after November 1, 2006, but before November 1, 2009 were subject to an $8 million limit. Effective November 1, 2009, the retention limit was increased to $9 million per occurrence and effective November 1, 2012, the retention limit was increased to $10 million. Lower limits applied for claims arising prior to November 1, 2001. The Authority is self-insured for work-related injuries to employees. The annual cost associated with injuries to persons, other than employees, and damage to third-party property, is reflected in expenses as public liability claims in the accompanying consolidated statements of revenues, expenses and change in net position.
The Authority establishes its liability for injuries to employees and to the general public on the basis of independent actuarial estimates of future liability.
A summary of activity in estimated liability arising from injuries to persons, including employees, and damage to third-party property, for the years ended December 31, 2014 and 2013, is as follows (in thousands):
2014 2013
Balance at beginning of year 1,548,072$ 1,377,974$Activity during the year: Current year claims and changes in estimates 439,151 373,771 Claims paid (231,524) (203,673)
Balance at end of year 1,755,699 1,548,072
Less current portion (221,174) (188,580)
Long-term liability 1,534,525$ 1,359,492$
First Mutual Transportation Assurance Company — (FMTAC), an insurance captive subsidiary of MTA, operates a liability insurance program (ELF) that insures certain claims in excess of the self-insured retention limits of the agencies on both a retrospective (claims arising from incidents that occurred before October 31, 2003) and prospective (claims arising from incidents that occurred on or after October 31, 2003) basis. For claims arising from incidents that occurred on or after November 1, 2006, but before November 1, 2009, the self-insured retention limits are: $8 million for MTA New York City Transit, MaBSTOA, MTA Bus, MTA Long Island Rail Road, and MTA Metro-North Railroad; $2.3 million for MTA Long Island Bus and MTA Staten Island Railway; and $1.6 million for MTAHQ and MTA Bridges and Tunnels. For claims arising from incidents that occurred on or after November 1, 2009, but before November 1, 2012, the self-insured retention limits are: $9 million for MTA New York City Transit, MaBSTOA, MTA Bus, MTA Long Island Rail Road and MTA Metro-North Railroad; $2.6 million for MTA Long Island Bus and MTA Staten Island Railway; and $1.9 million for MTAHQ and MTA Bridges and Tunnels. Effective November 1, 2012 the self-insured retention limits for ELF were increased to the following amounts: $10 million for MTA New York City Transit, MaBSTOA, MTA Bus, MTA Long Island Rail Road and MTA Metro-North Railroad; $3 million for MTA Staten
- 56 -
Island Railway; and $2.6 million for MTAHQ and MTA Bridges and Tunnels. The maximum amount of claims arising out of any one occurrence is the total assets of the program available for claims, but in no event greater than $50 million. The retrospective portion contains the same insurance agreements, participant retentions, and limits as existed under the ELF program for occurrences happening on or before October 30, 2003. On a prospective basis, FMTAC issues insurance policies indemnifying the other MTA Group entities above their specifically assigned self-insured retention with a limit of $50 million per occurrence with a $50 million annual aggregate. FMTAC charges appropriate annual premiums based on loss experience and exposure analysis to maintain the fiscal viability of the program. On December 31, 2014, the balance of the assets in the ELF program was $72.2 million.
MTA also maintains an All-Agency Excess Liability Insurance Policy that affords the MTA Group additional coverage limits of $350 million for a total limit of $400 million ($350 million excess of $50 million). In certain circumstances, when the assets in the program described in the preceding paragraph are exhausted due to payment of claims, the All-Agency Excess Liability Insurance will assume the coverage position of $50 million.
On March 1, 2014, the “nonrevenue fleet” automobile liability policy program was renewed. This program provides third-party auto liability insurance protection for the MTA Group with the exception of MTA New York City Transit and MTA Bridges and Tunnels. The policy provides $10 million per occurrence limit with a $0.5 million per occurrence deductible for MTA Long Island Rail Road, MTA Staten Island Rapid Transit Operating Authority, MTA Police, MTA Metro-North Railroad, MTA Inspector General and MTA Headquarters. FMTAC renewed its deductible buy back policy, where it assumes the liability of the agencies for their deductible.
On March 1, 2014, the “Access-A-Ride” automobile liability policy program was renewed. This program provides third-party auto liability insurance protection for the MTA New York City Transit’s Access-A-Ride program, including the contracted operators. This policy provides a $3 million per occurrence limit with a $1 million per occurrence deductible.
On December 15, 2014, FMTAC renewed the primary coverage on the Station Liability and Force Account liability policies for $10 million per occurrence loss for MTA Metro-North Railroad and MTA Long Island Rail Road.
Property Insurance — Effective May 1, 2014, FMTAC renewed the all-agency property insurance program. For the annual period commencing May 1, 2014, FMTAC directly insures property damage claims of the other MTA Group entities in excess of a $25 million per occurrence self-insured retention (SIR), subject to an annual $75 million aggregate as well as certain exceptions summarized below. The total program is $600 million per occurrence covering property of the related entities collectively. FMTAC is reinsured in the domestic, Asian, London, European and Bermuda marketplaces for this coverage. Losses occurring after the retention aggregate is exceeded are subject to a deductible of $7.5 million per occurrence. The property insurance policy provides replacement cost coverage for all risks (including earthquake, flood and wind) of direct physical loss or damage to all real and personal property, with minor exceptions. The policy also provides extra expense and business interruption coverage.
In addition to the noted $25 million per occurrence self-insured retention, MTA self-insures all risks (excluding earthquake, flood and wind) above that retention for an additional $362.3 million within the overall $600 million property program as follow: $33 million (or 33%) of the $100 million layer excess of the primary $150 million layer, plus $229.3 million (or 91.7%) of the $250 million layer excess of $250 million, plus $100 million (or 100%) of $100 million excess of $500 million.
- 57 -
FMTAC is 100% reinsured in the domestic, Asian, London, European and Bermuda marketplaces for the perils of Earthquake, Flood, and Wind for the $600 million per occurrence and in the annual aggregate property program.
Supplementing the $600 million per occurrence coverage noted above, FMTAC’s property insurance program has been expanded to include a further layer of $200 million of fully collateralized storm surge coverage for losses from storm surges that surpass specified trigger levels in the New York Harbor or Long Island Sound and are associated with named storms that occur at any point in the three year period from July 31, 2013 to July 30, 2016. The expanded protection is reinsured by MetroCat Re Ltd., a Bermuda special purpose insurer independent of the Authority and the MTA and formed to provide FMTAC with capital markets-based property reinsurance. The MetroCat Re reinsurance policy is fully collateralized by a Regulation 114 trust invested in U.S. Treasury Money Market Funds. The additional coverage provided is available for storm surge losses only after amounts available under the $600 million in general property reinsurance are exhausted.
With respect to acts of terrorism, FMTAC provides direct coverage that is reinsured by the United States Government for 85% of “certified” losses, as covered by the Terrorism Risk Insurance Act (TRIA) of 2007 (originally introduced in 2002). Under the 2007 extension, terrorism acts sponsored by both foreign and domestic organizations are covered. The remaining 15% of MTA Group losses arising from an act of terrorism would be covered under the additional terrorism policy described below. Additionally, no federal compensation will be paid unless the aggregate industry insured losses exceed $100 million (trigger). The United States government’s reinsurance of FMTAC expired on December 31, 2014 when Congress did not reauthorize TRIA. FMTAC was able to secure stand-alone terrorism coverage for the period from January 1, 2015 until January 12, 2015, when the Federal Terrorism Insurance Program was extended for six years and MTA reverted to said program.
To supplement the reinsurance to FMTAC through the 2007 Terrorism Risk Insurance Program Reauthorization Act (TRIPRA) program, the MTA obtained an additional commercial reinsurance policy with various reinsurance carriers in the domestic, London and European marketplaces. That policy provides coverage for: (1) 15% of any “certified” act of terrorism — up to a maximum recovery of $161.2 million for any one occurrence and in the annual aggregate, (2) the TRIPRA FMTAC captive deductible (per occurrence and on an aggregated basis) that applies when recovering under the 15% “certified” acts of terrorism insurance or (3) 100% of any “certified” terrorism loss which exceeds $5 million and less than the $100 million TRIPRA trigger — up to a maximum recovery of $100 million for any occurrence and in the annual aggregate. This coverage expires at midnight on May 1, 2015. Recovery under this policy is subject to retention of $25 million per occurrence and $75 million in the annual aggregate — in the event of multiple losses during the policy year. In the event that the MTA Group’s retention in any one year exceed $75 million, future losses in that policy year are subject to retention of $7.5 million.
During 2014, there were no FMTAC reimbursements to the Authority. At December 31, 2014, the Authority has one outstanding claim requiring coverage by FMTAC for approximately $3.0 million, which relates to a pedestrian struck by a vehicle in 2004. At December 31, 2014, FMTAC had $1.3 billion of assets to insure current and future claims.
- 58 -
16. CONTINGENCIES
The Authority is involved in various litigation and claims involving personal liability claims and certain other matters. The ultimate outcome of these claims and suits cannot be predicted at this time. Nevertheless, management does not believe that the ultimate outcome of these matters will have a material effect on the consolidated financial position of the Authority.
In accordance with GASB Statement No. 49, Accounting and Financial Reporting for Pollution Remediation Obligations, in 2014 and 2013, the Authority recognized $12.5 million and $24.1 million, respectively, in pollution remediation expenses. The expense provision was measured at its current value utilizing the prescribed expected cash flow method (see Note 2). Pollution remediation obligations are estimates and subject to changes resulting from price increases or reductions, technology, or changes in applicable laws or regulations.
At December 31, 2014, the Authority’s pollution remediation liability totaled $42.7 million on the consolidated statements of net position, primarily consisting of future remediation activities associated with asbestos removal, lead abatement, ground water contamination, and soil remediation.
17. SUBSEQUENT EVENTS
On January 14th and 15th, 2015, MTA priced $850 million of MTA Transportation Revenue Bonds, Series 2015A, to finance existing approved transit and commuter projects. The bonds were offered in two subseries: the 2015A-1 bonds totaling $600 million were issued as fixed-rate serial and term bonds; the 2015A-2 bonds were offered as SIFMA Floating Rate Notes (FRNs) with an initial purchase date of 5-years. The transaction was led by J.P. Morgan Securities, together with co-senior manager The Williams Capital Group. Hawkins Delafield and Wood served as bond counsel and Public Financial Management, Inc. served as financial advisor.
On January 22, 2015, the MTA Board voted to increase the Authority’s Subway and Bus fares effective March 22, 2015. MetroCard seven-day passes increase from $30 to $31 and MetroCard thirty-day passes increase from $112 to $116.50. The basic fare increases from $2.50 to $2.75. The single-ride ticket price increases from $2.75 to $3.00. The bonus value increases from 5% to 11%.
On January 29, 2015, MTA executed a 2.9 gallon ultra-low sulfur diesel fuel hedge with J.P. Morgan Ventures Energy Corporation at an all-in price of $1.8095/gallon. Three of MTA’s existing approved commodity counterparties participated in bidding on the transaction: Goldman, Sachs & Co./ J Aron, J.P. Morgan Ventures Energy Corporation and Merrill Lynch Commodities Inc. The hedge covers the period from January 2016 through December 2016.
On February 26, 2015, MTA executed a 2.9 million gallon ultra-low sulfur diesel fuel hedge with Merrill Lynch Commodities Inc. at an all-in price of $2.052/gallon. Three of MTA’s existing approved commodity counterparties participated in bidding on the transaction: Goldman, Sachs & Co./ J Aron, J.P. Morgan Ventures Energy Corporation and Merrill Lynch Commodities Inc. The hedge covers the period from February 2016 through January 2017.
On March 19, 2015, MTA issued $275 million of MTA Transportation Revenue Bonds, Series 2015B, to finance existing approved transit and commuter projects. Nixon Peabody will serve as bond counsel and Public Financial Management, Inc. will serve as financial advisor.
On March 25, 2015, MTA executed a 2.9 million gallon ultra-low sulfur diesel fuel hedge with Merrill Lynch Commodities Inc. at an all-in price of $1.9195/gallon. Three of MTA’s existing approved
- 59 -
commodity counterparties participated in bidding on the transaction: Goldman, Sachs & Co./ J Aron, J.P. Morgan Ventures Energy Corporation and Merrill Lynch Commodities Inc. The hedge covers the period from March 2016 through February 2017.
On April 2, 2015, MTA effected a mandatory tender and remarket $50 million of MTA Transportation Revenue Bonds, Subseries 2012A-3, because its current interest rate period is set to expire by its terms on May 15, 2015.
Tropical Storm Sandy Update
As of February 26, 2015, MTA has drawn down $183 million of the $194 million grant for reimbursement of eligible operating and capital expenses. The grant in the amount of $886 million is solely for MTA capital projects and will be used for recovery projects totaling $802 million and for four resiliency projects totaling $84 million. As of February 26, 2015, MTA has drawn down $399 million of the $886 million grant for reimbursement of eligible capital expenses. As of February 26, 2015, MTA has drawn down $17 million of the $684.5 million grant executed in September 2014, for reimbursement of eligible capital expenses. The grant in the amount of $787.6 million is solely for MTA capital projects and was executed on February 11, 2015. As of February 26, 2015 there have been no federal drawdowns for that grant. The balance of funds to be drawn down from all four grants is available to MTA for reimbursement of eligible expenses as requisitions are submitted by MTA and approved by FTA. Additional requisitions are in process.
* * * * * *
- 60 -
REQUIRED SUPPLEMENTARY INFORMATION
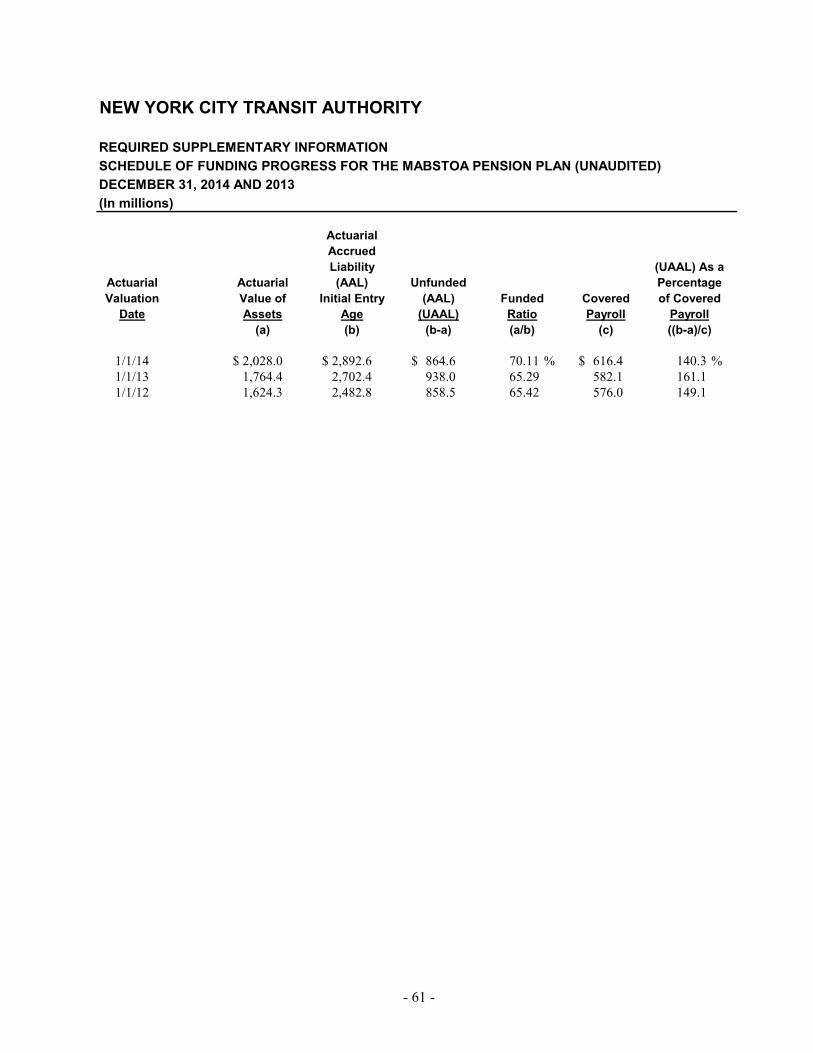
- 61 -
NEW YORK CITY TRANSIT AUTHORITY
REQUIRED SUPPLEMENTARY INFORMATIONSCHEDULE OF FUNDING PROGRESS FOR THE MABSTOA PENSION PLAN (UNAUDITED)DECEMBER 31, 2014 AND 2013(In millions)
ActuarialAccruedLiability (UAAL) As a
Actuarial Actuarial (AAL) Unfunded PercentageValuation Value of Initial Entry (AAL) Funded Covered of Covered
Date Assets Age (UAAL) Ratio Payroll Payroll(a) (b) (b-a) (a/b) (c) ((b-a)/c)
1/1/14 2,028.0$ 2,892.6$ 864.6$ 70.11 % 616.4$ 140.3 % 1/1/13 1,764.4 2,702.4 938.0 65.29 582.1 161.1 1/1/12 1,624.3 2,482.8 858.5 65.42 576.0 149.1
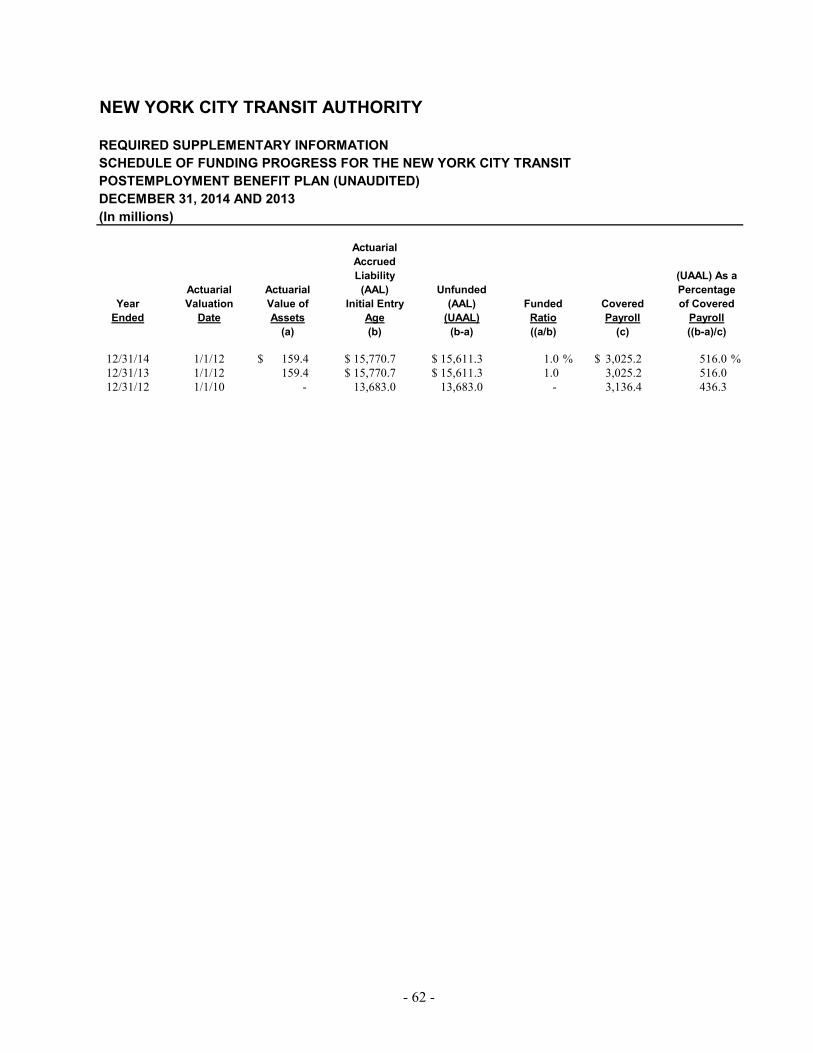
- 62 -
NEW YORK CITY TRANSIT AUTHORITY
REQUIRED SUPPLEMENTARY INFORMATIONSCHEDULE OF FUNDING PROGRESS FOR THE NEW YORK CITY TRANSITPOSTEMPLOYMENT BENEFIT PLAN (UNAUDITED)DECEMBER 31, 2014 AND 2013(In millions)
ActuarialAccruedLiability (UAAL) As a
Actuarial Actuarial (AAL) Unfunded PercentageYear Valuation Value of Initial Entry (AAL) Funded Covered of Covered
Ended Date Assets Age (UAAL) Ratio Payroll Payroll(a) (b) (b-a) ((a/b) (c) ((b-a)/c)
12/31/14 1/1/12 159.4$ 15,770.7$ 15,611.3$ 1.0 % 3,025.2$ 516.0 % 12/31/13 1/1/12 159.4 15,770.7$ 15,611.3$ 1.0 3,025.2 516.0 12/31/12 1/1/10 - 13,683.0 13,683.0 - 3,136.4 436.3