Embed Size (px)
Citation preview

1 NEW YORK CITY MAYOR’S CARBON CHALLENGE PROGRESS REPORT
NEW YORK CITY MAYOR’S CARBON CHALLENGEPROGRESS REPORTAPRIL 2013
The City of New YorkMayor Michael R. Bloomberg
A GREENER, GREATER NEW YORK

2 NEW YORK CITY MAYOR’S CARBON CHALLENGE PROGRESS REPORT
The City of New York would like to thank the following for their valuable assistance in producing this report: Barnard College, Berkeley College, Broadway Green Alliance, The City University of New York, Columbia University, Continuum Health Partners, The Cooper Union, Fashion Institute of Technology of the State University of New York, Fordham University, Lutheran Medical Center, Maimonides Medical Center, Memorial Sloan-Kettering Cancer Center, Montefiore Medical Center, Mount Sinai Hos-pital, New York City Health and Hospitals Corporation, New York Hospital Queens, The New School, New York School of Inte-rior Design, New York State Energy Research and Development Authority, New York University, New York University Langone Medical Center, NewYork-Presbyterian Hospital, North Shore-Long Island Jewish Health System, Pace University, Polytechnic Institute of New York University, Pratt Institute, The Rockefeller University, School of Visual Arts, St. John’s University, and Weill Cornell Medical College.
This report was written by Jenna Tatum of the New York City Mayor’s Office of Long-Term Planning and Sustainability, with sup-port from Christyn Takara, Elizabeth Balkan, Steven A. Caputo, Jr., John H. Lee, and Sergej Mahnovski. The report was designed by Stacy Lee.
Cover Photo: Downtown ManhattanCredit: John H. Lee
Printed on paper containing 30% post-consumer material.

3 NEW YORK CITY MAYOR’S CARBON CHALLENGE PROGRESS REPORT
Executive Summary
Background
Outcomes
Early Achievers
New Sectors
Conclusion
Appendices
2
4
8
12
20
22
23
NEW YORK CITY MAYOR’S CARBON CHALLENGE
PROGRESS REPORTAPRIL 2013
A GREENER GREATER NEW YORK
Executive Summary
2 NEW YORK CITY MAYOR’S CARBON CHALLENGE PROGRESS REPORT
Tackling global climate change is one of the most significant chal-lenges we face today. Hurricanes Sandy and Irene provided dra-matic snapshots of the growing risks to New York City. To address these risks, New York City must both increase its resiliency to with-stand future events and take bold action to mitigate the green-house gas (GHG) emissions that contribute to climate change.
In 2007, Mayor Michael R. Bloomberg released PlaNYC, a com-prehensive set of strategies for a sustainable future that includes the goal to reduce citywide GHG emissions 30 percent by the year 2030. Because 75 percent of New York City’s emissions come from its buildings, and 80 percent of the buildings that exist today will still be here in 2050, increasing the energy efficiency of existing buildings represents the greatest opportunity to meet this goal. Improving efficiency also lowers building operating costs, creates good jobs, and reduces our dependence on fossil fuels.
Mayor Bloomberg asked the city’s universities and hospitals to match City government’s goal to reduce its own GHG emissions at an accelerated pace of 30 percent in ten years. Since then, 17 of New York City’s leading universities and the 11 largest hospital systems have accepted the Mayor’s Carbon Challenge to meet that goal, measured as as a 30 percent reduction in carbon diox-ide equivalent per square foot. Together, they make up 120 million square feet and roughly 3.5 percent of citywide emissions, based on 2005 emissions levels. If each participant achieves the 30 per-cent goal, they will eliminate more than 600,000 metric tons of carbon dioxide equivalent and reduce citywide emissions by about one percent, assuming no change in baseline square feet.
Since the launch of the Challenge, participating universities and hospitals have significantly cut their energy use and emissions, revealing effective strategies and providing insight on how to use voluntary action to meet policy goals. The Challenge has fostered collective action by creating a platform to share ideas and engag-ing new communities in the effort to address climate change.
Outcomes
Universities and hospitals have achieved tremendous results.
• Fiveparticipantsachievedthe30percentgoal:BarnardCollege(Barnard), the Fashion Institute of Technology (FIT), New York University (NYU), The Rockefeller University (Rockefeller), and New York Hospital Queens (NYHQ).
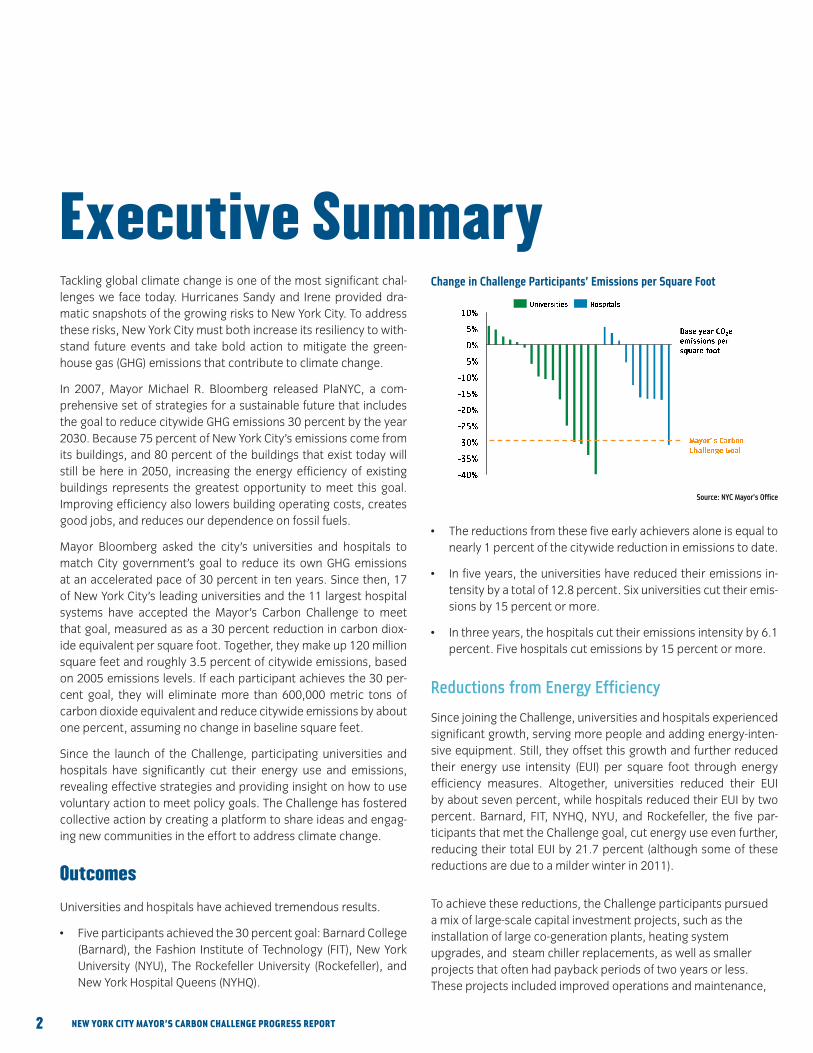
• Thereductionsfromthesefiveearlyachieversaloneisequaltonearly 1 percent of the citywide reduction in emissions to date.
• Infiveyears,theuniversitieshavereducedtheiremissionsin-tensity by a total of 12.8 percent. Six universities cut their emis-sions by 15 percent or more.
• Inthreeyears,thehospitalscuttheiremissionsintensityby6.1percent. Five hospitals cut emissions by 15 percent or more.
Reductions from Energy Efficiency
Since joining the Challenge, universities and hospitals experienced significant growth, serving more people and adding energy-inten-sive equipment. Still, they offset this growth and further reduced their energy use intensity (EUI) per square foot through energy efficiency measures. Altogether, universities reduced their EUI by about seven percent, while hospitals reduced their EUI by two percent. Barnard, FIT, NYHQ, NYU, and Rockefeller, the five par-ticipants that met the Challenge goal, cut energy use even further, reducing their total EUI by 21.7 percent (although some of these reductions are due to a milder winter in 2011).
To achieve these reductions, the Challenge participants pursued a mix of large-scale capital investment projects, such as the installation of large co-generation plants, heating system upgrades, and steam chiller replacements, as well as smaller projects that often had payback periods of two years or less. These projects included improved operations and maintenance,
Change in Challenge Participants’ Emissions per Square Foot
Source: NYC Mayor’s Office

3 NEW YORK CITY MAYOR’S CARBON CHALLENGE PROGRESS REPORT
lighting upgrades, retro-commissioning of building equipment, and public education campaigns aimed at behavioral change.
Reductions from Cleaner Energy Sources
Universities and hospitals also achieved emissions reductions by phasing out carbon intensive sources of energy and switching to cleaner sources.
Universities and hospitals phased out 67 percent of No. 6 fuel oil, the heaviest of available fuel oils. These efforts removed more than 210,000 metric tons of carbon dioxide equivalent from the air last year. Electricity and gas now make up more than 85 percent of the participants’ energy use.
Barnard, FIT, NYHQ, NYU, and Rockefeller phased out 87 percent of their No. 6 fuel oil. Electricity and natural gas now account for more than 90 percent of their energy use.
Cost-Savings
Challenge participants experienced financial savings as a result of their energy projects, based on a recovery of investment costs over time. The five early achievers accrued the following savings:
• NYU–$11-14millionperyear
• NYHQ–atleast$2.5millionperyear
• Rockefeller–atleast$1millionperyear
• FIT–atleast$1millionperyear
• Barnard–roughly$1millionperyear
There Are Many Ways to Reach 30 Percent
Barnard, FIT, NYHQ, NYU, and Rockefeller began the Challenge with very different energy and emissions profiles. Some started the Challenge as high energy users, while others began with much lower energy use intensities. Several depended on just two or three energy sources while others depended on a wider mix. Still, each managed to achieve the goal in just a few years by using a tailored set of projects to address their individual profiles. Their success shows that there is no single pathway to reach a 30 per-cent reduction in emissions. With the right mix of strategies, it is possible for a wide range of institutions to achieve the goal.
New Sectors
Building on the success of the universities and hospitals, the City, partnership with the New York State Energy Research and Devel-opment Authority (NYSERDA), is expanding the program to include new sectors.
Commercial Offices
In April 2013, ten companies with significant commercial office space in New York City accepted the Challenge: AIG, BlackRock, Bloomberg L.P., Credit Suisse, Deutsche Bank, Goldman Sachs, Google, JetBlue, JP Morgan Chase, and PVH.
Commercial buildings account for 21 percent of New York City’s emissions,and interiorofficespaceaccounts forbetween40 to60 percent of energy use in a typical commercial office building. The building owners, not the tenants, are most often responsible for implementing energy efficiency upgrades to the base building systems of their buildings. This group will explore ways to increase energy efficiency in interior office spaces from innovative strate-gies such as lighting upgrades and daylighting, plug load reduc-tions, IT efficiency, and space layout optimization.
Residential Co-Ops and Condos
In the summer of 2013, the City will launch a new Mayor’s Carbon Challenge to residential co-ops and condos, expanding the pro-gram to include some of the largest residential buildings in the city. The residential sector accounts for 37 percent of New York City’s emissions, and the 10,000 co-ops and condos here represent more than 17 percent of the city’s total residential square footage. A fragmented decision-making process has been a barrier to ener-gy efficiency in the past, but the ownership structure of co-ops and condos also means that investments in energy efficiency will gen-erate cost-savings that result in direct paybacks to unit owners.
Broadway Theatres
In 2008, the Mayor launched a partnership with Broadway theatres to introduce a number of sustainability initiatives. New York City is now working with the Broadway Green Alliance to begin measur-ingenergyusein40individualBroadwaytheatresandcreateanappropriate emissions reduction goal for theatres.
Looking Forward
With the expansion of the Challenge, new participants will build on the documented success of the universities and hospitals. This diverse set of participants will continue to demonstrate that de-termined, individual organizations can motivate each other to cut their GHG emissions and contribute toward citywide emissions re-ductions. With each new participant that crosses the finish line, New York City will become a stronger and more sustainable city.
The first Mayor’s Carbon Challenge was launched with universities in 2007. Cred
it: N
YC M
ayor
’s O
ffice
Background
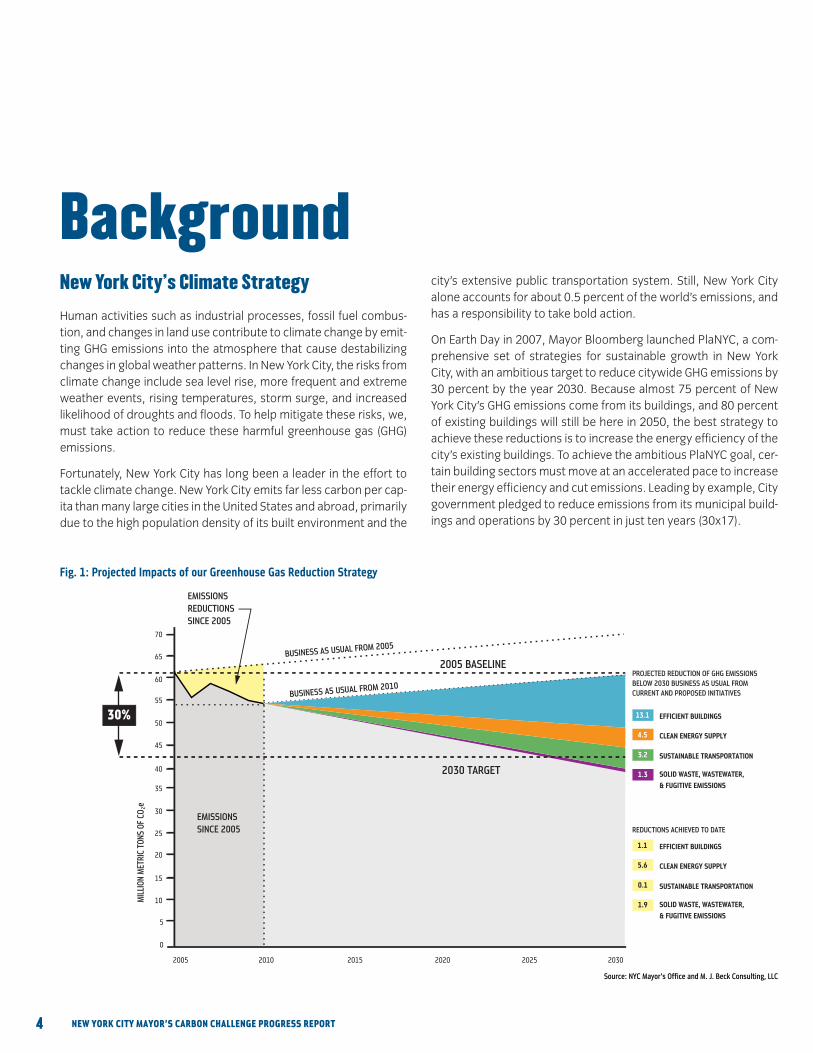
Source: NYC Mayor’s Office and M. J. Beck Consulting, LLC
Fig. 1: Projected Impacts of our Greenhouse Gas Reduction Strategy
30%
2005 BASELINE
2030 TARGET
2005
70
65
60
55
50
45
40
35
30
25
20
15
10
5
0
2010 2015 2020 2025 2030
UBUSINESS AS US AL FROM 2010
UBUSINESS AS US AL FROM 2005
EMISSIONSREDUCTIONSSINCE 2005
EMISSIONSSINCE 2005
EFFICIENT BUILDINGS
CLEAN ENERGY SUPPLY
SUSTAINABLE TRANSPORTATION
SOLID WASTE, WASTEWATER, & FUGITIVE EMISSIONS
13.1
4.5
3.2
1.3
PROJECTED REDUCTION OF GHG EMISSIONS BELOW 2030 BUSINESS AS USUAL FROMCURRENT AND PROPOSED INITIATIVES
EFFICIENT BUILDINGS
CLEAN ENERGY SUPPLY
SUSTAINABLE TRANSPORTATION
SOLID WASTE, WASTEWATER, & FUGITIVE EMISSIONS
1.1
5.6
0.1
1.9
REDUCTIONS ACHIEVED TO DATE
MIL
LION
MET
RIC
TONS
OF
CO e 2
4 NEW YORK CITY MAYOR’S CARBON CHALLENGE PROGRESS REPORT
New York City’s Climate Strategy
Human activities such as industrial processes, fossil fuel combus-tion, and changes in land use contribute to climate change by emit-ting GHG emissions into the atmosphere that cause destabilizing changes in global weather patterns. In New York City, the risks from climate change include sea level rise, more frequent and extreme weather events, rising temperatures, storm surge, and increased likelihood of droughts and floods. To help mitigate these risks, we, must take action to reduce these harmful greenhouse gas (GHG) emissions.
Fortunately, New York City has long been a leader in the effort to tackle climate change. New York City emits far less carbon per cap-ita than many large cities in the United States and abroad, primarily due to the high population density of its built environment and the
city’s extensive public transportation system. Still, New York City alone accounts for about 0.5 percent of the world’s emissions, and has a responsibility to take bold action.
On Earth Day in 2007, Mayor Bloomberg launched PlaNYC, a com-prehensive set of strategies for sustainable growth in New York City, with an ambitious target to reduce citywide GHG emissions by 30 percent by the year 2030. Because almost 75 percent of New York City’s GHG emissions come from its buildings, and 80 percent of existing buildings will still be here in 2050, the best strategy to achieve these reductions is to increase the energy efficiency of the city’s existing buildings. To achieve the ambitious PlaNYC goal, cer-tain building sectors must move at an accelerated pace to increase their energy efficiency and cut emissions. Leading by example, City government pledged to reduce emissions from its municipal build-ings and operations by 30 percent in just ten years (30x17).

Source: NYC Mayor’s Office
Fig. 2: 2011 Citywide CO2e Emissions by Sector
37%
21%
8%
8%
18%
3%
1%
4% 0.1%
Total = 53.4 million metric tons
Buildings = 74%
Residential
Commercial
Industrial
Institutional
Transportation = 21%
On-road transportation
Transit
Wastewater, fugitive = 1%
Wastewater, fugitive
Solid waste = 4%
Solid waste
Streetlights and traffic signals = 0.1%
Streelights and traffic signals
Mayor’s Carbon Challenge Universities
• BarnardCollege
• BerkeleyCollege
• TheCityUniversityofNewYork
• ColumbiaUniversity
• TheCooperUnion
• Fashion InstituteofTechnologyof theStateUniversityof
New York
• FordhamUniversity
• TheNewSchool
• NewYorkSchoolofInteriorDesign
• NewYorkUniversity
• PaceUniversity
• PolytechnicInstituteofNewYorkUniversity
• PrattInstitute
• TheRockefellerUniversity
• SchoolofVisualArts
• St.John’sUniversity
• WeillCornellMedicalCollege
Mayor’s Carbon Challenge Hospitals
• ContinuumHealthPartners
• LutheranMedicalCenter
• MaimonidesMedicalCenter
• MemorialSloan-KetteringCancerCenter
• MontefioreMedicalCenter
• MountSinaiHospital
• New York City Health and Hospitals Corporation
• NewYorkHospitalQueens
• NewYork-PresbyterianHospital
• NorthShore-LongIslandJewishHealthSystem
• NYULangoneMedicalCenter
5 NEW YORK CITY MAYOR’S CARBON CHALLENGE PROGRESS REPORT
Mayor’s Carbon Challenge
Following this pledge, Mayor Bloomberg issued the Mayor’s Car-bon Challenge (Challenge) to members of the institutional and private sectors to match City government’s goal. The Challenge is a way to motivate voluntary action and help overcome structural barriers to reduce emissions from the city’s largest sectors. Since then, 17 of the leading universities and the 11 largest hospital sys-tems—representing more than 50 individual hospitals—have ac-cepted the Challenge. Together, they make up more than 120 mil-lion square feet of space and account for 3.5 percent of the City’s total emissions, based on 2005 emissions levels. In addition, the City has joined a partnership with the Broadway Green Alliance (BGA) to launch a number of sustainability initiatives in more than 40Broadwaytheatres.
Universities
Mayor Bloomberg launched the Challenge to universities in 2007, recognizing strong leadership within academic institutions to ad-dress climate change and their significant contribution to citywide emissions. For the universities, the Challenge is an opportunity to align their academic research and environmental stewardship ef-forts with the broader citywide sustainability goals in PlaNYC.
The first nine universities accepted the Challenge in 2007, joined later by eight additional universities in 2008. Together, these 17 schools make up roughly 70 million square feet of space in the city and account for 1.5 percent of total citywide emissions, based on 2005 emissions levels.
Hospitals
Mayor Bloomberg launched the Challenge to hospitals two years later as a way to engage one of the most vitally important but
energy-intensive sectors of the economy. Hospitals viewed the Challenge as a way to reduce their air pollution and emissions, which is an important component of their missions to improve public health.
The 11 largest hospital systems in New York City accepted the Challenge in 2009, which represent more than 50 individual hospi-tals and dozens of clinics, outpatient centers, and medical offices. Together, these facilities make up nearly 50 million square feet of space in the city and account for roughly two percent of total city-wide emissions, again based on 2005 emissions levels.

Cred
it: N
YC M
ayor
’s O
Ffice
Mayor Bloomberg launched the University Challenge in 2007, following the release of PlaNYC.
6 NEW YORK CITY MAYOR’S CARBON CHALLENGE PROGRESS REPORT
Challenge Metrics
The university and hospital participants have pledged to reduce the emissions intensity of their buildings, measured as carbon di-oxide equivalent per square foot, by 30 percent in ten years from a set base year. The participants track energy use by fuel type, as-sociated GHG emissions, emissions intensity per square foot, and energy use intensity per square foot. Metrics used for the Chal-lenge include:
Energy Use: The total amount of energy used in a participant’s buildings and facilities. Energy use is measured as million British thermal units (MMBtu), which is a standardized measure of total energy use to compare across different energy sources. The Chal-lenge measures energy use in terms of “source energy,” or energy use that takes into account production, transmission, and deliv-ery losses of an upstream energy source. “Source energy” is not weather-normalized for the Challenge.
GHG Emissions: The total level of emissions that result from a participant’s energy use. GHG emissions are measured as carbon dioxide equivalent (CO
2e), which is a level of carbon dioxide (CO
2)
that would have the same climate impact as a given concentration and type of GHG gas. In this report, “GHG emissions” and “carbon emissions” are used interchangeably to refer to CO
2e. Under the
Challenge methodology, emissions are calculated by applying a “carbon coefficient” to each participant’s annual energy consump-tion by fuel type. The Challenge uses New York City-specific coef-ficients for electricity and steam, which are calculated by the New
York City Mayor’s Office of Long-Term Planning and Sustainability (Mayor’s Office). These coefficients are based on aggregate power plant data and are in compliance with the 2010 Local Government Operations Protocol (LGOP). All emissions coefficients for natural gas,propane,andNo.2,4,and6fueloilsweredevelopedbytheU.S. Environmental Protection Agency (EPA).
For the purposes of the Challenge, the coefficients used to deter-mine the carbon emissions associated with electricity and steam are fixed at 2005 levels, which is because these coefficients can change dramatically over time. For example, since 2005, the retire-ment of coal-fired power plants, increased use of natural gas, and construction of more energy-efficient combined cycle power units have decreased the carbon intensity of New York City’s electricity supply by more than 30 percent. Annually changing the electricity coefficient to reflect this reduction would provide an advantage to Challenge participants that depend primarily on electricity. Fixing the electricity and steam carbon coefficients at 2005 levels there-fore measures only the direct efforts of the participants, and not exogenous changes to the energy supply.
Total Floor Area: The total square footage of a participant’s owned and leased space. Total floor area is measured in terms of gross square feet (sq ft), which includes the total number of square feet measured between the exterior surfaces of the enclosing fixed walls, including spaces such as vent shafts, stairs, basements, etc.
Emissions Intensity: The level of a participant’s GHG emissions per square foot (CO
2e/sq ft). This is used to measure the 30 percent
emissions reduction goal.

Emissions Intensity
The participants base their Challenge reduction goal on emis-sions intensity because this standardizes emissions levels for facilities of different sizes. An absolute emissions reduction was not feasible because the university and hospital partici-pants expected to significantly increase their size as they add more students, patients, staff, and research capacity, which is both central to these institutions’ missions and vital to New York City’s broader economy. Measuring emissions intensity will still translate to real emissions reductions even as the uni-versities and hospitals continue to grow, particularly as they renovate older buildings and facilities to make them more en-ergy efficient.
Emissions Scopes
The Challenge participants are asked to report emissions from the energy used in their buildings, but it is important to under-stand that this does not cover the full profile of their emissions. According to the World Resources Institute’s Greenhouse Gas Protocol, the full profile of an institution’s emissions include three main categories: “Scope 1” emissions, which are direct emissions physically produced on the institution’s property (for example, by fossil fuels used in boilers); “Scope 2” emis-sions, which are indirect emissions that result from offsite energy generation in a location separate from the institu-tion’s property (for example, district steam or electricity); and “Scope 3” emissions, which are indirect emissions that are not produced on-site or from offsite energy generation but are nonetheless attributable to the institution’s activities (for ex-ample, emissions from air travel or solid waste disposal). The Challenge does not include Scope 3 emissions, both because they are not always located within the city and because there is a lack of agreement on proper accounting methodologies for calculating these emissions. However, GHG accounting protocols are evolving to include methodologies for calculat-ing and reporting Scope 3 emissions. As these protocols be-come more established, future inventories may include emis-sions from Scope 3 sources.
7 NEW YORK CITY MAYOR’S CARBON CHALLENGE PROGRESS REPORT
This report usually describes emissions intensity in terms of metric tons of carbon dioxide equivalent per square foot (Mtons CO
2e/sq
ft), but will sometimes refer to emissions intensity as pounds of carbon dioxide equivalent per square foot (lbs CO
2e/sq ft). These
two measures are interchangeable: 1 metric ton of CO2e=2,204.6
pounds of CO2e. Metric tons of CO
2e/sq ft will generally be used
to represent the aggregate carbon intensity among institutions, while pounds of CO
2e/sq ft will be used to represent the carbon
intensity of an individual institution at a smaller scale.
Energy Use Intensity (EUI): The level of a participant’s source energy use per square foot, measured as MMBtu per square foot (MMBtu/sq ft). “Source energy” takes into account all production, transmission, and delivery losses of the energy source. For pur-poses of the Challenge, EUI is not weather-normalized.
Base Year: The year from which Challenge participants’ GHG emissions reductions are measured. Universities were allowed to choose a base year of either 2005 or 2006. However, some univer-sities were only able to obtain complete energy use data for later years. In these cases, universities were permitted to use the earli-est base year for which they had complete data.
All hospitals use a base year of 2005 or 2006 except one that uses a base year of 2007 because it is missing energy data for previous years.1
Start Year: The year that a participant began the Challenge. The universities’ start year is 2007. The hospitals’ start year is 2009.
End Year: The last year of the Challenge and the year by which the 30 percent emissions reduction goal must be achieved. This is ten years from a Challenge participant’s start date. The universities’ end year is 2017 and the hospitals’ end year is 2019.
Outcomes
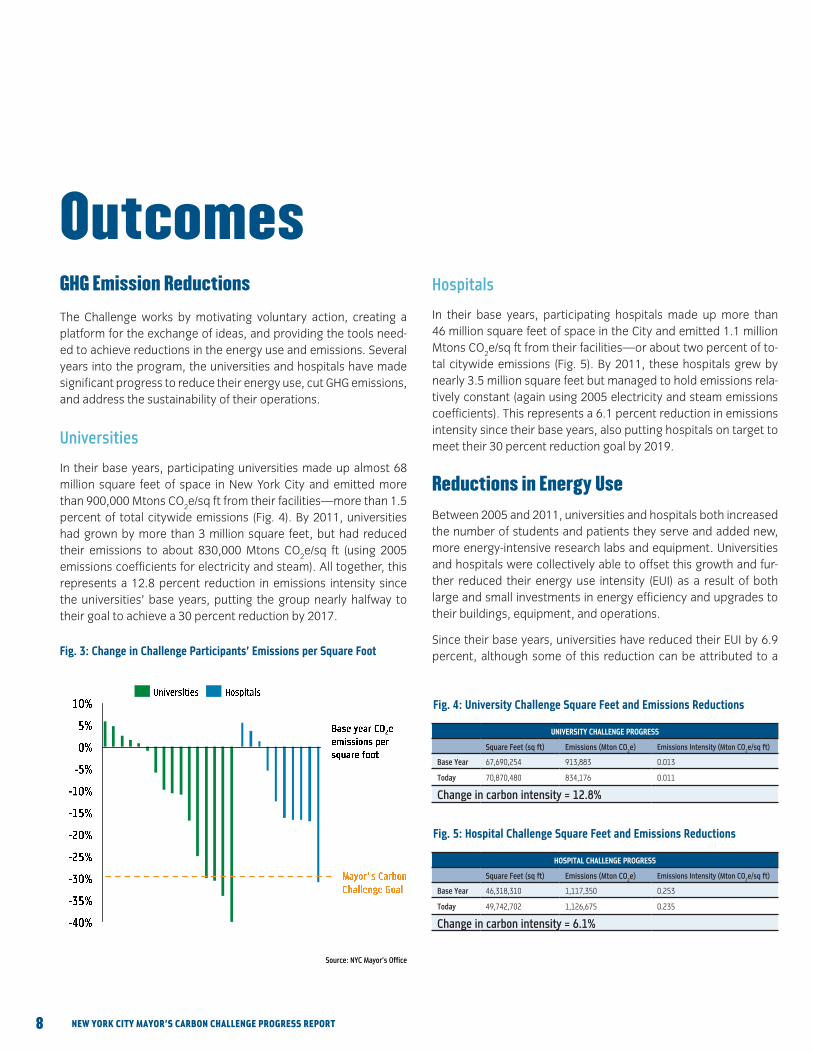
Source: NYC Mayor’s Office
Fig. 3: Change in Challenge Participants’ Emissions per Square Foot
UNIVERSITY CHALLENGE PROGRESS
Square Feet (sq ft) Emissions (Mton CO2e) Emissions Intensity (Mton CO
2e/sq ft)
Base Year 67,690,254 913,883 0.013
Today 70,870,480 834,176 0.011
Change in carbon intensity = 12.8%
Fig. 5: Hospital Challenge Square Feet and Emissions Reductions
Fig. 4: University Challenge Square Feet and Emissions Reductions
HOSPITAL CHALLENGE PROGRESS
Square Feet (sq ft) Emissions (Mton CO2e) Emissions Intensity (Mton CO
2e/sq ft)
Base Year 46,318,310 1,117,350 0.253
Today 49,742,702 1,126,675 0.235
Change in carbon intensity = 6.1%
8 NEW YORK CITY MAYOR’S CARBON CHALLENGE PROGRESS REPORT
GHG Emission Reductions
The Challenge works by motivating voluntary action, creating a platform for the exchange of ideas, and providing the tools need-ed to achieve reductions in the energy use and emissions. Several years into the program, the universities and hospitals have made significant progress to reduce their energy use, cut GHG emissions, and address the sustainability of their operations.
Universities
In their base years, participating universities made up almost 68 million square feet of space in New York City and emitted more than 900,000 Mtons CO
2e/sq ft from their facilities—more than 1.5
percentof totalcitywideemissions (Fig.4).By2011,universitieshad grown by more than 3 million square feet, but had reduced their emissions to about 830,000 Mtons CO
2e/sq ft (using 2005
emissions coefficients for electricity and steam). All together, this represents a 12.8 percent reduction in emissions intensity since the universities’ base years, putting the group nearly halfway to their goal to achieve a 30 percent reduction by 2017.
Hospitals
In their base years, participating hospitals made up more than 46millionsquarefeetofspaceintheCityandemitted1.1millionMtons CO
2e/sq ft from their facilities—or about two percent of to-
tal citywide emissions (Fig. 5). By 2011, these hospitals grew by nearly 3.5 million square feet but managed to hold emissions rela-tively constant (again using 2005 electricity and steam emissions coefficients). This represents a 6.1 percent reduction in emissions intensity since their base years, also putting hospitals on target to meet their 30 percent reduction goal by 2019.
Reductions in Energy Use
Between 2005 and 2011, universities and hospitals both increased the number of students and patients they serve and added new, more energy-intensive research labs and equipment. Universities and hospitals were collectively able to offset this growth and fur-ther reduced their energy use intensity (EUI) as a result of both large and small investments in energy efficiency and upgrades to their buildings, equipment, and operations.
Since their base years, universities have reduced their EUI by 6.9 percent, although some of this reduction can be attributed to a
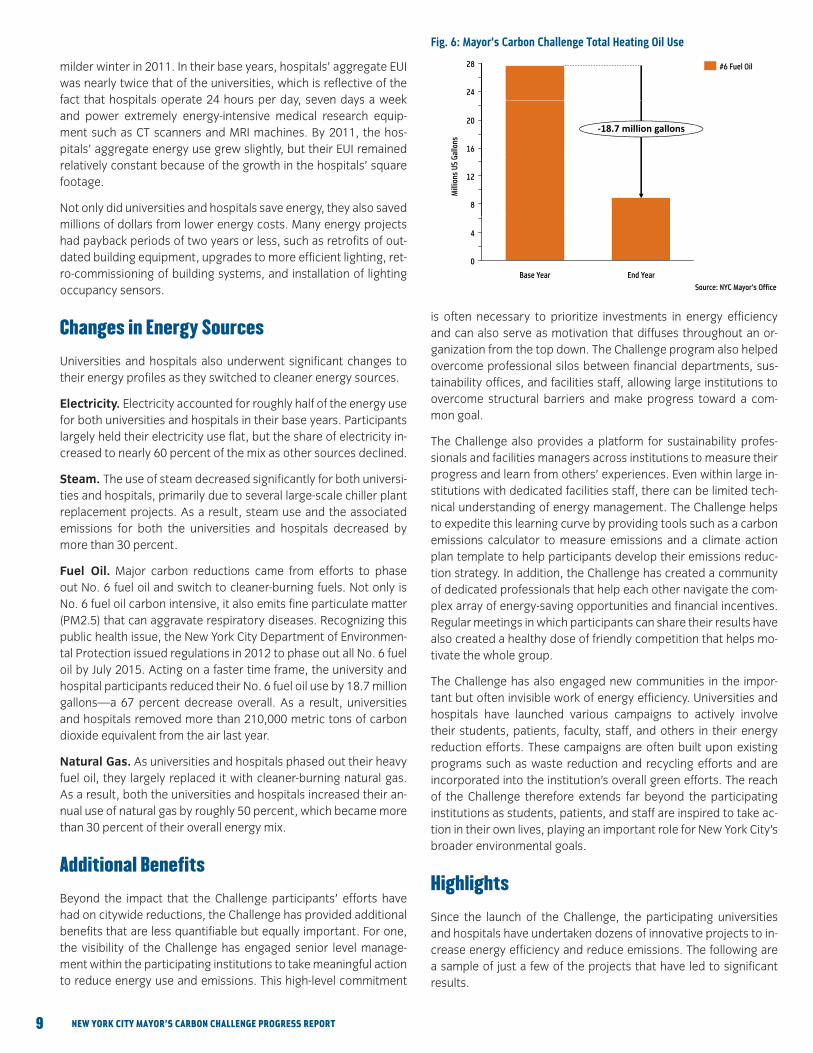
Source: NYC Mayor’s Office
Fig. 6: Mayor’s Carbon Challenge Total Heating Oil Use
Base and End Year Comparison of Heating Oil Use in Hospital Challenge
24
28 #6 Fuel Oil
20‐18.7 million gallons
16
Gallo
ns
12
8
Mill
ions
US
G
0
E d YB Y
4
End YearBase Year
9 NEW YORK CITY MAYOR’S CARBON CHALLENGE PROGRESS REPORT
milder winter in 2011. In their base years, hospitals’ aggregate EUI was nearly twice that of the universities, which is reflective of the fact thathospitalsoperate24hoursperday,sevendaysaweekand power extremely energy-intensive medical research equip-ment such as CT scanners and MRI machines. By 2011, the hos-pitals’ aggregate energy use grew slightly, but their EUI remained relatively constant because of the growth in the hospitals’ square footage.
Not only did universities and hospitals save energy, they also saved millions of dollars from lower energy costs. Many energy projects had payback periods of two years or less, such as retrofits of out-dated building equipment, upgrades to more efficient lighting, ret-ro-commissioning of building systems, and installation of lighting occupancy sensors.
Changes in Energy Sources
Universities and hospitals also underwent significant changes to their energy profiles as they switched to cleaner energy sources.
Electricity. Electricity accounted for roughly half of the energy use for both universities and hospitals in their base years. Participants largely held their electricity use flat, but the share of electricity in-creased to nearly 60 percent of the mix as other sources declined.
Steam. The use of steam decreased significantly for both universi-ties and hospitals, primarily due to several large-scale chiller plant replacement projects. As a result, steam use and the associated emissions for both the universities and hospitals decreased by more than 30 percent.
Fuel Oil. Major carbon reductions came from efforts to phase out No. 6 fuel oil and switch to cleaner-burning fuels. Not only is No. 6 fuel oil carbon intensive, it also emits fine particulate matter (PM2.5) that can aggravate respiratory diseases. Recognizing this public health issue, the New York City Department of Environmen-tal Protection issued regulations in 2012 to phase out all No. 6 fuel oil by July 2015. Acting on a faster time frame, the university and hospital participants reduced their No. 6 fuel oil use by 18.7 million gallons—a 67 percent decrease overall. As a result, universities and hospitals removed more than 210,000 metric tons of carbon dioxide equivalent from the air last year.
Natural Gas. As universities and hospitals phased out their heavy fuel oil, they largely replaced it with cleaner-burning natural gas. As a result, both the universities and hospitals increased their an-nual use of natural gas by roughly 50 percent, which became more than 30 percent of their overall energy mix.
Additional Benefits
Beyond the impact that the Challenge participants’ efforts have had on citywide reductions, the Challenge has provided additional benefits that are less quantifiable but equally important. For one, the visibility of the Challenge has engaged senior level manage-ment within the participating institutions to take meaningful action to reduce energy use and emissions. This high-level commitment
is often necessary to prioritize investments in energy efficiency and can also serve as motivation that diffuses throughout an or-ganization from the top down. The Challenge program also helped overcome professional silos between financial departments, sus-tainability offices, and facilities staff, allowing large institutions to overcome structural barriers and make progress toward a com-mon goal.
The Challenge also provides a platform for sustainability profes-sionals and facilities managers across institutions to measure their progress and learn from others’ experiences. Even within large in-stitutions with dedicated facilities staff, there can be limited tech-nical understanding of energy management. The Challenge helps to expedite this learning curve by providing tools such as a carbon emissions calculator to measure emissions and a climate action plan template to help participants develop their emissions reduc-tion strategy. In addition, the Challenge has created a community of dedicated professionals that help each other navigate the com-plex array of energy-saving opportunities and financial incentives. Regular meetings in which participants can share their results have also created a healthy dose of friendly competition that helps mo-tivate the whole group.
The Challenge has also engaged new communities in the impor-tant but often invisible work of energy efficiency. Universities and hospitals have launched various campaigns to actively involve their students, patients, faculty, staff, and others in their energy reduction efforts. These campaigns are often built upon existing programs such as waste reduction and recycling efforts and are incorporated into the institution’s overall green efforts. The reach of the Challenge therefore extends far beyond the participating institutions as students, patients, and staff are inspired to take ac-tion in their own lives, playing an important role for New York City’s broader environmental goals.
Highlights
Since the launch of the Challenge, the participating universities and hospitals have undertaken dozens of innovative projects to in-crease energy efficiency and reduce emissions. The following are a sample of just a few of the projects that have led to significant results.

Berkeley College
Columbia University
St. John’s University
Key Project: Residential Fuel Conversions
Columbia University is working with Con Edison to convert heating fuel in 75 residential buildings from heavy fuel oil to natural gas, which will both reduce the university’s emis-sions and improve local air quality for the entire neighbor-hood. So far, Columbia has converted heating fuel in 22 of its buildings. The university expects to complete conver-sions in an additional 27 buildings in 2013, with the re-maindertobeconvertedbyJune2014.Asaresultofthesefuel conversions, Columbia projects that it will reduce its emissions by 7,236 metric tons of carbon dioxide equiva-lent—or roughly five percent of its baseline emissions in 2005.
Columbia University owns and operates more than 13 million square feet of space in NYC. Planned projects across these properties will reduce emissions by up to 45,000 metric tons.
Key Project: Lighting Retrofit Project
Berkeley College began a lighting retrofit project in 2007 to replace 675 lighting fixtures in one of the college’s three buildings in New York City. Berkeley found it could replace four higher watt bulbs with two low-watt bulbs and a reflec-tor kit and still produce the same amount of light through-out the building, which would reduce electricity usage by 31,370 watts and cut lighting costs by more than half. In combination with a rebate from NYSERDA, the energy sav-ings of the project generated a payback period of less than one year, proving that spending a little on energy efficiency can realize great savings. Berkeley College now plans to replicate the success of this lighting project in a second
Berkeley College might be small, but that has not stopped the college from realizing big energy savings, helping the college reduce its emissions by 17 percent since 2007.
Key Project: Behavioral Change
St. John’s University has made student engagement in-tegral to its emissions reduction strategy. Every year, St. John’s participates in competitions such as RecycleMania and Campus Conservation Nationals to engage students in sustainability measures. St. John’s won Campus Conserva-tion Nationals for the New York region in 2012, reducing energy use in 9 dorms by 37,071 kWh—an average of 10 percent per dorm. Now, St. John’s has challenged other NYC universities to compete in 2013. Student “Wattstop-pers” are using data gathered from energy use dashboards and meters for standard appliances to win the competition again this year.
Students are key to St. John’s University’s success so far, helping to achieve a 12 percent reduction in emissions since 2007 through their behavioral changes.
10 NEW YORK CITY MAYOR’S CARBON CHALLENGE PROGRESS REPORT
Cred
it: B
erke
ley
Colle
ge
Phot
o Cr
edit:
Col
umbi
a Un
iver
sity
Cred
it: S
t. Jo
hn’s
Uni
vers
ity

Montefiore Medical Center is improving public health by reducing emissions in the Bronx, which has asthma rates that are 70% higher than the other boroughs.
Montefiore Medical CenterKey Project: Combined Heat and Power Plant
Montefiore is a pioneer of combined heat and power (CHP) generation within the healthcare community. The medical center installed itsfirstCHPsystemin1994andasecondin 2003, which together generate 11 MW of power and pro-duce steam for heating, cooling, and hot water. The plant provides reliable power that allows the hospital to continue operating even during blackouts and other emergencies. With a system-wide efficiency of 70 percent, the CHP sys-tem cuts emissions by 17,000 tons per year and uses 26 percent less fuel than electricity from the grid. Now, Mon-tefiore is planning an additional CHP plant to cut emissions beyond the 17 percent reduction already achieved.
NYU Langone Medical Center
Memorial Sloan-Kettering Cancer CenterKey Project: Central Chilled Water Plant Oversight
Memorial Sloan-Kettering Cancer Center (MSKCC) launched the Central Chilled Water Plant Oversight program in 2007 to find simple, cost-saving ways to optimize performance of its chiller plants. MSKCC installed a utility grade measure-ment system to collect data on its chilled water production for continuous energy oversight and analysis. Based on the data, MSKCC reset its condenser water supply schedule to optimize efficiency and changed piping configurations to maximize free cooling. Implementing these changes in four chiller plants reduced the hospital’s steam use by nearly 30,000mlbsandcutelectricityuseby2.4millionkWh,re-ducingcostsbymorethan$800,000lastyear.
Memorial Sloan-Kettering Cancer Center saved a total of $2.6 million from its energy projects in 2012—funds that the hospital can reinvest in its cancer patients and research.
Key Project: Enhanced Energy Management
NYU Langone Medical Center has created an institutional framework to help make energy management a top priority across the organization. In 2008, NYU Langone appointed an energy manager to oversee project development and created a committee to track energy performance. Each month, the energy committee reviews the status of proj-ects, examines energy usage to pinpoint opportunities for improvement, and recognizes successful initiatives and staff achievements. The committee currently oversees 33 active projects and has committed $7.4million in capitalinvestments since 2008, which have helped NYU Langone achieve a 17 percent reduction in emissions since 2005.
NYU Langone Medical Center’s Energy Committee manages and evaluates the performance of dozens of energy projects at a time, helping the hospital reduce its emissions by 17%.
Cred
it: M
onte
fiore
Med
ical
Cen
ter
11 NEW YORK CITY MAYOR’S CARBON CHALLENGE PROGRESS REPORT
Cred
it: N
YU L
ango
ne M
edic
al C
ente
r
Cred
it: M
emor
ial S
loan
-Ket
terin
g Ca
ncer
Cen
ter

Early AchieversFig. 7: Early Achievers’ Absolute CO
2e Emissions Reductions
Source: NYC Mayor’s Office
0
50,000
100,000
150,000
200,000
250,000
300,000
350,000
2005 2006 2007 2008 2009 2010 2011 2012
Years in Challenge
MM
Btu/
sq ft
-86,406 Mtons CO2e
Mayor’s Carbon Challenge Early Achievers• NewYorkUniversity:30.03%
• TheRockefellerUniversity:30.64%
• BarnardCollege:34.09%
• FashionInstituteofTechnology:40.78%
• NewYorkHospitalQueens:30.92%
12 NEW YORK CITY MAYOR’S CARBON CHALLENGE PROGRESS REPORT
Since Mayor Bloomberg launched the Challenge to universities and hospitals, four universities and one hospital reached the goal, cut-ting their emissions by 30 percent or more in half the time allotted for the Challenge. The four universities are Barnard College (Bar-nard), the Fashion Institute of Technology of the State University of New York (FIT), New York University (NYU), and The Rockefeller University (Rockefeller), each of which exceeded the 30 percent goal in less than five years since joining the Challenge. The hospital is New York Hospital Queens (NYHQ), which achieved the goal in just two years since joining the Challenge. All together, these five institutions’ GHG reductions are equal to nearly one percent of the total reduction in citywide emissions since 2005.
Overview of Reductions
At the beginning of the Challenge, Barnard, FIT, NYHQ, NYU, and Rockefeller operated nearly 18 million square feet of space and emitted more than 300,000 Mtons CO
2e/sq ft (Fig. 8). In their most
recent inventories, these five institutions grew by about 500,000 square feet but cut their emissions by more than 86,000 Mtons CO
2e/sq ft (Fig. 7). The reduction in emissions from these five in-
stitutions alone is equal to 0.85 percent of New York City’s total emissions reduction last year, or the equivalent of removing about 18,000 passenger vehicles from the road.5
Reductions from Energy Efficiency
Dramatic reductions in energy use occurred as a result of major investments in energy efficiency. Even as Barnard, FIT, NYHQ, NYU, and Rockefeller added capacity, they reduced energy use by more than 20 percent, although this is partly due to a mild winter in 2011.
All together, the institutions cut their energy consumption from 5.5millionMMBtuto4.4millionMMBtuandreducedtheirEUIfrom0.311MMBtu/sqftto0.243MMBtu/sqft.This21.7percentreduc-tion in EUI accounts for more than two-thirds of their total reduc-tion in emissions.
Barnard, FIT, NYHQ, NYU, and Rockefeller reduced energy use through a combination of both large-scale investments in energy efficiency and low-cost energy conservation measures. Large en-ergy projects included the installation of a 13.8 megawatt (MW) cogeneration plant at NYU, which allowed NYU to both reduce to-tal energy use and switch to cleaner-burning natural gas, as well
as chiller plant replacements at FIT and NYHQ. However, smaller, lower-cost energy projects, which can have a payback time of two years or less, also contributed significantly to the reductions. These projects include lighting upgrades, window replacements, retro-commissioning of building equipment, lighting and heat-ing controls, improved operations and maintenance, schedule changes to maximize efficiency, procurement of energy efficient appliances, enhanced insulation, and public education campaigns aimed at behavioral change.
Reductions from Fuel Switching
Switching heavy fuel oil to cleaner energy sources such as elec-tricity and natural gas also accounted for a significant portion of Barnard, FIT, NYHQ, NYU, and Rockefeller’s emissions reductions. In their base years, these five institutions burned nearly 10 million gallonsofNo.2,No.4,andNo.6fueloil,emittingnearly110,000
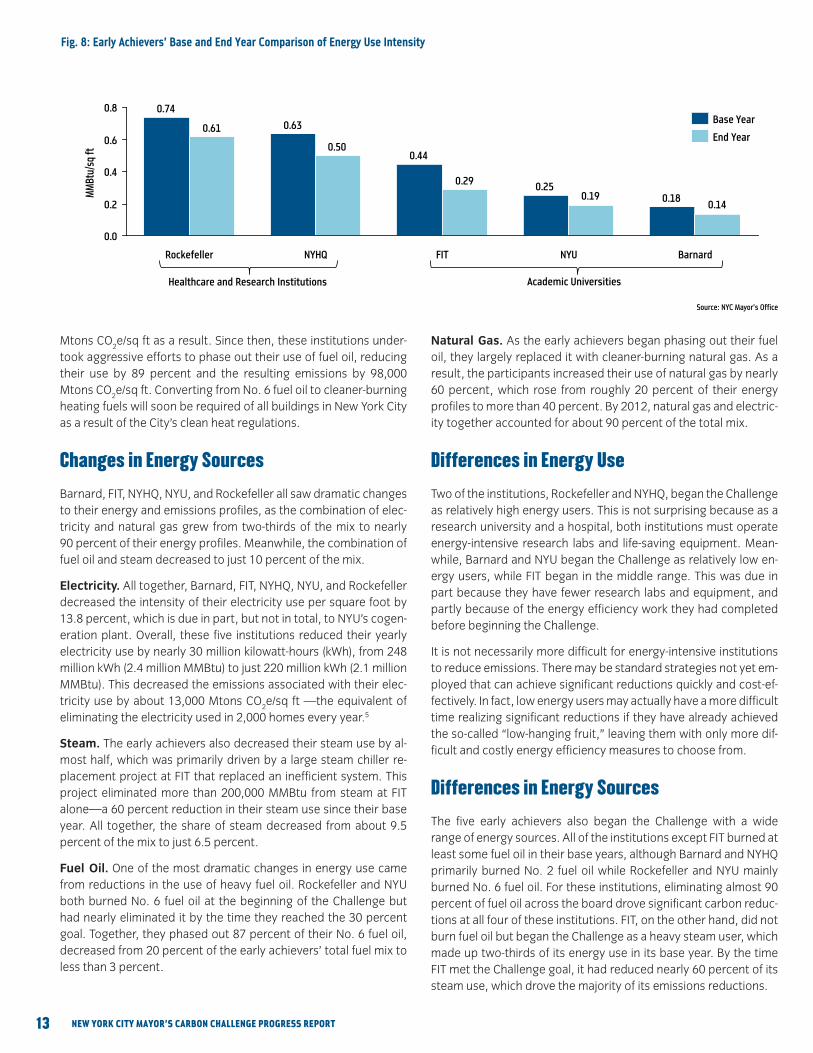
Fig. 8: Early Achievers’ Base and End Year Comparison of Energy Use Intensity
0.180.25
0.44
0.63
0.74
0.140.19
0.29
0.50
0.61
0.0
0.2
0.4
0.6
0.8
NYHQRockefeller FIT NYU Barnard
Base Year
End Year
MM
Btu/
sqft
Early Achievers’ Base and End Year Comparison of EUI
Fig. 8: Early Achievers’ Base and End Year Comparison of EUI
Healthcare and Research Institutions Academic Universities
Source: NYC Mayor’s Office
13 NEW YORK CITY MAYOR’S CARBON CHALLENGE PROGRESS REPORT
Mtons CO2e/sq ft as a result. Since then, these institutions under-
took aggressive efforts to phase out their use of fuel oil, reducing their use by 89 percent and the resulting emissions by 98,000 Mtons CO
2e/sq ft. Converting from No. 6 fuel oil to cleaner-burning
heating fuels will soon be required of all buildings in New York City as a result of the City’s clean heat regulations.
Changes in Energy Sources
Barnard, FIT, NYHQ, NYU, and Rockefeller all saw dramatic changes to their energy and emissions profiles, as the combination of elec-tricity and natural gas grew from two-thirds of the mix to nearly 90 percent of their energy profiles. Meanwhile, the combination of fuel oil and steam decreased to just 10 percent of the mix.
Electricity. All together, Barnard, FIT, NYHQ, NYU, and Rockefeller decreased the intensity of their electricity use per square foot by 13.8 percent, which is due in part, but not in total, to NYU’s cogen-eration plant. Overall, these five institutions reduced their yearly electricityusebynearly30millionkilowatt-hours(kWh),from248millionkWh(2.4millionMMBtu)tojust220millionkWh(2.1millionMMBtu). This decreased the emissions associated with their elec-tricity use by about 13,000 Mtons CO
2e/sq ft —the equivalent of
eliminating the electricity used in 2,000 homes every year.5
Steam. The early achievers also decreased their steam use by al-most half, which was primarily driven by a large steam chiller re-placement project at FIT that replaced an inefficient system. This project eliminated more than 200,000 MMBtu from steam at FIT alone—a 60 percent reduction in their steam use since their base year. All together, the share of steam decreased from about 9.5 percent of the mix to just 6.5 percent.
Fuel Oil. One of the most dramatic changes in energy use came from reductions in the use of heavy fuel oil. Rockefeller and NYU both burned No. 6 fuel oil at the beginning of the Challenge but had nearly eliminated it by the time they reached the 30 percent goal. Together, they phased out 87 percent of their No. 6 fuel oil, decreased from 20 percent of the early achievers’ total fuel mix to less than 3 percent.
Natural Gas. As the early achievers began phasing out their fuel oil, they largely replaced it with cleaner-burning natural gas. As a result, the participants increased their use of natural gas by nearly 60 percent, which rose from roughly 20 percent of their energy profilestomorethan40percent.By2012,naturalgasandelectric-ity together accounted for about 90 percent of the total mix.
Differences in Energy Use
Two of the institutions, Rockefeller and NYHQ, began the Challenge as relatively high energy users. This is not surprising because as a research university and a hospital, both institutions must operate energy-intensive research labs and life-saving equipment. Mean-while, Barnard and NYU began the Challenge as relatively low en-ergy users, while FIT began in the middle range. This was due in part because they have fewer research labs and equipment, and partly because of the energy efficiency work they had completed before beginning the Challenge.
It is not necessarily more difficult for energy-intensive institutions to reduce emissions. There may be standard strategies not yet em-ployed that can achieve significant reductions quickly and cost-ef-fectively. In fact, low energy users may actually have a more difficult time realizing significant reductions if they have already achieved the so-called “low-hanging fruit,” leaving them with only more dif-ficult and costly energy efficiency measures to choose from.
Differences in Energy Sources
The five early achievers also began the Challenge with a wide range of energy sources. All of the institutions except FIT burned at least some fuel oil in their base years, although Barnard and NYHQ primarily burned No. 2 fuel oil while Rockefeller and NYU mainly burned No. 6 fuel oil. For these institutions, eliminating almost 90 percent of fuel oil across the board drove significant carbon reduc-tions at all four of these institutions. FIT, on the other hand, did not burn fuel oil but began the Challenge as a heavy steam user, which made up two-thirds of its energy use in its base year. By the time FIT met the Challenge goal, it had reduced nearly 60 percent of its steam use, which drove the majority of its emissions reductions.

Fig. 9: Early Achievers’ Base and End Year Comparison of Carbon Emissions by Fuel Type
Base Year (2005 or 2006)
Emissions Intensity: 38.7 lbs per sq ft
End Year (2011 or 2012)
Emissions Intensity: 27.2 lbs per sq ft
11%
24%
1%
10% 20%
34%
9% 4%
1% 0%
45%
41%
Source: NYC Mayor’s Office
14 NEW YORK CITY MAYOR’S CARBON CHALLENGE PROGRESS REPORT
Electricity accounted for anywhere between one-third and one half of the five early achievers’ energy profiles in their base years. NYU led the way in the institutions’ electricity reductions, with a decrease in electricity use of about 27 percent, largely due to its cogeneration plant but also due to aggressive energy efficiency efforts such as occupancy sensors in its dorms and enhanced training in operations and maintenance. Meanwhile, electricity decreased or stayed relatively constant at the other institutions, while the share of electricity in the overall mix increased as other sources decreased.
All five participants started off using some natural gas and have increased this use since their base years, although some increased natural gas usage much more dramatically than others. For ex-ample, Rockefeller began with natural gas at just six percent of its energy mix, but since then has quadrupled its use, which now accounts for nearly half of the university’s energy consumption. Natural gas accounted for just 0.1 percent of FIT’s energy use in its base year but has since increased by tenfold.
Cost Savings
In order to reach the 30 percent goal, Barnard, FIT, NYHQ, NYU, and Rockefeller pursued a range of strategies that were tailored to fit their individual needs. This included a mix of large-scale capital investment projects and smaller projects with quicker pay-back times. However, the common outcome among the five early achievers was saving millions of dollars by reducing energy con-sumption and cutting emissions—savings that can be reinvested directly into these institutions’ students, patients, and research.
• NYUissavingbetween$11-14millionperyearinenergycostsfrom the combination of its new 13.8 MW cogeneration plant and aggressive campuswide energy efficiency measures.
• NYHQ is savingat least$2.5millionper year inenergycostsfrom phasing out its fuel oil and investing in energy efficiency measures such as a large chiller plant replacement.
• Rockefellerissavingmorethan$1millioninenergycostsfrommeasures that include phasing out its fuel oil and reducing its lighting and air conditioning needs, particularly in its labs.
• FITisalsosavingmorethan$1millioninenergycostsbyreplac-ing a large, outdated steam chiller, weatherizing its buildings, purchasing energy efficient appliances, and other measures.
• Barnardissavingatleast$1millioninenergycostsfromreduc-ing its fuel oil, adjusting temperature settings, installing occu-pancy sensors, and improving building operation.
Highlights
There are some common trends in how Barnard, FIT, NYHQ, NYU, and Rockefeller achieved their reductions. For example, all of the early achievers reduced or held their electricity use constant, even as they added students, patients, and research capacity, and all institutions that used fuel oil at the start of the Challenge also un-dertook aggressive efforts to phase it out.
However, the progress of the five early achievers is even more re-markable because of the wide variety in their energy and emissions profiles. Each institution achieved early reductions through unique strategies, demonstrating that there are many ways to reach a 30 percent reduction. The key factor of success for each institution was a strategic plan tailored to individual needs and dedicated staff that moved quickly to implement the strategy across their campuses. The sustainability and facilities staff vary by composi-tion and size across the institutions, but each provided direction and accountability while consistently measuring the results. Using tools provided by the Mayor’s Office, these participants were able to track energy use, emissions reductions, and financial savings from projects, which resulted in a virtuous cycle that helped to ob-tain additional capital needed for new projects.
Natural Gas
#2 Fuel Oil
#4 Fuel Oil
#6 Fuel Oil
Steam
Electricity
Source: NYC Mayor’s Office
Natural Gas#2 Fuel Oil
Electricity
Year in Challenge2006 2007 2008 2009 2010 20112005 2012
lbs
CO2e/
sq ft
0
10
20
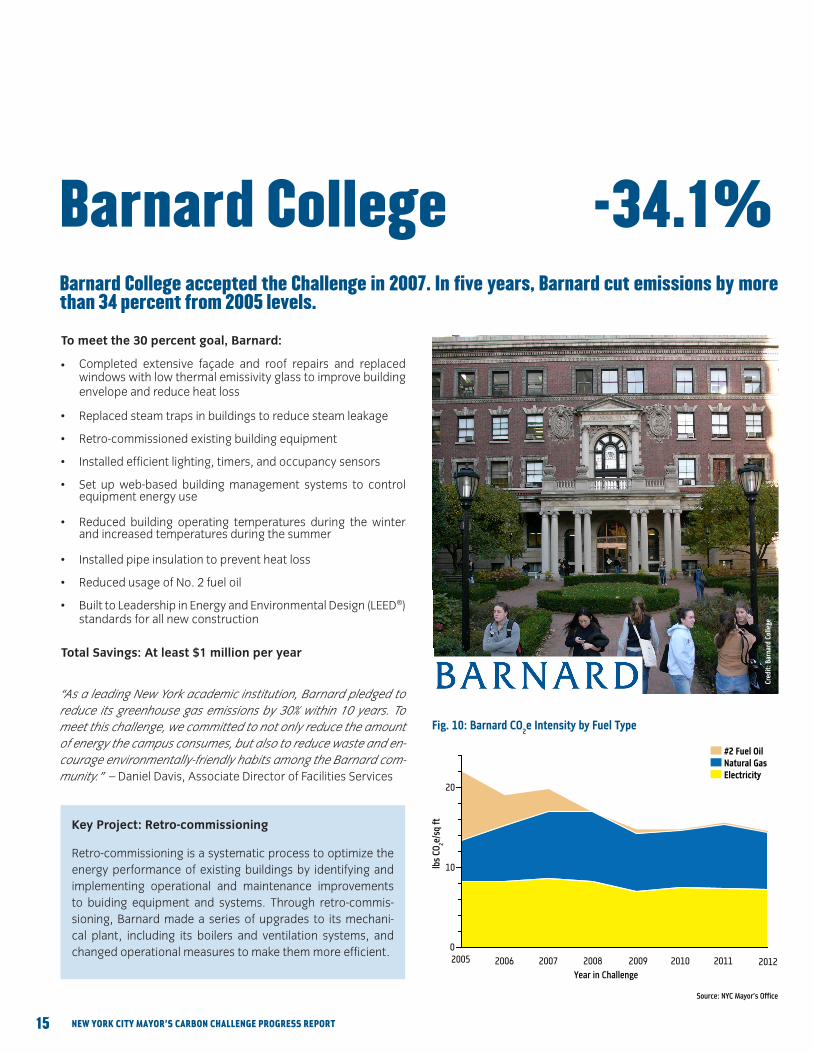
Fig. 10: Barnard CO2e Intensity by Fuel Type
Key Project: Retro-commissioning
Retro-commissioning is a systematic process to optimize the energy performance of existing buildings by identifying and implementing operational and maintenance improvements to buiding equipment and systems. Through retro-commis-sioning, Barnard made a series of upgrades to its mechani-cal plant, including its boilers and ventilation systems, and changed operational measures to make them more efficient.
15 NEW YORK CITY MAYOR’S CARBON CHALLENGE PROGRESS REPORT
Barnard College accepted the Challenge in 2007. In five years, Barnard cut emissions by more than 34 percent from 2005 levels.
To meet the 30 percent goal, Barnard:
• Completed extensive façade and roof repairs and replaced windows with low thermal emissivity glass to improve building envelope and reduce heat loss
• Replacedsteamtrapsinbuildingstoreducesteamleakage
• Retro-commissionedexistingbuildingequipment
• Installedefficientlighting,timers,andoccupancysensors
• Set upweb-based buildingmanagement systems to control equipment energy use
• Reduced building operating temperatures during the winterand increased temperatures during the summer
• Installedpipeinsulationtopreventheatloss
• ReducedusageofNo.2fueloil
• BuilttoLeadershipinEnergyandEnvironmentalDesign(LEED®)standards for all new construction
Total Savings: At least $1 million per year
Barnard College
“As a leading New York academic institution, Barnard pledged to reduce its greenhouse gas emissions by 30% within 10 years. To meet this challenge, we committed to not only reduce the amount of energy the campus consumes, but also to reduce waste and en-courage environmentally-friendly habits among the Barnard com-munity.”–DanielDavis,AssociateDirectorofFacilitiesServices
-34.1%
Cred
it: B
arna
rd C
olle
ge

Source: NYC Mayor’s Office
lbs
CO2e/
sq ft
Years in Challenge2005 2006 2007 2008 2009 2010 2011
60
50
40
30
20
10
0
Natural Gas
Steam
Electricity
Fig. 11: FIT CO2e Intensity by Fuel Type
Key Project: New Chiller Plant and Cooling Tower
In 2007, FIT installed a new chiller plant to efficiently meet FIT’s cooling demands. The plant is composed of a new 500 ton electric chiller with a variable speed drive that provides efficient, modulated cooling, and three steam turbines, each with 1,000 tons of cooling capacity. Additionally, the plant was retrofitted with a new steam turbine driver, refurbished refrig-erant compressors, re-tubed evaporators and condensers, and a more ozone-friendly refridgerant. FIT also replaced its cooling tower with a new 6-cell cooling tower (shown above), equipped with automated controls and variable speed fans. FIT estimates that that project will remove about 11 mil-lion pounds of CO
2e per year and save the university almost
$600,000annuallyinreducedsteamcosts.
16 NEW YORK CITY MAYOR’S CARBON CHALLENGE PROGRESS REPORT
To meet the 30 percent goal, FIT:
• Replacedanoutdatedchillerplantandcoolingtower
• Installedlightingretrofitsandoccupancysensors
• Replacedwindowswithlowthermalemissivityglass
• Installedhigh-efficiencyrefrigerators,washers,anddryers
• Retrofitted50,000squarefeetoflabspace
• Paintedover10,000squarefeetofroofswithreflectivepaint
• InstalledagreenroofontheShirleyGoodmanResourceCenter
Total Savings: At least $1 million per year
The Fashion Institute of Technology accepted the Challenge in 2007. In four years, FIT cut emissions by more than 40 percent from 2005 levels.
“The Fashion Institute of Technology is very pleased to be a partici-pant in the Mayor’s Carbon Challenge for New York colleges and universities. The tools and information provided by the Mayor’s Of-fice of Long Term Planning and Sustainability allowed the College to document a 39% reduction in carbon emissions as of 2011, mak-ing FIT one of the first colleges to successfully meet the Mayor’s Challenge.” –Dr.JoyceBrown,President
-40.8% Fashion Institute of Technology
Cred
it: F
ashi
on In
stitu
te o
f Tec
hnol
ogy
of th
e St
ate
Univ
ersi
ty o
f New
Yor
kKey Project: Chiller Plant Replacement
In 2007, FIT installed a new chiller plant to efficiently meet FIT’s cooling demands. The plant is composed of a new 500 ton electric chiller with a variable speed drive that provides efficient, modulated cooling, and three steam turbines, each with 1,000 tons of cooling capacity. Additionally, the plant was retrofitted with a new steam turbine driver, refurbished refrig-erant compressors, re-tubed evaporators and condensers, and a more ozone-friendly refrigerant. FIT also replaced its cooling tower with a new 6-cell cooling tower (shown above), equipped with automated controls and variable speed fans. FIT estimates that that project will remove about 11 mil-lion pounds of CO
2e per year and save the university almost
$600,000annuallyinreducedsteamcosts.

0
10
20
30
40
50
60
70
80
Natural Gas
#2 Fuel Oil
Electricity
Years in Challenge2005 2006 2007 2008 2009 2010 2011
lbs
CO2e/
sq ft
Key Project: Chiller Plant Replacement
NYHQ’s former central chiller plant consisted of three 1,100-ton gas fired absorption chillers serving the hospital’s multiple cooling needs. With the help of financial incentives from the New York State Energy Research and Development Authority (NYSERDA)’s Existing Facilities program, NYHQ replaced one chiller with a 1,200-ton high efficiency electric chiller (shown above), which will use 17 percent less electricity than stan-dard performance chillers. It reduces NYHQ’s annual carbon emissions by seven percent, or 1,655 Mtons CO
2e/sq ft from
theatmosphere.Thissavesthehospitalmorethan$175,000per year in reduced energy costs.
17 NEW YORK CITY MAYOR’S CARBON CHALLENGE PROGRESS REPORT
To meet the 30 percent goal, NYHQ:
• Replaced a gas-fired absorption chillerwith a high efficiency electric chiller with a variable frequency drive
• Replaced a No. 2 fuel oil boilerwith two new high pressurenatural gas boilers
• Retro-commissionedalarge,30-yearoldairhandlingunit
• Installedphotocellcontrolstoincreasenaturallightingandoc-cupancy sensors to turn off lighting in unoccupied rooms
• UsedacentralizedBuildingManagementSystemtoshutoffun-used ventilation systems during non-business hours
• Builtallnewconstructiontohigherenergyefficiencystandards
• Launched an aggressive education campaign to encouragemore energy efficient practices on the part of doctors, pa-tients, and staff
Total Savings: At least $2.5 million per year
“The Mayor’s Carbon Challenge has helped us cut emissions, reduce our energy use and save money in the process.” –KevinMannle, Associate Vice President for Facilities Management
New York Hospital Queens -30.9% In 2009, New York Hospital Queens accepted the Challenge. In two years, the hospital cut emissions by 31 percent from 2005 levels.
Source: NYC Mayor’s Office
Fig. 12: NYHQ CO2e Intensity by Fuel Type
Cred
it: N
ew Y
ork
Hosp
ital Q
ueen
s
Key Project: Chiller Plant Replacement
NYHQ’s former central chiller plant consisted of three 1,100-ton gas fired absorption chillers serving the hospital’s multiple cooling needs. With the help of financial incentives from the New York State Energy Research and Development Authority (NYSERDA)’s Existing Facilities program, NYHQ replaced one chiller with a 1,200-ton high efficiency electric chiller (shown above), which will use 17 percent less electricity than stan-dard performance chillers. It reduces NYHQ’s annual carbon emissions by seven percent, or 1,655 Mtons CO
2e from the
atmosphere.Thissavesthehospitalmorethan$175,000peryear in reduced energy costs.

Source: NYC Mayor’s Office
Natural Gas
#2 Fuel Oil
#4 Fuel Oil
#6 Fuel Oil
Steam
Electricity
Year in Challenge
lbs
CO2e/
sq ft
2006 2007 2008 2009 2010 2011 2012
30
20
10
0
Key Project: Combined Heat and Power Plant Installment
NYU completed a cutting-edge, high-efficiency combined heat andpower(CHP)plantin2011atacostof$125million,whichwas the largest capital investment in NYU’s history. The plant providesheating,cooling,andelectricityto40buildings,pro-viding half the campus with more efficient energy and helping to prevent brownouts by taking pressure off the city’s strained electrical grid. The plant reduces NYU’s GHG emissions by more than 20 percent, cuts air pollutants by 68 percent, and doubles the power output of the previous system. The CHP systemisexpectedtosave$5-8millionperyearinreduceden-ergy costs, freeing up resources for additional energy-saving retrofits and academic purposes. Over time, NYU’s investment will be returned through cost savings, with support from finan-cial incentives from NYSERDA.
18 NEW YORK CITY MAYOR’S CARBON CHALLENGE PROGRESS REPORT
NYU accepted the Challenge in 2007 and in five years, reduced emissions by 30 percent from 2006 levels. Now, NYU has set out to cut its emissions in half by the end of the Challenge.
To meet the 30 percent goal, NYU:
• Constructeda13.8MWcogenerationfacility
• Retrofittedandupgradedoutdatedequipment
• Installedoccupancysensorsforlighting,heatingandcooling
• Expandedtheuseofbuildingmanagementsystems
• Trainedequipmentoperatorsinenergyefficiency
• Minimizeduseofheavyfueloilsforheating
• InstalledENERGYSTARboilers,printers,andcomputers
• IntegratedenergyefficiencyintotheconstructionprocessandbuilttoLEED®standardsfornewconstruction
• Engagedstudents,facultyandstafftouselessenergy
Total Savings: $11-14 million per year
“Seldom have I seen an initiative unite and motivate our campus more than our green efforts. From declines in electrical consump-tion to increases in recycling, from our new co-gen plant’s reduc-tions in greenhouse emissions to expansion of bicycle riding, the commitment to meeting the challenges of climate change is not only an institutional priority at NYU, but a widespread and very personal one as well.” –JohnSexton,President
New York University -30.0% Fig. 13: NYU CO
2e Intensity by Fuel Type
Cred
it: N
ew Y
ork
Univ
ersi
ty

Source: NYC Mayor’s Office
Natural Gas#6 Fuel Oil
Electricity
Year in Challenge
2006 2007 2008 2009 2010 20112005
lbs
CO2e/
sq ft
0
10
20
30
40
50
60
70
80
90
100
Key Project: Energy Efficient Laboratories
Laboratory air systems are required to use 100% outside air and are typically designed for the worst case load scenarios. This level of air turnover is extremely expensive, but is only required about 1% of the year. To increase the efficiency of air flows in its labs, Rockefeller University installed variable air volume (VAV) controls to vary the quantity of air delivered based on occupation levels and cooling requirements and installed sash monitoring controls on fume hoods to reduce hood exhaust flows. With these measures, Rockefeller Univer-sity reduced the volume of air on average by about 15%.
19 NEW YORK CITY MAYOR’S CARBON CHALLENGE PROGRESS REPORT
To meet the 30 percent goal, Rockefeller University:
• FormedaGreenTaskForceoffaculty,staff,andadministrators to discuss green issues, potential projects, and intiatives
• Installedvariableairvolume(VAV)controlstovaryairdeliveryto laboratories for occupancy levels and cooling requirements
• Installedmoreenergyefficientlighting,reducingupto50%oflighting loads in several buildings
• ConvertedNo.6fueloiltonaturalgasforheatingsystems
• Rebalancedairflowsthroughoutthecampus
• Adjusted temperature settings to bewarmer in the summerand cooler in the winter
• Reducedheatingduringnightsandweekends
• Launched a “Shut the Sash” campaign to lower laboratoryfume hoods when not in use, reducing air conditioning needs
• BuilttoLEED®standardsfornewconstruction
• Engaged students in sustainability efforts through recyclingprograms
Total Savings: Over $1 million in reduced energy costs per year
The Rockefeller University accepted the Challenge in 2007. In less than five years, the University cut emissions by 30.6 percent from 2005 levels.
“After joining the Mayor’s Carbon Challenge, The Rockefeller Uni-versity’s administration made energy a major priority, making sig-nificant upgrades to the University’s buildings and infrastructure. As a result, in less than five years The Rockefeller University met the Mayor’s Carbon Challenge goal. The Rockefeller University now operates more efficiently and sustainably—which is good for students, the University, and the planet!”–AlexKogan,AssociateVice President of Plant Operations & Housing
The Rockefeller University -30.6%
Fig. 14: Rockefeller CO2e Intensity by Fuel Type
Cred
it: T
he R
ocke
felle
r Uni
vers
ity

New SectorsMayor’s Carbon Challenge Commercial Offices
• American International Group
• BlackRock
• BloombergL.P.
• CreditSuisse
• DeutscheBank
• GoldmanSachs
• JetBlue
• JPMorganChase
• PVH
20 NEW YORK CITY MAYOR’S CARBON CHALLENGE PROGRESS REPORT
Expansion of the Challenge
Building on the success of the existing program, the City is now partnering with NYSERDA to expand the Challenge to additional sectors, including New York City’s largest commercial offices and residential cooperatives and condominiums. The City is also in the process of enhancing the Challenge partnership with Broadway theatres.
Commercial Offices
In April 2013, the City, in partnership with NYSERDA, launched the Challenge to commercial offices to engage some of the largest global corporations in energy efficiency, with a focus on reducing the energy used in their interior offices and leased spaces. Com-mercial buildings account for 21 percent of citywide emissions, and interiorofficespacemakesupbetween40to60percentofthe energy use in a typical office building. However, most energy efficiency efforts have historically been geared toward upgrades that the building owners can make in their base building systems, and often exclude upgrades that office tenants can make in the interior office space.
The new Challenge to commercial offices motivates companies with significant office space in New York City to reduce emissions and energy use in these spaces. This new Challenge will include two groups: commercial office tenants and commercial building owner-occupiers. Because these two groups have fundamental differences in the energy use that they have direct operational control over, they will measure their emissions in different ways. Commercial tenants will measure per capita emissions resulting from the energy use in their interior office space, which includes lighting, plug loads, data centers, and supplemental heating and ventilation systems, while building owner-occupiers measure their emissions per square foot from their whole buildings, including the base building systems.
Ten global corporations with significant office space in New York City have accepted the Challenge, committing to reduce emis-sions per capita or per square foot by 30 percent or more in ten years. Together, these ten corporations make up more than 20 mil-lion square feet of space in New York City and employ more than 70,000 New Yorkers.
Residential Co-Ops and Condos
In the spring of 2013, the City will launch the Challenge to residen-tial co-ops and condos, targeting energy use and emissions from the City’s largest residential cooperatives and condominiums. New YorkCity’s2010LocalLaw84benchmarkingdatashowsthatGHGemissions from large residential buildings represent nearly 60 per-cent of emissions from all buildings greater than 50,000 square feet. Because the ownership structure of co-ops and condos in-centivizes the deployment of energy efficiency measures, these buildings are particularly strong candidates for the Challenge.
Broadway Theatres
In 2008, the City joined a partnership with the Broadway Green Al-liance (BGA) to launch a number of sustainability initiatives in more than40Broadwaytheatres.Theseinitiativesincludereplacingallmarquee and roof lighting with energy efficient light-emitting di-ode (LED) lights, recycling supplies and reusing props, replacing bottled water with tap water, appointing a “Green Captain” on every Broadway production, and more. The City is now working with the BGA and the Natural Resources Defense Council (NRDC) to measure the energy used in participating Broadway theatres, and create the proper set of metrics for an emissions reduction goal.

Mayor’s Carbon Challenge Broadway Theatres
• Al Hirschfeld Theatre
• AmbassadorTheatre
• AmericanAirlinesTheatre
• AugustWilsonTheatre
• BelascoTheatre
• BernardB.JacobsTheatre
• BoothTheatre
• BroadhurstTheatre
• TheBroadwayTheatre
• BrooksAtkinsonTheatre
• CircleintheSquareTheatre
• CortTheatre
• EthelBarrymoreTheatre
• EugeneO’NeillTheatre
• FoxwoodsTheatre
• GeraldSchoenfeldTheatre
• GershwinTheatre
• HelenHayesTheatre
• ImperialTheatre
• JohnGoldenTheatre
• LongacreTheatre
• Lunt-FontanneTheatre
• LyceumTheatre
• MajesticTheatre
• MarquisTheatre
• MinskoffTheatre
• MusicBoxTheatre
• NederlanderTheatre
• NeilSimonTheatre
• NewAmsterdamTheatre
• PalaceTheatre
• RichardRodgersTheatre
• SamuelJ.FriedmanTheatre
• ShubertTheatre
• StephenSondheimTheatre
• St.JamesTheatre
• Studio54
• VivianBeaumontTheatre
• WalterKerrTheatre
• WinterGardenTheatre
Cred
it: N
YC M
ayor
’s O
ffice
The Broadway Green Alliance has partnered with the Mayor’s Carbon Challenge to encourage sustainable practices in Broadway theatres.
21 NEW YORK CITY MAYOR’S CARBON CHALLENGE PROGRESS REPORT

Conclusion
22 NEW YORK CITY MAYOR’S CARBON CHALLENGE PROGRESS REPORT
The success of the Mayor’s Carbon Challenge to Universities and Hospitals demonstrates that motivating voluntary action on the part of private institutions can lead to substantial progress on pub-lic policy goals. Taken together, the efforts of the universities and Hospitals have had a measureable impact on citywide emissions, making the Challenge a tremendously cost-effective way for New York City to make progress toward its PlaNYC goal to reduce city-wide emissions by 30% by 2030.
The Challenge has brought about high-level commitment to reduce emissions within the partner institutions, reduced the learning curve of facilities staff on issues of energy management, and en-gaged new communities in the effort to tackle climate change. As a resut, the participants have collectively saved millions of dollars in reduced energy costs. Keys to this success include developing tools to help participants plan their strategy and track reductions, creating a platform for the open exchange of ideas, and providing the opportunity for institutions and private sector organizations to partner with the City on on sustainability initiatives and be recog-nized for those efforts.
The organizational and financial benefits that have resulted from the Mayor’s Carbon Challenge will continue to pay dividends for years to come. For Barnard, FIT, NYHQ, NYU, and Rockefeller, the five early achievers that have already reached the 30% goal, this means that their work is not over. Each of these insitutions has pledged to continue investing in their energy efficiency, and sev-eral are even considering a commitment to reach a 50% emissions reduction stretch-goal by the end of the Challenge.
Building on this successful model, the City of New York, together with NYSERDA, will now expand the partnership with Broadway theaters, launch two new Challenges to commercial offices and residential co-ops and condos, and explore options to expand the Challenge model to other initiatives including water use and solid waste. Some lessons learned along the way from the Mayor’s Car-bon Challenge will provide insights for these and other voluntary engagement programs.
For one, the lack of a standard GHG accounting methodology and a set of accepted sustainability metrics is a major difficulty. Although the Challenge methodology is in full compliance with the Local Government Operations Protocol (LGOP), issues remain that lack clear answers, such as how to account for the changing carbon intensity of the City’s electricity supply or the marginal impact of onsite generation on peak load carbon intensity. In these cases, the Mayor’s Office made executive decisions that attempt to bal-ance simplicity of reporting with accuracy of information. In the future, more should be done to coordinate between the various GHG reporting methodologies across government agencies and outside programs.
In addition, there are difficulties associated with managing a ten-year program, which continues to exist even after staff leave. The Challenge program seeks to overcome these difficulties by helping to provide a foundation for participants to instutionalize their en-ergy management and providing simple tools for participants with varying degrees of expertise so they can track their emissions and plan their strategies without needing substantial guidance. Again, creating these tools requires a careful balance between both sim-plicity and accuracy in reporting.
In the five years since Mayor Bloomberg launched the first Chal-lenge, the program demonstrated that private institutions can achieve sharp emissions reductions in a short period of time that have a measureable impact on citywide emissions. But on an even broader scale, the success of the Challenge program to universi-ties and hospitals proves that voluntary engagement programs can play a role in fostering the stakeholder buy-in and behavioral changes necessary to tackle climate change. With an expansion of the Challenge underway, we will continue to engage new and vi-tally important sectors of New York City in this effort. As large com-mercial offices, residential co-ops and condos, and Broadway the-atres begin their work, they will join the universities and hospitals as case studies that can be scaled up in New York City and beyond.

APPENDICES
23 NEW YORK CITY MAYOR’S CARBON CHALLENGE PROGRESS REPORT
Methodology
Acronym Definitions Endnotes
24
25
26
A GREENER GREATER NEW YORK
A
B
C

Methodology
Appendix A
STANDARD UNITS FOR THE MAYOR’S CARBON CHALLENGE
Measure Units Abbreviation Description
Greenhouse Gas Emissions
Carbon dioxide equivalent CO2e
The level of carbon dioxide (CO2) that would have the same climate impact as a given concentration and type of green-
house gas.
Energy Use Million British thermal units MMBtuA standardized measure of total energy used to compare energy use across different fuel types. For purposes of the Challenge, energy use is measure in terms of source energy, or energy use that takes into account weather fluctuations or transmission, delivery, and production losses of an energy source.
Floor Area Gross Square Feet sq ftIncludes the total number of square feet measured between the exterior surfaces of the enclosing fixed walls. This includes spaces such as vent shafts, stairs, basements, etc.
Carbon Intensity
Metric tons of carbon dioxide equivalent per gross square foot
MTCO2e/sq ft
A measure of the intensity of carbon emitted per square foot, which standardizes emissions levels for buildings of differ-ent sizes.
Energy Use Intensity
Million metric British thermal units per gross square foot
MMBtu/sq ft A measure of the intensity of energy used per sqaure foot, which standardizes energy use for buildings of different sizes.
MAYOR’S CARBON CHALLENGE COEFFICIENTS
Electricity (kWh) Natural Gas (Therms) #2 Fuel Oil (US Gallons) #4 Fuel Oil (US Gallons) #6 Fuel Oil (US Gallons) Propane (US Gallons) Steam (Mlbs)
MT CO2e per unit energy 0.0004227 0.0053156 0.0102640 0.0110167 0.0113276 0.0124138 0.0894146
MMBTu per unit energy 0.0095346 0.1000000 0.1380000 0.1460000 0.1500000 0.0910000 1.3301500
24 NEW YORK CITY MAYOR’S CARBON CHALLENGE PROGRESS REPORT
All Challenge participants track their carbon emissions according to a common methodology, whereby participants aggregate their respective energy consumption data by fuel type and enter it into a Carbon Emissions Inventory calculator provided by the Mayor’s Office. Participants currently track only building energy use. Meth-odologies to calculate emissions for vehicle fleets and solid waste are under development, but will be optional under the Challenge. Emissions from these sources are only expected to account for two to three percent of participants’ total emissions.
The Carbon Emissions Inventory calculator applies a “carbon co-efficient” to the Challenge participants’ annual fuel consumption to determine the associated level of GHG emissions, which is measured in terms of CO
2e. Total emissions are then divided by
the participant’s gross square footage to determine their carbon intensity (CO
2e/sq ft). Participants are required to track their car-
bon intensity for each year of the Challenge, beginning in the base year and ending ten years later. Most Challenge Universities and Hospitals use a base year of 2005 or 2006, which is the first year they begin measuring energy use and the year from which their emissions reductions are measured. Universities began the Chal-lenge in 2007 or 2008 and have until 2017 to complete it; hospitals began in 2009 and will complete the Challenge in 2019.
All carbon coefficients for the Challenge are in compliance with the 2010 LGOP. The Challenge uses New York City-specific coefficients
for electricity and steam, which are developed by the Mayor’s Office based on aggregate power plant data. All emissions coef-ficientsfornaturalgas,propane,andNo.2,4,and6fueloilsweredeveloped by the EPA.
For the purposes of the Challenge, the carbon coefficients for elec-tricity and steam are fixed at 2005 estimates. Changes in primary energy sources used to generate the City’s electricity and steam supply cause these coefficients to vary significantly between years. Since 2005, the retirement of coal-fired power plants, increased use of natural gas, and construction of more energy-efficient com-bined cycle power units have decreased the carbon intensity of New York City’s electricity supply by over 30 percent. If the electric-ity coefficient annually changes to reflect these changes in carbon intensity at the source, it would provide a significant advantage to Challenge participants who depend primarily on electricity. Fixing the carbon coefficients for electricity and steam at 2005 figures therefore levels the playing field and measures only the direct emissions reduction efforts taken by participants.
In 2011, the Mayor’s Office decided to hold the electricity and steam coefficients constant, basing them on the best estimates for 2005 emissions levels. The City has updated these estimates since 2011, but for purposes of the Challenge, both coefficients are maintained at these figures. This is not expected to significant-ly change the emissions levels for participants.

Acronym Definitions
Appendix B
25 NEW YORK CITY MAYOR’S CARBON CHALLENGE PROGRESS REPORT
CO2e/sq ft – carbon dioxide equivalent per square foot (carbon
intensity)
EUI–energyuseintensity
FY–fiscalyear
GHG–greenhousegas
kWh–kilowatt-hours
lbs–pounds
LED–light-emittingdiode
LEED®–LeadershipinEnergyandEnvironmentalDesign
LGOP–LocalGovernmentOperationsProtocol
MMBtu–millionBritishthermalunits
MRI - Magnetic Resonance Imaging
MW–megawatt
PM2.5 - fine particulate matter
sqft–grosssquarefoot
Entities:
BGA–BroadwayGreenAlliance
EPA–UnitedStatesEnvironmentalProtectionAgency
FIT–FashionInstituteofTechnologyoftheStateUniversityofNewYork
NRDC–NaturalResourceDefenseCouncil
NYHQ–NewYorkHospitalQueens
NYSERDA - New York State Energy Research and Development Authority
NYU–NewYorkUniversity
WRI–WorldResourcesInstitute
The following acronyms are used throughout this
report:
CT–ComputedTomography
CO2–carbondioxide
CO2e–carbondioxideequivalent

Endnotes
Appendix C
26 NEW YORK CITY MAYOR’S CARBON CHALLENGE PROGRESS REPORT
1. Berkeley College, Cooper Union, Pace University, Polytechnic Institute of NYU, School of Visual Arts, St. John’s University, and Montefiore Medical Center use a base year of 2007.
2. Barnard College, New York University, and The Rockefeller Uni-versity submitted energy data for Fiscal Year 2012 (FY 2012) to demonstrate their 30 percent emissions reductions; this data is substituted for their 2011 energy data. The Polytechnic Insti-tute of New York University and Cooper Union submitted data through 2010, thus 2010 energy data is substituted for their 2011 energy data. The New School has not yet submitted an inventory due to problems locating accurate energy data and therefore has been excluded from these data sets.
3. Continuum Health Partners has not yet submitted a complete inventory due to problems locating accurate energy data, and therefore has been excluded from these data sets.
4. Challengeparticipantswereoriginallygiventheoptionofsub-mitting inventories based on either a calendar year or a fiscal year. In 2012, all Challenge participants were asked to begin reporting on a calendar year in order to standardize submis-sions, but participants that could demonstrate a 30 percent reduction for Fiscal Year 2012 (FY 2012) were allowed to report on a fiscal year for their most recent inventory. Those reporting their FY 2012 energy use are Barnard, NYU, and Rockefeller.
5. All equivalencies are calculated by the EPA Greenhouse Gas Equivalencies Calculator which can be found online at: http://www.epa.gov/cleanenergy/energy-resources/calculator.html.

27 NEW YORK CITY MAYOR’S CARBON CHALLENGE PROGRESS REPORT
The data presented is for Fiscal Years 2005 through 2011.
For more information, please visit:
www.nyc.gov/carbonchallenges

28 NEW YORK CITY MAYOR’S CARBON CHALLENGE PROGRESS REPORT
Mayor’s Office of Long-Term Planning & SustainabilityCity HallNew York, NY 10007