Embed Size (px)
Citation preview
AAGGEENNDDAA
FFIINNAANNCCEE
COMMITTEE MMEEEETTIINNGG DDAATTEE:: MMAARRCCHH 1133,, 22001122
TTIIMMEE:: 99::0000 AA..MM..
LLOOCCAATTIIOONN:: 112255 WWOORRTTHH SSTTRREEEETT
BBOOAARRDD RROOOOMM
BBOOAARRDD OOFF
DDIIRREECCTTOORRSS
CALL TO ORDER BERNARD ROSEN
ADOPTION OF THE FEBRUARY 7, 2012 MINUTES
SS SENIOR VICE PRESIDENT’S REPORT MARLENE ZURACK KEY INDICATORS/CASH RECEIPTS & DISBURSEMENTS REPORTS FRED COVINO
INFORMATION ITEMS
1. QUARTERLY PS REVIEW OF KEY INDICATORS FOR THE PERIOD 6/18/11 – 1/14/12 FRED COVINO 2. FINANCIAL PLAN STATUS REPORT FRED COVINO 3. MEDICAID ELIGIBILITY REPORT –JANUARY 2012 MAXINE KATZ 4. STATEMENT OF REVENUES & EXPENSES AS OF 12/31/11 TO 12/31/10 JAY WEINMAN
OLD BUSINESS NEW BUSINESS
ADJOURNMENT BERNARD ROSEN
Minutes of the February 7, 2012 Finance Committee Meeting
2
MINUTES
MEETING DATE: FEBRUARY 7, 2012
FFIINNAANNCCEE
CCOOMMMMIITTTTEEEE
BBOOAARRDD OOFF
DDIIRREECCTTOORRSS
The meeting of the Finance Committee of the Board of Directors was held on February 7, 2012 in the 5th floor Board Room with Bernard Rosen presiding as Chairperson. ATTENDEES COMMITTEE MEMBERS Bernard Rosen Alan D. Aviles, Esq Michael A. Stocker, MD Emily Youssouf Josephine Bolus, RN Andrea Cohen, (representing Deputy Mayor Linda Gibbs in a voting capacity) OTHER ATTENDEES M. Dolan, Assistant Director, DC 37 M. Dubowski, Analyst, City Office of Management & Budget (OMB) J. DeGeorge, Analyst, State Comptroller’s Office C. Fiorentini, Analyst, Independent Budget Office (IBO) R. McIntyre, Account Executive, Siemens M. Meagher, Analyst, OMB E. Mendez-Santiago, Commission on the Public Hospital System (CPHS)
HHC STAFF V. Bekker, Chief Financial Officer (CFO), Generations+ Northern Manhattan Health Network D. Benjamin, Restructuring Project Management Officer D. Cates, Chief of Staff, Board Affairs
Minutes of the February 7, 2012 Finance Committee Meeting
3
F. Covino, Corporate Budget Director, Corporate Budget N. Doyle, Assistant Vice President, Corporate Human Resources/Workforce Development L. Free, Senior Director, Managed Care R. Fischer, Associate Executive Director, Bellevue Hospital Center D. Frimer, Controller, Coney Island Hospital K. Garramone, Chief Financial Officer, North Bronx Healthcare Network G. Guilford, Senior Director, Office of the Senior Vice President/Finance/Managed Care D. Guzman, Associate Director C. Jacobs, Senior Vice President, Patient Safety, Accreditation M. Katz, Senior Assistant Vice President, Corporate Revenue Management P. Lockhart, Secretary to the Corporation, Office of the Chairman P. Lok, Director, Corporate Reimbursement/Debt Financing N. Mar, Director, Corporate Reimbursement Services/Debt Financing T. Mammo, Deputy Chief of Staff, Office of the President R. Mayer, Director, Corporate Internal Audits L. Migdal, Deputy Chief Financial Officer, Corporate Finance D. Moskos, Director, Office of Facilities Development K. Olson, Senior Director, Corporate Budget F. Ortiz, Senior Associate Director, Woodhull Medical & Mental Health Center J. Perrine, 1st Deputy IG, Office of the Inspector General S. Russo, Senior Vice President, General Counsel, Office of Legal Affairs A. Saul, Senior Associate Director, Kings County Hospital Center W. Saunders, Assistant Vice President, Intergovernmental Relations J. Schick, Chief of Staff, Office of the President J. Weinman, Corporate Comptroller, Corporate Comptroller’s Office M. Williams, Assistant Vice President, Corporate Affirmative Action/EEO R. Wilson, Senior Vice President/Chief Medical Officer, Medical & Professional Affairs M. Zurack, Senior Vice President, Corporate Finance/Managed Care
Minutes of the February 7, 2012 Finance Committee Meeting
4
CALL TO ORDER: The meeting of the Finance Committee was called to order at 9:05 a.m. The minutes of the January 10, 2012 Finance Committee meeting were adopted as submitted.
CHAIR’S REPORT BERNARD ROSEN
SENIOR VICE PRESIDENT’S REPORT MARLENE ZURACK Ms. Zurack informed the Committee that her report would be deferred until later in the agenda in order to accommodate the action item.
ACTION ITEM ANTONIO MARTIN/JOSEPH QUINONES Authorizing the President of the New York City Health and Hospitals Corporation (the “Corporation”) to negotiate and execute a management contract with Johnson Controls, Inc. (“JC Inc”) to manage the Corporation’s plant maintenance operations for each HHC facility. The contract will be for a term of nine years in a total amount not to exceed $363,191,470. Mr. Martin after reading the resolution informed the Committee that a presentation, which was included in the package, would be presented by Mr. Quinones, Senior Assistant Vice President, Contract Administration and Control. Mr. Quinones stated that several representatives, Paul Morgan, Stephen Herbst, Bob Giro, Glen Zilligan,
Chris Howard, Stephen Terrano, Carol Skotnicki, Jayme Hamann from Johnson Control, Inc. (JCI) were in attendance to address questions from the Committee. Beginning with the presentation, Mr. Quinones, in addressing the question of why there is a need for a vendor to manage plant maintenance, stated that HHC is currently exposed to substantial rising costs in its Plant Maintenance which includes operations, repair and maintenance of HHC’s facilities. As part of the Corporation’s objective for achieving savings, the Restructuring Leadership Committee identified Plant Maintenance as one of the 39 projects included in that area. In order to control and standardize costs throughout the enterprise, a management contract is needed in order to control rising costs through the deployment of an experienced vendor. Failure to take action would result in HHC having to allocate limited resources from patient care to cover increased cost in non-core goods and services. In order to identify a skilled and experienced vendor, a request for proposals (RFP) was issued in accordance with HHC’s operating procedures. The RFP selection Committee as part of that process chose Johnson Controls, Inc (JCI) as the highest rated proposer on both cost and quality. The proposed contract with Johnson Control will include multiple guarantees over nine years that will negate HHC’s exposure to those projected rising costs. In terms of the contractor’s background, Mr. Quinones stated that Johnson Controls, Inc was founded in 1885. The Building Efficiency Division was established to address the need for a specialized, high quality, innovative and responsive Plant Maintenance Company, which services over 3,500 healthcare customers in the US and Canada, including over a dozen acute-care hospitals where full service plant
Minutes of the February 7, 2012 Finance Committee Meeting
5
maintenance is provided. JCI has a presence in more than 40% of North American healthcare facilities; 15,000 employees maintaining 17,000 building, 1.5 billion square feet across 90 countries with a client retention rate of 90%. JCI has earned the following distinctions: Top 100 Best Managed Companies, “Industry Week,” Top 100 Best Corporate Citizens, “Business Ethics Magazine,” Ranked #2 greenest Company, “Newsweek,” Corporate Diversity Award, World Diversity Leadership Council. Mr. Quinones stated that JCI currently has contracts with the following entities: Department of Defense and Department of Energy, Hanford; Camp LeJune, NC; County governments: Fulton County, GA, Washington County, WI; Los Angeles County, CA. Healthcare facilities: Phoenix Children’s Hospital; Methodist La Bonheur Healthcare, Memphis, TN; McGill Hospital, Montreal, ON; Abbottsford Hospital and Cancer Centre, Abbottsford, BC; Niagara Health System, St. Catherines, ON; Bridgepoint Health Centre, Toronto, ON; North Bay Regional Health Centre, North Bay, ON. JCI currently employs approximately 7,500 union employees represented by 56 collective bargaining units nation-wide. Mrs. Bolus asked if HHC employees are represented by the same unions. Mr. Quinones deferred the question to one of JCI representatives to which a response that those unions are the same was given. Dr. Stocker asked JCI for further clarification. Mr. Herbst stated that Locals 30, 637 and electricians unions are just a few. The 7,500 employees are NY employees that are within the unions. Mr. Quinones continuing with the presentation stated that JCI has contracts with New York State and New York City agencies that include HHC, whereby, JCI has performed maintenance, repair, refurbishment work in virtually all HHC facilities over the past ten years; Empire State Building, JCI currently performing a $50 million energy performance contract that includes a retrofit program that will reduce the Empire State Building’s energy use by 38% per year, placing it in the top 10% of all US office buildings in terms of energy efficiency; CUNY and DASNY/NYS OGS. Mr. Quinones stated that JCI’s responsibilities will include the hiring of existing management staff to oversee HHC’s plant maintenance services staff; train staff to improve performance; buy supplies out of the contract payments at optimal cost; provide software for repair and maintenance work order tracking; provide necessary repair and maintenance tools; deploy the best methods across the enterprise to improve satisfaction; control personal services, overtime and OTPS costs; maintain equipment deemed to have exceeded useful life. Page 8 included a summary of the total savings by the various contract categories, fees, OTPS, management salaries, personal services, overtime and fringes. For the purpose of the Committee, the box below that summary reflected a breakdown of the costs for the total value of the contract amount as stated in the resolution. Additionally the expenses that are non JCI expenses, Group 12 wage expenses and Group 12 benefit expenses are also reflected in that box.
Minutes of the February 7, 2012 Finance Committee Meeting
6
Ms. Youssouf asked for further clarification of the services JCI will provide as part of Plant Maintenance. Mr. Quinones asked Mr. Alfonso Pistone, Assistant Vice President, Facilities Development who oversees facilities plant operations to respond. Mr. Pistone stated that the services that JCI will be providing would be the routine day-to-day operations, maintenance and minor repairs to keep the facilities functioning. Mrs. Bolus asked if management would become a part of JCI and Group 12 employees would continue to be employed by HHC. Mr. Martin replied in the affirmative. Mr. Quinones stated that on page 9, a breakdown of the annual proposed savings each year was delineated by the previous cited categories, fees, overtime, management wages, fringes, PS and OTPS. The projected savings total $127.92 million. On page 10, the inflationary exposure for HHC over the nine-year term of the contract includes a major increase in fringe benefits estimated at 44.06% in FY 13 to 58% in FY 21; PS inflation factor in the current Financial Plan is zero salary increases for years 1-3 and 1.25% for years 4-9; Group 12 costs are estimated to be $636.36 million for an average cost of $70.7 million per year and OTPS costs are estimated at $158.08 million for an average cost of $17.56 million per year based on an inflation factor of 3%; total OTPS for routine plant maintenance costs are projected to increase to $299.9 million or an average cost of $33.32 per year. If HHC continues to operate at the current level of operations for plant maintenance, PS and OTPS costs are projected to escalate to approximately $1.5 billion. Page 11 outlines how contracting with JCI will mitigate HHC’s exposure over the nine-year term; Group 12 PS costs are capped at $553.03 million compared to projected costs of $636.36 million; overtime costs are capped at $137.39 million compared to projected $158.08 million; OTPS costs are capped at $271.74 million compared to projected costs of $299.94 million. Mrs. Bolus asked if the unions have agreed to those caps and whether those caps are included in the contract that will be signed by HHC. Mr. Quinones stated those were the expenses of HHC not the contractor. Mr. Aviles added that the PS costs include the projected attrition that will reduce the headcount by 131 FTEs. Mr. Quinones continuing with the presentation, page 12 reflected the total projected saving over the nine-year term of the contract which will be achieved by a reduction in the current projected operational costs of $1.5 billion compared to the proposed contracting of the management services to JCI for a total projected saving of $127.9 million, $1.37 billion compared to $1.5 billion, over the nine-year terms of the contract. Ms. Youssouf asked for clarification of how the projected savings would be achieved.
Minutes of the February 7, 2012 Finance Committee Meeting
7
Mr. Rosen asked if the savings would be attributable to the capping of the costs. Mr. Quinones stated that it would be directly related to the caps as part of the guarantees that are reflected on page 8 of the presentation. Ms. Youssouf asked if those were guarantees on behalf of JCI regardless of any unforeseen cost increases. Mr. Quinones stated that the only change would be if there is a change in the scope of work. Mrs. Bolus asked for an example of a change in the scope of work that would impact the cost. Mr. Quinones stated that if HHC were to acquire another facility. Mr. Aviles added that conversely, if HHC closes a facility there would be reduction in the cost. Ms. Youssouf asked how labor agreements would impact the cost. Mr. Quinones replied that collective bargaining agreements which would be outside of JCI’s control would increase the costs if the projections fall below the actual contractual agreement increases. Moving back to the savings on page 12, Mr. Quinones stated that the saving with JCI would be $127.9 million over nine years at an annual average saving of $14.2 million per year. The current estimated salary increases are projected to remain at the current level for years 1-3, increasing by 1.25% for years 4-9. Costs related to OTPS, PS and overtime are guaranteed. Ms. Youssouf asked if HHC’s managers would be moving over to JCI and the Group 12 employees would remain with HHC and whether the savings would be achieved by JCI through better management of HHC’s plant maintenance operations. Mr. Quinones, concluding the presentation, stated that some of the added benefits of contracting with JCI included: union employees will not be terminated as a consequence of outsourcing Plant Maintenance Operations; current management employees will have the opportunity to become employees of JCI; a corporate-wide Life Cycle Assessment will be performed cataloguing and evaluating infrastructure equipment; standardization of work order tracking would be implemented to monitor costs and productivity. Mrs. Bolus asked if the management employees would have an option to go with JCI or remain with HHC. Mr. Aviles stated that it is not an option but that those employees could seek other employment opportunities within HHC but could not remain with HHC in their current role as part of Plant Maintenance. This option is consistent with all other outsourcing of management service contracts, such as environmental services and Brooklyn central laundry, whereby some employees opted not to take the option being employed by the contractor and secured positions in the private sector.
Minutes of the February 7, 2012 Finance Committee Meeting
8
Mrs. Bolus asked how often the Board would be informed of the status of the implementation of the Life Cycle Assessment. Mr. Aviles stated that it would be as often as the Board would require that report. Dr. Stocker asked if annually would be sufficient for the Board to receive a status report. The Committee was in agreement with having an annual report. Ms. Cohen asked if there were any structural difference with that model in comparison to the Crothall contract for environmental services or whether it is fundamentally the same model. Mr. Martin stated that it is the same. Mrs. Bolus asked if HHC would be the largest system managed by JCI and whether that would be a major challenge. Mr. Herbst stated that HHC would be one of the largest healthcare contracts for JCI; however, it is not dissimilar to other contracts managed by JCI in the private sector that are global in nature. JCI will take best practices and technologies from those implementations and apply them to the HHC. Mrs. Bolus asked what the estimated response time is given that HHC facilities are spread throughout the five boroughs. Mr. Herbst stated it is difficult to make that assessment at this time given that one of the priorities for improving efficiencies is to group similar types of work orders or responses so that JCI will not service the same piece of equipment more than once for multiple service requirements. JCI will make an assessment of all equipment and operational function and the response time will be tailored to that criticality and will work with HHC to ensure that the appropriate interpretation of that criticality. Mrs. Bolus asked how JCI would maintain equipment that has been determined to have exceeded useful life. Mr. Herbst stated that HHC is currently maintaining that function; therefore, JCI would continue to monitor all equipment in conjunction with HHC. Mr. Pistone added that HHC has in its capital plan a replacement program of its infrastructure. There is some flexibility within the capital plan to address issues that are identified by JCI as they may relate to the life cycle assessment that will be undertaken. Mrs. Bolus asked if there will be a manager assigned to each facility to oversee the daily operations. Mr. Herbst stated that there will be a manager assigned to each facility, consistent with HHC’s network structure for the leadership of the facilities for plant maintenance and operations and HHC’s operating procedures. JCI’s enterprise-wide platform will be made available to HHC.
Minutes of the February 7, 2012 Finance Committee Meeting
9
Ms. Youssouf asked if there are incentives or standards included in the contract by which HHC will monitor JCI’s performance and whether there are any penalties attached to those performances if JCI fails to achieve those standards. Mr. Pistone stated that there are no performance incentives included in the contract; however, the contract will include provisions that will allow HHC to extricate from the contract if performances are not satisfactory. Ms. Youssouf asked if there would be penalties included as part of those provisions. Mr. Quinones stated that if JCI does not perform to HHC’s standard, the contractor will not receive payment. There are no penalties included in the contract. Mr. Rosen asked if HHC or JCI would bear the cost if the estimates included in the personal services costs are greater than projected. Mr. Quinones stated that HHC would bear those costs. Mr. Rosen added that those costs would include fringes, overtime, salaries, etc. Mr. Quinones stated that those costs would be included. Mr. Aviles added that it is important to note that in terms of HHC’s current situation, if there is an increase in cost due to collective bargaining agreements (CB), HHC would bear those costs. However, through this process there will be savings through attrition. Ms. Youssouf asked if attrition would apply also to management. Mr. Aviles stated that it only applies to Group 12. Mrs. Bolus asked if the CB contracts would remain with HHC or JCI. Mr. Aviles stated that HHC will maintain control of that process. Mr. Rosen asked where JCI’s NY office is located. Mr. Herbst stated that JCI is located at 60 East 42ndStreet. Mrs. Bolus asked if the replacement of the managers would be done by JCI as part of the agreement. Mr. Herbst stated that the management team from HHC will be transferred to JCI and to the extent that there is a need to supplement those staff, JCI will hire externally and internally within the City. Mr. Martin stated that it is to HHC’s benefit that the managers are kept at the facilities. The intent is to ensure that the current managers are rolled-over to JCI and continue to manage the daily operations of those facilities. Mrs. Bolus asked how would the replacement of those managers who over the nine year period retire or move onto other jobs be replaced.
Minutes of the February 7, 2012 Finance Committee Meeting
10
Mr. Herbst stated that it is JCI practice to first look from within the organizational workforce for opportunities to advance the existing staff in other areas. The overall objective is to recruit staff with various levels of experience in order to enhance the standard of work. Mrs. Bolus asked if JCI would be providing continuing education to assist staff in advancing to the next management level. Mr. Herbst stated that JCI will not have any management control for the Group 12 employees; therefore, HHC would be in a better position to respond. Mr. Martin stated that there will be continuing education to ensure that the Group 12 employees have an opportunity to advance through the organization. Ms. Youssouf asked how many managers would be transferred to JCI and whether the contract is for those managers. Mr. Quinones stated that there are thirty one HHC managers. Mr. Aviles asked if the thirty one managers was the total number included in the contract. Mr. Quinones stated that there are thirty one managers for HHC and a total of forty five managers are included in the contract. Ms. Zurack added that similar to the Crothall contract, the OTPS purchases will be made by JCI on behalf of HHC for a total of $271 million which is the bulk of the contract. Contractors such as JCI are able to get larger discounts as part of their volume business. Ms. Cohen asked why there are no performance based compensations included in the contract and whether JCI has this type feature included in other similar contracts. Mr. Pistone stated there are no performance based incentives included in the contract due to JCI’s expertise in this area; therefore, it was decided that it was not necessary to incentivize for that purpose. Ms. Cohen asked if that was typical for other similar JCI contracts. Mr. Herbst stated that it varies in that there are contracts that include performance incentives that include a balance score card, whereby there is equal opportunity for both penalty and reward depending on performance measures that are quantifiable. Oftentimes, those types of incentives are implemented in the out years in order to have a better understanding of the baseline and how to measure performance which is probably one of the reasons HHC has opted not to include any in the initial work. Ms. Cohen asked what some of the metrics are.
Minutes of the February 7, 2012 Finance Committee Meeting
11
Mr. Herbst stated that some would include response time, health and safety measures, recordable incident, time loss, and quality standards that are somewhat difficult to measure are based on surveys and are more subjective. Ms. Youssouf asked if JCI would have a system in place to track the amount of time it takes to complete work orders and efficiencies. Mr. Herbst stated as part of JCI’s technology that feature would be included. Ms. Youssouf asked if it would be monitored by HHC. Mr. Pistone stated HHC would be responsible for monitoring that performance. Mr. Rosen asked if any of the JCI representatives would be assigned to the NY office. Mr. Herbst stated that he is based in Chicago, but that three of the representatives in attendance would be assigned to the NY office. Mr. Rosen asked if those three JCI representatives would be the point of contract for HHC. Mr. Herbst stated that they would be in addition to the staff that will be transferred from HHC to JCI. The resolution was approved for the full Board’s consideration.
SENIOR VICE PRESIDENT’S REPORT MARLENE ZURACK Ms. Zurack stated that her report would include an update on two items. First, currently HHC’s cash on hand (COH) is at 27 days compared to 35 days last month. However, it is anticipated that COH will return to 35 days by year-end. There are a number of pending supplemental Medicaid payments that are extremely important in maintaining a healthy cash balance. At the State level, last year the State passed a two-year Medicaid budget, this being the second year that included a freeze, an inflation factor and a 2% cut. In terms of the Governor’s budget, there is minimal impact to HHC. There were some new initiatives that were funded related to the MRT workgroup and some changes in benefits. Some of the items in terms of the service mix include, podiatry for adult diabetics was added, breastfeeding support and tobacco support, while knee orthoscopic, back pain treatment, angioplasty and growth hormones were cut in certain situations. The old State proposal remains a factor whereby there was a reduction in payments for elective C-sections that were without medical indications; however, the details of that action are currently under review after deferring this issue another year. In addition $32 million was added to address health disparities for expanded services translation reimbursement data collection; $100 million for vital access providers and essential community providers who were referenced in the MRT. Ms. Cohen added that those did not affect HHC.
Minutes of the February 7, 2012 Finance Committee Meeting
12
Ms. Zurack stated that although there is no impact to HHC, it is important to provide the Committee with some of the highlights of the State Budget. There is $25 million to modernize and automate the Medicaid eligibility system and $1.5 million to promote the expansion of non-physicians. Those investments will be funded by a proposal that has been repeatedly discussed, the elimination of the spousal refusal; redirection of the expiring acute care transition funding and the elimination of some of the previous cited benefits. Those are some of the highlights that as previously stated will have a minimal impact on HHC but a greater impact on some patients in Brooklyn.
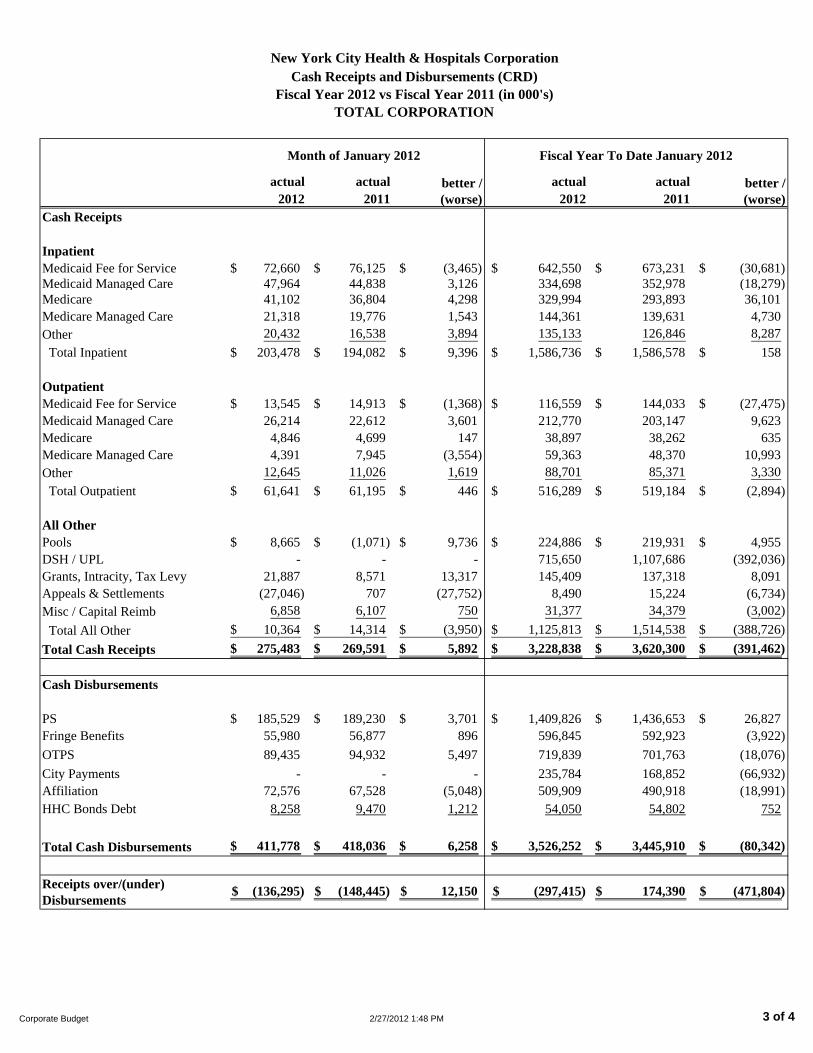
KEY INDICATORS/CASH RECEIPTS & DISBURSEMENTS REPORTS FRED COVINO Mr. Covino reported that on Page 1 which shows utilization year-to-date (YTD) through December 2011, acute discharges are down by 4.9% which is consistent with last month; however, it is a significant improvement from 9% at the beginning of the year. The Diagnostic and Treatment Centers (D&TC) visits are down by 6.7%, however, this is a significant improvement compared to 10.7% in July 2011. Nursing home days are down by 4.7% which has remained at that level throughout the year. The ALOS, the majority of the facilities with the exception of Lincoln are within a 1/3 day of the corporate average, whereas Lincoln is at ½ day below that average. The CMI is up by 1% compared to last year for the same period which is on top of a 6% and 4.5% for the last two years. Pages 2, FTEs are down by 137 since June 2011 which is 168 FTEs less than the target for the YTD period. The FTE level is down by 747 compared to last year. In the last twelve months, FTEs were reduced by 750. Through December 2011, receipts are $42.6 million better than budget while disbursements are $23 million less than budget resulting in a net total of $65 million against the budget. Page 3, a comparison of cash receipts and disbursements to the current and prior year actuals, receipts are $397 million worse than last year due to the timing of DSH and UPL payments. In FY 10, a large payment of $727 million was received in December but not this year for the same period. Expenses are $86 million worse than last year due to payments to the City that are $144 million higher this year, in addition to the timing of those payments that are offset by a reduction in personal services (PS) of $23 million and a reduction of $54 million. Overall receipts are $484 million worse than last year. Page 4, a comparison of the actuals against the budget through December 2011, receipts are up by $19.2 million due to an increase in Medicare collections which are up due to the timing of the PIP reduction. Outpatient collections are up by $13.2 million due to a large increase in Medicaid managed care disbursements due to a retro rate adjustment from MetroPlus of $27 million for ER and Amb Surg rates for calendar year 2011. All other is up by $10 million due to an increase in appeals and settlements that are higher than anticipated in the budget. Concluding the report, Mr. Covino stated that PS expenses are $3.4 million worse than budget due to overtime spending and OTPS is $22.7 million better than planned due to a rollover from last year into the current year. Mr. Aviles informed the Committee that a three-month hiring freeze had been imposed through April 2011. There are some exceptions, one being IT services. Mrs. Bolus asked if RNs are exempted. Mr. Aviles stated that RNs are not automatically exempted; however, there is an opportunity to appeal to the Chief Operating Officer, Mr. Martin for extraordinary needs.
Minutes of the February 7, 2012 Finance Committee Meeting
13
Ms. Cohen asked what a PIP payment is. Ms. Zurack stated that it is a Periodic Interim Payment, whereby, Medicaid pays a steady cash flow and adjusts when actual claims are adjudicated. Mr. Migdal added that HHC is probably one of the last systems in the industry that receives those payments.
INFORMATION ITEM MAXINE KATZ INPATIENT, OUTPATIENT ADULT AND PEDIATRICS PAYOR MIX REPORTS Ms. Katz stated that the Inpatient Payor Mix report from July 2011 through December 2011 shows that there is a slight improvement this year in the percentage of insured to the total. In almost all of the payor mix categories with the exception of commercial managed care and commercial, all other payors are down this year compared to last year. However, there is also a decrease in total discharges by 4,000. There is a slight shift in the payor mix but there is also a decrease in discharges and self-pay discharges as well. The outpatient adult payor mix report comparing the two years, the trend has remained steady at the same level. However, there are some shifts in the outpatient payor mix. Self-pay is down in addition to other payor categories. Total visits and patient volume are also down. Pediatrics payor mix is also holding steady at the same rate comparing the two years but total patients and visits are down and there is also a shift in payor mix. Mr. Rosen commented that the percentage of insured to total remains at the same level. Ms. Katz stated that it is but that self-pay is down while the payor mix appears to be shifting into different categories. Over the years, Medicaid fee for service was higher but is now migrating to other payors. There is more commercial and commercial managed care than in prior years.
INFORMATION ITEM MAXINE KATZ INPATIENT MEDICAID ELIGIBILITY REPORT Ms. Katz reported that the Medicaid application submissions are down, but overall eligible decisions are down from year to year. The percentage of eligible decisions to applications submitted is better than last year. Requests for additional information from HRA are down compared to last year. Mrs. Bolus asked what contributed to that improvement. Ms. Katz stated that a number of Breakthrough activities centered on Medicaid applications have taken place. The facilities have implemented operational changes and are monitoring the application process more closely; more training is being done for the staff based on the ineligible decisions that are being returned. HHC has been working very closely with HRA on training staff and working to improve the front-end processes that involve contacting the patient immediately after a determination has been made that the patient will be admitted. Overall better practices have been implemented but more improvements are needed. In concluding her report, Ms. Katz stated that one of the key factors in those process changes is that the facilities are very active in the process by making site visits to other facilities to examine best practices and deciding which works best for their facility.

Minutes of the February 7, 2012 Finance Committee Meeting
14
Mr. Rosen asked when the State is expected to take over Medicaid and whether that would mean that the function will shift from HRA to the State. Ms. Zurack stated that it is not known at this time. Ms. Cohen added that it is unclear at this time exactly what the process will be.
ADJOURNMENT BERNARD ROSEN There being no further business to discuss the meeting was adjourned at 9:52 a.m.
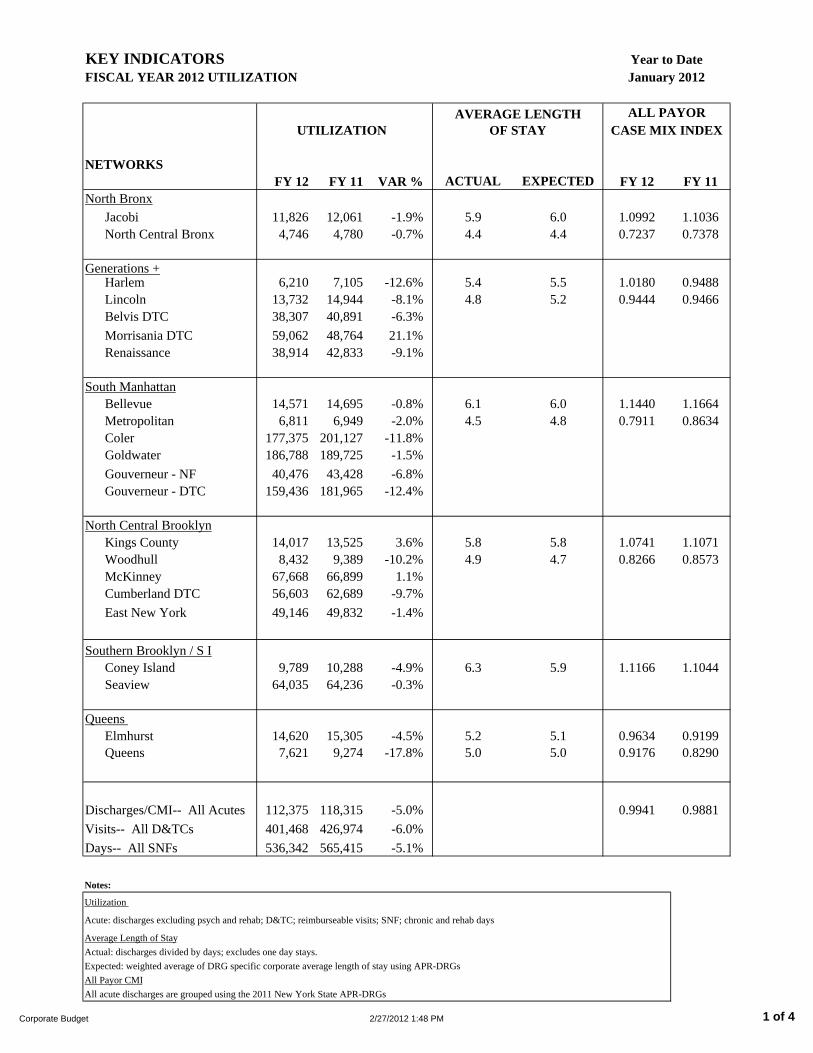
KEY INDICATORSFISCAL YEAR 2012 UTILIZATION
NETWORKSFY 12 FY 11 VAR % ACTUAL EXPECTED FY 12 FY 11
North BronxJacobi 11,826 12,061 -1.9% 5.9 6.0 1.0992 1.1036North Central Bronx 4,746 4,780 -0.7% 4.4 4.4 0.7237 0.7378
Generations +Harlem 6,210 7,105 -12.6% 5.4 5.5 1.0180 0.9488Lincoln 13,732 14,944 -8.1% 4.8 5.2 0.9444 0.9466Belvis DTC 38,307 40,891 -6.3%Morrisania DTC 59,062 48,764 21.1%Renaissance 38,914 42,833 -9.1%
South ManhattanBellevue 14,571 14,695 -0.8% 6.1 6.0 1.1440 1.1664Metropolitan 6,811 6,949 -2.0% 4.5 4.8 0.7911 0.8634Coler 177,375 201,127 -11.8%Goldwater 186,788 189,725 -1.5%Gouverneur - NF 40,476 43,428 -6.8%Gouverneur - DTC 159,436 181,965 -12.4%
North Central BrooklynKings County 14,017 13,525 3.6% 5.8 5.8 1.0741 1.1071Woodhull 8,432 9,389 -10.2% 4.9 4.7 0.8266 0.8573McKinney 67,668 66,899 1.1%Cumberland DTC 56,603 62,689 -9.7%East New York 49,146 49,832 -1.4%
Southern Brooklyn / S IConey Island 9,789 10,288 -4.9% 6.3 5.9 1.1166 1.1044Seaview 64,035 64,236 -0.3%
Queens Elmhurst 14,620 15,305 -4.5% 5.2 5.1 0.9634 0.9199Queens 7,621 9,274 -17.8% 5.0 5.0 0.9176 0.8290
Discharges/CMI-- All Acutes 112,375 118,315 -5.0% 0.9941 0.9881Visits-- All D&TCs 401,468 426,974 -6.0%Days-- All SNFs 536,342 565,415 -5.1%
Notes:
Utilization
Acute: discharges excluding psych and rehab; D&TC; reimburseable visits; SNF; chronic and rehab days
Average Length of StayActual: discharges divided by days; excludes one day stays.Expected: weighted average of DRG specific corporate average length of stay using APR-DRGsAll Payor CMIAll acute discharges are grouped using the 2011 New York State APR-DRGs
Year to DateJanuary 2012
AVERAGE LENGTH OF STAY
ALL PAYORUTILIZATION CASE MIX INDEX
Corporate Budget 2/27/2012 1:48 PM 1 of 4
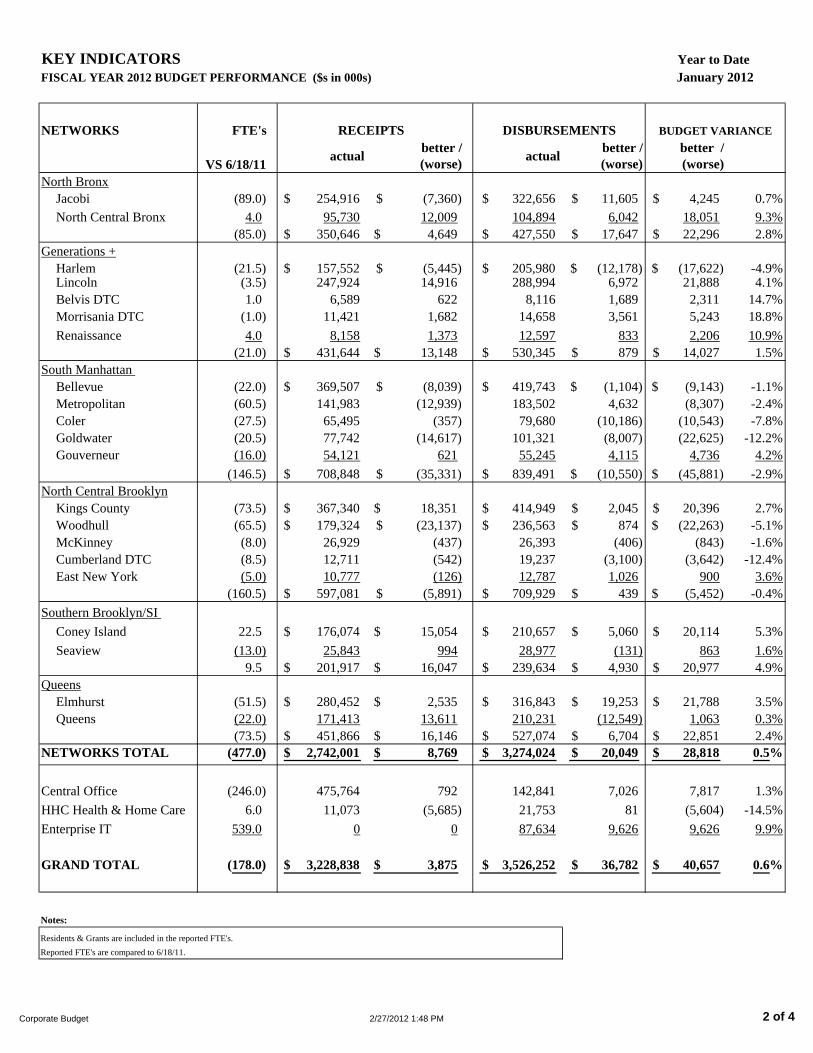
KEY INDICATORSFISCAL YEAR 2012 BUDGET PERFORMANCE ($s in 000s)
NETWORKS FTE's
VS 6/18/11 actual better / (worse) actual better /
(worse)better / (worse)
NNorth BronxJacobi (89.0) 254,916$ (7,360)$ 322,656$ 11,605$ 4,245$ 0.7%North Central Bronx 4.0 95,730 12,009 104,894 6,042 18,051 9.3%
(85.0) 350,646$ 4,649$ 427,550$ 17,647$ 22,296$ 2.8%GGenerations +
Harlem (21.5) 157,552$ (5,445)$ 205,980$ (12,178)$ (17,622)$ -4.9%Lincoln (3.5) 247,924 14,916 288,994 6,972 21,888 4.1%Belvis DTC 1.0 6,589 622 8,116 1,689 2,311 14.7%Morrisania DTC (1.0) 11,421 1,682 14,658 3,561 5,243 18.8%Renaissance 4.0 8,158 1,373 12,597 833 2,206 10.9%
(21.0) 431,644$ 13,148$ 530,345$ 879$ 14,027$ 1.5%SSouth Manhattan
Bellevue (22.0) 369,507$ (8,039)$ 419,743$ (1,104)$ (9,143)$ -1.1%Metropolitan (60.5) 141,983 (12,939) 183,502 4,632 (8,307) -2.4%Coler (27.5) 65,495 (357) 79,680 (10,186) (10,543) -7.8%Goldwater (20.5) 77,742 (14,617) 101,321 (8,007) (22,625) -12.2%
GoGouverneur (16.0) 54,121 621 55,245 4,115 4,736 4.2%(146.5) 708,848$ (35,331)$ 839,491$ (10,550)$ (45,881)$ -2.9%
NNorth Central BrooklynKings County (73.5) 367,340$ 18,351$ 414,949$ 2,045$ 20,396$ 2.7%Woodhull (65.5) 179,324$ (23,137)$ 236,563$ 874$ (22,263)$ -5.1%McKinney (8.0) 26,929 (437) 26,393 (406) (843) -1.6%Cumberland DTC (8.5) 12,711 (542) 19,237 (3,100) (3,642) -12.4%East New York (5.0) 10,777 (126) 12,787 1,026 900 3.6%
(160.5) 597,081$ (5,891)$ 709,929$ 439$ (5,452)$ -0.4%SSouthern Brooklyn/SI
Coney Island 22.5 176,074$ 15,054$ 210,657$ 5,060$ 20,114$ 5.3%Seaview (13.0) 25,843 994 28,977 (131) 863 1.6%
9.5 201,917$ 16,047$ 239,634$ 4,930$ 20,977$ 4.9%QQueens
Elmhurst (51.5) 280,452$ 2,535$ 316,843$ 19,253$ 21,788$ 3.5%Queens (22.0) 171,413 13,611 210,231 (12,549) 1,063 0.3%
(73.5) 451,866$ 16,146$ 527,074$ 6,704$ 22,851$ 2.4%NETWORKS TOTAL (477.0) 2,742,001$ 8,769$ 3,274,024$ 20,049$ 28,818$ 0.5%
Central Office (246.0) 475,764 792 142,841 7,026 7,817 1.3%HHC Health & Home Care 6.0 11,073 (5,685) 21,753 81 (5,604) -14.5%
UEnterprise IT 539.0 0 0 87,634 9,626 9,626 9.9%
GRAND TOTAL (178.0) 3,228,838$ 3,875$ 3,526,252$ 36,782$ 40,657$ 0.6%
CORPORATE TOTALSNotes:
Residents & Grants are included in the reported FTE's.Reported FTE's are compared to 6/18/11.
Year to Date January 2012
RECEIPTS DISBURSEMENTS BUDGET VARIANCE
Corporate Budget 2/27/2012 1:48 PM 2 of 4
CORPORATE TOTALS 19 18 19
actual actual actual actual2012 2011 2012 2011
Cash Receipts
Inpatient IMMMedicaid Fee for Service 72,660$ 76,125$ (3,465)$ 642,550$ 673,231$ (30,681)$ IMMMedicaid Managed Care 47,964 44,838 3,126 334,698 352,978 (18,279)IMMMedicare 41,102 36,804 4,298 329,994 293,893 36,101IHMMedicare Managed Care 21,318 19,776 1,543 144,361 139,631 4,730OOOther 20,432 16,538 3,894 135,133 126,846 8,287
Total Inpatient 203,478$ 194,082$ 9,396$ 1,586,736$ 1,586,578$ 158$
Outpatient OMMedicaid Fee for Service 13,545$ 14,913$ (1,368)$ 116,559$ 144,033$ (27,475)$ OMMedicaid Managed Care 26,214 22,612 3,601 212,770 203,147 9,623OMMedicare 4,846 4,699 147 38,897 38,262 635OMMedicare Managed Care 4,391 7,945 (3,554) 59,363 48,370 10,993OOOther 12,645 11,026 1,619 88,701 85,371 3,330
Total Outpatient 61,641$ 61,195$ 446$ 516,289$ 519,184$ (2,894)$
All OtherPOPools 8,665$ (1,071)$ 9,736$ 224,886$ 219,931$ 4,955$ DODSH / UPL - - - 715,650 1,107,686 (392,036)
Grants, Intracity, Tax Levy 21,887 8,571 13,317 145,409 137,318 8,091GOAppeals & Settlements (27,046) 707 (27,752) 8,490 15,224 (6,734)MMMisc / Capital Reimb 6,858 6,107 750 31,377 34,379 (3,002)AO Total All Other 10,364$ 14,314$ (3,950)$ 1,125,813$ 1,514,538$ (388,726)$
Total Cash Receipts 275,483$ 269,591$ 5,892$ 3,228,838$ 3,620,300$ (391,462)$
Cash Disbursements
P1PS 185,529$ 189,230$ 3,701$ 1,409,826$ 1,436,653$ 26,827$ F2Fringe Benefits 55,980 56,877 896 596,845 592,923 (3,922)O3OTPS 89,435 94,932 5,497 719,839 701,763 (18,076)
CCity Payments - - - 235,784 168,852 (66,932) A4Affiliation 72,576 67,528 (5,048) 509,909 490,918 (18,991)B5HHC Bonds Debt 8,258 9,470 1,212 54,050 54,802 752
Total Cash Disbursements 411,778$ 418,036$ 6,258$ 3,526,252$ 3,445,910$ (80,342)$
New York City Health & Hospitals CorporationCash Receipts and Disbursements (CRD)
Fiscal Year 2012 vs Fiscal Year 2011 (in 000's)TOTAL CORPORATION
(471,804)$
Fiscal Year To Date January 2012
better / (worse)
better / (worse)
Month of January 2012
174,390$ Receipts over/(under) Disbursements
(136,295)$ (148,445)$ 12,150$ (297,415)$
Corporate Budget 2/27/2012 1:48 PM 3 of 4
CORPORATE TOTALS 19 18 19
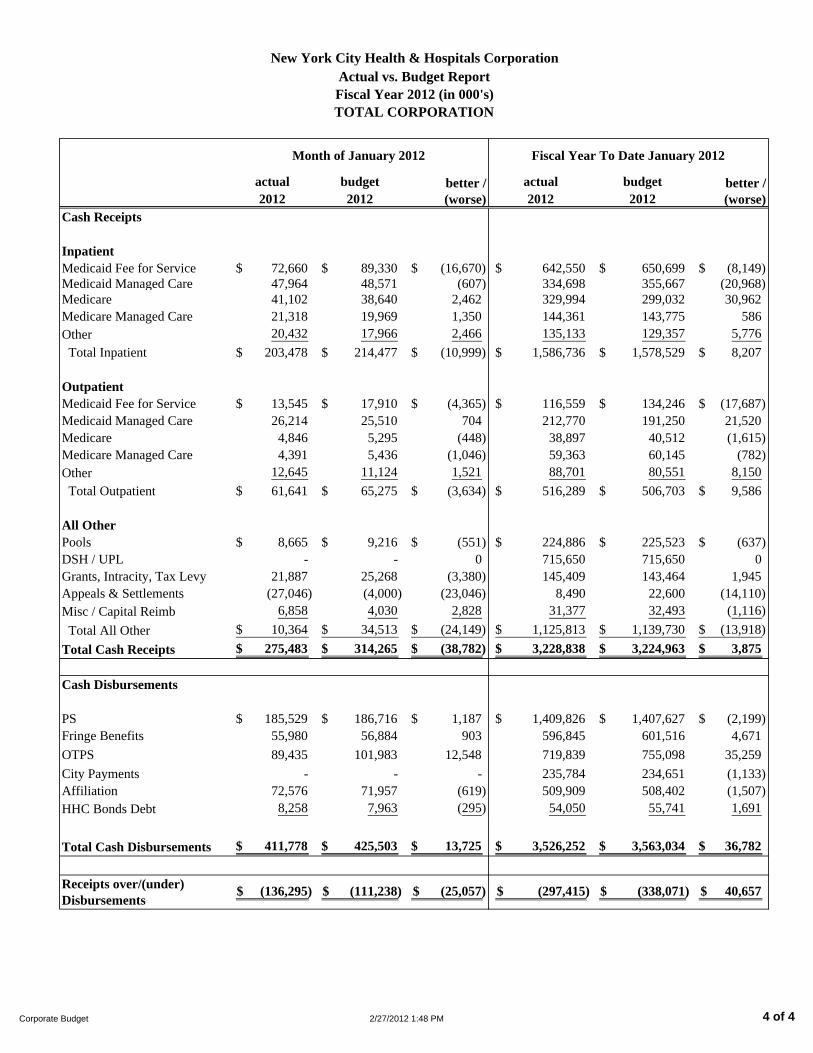
actual budget actual budget2012 2012 2012 2012
Cash Receipts
Inpatient I MMedicaid Fee for Service 72,660$ 89,330$ (16,670)$ 642,550$ 650,699$ (8,149)$ I MMedicaid Managed Care 47,964 48,571 (607) 334,698 355,667 (20,968)I MMedicare 41,102 38,640 2,462 329,994 299,032 30,962I MMedicare Managed Care 21,318 19,969 1,350 144,361 143,775 586OOOther 20,432 17,966 2,466 135,133 129,357 5,776
Total Inpatient 203,478$ 214,477$ (10,999)$ 1,586,736$ 1,578,529$ 8,207$
Outpatient OMMedicaid Fee for Service 13,545$ 17,910$ (4,365)$ 116,559$ 134,246$ (17,687)$ OMMedicaid Managed Care 26,214 25,510 704 212,770 191,250 21,520OMMedicare 4,846 5,295 (448) 38,897 40,512 (1,615)OMMedicare Managed Care 4,391 5,436 (1,046) 59,363 60,145 (782)OOOther 12,645 11,124 1,521 88,701 80,551 8,150
Total Outpatient 61,641$ 65,275$ (3,634)$ 516,289$ 506,703$ 9,586$
All OtherPOPools 8,665$ 9,216$ (551)$ 224,886$ 225,523$ (637)$ DODSH / UPL - - 0 715,650 715,650 0 GOGrants, Intracity, Tax Levy 21,887 25,268 (3,380) 145,409 143,464 1,945AOAppeals & Settlements (27,046) (4,000) (23,046) 8,490 22,600 (14,110)MMMisc / Capital Reimb 6,858 4,030 2,828 31,377 32,493 (1,116)
Total All Other 10,364$ 34,513$ (24,149)$ 1,125,813$ 1,139,730$ (13,918)$ Total Cash Receipts 275,483$ 314,265$ (38,782)$ 3,228,838$ 3,224,963$ 3,875$
Cash Disbursements
P1PS 185,529$ 186,716$ 1,187$ 1,409,826$ 1,407,627$ (2,199)$ F2Fringe Benefits 55,980 56,884 903 596,845 601,516 4,671O3OTPS 89,435 101,983 12,548 719,839 755,098 35,259
City Payments - - - 235,784 234,651 (1,133) A4Affiliation 72,576 71,957 (619) 509,909 508,402 (1,507)B5HHC Bonds Debt 8,258 7,963 (295) 54,050 55,741 1,691
Total Cash Disbursements 411,778$ 425,503$ 13,725$ 3,526,252$ 3,563,034$ 36,782$
New York City Health & Hospitals CorporationActual vs. Budget ReportFiscal Year 2012 (in 000's)TOTAL CORPORATION
(338,071)$ 40,657$ Receipts over/(under) Disbursements
(136,295)$ (111,238)$ (25,057)$ (297,415)$
Month of January 2012 Fiscal Year To Date January 2012
better / (worse)
better / (worse)
Corporate Budget 2/27/2012 1:48 PM 4 of 4
Review of Personal Services
Key Indicators
6/18/11 Thru 1/14/12)
2
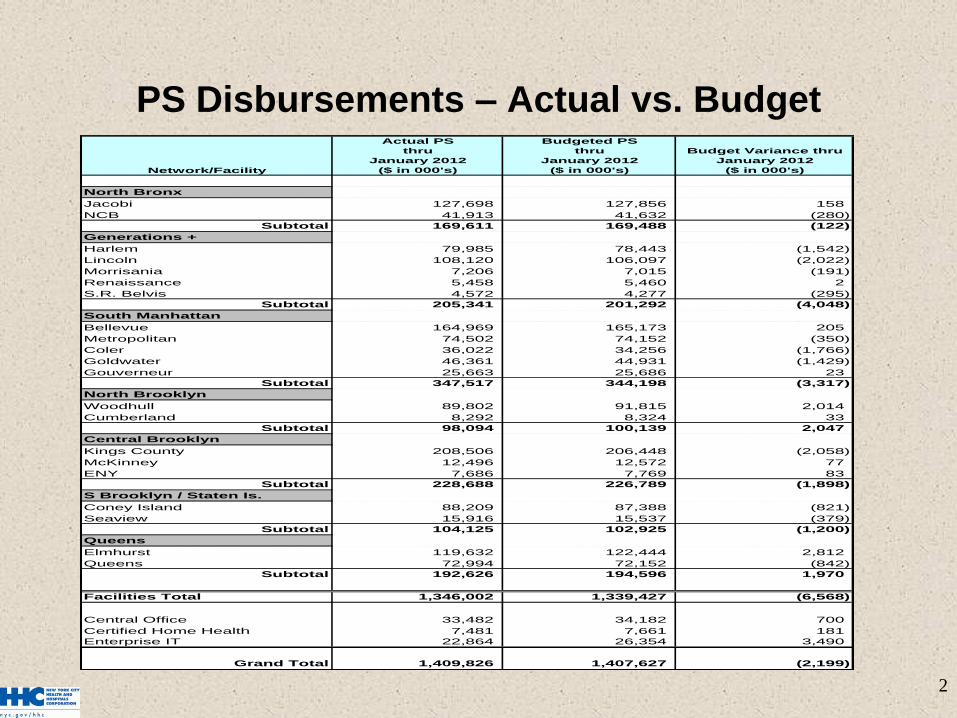
PS Disbursements – Actual vs. Budget
Network/Facility
Actual PS
thru
January 2012
($ in 000's)
Budgeted PS
thru
January 2012
($ in 000's)
Budget Variance thru
January 2012
($ in 000's)
North Bronx
Jacobi 127,698 127,856 158
NCB 41,913 41,632 (280)
Subtotal 169,611 169,488 (122)
Generations +
Harlem 79,985 78,443 (1,542)
Lincoln 108,120 106,097 (2,022)
Morrisania 7,206 7,015 (191)
Renaissance 5,458 5,460 2
S.R. Belvis 4,572 4,277 (295)
Subtotal 205,341 201,292 (4,048)
South Manhattan
Bellevue 164,969 165,173 205
Metropolitan 74,502 74,152 (350)
Coler 36,022 34,256 (1,766)
Goldwater 46,361 44,931 (1,429)
Gouverneur 25,663 25,686 23
Subtotal 347,517 344,198 (3,317)
North Brooklyn
Woodhull 89,802 91,815 2,014
Cumberland 8,292 8,324 33
Subtotal 98,094 100,139 2,047
Central Brooklyn
Kings County 208,506 206,448 (2,058)
McKinney 12,496 12,572 77
ENY 7,686 7,769 83
Subtotal 228,688 226,789 (1,898)
S Brooklyn / Staten Is.
Coney Island 88,209 87,388 (821)
Seaview 15,916 15,537 (379)
Subtotal 104,125 102,925 (1,200)
Queens
Elmhurst 119,632 122,444 2,812
Queens 72,994 72,152 (842)
Subtotal 192,626 194,596 1,970
Facilities Total 1,346,002 1,339,427 (6,568)
Central Office 33,482 34,182 700
Certified Home Health 7,481 7,661 181
Enterprise IT 22,864 26,354 3,490
Grand Total 1,409,826 1,407,627 (2,199)
3
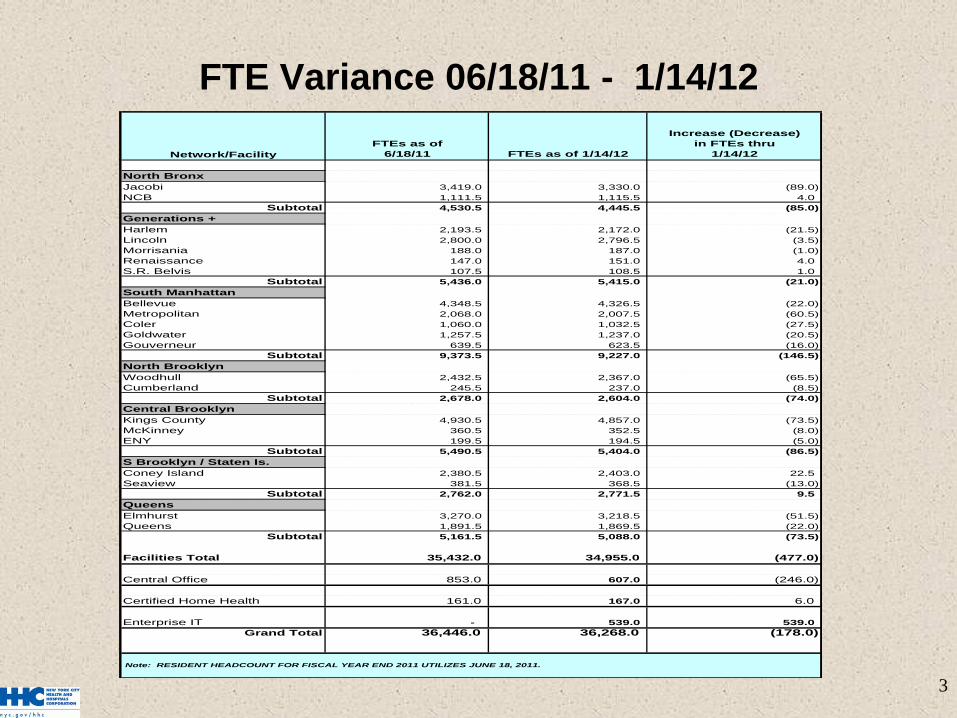
FTE Variance 06/18/11 - 1/14/12
Network/Facility
FTEs as of
6/18/11 FTEs as of 1/14/12
Increase (Decrease)
in FTEs thru
1/14/12
North Bronx
Jacobi 3,419.0 3,330.0 (89.0)
NCB 1,111.5 1,115.5 4.0
Subtotal 4,530.5 4,445.5 (85.0)
Generations +
Harlem 2,193.5 2,172.0 (21.5)
Lincoln 2,800.0 2,796.5 (3.5)
Morrisania 188.0 187.0 (1.0)
Renaissance 147.0 151.0 4.0
S.R. Belvis 107.5 108.5 1.0
Subtotal 5,436.0 5,415.0 (21.0)
South Manhattan
Bellevue 4,348.5 4,326.5 (22.0)
Metropolitan 2,068.0 2,007.5 (60.5)
Coler 1,060.0 1,032.5 (27.5)
Goldwater 1,257.5 1,237.0 (20.5)
Gouverneur 639.5 623.5 (16.0)
Subtotal 9,373.5 9,227.0 (146.5)
North Brooklyn
Woodhull 2,432.5 2,367.0 (65.5)
Cumberland 245.5 237.0 (8.5)
Subtotal 2,678.0 2,604.0 (74.0)
Central Brooklyn
Kings County 4,930.5 4,857.0 (73.5)
McKinney 360.5 352.5 (8.0)
ENY 199.5 194.5 (5.0)
Subtotal 5,490.5 5,404.0 (86.5)
S Brooklyn / Staten Is.
Coney Island 2,380.5 2,403.0 22.5
Seaview 381.5 368.5 (13.0)
Subtotal 2,762.0 2,771.5 9.5
Queens
Elmhurst 3,270.0 3,218.5 (51.5)
Queens 1,891.5 1,869.5 (22.0)
Subtotal 5,161.5 5,088.0 (73.5)
Facilities Total 35,432.0 34,955.0 (477.0)
Central Office 853.0 607.0 (246.0)
Certified Home Health 161.0 167.0 6.0
Enterprise IT - 539.0 539.0
Grand Total 36,446.0 36,268.0 (178.0)
Note: RESIDENT HEADCOUNT FOR FISCAL YEAR END 2011 UTILIZES JUNE 18, 2011.
4
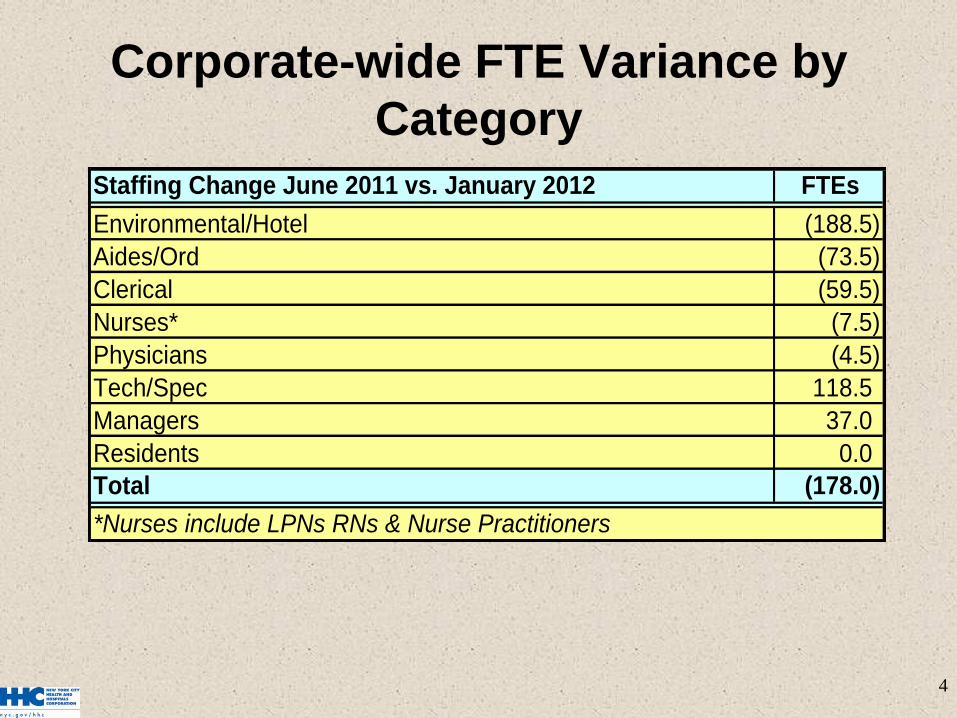
Corporate-wide FTE Variance by
Category
Staffing Change June 2011 vs. January 2012 FTEs
Environmental/Hotel (188.5)
Aides/Ord (73.5)
Clerical (59.5)
Nurses* (7.5)
Physicians (4.5)
Tech/Spec 118.5
Managers 37.0
Residents 0.0
Total (178.0)
*Nurses include LPNs RNs & Nurse Practitioners
5
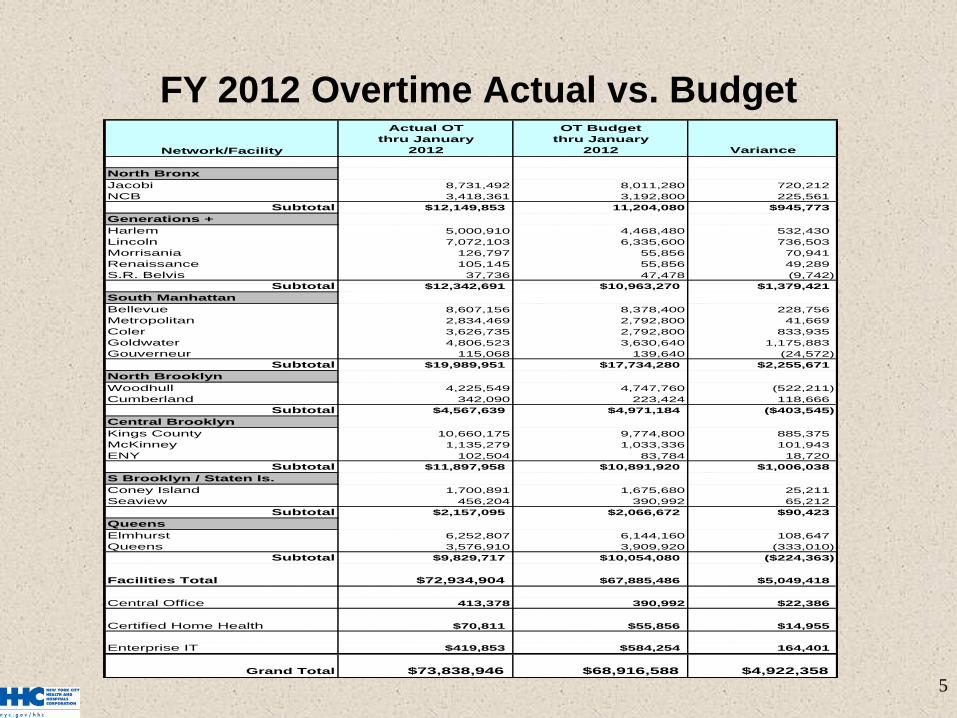
FY 2012 Overtime Actual vs. Budget
Network/Facility
Actual OT
thru January
2012
OT Budget
thru January
2012 Variance
North Bronx
Jacobi 8,731,492 8,011,280 720,212
NCB 3,418,361 3,192,800 225,561
Subtotal $12,149,853 11,204,080 $945,773
Generations +
Harlem 5,000,910 4,468,480 532,430
Lincoln 7,072,103 6,335,600 736,503
Morrisania 126,797 55,856 70,941
Renaissance 105,145 55,856 49,289
S.R. Belvis 37,736 47,478 (9,742)
Subtotal $12,342,691 $10,963,270 $1,379,421
South Manhattan
Bellevue 8,607,156 8,378,400 228,756
Metropolitan 2,834,469 2,792,800 41,669
Coler 3,626,735 2,792,800 833,935
Goldwater 4,806,523 3,630,640 1,175,883
Gouverneur 115,068 139,640 (24,572)
Subtotal $19,989,951 $17,734,280 $2,255,671
North Brooklyn
Woodhull 4,225,549 4,747,760 (522,211)
Cumberland 342,090 223,424 118,666
Subtotal $4,567,639 $4,971,184 ($403,545)
Central Brooklyn
Kings County 10,660,175 9,774,800 885,375
McKinney 1,135,279 1,033,336 101,943
ENY 102,504 83,784 18,720
Subtotal $11,897,958 $10,891,920 $1,006,038
S Brooklyn / Staten Is.
Coney Island 1,700,891 1,675,680 25,211
Seaview 456,204 390,992 65,212
Subtotal $2,157,095 $2,066,672 $90,423
Queens
Elmhurst 6,252,807 6,144,160 108,647
Queens 3,576,910 3,909,920 (333,010)
Subtotal $9,829,717 $10,054,080 ($224,363)
Facilities Total $72,934,904 $67,885,486 $5,049,418
Central Office 413,378 390,992 $22,386
Certified Home Health $70,811 $55,856 $14,955
Enterprise IT $419,853 $584,254 164,401
Grand Total $73,838,946 $68,916,588 $4,922,358
6
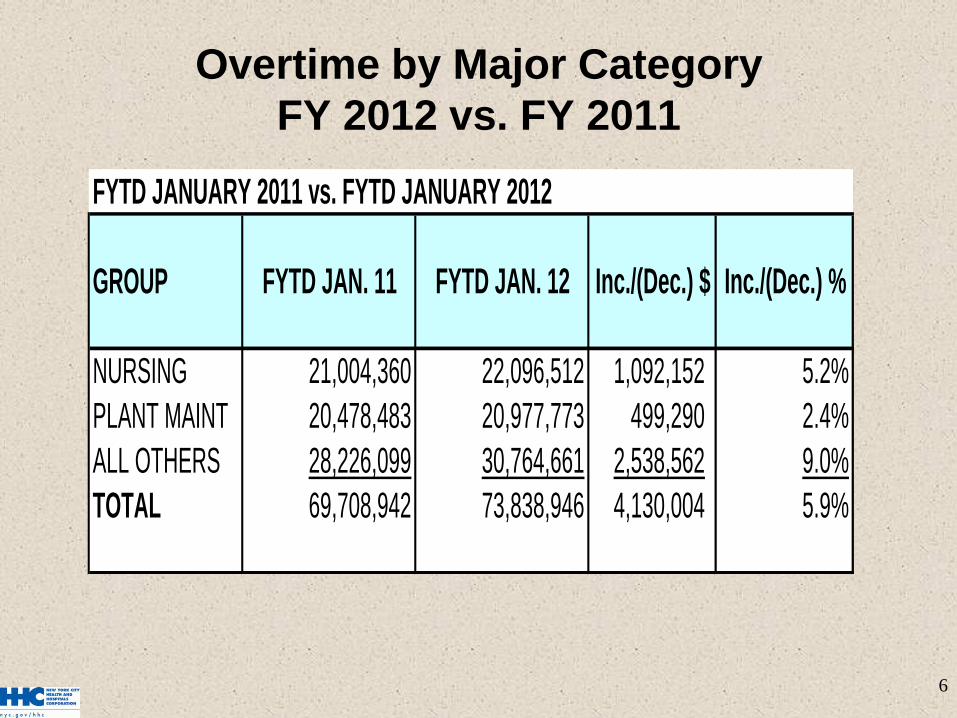
Overtime by Major Category
FY 2012 vs. FY 2011
FYTD JANUARY 2011 vs. FYTD JANUARY 2012
GROUP FYTD JAN. 11 FYTD JAN. 12 Inc./(Dec.) $ Inc./(Dec.) %
NURSING 21,004,360 22,096,512 1,092,152 5.2%
PLANT MAINT 20,478,483 20,977,773 499,290 2.4%
ALL OTHERS 28,226,099 30,764,661 2,538,562 9.0%
TOTAL 69,708,942 73,838,946 4,130,004 5.9%
7
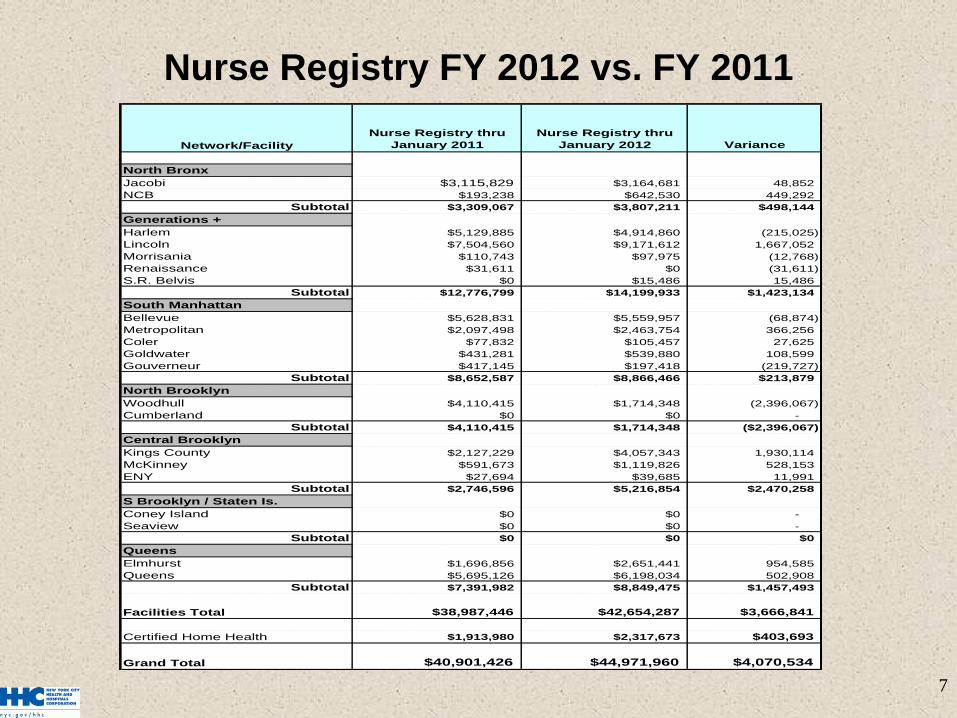
Nurse Registry FY 2012 vs. FY 2011
Network/Facility
Nurse Registry thru
January 2011
Nurse Registry thru
January 2012 Variance
North Bronx
Jacobi $3,115,829 $3,164,681 48,852
NCB $193,238 $642,530 449,292
Subtotal $3,309,067 $3,807,211 $498,144
Generations +
Harlem $5,129,885 $4,914,860 (215,025)
Lincoln $7,504,560 $9,171,612 1,667,052
Morrisania $110,743 $97,975 (12,768)
Renaissance $31,611 $0 (31,611)
S.R. Belvis $0 $15,486 15,486
Subtotal $12,776,799 $14,199,933 $1,423,134
South Manhattan
Bellevue $5,628,831 $5,559,957 (68,874)
Metropolitan $2,097,498 $2,463,754 366,256
Coler $77,832 $105,457 27,625
Goldwater $431,281 $539,880 108,599
Gouverneur $417,145 $197,418 (219,727)
Subtotal $8,652,587 $8,866,466 $213,879
North Brooklyn
Woodhull $4,110,415 $1,714,348 (2,396,067)
Cumberland $0 $0 -
Subtotal $4,110,415 $1,714,348 ($2,396,067)
Central Brooklyn
Kings County $2,127,229 $4,057,343 1,930,114
McKinney $591,673 $1,119,826 528,153
ENY $27,694 $39,685 11,991
Subtotal $2,746,596 $5,216,854 $2,470,258
S Brooklyn / Staten Is.
Coney Island $0 $0 -
Seaview $0 $0 -
Subtotal $0 $0 $0
Queens
Elmhurst $1,696,856 $2,651,441 954,585
Queens $5,695,126 $6,198,034 502,908
Subtotal $7,391,982 $8,849,475 $1,457,493
Facilities Total $38,987,446 $42,654,287 $3,666,841
Certified Home Health $1,913,980 $2,317,673 $403,693
Grand Total $40,901,426 $44,971,960 $4,070,534
8
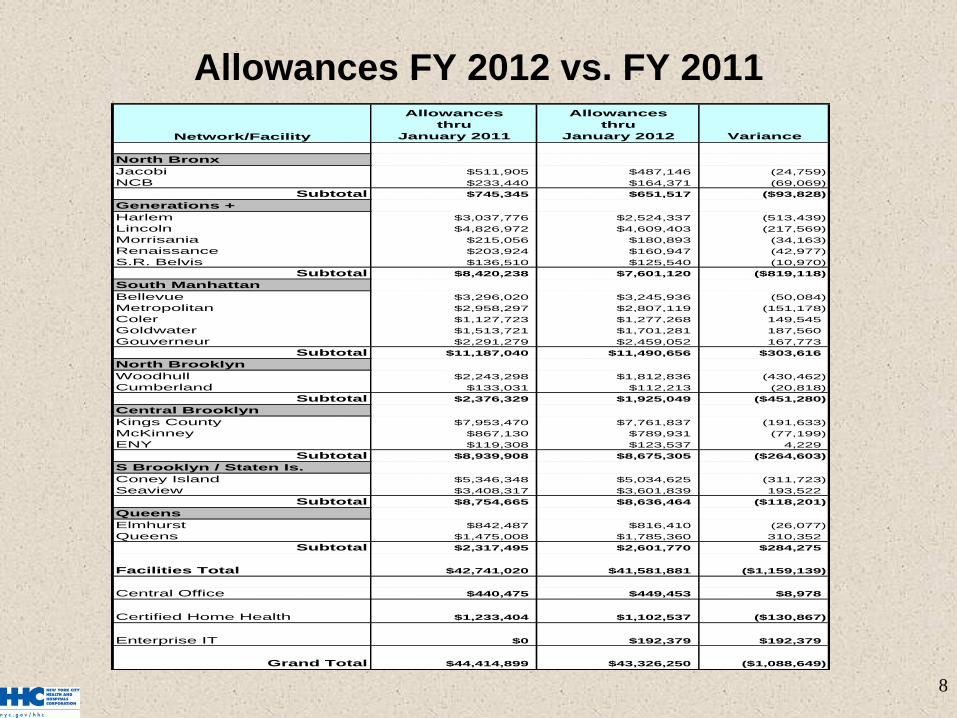
Allowances FY 2012 vs. FY 2011
Network/Facility
Allowances
thru
January 2011
Allowances
thru
January 2012 Variance
North Bronx
Jacobi $511,905 $487,146 (24,759)
NCB $233,440 $164,371 (69,069)
Subtotal $745,345 $651,517 ($93,828)
Generations +
Harlem $3,037,776 $2,524,337 (513,439)
Lincoln $4,826,972 $4,609,403 (217,569)
Morrisania $215,056 $180,893 (34,163)
Renaissance $203,924 $160,947 (42,977)
S.R. Belvis $136,510 $125,540 (10,970)
Subtotal $8,420,238 $7,601,120 ($819,118)
South Manhattan
Bellevue $3,296,020 $3,245,936 (50,084)
Metropolitan $2,958,297 $2,807,119 (151,178)
Coler $1,127,723 $1,277,268 149,545
Goldwater $1,513,721 $1,701,281 187,560
Gouverneur $2,291,279 $2,459,052 167,773
Subtotal $11,187,040 $11,490,656 $303,616
North Brooklyn
Woodhull $2,243,298 $1,812,836 (430,462)
Cumberland $133,031 $112,213 (20,818)
Subtotal $2,376,329 $1,925,049 ($451,280)
Central Brooklyn
Kings County $7,953,470 $7,761,837 (191,633)
McKinney $867,130 $789,931 (77,199)
ENY $119,308 $123,537 4,229
Subtotal $8,939,908 $8,675,305 ($264,603)
S Brooklyn / Staten Is.
Coney Island $5,346,348 $5,034,625 (311,723)
Seaview $3,408,317 $3,601,839 193,522
Subtotal $8,754,665 $8,636,464 ($118,201)
Queens
Elmhurst $842,487 $816,410 (26,077)
Queens $1,475,008 $1,785,360 310,352
Subtotal $2,317,495 $2,601,770 $284,275
Facilities Total $42,741,020 $41,581,881 ($1,159,139)
Central Office $440,475 $449,453 $8,978
Certified Home Health $1,233,404 $1,102,537 ($130,867)
Enterprise IT $0 $192,379 $192,379
Grand Total $44,414,899 $43,326,250 ($1,088,649)

Operating Financial Plan
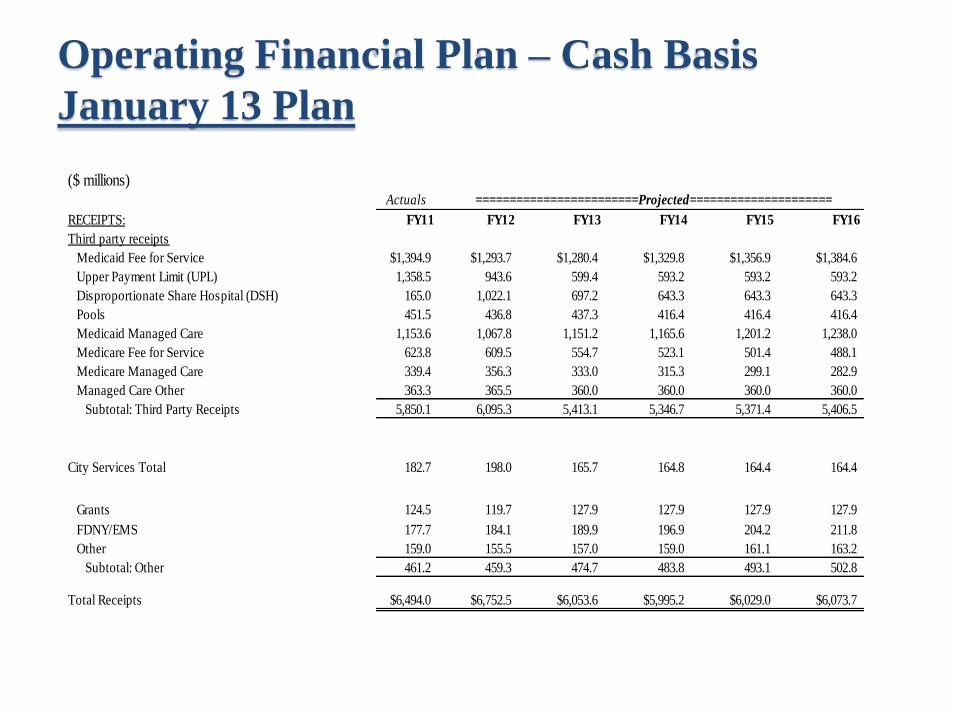
Operating Financial Plan – Cash Basis
January 13 Plan
($ millions)Actuals
RECEIPTS: FY11 FY12 FY13 FY14 FY15 FY16
Third party receipts
Medicaid Fee for Service $1,394.9 $1,293.7 $1,280.4 $1,329.8 $1,356.9 $1,384.6
Upper Payment Limit (UPL) 1,358.5 943.6 599.4 593.2 593.2 593.2
Disproportionate Share Hospital (DSH) 165.0 1,022.1 697.2 643.3 643.3 643.3
Pools 451.5 436.8 437.3 416.4 416.4 416.4
Medicaid Managed Care 1,153.6 1,067.8 1,151.2 1,165.6 1,201.2 1,238.0
Medicare Fee for Service 623.8 609.5 554.7 523.1 501.4 488.1
Medicare Managed Care 339.4 356.3 333.0 315.3 299.1 282.9
Managed Care Other 363.3 365.5 360.0 360.0 360.0 360.0
Subtotal: Third Party Receipts 5,850.1 6,095.3 5,413.1 5,346.7 5,371.4 5,406.5
City Services Total 182.7 198.0 165.7 164.8 164.4 164.4
Grants 124.5 119.7 127.9 127.9 127.9 127.9
FDNY/EMS 177.7 184.1 189.9 196.9 204.2 211.8
Other 159.0 155.5 157.0 159.0 161.1 163.2
Subtotal: Other 461.2 459.3 474.7 483.8 493.1 502.8
Total Receipts $6,494.0 $6,752.5 $6,053.6 $5,995.2 $6,029.0 $6,073.7
========================Projected=====================
Actuals
FY11 FY12 FY13 FY14 FY15 FY16
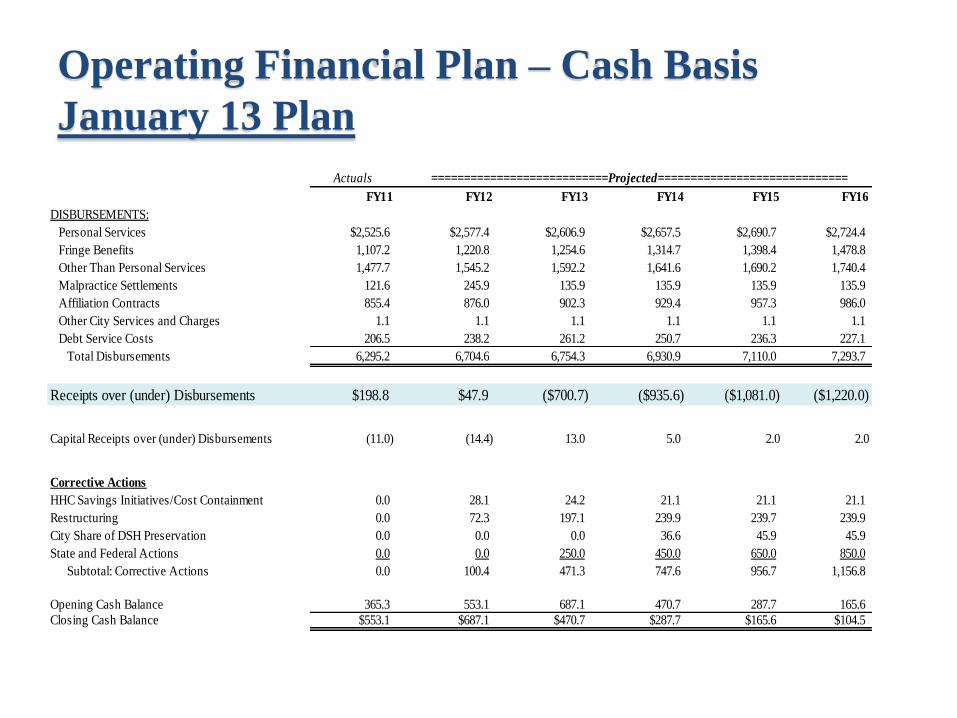
DISBURSEMENTS:
Personal Services $2,525.6 $2,577.4 $2,606.9 $2,657.5 $2,690.7 $2,724.4
Fringe Benefits 1,107.2 1,220.8 1,254.6 1,314.7 1,398.4 1,478.8
Other Than Personal Services 1,477.7 1,545.2 1,592.2 1,641.6 1,690.2 1,740.4
Malpractice Settlements 121.6 245.9 135.9 135.9 135.9 135.9
Affiliation Contracts 855.4 876.0 902.3 929.4 957.3 986.0
Other City Services and Charges 1.1 1.1 1.1 1.1 1.1 1.1
Debt Service Costs 206.5 238.2 261.2 250.7 236.3 227.1
Total Disbursements 6,295.2 6,704.6 6,754.3 6,930.9 7,110.0 7,293.7
Receipts over (under) Disbursements $198.8 $47.9 ($700.7) ($935.6) ($1,081.0) ($1,220.0)
Capital Receipts over (under) Disbursements (11.0) (14.4) 13.0 5.0 2.0 2.0
Corrective Actions
HHC Savings Initiatives/Cost Containment 0.0 28.1 24.2 21.1 21.1 21.1
Restructuring 0.0 72.3 197.1 239.9 239.7 239.9
City Share of DSH Preservation 0.0 0.0 0.0 36.6 45.9 45.9
State and Federal Actions 0.0 0.0 250.0 450.0 650.0 850.0
Subtotal: Corrective Actions 0.0 100.4 471.3 747.6 956.7 1,156.8
Opening Cash Balance 365.3 553.1 687.1 470.7 287.7 165.6
Closing Cash Balance $553.1 $687.1 $470.7 $287.7 $165.6 $104.5
===========================Projected=============================
Operating Financial Plan – Cash Basis
January 13 Plan
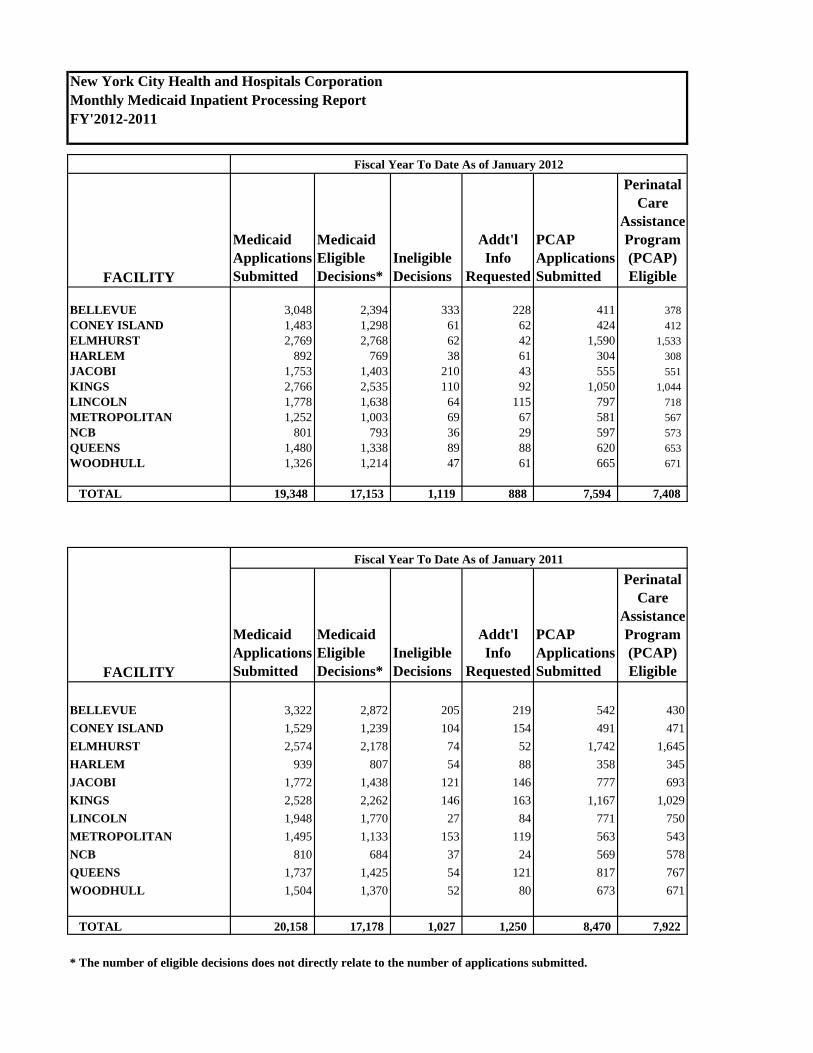
New York City Health and Hospitals CorporationMonthly Medicaid Inpatient Processing ReportFY'2012-2011
Fiscal Year To Date As of January 2012
FACILITY
Medicaid Applications Submitted
Medicaid Eligible Decisions*
Ineligible Decisions
Addt'l Info
Requested
PCAP Applications Submitted
Perinatal Care
Assistance Program (PCAP) Eligible
BELLEVUE 3,048 2,394 333 228 411 378 CONEY ISLAND 1,483 1,298 61 62 424 412 ELMHURST 2,769 2,768 62 42 1,590 1,533 HARLEM 892 769 38 61 304 308 JACOBI 1,753 1,403 210 43 555 551 KINGS 2,766 2,535 110 92 1,050 1,044 LINCOLN 1,778 1,638 64 115 797 718 METROPOLITAN 1,252 1,003 69 67 581 567 NCB 801 793 36 29 597 573 QUEENS 1,480 1,338 89 88 620 653 WOODHULL 1,326 1,214 47 61 665 671
TOTAL 19,348 17,153 1,119 888 7,594 7,408
Fiscal Year To Date As of January 2011
FACILITY
Medicaid Applications Submitted
Medicaid Eligible Decisions*
Ineligible Decisions
Addt'l Info
Requested
PCAP Applications Submitted
Perinatal Care
Assistance Program (PCAP) Eligible
BELLEVUE 3,322 2,872 205 219 542 430CONEY ISLAND 1,529 1,239 104 154 491 471ELMHURST 2,574 2,178 74 52 1,742 1,645HARLEM 939 807 54 88 358 345JACOBI 1,772 1,438 121 146 777 693KINGS 2,528 2,262 146 163 1,167 1,029LINCOLN 1,948 1,770 27 84 771 750METROPOLITAN 1,495 1,133 153 119 563 543NCB 810 684 37 24 569 578QUEENS 1,737 1,425 54 121 817 767WOODHULL 1,504 1,370 52 80 673 671
TOTAL 20,158 17,178 1,027 1,250 8,470 7,922
* The number of eligible decisions does not directly relate to the number of applications submitted.
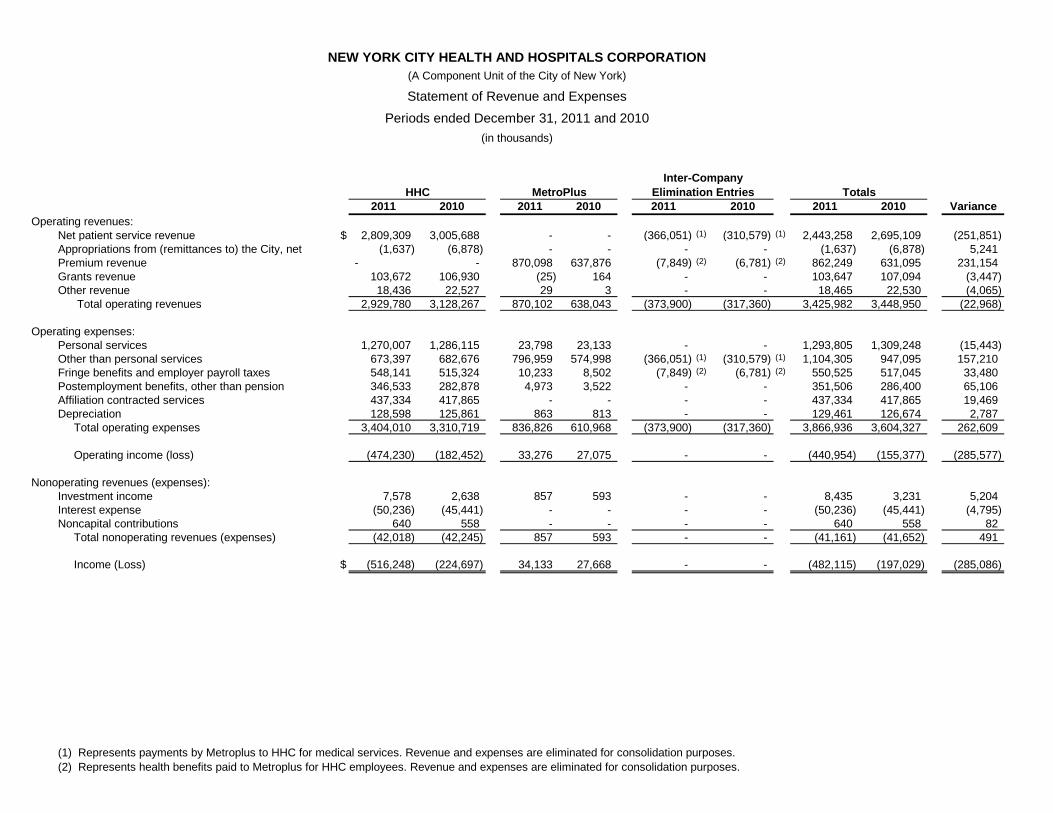
NEW YORK CITY HEALTH AND HOSPITALS CORPORATION
(A Component Unit of the City of New York)
Statement of Revenue and Expenses
Periods ended December 31, 2011 and 2010
(in thousands)
2011 2010 2011 2010 2011 2010 2011 2010 Variance
Net patient service revenue $ 2,809,309 3,005,688 - - (366,051) (1) (310,579) (1) 2,443,258 2,695,109 (251,851)
Appropriations from (remittances to) the City, net (1,637) (6,878) - - - - (1,637) (6,878) 5,241
Premium revenue - - 870,098 637,876 (7,849) (2) (6,781) (2) 862,249 631,095 231,154
Grants revenue 103,672 106,930 (25) 164 - - 103,647 107,094 (3,447)
Other revenue 18,436 22,527 29 3 - - 18,465 22,530 (4,065)
Total operating revenues 2,929,780 3,128,267 870,102 638,043 (373,900) (317,360) 3,425,982 3,448,950 (22,968)
Operating expenses:
Personal services 1,270,007 1,286,115 23,798 23,133 - - 1,293,805 1,309,248 (15,443)
Other than personal services 673,397 682,676 796,959 574,998 (366,051) (1) (310,579) (1) 1,104,305 947,095 157,210
Fringe benefits and employer payroll taxes 548,141 515,324 10,233 8,502 (7,849) (2) (6,781) (2) 550,525 517,045 33,480
Postemployment benefits, other than pension 346,533 282,878 4,973 3,522 - - 351,506 286,400 65,106
Affiliation contracted services 437,334 417,865 - - - - 437,334 417,865 19,469
Depreciation 128,598 125,861 863 813 - - 129,461 126,674 2,787
Total operating expenses 3,404,010 3,310,719 836,826 610,968 (373,900) (317,360) 3,866,936 3,604,327 262,609
Operating income (loss) (474,230) (182,452) 33,276 27,075 - - (440,954) (155,377) (285,577)
Nonoperating revenues (expenses):
Investment income 7,578 2,638 857 593 - - 8,435 3,231 5,204
Interest expense (50,236) (45,441) - - - - (50,236) (45,441) (4,795)
Noncapital contributions 640 558 - - - - 640 558 82
Total nonoperating revenues (expenses) (42,018) (42,245) 857 593 - - (41,161) (41,652) 491
Income (Loss) $ (516,248) (224,697) 34,133 27,668 - - (482,115) (197,029) (285,086)
(1) Represents payments by Metroplus to HHC for medical services. Revenue and expenses are eliminated for consolidation purposes.
(2) Represents health benefits paid to Metroplus for HHC employees. Revenue and expenses are eliminated for consolidation purposes.
Inter-Company
Totals
Operating revenues:
HHC MetroPlus Elimination Entries


![[123doc.vn] hhc daicuong](https://img.pdfslide.us/doc/110x75/558fc9551a28ab970b8b4692/123docvn-hhc-daicuong.jpg)