Embed Size (px)
Citation preview

New York City Department of EducationOffice of Accountability
October 9, 2007
LEARNING ENVIRONMENT SURVEYS
School Leaders and Strategies Make the Difference: Using Survey Results to Improve School Environment
This document is a User Guide to Survey Access, which is available online at http://schools.nyc.gov.surveys.

1. About Survey Access
2. How to Filter Survey Access
3. How School Leaders Can Use Survey Access to Identify Effective Strategies for Improving School Environment
Table of Contents

Is available online at http://schools.nyc.gov/surveys.
Is in spreadsheet form, enabling users to sort, filter, and manipulate survey data.
Includes all schools’ scores, response rates, question-level results, and number of respondents selecting each answer choice.
Includes demographic and other school profile information for purposes of analysis and identification of schools with similar characteristics.
Provides the information schools need to identify similar schools with higher ratings.
Survey Access
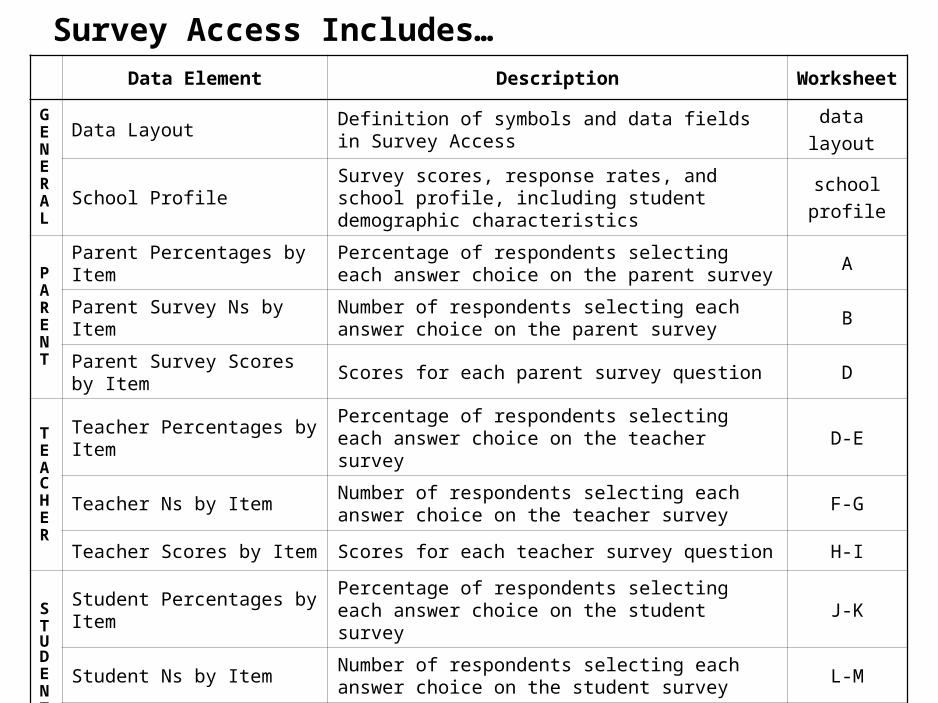
Survey Access Includes…Data Element Description Worksheet
GENERAL
Data LayoutDefinition of symbols and data fields in Survey Access
data
layout
School ProfileSurvey scores, response rates, and school profile, including student demographic characteristics
school
profile
PARENT
Parent Percentages by ItemPercentage of respondents selecting each answer choice on the parent survey
A
Parent Survey Ns by ItemNumber of respondents selecting each answer choice on the parent survey
B
Parent Survey Scores by Item
Scores for each parent survey question D
TEACHER
Teacher Percentages by ItemPercentage of respondents selecting each answer choice on the teacher survey
D-E
Teacher Ns by ItemNumber of respondents selecting each answer choice on the teacher survey
F-G
Teacher Scores by Item Scores for each teacher survey question H-I
STUDENT
Student Percentages by ItemPercentage of respondents selecting each answer choice on the student survey
J-K
Student Ns by ItemNumber of respondents selecting each answer choice on the student survey
L-M
Student Scores by Item Scores for each student survey question N-O

Table of Contents
1. About Survey Access
2. How to Filter Survey Access
3. How School Leaders Can Use Survey Access to Identify Effective Strategies for Improving School Environment
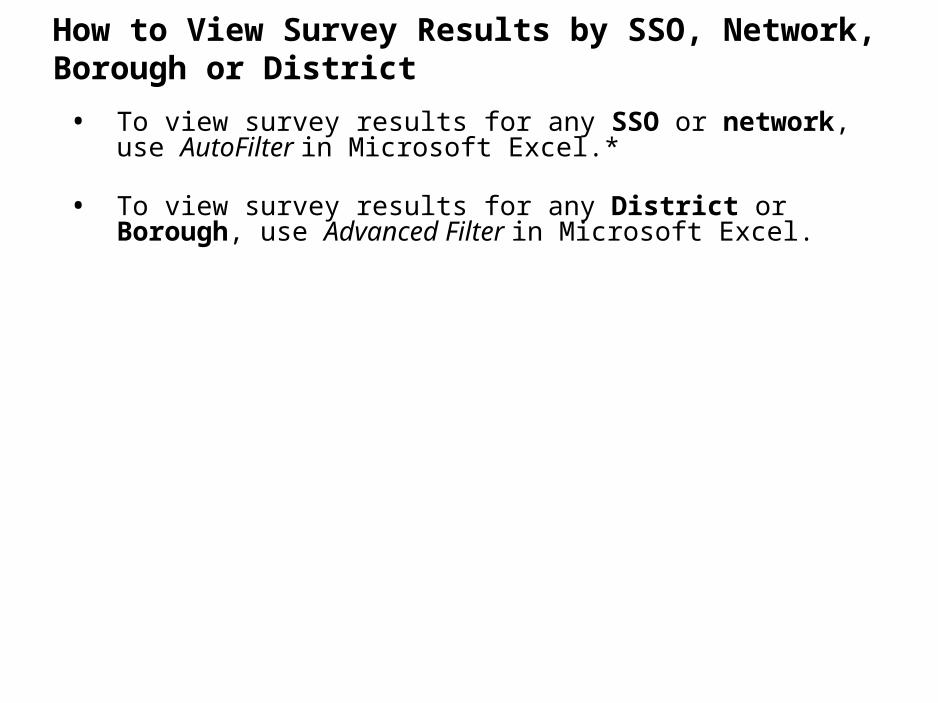
How to View Survey Results by SSO, Network, Borough or District
• To view survey results for any SSO or network, use AutoFilter in Microsoft Excel.*
• To view survey results for any District or Borough, use Advanced Filter in Microsoft Excel.

To view results by Network, follow these steps the column marked Network (column C).
Viewing Survey Data By SSO or Network
Follow these steps to use Microsoft Excel AutoFilter* to view parent percentages by item for the ESO:
Step 2: Click on the AutoFilter arrow in the column marked SSO (column B).
Step 3: Select ESO from the drop-down menu.
Results for the ESO will be displayed.
Step 1: Locate worksheet A, which includes parent survey results by item (percentages).
* For detailed information on using AutoFilter, click here to visit Microsoft Excel online help.
Microsoft Excel: Survey Access
Example: Viewing Parent Percentages by Item for the Empowerment Schools Organization (ESO)

Viewing Survey Data by District or Borough
Follow these steps to use Microsoft Excel Advanced Filter to view parent percentages by item for District 14:
Step 2: Click on the AutoFilter arrow to the right of the column label for Column A, marked “DBN.”
Step 3: Select “Custom” from the drop-down menu.
Step 4: In the window that pops up, select “begins with” and enter “14.” Click OK.
Step 1: Locate worksheet A, which includes parent survey results by item (percentages).
Results for District 14 schools will be displayed.
To view results by borough, follow the steps outlined above. In Step 4, select “contains” and enter the appropriate borough abbreviation (K is Brooklyn, M is Manhattan, Q is Queens, R is Staten Island, and X is the Bronx).
* For detailed information on using Advanced Filter, click here to visit Microsoft Excel online help.
Microsoft Excel: Survey Access
Example: Viewing Parent Percentages by Item for District 14

Removing Filters
Filters are not removed automatically. When finished using a filter or set of filters, it is important to remove the filters so that they do not interfere with future searches.
• To remove a filter, click the blue filter arrow, and select all. Repeat this step for all filters.
• When arrows and row numbers are blue, filters are on. When arrows and row numbers are black, filters are off.
• When all arrows and filters are black, filters are off.
* For detailed information on using Advanced Filter, click here to visit Microsoft Excel online help.
Microsoft Excel: Survey Access

Table of Contents
1. About Survey Access
2. How to Filter Survey Access
3. How School Leaders Can Use Survey Access to Identify Effective Strategies for Improving School Environment
0%
10%
20%
30%
40%
50%
60%
70%
80%
90%
100%
0 500 1,000 1,500 2,000
11Enrollment
Pe
rce
nta
ge
Pa
ren
ts S
ele
ctin
g
“At
Le
ast
On
ce a
Mo
nth
”
Percent poor, minority, special needs students
0%
10%
20%
30%
40%
50%
60%
70%
80%
90%
100%
0.0 20.0 40.0 60.0 80.0 100.0
”How often during this school year have you received information about what your child is studying?”
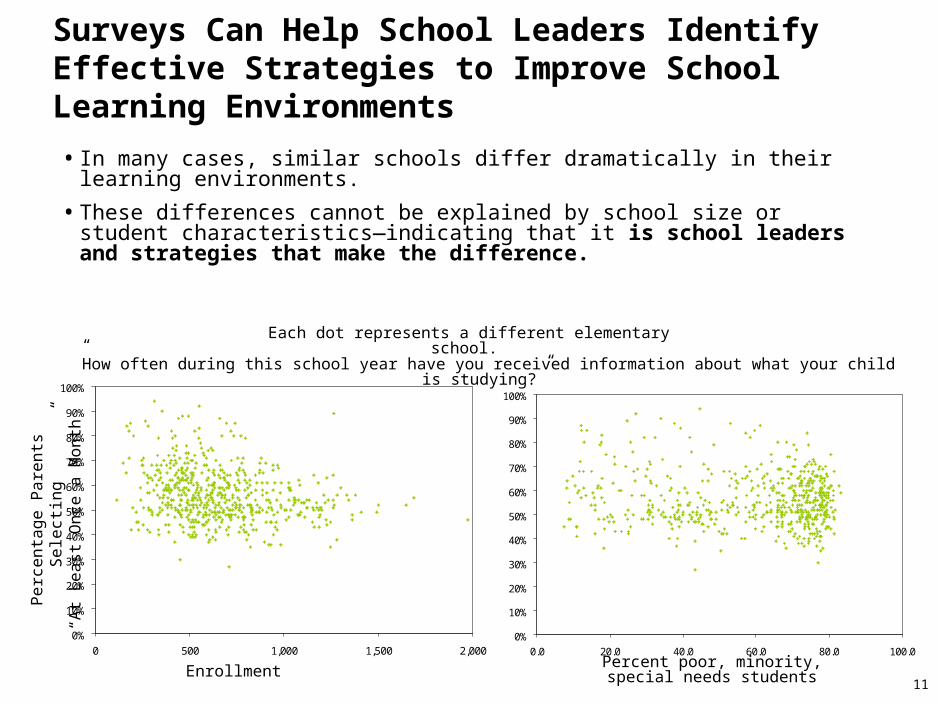
Surveys Can Help School Leaders Identify Effective Strategies to Improve School Learning Environments
Each dot represents a different elementary school.
• In many cases, similar schools differ dramatically in their learning environments.
• These differences cannot be explained by school size or student characteristics—indicating that it is school leaders and strategies that make the difference.
0%
10%
20%
30%
40%
50%
60%
70%
80%
90%
100%
0 500 1,000 1,500 2,000
12Enrollment
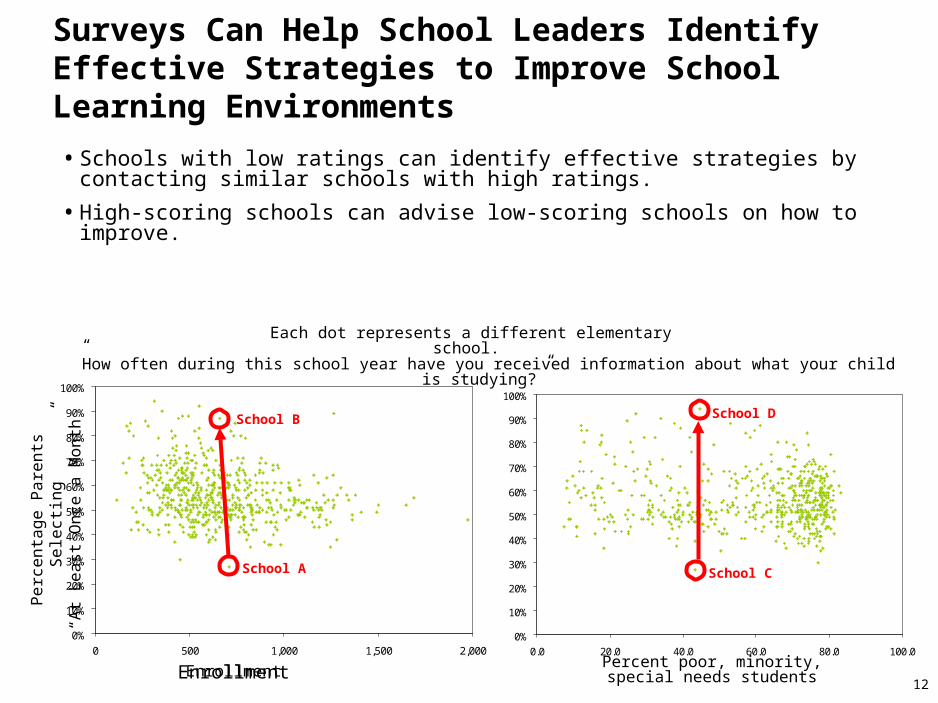
• Schools with low ratings can identify effective strategies by contacting similar schools with high ratings.
• High-scoring schools can advise low-scoring schools on how to improve.
Pe
rce
nta
ge
Pa
ren
ts S
ele
ctin
g
“At
Le
ast
On
ce a
Mo
nth
”
EnrollmentPercent poor, minority, special
needs students
0%
10%
20%
30%
40%
50%
60%
70%
80%
90%
100%
0.0 20.0 40.0 60.0 80.0 100.0
”How often during this school year have you received information about what your child is studying?”
School A
School B
School C
School D
Surveys Can Help School Leaders Identify Effective Strategies to Improve School Learning Environments
Each dot represents a different elementary school.

0%
10%
20%
30%
40%
50%
60%
70%
80%
90%
100%
0 500 1,000 1,500 2,000
13Enrollment
Pe
rce
nta
ge
Pa
ren
ts S
ele
ctin
g
“At
Le
ast
On
ce a
Mo
nth
”School Leaders Can Use Survey Access to Identify Similar Schools with Higher Ratings
• School leaders can use Survey Access to identify similar schools with higher ratings to approach for advice.
School A
School B
School A
School B
Microsoft Excel: Survey Access
• I.S. 402 is a middle school interested in using survey results to improve its learning environment.
• The principal of I.S. 402 has gathered a group of teachers to review survey results, choose an area for improvement, and identify similar schools with higher ratings in that area.
• The group hopes to approach similar schools with higher ratings to ask for advice.
Case Study: I.S. 402 Uses Survey Results to Improve School Environment

The group has developed a plan for using survey results to improve their school environment:
Case Study: I.S. 402 Uses Survey Results to Improve School Environment
• Step 1: Use survey scores to identify an area for growth.
• Step 2: Use Survey Access to identify similar schools.
• Step 3: Use Survey Access to identify similar schools with higher ratings.
• Step 4: Ask higher-scoring similar schools to share effective strategies to improve school environment.

• Identifying an Area for Growth. The group begins by the overall survey scores reported on the Survey Report, which is available on the Statistics page of the school’s Web site.
• Focusing Improvement Efforts. The group chooses to focus on Engagement, the category in which it received the lowest score of 5.8 out of 10--0.3 points below the Citywide average.
Engagement measures the degree to which a school involves students, parents and educators in a partnership to promote student learning. Schools with a broad range of curricular offerings, activities, and opportunities for parents, teachers and students to influence the direction of the school are better able to meet the learning needs of children.
Step 1: Use Survey Scores to Identify an Area for Growth
Survey Report, page 1. Survey reports are available on the Statistics page of schools’ Web sites.

The group turns to the parent, teacher, and student Engagement Scores on Page 2 of its Survey Report.
• Concentrating on Teachers. The group chooses to focus its efforts on teachers. The teacher score was the lowest in the Engagement area, below the parent and student scores.
Step 1: Use Survey Scores to Identify an Area for Growth
Survey Report, page 2.

Step 1: Use Survey Scores to Identify an Area for Growth
• Choosing a Question. To identify a concrete way in which the school can improve teacher engagement, the group turns to its teacher survey results, on pages 7-11 of its Survey Report. The group reviews all questions marked “E” for Engagement in the column marked “Domain,” on the right side of the page.
• The group notices that the school received a score of 4.8 on question 12a. 48% of teachers responding disagree and 9% strongly disagree with the statement “Obtaining information from parents about student learning needs is a priority at my school.” The group decides to focus its efforts on this question.

Step 2: Use Survey Access to Identify Similar Schools
• Self-Evaluation. The group agrees that the school should further emphasize the importance of obtaining information from parents about student learning needs.
• Challenges. One teacher says that the school already believes that information from parents is important and useful. However, the school faces two major challenges in gathering information from parents:
1. Language. Many parents at the school speak only Spanish—32% of IS 402 students are English Language Learners (ELLs). Although some teachers at the school speak Spanish, not all teachers do—this language barrier makes it difficult for many teachers to have meaningful conversations with parents.
2. School Size. The school has 723 students and just one Parent Coordinator. Additionally, student-teacher ratio at the school is high, making it difficult for teachers to connect with all of their students’ families.

Step 2: Use Survey Access to Identify Similar Schools
• School Leaders and Strategies Make the Difference. The principal knows that important aspects of school environment are not explained by factors like demographics and school size.
The principal suggests that the group contact higher-scoring similar schools to ask what strategies they use to prioritize obtaining information from parents about student learning needs.
• Defining Criteria for Similar Schools. I.S. 402 has 32% English Language Learners, and an enrollment of 723 students. The group decides to define similar schools as middle schools with over 25% English Language Learners, and enrollment over 700.

Step 2: Use Survey Access to Identify Similar Schools
• Identifying Similar Schools. The group opens Survey Access, available online at http://schools.nyc.gov/surveys. The group navigates to the worksheet labeled schoolprofile, which includes school information. On this worksheet, the group uses filter functions to identify a list of similar schools.
• Under School Type (column D), the group selects 5, which is the code for middle schools.*
• Under Enrollment (column AX), the group selects Custom. In the Advanced Filter menu, the group selects greater than and enters 700.
• Under % Students ELL (column BF), the group selects Custom. In the Advanced Filter menu, the group selects greater than and enters 0.25.
The spreadsheet displays twelve schools which meet the criteria defined.
* All codes and symbols in Survey Access are explained in the worksheet entitled “Data Layout.”
Microsoft Excel: Survey Access

Step 3: Use Survey Access to Identify Similar Schools with Higher Ratings
• Identifying Similar Schools with Higher Ratings. The group navigates to worksheet I, which includes scores for teacher questions 9-15.* The group navigates to the column including scores for teacher survey question 12a (column S).
• The group reviews scores for the similar schools identified in Step 2. Of the 12 schools identified, 7 have scores higher than I.S. 402’s score of 4.8.
• The 7 schools identified are schools with similar student characteristics with higher ratings.
* Data fields included in each worksheet are outlined in the worksheet titled “Contents.”
Microsoft Excel: Survey Access

Step 4: Ask Similar Schools for Effective Strategies to Improve School Environment
• Over the next few weeks, the principal approaches the principal of the seven schools to ask what strategies they use to gather information from parents.
• The group decides to meet again to review strategies identified, and to begin implementing changes to improve this aspect of the learning environment at I.S. 402.
• Step 1: Use survey scores to identify an area for growth.
• Step 2: Use Survey Access to identify similar schools.
• Step 3: Sort Survey Access by school characteristics and survey scores to identify similar schools with higher ratings.
• Step 4: Ask higher-scoring similar schools to share effective strategies to improve school environment.
For more information about using survey results to improve school environment, please visit http://schools.nyc.gov/survey or email [email protected].
Review: How School Leaders Can Use Survey Results to Improve School Environments


![ACCOUNTABILITY REPORT 2013 › ... › 01 › EDUCO-ACCOUNTABILITY-REPO… · Accountability report 2013 [3]](https://img.pdfslide.us/doc/110x75/5f03b5847e708231d40a62a8/accountability-report-2013-a-a-01-a-educo-accountability-repo-accountability.jpg)


![Film Brochure [elec] - Millwood, Inc. Brochure.pdf · Stretch Film & Shrink Wrap. Understanding Your Application Our Approach 123 THE DIFFERENCE TRANSPARENCY • SIMPLICITY • ACCOUNTABILITY](https://img.pdfslide.us/doc/110x75/5f9edba206f1ea16914a24fd/film-brochure-elec-millwood-inc-brochurepdf-stretch-film-shrink-wrap.jpg)