Embed Size (px)
Citation preview
New York CityBoard of Education Retirement SystemPerformance Overview as of June 30, 2021
Total Fund Overview
New York City Board of Education Retirement System 1Performance Overview as of June 30, 2021
Consultant's Commentary & Performance Charts p.3
Appendix A - Consolidated Performance Report p.33
Appendix B - Public Markets Manager Performance Detail p.40
Appendix C - Alternative Assets Manager Performance Detail p.48
Appendix D - Footnotes p.56
Table of Contents:
New York CityBoard of Education Retirement System
New York City Board of Education Retirement System 2Performance Overview as of June 30, 2021
New York City Board of Education Retirement System (BERS) Consultant’s Commentary – Through June 30, 2021
Total Fund Performance
The Board of Education Retirement System (BERS) Total Fund returned +5.89% net of fees for the quarter ended June 30, 2021, versus the policy benchmark’s return of +5.37%. For the fiscal year to date as of June 30, 2021, the Total Fund returned +27.97% net of fees, versus the benchmark return of +27.47%.
Total Fund Asset Allocation
As of June 30, 2021, the BERS Total Fund had $8.71 billion, up from $8.28 billion at March 31, 2021.
U.S. Equity Commentary
As of June 30, 2021, U.S. Equity was $2.89 billion or 33.2% of the NYBERS Total Fund. The U.S. equity composite was positive in the second quarter of 2021 returning +7.95%. This performance was below the Russell 3000 index return of +8.24%.
Active U.S. Equity Managers
Wellington returned +2.90% during the quarter, below the S&P Midcap 400 Index return of +3.64%. For the fiscal year to date as of June 30, 2021, Wellington returned +43.43% versus +53.24% for the S&P Midcap 400 Index.
• Sector allocation, a result of the bottom-up stock selection process, was a driver of relative underperformance. Allocation effect wasdriven by the overweight to information technology and underweight to real estate, but partially offset by the overweight to health careand underweight to consumer staples. Stock selection also detracted from returns. Weak selection in health care was partially offsetby selection in information technology, consumer discretionary and communication services.
• At the issuer level, the top two relative contributors were out of benchmark allocations to CommScope Holding and ApellisPharmaceuticals, while the top two relative detractors were out of benchmark allocations to ChemoCentryx and F5 Networks.
Wasatch returned +7.50% during the quarter, above the Russell 2000 Growth Index return of +3.92%. For the fiscal year to date as of June 30, 2021, Wasatch returned +52.70% versus +51.36% for the Russell 2000 Growth Index.
Consultant's Commentary
Through June 30, 2021
New York City Board of Education Retirement System 3Performance Overview as of June 30, 2021
• For the second quarter, the top contributor to the strategy performance was Pool Corp. (POOL), a wholesale distributor ofswimming pools and related supplies. The company’s customers include more than 120,000 contractors and retailers. Pool offersapproximately 200,000 national-brand and private-label products from more than 2,000 suppliers. The prevalence of stay-at-homeorders during the pandemic led many consumers to seek alternative outdoor activities, and Pool enjoyed a record year in 2020.
• The largest detractor from the strategy performance for the second quarter was Allegiant Travel Co. (ALGT), which offers airlineflights, hotel bookings, car rentals, travel management and other related services. In 2020, unlike other travel related competitors,Allegiant was not forced to raise dilutive equity or take government money. Since then, Allegiant has strengthened its relationshipswith pilots and crews and has positioned itself to benefit from leisure travel, which should accelerate sooner than business travel.During the second quarter, the stock simply gave back some of its gains but the company’s fundamentals are still attractive from arisk/reward perspective.
World ex-USA Commentary
As of June 30, 2021, World ex-USA Equity was $887.9 million (10.2%) of the NYBERS Total Fund. World ex-USA Equity returned +5.99% in the second quarter of 2021 versus +5.52% for the World ex-USA custom benchmark.
Active World ex-USA Equity Managers
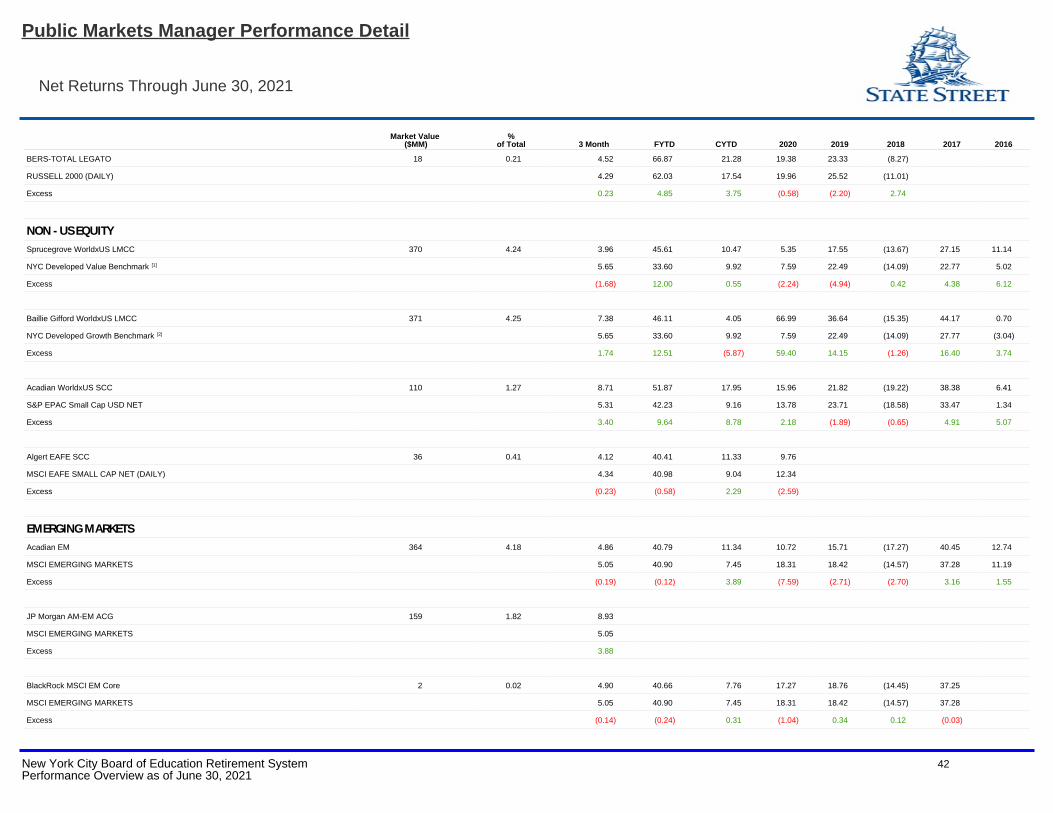
Sprucegrove returned +3.96% during the quarter versus +5.65% for NYC Developed Value Benchmark. For the fiscal year to date as of June 30, 2021, Sprucegrove returned +45.61% versus +33.60% for the NYC Developed Value Benchmark.
• The portfolio continues to represent high quality value style holdings with a projected ROE of 14.8%, which is higher than the Worldex-USA Index at 11.0%. The portfolio has a normalized P/E ratio of 15.7x, less than the 17.6x for the Index. These characteristics areconsistent with the historical profile of the manager. The manager believes the portfolio is attractively valued compared to themarket. The strategy is well diversified across sectors and geographies, a residual from bottom up selection.
• The U.K. was the largest country exposure in the Fund at 24.6%, followed by Japan at 10.7%. Exposure to Emerging Markets was13.8% and cash was 5.0% of the Fund at quarter end.
• Over the quarter, the Fund’s underperformance was mainly due to a combination of an underweight position and stock selection inFrance (Total and Air Liquide). Stock selection in Holland (SBM Offshore and Boskalis) and Germany (Henkel and BASF) and anunderweight position in Canada also had a negative impact on relative performance. Underperformance was partially offset byposition relative performance due to an underweight position in Japan and stock selection in the United Kingdom (IMI and TravisPerkins).
• The top 10 holdings represent 20.6% of the portfolio.
Consultant's Commentary
Through June 30, 2021
New York City Board of Education Retirement System 4Performance Overview as of June 30, 2021
Baillie Gifford returned +7.38% in the quarter versus +5.65% for NYC Developed Growth Benchmark. For the fiscal year to date as of June 30, 2021, Baillie Gifford returned +46.11% versus +33.60% for the NYC Developed Growth Benchmark.
• ASML, a semiconductor equipment manufacturer, was the portfolio’s largest holdings at 7.2%.
• At quarter end, the portfolio had 13.4% invested in Emerging Markets.
• The top 10 holdings represent 42.3% of the portfolio.
Acadian performed above the index for the quarter, +8.71% versus +5.31% for the S&P EPAC Small Cap Index. For the fiscal year to date as of June 30, 2021, Acadian returned +51.87% versus +42.23% for the S&P EPAC Small Cap Index.
• The top allocation by country was Japan with 15.2% followed by Switzerland (11.4%) and Australia (9.1%).
• The portfolio had a P/E of 18.2x while the benchmark had a P/E of 41.1x.
• At quarter end, the portfolio’s emerging markets exposure was 6.9%.
• The portfolio held 1,078 stocks.
Algert underperformed for the quarter, +4.12% versus +4.34% for the MSCI EAFE Small Cap Index. For the fiscal year to date as of June 30, 2021, Algert returned +40.41% versus +40.98% for the MSCI EAFE Small Cap Index.
• During the second quarter, stock selection was a modestly positive contributor to excess returns relative to the benchmark. Thestrategy’s currency, country, industry and risk factor exposures collectively detracted during the quarter.
• Catalyst-related exposures were the primary positive contributor to performance for the quarter, most notably in Europe and to alesser extent, Japan. Catalyst-driven exposures successfully captured the recovery in corporate profits and outlook across Europe,backed in part by ongoing policy support mechanisms, including the EU Next Generation initiative. Given the quickly evolving natureof the corporate recovery, NLP-based data sets provided timely information on the growing fundamental differentiation across firmsas they adapt to the nascent economic expansion. As the quarter progressed however, worrisome growth in new COVID infectionsglobally dampened growth prospects and investor bullishness. Amid this retrenchment, the strategy’s catalyst-related exposureswere able to capture the rotation away from economically sensitive firms towards more defensively oriented peers.
• The portfolio held 138 stocks compared to MSCI EAFE Small Cap of 2,384 stocks.
Consultant's Commentary
Through June 30, 2021
New York City Board of Education Retirement System 5Performance Overview as of June 30, 2021
Emerging Markets Equity Commentary
As of June 30, 2021, Emerging Markets Equity was $524.8 million or 6.0% of the NYBERS Total Fund. Emerging Markets outperformed for the quarter, +5.99% versus +5.05% for the MSCI Emerging Markets, Net Index.
Emerging Markets Equity Managers
Acadian underperformed for the quarter, posting a +4.86% versus +5.05% for the MSCI Emerging Markets, Net Index. For the fiscal year to date as of June 30, 2021, Acadian returned +40.79% versus +40.90% for the MSCI Emerging Markets, Net Index.
• The portfolio had a P/E of 10.4x, while the benchmark had a P/E of 18.7x.
• At quarter end, the portfolio held 458 stocks and the benchmark held 1,412.
• The top allocation by country was China with 34.8% followed by Taiwan (18.8%) and South Korea (17.3%).
CONY GT EM BlackRock returned +4.90% versus +5.50% for the MSCI Emerging Markets, Net Index during the quarter. For the fiscal year to date as of June 30, 2021, CONY GT EM BlackRock returned +40.66% versus +40.90% for the MSCI Emerging Markets, Net Index.
• Despite the diverging rates of restrictions and vaccination programs across emerging markets, and the increasing number of Covid-19 infections, EM posted a positive return over the period. The rise of restrictions hampered mobility in some countries and weigheddown on economies across regions. However, the improving global macro backdrop, the weakened US dollar, and the rise incommodity prices proved beneficial for emerging markets, all supporting positive performance throughout the quarter.
• Most of the GICS sectors within the MSCI Emerging Markets Index posted positive returns over the quarter. Health Care(+14.10%), Industrials (+13.51%), and Energy (+12.65%) were the best performers. While Real Estate (-5.88%), ConsumerDiscretionary (+1.46%), and Communication Services (+1.96%) were among the lowest performers.
JP Morgan returned +8.93% versus +5.05% for the MSCI Emerging Markets, Net Index during the quarter.
• Stock selection in China aided performance, with the portfolio’s position in WuXi Biologics, a global biologics service provider,outperforming. The company raised revenue and profit guidance as WuXi continues to diversify its revenue sources due toincreasing demand from global pharmaceutical outsourcing. Additionally, Xinyi Solar, a leading solar glass manufacturer, was alsoamong the top contributors, benefitting from an improved demand outlook.
Consultant's Commentary
Through June 30, 2021
New York City Board of Education Retirement System 6Performance Overview as of June 30, 2021
• Stock selection in the communication services sector was a leading contributor to returns. Sea Limited, an ASEAN e-commerce andgaming business listed in Singapore, was among the top performers. Results announced during the quarter signaled continuedgrowth across Sea's gaming, ecommerce, and fintech businesses.
Global Equity Managers
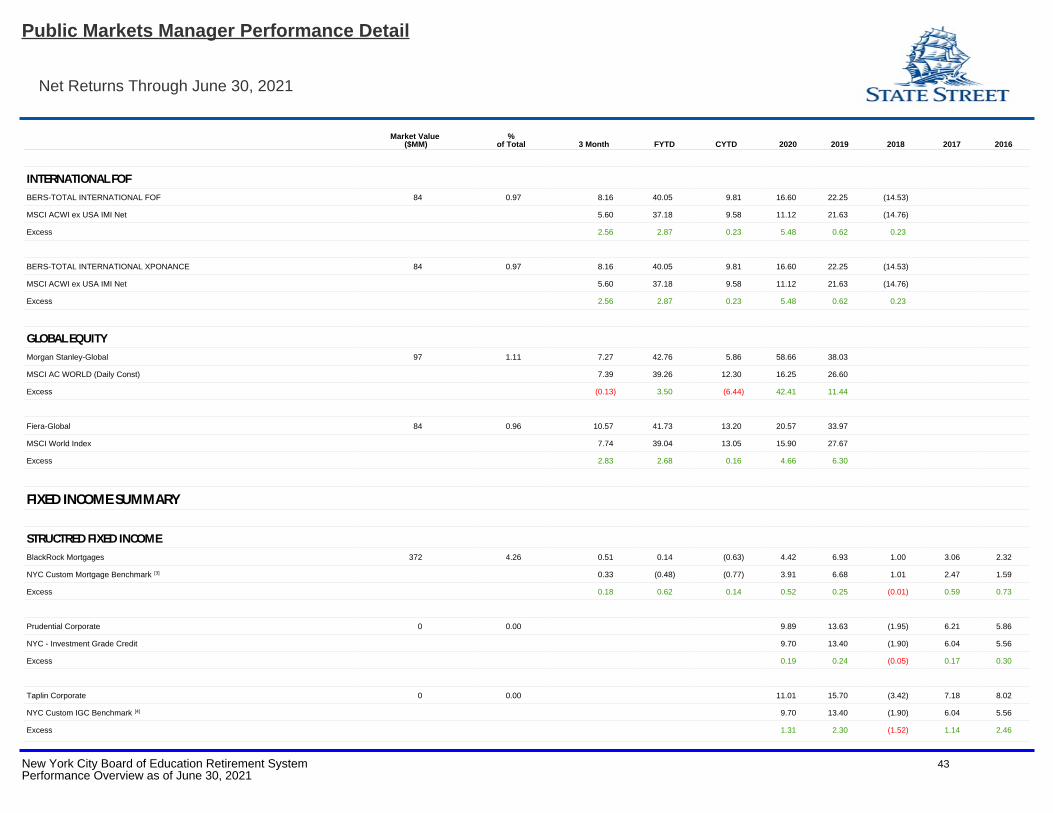
Morgan Stanley returned +7.27% versus +7.39% for the MSCI AC World Index, during the quarter. For the fiscal year to date as of June 30, 2021, Morgan Stanley outperformed returning +42.76% versus +39.26% for the MSCI AC World Index.
• During the second quarter of 2021, the portfolio’s unfavorable stock selection offset the favorable sector allocation. Global equitiesadvanced during the period, led by information technology, energy and health care. The utilities sector declined, while industrials,consumer staples and consumer discretionary also underperformed the MSCI AC World Index. Stock selection and a sectoroverweight position in information technology contributed positively to relative performance. Top individual contributors includedshares of Canadian e-commerce solution provider Shopify, French luxury brand Hermès, Danish transport and logistics companyDSV Panalpina A/S; Eastern European business services firm EPAM Systems and creative software developer Adobe.
• Stock selection in consumer discretionary and financials were the greatest detractors from relative performance during the period.Top individual detractors included Chinese tutorial provider TAL Education Group, global ride-booking and food delivery platformUber Technologies, online travel agent Trip.com, entertainment leader Walt Disney and online luxury marketplace Farfetch Limited.
Fiera returned +10.57% versus +7.74% for the MSCI World Index, during the quarter. For the fiscal year to date as of June 30, 2021, Fiera returned +41.73% versus +39.04% for the MSCI World Index.
• The leading contributors to performance over the quarter were Moody’s and MSCI. Moody’s reported solid returns in both itsinformation services and analytics segments. The company increased its guidance for the year based on strong results, with theexpectations of issuance levels looking brighter than originally feared given the strong GDP outlook, which has historically beenpositively correlated to issuance levels. As of MSCI, the company reported solid results with strong growth across the board, withIndices and ESG revenues posting double-digit growth. The company continues to see strong demand for their ESG products, whichinclude ESG benchmarking, climate data and ESG ratings, and are committed to continue investing internally to expand theircapabilities.
•The largest detractors over the quarter were Becton Dickinson and Intercontinental Hotel Group (IHG). Becton Dickinson’sunderperformance was largely driven by a faster than initially anticipated volume and price erosion of their rapid antigen test, Veritor,as well as the continual overhang of the FDA resubmission process for one of the company’s key products. Becton Dickinsonfurthermore announced the spin-off of its small diabetes business over the quarter as the company believes that the business differsfrom its core competencies. With investors already having begun pricing in a recovery, IHG’s stock entered the period with a rich
Consultant's Commentary
Through June 30, 2021
New York City Board of Education Retirement System 7Performance Overview as of June 30, 2021
valuation. The hotel group, in addition, is taking the opportunity to optimize its portfolio, which is putting pressure on room growth in the short term.
Fixed Income – Structured Manager Composite Commentary
As of June 30, 2021, the Total Structured Portfolio was $1.38 billion or 15.9% of the NYBERS Total Fund. Structured Fixed Income returned +2.01% in the second quarter versus +1.93% for the benchmark. For the fiscal year to date as of June 30, 2021, Structured Fixed Income returned -0.59% versus -0.42% for the benchmark.
Fixed Income – Structured Manager Composite Managers
BlackRock (mortgages) returned +0.51% in the quarter versus the NYC Custom Mortgage Benchmark return of +0.33%. For the fiscal year to date as of June 30, 2021, BlackRock (mortgages) returned +0.14% versus -0.48% for the NYC Custom Mortgage Benchmark.
• Sector allocation and security selection benefited results versus the index while duration negatively affected relative performanceversus the index. Exposure to commercial mortgage backed securities also contributed to some of the outperformance.
• At quarter end, the portfolio held 1,699 holdings.
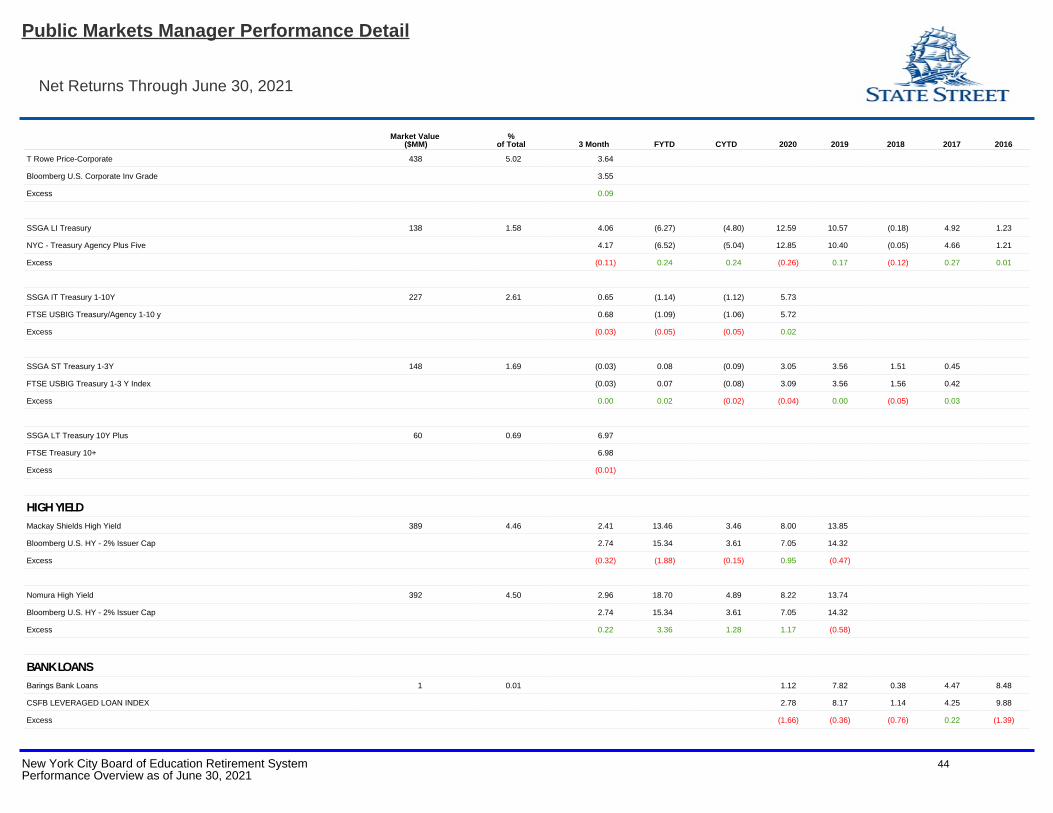
T Rowe Price returned +3.64% in the quarter versus the Bloomberg Barclay U.S. Corporate Investment Grade Index return of +3.55%.
• Credit selection within banking aided relative results, although an overweight allocation to the sector detracted marginally as aflattening yield curve compressed lending margins. Improving economic activity and steady balance sheets provided tailwinds for theglobal banking sector. Holdings in Barclays PLC and Morgan Stanley were constructive. Selection within consumer noncyclical wasalso beneficial, and an underweight allocation to the sector further supported results. The sector received a boost from positivevaccine news, economic reopening, and healthy quarterly earnings. Holdings in AbbVie and Albertsons Cos outperformed. Inaddition, an overweight allocation to energy contributed to relative performance alongside rising oil prices, although credit selectionwithin the sector negated some gains as higher-beta exploration and production companies outperformed their higher-qualitymidstream peers.
• Yield curve positioning hurt relative performance. A modest overweight within the intermediate part of the curve detracted asintermediate-term U.S. Treasury yields rose. Security selection among electric credits hindered relative performance, although anunderweight allocation was beneficial. Credits issued by Pacific Gas & Electric and Southern California Edison underperformed withthe start of the fire season out west.
Consultant's Commentary
Through June 30, 2021
New York City Board of Education Retirement System 8Performance Overview as of June 30, 2021
SSgA LI Treasury (governments) returned +4.06% in the quarter versus the +4.17% return for the NYC - Treasury Agency Plus Five. For the fiscal year to date as of June 30, 2021, SSgA (governments) returned -6.27% versus the -6.52% for the NYC - Treasury Agency Plus Five.
• US Treasury yields retreated from year to date highs reached in March with the 10-year yield declining 27 basis points (bps) to endthe quarter at 1.47% while the 30-year declined 32 bps to 2.09%. The US economy continues to reopen broadly amid an acceleratedvaccine rollout and positive data releases. Investor sentiment remains generally positive, even as multiple headwinds, mainly thethreat of higher inflation, supply chain disruptions, and a new variant of Covid-19, linger.
SSGA 1-10 Yr. Treasury/ Agency returned +0.65% in the quarter versus the FTSE USBIG Treasury/Agency 1-10 Yr. Index return of +0.68%. For the fiscal year to date as of June 30, 2021, the SSgA 1-10 Yr. Treasury Index returned -1.14%, versus the FTSE USBIGTreasury/Agency 1-10 Yr. return of -1.09%.
SSgA 1 -3 Yr. Treasury Index returned -0.03% in the quarter, matching the FTSE USBIG Treasury 1 -3 Yr. Index return of -0.03%. For the fiscal year to date as of June 30, 2021, the SSgA 1-3 Yr. Treasury Index returned +0.08%, versus the FTSE USBIG Treasury 1 -3 Yr. Index return of +0.07%.
SSGA LT Treasury 10Y Plus returned +6.97% in the quarter versus the FTSE Treasury 10+ return of +6.98%.
Enhanced Yield Fixed Income & Bank Loans Commentary
As of June 30, 2021, Enhanced Yield Fixed Income was $780.5 million or 9.0% of the NYBERS Total Fund.
Mackay Shields returned +2.41% in the quarter versus +2.74% for Bloomberg Barclays US High Yield – 2% Issuer Cap Index. For the fiscal year to date as of June 30, 2021, Mackay Shields returned +13.46% versus +15.34% for the Bloomberg Barclays US High Yield – 2% Issuer Cap Index.
• An underweight to CCC’s was negative for relative performance as riskier bonds significantly outperformed, however, this effectwas offset by positive security selection within the portfolio. Positions in Carlson Travel underperformed in Support Services,detracting from relative returns. Within the Electric-Integrated sector, an overweight to PG&E was negative for performance.
• An overweight to Energy and positive security selection in Exploration and Production were the top contributors to relativeperformance for the quarter as positions in Gulfport Energy and Talos Energy outperformed the broader market. Positioning in OilField Equipment and Services and Refining slightly detracted from returns. An underweight to Telecom-Wireline and Packaging
Consultant's Commentary
Through June 30, 2021
New York City Board of Education Retirement System 9Performance Overview as of June 30, 2021
benefitted returns as the sectors lagged during the quarter. Selection within Media-Content helped as the portfolio avoided names that underperformed within the sector.
Nomura returned +2.96% in the quarter versus +2.74% for Bloomberg Barclays US High Yield – 2% Issuer Cap Index. For the fiscal year to date as of June 30, 2021, Nomura returned +18.70% versus +15.34% for the Bloomberg Barclays US High Yield – 2% Issuer Cap Index.
• Three of the largest contributors to relative performance were Energy subsectors –the overweight to Oil Field Equipment & Servicesand positive security selection in Exploration & Production and Gas Distribution. From a ratings perspective, positive credit selectionin BBs and the overweight to CCCs contributed to relative performance. Overweight in Bs detracted slightly in the quarter, butpositive credit selection more than offset this effect. The duration posture also continued to generate alpha in Q2.
• The overweight and negative credit selection in the Pharmaceuticals sector, the underweight to the Wholesale Food sector, andnegative credit selection in Automakers all detracted from relative performance during the second quarter.
TIPS, ETI, Cash Commentary
As of June 30, 2021, Fixed Income – TIPS, ETI and Cash was $419.50 million or 4.8% of the NYBERS Total Fund.
Fixed Income – TIPS Managers
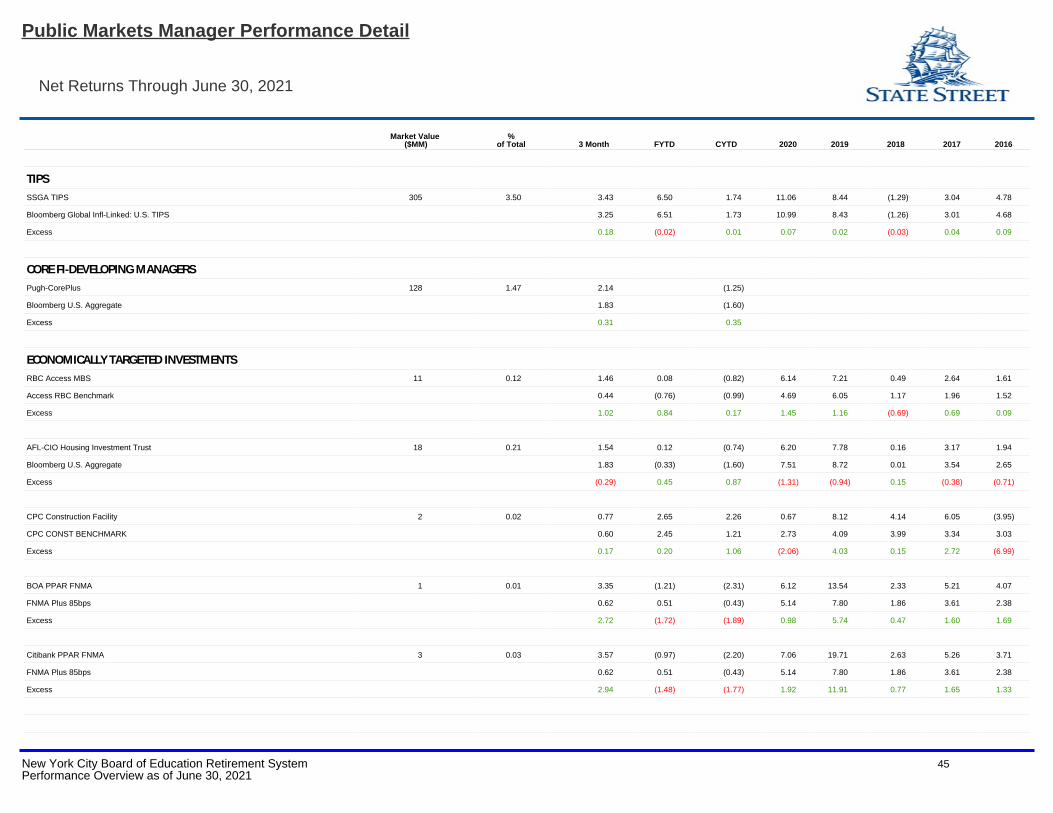
SSgA (TIPS) returned +3.43% in the quarter, above the +3.25% return for the Barclays Global Inflation Linked Index. For the fiscal year to date as of June 30, 2021, SSgA (TIPS) returned +6.50%, versus the +6.51% return for the Barclays Global Inflation Linked Index.
Fixed Income – Core Managers
Pugh returned +2.14% in the quarter, versus the +1.83% return for Bloomberg Barclays Aggregate Index.
• Asset allocation and security selection both contributed positively to performance, partially offset by a modest negative impact fromduration positioning. The overweight positioning in Corporates, ABS, and CMBS all contributed to the outperformance. In addition, theunderweight to MBS was beneficial as the sector generated negative excess returns over the quarter. Security selection withinCorporates and ABS positively impacted performance, due in part to an overweight exposure to BBB-rated, crossover, and high yieldCorporates, which outperformed higher quality alternatives.
• Duration was managed to be slightly lower than the Index throughout the quarter as interest rates declined, negatively impactingperformance. At quarter end, the portfolio duration was 6.36, slightly lower than Index duration of 6.58.
Consultant's Commentary
Through June 30, 2021
New York City Board of Education Retirement System 10Performance Overview as of June 30, 2021
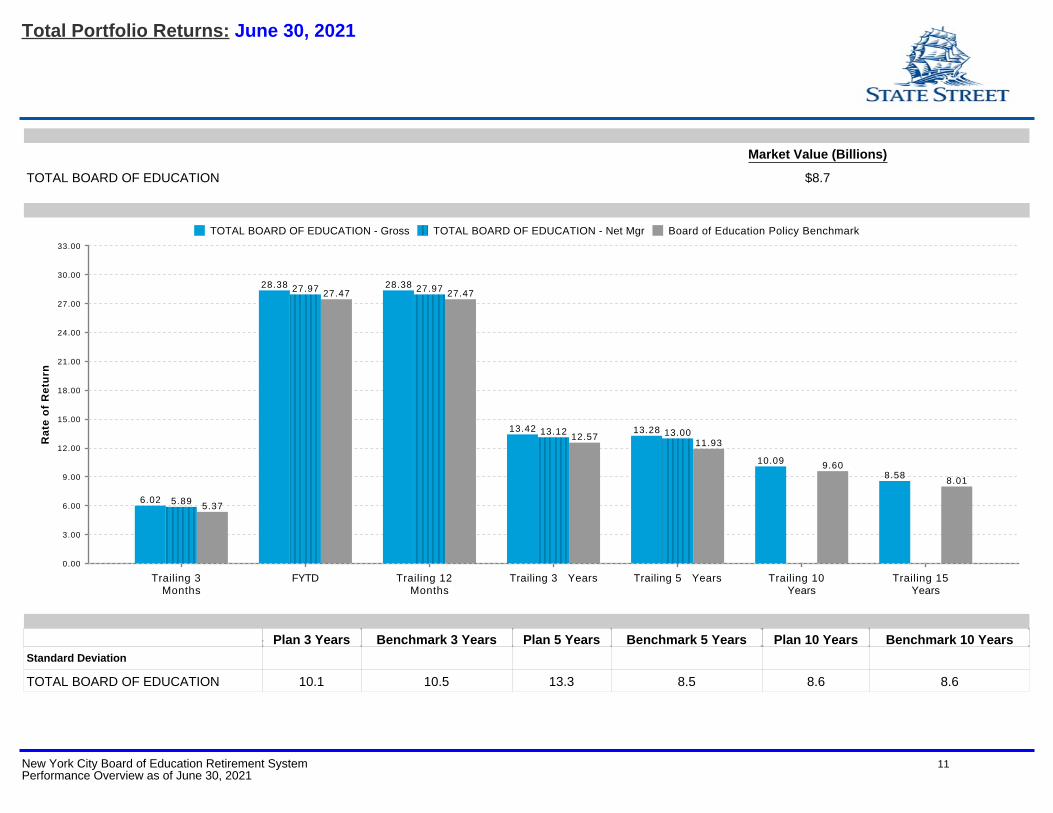
Plan 3 Years Benchmark 3 Years Plan 5 Years Benchmark 5 Years Plan 10 Years Benchmark 10 YearsStandard Deviation
TOTAL BOARD OF EDUCATION 10.1 10.5 13.3 8.5 8.6 8.6
TOTAL BOARD OF EDUCATION - Gross TOTAL BOARD OF EDUCATION - Net Mgr Board of Education Policy Benchmark
Trailing 3 Months
FYTD Trailing 12 Months
Trailing 3 Years Trailing 5 Years Trailing 10 Years
Trailing 15 Years
0.00
3.00
6.00
9.00
12.00
15.00
18.00
21.00
24.00
27.00
30.00
33.00
Ra
te o
f R
etu
rn
6.02 5.89 5.37
28.38 27.97 27.4728.38 27.97 27.47
13.42 13.12 12.5713.28 13.00
11.93
10.09 9.608.58
8.01
Market Value (Billions)
TOTAL BOARD OF EDUCATION $8.7
Total Portfolio Returns: June 30, 2021
New York City Board of Education Retirement System 11Performance Overview as of June 30, 2021
2.2%
0.2% 0.0%
-0.8% -2.0%
-3.9%
1.0% 1.0% 2.1%
-8.00%
-6.00%
-4.00%
-2.00%
0.00%2.00%
4.00%
6.00%
8.00%
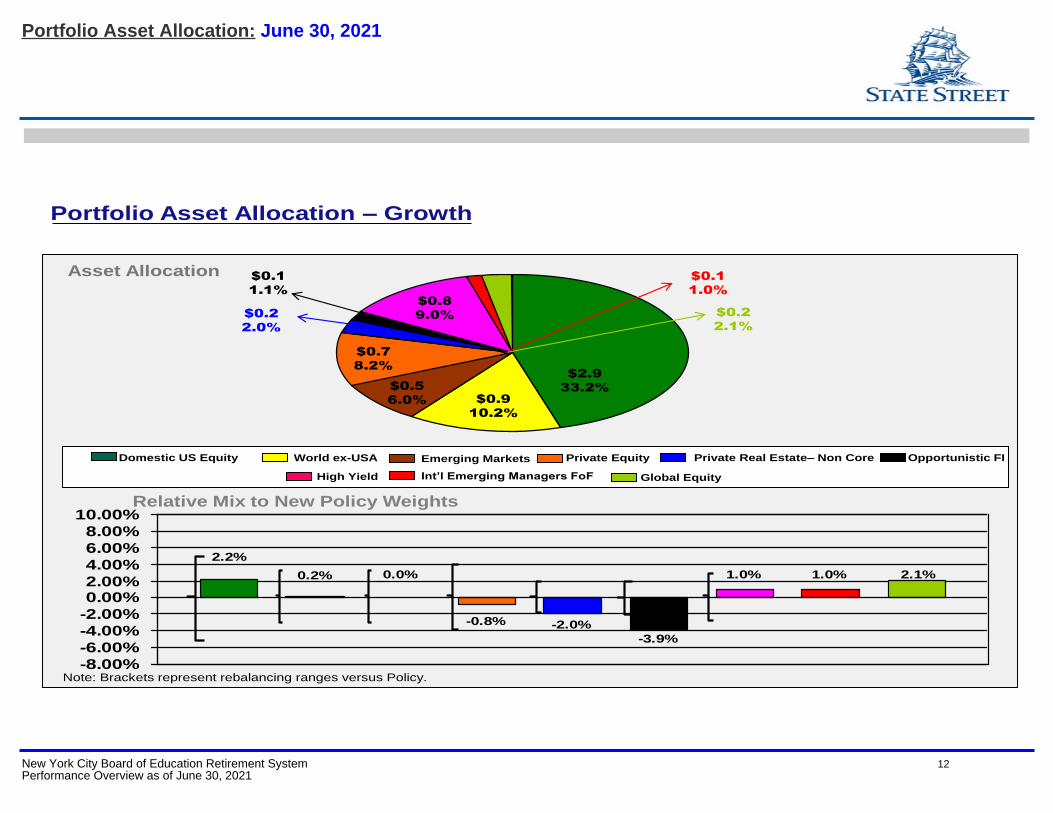
10.00%Relative Mix to New Policy Weights
$2.9
33.2%
Domestic US Equity World ex-USA Emerging Markets Private Equity
$0.9
10.2%
$0.5
6.0%
$0.7
8.2%
$0.8
9.0%$0.2
2.0%
Private Real Estate– Non Core
Portfolio Asset Allocation – Growth
Asset Allocation
Note: Brackets represent rebalancing ranges versus Policy.
High Yield Int’l Emerging Managers FoF Global Equity
$0.2
2.1%
$0.1
1.0%
Opportunistic FI
$0.1
1.1%
Portfolio Asset Allocation: June 30, 2021
New York City Board of Education Retirement System 12Performance Overview as of June 30, 2021
s
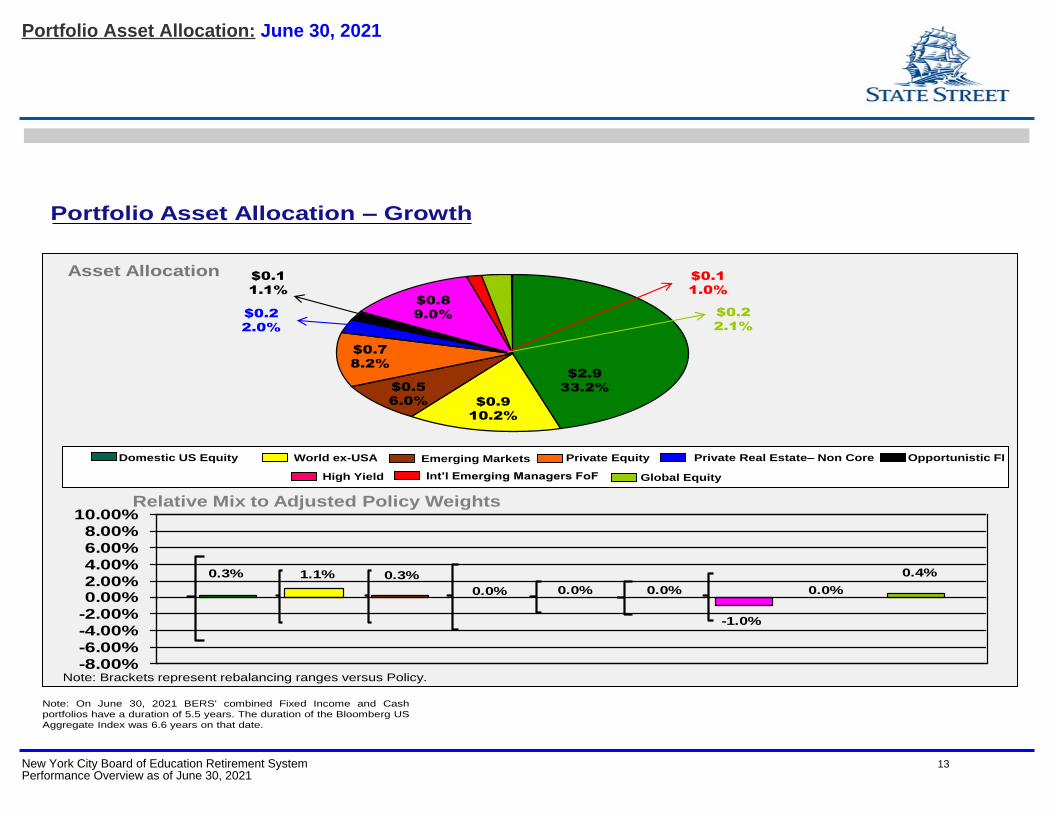
Portfolio Asset Allocation – Growth
Asset Allocation
Note: Brackets represent rebalancing ranges versus Policy.
0.3% 1.1% 0.3%
0.0% 0.0% 0.0%
-1.0%
0.0%
0.4%
-8.00%
-6.00%
-4.00%
-2.00%
0.00%2.00%
4.00%
6.00%
8.00%
10.00%Relative Mix to Adjusted Policy Weights
Note: On June 30, 2021 BERS' combined Fixed Income and Cash
portfolios have a duration of 5.5 years. The duration of the Bloomberg US
Aggregate Index was 6.6 years on that date.
Domestic US Equity World ex-USA Emerging Markets Private Equity Private Real Estate– Non Core
High Yield Int’l Emerging Managers FoF Global Equity
Opportunistic FI
$2.9
33.2%
$0.9
10.2%
$0.5
6.0%
$0.7
8.2%
$0.8
9.0%$0.2
2.0%
$0.2
2.1%
$0.1
1.0%
$0.1
1.1%
Portfolio Asset Allocation: June 30, 2021
New York City Board of Education Retirement System 13Performance Overview as of June 30, 2021
Asset Allocation
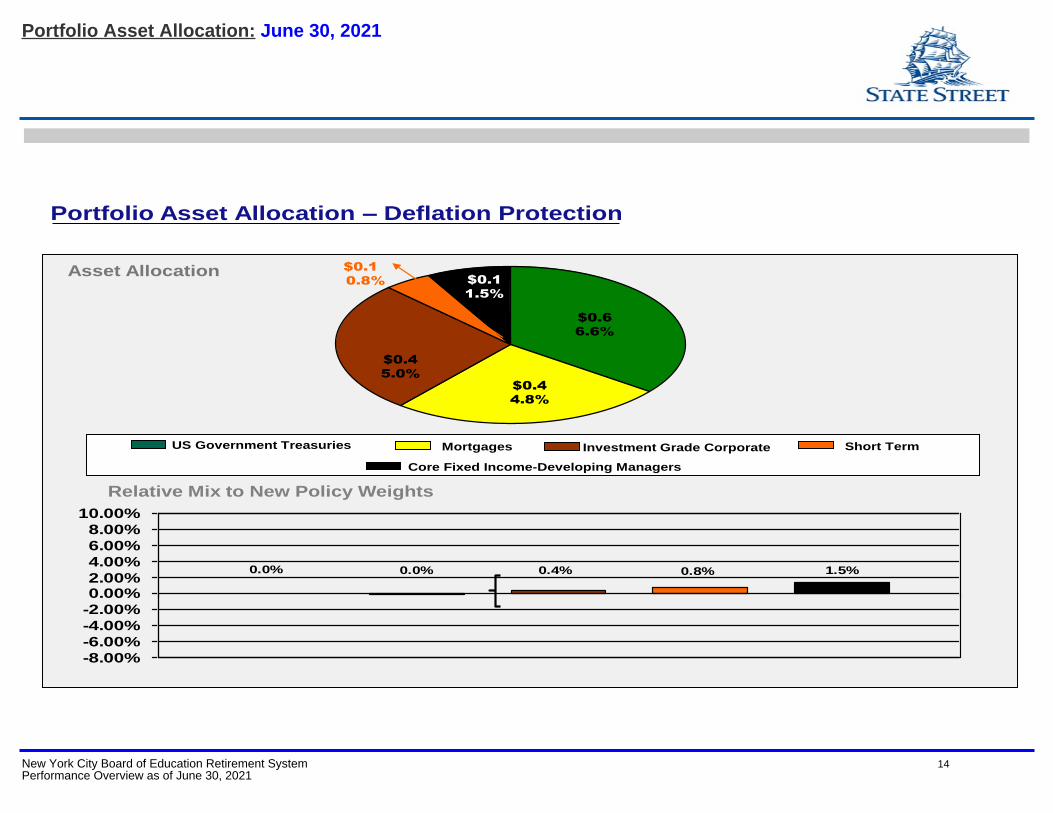
US Government Treasuries
1.5%0.0% 0.0% 0.4% 0.8%
-8.00%
-6.00%
-4.00%
-2.00%
0.00%2.00%
4.00%
6.00%
8.00%
10.00%
Mortgages Investment Grade Corporate Short Term
Relative Mix to New Policy Weights
Portfolio Asset Allocation – Deflation Protection
$0.1
0.8%
Core Fixed Income-Developing Managers
$0.1
1.5%
$0.6
6.6%
$0.4
5.0%
$0.4
4.8%
Portfolio Asset Allocation: June 30, 2021
New York City Board of Education Retirement System 14Performance Overview as of June 30, 2021
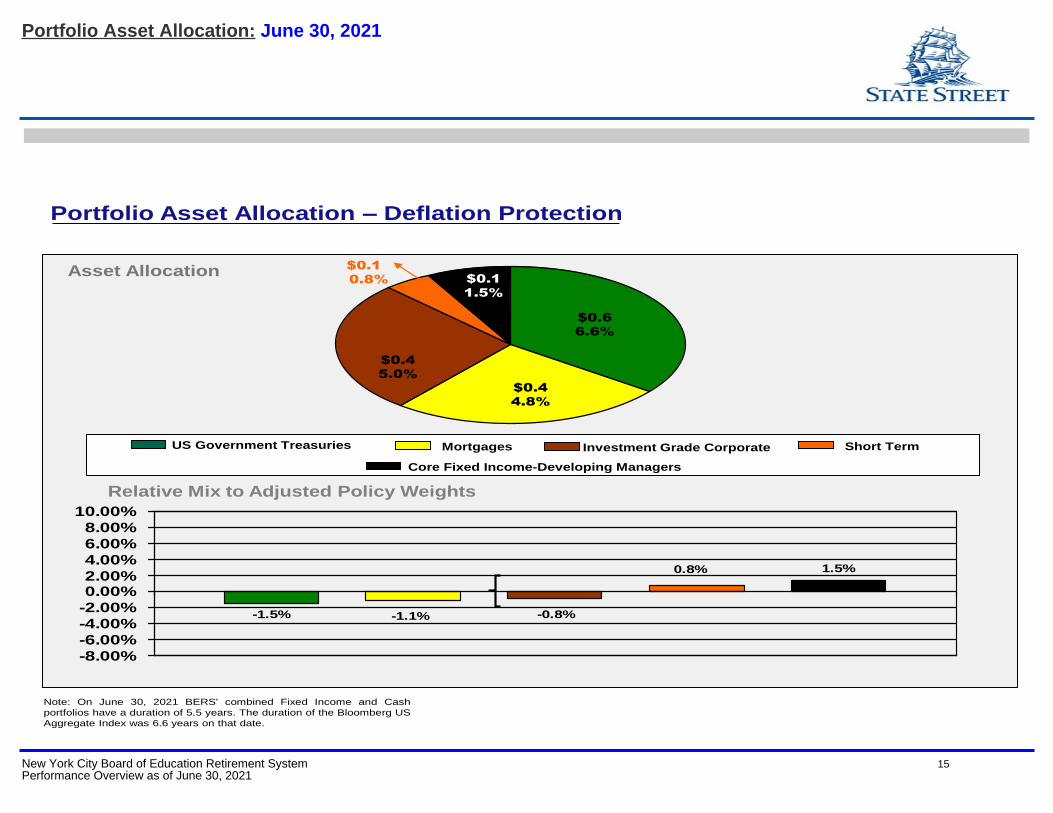
Asset Allocation
Relative Mix to Adjusted Policy Weights
Portfolio Asset Allocation – Deflation Protection
1.5%
-1.5% -1.1% -0.8%
0.8%
-8.00%
-6.00%
-4.00%
-2.00%
0.00%2.00%
4.00%
6.00%
8.00%
10.00%
US Government Treasuries Mortgages Investment Grade Corporate Short Term
Core Fixed Income-Developing Managers
$0.1
0.8% $0.1
1.5%
$0.6
6.6%
$0.4
5.0%
$0.4
4.8%
Note: On June 30, 2021 BERS' combined Fixed Income and Cash
portfolios have a duration of 5.5 years. The duration of the Bloomberg US
Aggregate Index was 6.6 years on that date.
Portfolio Asset Allocation: June 30, 2021
New York City Board of Education Retirement System 15Performance Overview as of June 30, 2021
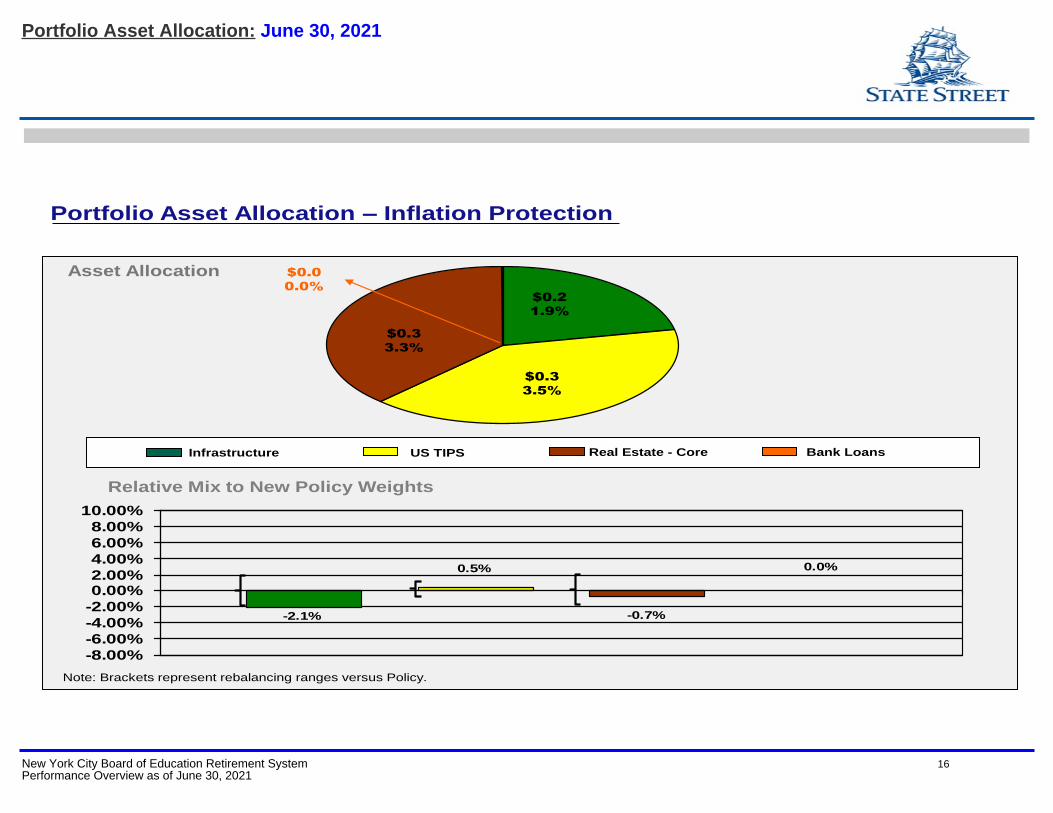
Asset Allocation
Infrastructure US TIPS Real Estate - Core Bank Loans
Relative Mix to New Policy Weights
Note: Brackets represent rebalancing ranges versus Policy.
Portfolio Asset Allocation – Inflation Protection
$0.3
3.5%
$0.3
3.3%
$0.0
0.0%
$0.2
1.9%
-2.1%
0.5%
-0.7%
0.0%
-8.00%
-6.00%
-4.00%
-2.00%
0.00%2.00%
4.00%
6.00%
8.00%
10.00%
Portfolio Asset Allocation: June 30, 2021
New York City Board of Education Retirement System 16Performance Overview as of June 30, 2021
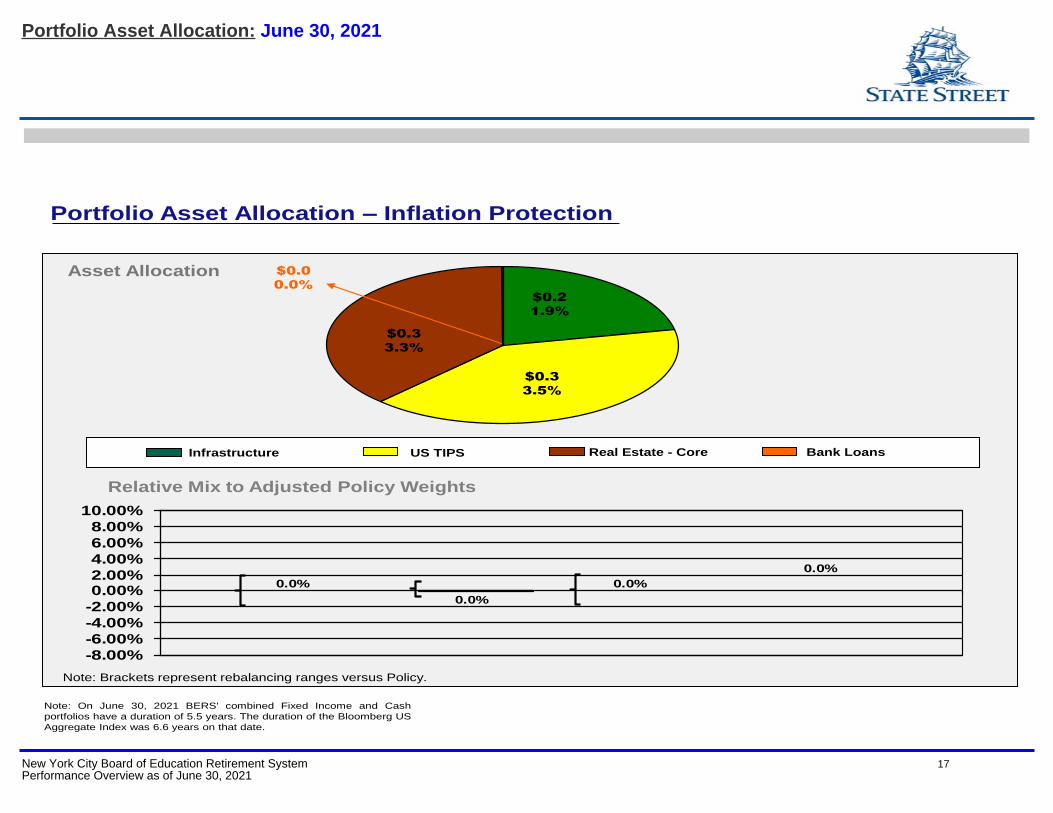
Asset Allocation
Infrastructure
0.0%
0.0%
0.0%
0.0%
-8.00%
-6.00%
-4.00%
-2.00%
0.00%2.00%
4.00%
6.00%
8.00%
10.00%
US TIPS Real Estate - Core Bank Loans
Relative Mix to Adjusted Policy Weights
Note: Brackets represent rebalancing ranges versus Policy.
Portfolio Asset Allocation – Inflation Protection
$0.3
3.5%
$0.3
3.3%
$0.0
0.0%
$0.2
1.9%
Note: On June 30, 2021 BERS' combined Fixed Income and Cash
portfolios have a duration of 5.5 years. The duration of the Bloomberg US
Aggregate Index was 6.6 years on that date.
Portfolio Asset Allocation: June 30, 2021
New York City Board of Education Retirement System 17Performance Overview as of June 30, 2021
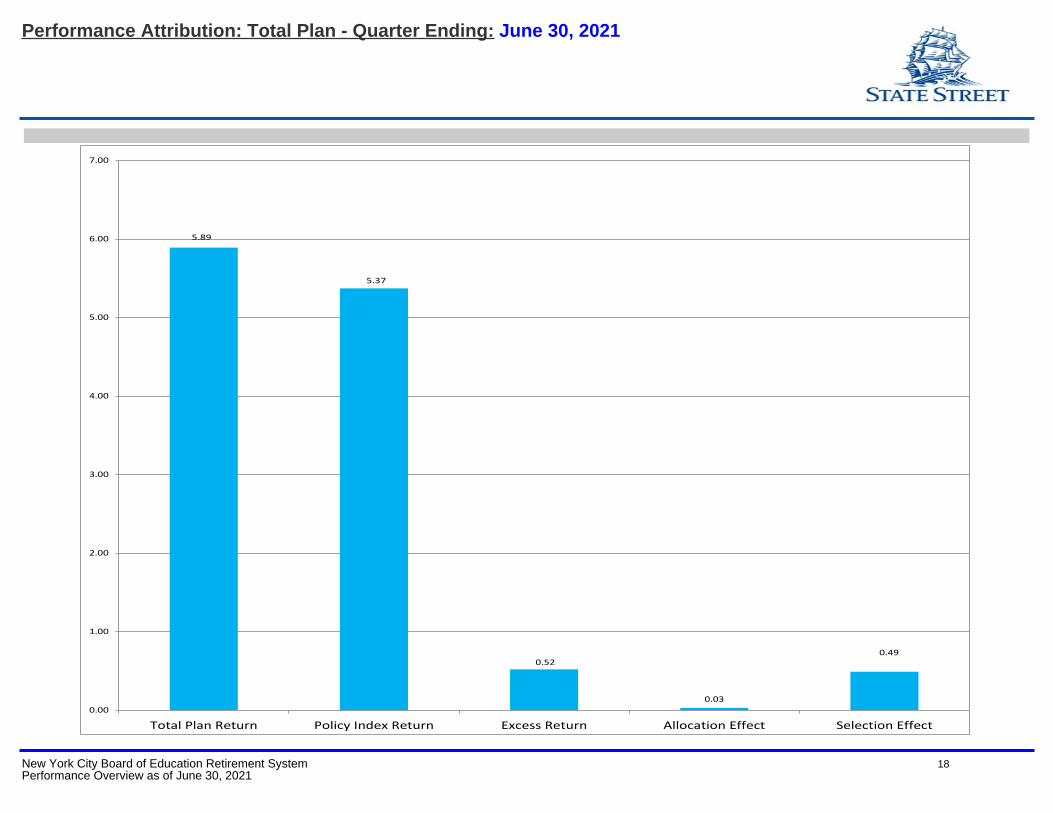
5.89
5.37
0.52
0.03
0.49
0.00
1.00
2.00
3.00
4.00
5.00
6.00
7.00
Total Plan Return Policy Index Return Excess Return Allocation Effect Selection Effect
Performance Attribution: Total Plan - Quarter Ending: June 30, 2021
New York City Board of Education Retirement System 18Performance Overview as of June 30, 2021
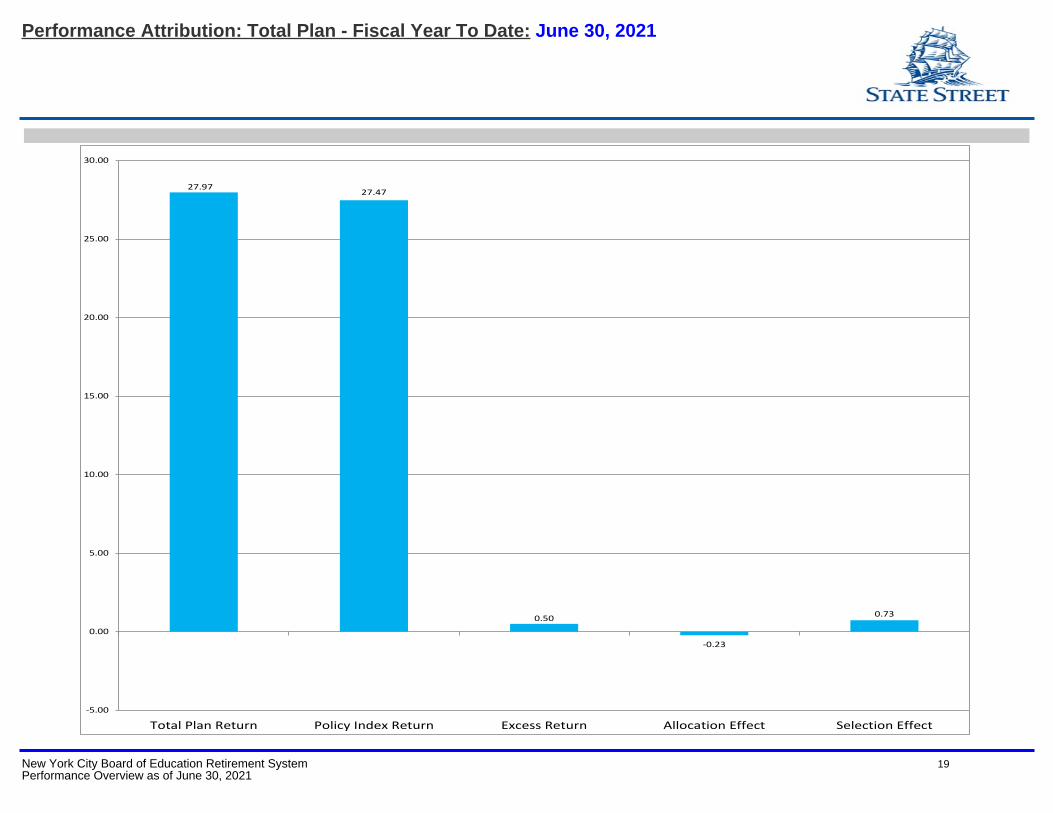
27.9727.47
0.50
-0.23
0.73
-5.00
0.00
5.00
10.00
15.00
20.00
25.00
30.00
Total Plan Return Policy Index Return Excess Return Allocation Effect Selection Effect
Performance Attribution: Total Plan - Fiscal Year To Date: June 30, 2021
New York City Board of Education Retirement System 19Performance Overview as of June 30, 2021
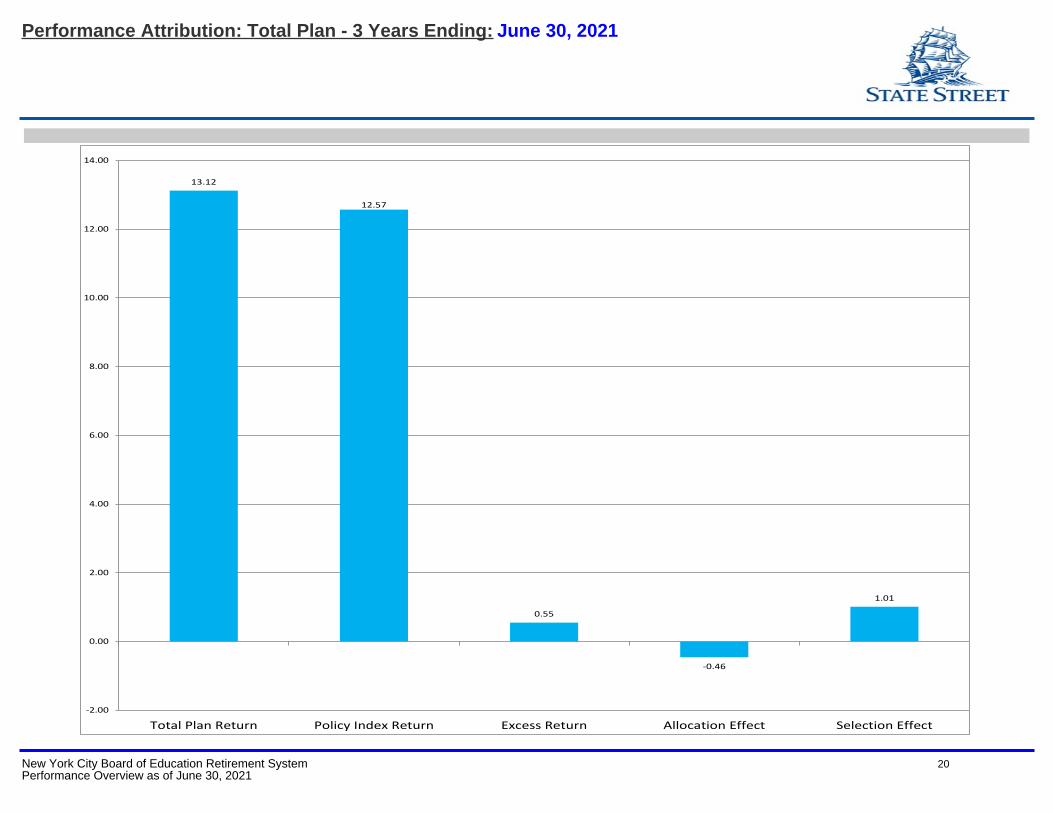
13.12
12.57
0.55
-0.46
1.01
-2.00
0.00
2.00
4.00
6.00
8.00
10.00
12.00
14.00
Total Plan Return Policy Index Return Excess Return Allocation Effect Selection Effect
Performance Attribution: Total Plan - 3 Years Ending: June 30, 2021
New York City Board of Education Retirement System 20Performance Overview as of June 30, 2021
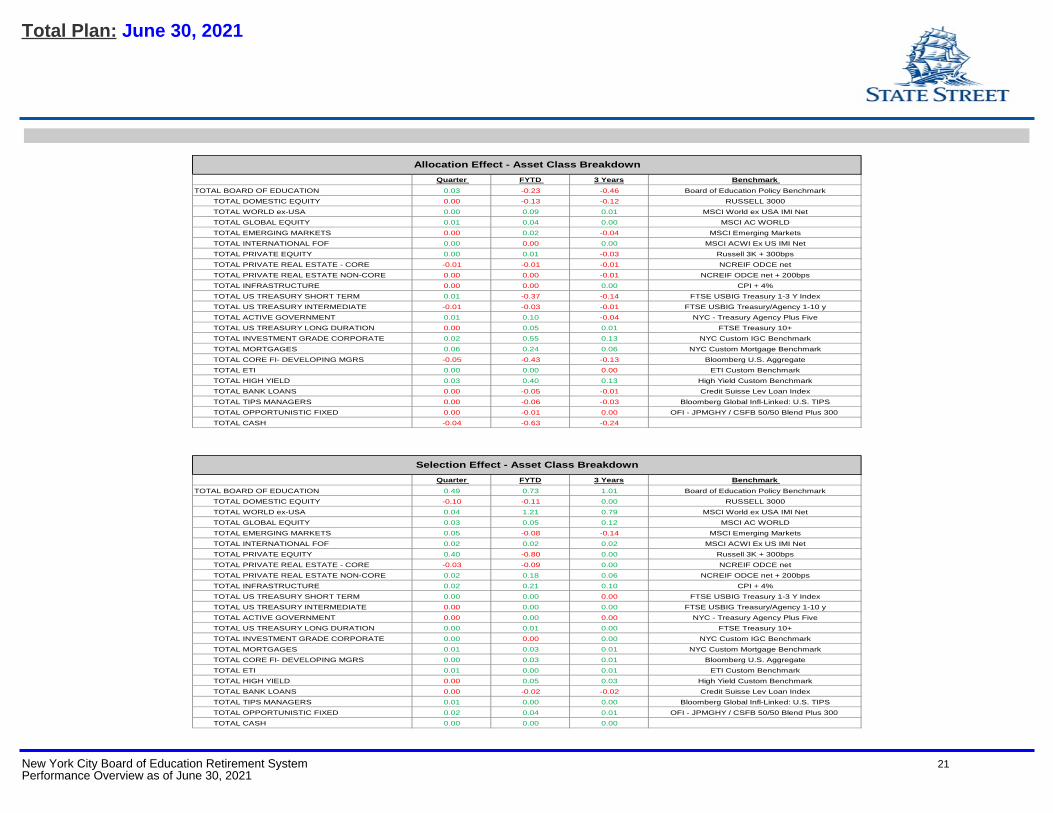
Quarter FYTD 3 Years Benchmark
TOTAL BOARD OF EDUCATION 0.03 -0.23 -0.46 Board of Education Policy Benchmark
TOTAL DOMESTIC EQUITY 0.00 -0.13 -0.12 RUSSELL 3000
TOTAL WORLD ex-USA 0.00 0.09 0.01 MSCI World ex USA IMI Net
TOTAL GLOBAL EQUITY 0.01 0.04 0.00 MSCI AC WORLD
TOTAL EMERGING MARKETS 0.00 0.02 -0.04 MSCI Emerging Markets
TOTAL INTERNATIONAL FOF 0.00 0.00 0.00 MSCI ACWI Ex US IMI Net
TOTAL PRIVATE EQUITY 0.00 0.01 -0.03 Russell 3K + 300bps
TOTAL PRIVATE REAL ESTATE - CORE -0.01 -0.01 -0.01 NCREIF ODCE net
TOTAL PRIVATE REAL ESTATE NON-CORE 0.00 0.00 -0.01 NCREIF ODCE net + 200bps
TOTAL INFRASTRUCTURE 0.00 0.00 0.00 CPI + 4%
TOTAL US TREASURY SHORT TERM 0.01 -0.37 -0.14 FTSE USBIG Treasury 1-3 Y Index
TOTAL US TREASURY INTERMEDIATE -0.01 -0.03 -0.01 FTSE USBIG Treasury/Agency 1-10 y
TOTAL ACTIVE GOVERNMENT 0.01 0.10 -0.04 NYC - Treasury Agency Plus Five
TOTAL US TREASURY LONG DURATION 0.00 0.05 0.01 FTSE Treasury 10+
TOTAL INVESTMENT GRADE CORPORATE 0.02 0.55 0.13 NYC Custom IGC Benchmark
TOTAL MORTGAGES 0.06 0.24 0.06 NYC Custom Mortgage Benchmark
TOTAL CORE FI- DEVELOPING MGRS -0.05 -0.43 -0.13 Bloomberg U.S. Aggregate
TOTAL ETI 0.00 0.00 0.00 ETI Custom Benchmark
TOTAL HIGH YIELD 0.03 0.40 0.13 High Yield Custom Benchmark
TOTAL BANK LOANS 0.00 -0.05 -0.01 Credit Suisse Lev Loan Index
TOTAL TIPS MANAGERS 0.00 -0.06 -0.03 Bloomberg Global Infl-Linked: U.S. TIPS
TOTAL OPPORTUNISTIC FIXED 0.00 -0.01 0.00 OFI - JPMGHY / CSFB 50/50 Blend Plus 300
TOTAL CASH -0.04 -0.63 -0.24
Quarter FYTD 3 Years Benchmark
TOTAL BOARD OF EDUCATION 0.49 0.73 1.01 Board of Education Policy Benchmark
TOTAL DOMESTIC EQUITY -0.10 -0.11 0.00 RUSSELL 3000
TOTAL WORLD ex-USA 0.04 1.21 0.79 MSCI World ex USA IMI Net
TOTAL GLOBAL EQUITY 0.03 0.05 0.12 MSCI AC WORLD
TOTAL EMERGING MARKETS 0.05 -0.08 -0.14 MSCI Emerging Markets
TOTAL INTERNATIONAL FOF 0.02 0.02 0.02 MSCI ACWI Ex US IMI Net
TOTAL PRIVATE EQUITY 0.40 -0.80 0.00 Russell 3K + 300bps
TOTAL PRIVATE REAL ESTATE - CORE -0.03 -0.09 0.00 NCREIF ODCE net
TOTAL PRIVATE REAL ESTATE NON-CORE 0.02 0.18 0.06 NCREIF ODCE net + 200bps
TOTAL INFRASTRUCTURE 0.02 0.21 0.10 CPI + 4%
TOTAL US TREASURY SHORT TERM 0.00 0.00 0.00 FTSE USBIG Treasury 1-3 Y Index
TOTAL US TREASURY INTERMEDIATE 0.00 0.00 0.00 FTSE USBIG Treasury/Agency 1-10 y
TOTAL ACTIVE GOVERNMENT 0.00 0.00 0.00 NYC - Treasury Agency Plus Five
TOTAL US TREASURY LONG DURATION 0.00 0.01 0.00 FTSE Treasury 10+
TOTAL INVESTMENT GRADE CORPORATE 0.00 0.00 0.00 NYC Custom IGC Benchmark
TOTAL MORTGAGES 0.01 0.03 0.01 NYC Custom Mortgage Benchmark
TOTAL CORE FI- DEVELOPING MGRS 0.00 0.03 0.01 Bloomberg U.S. Aggregate
TOTAL ETI 0.01 0.00 0.01 ETI Custom Benchmark
TOTAL HIGH YIELD 0.00 0.05 0.03 High Yield Custom Benchmark
TOTAL BANK LOANS 0.00 -0.02 -0.02 Credit Suisse Lev Loan Index
TOTAL TIPS MANAGERS 0.01 0.00 0.00 Bloomberg Global Infl-Linked: U.S. TIPS
TOTAL OPPORTUNISTIC FIXED 0.02 0.04 0.01 OFI - JPMGHY / CSFB 50/50 Blend Plus 300
TOTAL CASH 0.00 0.00 0.00
Allocation Effect - Asset Class Breakdown
Selection Effect - Asset Class Breakdown
Total Plan: June 30, 2021
New York City Board of Education Retirement System 21Performance Overview as of June 30, 2021
TOTAL SMALL CAP ACTIVE
TOTAL MID CAP ACTIVE
TOTAL SMALL CAP PASSIVE
TOTAL RUSSELL 1000 PASSIVE
TOTAL RUSSELL TOP 200 PASSIVE
TOTAL EMERGING MANAGERS
0.6%
23.6%
3.9%
9.4%
3.1%
59.4%
TOTAL SMALL CAP ACTIVE
TOTAL MID CAP ACTIVE
TOTAL SMALL CAP PASSIVE
TOTAL RUSSELL 1000 PASSIVE
TOTAL RUSSELL TOP 200 PASSIVE
TOTAL EMERGING MANAGERS
0.6%
23.6%
3.9%
9.4%
3.1%
59.4%
Market Value (Billions) % of Plan
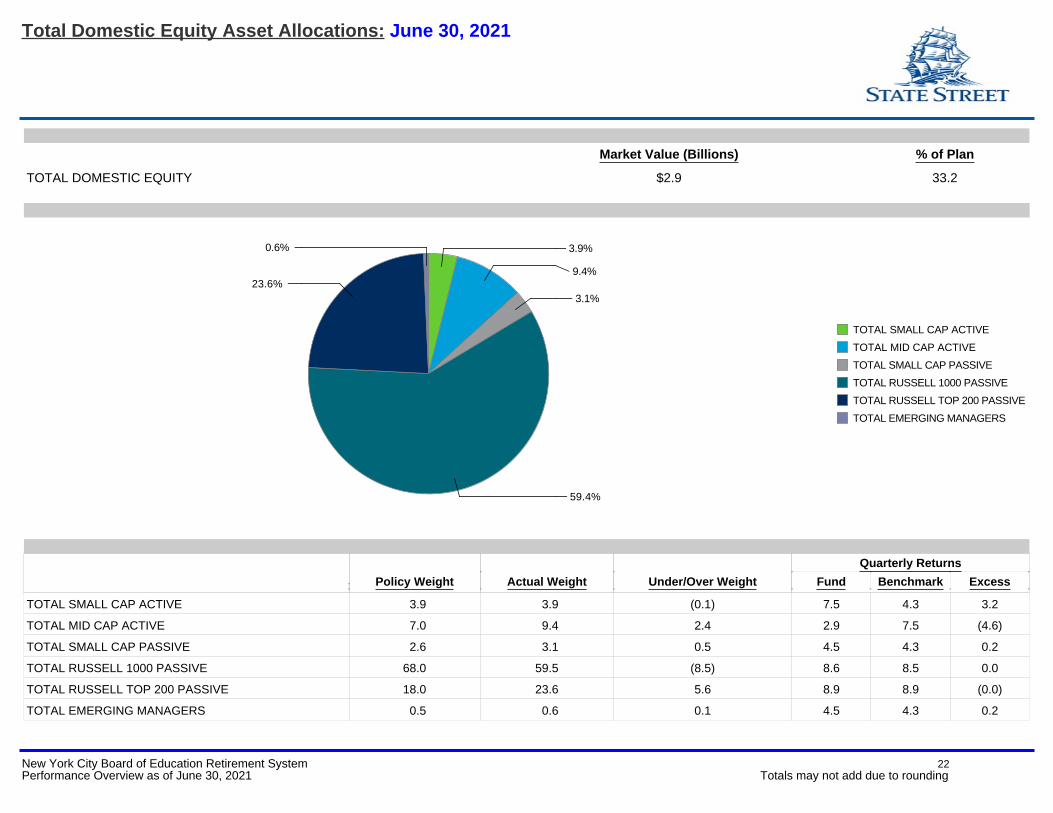
TOTAL DOMESTIC EQUITY $2.9 33.2
Policy Weight Actual Weight Under/Over WeightQuarterly Returns
Fund Benchmark Excess
TOTAL SMALL CAP ACTIVE 3.9 3.9 (0.1) 7.5 4.3 3.2
TOTAL MID CAP ACTIVE 7.0 9.4 2.4 2.9 7.5 (4.6)
TOTAL SMALL CAP PASSIVE 2.6 3.1 0.5 4.5 4.3 0.2
TOTAL RUSSELL 1000 PASSIVE 68.0 59.5 (8.5) 8.6 8.5 0.0
TOTAL RUSSELL TOP 200 PASSIVE 18.0 23.6 5.6 8.9 8.9 (0.0)
TOTAL EMERGING MANAGERS 0.5 0.6 0.1 4.5 4.3 0.2
Total Domestic Equity Asset Allocations: June 30, 2021
New York City Board of Education Retirement System 22Performance Overview as of June 30, 2021 Totals may not add due to rounding
Asset WeightQuarterly Returns
Fund Benchmark Excess
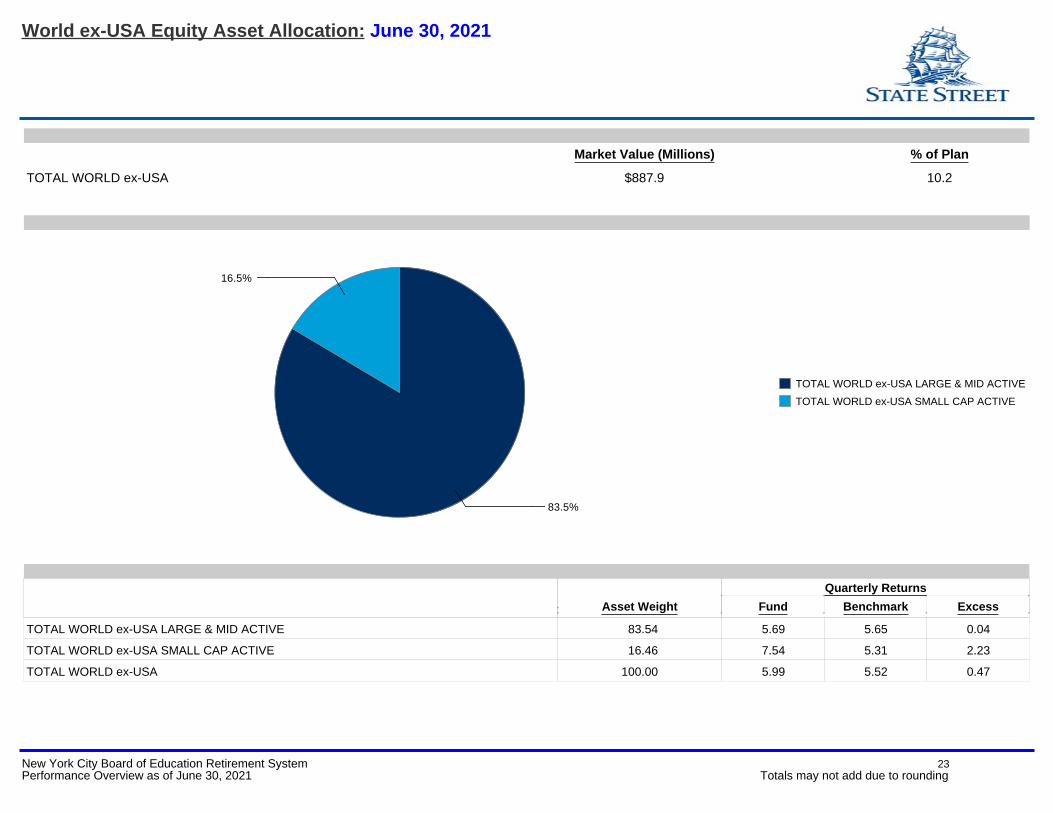
TOTAL WORLD ex-USA LARGE & MID ACTIVE 83.54 5.69 5.65 0.04
TOTAL WORLD ex-USA SMALL CAP ACTIVE 16.46 7.54 5.31 2.23
TOTAL WORLD ex-USA 100.00 5.99 5.52 0.47
Market Value (Millions) % of Plan
TOTAL WORLD ex-USA $887.9 10.2
TOTAL WORLD ex-USA LARGE & MID ACTIVE
TOTAL WORLD ex-USA SMALL CAP ACTIVE
16.5%
83.5%
TOTAL WORLD ex-USA LARGE & MID ACTIVE
TOTAL WORLD ex-USA SMALL CAP ACTIVE
16.5%
83.5%
World ex-USA Equity Asset Allocation: June 30, 2021
New York City Board of Education Retirement System 23Performance Overview as of June 30, 2021 Totals may not add due to rounding
Market Value (Millions) % of Plan
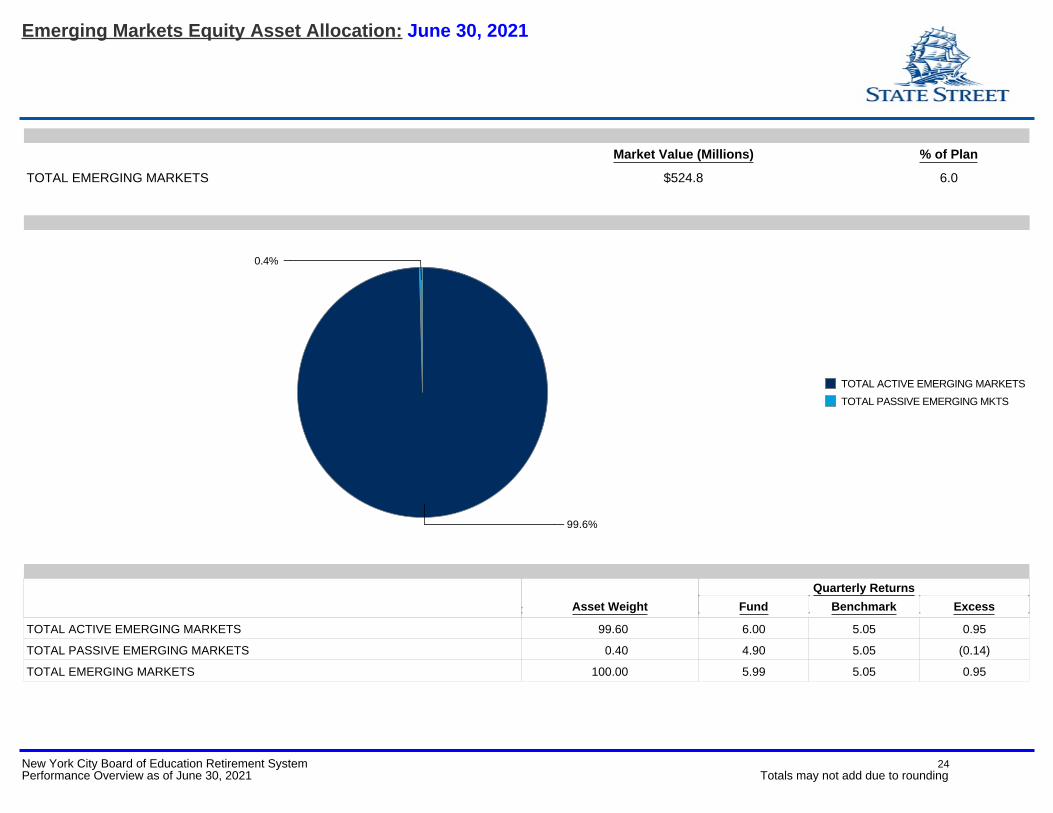
TOTAL EMERGING MARKETS $524.8 6.0
TOTAL ACTIVE EMERGING MARKETS
TOTAL PASSIVE EMERGING MKTS
0.4%
99.6%
TOTAL ACTIVE EMERGING MARKETS
TOTAL PASSIVE EMERGING MKTS
0.4%
99.6%
Asset WeightQuarterly Returns
Fund Benchmark Excess
TOTAL ACTIVE EMERGING MARKETS 99.60 6.00 5.05 0.95
TOTAL PASSIVE EMERGING MARKETS 0.40 4.90 5.05 (0.14)
TOTAL EMERGING MARKETS 100.00 5.99 5.05 0.95
Emerging Markets Equity Asset Allocation: June 30, 2021
New York City Board of Education Retirement System 24Performance Overview as of June 30, 2021 Totals may not add due to rounding
TOTAL TREASURY/AGENCY
TOTAL MORTGAGE
TOTAL INVESTMENT GRADE CORPORATE
30.7%
29.1%
40.1%
TOTAL TREASURY/AGENCY
TOTAL MORTGAGE
TOTAL INVESTMENT GRADE CORPORATE
30.7%
29.1%
40.1%
Policy Weight Asset Weight Under/Over WeightQuarterly Returns
Fund Benchmark Excess
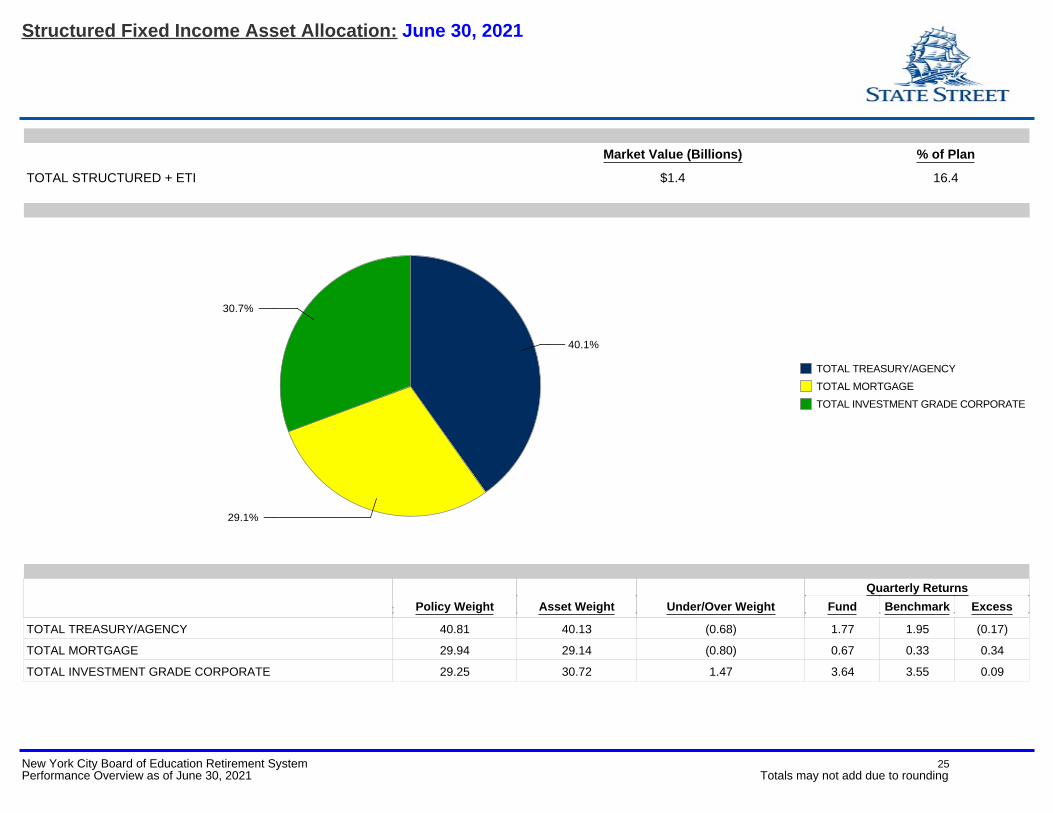
TOTAL TREASURY/AGENCY 40.81 40.13 (0.68) 1.77 1.95 (0.17)
TOTAL MORTGAGE 29.94 29.14 (0.80) 0.67 0.33 0.34
TOTAL INVESTMENT GRADE CORPORATE 29.25 30.72 1.47 3.64 3.55 0.09
Market Value (Billions) % of Plan
TOTAL STRUCTURED + ETI $1.4 16.4
Structured Fixed Income Asset Allocation: June 30, 2021
New York City Board of Education Retirement System 25Performance Overview as of June 30, 2021 Totals may not add due to rounding
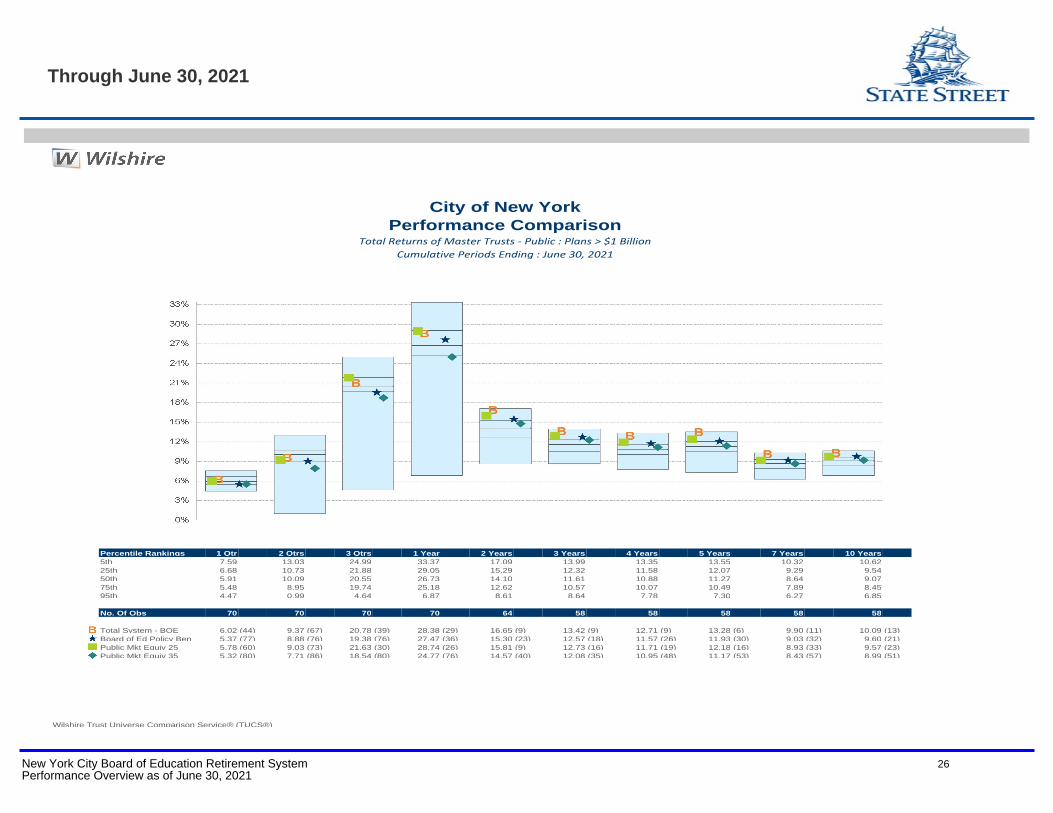
City of New YorkPerformance Comparison
Total Returns of Master Trusts - Public : Plans > $1 Billion
Cumulative Periods Ending : June 30, 2021
Percentile Rankings 1 Qtr 2 Qtrs 3 Qtrs 1 Year 2 Years 3 Years 4 Years 5 Years 7 Years 10 Years5th 7.59 13.03 24.99 33.37 17.09 13.99 13.35 13.55 10.32 10.6225th 6.68 10.73 21.88 29.05 15.29 12.32 11.58 12.07 9.29 9.5450th 5.91 10.09 20.55 26.73 14.10 11.61 10.88 11.27 8.64 9.0775th 5.48 8.95 19.74 25.18 12.62 10.57 10.07 10.49 7.89 8.4595th 4.47 0.99 4.64 6.87 8.61 8.64 7.78 7.30 6.27 6.85
No. Of Obs 70 70 70 70 64 58 58 58 58 58
Total System - BOE 6.02 (44) 9.37 (67) 20.78 (39) 28.38 (29) 16.65 (9) 13.42 (9) 12.71 (9) 13.28 (6) 9.90 (11) 10.09 (13)Board of Ed Policy Ben 5.37 (77) 8.88 (76) 19.38 (76) 27.47 (36) 15.30 (23) 12.57 (18) 11.57 (26) 11.93 (30) 9.03 (32) 9.60 (21)Public Mkt Equiv 25 5.78 (60) 9.03 (73) 21.63 (30) 28.74 (26) 15.81 (9) 12.73 (16) 11.71 (19) 12.18 (16) 8.93 (33) 9.57 (23)Public Mkt Equiv 35 5.32 (80) 7.71 (86) 18.54 (80) 24.77 (76) 14.57 (40) 12.08 (35) 10.95 (48) 11.17 (53) 8.43 (57) 8.99 (51)
Wilshire Trust Universe Comparison Service® (TUCS®)
Through June 30, 2021
New York City Board of Education Retirement System 26Performance Overview as of June 30, 2021
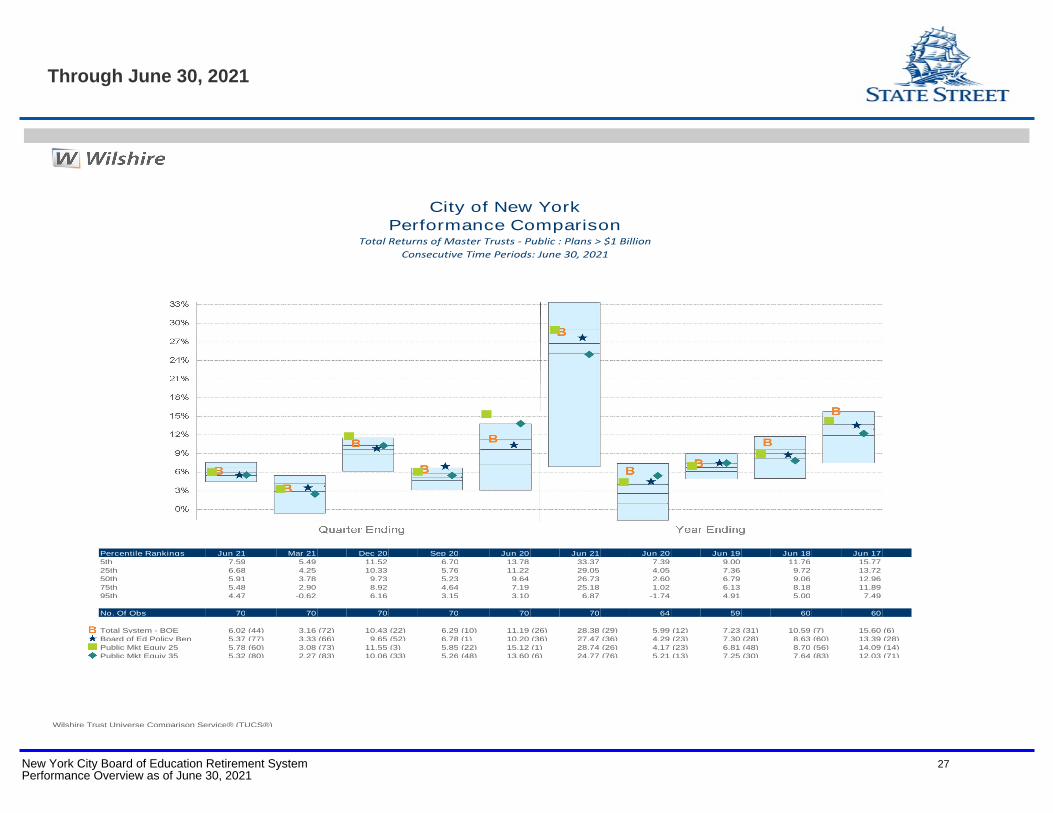
City of New YorkPerformance Comparison
Total Returns of Master Trusts - Public : Plans > $1 Billion
Consecutive Time Periods: June 30, 2021
Percentile Rankings Jun 21 Mar 21 Dec 20 Sep 20 Jun 20 Jun 21 Jun 20 Jun 19 Jun 18 Jun 175th 7.59 5.49 11.52 6.70 13.78 33.37 7.39 9.00 11.76 15.7725th 6.68 4.25 10.33 5.76 11.22 29.05 4.05 7.36 9.72 13.7250th 5.91 3.78 9.73 5.23 9.64 26.73 2.60 6.79 9.06 12.9675th 5.48 2.90 8.92 4.64 7.19 25.18 1.02 6.13 8.18 11.8995th 4.47 -0.62 6.16 3.15 3.10 6.87 -1.74 4.91 5.00 7.49
No. Of Obs 70 70 70 70 70 70 64 59 60 60
Total System - BOE 6.02 (44) 3.16 (72) 10.43 (22) 6.29 (10) 11.19 (26) 28.38 (29) 5.99 (12) 7.23 (31) 10.59 (7) 15.60 (6)Board of Ed Policy Ben 5.37 (77) 3.33 (66) 9.65 (52) 6.78 (1) 10.20 (36) 27.47 (36) 4.29 (23) 7.30 (28) 8.63 (60) 13.39 (28)Public Mkt Equiv 25 5.78 (60) 3.08 (73) 11.55 (3) 5.85 (22) 15.12 (1) 28.74 (26) 4.17 (23) 6.81 (48) 8.70 (56) 14.09 (14)Public Mkt Equiv 35 5.32 (80) 2.27 (83) 10.06 (33) 5.26 (48) 13.60 (6) 24.77 (76) 5.21 (13) 7.25 (30) 7.64 (83) 12.03 (71)
Wilshire Trust Universe Comparison Service® (TUCS®)
Through June 30, 2021
New York City Board of Education Retirement System 27Performance Overview as of June 30, 2021
Avg. Net Asset
Value FY 2020
($MM)
Base Mgmt.
Fees ($M)
Partnership
Fees ($M)
Base Mgmt. Fees &
Partnership Fees in BPS
Performance /
Carry Fees in ($M)
Performance / Carry
Fees in BPS
Total Investment Mgmt.
Fees in ($M)
Total Investment
Mgmt. Fees in BPS
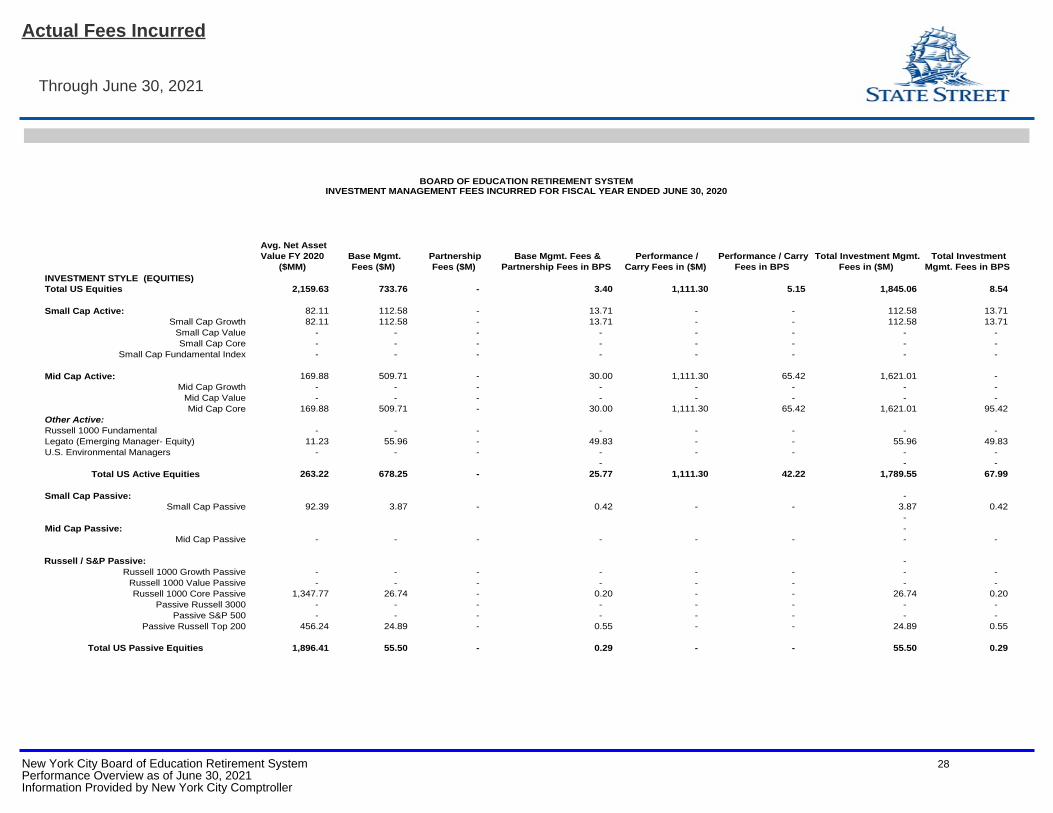
INVESTMENT STYLE (EQUITIES)
Total US Equities 2,159.63 733.76 - 3.40 1,111.30 5.15 1,845.06 8.54
Small Cap Active: 82.11 112.58 - 13.71 - - 112.58 13.71
Small Cap Growth 82.11 112.58 - 13.71 - - 112.58 13.71
Small Cap Value - - - - - - - -
Small Cap Core - - - - - - - -
Small Cap Fundamental Index - - - - - - - -
Mid Cap Active: 169.88 509.71 - 30.00 1,111.30 65.42 1,621.01 -
Mid Cap Growth - - - - - - - -
Mid Cap Value - - - - - - - -
Mid Cap Core 169.88 509.71 - 30.00 1,111.30 65.42 1,621.01 95.42
Other Active:
Russell 1000 Fundamental - - - - - - - -
Legato (Emerging Manager- Equity) 11.23 55.96 - 49.83 - - 55.96 49.83
U.S. Environmental Managers - - - - - - - -
- - -
Total US Active Equities 263.22 678.25 - 25.77 1,111.30 42.22 1,789.55 67.99
Small Cap Passive: -
Small Cap Passive 92.39 3.87 - 0.42 - - 3.87 0.42
-
Mid Cap Passive: -
Mid Cap Passive - - - - - - - -
Russell / S&P Passive: -
Russell 1000 Growth Passive - - - - - - - -
Russell 1000 Value Passive - - - - - - - -
Russell 1000 Core Passive 1,347.77 26.74 - 0.20 - - 26.74 0.20
Passive Russell 3000 - - - - - - - -
Passive S&P 500 - - - - - - - -
Passive Russell Top 200 456.24 24.89 - 0.55 - - 24.89 0.55
Total US Passive Equities 1,896.41 55.50 - 0.29 - - 55.50 0.29
BOARD OF EDUCATION RETIREMENT SYSTEMINVESTMENT MANAGEMENT FEES INCURRED FOR FISCAL YEAR ENDED JUNE 30, 2020
Actual Fees Incurred
Through June 30, 2021
New York City Board of Education Retirement System 28Performance Overview as of June 30, 2021Information Provided by New York City Comptroller
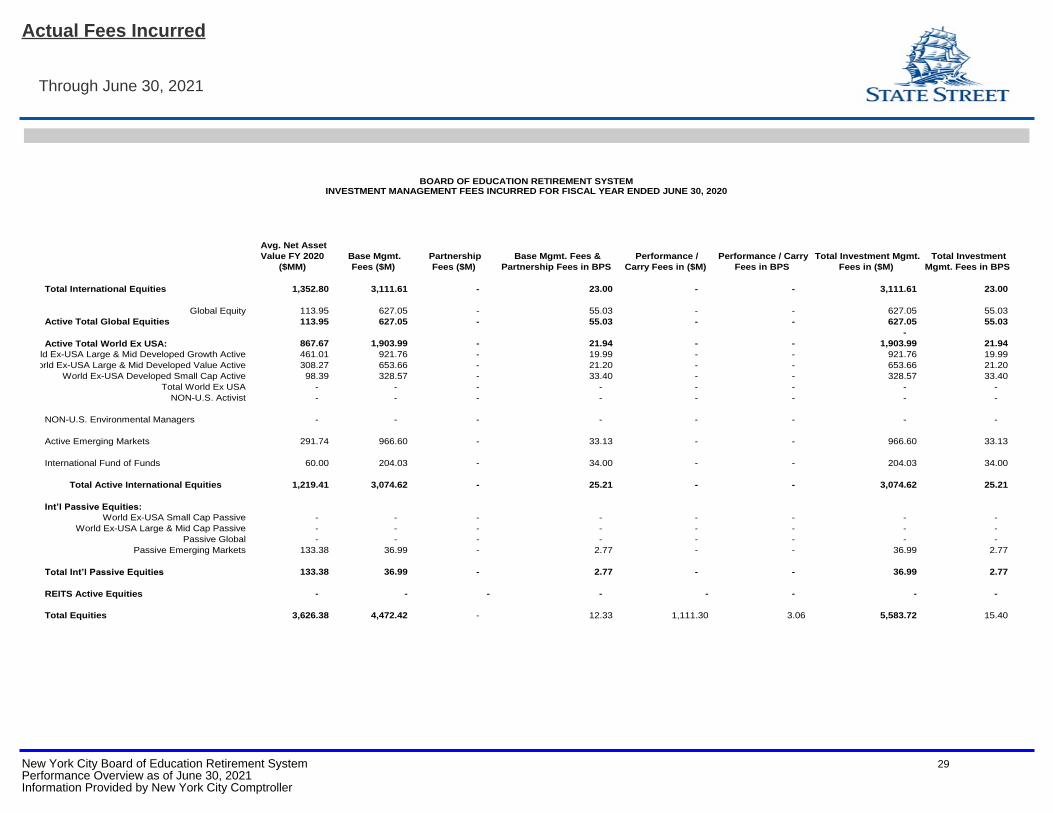
BOARD OF EDUCATION RETIREMENT SYSTEMINVESTMENT MANAGEMENT FEES INCURRED FOR FISCAL YEAR ENDED JUNE 30, 2020
Avg. Net Asset
Value FY 2020
($MM)
Base Mgmt.
Fees ($M)
Partnership
Fees ($M)
Base Mgmt. Fees &
Partnership Fees in BPS
Performance /
Carry Fees in ($M)
Performance / Carry
Fees in BPS
Total Investment Mgmt.
Fees in ($M)
Total Investment
Mgmt. Fees in BPS
Total International Equities 1,352.80 3,111.61 - 23.00 - - 3,111.61 23.00
Global Equity 113.95 627.05 - 55.03 - - 627.05 55.03
Active Total Global Equities 113.95 627.05 - 55.03 - - 627.05 55.03
-
Active Total World Ex USA: 867.67 1,903.99 - 21.94 - - 1,903.99 21.94
World Ex-USA Large & Mid Developed Growth Active 461.01 921.76 - 19.99 - - 921.76 19.99
World Ex-USA Large & Mid Developed Value Active 308.27 653.66 - 21.20 - - 653.66 21.20
World Ex-USA Developed Small Cap Active 98.39 328.57 - 33.40 - - 328.57 33.40
Total World Ex USA - - - - - - - -
NON-U.S. Activist - - - - - - - -
NON-U.S. Environmental Managers - - - - - - - -
Active Emerging Markets 291.74 966.60 - 33.13 - - 966.60 33.13
International Fund of Funds 60.00 204.03 - 34.00 - - 204.03 34.00
Total Active International Equities 1,219.41 3,074.62 - 25.21 - - 3,074.62 25.21
Int’l Passive Equities:
World Ex-USA Small Cap Passive - - - - - - - -
World Ex-USA Large & Mid Cap Passive - - - - - - - -
Passive Global - - - - - - - -
Passive Emerging Markets 133.38 36.99 - 2.77 - - 36.99 2.77
Total Int’l Passive Equities 133.38 36.99 - 2.77 - - 36.99 2.77
REITS Active Equities - - - - - - - -
Total Equities 3,626.38 4,472.42 - 12.33 1,111.30 3.06 5,583.72 15.40
Actual Fees Incurred
Through June 30, 2021
New York City Board of Education Retirement System 29Performance Overview as of June 30, 2021Information Provided by New York City Comptroller
BOARD OF EDUCATION RETIREMENT SYSTEMINVESTMENT MANAGEMENT FEES INCURRED FOR FISCAL YEAR ENDED JUNE 30, 2020
Avg. Net Asset
Value FY 2020
($MM)
Base Mgmt.
Fees ($M)
Partnership
Fees ($M)
Base Mgmt. Fees &
Partnership Fees in BPS
Performance /
Carry Fees in ($M)
Performance / Carry
Fees in BPS
Total Investment Mgmt.
Fees in ($M)
Total Investment
Mgmt. Fees in BPS
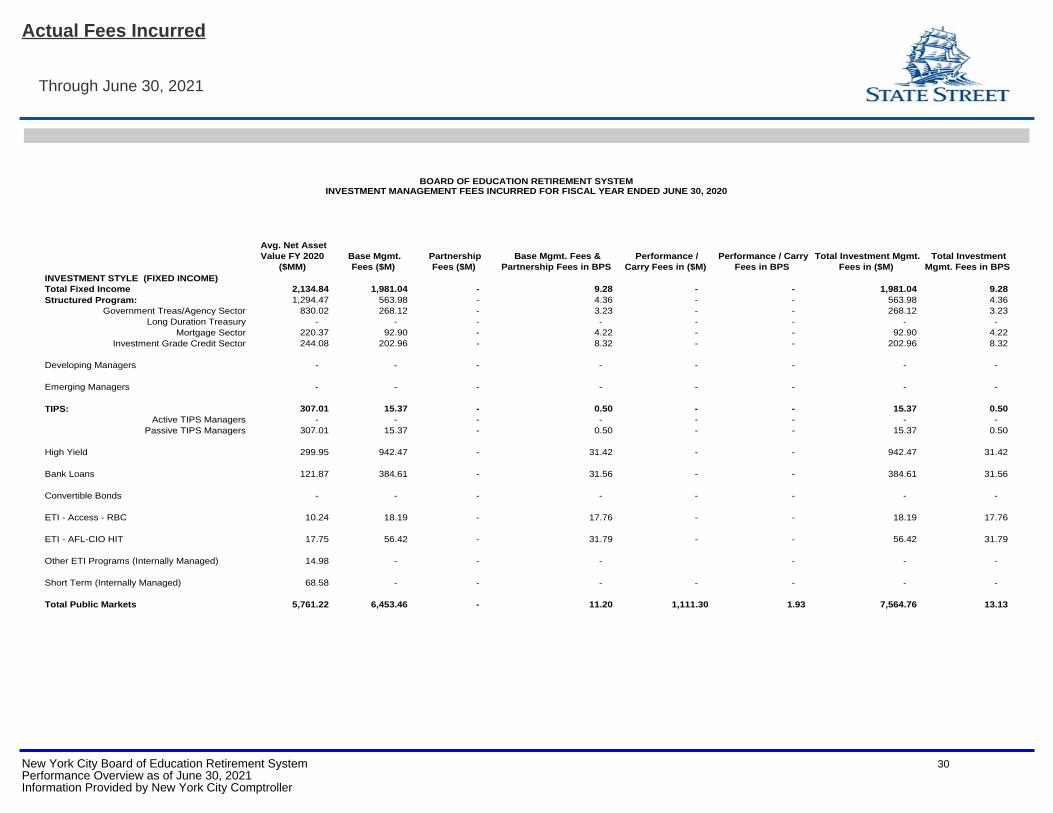
INVESTMENT STYLE (FIXED INCOME)
Total Fixed Income 2,134.84 1,981.04 - 9.28 - - 1,981.04 9.28
Structured Program: 1,294.47 563.98 - 4.36 - - 563.98 4.36
Government Treas/Agency Sector 830.02 268.12 - 3.23 - - 268.12 3.23
Long Duration Treasury - - - - - - - -
Mortgage Sector 220.37 92.90 - 4.22 - - 92.90 4.22
Investment Grade Credit Sector 244.08 202.96 - 8.32 - - 202.96 8.32
Developing Managers - - - - - - - -
Emerging Managers - - - - - - - -
TIPS: 307.01 15.37 - 0.50 - - 15.37 0.50
Active TIPS Managers - - - - - - - -
Passive TIPS Managers 307.01 15.37 - 0.50 - - 15.37 0.50
High Yield 299.95 942.47 - 31.42 - - 942.47 31.42
Bank Loans 121.87 384.61 - 31.56 - - 384.61 31.56
Convertible Bonds - - - - - - - -
ETI - Access - RBC 10.24 18.19 - 17.76 - - 18.19 17.76
ETI - AFL-CIO HIT 17.75 56.42 - 31.79 - - 56.42 31.79
Other ETI Programs (Internally Managed) 14.98 - - - - - -
Short Term (Internally Managed) 68.58 - - - - - - -
Total Public Markets 5,761.22 6,453.46 - 11.20 1,111.30 1.93 7,564.76 13.13
Actual Fees Incurred
Through June 30, 2021
New York City Board of Education Retirement System 30Performance Overview as of June 30, 2021Information Provided by New York City Comptroller
BOARD OF EDUCATION RETIREMENT SYSTEMINVESTMENT MANAGEMENT FEES INCURRED FOR FISCAL YEAR ENDED JUNE 30, 2020
Avg. Net Asset
Value FY 2020
($MM)
Base Mgmt.
Fees ($M)
Partnership
Fees ($M)
Base Mgmt. Fees &
Partnership Fees in BPS
Performance /
Carry Fees in ($M)
Performance / Carry
Fees in BPS
Total Investment Mgmt.
Fees in ($M)
Total Investment
Mgmt. Fees in BPS
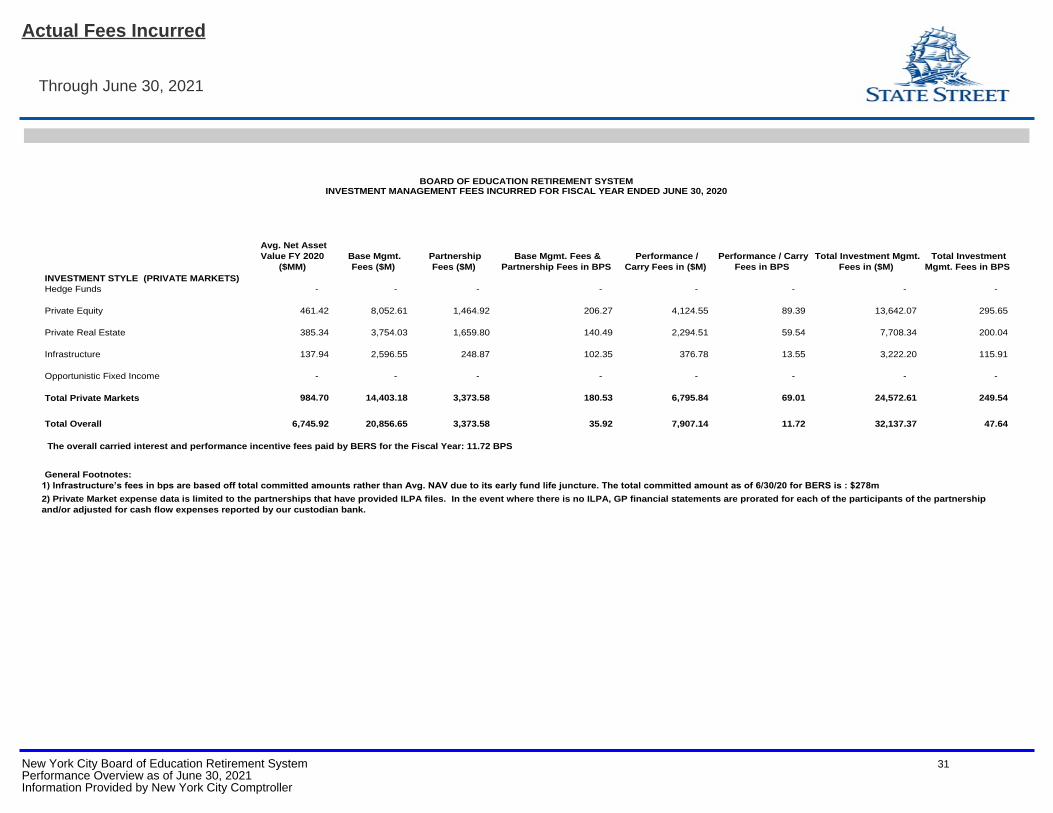
INVESTMENT STYLE (PRIVATE MARKETS)
Hedge Funds - - - - - - - -
Private Equity 461.42 8,052.61 1,464.92 206.27 4,124.55 89.39 13,642.07 295.65
Private Real Estate 385.34 3,754.03 1,659.80 140.49 2,294.51 59.54 7,708.34 200.04
Infrastructure 137.94 2,596.55 248.87 102.35 376.78 13.55 3,222.20 115.91
Opportunistic Fixed Income - - - - - - - -
Total Private Markets 984.70 14,403.18 3,373.58 180.53 6,795.84 69.01 24,572.61 249.54
Total Overall 6,745.92 20,856.65 3,373.58 35.92 7,907.14 11.72 32,137.37 47.64
The overall carried interest and performance incentive fees paid by BERS for the Fiscal Year: 11.72 BPS
General Footnotes:
1) Infrastructure’s fees in bps are based off total committed amounts rather than Avg. NAV due to its early fund life juncture. The total committed amount as of 6/30/20 for BERS is : $278m
2) Private Market expense data is limited to the partnerships that have provided ILPA files. In the event where there is no ILPA, GP financial statements are prorated for each of the participants of the partnership
and/or adjusted for cash flow expenses reported by our custodian bank.
Actual Fees Incurred
Through June 30, 2021
New York City Board of Education Retirement System 31Performance Overview as of June 30, 2021Information Provided by New York City Comptroller
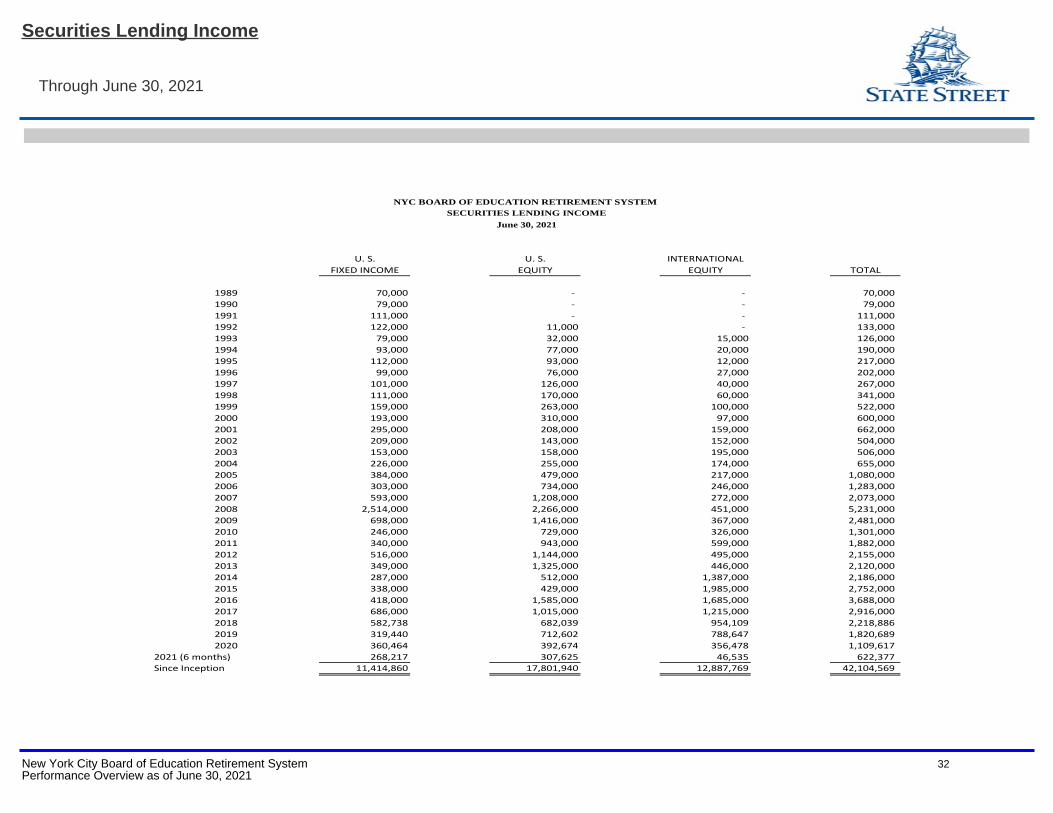
U. S. U. S. INTERNATIONALFIXED INCOME EQUITY EQUITY TOTAL
1989 70,000 - - 70,000 1990 79,000 - - 79,000 1991 111,000 - - 111,000 1992 122,000 11,000 - 133,000 1993 79,000 32,000 15,000 126,000 1994 93,000 77,000 20,000 190,000 1995 112,000 93,000 12,000 217,000 1996 99,000 76,000 27,000 202,000 1997 101,000 126,000 40,000 267,000 1998 111,000 170,000 60,000 341,000 1999 159,000 263,000 100,000 522,000 2000 193,000 310,000 97,000 600,000 2001 295,000 208,000 159,000 662,000 2002 209,000 143,000 152,000 504,000 2003 153,000 158,000 195,000 506,000 2004 226,000 255,000 174,000 655,000 2005 384,000 479,000 217,000 1,080,000 2006 303,000 734,000 246,000 1,283,000 2007 593,000 1,208,000 272,000 2,073,000 2008 2,514,000 2,266,000 451,000 5,231,000 2009 698,000 1,416,000 367,000 2,481,000 2010 246,000 729,000 326,000 1,301,000 2011 340,000 943,000 599,000 1,882,000 2012 516,000 1,144,000 495,000 2,155,000 2013 349,000 1,325,000 446,000 2,120,000 2014 287,000 512,000 1,387,000 2,186,000 2015 338,000 429,000 1,985,000 2,752,000 2016 418,000 1,585,000 1,685,000 3,688,000 2017 686,000 1,015,000 1,215,000 2,916,000 2018 582,738 682,039 954,109 2,218,886 2019 319,440 712,602 788,647 1,820,689 2020 360,464 392,674 356,478 1,109,617
2021 (6 months) 268,217 307,625 46,535 622,377 Since Inception 11,414,860 17,801,940 12,887,769 42,104,569
NYC BOARD OF EDUCATION RETIREMENT SYSTEM SECURITIES LENDING INCOME
June 30, 2021
Securities Lending Income
Through June 30, 2021
New York City Board of Education Retirement System 32Performance Overview as of June 30, 2021
New York CityBoard of Education Retirement System
Appendix A
Consolidated Performance Report
New York City Board of Education Retirement System 33Performance Overview as of June 30, 2021
Market Value ($MM) % of Total 3 Month FYTD CYTD
FYE 2020
CYE 2020
CYE 2019
CYE 2018 1 Year 3 Year 5 Year 10 Year ITD Inception Date
SYSTEM RETURN SUMMARY
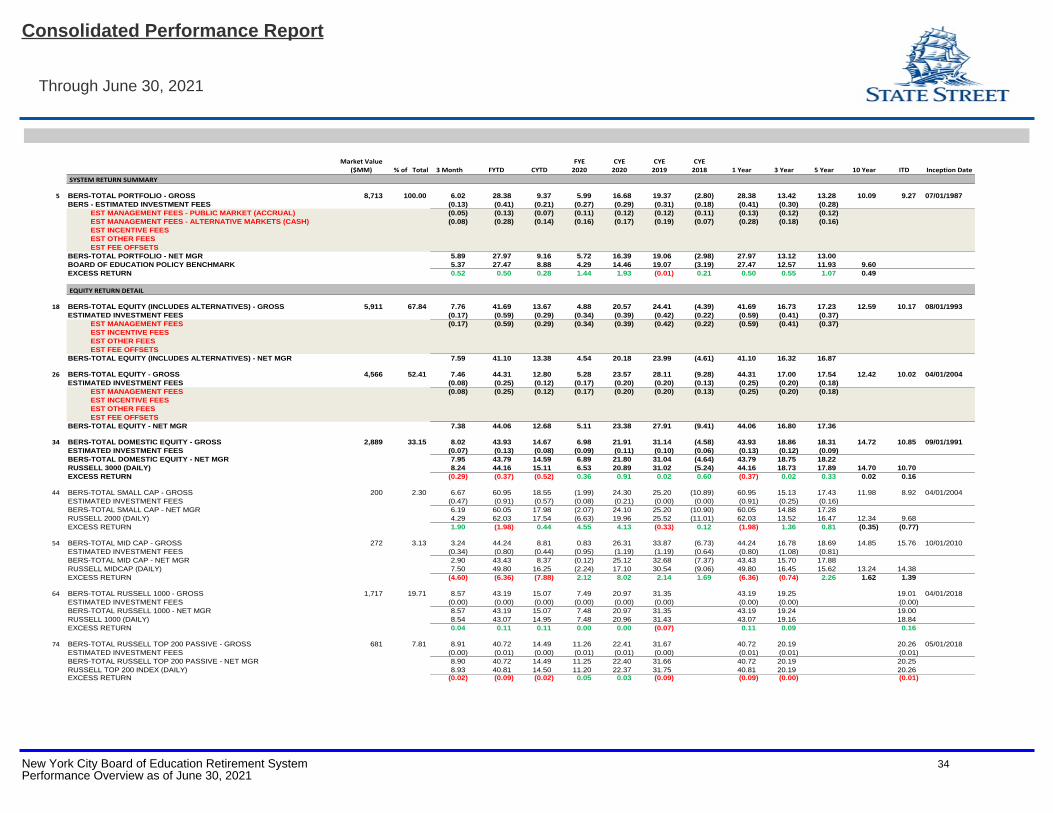
5 BERS-TOTAL PORTFOLIO - GROSS 8,713 100.00 6.02 28.38 9.37 5.99 16.68 19.37 (2.80) 28.38 13.42 13.28 10.09 9.27 07/01/1987
BERS - ESTIMATED INVESTMENT FEES (0.13) (0.41) (0.21) (0.27) (0.29) (0.31) (0.18) (0.41) (0.30) (0.28)
EST MANAGEMENT FEES - PUBLIC MARKET (ACCRUAL) (0.05) (0.13) (0.07) (0.11) (0.12) (0.12) (0.11) (0.13) (0.12) (0.12)
EST MANAGEMENT FEES - ALTERNATIVE MARKETS (CASH) (0.08) (0.28) (0.14) (0.16) (0.17) (0.19) (0.07) (0.28) (0.18) (0.16)
EST INCENTIVE FEES
EST OTHER FEES
EST FEE OFFSETS
BERS-TOTAL PORTFOLIO - NET MGR 5.89 27.97 9.16 5.72 16.39 19.06 (2.98) 27.97 13.12 13.00
BOARD OF EDUCATION POLICY BENCHMARK 5.37 27.47 8.88 4.29 14.46 19.07 (3.19) 27.47 12.57 11.93 9.60
EXCESS RETURN 0.52 0.50 0.28 1.44 1.93 (0.01) 0.21 0.50 0.55 1.07 0.49
EQUITY RETURN DETAIL
18 BERS-TOTAL EQUITY (INCLUDES ALTERNATIVES) - GROSS 5,911 67.84 7.76 41.69 13.67 4.88 20.57 24.41 (4.39) 41.69 16.73 17.23 12.59 10.17 08/01/1993
ESTIMATED INVESTMENT FEES (0.17) (0.59) (0.29) (0.34) (0.39) (0.42) (0.22) (0.59) (0.41) (0.37)
EST MANAGEMENT FEES (0.17) (0.59) (0.29) (0.34) (0.39) (0.42) (0.22) (0.59) (0.41) (0.37)
EST INCENTIVE FEES
EST OTHER FEES
EST FEE OFFSETS
BERS-TOTAL EQUITY (INCLUDES ALTERNATIVES) - NET MGR 7.59 41.10 13.38 4.54 20.18 23.99 (4.61) 41.10 16.32 16.87
26 BERS-TOTAL EQUITY - GROSS 4,566 52.41 7.46 44.31 12.80 5.28 23.57 28.11 (9.28) 44.31 17.00 17.54 12.42 10.02 04/01/2004
ESTIMATED INVESTMENT FEES (0.08) (0.25) (0.12) (0.17) (0.20) (0.20) (0.13) (0.25) (0.20) (0.18)
EST MANAGEMENT FEES (0.08) (0.25) (0.12) (0.17) (0.20) (0.20) (0.13) (0.25) (0.20) (0.18)
EST INCENTIVE FEES
EST OTHER FEES
EST FEE OFFSETS
BERS-TOTAL EQUITY - NET MGR 7.38 44.06 12.68 5.11 23.38 27.91 (9.41) 44.06 16.80 17.36
34 BERS-TOTAL DOMESTIC EQUITY - GROSS 2,889 33.15 8.02 43.93 14.67 6.98 21.91 31.14 (4.58) 43.93 18.86 18.31 14.72 10.85 09/01/1991
ESTIMATED INVESTMENT FEES (0.07) (0.13) (0.08) (0.09) (0.11) (0.10) (0.06) (0.13) (0.12) (0.09)
BERS-TOTAL DOMESTIC EQUITY - NET MGR 7.95 43.79 14.59 6.89 21.80 31.04 (4.64) 43.79 18.75 18.22
RUSSELL 3000 (DAILY) 8.24 44.16 15.11 6.53 20.89 31.02 (5.24) 44.16 18.73 17.89 14.70 10.70
EXCESS RETURN (0.29) (0.37) (0.52) 0.36 0.91 0.02 0.60 (0.37) 0.02 0.33 0.02 0.16
44 BERS-TOTAL SMALL CAP - GROSS 200 2.30 6.67 60.95 18.55 (1.99) 24.30 25.20 (10.89) 60.95 15.13 17.43 11.98 8.92 04/01/2004
ESTIMATED INVESTMENT FEES (0.47) (0.91) (0.57) (0.08) (0.21) (0.00) (0.00) (0.91) (0.25) (0.16)
BERS-TOTAL SMALL CAP - NET MGR 6.19 60.05 17.98 (2.07) 24.10 25.20 (10.90) 60.05 14.88 17.28
RUSSELL 2000 (DAILY) 4.29 62.03 17.54 (6.63) 19.96 25.52 (11.01) 62.03 13.52 16.47 12.34 9.68
EXCESS RETURN 1.90 (1.98) 0.44 4.55 4.13 (0.33) 0.12 (1.98) 1.36 0.81 (0.35) (0.77)
54 BERS-TOTAL MID CAP - GROSS 272 3.13 3.24 44.24 8.81 0.83 26.31 33.87 (6.73) 44.24 16.78 18.69 14.85 15.76 10/01/2010
ESTIMATED INVESTMENT FEES (0.34) (0.80) (0.44) (0.95) (1.19) (1.19) (0.64) (0.80) (1.08) (0.81)
BERS-TOTAL MID CAP - NET MGR 2.90 43.43 8.37 (0.12) 25.12 32.68 (7.37) 43.43 15.70 17.88
RUSSELL MIDCAP (DAILY) 7.50 49.80 16.25 (2.24) 17.10 30.54 (9.06) 49.80 16.45 15.62 13.24 14.38
EXCESS RETURN (4.60) (6.36) (7.88) 2.12 8.02 2.14 1.69 (6.36) (0.74) 2.26 1.62 1.39
64 BERS-TOTAL RUSSELL 1000 - GROSS 1,717 19.71 8.57 43.19 15.07 7.49 20.97 31.35 43.19 19.25 19.01 04/01/2018
ESTIMATED INVESTMENT FEES (0.00) (0.00) (0.00) (0.00) (0.00) (0.00) (0.00) (0.00) (0.00)
BERS-TOTAL RUSSELL 1000 - NET MGR 8.57 43.19 15.07 7.48 20.97 31.35 43.19 19.24 19.00
RUSSELL 1000 (DAILY) 8.54 43.07 14.95 7.48 20.96 31.43 43.07 19.16 18.84
EXCESS RETURN 0.04 0.11 0.11 0.00 0.00 (0.07) 0.11 0.09 0.16
74 BERS-TOTAL RUSSELL TOP 200 PASSIVE - GROSS 681 7.81 8.91 40.72 14.49 11.26 22.41 31.67 40.72 20.19 20.26 05/01/2018
ESTIMATED INVESTMENT FEES (0.00) (0.01) (0.00) (0.01) (0.01) (0.00) (0.01) (0.01) (0.01)
BERS-TOTAL RUSSELL TOP 200 PASSIVE - NET MGR 8.90 40.72 14.49 11.25 22.40 31.66 40.72 20.19 20.25
RUSSELL TOP 200 INDEX (DAILY) 8.93 40.81 14.50 11.20 22.37 31.75 40.81 20.19 20.26EXCESS RETURN (0.02) (0.09) (0.02) 0.05 0.03 (0.09) (0.09) (0.00) (0.01)
Consolidated Performance Report
Through June 30, 2021
New York City Board of Education Retirement System 34Performance Overview as of June 30, 2021
Market Value ($MM) % of Total 3 Month FYTD CYTD
FYE 2020
CYE 2020
CYE 2019
CYE 2018 1 Year 3 Year 5 Year 10 Year ITD Inception Date
EQUITY RETURN DETAIL
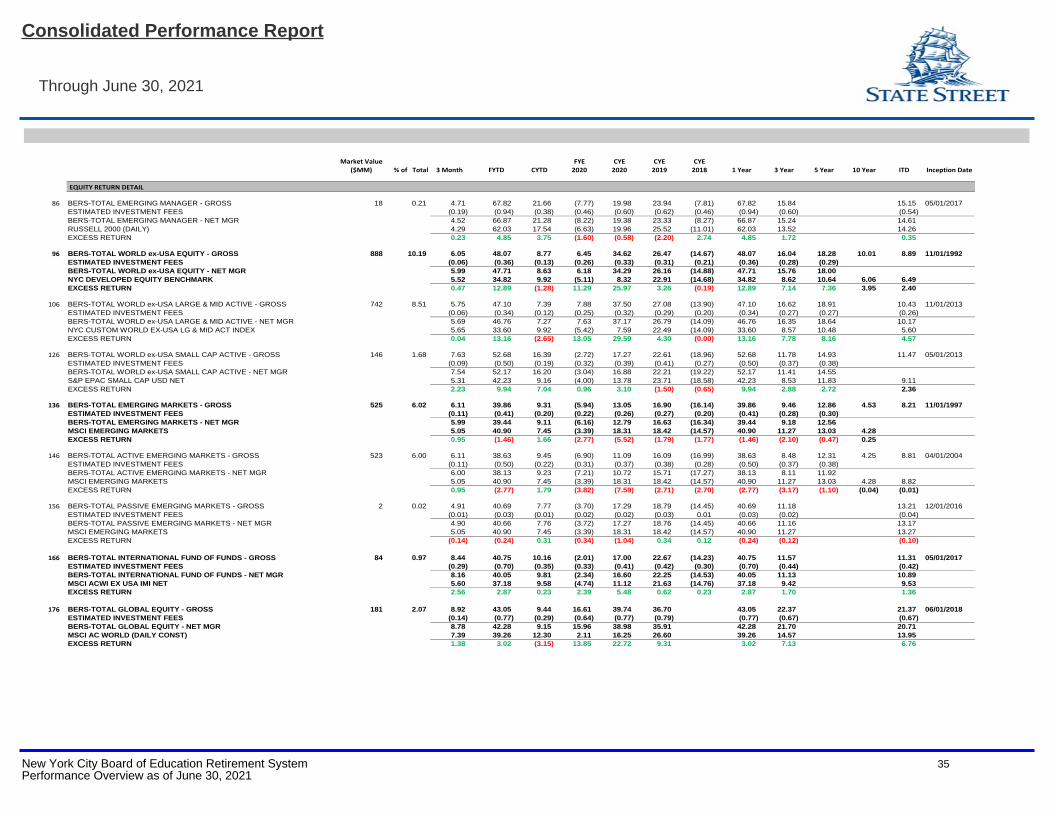
86 BERS-TOTAL EMERGING MANAGER - GROSS 18 0.21 4.71 67.82 21.66 (7.77) 19.98 23.94 (7.81) 67.82 15.84 15.15 05/01/2017
ESTIMATED INVESTMENT FEES (0.19) (0.94) (0.38) (0.46) (0.60) (0.62) (0.46) (0.94) (0.60) (0.54)
BERS-TOTAL EMERGING MANAGER - NET MGR 4.52 66.87 21.28 (8.22) 19.38 23.33 (8.27) 66.87 15.24 14.61
RUSSELL 2000 (DAILY) 4.29 62.03 17.54 (6.63) 19.96 25.52 (11.01) 62.03 13.52 14.26
EXCESS RETURN 0.23 4.85 3.75 (1.60) (0.58) (2.20) 2.74 4.85 1.72 0.35
96 BERS-TOTAL WORLD ex-USA EQUITY - GROSS 888 10.19 6.05 48.07 8.77 6.45 34.62 26.47 (14.67) 48.07 16.04 18.28 10.01 8.89 11/01/1992
ESTIMATED INVESTMENT FEES (0.06) (0.36) (0.13) (0.26) (0.33) (0.31) (0.21) (0.36) (0.28) (0.29)
BERS-TOTAL WORLD ex-USA EQUITY - NET MGR 5.99 47.71 8.63 6.18 34.29 26.16 (14.88) 47.71 15.76 18.00
NYC DEVELOPED EQUITY BENCHMARK 5.52 34.82 9.92 (5.11) 8.32 22.91 (14.68) 34.82 8.62 10.64 6.06 6.49
EXCESS RETURN 0.47 12.89 (1.28) 11.29 25.97 3.26 (0.19) 12.89 7.14 7.36 3.95 2.40
106 BERS-TOTAL WORLD ex-USA LARGE & MID ACTIVE - GROSS 742 8.51 5.75 47.10 7.39 7.88 37.50 27.08 (13.90) 47.10 16.62 18.91 10.43 11/01/2013
ESTIMATED INVESTMENT FEES (0.06) (0.34) (0.12) (0.25) (0.32) (0.29) (0.20) (0.34) (0.27) (0.27) (0.26)
BERS-TOTAL WORLD ex-USA LARGE & MID ACTIVE - NET MGR 5.69 46.76 7.27 7.63 37.17 26.79 (14.09) 46.76 16.35 18.64 10.17
NYC CUSTOM WORLD EX-USA LG & MID ACT INDEX 5.65 33.60 9.92 (5.42) 7.59 22.49 (14.09) 33.60 8.57 10.48 5.60
EXCESS RETURN 0.04 13.16 (2.65) 13.05 29.59 4.30 (0.00) 13.16 7.78 8.16 4.57
126 BERS-TOTAL WORLD ex-USA SMALL CAP ACTIVE - GROSS 146 1.68 7.63 52.68 16.39 (2.72) 17.27 22.61 (18.96) 52.68 11.78 14.93 11.47 05/01/2013
ESTIMATED INVESTMENT FEES (0.09) (0.50) (0.19) (0.32) (0.39) (0.41) (0.27) (0.50) (0.37) (0.38)
BERS-TOTAL WORLD ex-USA SMALL CAP ACTIVE - NET MGR 7.54 52.17 16.20 (3.04) 16.88 22.21 (19.22) 52.17 11.41 14.55
S&P EPAC SMALL CAP USD NET 5.31 42.23 9.16 (4.00) 13.78 23.71 (18.58) 42.23 8.53 11.83 9.11
EXCESS RETURN 2.23 9.94 7.04 0.96 3.10 (1.50) (0.65) 9.94 2.88 2.72 2.36
136 BERS-TOTAL EMERGING MARKETS - GROSS 525 6.02 6.11 39.86 9.31 (5.94) 13.05 16.90 (16.14) 39.86 9.46 12.86 4.53 8.21 11/01/1997
ESTIMATED INVESTMENT FEES (0.11) (0.41) (0.20) (0.22) (0.26) (0.27) (0.20) (0.41) (0.28) (0.30)
BERS-TOTAL EMERGING MARKETS - NET MGR 5.99 39.44 9.11 (6.16) 12.79 16.63 (16.34) 39.44 9.18 12.56
MSCI EMERGING MARKETS 5.05 40.90 7.45 (3.39) 18.31 18.42 (14.57) 40.90 11.27 13.03 4.28
EXCESS RETURN 0.95 (1.46) 1.66 (2.77) (5.52) (1.79) (1.77) (1.46) (2.10) (0.47) 0.25
146 BERS-TOTAL ACTIVE EMERGING MARKETS - GROSS 523 6.00 6.11 38.63 9.45 (6.90) 11.09 16.09 (16.99) 38.63 8.48 12.31 4.25 8.81 04/01/2004
ESTIMATED INVESTMENT FEES (0.11) (0.50) (0.22) (0.31) (0.37) (0.38) (0.28) (0.50) (0.37) (0.38)
BERS-TOTAL ACTIVE EMERGING MARKETS - NET MGR 6.00 38.13 9.23 (7.21) 10.72 15.71 (17.27) 38.13 8.11 11.92
MSCI EMERGING MARKETS 5.05 40.90 7.45 (3.39) 18.31 18.42 (14.57) 40.90 11.27 13.03 4.28 8.82
EXCESS RETURN 0.95 (2.77) 1.79 (3.82) (7.59) (2.71) (2.70) (2.77) (3.17) (1.10) (0.04) (0.01)
156 BERS-TOTAL PASSIVE EMERGING MARKETS - GROSS 2 0.02 4.91 40.69 7.77 (3.70) 17.29 18.79 (14.45) 40.69 11.18 13.21 12/01/2016
ESTIMATED INVESTMENT FEES (0.01) (0.03) (0.01) (0.02) (0.02) (0.03) 0.01 (0.03) (0.02) (0.04)
BERS-TOTAL PASSIVE EMERGING MARKETS - NET MGR 4.90 40.66 7.76 (3.72) 17.27 18.76 (14.45) 40.66 11.16 13.17
MSCI EMERGING MARKETS 5.05 40.90 7.45 (3.39) 18.31 18.42 (14.57) 40.90 11.27 13.27
EXCESS RETURN (0.14) (0.24) 0.31 (0.34) (1.04) 0.34 0.12 (0.24) (0.12) (0.10)
166 BERS-TOTAL INTERNATIONAL FUND OF FUNDS - GROSS 84 0.97 8.44 40.75 10.16 (2.01) 17.00 22.67 (14.23) 40.75 11.57 11.31 05/01/2017
ESTIMATED INVESTMENT FEES (0.29) (0.70) (0.35) (0.33) (0.41) (0.42) (0.30) (0.70) (0.44) (0.42)
BERS-TOTAL INTERNATIONAL FUND OF FUNDS - NET MGR 8.16 40.05 9.81 (2.34) 16.60 22.25 (14.53) 40.05 11.13 10.89
MSCI ACWI EX USA IMI NET 5.60 37.18 9.58 (4.74) 11.12 21.63 (14.76) 37.18 9.42 9.53
EXCESS RETURN 2.56 2.87 0.23 2.39 5.48 0.62 0.23 2.87 1.70 1.36
176 BERS-TOTAL GLOBAL EQUITY - GROSS 181 2.07 8.92 43.05 9.44 16.61 39.74 36.70 43.05 22.37 21.37 06/01/2018
ESTIMATED INVESTMENT FEES (0.14) (0.77) (0.29) (0.64) (0.77) (0.79) (0.77) (0.67) (0.67)
BERS-TOTAL GLOBAL EQUITY - NET MGR 8.78 42.28 9.15 15.96 38.98 35.91 42.28 21.70 20.71
MSCI AC WORLD (DAILY CONST) 7.39 39.26 12.30 2.11 16.25 26.60 39.26 14.57 13.95
EXCESS RETURN 1.38 3.02 (3.15) 13.85 22.72 9.31 3.02 7.13 6.76
Consolidated Performance Report
Through June 30, 2021
New York City Board of Education Retirement System 35Performance Overview as of June 30, 2021
Market Value ($MM) % of Total 3 Month FYTD CYTD
FYE 2020
CYE 2020
CYE 2019
CYE 2018 1 Year 3 Year 5 Year 10 Year ITD Inception Date
ALTERNATIVE EQUITY RETURN DETAIL
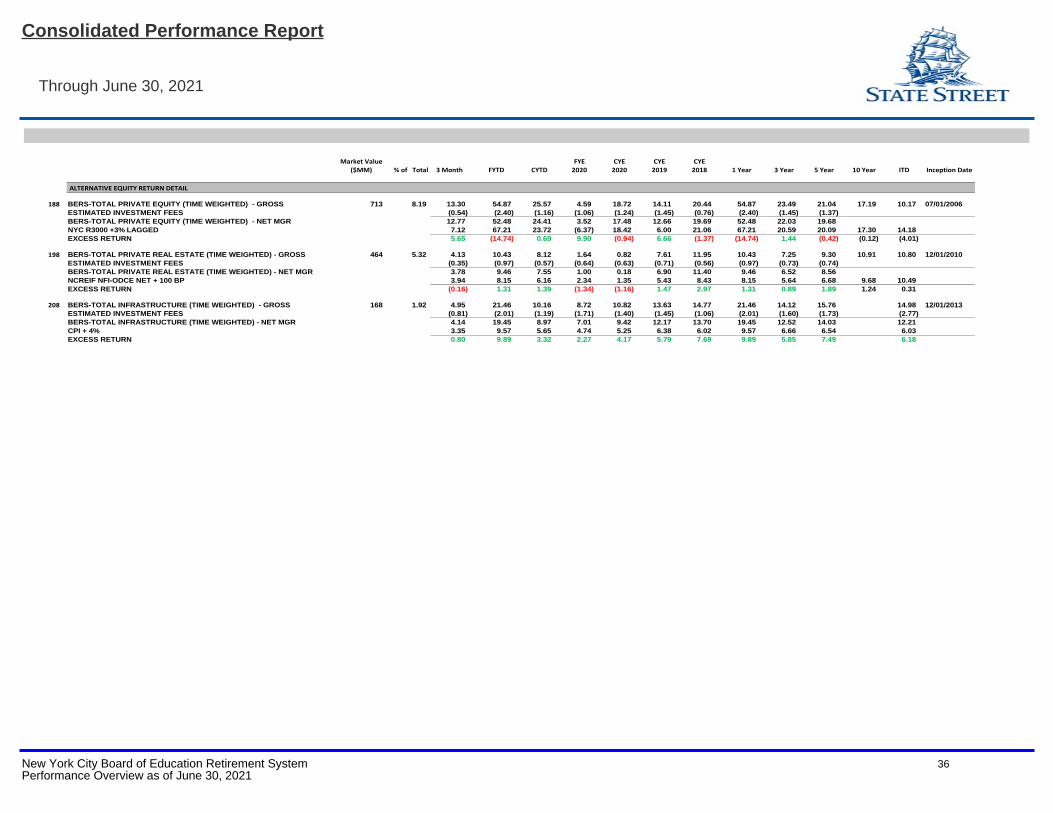
188 BERS-TOTAL PRIVATE EQUITY (TIME WEIGHTED) - GROSS 713 8.19 13.30 54.87 25.57 4.59 18.72 14.11 20.44 54.87 23.49 21.04 17.19 10.17 07/01/2006
ESTIMATED INVESTMENT FEES (0.54) (2.40) (1.16) (1.06) (1.24) (1.45) (0.76) (2.40) (1.45) (1.37)
BERS-TOTAL PRIVATE EQUITY (TIME WEIGHTED) - NET MGR 12.77 52.48 24.41 3.52 17.48 12.66 19.69 52.48 22.03 19.68
NYC R3000 +3% LAGGED 7.12 67.21 23.72 (6.37) 18.42 6.00 21.06 67.21 20.59 20.09 17.30 14.18
EXCESS RETURN 5.65 (14.74) 0.69 9.90 (0.94) 6.66 (1.37) (14.74) 1.44 (0.42) (0.12) (4.01)
198 BERS-TOTAL PRIVATE REAL ESTATE (TIME WEIGHTED) - GROSS 464 5.32 4.13 10.43 8.12 1.64 0.82 7.61 11.95 10.43 7.25 9.30 10.91 10.80 12/01/2010
ESTIMATED INVESTMENT FEES (0.35) (0.97) (0.57) (0.64) (0.63) (0.71) (0.56) (0.97) (0.73) (0.74)
BERS-TOTAL PRIVATE REAL ESTATE (TIME WEIGHTED) - NET MGR 3.78 9.46 7.55 1.00 0.18 6.90 11.40 9.46 6.52 8.56
NCREIF NFI-ODCE NET + 100 BP 3.94 8.15 6.16 2.34 1.35 5.43 8.43 8.15 5.64 6.68 9.68 10.49
EXCESS RETURN (0.16) 1.31 1.39 (1.34) (1.16) 1.47 2.97 1.31 0.89 1.89 1.24 0.31
208 BERS-TOTAL INFRASTRUCTURE (TIME WEIGHTED) - GROSS 168 1.92 4.95 21.46 10.16 8.72 10.82 13.63 14.77 21.46 14.12 15.76 14.98 12/01/2013
ESTIMATED INVESTMENT FEES (0.81) (2.01) (1.19) (1.71) (1.40) (1.45) (1.06) (2.01) (1.60) (1.73) (2.77)
BERS-TOTAL INFRASTRUCTURE (TIME WEIGHTED) - NET MGR 4.14 19.45 8.97 7.01 9.42 12.17 13.70 19.45 12.52 14.03 12.21
CPI + 4% 3.35 9.57 5.65 4.74 5.25 6.38 6.02 9.57 6.66 6.54 6.03
EXCESS RETURN 0.80 9.89 3.32 2.27 4.17 5.79 7.69 9.89 5.85 7.49 6.18
Consolidated Performance Report
Through June 30, 2021
New York City Board of Education Retirement System 36Performance Overview as of June 30, 2021
Market Value ($MM) % of Total 3 Month FYTD CYTD
FYE 2020
CYE 2020
CYE 2019
CYE 2018 1 Year 3 Year 5 Year 10 Year ITD Inception Date
FIXED INCOME RETURN DETAIL
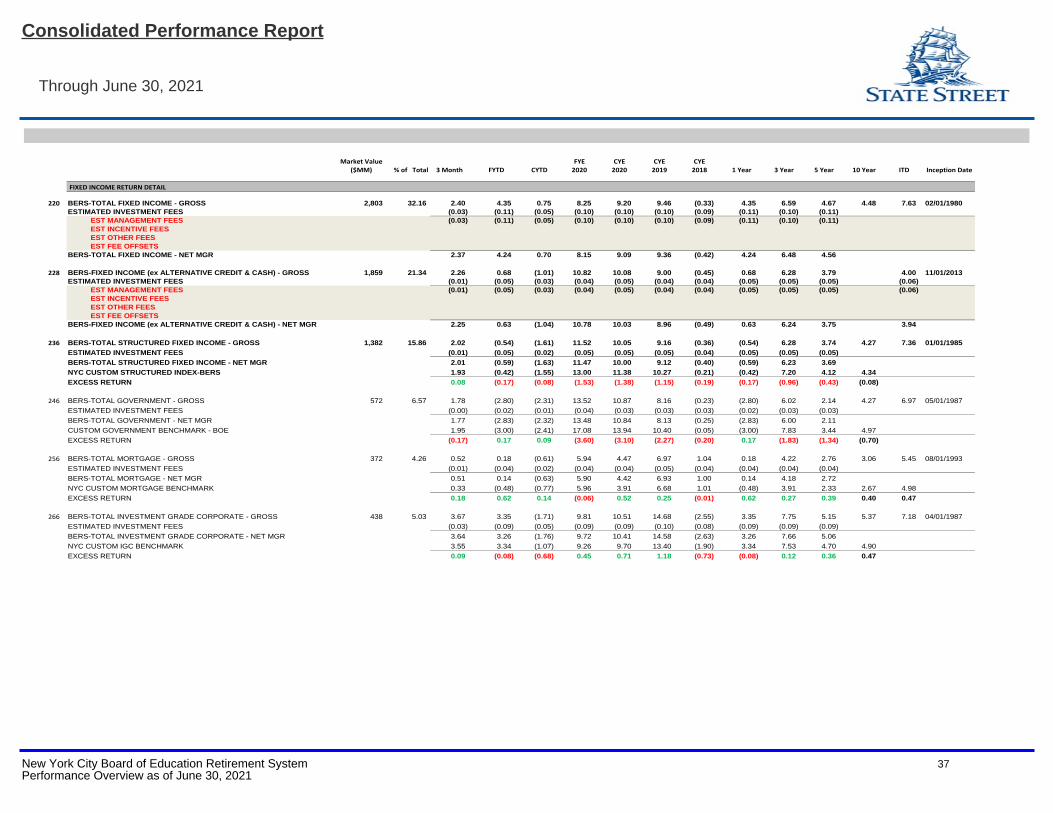
220 BERS-TOTAL FIXED INCOME - GROSS 2,803 32.16 2.40 4.35 0.75 8.25 9.20 9.46 (0.33) 4.35 6.59 4.67 4.48 7.63 02/01/1980
ESTIMATED INVESTMENT FEES (0.03) (0.11) (0.05) (0.10) (0.10) (0.10) (0.09) (0.11) (0.10) (0.11)
EST MANAGEMENT FEES (0.03) (0.11) (0.05) (0.10) (0.10) (0.10) (0.09) (0.11) (0.10) (0.11)
EST INCENTIVE FEES
EST OTHER FEES
EST FEE OFFSETS
BERS-TOTAL FIXED INCOME - NET MGR 2.37 4.24 0.70 8.15 9.09 9.36 (0.42) 4.24 6.48 4.56
228 BERS-FIXED INCOME (ex ALTERNATIVE CREDIT & CASH) - GROSS 1,859 21.34 2.26 0.68 (1.01) 10.82 10.08 9.00 (0.45) 0.68 6.28 3.79 4.00 11/01/2013
ESTIMATED INVESTMENT FEES (0.01) (0.05) (0.03) (0.04) (0.05) (0.04) (0.04) (0.05) (0.05) (0.05) (0.06)
EST MANAGEMENT FEES (0.01) (0.05) (0.03) (0.04) (0.05) (0.04) (0.04) (0.05) (0.05) (0.05) (0.06)
EST INCENTIVE FEES
EST OTHER FEES
EST FEE OFFSETS
BERS-FIXED INCOME (ex ALTERNATIVE CREDIT & CASH) - NET MGR 2.25 0.63 (1.04) 10.78 10.03 8.96 (0.49) 0.63 6.24 3.75 3.94
236 BERS-TOTAL STRUCTURED FIXED INCOME - GROSS 1,382 15.86 2.02 (0.54) (1.61) 11.52 10.05 9.16 (0.36) (0.54) 6.28 3.74 4.27 7.36 01/01/1985
ESTIMATED INVESTMENT FEES (0.01) (0.05) (0.02) (0.05) (0.05) (0.05) (0.04) (0.05) (0.05) (0.05)
BERS-TOTAL STRUCTURED FIXED INCOME - NET MGR 2.01 (0.59) (1.63) 11.47 10.00 9.12 (0.40) (0.59) 6.23 3.69
NYC CUSTOM STRUCTURED INDEX-BERS 1.93 (0.42) (1.55) 13.00 11.38 10.27 (0.21) (0.42) 7.20 4.12 4.34
EXCESS RETURN 0.08 (0.17) (0.08) (1.53) (1.38) (1.15) (0.19) (0.17) (0.96) (0.43) (0.08)
246 BERS-TOTAL GOVERNMENT - GROSS 572 6.57 1.78 (2.80) (2.31) 13.52 10.87 8.16 (0.23) (2.80) 6.02 2.14 4.27 6.97 05/01/1987
ESTIMATED INVESTMENT FEES (0.00) (0.02) (0.01) (0.04) (0.03) (0.03) (0.03) (0.02) (0.03) (0.03)
BERS-TOTAL GOVERNMENT - NET MGR 1.77 (2.83) (2.32) 13.48 10.84 8.13 (0.25) (2.83) 6.00 2.11
CUSTOM GOVERNMENT BENCHMARK - BOE 1.95 (3.00) (2.41) 17.08 13.94 10.40 (0.05) (3.00) 7.83 3.44 4.97
EXCESS RETURN (0.17) 0.17 0.09 (3.60) (3.10) (2.27) (0.20) 0.17 (1.83) (1.34) (0.70)
256 BERS-TOTAL MORTGAGE - GROSS 372 4.26 0.52 0.18 (0.61) 5.94 4.47 6.97 1.04 0.18 4.22 2.76 3.06 5.45 08/01/1993
ESTIMATED INVESTMENT FEES (0.01) (0.04) (0.02) (0.04) (0.04) (0.05) (0.04) (0.04) (0.04) (0.04)
BERS-TOTAL MORTGAGE - NET MGR 0.51 0.14 (0.63) 5.90 4.42 6.93 1.00 0.14 4.18 2.72
NYC CUSTOM MORTGAGE BENCHMARK 0.33 (0.48) (0.77) 5.96 3.91 6.68 1.01 (0.48) 3.91 2.33 2.67 4.98
EXCESS RETURN 0.18 0.62 0.14 (0.06) 0.52 0.25 (0.01) 0.62 0.27 0.39 0.40 0.47
266 BERS-TOTAL INVESTMENT GRADE CORPORATE - GROSS 438 5.03 3.67 3.35 (1.71) 9.81 10.51 14.68 (2.55) 3.35 7.75 5.15 5.37 7.18 04/01/1987
ESTIMATED INVESTMENT FEES (0.03) (0.09) (0.05) (0.09) (0.09) (0.10) (0.08) (0.09) (0.09) (0.09)
BERS-TOTAL INVESTMENT GRADE CORPORATE - NET MGR 3.64 3.26 (1.76) 9.72 10.41 14.58 (2.63) 3.26 7.66 5.06
NYC CUSTOM IGC BENCHMARK 3.55 3.34 (1.07) 9.26 9.70 13.40 (1.90) 3.34 7.53 4.70 4.90
EXCESS RETURN 0.09 (0.08) (0.68) 0.45 0.71 1.18 (0.73) (0.08) 0.12 0.36 0.47
Consolidated Performance Report
Through June 30, 2021
New York City Board of Education Retirement System 37Performance Overview as of June 30, 2021
Market Value ($MM) % of Total 3 Month FYTD CYTD
FYE 2020
CYE 2020
CYE 2019
CYE 2018 1 Year 3 Year 5 Year 10 Year ITD Inception Date
FIXED INCOME RETURN DETAIL
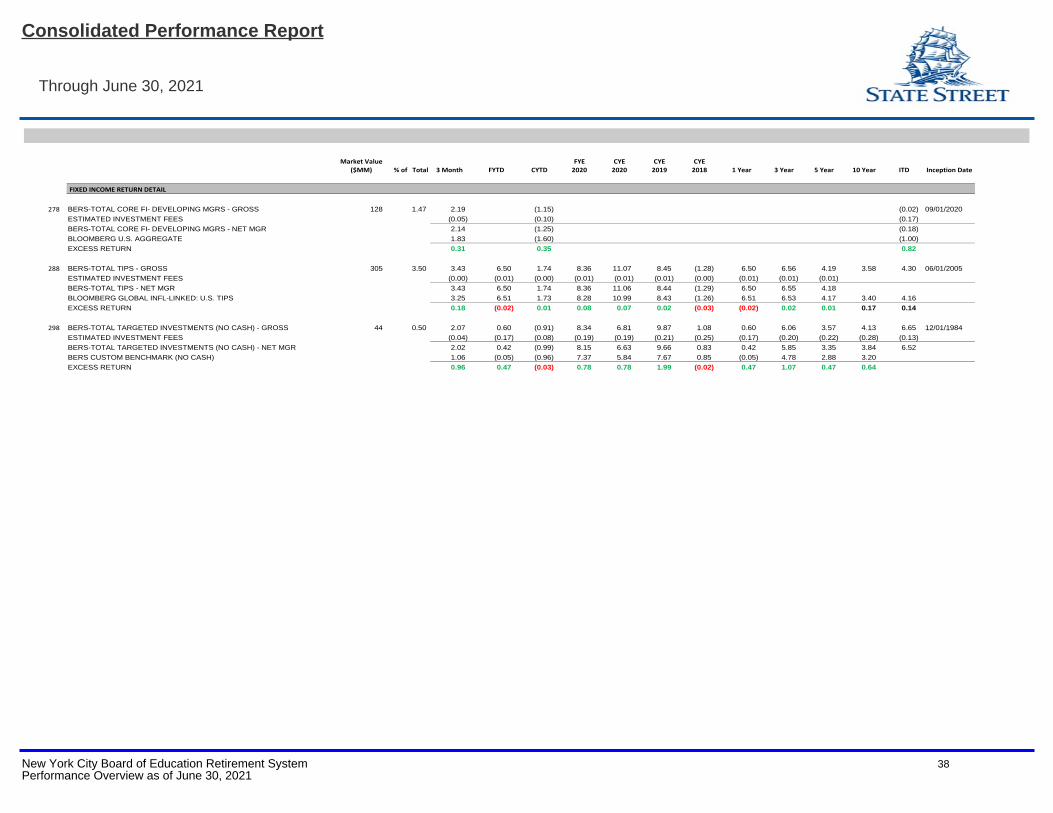
278 BERS-TOTAL CORE FI- DEVELOPING MGRS - GROSS 128 1.47 2.19 (1.15) (0.02) 09/01/2020
ESTIMATED INVESTMENT FEES (0.05) (0.10) (0.17)
BERS-TOTAL CORE FI- DEVELOPING MGRS - NET MGR 2.14 (1.25) (0.18)
BLOOMBERG U.S. AGGREGATE 1.83 (1.60) (1.00)
EXCESS RETURN 0.31 0.35 0.82
288 BERS-TOTAL TIPS - GROSS 305 3.50 3.43 6.50 1.74 8.36 11.07 8.45 (1.28) 6.50 6.56 4.19 3.58 4.30 06/01/2005
ESTIMATED INVESTMENT FEES (0.00) (0.01) (0.00) (0.01) (0.01) (0.01) (0.00) (0.01) (0.01) (0.01)
BERS-TOTAL TIPS - NET MGR 3.43 6.50 1.74 8.36 11.06 8.44 (1.29) 6.50 6.55 4.18
BLOOMBERG GLOBAL INFL-LINKED: U.S. TIPS 3.25 6.51 1.73 8.28 10.99 8.43 (1.26) 6.51 6.53 4.17 3.40 4.16
EXCESS RETURN 0.18 (0.02) 0.01 0.08 0.07 0.02 (0.03) (0.02) 0.02 0.01 0.17 0.14
298 BERS-TOTAL TARGETED INVESTMENTS (NO CASH) - GROSS 44 0.50 2.07 0.60 (0.91) 8.34 6.81 9.87 1.08 0.60 6.06 3.57 4.13 6.65 12/01/1984
ESTIMATED INVESTMENT FEES (0.04) (0.17) (0.08) (0.19) (0.19) (0.21) (0.25) (0.17) (0.20) (0.22) (0.28) (0.13)
BERS-TOTAL TARGETED INVESTMENTS (NO CASH) - NET MGR 2.02 0.42 (0.99) 8.15 6.63 9.66 0.83 0.42 5.85 3.35 3.84 6.52
BERS CUSTOM BENCHMARK (NO CASH) 1.06 (0.05) (0.96) 7.37 5.84 7.67 0.85 (0.05) 4.78 2.88 3.20
EXCESS RETURN 0.96 0.47 (0.03) 0.78 0.78 1.99 (0.02) 0.47 1.07 0.47 0.64
Consolidated Performance Report
Through June 30, 2021
New York City Board of Education Retirement System 38Performance Overview as of June 30, 2021
Market Value ($MM) % of Total 3 Month FYTD CYTD
FYE 2020
CYE 2020
CYE 2019
CYE 2018 1 Year 3 Year 5 Year 10 Year ITD Inception Date
ALTERNATIVE CREDIT INCOME RETURN DETAIL
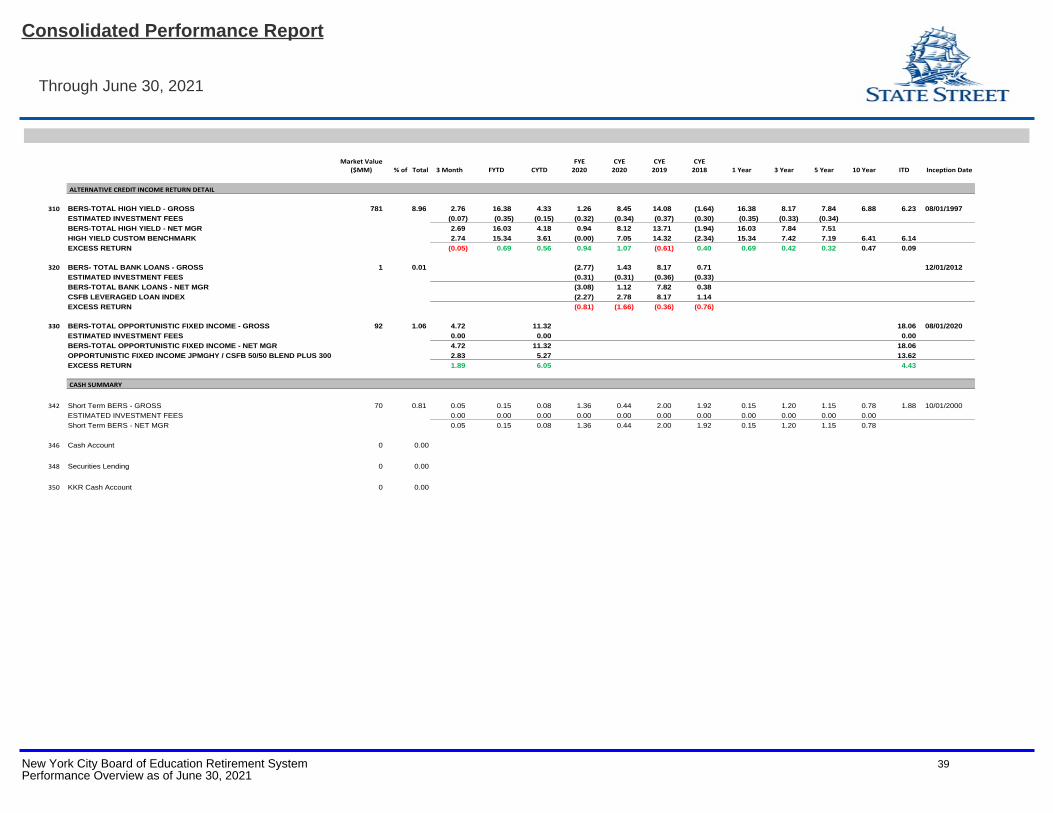
310 BERS-TOTAL HIGH YIELD - GROSS 781 8.96 2.76 16.38 4.33 1.26 8.45 14.08 (1.64) 16.38 8.17 7.84 6.88 6.23 08/01/1997
ESTIMATED INVESTMENT FEES (0.07) (0.35) (0.15) (0.32) (0.34) (0.37) (0.30) (0.35) (0.33) (0.34)
BERS-TOTAL HIGH YIELD - NET MGR 2.69 16.03 4.18 0.94 8.12 13.71 (1.94) 16.03 7.84 7.51
HIGH YIELD CUSTOM BENCHMARK 2.74 15.34 3.61 (0.00) 7.05 14.32 (2.34) 15.34 7.42 7.19 6.41 6.14
EXCESS RETURN (0.05) 0.69 0.56 0.94 1.07 (0.61) 0.40 0.69 0.42 0.32 0.47 0.09
320 BERS- TOTAL BANK LOANS - GROSS 1 0.01 (2.77) 1.43 8.17 0.71 12/01/2012
ESTIMATED INVESTMENT FEES (0.31) (0.31) (0.36) (0.33)
BERS-TOTAL BANK LOANS - NET MGR (3.08) 1.12 7.82 0.38
CSFB LEVERAGED LOAN INDEX (2.27) 2.78 8.17 1.14
EXCESS RETURN (0.81) (1.66) (0.36) (0.76)
330 BERS-TOTAL OPPORTUNISTIC FIXED INCOME - GROSS 92 1.06 4.72 11.32 18.06 08/01/2020
ESTIMATED INVESTMENT FEES 0.00 0.00 0.00
BERS-TOTAL OPPORTUNISTIC FIXED INCOME - NET MGR 4.72 11.32 18.06
OPPORTUNISTIC FIXED INCOME JPMGHY / CSFB 50/50 BLEND PLUS 300 2.83 5.27 13.62
EXCESS RETURN 1.89 6.05 4.43
CASH SUMMARY
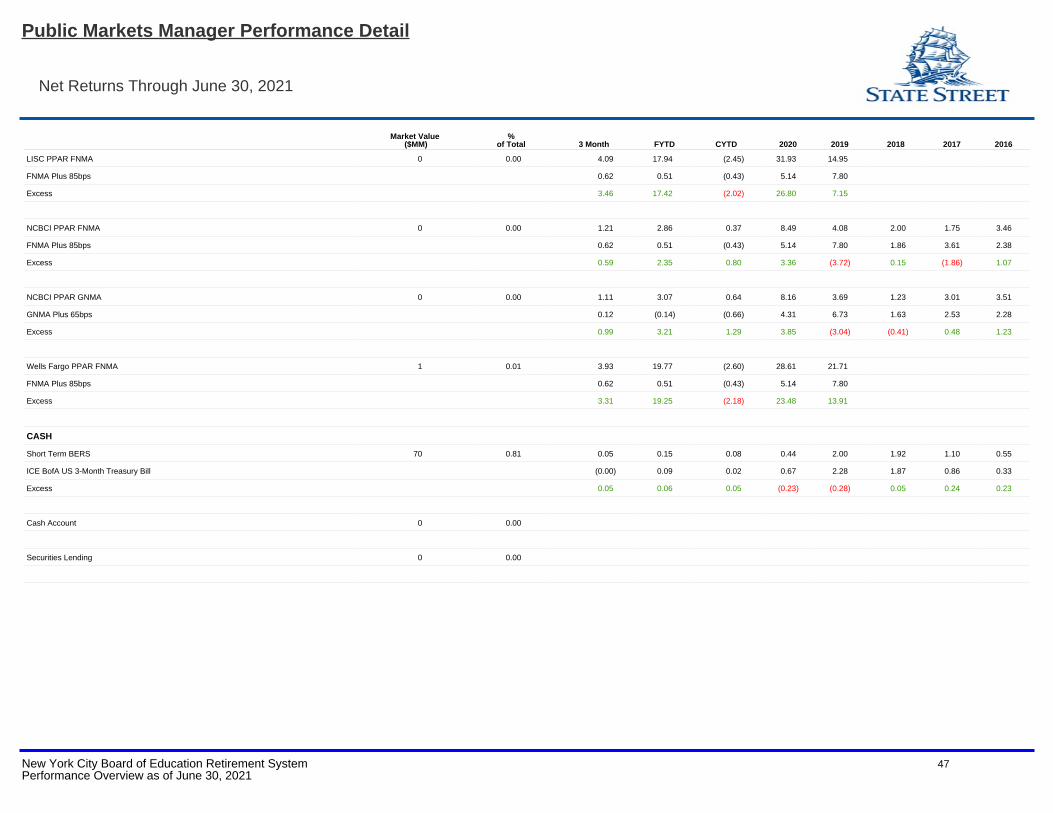
342 Short Term BERS - GROSS 70 0.81 0.05 0.15 0.08 1.36 0.44 2.00 1.92 0.15 1.20 1.15 0.78 1.88 10/01/2000
ESTIMATED INVESTMENT FEES 0.00 0.00 0.00 0.00 0.00 0.00 0.00 0.00 0.00 0.00 0.00
Short Term BERS - NET MGR 0.05 0.15 0.08 1.36 0.44 2.00 1.92 0.15 1.20 1.15 0.78
346 Cash Account 0 0.00
348 Securities Lending 0 0.00
350 KKR Cash Account 0 0.00
Consolidated Performance Report
Through June 30, 2021
New York City Board of Education Retirement System 39Performance Overview as of June 30, 2021
New York CityBoard of Education Retirement System
Appendix B
Public Markets Manager Performance Detail
New York City Board of Education Retirement System 40Performance Overview as of June 30, 2021
Market Value ($MM)
%of Total 3 Month FYTD CYTD 2020 2019 2018 2017 2016
EQUITY SUMMARY
US EQUITY
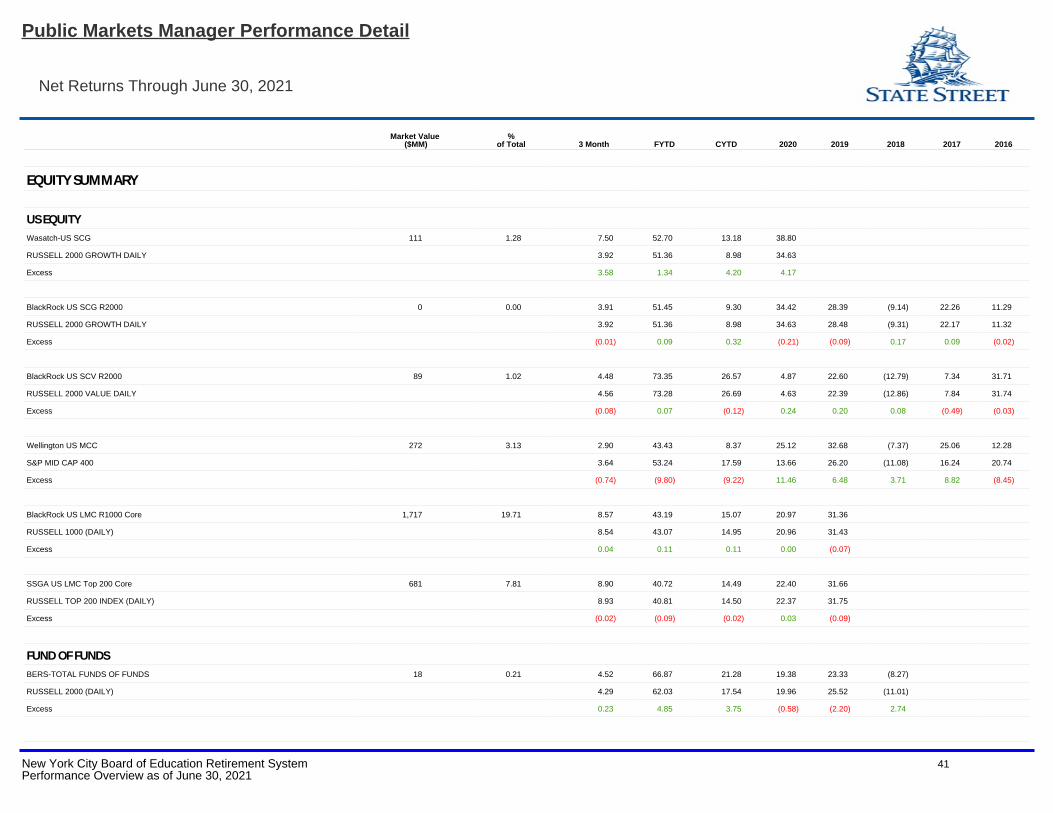
Wasatch-US SCG 111 1.28 7.50 52.70 13.18 38.80
RUSSELL 2000 GROWTH DAILY 3.92 51.36 8.98 34.63
Excess 3.58 1.34 4.20 4.17
BlackRock US SCG R2000 0 0.00 3.91 51.45 9.30 34.42 28.39 (9.14) 22.26 11.29
RUSSELL 2000 GROWTH DAILY 3.92 51.36 8.98 34.63 28.48 (9.31) 22.17 11.32
Excess (0.01) 0.09 0.32 (0.21) (0.09) 0.17 0.09 (0.02)
BlackRock US SCV R2000 89 1.02 4.48 73.35 26.57 4.87 22.60 (12.79) 7.34 31.71
RUSSELL 2000 VALUE DAILY 4.56 73.28 26.69 4.63 22.39 (12.86) 7.84 31.74
Excess (0.08) 0.07 (0.12) 0.24 0.20 0.08 (0.49) (0.03)
Wellington US MCC 272 3.13 2.90 43.43 8.37 25.12 32.68 (7.37) 25.06 12.28
S&P MID CAP 400 3.64 53.24 17.59 13.66 26.20 (11.08) 16.24 20.74
Excess (0.74) (9.80) (9.22) 11.46 6.48 3.71 8.82 (8.45)
BlackRock US LMC R1000 Core 1,717 19.71 8.57 43.19 15.07 20.97 31.36
RUSSELL 1000 (DAILY) 8.54 43.07 14.95 20.96 31.43
Excess 0.04 0.11 0.11 0.00 (0.07)
SSGA US LMC Top 200 Core 681 7.81 8.90 40.72 14.49 22.40 31.66
RUSSELL TOP 200 INDEX (DAILY) 8.93 40.81 14.50 22.37 31.75
Excess (0.02) (0.09) (0.02) 0.03 (0.09)
FUND OF FUNDS
BERS-TOTAL FUNDS OF FUNDS 18 0.21 4.52 66.87 21.28 19.38 23.33 (8.27)
RUSSELL 2000 (DAILY) 4.29 62.03 17.54 19.96 25.52 (11.01)
Excess 0.23 4.85 3.75 (0.58) (2.20) 2.74
Public Markets Manager Performance Detail
Net Returns Through June 30, 2021
New York City Board of Education Retirement System 41Performance Overview as of June 30, 2021
Market Value ($MM)
%of Total 3 Month FYTD CYTD 2020 2019 2018 2017 2016
BERS-TOTAL LEGATO 18 0.21 4.52 66.87 21.28 19.38 23.33 (8.27)
RUSSELL 2000 (DAILY) 4.29 62.03 17.54 19.96 25.52 (11.01)
Excess 0.23 4.85 3.75 (0.58) (2.20) 2.74
NON - US EQUITY
Sprucegrove WorldxUS LMCC 370 4.24 3.96 45.61 10.47 5.35 17.55 (13.67) 27.15 11.14
NYC Developed Value Benchmark [1] 5.65 33.60 9.92 7.59 22.49 (14.09) 22.77 5.02
Excess (1.68) 12.00 0.55 (2.24) (4.94) 0.42 4.38 6.12
Baillie Gifford WorldxUS LMCC 371 4.25 7.38 46.11 4.05 66.99 36.64 (15.35) 44.17 0.70
NYC Developed Growth Benchmark [2] 5.65 33.60 9.92 7.59 22.49 (14.09) 27.77 (3.04)
Excess 1.74 12.51 (5.87) 59.40 14.15 (1.26) 16.40 3.74
Acadian WorldxUS SCC 110 1.27 8.71 51.87 17.95 15.96 21.82 (19.22) 38.38 6.41
S&P EPAC Small Cap USD NET 5.31 42.23 9.16 13.78 23.71 (18.58) 33.47 1.34
Excess 3.40 9.64 8.78 2.18 (1.89) (0.65) 4.91 5.07
Algert EAFE SCC 36 0.41 4.12 40.41 11.33 9.76
MSCI EAFE SMALL CAP NET (DAILY) 4.34 40.98 9.04 12.34
Excess (0.23) (0.58) 2.29 (2.59)
EMERGING MARKETS
Acadian EM 364 4.18 4.86 40.79 11.34 10.72 15.71 (17.27) 40.45 12.74
MSCI EMERGING MARKETS 5.05 40.90 7.45 18.31 18.42 (14.57) 37.28 11.19
Excess (0.19) (0.12) 3.89 (7.59) (2.71) (2.70) 3.16 1.55
JP Morgan AM-EM ACG 159 1.82 8.93
MSCI EMERGING MARKETS 5.05
Excess 3.88
BlackRock MSCI EM Core 2 0.02 4.90 40.66 7.76 17.27 18.76 (14.45) 37.25
MSCI EMERGING MARKETS 5.05 40.90 7.45 18.31 18.42 (14.57) 37.28
Excess (0.14) (0.24) 0.31 (1.04) 0.34 0.12 (0.03)
Public Markets Manager Performance Detail
Net Returns Through June 30, 2021
New York City Board of Education Retirement System 42Performance Overview as of June 30, 2021
Market Value ($MM)
%of Total 3 Month FYTD CYTD 2020 2019 2018 2017 2016
INTERNATIONAL FOF
BERS-TOTAL INTERNATIONAL FOF 84 0.97 8.16 40.05 9.81 16.60 22.25 (14.53)
MSCI ACWI ex USA IMI Net 5.60 37.18 9.58 11.12 21.63 (14.76)
Excess 2.56 2.87 0.23 5.48 0.62 0.23
BERS-TOTAL INTERNATIONAL XPONANCE 84 0.97 8.16 40.05 9.81 16.60 22.25 (14.53)
MSCI ACWI ex USA IMI Net 5.60 37.18 9.58 11.12 21.63 (14.76)
Excess 2.56 2.87 0.23 5.48 0.62 0.23
GLOBAL EQUITY
Morgan Stanley-Global 97 1.11 7.27 42.76 5.86 58.66 38.03
MSCI AC WORLD (Daily Const) 7.39 39.26 12.30 16.25 26.60
Excess (0.13) 3.50 (6.44) 42.41 11.44
Fiera-Global 84 0.96 10.57 41.73 13.20 20.57 33.97
MSCI World Index 7.74 39.04 13.05 15.90 27.67
Excess 2.83 2.68 0.16 4.66 6.30
FIXED INCOME SUMMARY
STRUCTRED FIXED INCOME
BlackRock Mortgages 372 4.26 0.51 0.14 (0.63) 4.42 6.93 1.00 3.06 2.32
NYC Custom Mortgage Benchmark [3] 0.33 (0.48) (0.77) 3.91 6.68 1.01 2.47 1.59
Excess 0.18 0.62 0.14 0.52 0.25 (0.01) 0.59 0.73
Prudential Corporate 0 0.00 9.89 13.63 (1.95) 6.21 5.86
NYC - Investment Grade Credit 9.70 13.40 (1.90) 6.04 5.56
Excess 0.19 0.24 (0.05) 0.17 0.30
Taplin Corporate 0 0.00 11.01 15.70 (3.42) 7.18 8.02
NYC Custom IGC Benchmark [4] 9.70 13.40 (1.90) 6.04 5.56
Excess 1.31 2.30 (1.52) 1.14 2.46
Public Markets Manager Performance Detail
Net Returns Through June 30, 2021
New York City Board of Education Retirement System 43Performance Overview as of June 30, 2021
Market Value ($MM)
%of Total 3 Month FYTD CYTD 2020 2019 2018 2017 2016
T Rowe Price-Corporate 438 5.02 3.64
Bloomberg U.S. Corporate Inv Grade 3.55
Excess 0.09
SSGA LI Treasury 138 1.58 4.06 (6.27) (4.80) 12.59 10.57 (0.18) 4.92 1.23
NYC - Treasury Agency Plus Five 4.17 (6.52) (5.04) 12.85 10.40 (0.05) 4.66 1.21
Excess (0.11) 0.24 0.24 (0.26) 0.17 (0.12) 0.27 0.01
SSGA IT Treasury 1-10Y 227 2.61 0.65 (1.14) (1.12) 5.73
FTSE USBIG Treasury/Agency 1-10 y 0.68 (1.09) (1.06) 5.72
Excess (0.03) (0.05) (0.05) 0.02
SSGA ST Treasury 1-3Y 148 1.69 (0.03) 0.08 (0.09) 3.05 3.56 1.51 0.45
FTSE USBIG Treasury 1-3 Y Index (0.03) 0.07 (0.08) 3.09 3.56 1.56 0.42
Excess 0.00 0.02 (0.02) (0.04) 0.00 (0.05) 0.03
SSGA LT Treasury 10Y Plus 60 0.69 6.97
FTSE Treasury 10+ 6.98
Excess (0.01)
HIGH YIELD
Mackay Shields High Yield 389 4.46 2.41 13.46 3.46 8.00 13.85
Bloomberg U.S. HY - 2% Issuer Cap 2.74 15.34 3.61 7.05 14.32
Excess (0.32) (1.88) (0.15) 0.95 (0.47)
Nomura High Yield 392 4.50 2.96 18.70 4.89 8.22 13.74
Bloomberg U.S. HY - 2% Issuer Cap 2.74 15.34 3.61 7.05 14.32
Excess 0.22 3.36 1.28 1.17 (0.58)
BANK LOANS
Barings Bank Loans 1 0.01 1.12 7.82 0.38 4.47 8.48
CSFB LEVERAGED LOAN INDEX 2.78 8.17 1.14 4.25 9.88
Excess (1.66) (0.36) (0.76) 0.22 (1.39)
Public Markets Manager Performance Detail
Net Returns Through June 30, 2021
New York City Board of Education Retirement System 44Performance Overview as of June 30, 2021
Market Value ($MM)
%of Total 3 Month FYTD CYTD 2020 2019 2018 2017 2016
TIPS
SSGA TIPS 305 3.50 3.43 6.50 1.74 11.06 8.44 (1.29) 3.04 4.78
Bloomberg Global Infl-Linked: U.S. TIPS 3.25 6.51 1.73 10.99 8.43 (1.26) 3.01 4.68
Excess 0.18 (0.02) 0.01 0.07 0.02 (0.03) 0.04 0.09
CORE FI-DEVELOPING MANAGERS
Pugh-CorePlus 128 1.47 2.14 (1.25)
Bloomberg U.S. Aggregate 1.83 (1.60)
Excess 0.31 0.35
ECONOMICALLY TARGETED INVESTMENTS
RBC Access MBS 11 0.12 1.46 0.08 (0.82) 6.14 7.21 0.49 2.64 1.61
Access RBC Benchmark 0.44 (0.76) (0.99) 4.69 6.05 1.17 1.96 1.52
Excess 1.02 0.84 0.17 1.45 1.16 (0.69) 0.69 0.09
AFL-CIO Housing Investment Trust 18 0.21 1.54 0.12 (0.74) 6.20 7.78 0.16 3.17 1.94
Bloomberg U.S. Aggregate 1.83 (0.33) (1.60) 7.51 8.72 0.01 3.54 2.65
Excess (0.29) 0.45 0.87 (1.31) (0.94) 0.15 (0.38) (0.71)
CPC Construction Facility 2 0.02 0.77 2.65 2.26 0.67 8.12 4.14 6.05 (3.95)
CPC CONST BENCHMARK 0.60 2.45 1.21 2.73 4.09 3.99 3.34 3.03
Excess 0.17 0.20 1.06 (2.06) 4.03 0.15 2.72 (6.99)
BOA PPAR FNMA 1 0.01 3.35 (1.21) (2.31) 6.12 13.54 2.33 5.21 4.07
FNMA Plus 85bps 0.62 0.51 (0.43) 5.14 7.80 1.86 3.61 2.38
Excess 2.72 (1.72) (1.89) 0.98 5.74 0.47 1.60 1.69
Citibank PPAR FNMA 3 0.03 3.57 (0.97) (2.20) 7.06 19.71 2.63 5.26 3.71
FNMA Plus 85bps 0.62 0.51 (0.43) 5.14 7.80 1.86 3.61 2.38
Excess 2.94 (1.48) (1.77) 1.92 11.91 0.77 1.65 1.33
Public Markets Manager Performance Detail
Net Returns Through June 30, 2021
New York City Board of Education Retirement System 45Performance Overview as of June 30, 2021
Market Value ($MM)
%of Total 3 Month FYTD CYTD 2020 2019 2018 2017 2016
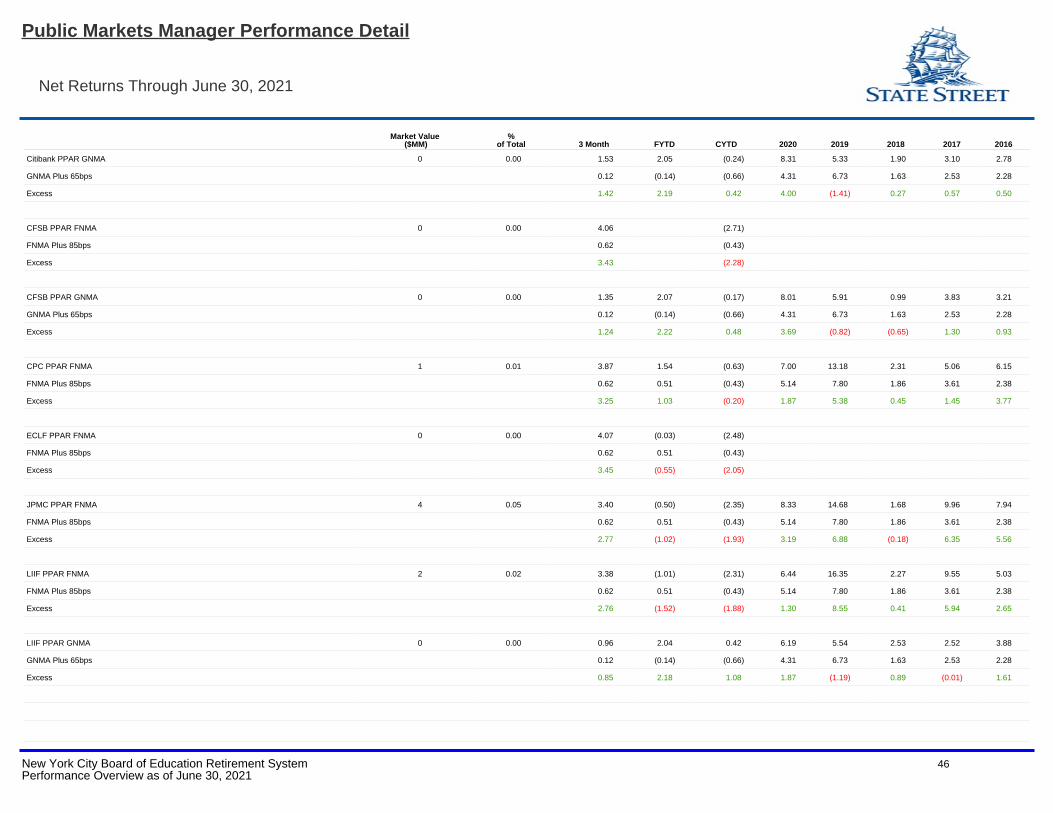
Citibank PPAR GNMA 0 0.00 1.53 2.05 (0.24) 8.31 5.33 1.90 3.10 2.78
GNMA Plus 65bps 0.12 (0.14) (0.66) 4.31 6.73 1.63 2.53 2.28
Excess 1.42 2.19 0.42 4.00 (1.41) 0.27 0.57 0.50
CFSB PPAR FNMA 0 0.00 4.06 (2.71)
FNMA Plus 85bps 0.62 (0.43)
Excess 3.43 (2.28)
CFSB PPAR GNMA 0 0.00 1.35 2.07 (0.17) 8.01 5.91 0.99 3.83 3.21
GNMA Plus 65bps 0.12 (0.14) (0.66) 4.31 6.73 1.63 2.53 2.28
Excess 1.24 2.22 0.48 3.69 (0.82) (0.65) 1.30 0.93
CPC PPAR FNMA 1 0.01 3.87 1.54 (0.63) 7.00 13.18 2.31 5.06 6.15
FNMA Plus 85bps 0.62 0.51 (0.43) 5.14 7.80 1.86 3.61 2.38
Excess 3.25 1.03 (0.20) 1.87 5.38 0.45 1.45 3.77
ECLF PPAR FNMA 0 0.00 4.07 (0.03) (2.48)
FNMA Plus 85bps 0.62 0.51 (0.43)
Excess 3.45 (0.55) (2.05)
JPMC PPAR FNMA 4 0.05 3.40 (0.50) (2.35) 8.33 14.68 1.68 9.96 7.94
FNMA Plus 85bps 0.62 0.51 (0.43) 5.14 7.80 1.86 3.61 2.38
Excess 2.77 (1.02) (1.93) 3.19 6.88 (0.18) 6.35 5.56
LIIF PPAR FNMA 2 0.02 3.38 (1.01) (2.31) 6.44 16.35 2.27 9.55 5.03
FNMA Plus 85bps 0.62 0.51 (0.43) 5.14 7.80 1.86 3.61 2.38
Excess 2.76 (1.52) (1.88) 1.30 8.55 0.41 5.94 2.65
LIIF PPAR GNMA 0 0.00 0.96 2.04 0.42 6.19 5.54 2.53 2.52 3.88
GNMA Plus 65bps 0.12 (0.14) (0.66) 4.31 6.73 1.63 2.53 2.28
Excess 0.85 2.18 1.08 1.87 (1.19) 0.89 (0.01) 1.61
Public Markets Manager Performance Detail
Net Returns Through June 30, 2021
New York City Board of Education Retirement System 46Performance Overview as of June 30, 2021
Market Value ($MM)
%of Total 3 Month FYTD CYTD 2020 2019 2018 2017 2016
LISC PPAR FNMA 0 0.00 4.09 17.94 (2.45) 31.93 14.95
FNMA Plus 85bps 0.62 0.51 (0.43) 5.14 7.80
Excess 3.46 17.42 (2.02) 26.80 7.15
NCBCI PPAR FNMA 0 0.00 1.21 2.86 0.37 8.49 4.08 2.00 1.75 3.46
FNMA Plus 85bps 0.62 0.51 (0.43) 5.14 7.80 1.86 3.61 2.38
Excess 0.59 2.35 0.80 3.36 (3.72) 0.15 (1.86) 1.07
NCBCI PPAR GNMA 0 0.00 1.11 3.07 0.64 8.16 3.69 1.23 3.01 3.51
GNMA Plus 65bps 0.12 (0.14) (0.66) 4.31 6.73 1.63 2.53 2.28
Excess 0.99 3.21 1.29 3.85 (3.04) (0.41) 0.48 1.23
Wells Fargo PPAR FNMA 1 0.01 3.93 19.77 (2.60) 28.61 21.71
FNMA Plus 85bps 0.62 0.51 (0.43) 5.14 7.80
Excess 3.31 19.25 (2.18) 23.48 13.91
CASH
Short Term BERS 70 0.81 0.05 0.15 0.08 0.44 2.00 1.92 1.10 0.55
ICE BofA US 3-Month Treasury Bill (0.00) 0.09 0.02 0.67 2.28 1.87 0.86 0.33
Excess 0.05 0.06 0.05 (0.23) (0.28) 0.05 0.24 0.23
Cash Account 0 0.00
Securities Lending 0 0.00
Public Markets Manager Performance Detail
Net Returns Through June 30, 2021
New York City Board of Education Retirement System 47Performance Overview as of June 30, 2021
New York CityBoard of Education Retirement System
Appendix C
Alternative Assets Manager Performance Detail
New York City Board of Education Retirement System 48Performance Overview as of June 30, 2021
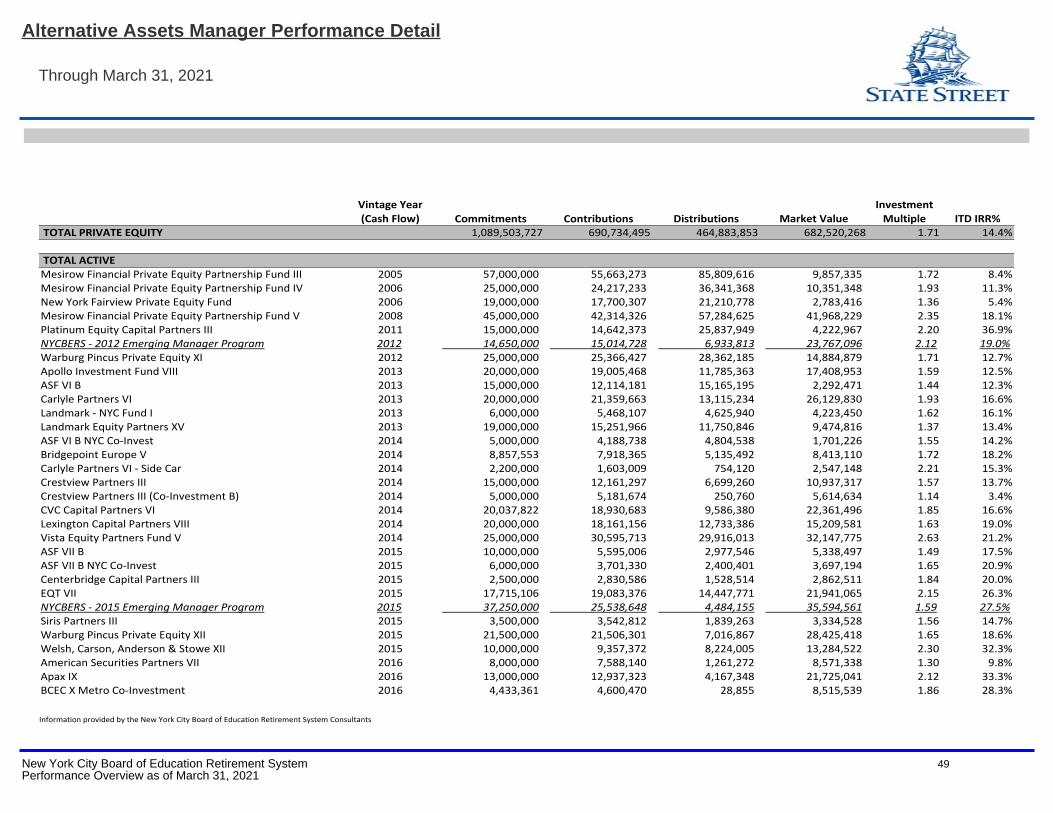
Vintage Year (Cash Flow) Commitments Contributions Distributions Market Value
Investment Multiple ITD IRR%
TOTAL PRIVATE EQUITY 1,089,503,727 690,734,495 464,883,853 682,520,268 1.71 14.4%
TOTAL ACTIVE Mesirow Financial Private Equity Partnership Fund III 2005 57,000,000 55,663,273 85,809,616 9,857,335 1.72 8.4%Mesirow Financial Private Equity Partnership Fund IV 2006 25,000,000 24,217,233 36,341,368 10,351,348 1.93 11.3%New York Fairview Private Equity Fund 2006 19,000,000 17,700,307 21,210,778 2,783,416 1.36 5.4%Mesirow Financial Private Equity Partnership Fund V 2008 45,000,000 42,314,326 57,284,625 41,968,229 2.35 18.1%Platinum Equity Capital Partners III 2011 15,000,000 14,642,373 25,837,949 4,222,967 2.20 36.9%NYCBERS - 2012 Emerging Manager Program 2012 14,650,000 15,014,728 6,933,813 23,767,096 2.12 19.0%Warburg Pincus Private Equity XI 2012 25,000,000 25,366,427 28,362,185 14,884,879 1.71 12.7%Apollo Investment Fund VIII 2013 20,000,000 19,005,468 11,785,363 17,408,953 1.59 12.5%ASF VI B 2013 15,000,000 12,114,181 15,165,195 2,292,471 1.44 12.3%Carlyle Partners VI 2013 20,000,000 21,359,663 13,115,234 26,129,830 1.93 16.6%Landmark - NYC Fund I 2013 6,000,000 5,468,107 4,625,940 4,223,450 1.62 16.1%Landmark Equity Partners XV 2013 19,000,000 15,251,966 11,750,846 9,474,816 1.37 13.4%ASF VI B NYC Co-Invest 2014 5,000,000 4,188,738 4,804,538 1,701,226 1.55 14.2%Bridgepoint Europe V 2014 8,857,553 7,918,365 5,135,492 8,413,110 1.72 18.2%Carlyle Partners VI - Side Car 2014 2,200,000 1,603,009 754,120 2,547,148 2.21 15.3%Crestview Partners III 2014 15,000,000 12,161,297 6,699,260 10,937,317 1.57 13.7%Crestview Partners III (Co-Investment B) 2014 5,000,000 5,181,674 250,760 5,614,634 1.14 3.4%CVC Capital Partners VI 2014 20,037,822 18,930,683 9,586,380 22,361,496 1.85 16.6%Lexington Capital Partners VIII 2014 20,000,000 18,161,156 12,733,386 15,209,581 1.63 19.0%Vista Equity Partners Fund V 2014 25,000,000 30,595,713 29,916,013 32,147,775 2.63 21.2%ASF VII B 2015 10,000,000 5,595,006 2,977,546 5,338,497 1.49 17.5%ASF VII B NYC Co-Invest 2015 6,000,000 3,701,330 2,400,401 3,697,194 1.65 20.9%Centerbridge Capital Partners III 2015 2,500,000 2,830,586 1,528,514 2,862,511 1.84 20.0%EQT VII 2015 17,715,106 19,083,376 14,447,771 21,941,065 2.15 26.3%NYCBERS - 2015 Emerging Manager Program 2015 37,250,000 25,538,648 4,484,155 35,594,561 1.59 27.5%Siris Partners III 2015 3,500,000 3,542,812 1,839,263 3,334,528 1.56 14.7%Warburg Pincus Private Equity XII 2015 21,500,000 21,506,301 7,016,867 28,425,418 1.65 18.6%Welsh, Carson, Anderson & Stowe XII 2015 10,000,000 9,357,372 8,224,005 13,284,522 2.30 32.3%American Securities Partners VII 2016 8,000,000 7,588,140 1,261,272 8,571,338 1.30 9.8%Apax IX 2016 13,000,000 12,937,323 4,167,348 21,725,041 2.12 33.3%BCEC X Metro Co-Investment 2016 4,433,361 4,600,470 28,855 8,515,539 1.86 28.3%
Information provided by the New York City Board of Education Retirement System Consultants
Alternative Assets Manager Performance Detail
Through March 31, 2021
New York City Board of Education Retirement System 49Performance Overview as of March 31, 2021
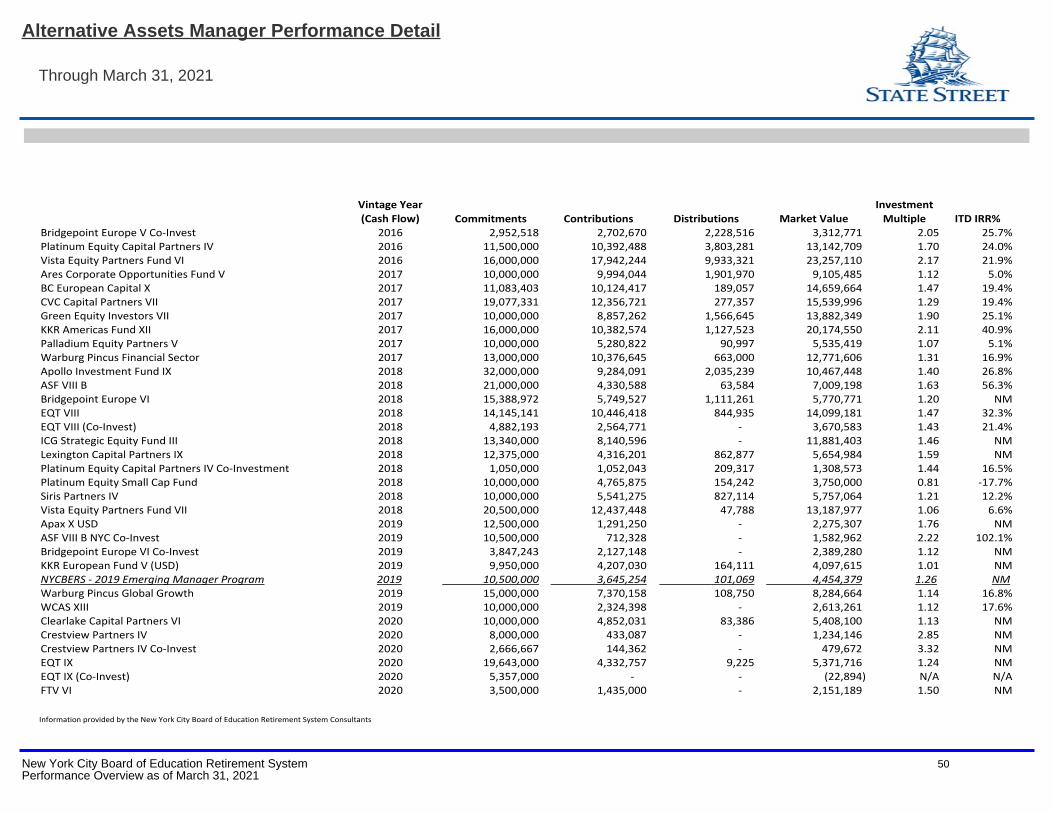
Vintage Year (Cash Flow) Commitments Contributions Distributions Market Value
Investment Multiple ITD IRR%
Bridgepoint Europe V Co-Invest 2016 2,952,518 2,702,670 2,228,516 3,312,771 2.05 25.7%Platinum Equity Capital Partners IV 2016 11,500,000 10,392,488 3,803,281 13,142,709 1.70 24.0%Vista Equity Partners Fund VI 2016 16,000,000 17,942,244 9,933,321 23,257,110 2.17 21.9%Ares Corporate Opportunities Fund V 2017 10,000,000 9,994,044 1,901,970 9,105,485 1.12 5.0%BC European Capital X 2017 11,083,403 10,124,417 189,057 14,659,664 1.47 19.4%CVC Capital Partners VII 2017 19,077,331 12,356,721 277,357 15,539,996 1.29 19.4%Green Equity Investors VII 2017 10,000,000 8,857,262 1,566,645 13,882,349 1.90 25.1%KKR Americas Fund XII 2017 16,000,000 10,382,574 1,127,523 20,174,550 2.11 40.9%Palladium Equity Partners V 2017 10,000,000 5,280,822 90,997 5,535,419 1.07 5.1%Warburg Pincus Financial Sector 2017 13,000,000 10,376,645 663,000 12,771,606 1.31 16.9%Apollo Investment Fund IX 2018 32,000,000 9,284,091 2,035,239 10,467,448 1.40 26.8%ASF VIII B 2018 21,000,000 4,330,588 63,584 7,009,198 1.63 56.3%Bridgepoint Europe VI 2018 15,388,972 5,749,527 1,111,261 5,770,771 1.20 NMEQT VIII 2018 14,145,141 10,446,418 844,935 14,099,181 1.47 32.3%EQT VIII (Co-Invest) 2018 4,882,193 2,564,771 - 3,670,583 1.43 21.4%ICG Strategic Equity Fund III 2018 13,340,000 8,140,596 - 11,881,403 1.46 NMLexington Capital Partners IX 2018 12,375,000 4,316,201 862,877 5,654,984 1.59 NMPlatinum Equity Capital Partners IV Co-Investment 2018 1,050,000 1,052,043 209,317 1,308,573 1.44 16.5%Platinum Equity Small Cap Fund 2018 10,000,000 4,765,875 154,242 3,750,000 0.81 -17.7%Siris Partners IV 2018 10,000,000 5,541,275 827,114 5,757,064 1.21 12.2%Vista Equity Partners Fund VII 2018 20,500,000 12,437,448 47,788 13,187,977 1.06 6.6%Apax X USD 2019 12,500,000 1,291,250 - 2,275,307 1.76 NMASF VIII B NYC Co-Invest 2019 10,500,000 712,328 - 1,582,962 2.22 102.1%Bridgepoint Europe VI Co-Invest 2019 3,847,243 2,127,148 - 2,389,280 1.12 NMKKR European Fund V (USD) 2019 9,950,000 4,207,030 164,111 4,097,615 1.01 NMNYCBERS - 2019 Emerging Manager Program 2019 10,500,000 3,645,254 101,069 4,454,379 1.26 NMWarburg Pincus Global Growth 2019 15,000,000 7,370,158 108,750 8,284,664 1.14 16.8%WCAS XIII 2019 10,000,000 2,324,398 - 2,613,261 1.12 17.6%Clearlake Capital Partners VI 2020 10,000,000 4,852,031 83,386 5,408,100 1.13 NMCrestview Partners IV 2020 8,000,000 433,087 - 1,234,146 2.85 NMCrestview Partners IV Co-Invest 2020 2,666,667 144,362 - 479,672 3.32 NMEQT IX 2020 19,643,000 4,332,757 9,225 5,371,716 1.24 NMEQT IX (Co-Invest) 2020 5,357,000 - - (22,894) N/A N/AFTV VI 2020 3,500,000 1,435,000 - 2,151,189 1.50 NM
Information provided by the New York City Board of Education Retirement System Consultants
Alternative Assets Manager Performance Detail
Through March 31, 2021
New York City Board of Education Retirement System 50Performance Overview as of March 31, 2021
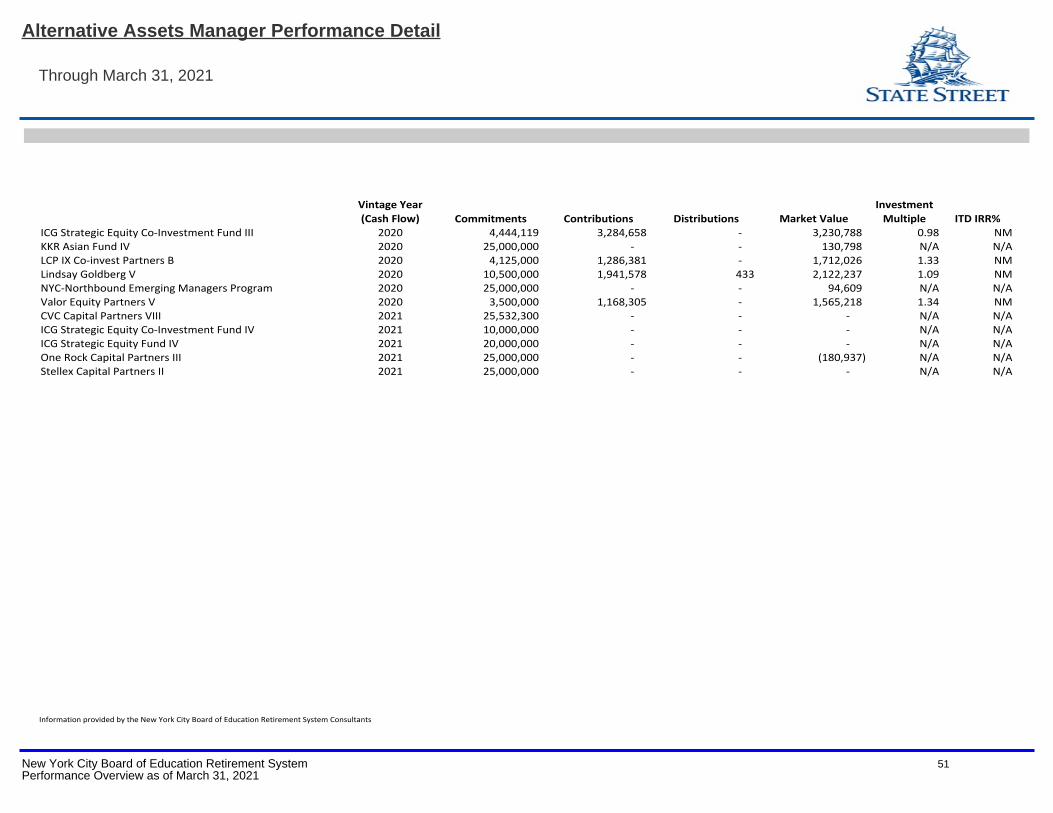
Vintage Year (Cash Flow) Commitments Contributions Distributions Market Value
Investment Multiple ITD IRR%
ICG Strategic Equity Co-Investment Fund III 2020 4,444,119 3,284,658 - 3,230,788 0.98 NMKKR Asian Fund IV 2020 25,000,000 - - 130,798 N/A N/ALCP IX Co-invest Partners B 2020 4,125,000 1,286,381 - 1,712,026 1.33 NMLindsay Goldberg V 2020 10,500,000 1,941,578 433 2,122,237 1.09 NMNYC-Northbound Emerging Managers Program 2020 25,000,000 - - 94,609 N/A N/AValor Equity Partners V 2020 3,500,000 1,168,305 - 1,565,218 1.34 NMCVC Capital Partners VIII 2021 25,532,300 - - - N/A N/AICG Strategic Equity Co-Investment Fund IV 2021 10,000,000 - - - N/A N/AICG Strategic Equity Fund IV 2021 20,000,000 - - - N/A N/AOne Rock Capital Partners III 2021 25,000,000 - - (180,937) N/A N/AStellex Capital Partners II 2021 25,000,000 - - - N/A N/A
Information provided by the New York City Board of Education Retirement System Consultants
Alternative Assets Manager Performance Detail
Through March 31, 2021
New York City Board of Education Retirement System 51Performance Overview as of March 31, 2021
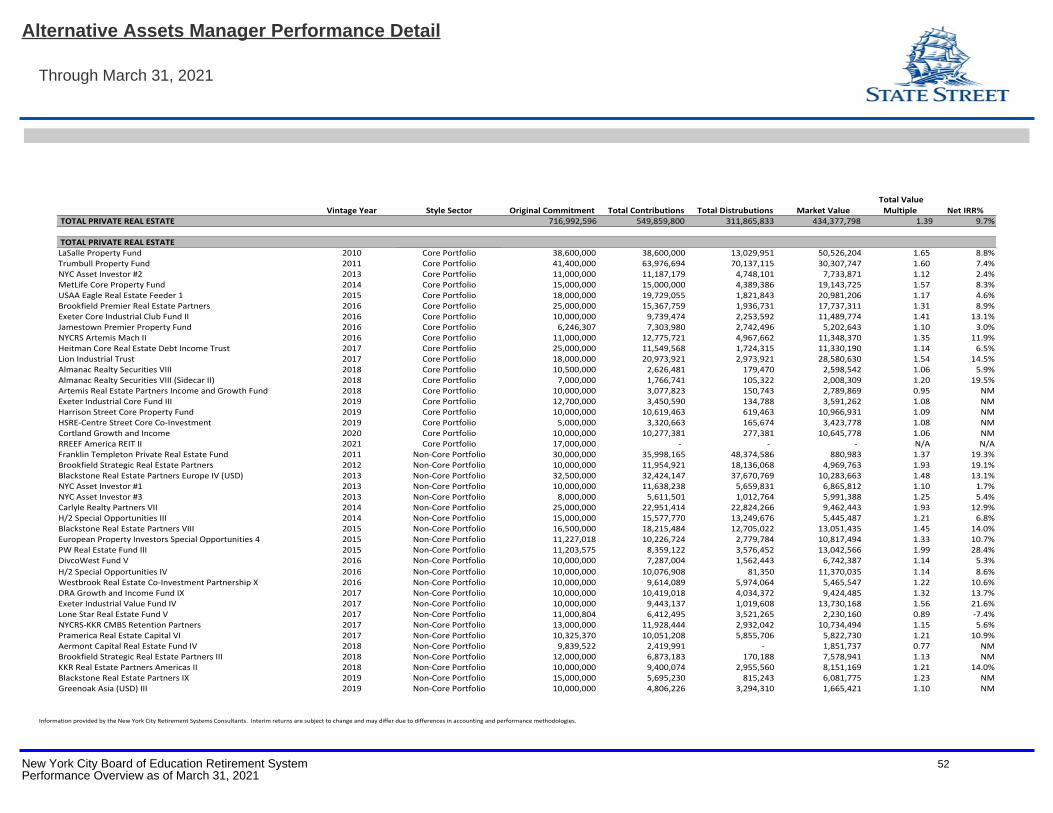
Vintage Year Style Sector Original Commitment Total Contributions Total Distrubutions Market Value
Total Value
Multiple Net IRR% TOTAL PRIVATE REAL ESTATE 716,992,596 549,859,800 311,865,833 434,377,798 1.39 9.7%
TOTAL PRIVATE REAL ESTATE LaSalle Property Fund 2010 Core Portfolio 38,600,000 38,600,000 13,029,951 50,526,204 1.65 8.8%Trumbull Property Fund 2011 Core Portfolio 41,400,000 63,976,694 70,137,115 30,307,747 1.60 7.4%NYC Asset Investor #2 2013 Core Portfolio 11,000,000 11,187,179 4,748,101 7,733,871 1.12 2.4%MetLife Core Property Fund 2014 Core Portfolio 15,000,000 15,000,000 4,389,386 19,143,725 1.57 8.3%USAA Eagle Real Estate Feeder 1 2015 Core Portfolio 18,000,000 19,729,055 1,821,843 20,981,206 1.17 4.6%Brookfield Premier Real Estate Partners 2016 Core Portfolio 25,000,000 15,367,759 1,936,731 17,737,311 1.31 8.9%Exeter Core Industrial Club Fund II 2016 Core Portfolio 10,000,000 9,739,474 2,253,592 11,489,774 1.41 13.1%Jamestown Premier Property Fund 2016 Core Portfolio 6,246,307 7,303,980 2,742,496 5,202,643 1.10 3.0%NYCRS Artemis Mach II 2016 Core Portfolio 11,000,000 12,775,721 4,967,662 11,348,370 1.35 11.9%Heitman Core Real Estate Debt Income Trust 2017 Core Portfolio 25,000,000 11,549,568 1,724,315 11,330,190 1.14 6.5%Lion Industrial Trust 2017 Core Portfolio 18,000,000 20,973,921 2,973,921 28,580,630 1.54 14.5%Almanac Realty Securities VIII 2018 Core Portfolio 10,500,000 2,626,481 179,470 2,598,542 1.06 5.9%Almanac Realty Securities VIII (Sidecar II) 2018 Core Portfolio 7,000,000 1,766,741 105,322 2,008,309 1.20 19.5%Artemis Real Estate Partners Income and Growth Fund 2018 Core Portfolio 10,000,000 3,077,823 150,743 2,789,869 0.95 NMExeter Industrial Core Fund III 2019 Core Portfolio 12,700,000 3,450,590 134,788 3,591,262 1.08 NMHarrison Street Core Property Fund 2019 Core Portfolio 10,000,000 10,619,463 619,463 10,966,931 1.09 NMHSRE-Centre Street Core Co-Investment 2019 Core Portfolio 5,000,000 3,320,663 165,674 3,423,778 1.08 NMCortland Growth and Income 2020 Core Portfolio 10,000,000 10,277,381 277,381 10,645,778 1.06 NMRREEF America REIT II 2021 Core Portfolio 17,000,000 - - - N/A N/AFranklin Templeton Private Real Estate Fund 2011 Non‐Core Portfolio 30,000,000 35,998,165 48,374,586 880,983 1.37 19.3%Brookfield Strategic Real Estate Partners 2012 Non‐Core Portfolio 10,000,000 11,954,921 18,136,068 4,969,763 1.93 19.1%Blackstone Real Estate Partners Europe IV (USD) 2013 Non‐Core Portfolio 32,500,000 32,424,147 37,670,769 10,283,663 1.48 13.1%NYC Asset Investor #1 2013 Non‐Core Portfolio 10,000,000 11,638,238 5,659,831 6,865,812 1.10 1.7%NYC Asset Investor #3 2013 Non‐Core Portfolio 8,000,000 5,611,501 1,012,764 5,991,388 1.25 5.4%Carlyle Realty Partners VII 2014 Non‐Core Portfolio 25,000,000 22,951,414 22,824,266 9,462,443 1.93 12.9%H/2 Special Opportunities III 2014 Non‐Core Portfolio 15,000,000 15,577,770 13,249,676 5,445,487 1.21 6.8%Blackstone Real Estate Partners VIII 2015 Non‐Core Portfolio 16,500,000 18,215,484 12,705,022 13,051,435 1.45 14.0%European Property Investors Special Opportunities 4 2015 Non‐Core Portfolio 11,227,018 10,226,724 2,779,784 10,817,494 1.33 10.7%PW Real Estate Fund III 2015 Non‐Core Portfolio 11,203,575 8,359,122 3,576,452 13,042,566 1.99 28.4%DivcoWest Fund V 2016 Non‐Core Portfolio 10,000,000 7,287,004 1,562,443 6,742,387 1.14 5.3%
H/2 Special Opportunities IV 2016 Non‐Core Portfolio 10,000,000 10,076,908 81,350 11,370,035 1.14 8.6%Westbrook Real Estate Co-Investment Partnership X 2016 Non‐Core Portfolio 10,000,000 9,614,089 5,974,064 5,465,547 1.22 10.6%DRA Growth and Income Fund IX 2017 Non‐Core Portfolio 10,000,000 10,419,018 4,034,372 9,424,485 1.32 13.7%Exeter Industrial Value Fund IV 2017 Non‐Core Portfolio 10,000,000 9,443,137 1,019,608 13,730,168 1.56 21.6%Lone Star Real Estate Fund V 2017 Non‐Core Portfolio 11,000,804 6,412,495 3,521,265 2,230,160 0.89 -7.4%NYCRS-KKR CMBS Retention Partners 2017 Non‐Core Portfolio 13,000,000 11,928,444 2,932,042 10,734,494 1.15 5.6%Pramerica Real Estate Capital VI 2017 Non‐Core Portfolio 10,325,370 10,051,208 5,855,706 5,822,730 1.21 10.9%Aermont Capital Real Estate Fund IV 2018 Non‐Core Portfolio 9,839,522 2,419,991 - 1,851,737 0.77 NMBrookfield Strategic Real Estate Partners III 2018 Non‐Core Portfolio 12,000,000 6,873,183 170,188 7,578,941 1.13 NMKKR Real Estate Partners Americas II 2018 Non‐Core Portfolio 10,000,000 9,400,074 2,955,560 8,151,169 1.21 14.0%Blackstone Real Estate Partners IX 2019 Non‐Core Portfolio 15,000,000 5,695,230 815,243 6,081,775 1.23 NMGreenoak Asia (USD) III 2019 Non‐Core Portfolio 10,000,000 4,806,226 3,294,310 1,665,421 1.10 NM
Information provided by the New York City Retirement Systems Consultants. Interim returns are subject to change and may differ due to differences in accounting and performance methodologies.
Alternative Assets Manager Performance Detail
Through March 31, 2021
New York City Board of Education Retirement System 52Performance Overview as of March 31, 2021
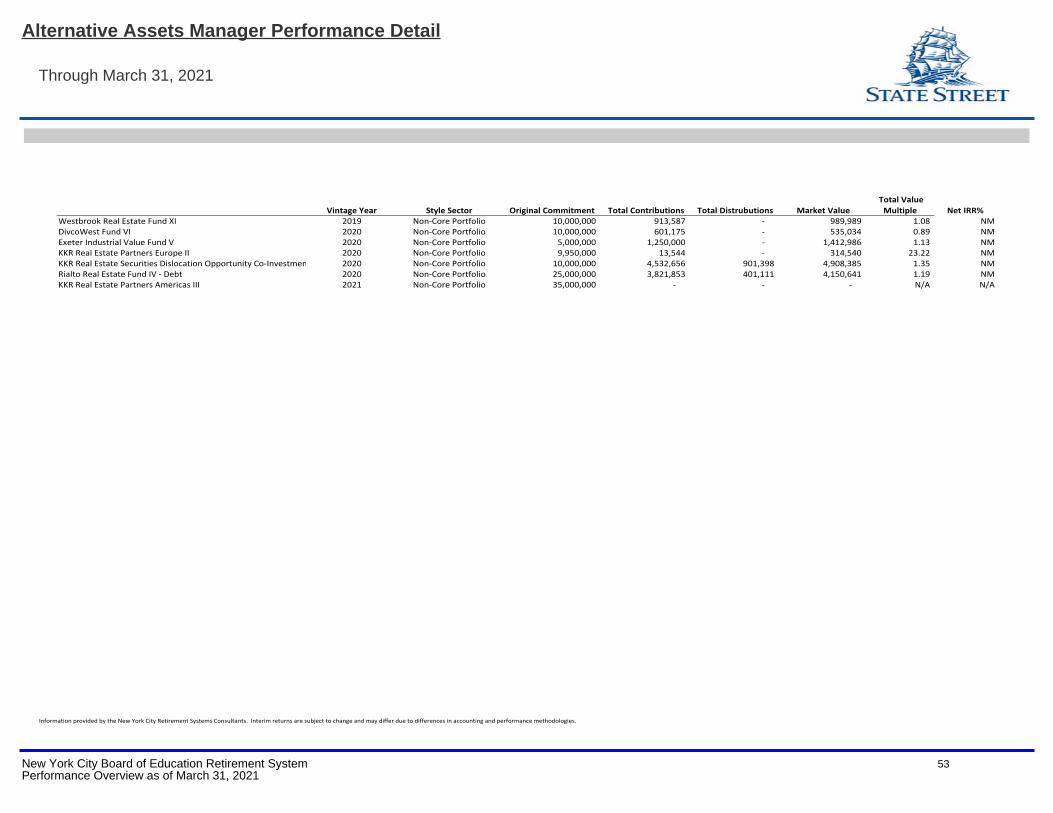
Vintage Year Style Sector Original Commitment Total Contributions Total Distrubutions Market Value
Total Value
Multiple Net IRR%Westbrook Real Estate Fund XI 2019 Non‐Core Portfolio 10,000,000 913,587 - 989,989 1.08 NMDivcoWest Fund VI 2020 Non‐Core Portfolio 10,000,000 601,175 - 535,034 0.89 NMExeter Industrial Value Fund V 2020 Non‐Core Portfolio 5,000,000 1,250,000 - 1,412,986 1.13 NMKKR Real Estate Partners Europe II 2020 Non‐Core Portfolio 9,950,000 13,544 - 314,540 23.22 NMKKR Real Estate Securities Dislocation Opportunity Co-Investment Fund 2020 Non‐Core Portfolio 10,000,000 4,532,656 901,398 4,908,385 1.35 NMRialto Real Estate Fund IV - Debt 2020 Non‐Core Portfolio 25,000,000 3,821,853 401,111 4,150,641 1.19 NMKKR Real Estate Partners Americas III 2021 Non‐Core Portfolio 35,000,000 - - - N/A N/A
Information provided by the New York City Retirement Systems Consultants. Interim returns are subject to change and may differ due to differences in accounting and performance methodologies.
Alternative Assets Manager Performance Detail
Through March 31, 2021
New York City Board of Education Retirement System 53Performance Overview as of March 31, 2021
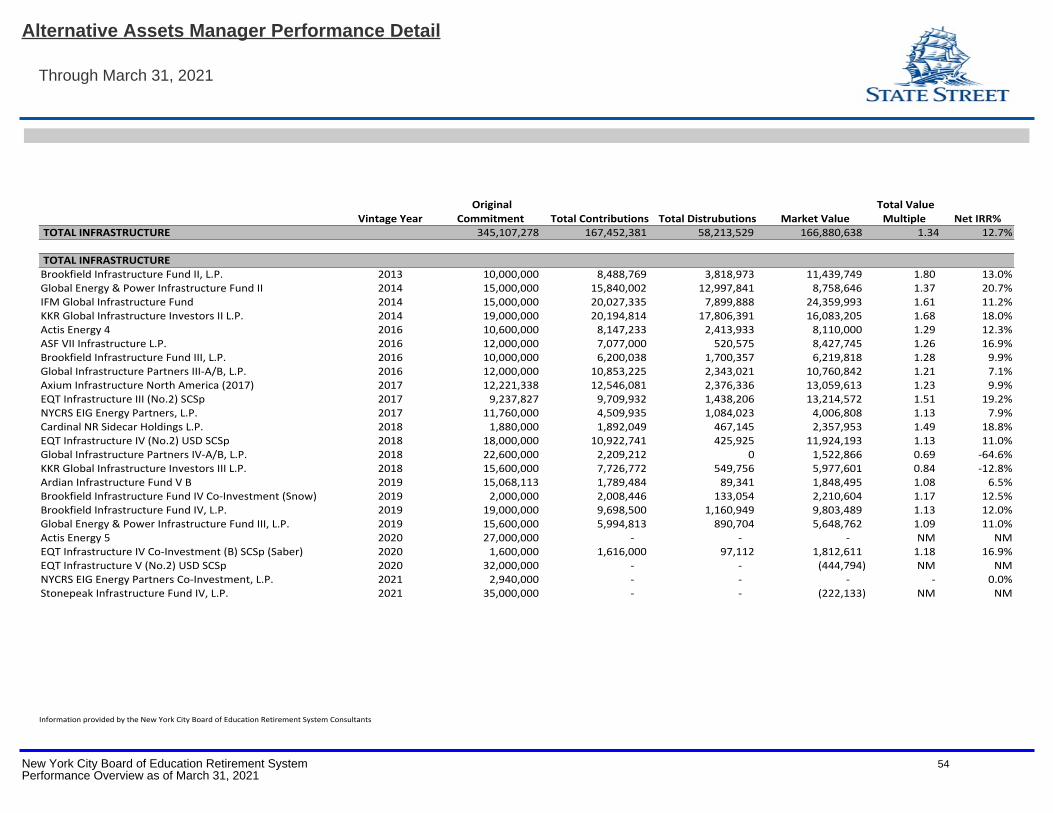
Vintage Year Original
Commitment Total Contributions Total Distrubutions Market Value Total Value
Multiple Net IRR% TOTAL INFRASTRUCTURE 345,107,278 167,452,381 58,213,529 166,880,638 1.34 12.7%
TOTAL INFRASTRUCTURE Brookfield Infrastructure Fund II, L.P. 2013 10,000,000 8,488,769 3,818,973 11,439,749 1.80 13.0%Global Energy & Power Infrastructure Fund II 2014 15,000,000 15,840,002 12,997,841 8,758,646 1.37 20.7%IFM Global Infrastructure Fund 2014 15,000,000 20,027,335 7,899,888 24,359,993 1.61 11.2%KKR Global Infrastructure Investors II L.P. 2014 19,000,000 20,194,814 17,806,391 16,083,205 1.68 18.0%Actis Energy 4 2016 10,600,000 8,147,233 2,413,933 8,110,000 1.29 12.3%ASF VII Infrastructure L.P. 2016 12,000,000 7,077,000 520,575 8,427,745 1.26 16.9%Brookfield Infrastructure Fund III, L.P. 2016 10,000,000 6,200,038 1,700,357 6,219,818 1.28 9.9%Global Infrastructure Partners III-A/B, L.P. 2016 12,000,000 10,853,225 2,343,021 10,760,842 1.21 7.1%Axium Infrastructure North America (2017) 2017 12,221,338 12,546,081 2,376,336 13,059,613 1.23 9.9%EQT Infrastructure III (No.2) SCSp 2017 9,237,827 9,709,932 1,438,206 13,214,572 1.51 19.2%NYCRS EIG Energy Partners, L.P. 2017 11,760,000 4,509,935 1,084,023 4,006,808 1.13 7.9%Cardinal NR Sidecar Holdings L.P. 2018 1,880,000 1,892,049 467,145 2,357,953 1.49 18.8%EQT Infrastructure IV (No.2) USD SCSp 2018 18,000,000 10,922,741 425,925 11,924,193 1.13 11.0%Global Infrastructure Partners IV-A/B, L.P. 2018 22,600,000 2,209,212 0 1,522,866 0.69 -64.6%KKR Global Infrastructure Investors III L.P. 2018 15,600,000 7,726,772 549,756 5,977,601 0.84 -12.8%Ardian Infrastructure Fund V B 2019 15,068,113 1,789,484 89,341 1,848,495 1.08 6.5%Brookfield Infrastructure Fund IV Co-Investment (Snow) 2019 2,000,000 2,008,446 133,054 2,210,604 1.17 12.5%Brookfield Infrastructure Fund IV, L.P. 2019 19,000,000 9,698,500 1,160,949 9,803,489 1.13 12.0%Global Energy & Power Infrastructure Fund III, L.P. 2019 15,600,000 5,994,813 890,704 5,648,762 1.09 11.0%Actis Energy 5 2020 27,000,000 - - - NM NMEQT Infrastructure IV Co-Investment (B) SCSp (Saber) 2020 1,600,000 1,616,000 97,112 1,812,611 1.18 16.9%EQT Infrastructure V (No.2) USD SCSp 2020 32,000,000 - - (444,794) NM NMNYCRS EIG Energy Partners Co-Investment, L.P. 2021 2,940,000 - - - - 0.0%Stonepeak Infrastructure Fund IV, L.P. 2021 35,000,000 - - (222,133) NM NM
Information provided by the New York City Board of Education Retirement System Consultants
Alternative Assets Manager Performance Detail
Through March 31, 2021
New York City Board of Education Retirement System 54Performance Overview as of March 31, 2021
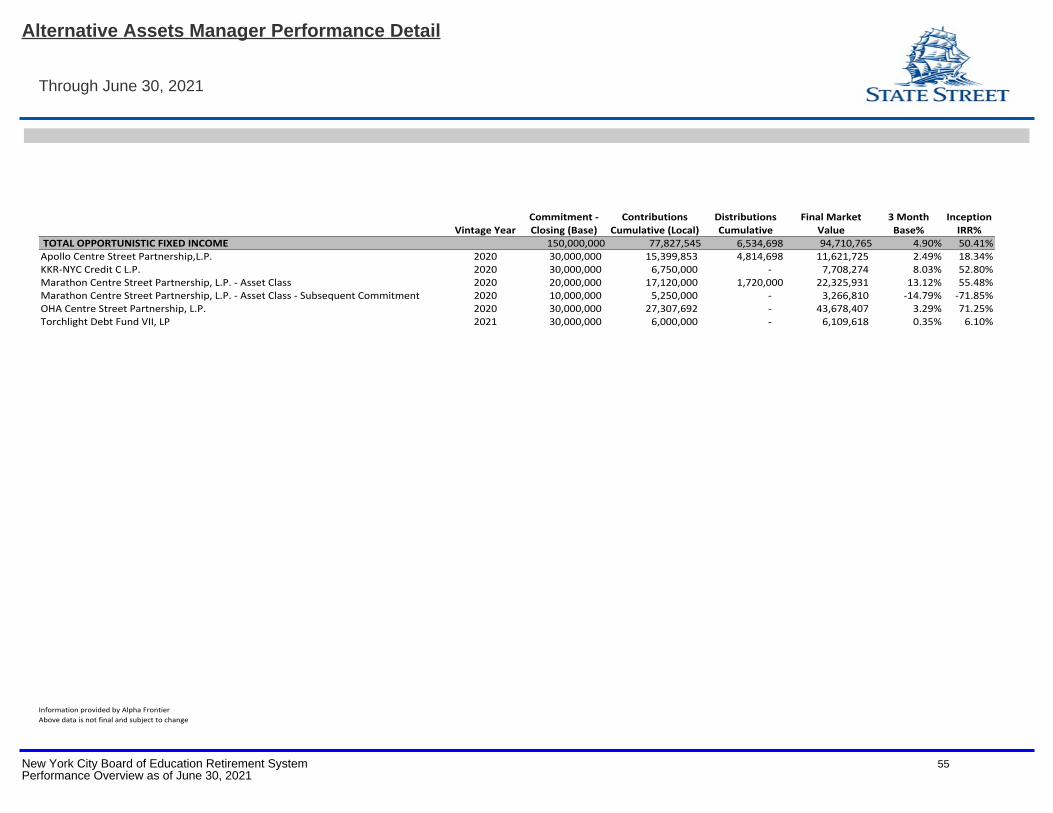
Vintage YearCommitment - Closing (Base)
Contributions Cumulative (Local)
Distributions Cumulative
Final Market Value
3 Month Base%
Inception IRR%
TOTAL OPPORTUNISTIC FIXED INCOME 150,000,000 77,827,545 6,534,698 94,710,765 4.90% 50.41%Apollo Centre Street Partnership,L.P. 2020 30,000,000 15,399,853 4,814,698 11,621,725 2.49% 18.34%KKR-NYC Credit C L.P. 2020 30,000,000 6,750,000 - 7,708,274 8.03% 52.80%Marathon Centre Street Partnership, L.P. - Asset Class 2020 20,000,000 17,120,000 1,720,000 22,325,931 13.12% 55.48%Marathon Centre Street Partnership, L.P. - Asset Class - Subsequent Commitment 2020 10,000,000 5,250,000 - 3,266,810 -14.79% -71.85%OHA Centre Street Partnership, L.P. 2020 30,000,000 27,307,692 - 43,678,407 3.29% 71.25%Torchlight Debt Fund VII, LP 2021 30,000,000 6,000,000 - 6,109,618 0.35% 6.10%
Information provided by Alpha Frontier
Above data is not final and subject to change
Alternative Assets Manager Performance Detail
Through June 30, 2021
New York City Board of Education Retirement System 55Performance Overview as of June 30, 2021
New York CityBoard of Education Retirement System
Appendix D
Footnotes
New York City Board of Education Retirement System 56Performance Overview as of June 30, 2021
General Notes
• Estimated management fees for public market investments are calculated on an accrual basis without adjustment for management fee
caps. Alternative investment (Private Market) fees are recorded on a cash basis and are not inclusive of carried interest paid. Since not
all alternative managers currently provide detailed fee disclosure, the alternative investment fees noted here are not comprehensive.
• Returns greater than 1 year are annualized.
• Public Market returns are Net of Manager Fees for periods after January 2014 and Gross of investment advisory fees for other periods
unless otherwise indicated.
• Public market excess returns for periods prior to 2014 are based on Gross performance.
Page Specific
Page 12 - 17 - Portfolio Asset Allocation
• Rebalancing Ranges: the minimum and maximum weights that actual Asset Allocation may reach before rebalancing between Asset
Classes is necessary.
Pages 18 - 20 - Performance Attribution: Total Plan
• Plan Return at Policy Weights: the return of the Total Plan assuming actual Asset Class results were maintained at target (Adjusted
Policy) weights. Figure = (Return of Asset Class 1* Target Weight) plus (Return Of Asset Class 2* Target Weight) plus (……)
• Allocation Effect = Total Plan Return minus Plan Return At Adjusted Policy Weights. Allocation is the Contribution to Performance
resulting from an overweight or underweight to an asset class. E.g. an underweight to an Asset Class that under-performs results in a
positive Allocation Effect and vice versa.
• Selection Effect = Equal to the Custom Benchmark (Adjusted Policy Index) Return minus Plan Return at Adjusted Policy Weights. This
illustrates how the Managers have added or removed value based on their Security Selection decisions, e.g., If the manager’s Actual
Returns are higher than the Implied Return there will be a positive Selection Effect.
• Policy Index = Custom Benchmark
The “policy index” is a custom benchmark representing the weighted average return of the weighted benchmark indexes for each major
investment program. Weights may reflect an adjustment of actual policy for outstanding commitments for new or revised programs,
such as for private market programs, which are invested gradually, or for any new or updated program requiring the completion of RFPs
and contracts. The policy index/custom benchmark is calculated monthly based on adjusted policy weights at the beginning of each
month.
Glossary of Terms
Through June 30, 2021
New York City Board of Education Retirement System 57Performance Overview as of June 30, 202109/02/2021 08:55:16 AM
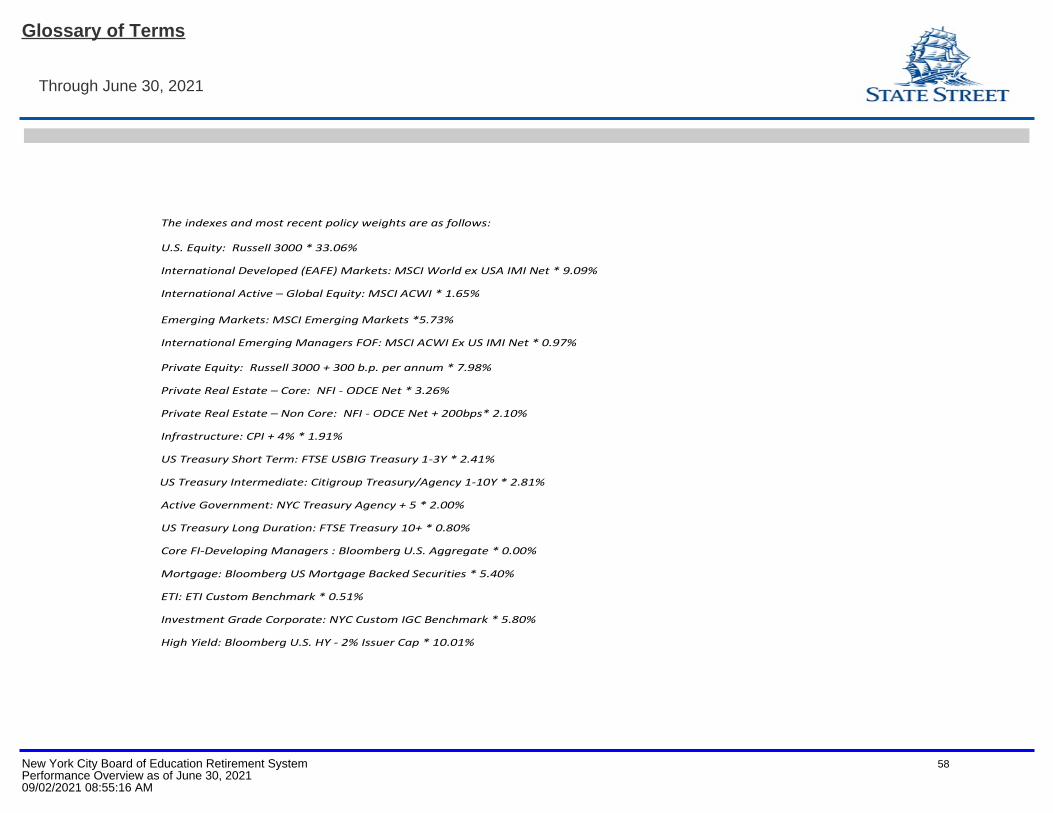
The indexes and most recent policy weights are as follows:
U.S. Equity: Russell 3000 * 33.06%
International Developed (EAFE) Markets: MSCI World ex USA IMI Net * 9.09%
International Active – Global Equity: MSCI ACWI * 1.65%
Emerging Markets: MSCI Emerging Markets *5.73%
International Emerging Managers FOF: MSCI ACWI Ex US IMI Net * 0.97%
Private Equity: Russell 3000 + 300 b.p. per annum * 7.98%
Private Real Estate – Core: NFI - ODCE Net * 3.26%
Private Real Estate – Non Core: NFI - ODCE Net + 200bps* 2.10%
Infrastructure: CPI + 4% * 1.91%
US Treasury Short Term: FTSE USBIG Treasury 1-3Y * 2.41%
US Treasury Intermediate: Citigroup Treasury/Agency 1-10Y * 2.81%
Active Government: NYC Treasury Agency + 5 * 2.00%
US Treasury Long Duration: FTSE Treasury 10+ * 0.80%
Core FI-Developing Managers : Bloomberg U.S. Aggregate * 0.00%
Mortgage: Bloomberg US Mortgage Backed Securities * 5.40%
ETI: ETI Custom Benchmark * 0.51%
Investment Grade Corporate: NYC Custom IGC Benchmark * 5.80%
High Yield: Bloomberg U.S. HY - 2% Issuer Cap * 10.01%
Glossary of Terms
Through June 30, 2021
New York City Board of Education Retirement System 58Performance Overview as of June 30, 202109/02/2021 08:55:16 AM
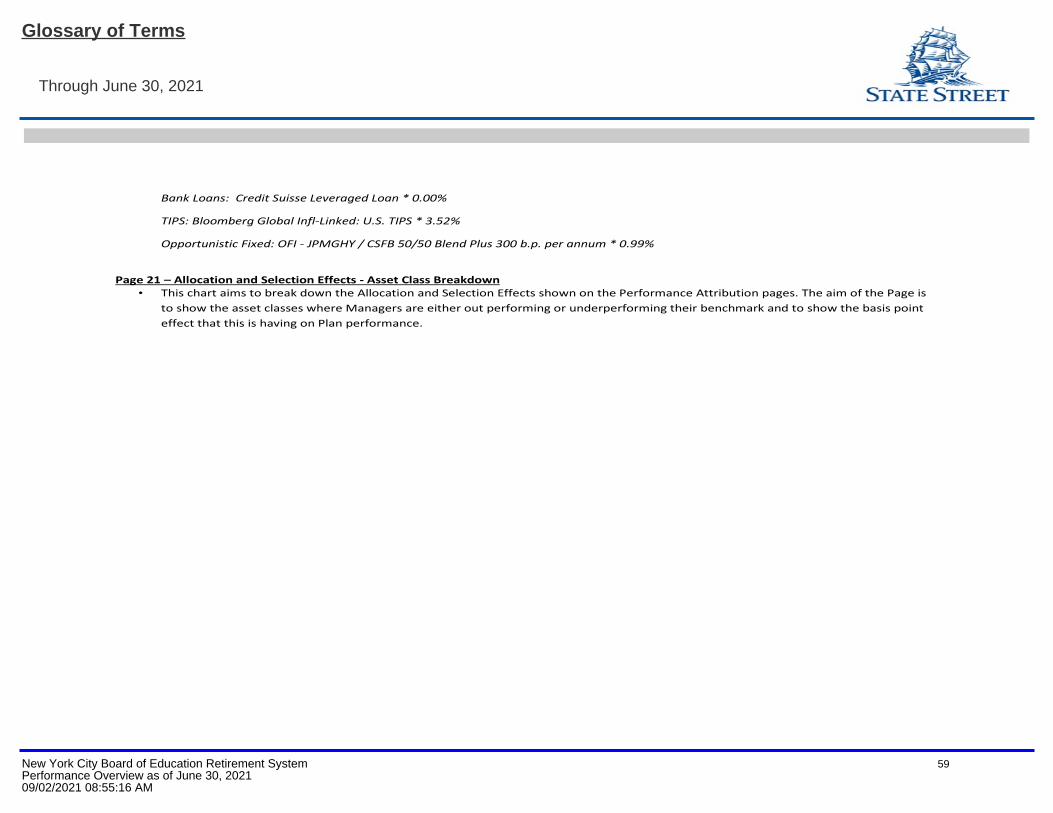
Bank Loans: Credit Suisse Leveraged Loan * 0.00%
TIPS: Bloomberg Global Infl-Linked: U.S. TIPS * 3.52%
Opportunistic Fixed: OFI - JPMGHY / CSFB 50/50 Blend Plus 300 b.p. per annum * 0.99%
Page 21 – Allocation and Selection Effects - Asset Class Breakdown
• This chart aims to break down the Allocation and Selection Effects shown on the Performance Attribution pages. The aim of the Page is
to show the asset classes where Managers are either out performing or underperforming their benchmark and to show the basis point
effect that this is having on Plan performance.
Glossary of Terms
Through June 30, 2021
New York City Board of Education Retirement System 59Performance Overview as of June 30, 202109/02/2021 08:55:16 AM
[1] NYC Developed Value Benchmark: Beginning 8.2017 benchmark changed from MSCI EAFE Value Net to MSCI World ex USA Net Index.[2] NYC Developed Growth Benchmark: Beginning 8.2017 benchmark changed from MSCI EAFE Growth to MSCI World ex USA Net Index.[3] NYC Custom Mortgage Benchmark: Beginning 9.2020 benchmark changed from FTSE Mortgage Index to Bloomberg US Mortgage Backed Securities.[4] NYC Custom IGC Benchmark: Beginning 3.2021 benchmark changed from NYC - Investment Grade Credit to Bloomberg U.S. Corporate Inv Grade.
Footnotes
Through June 30, 2021
New York City Board of Education Retirement System 60Performance Overview as of June 30, 2021