Embed Size (px)
Citation preview

The view in the deep ocean
Martin Stopford President,
Clarkson Research
Marine Money Hamburg 23rd February 2017
New Years Resolutions & Predictions: The shipping markets in 2017

The world in 1966: a few thoughts about the way things change
Martin Stopford, President CRSL 21 February 2017

Martin Stopford, President CRSL 21 February 2017
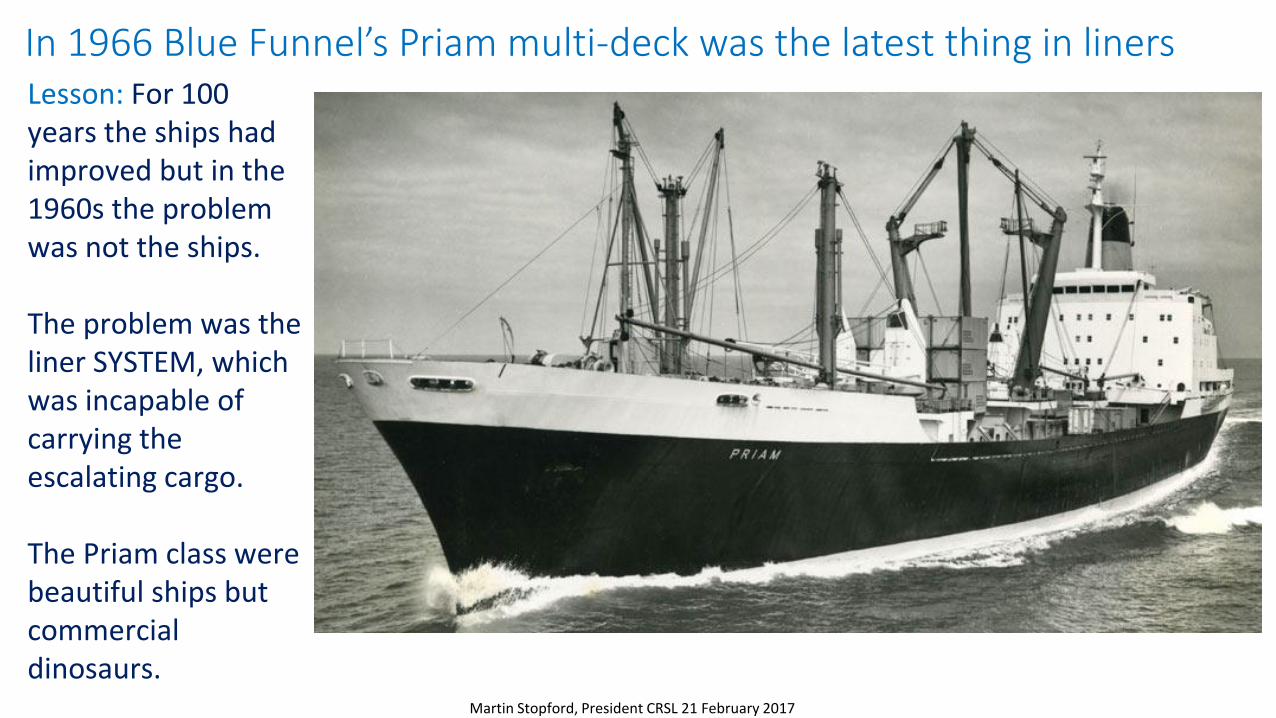
In 1966 Blue Funnel’s Priam multi-deck was the latest thing in liners Lesson: For 100 years the ships had improved but in the 1960s the problem was not the ships. The problem was the liner SYSTEM, which was incapable of carrying the escalating cargo. The Priam class were beautiful ships but commercial dinosaurs.

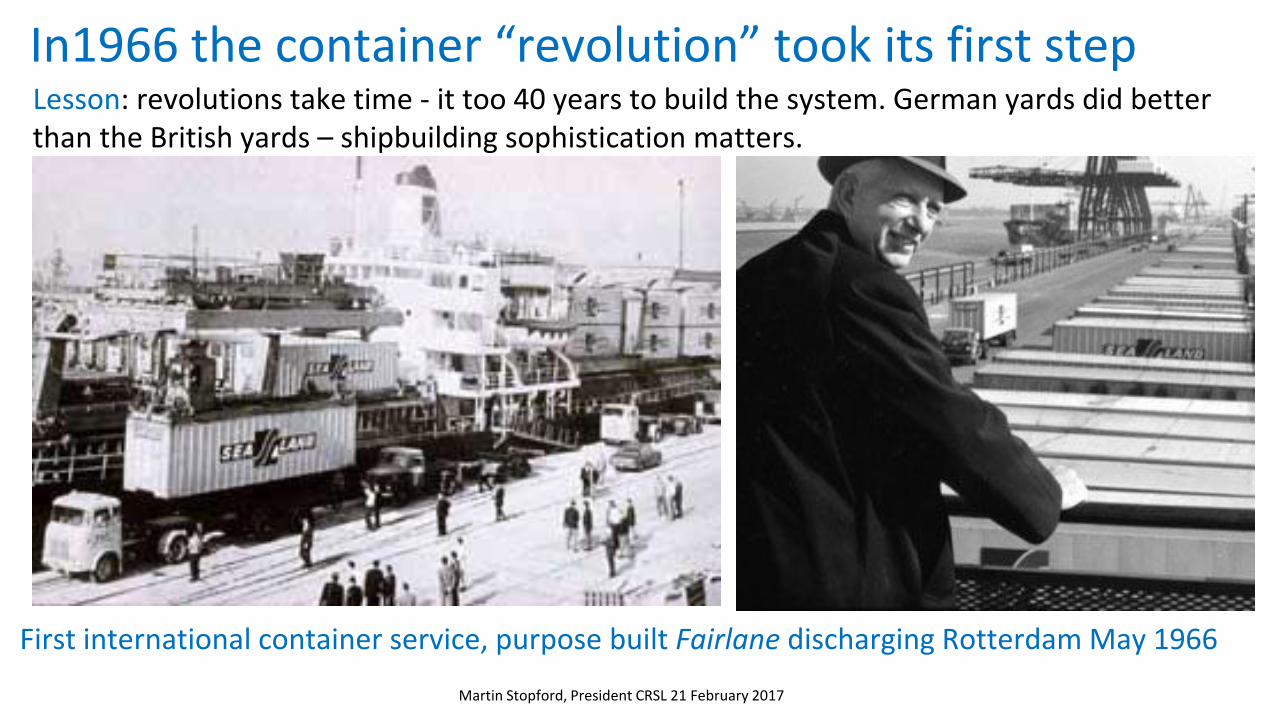
Lesson: revolutions take time - it too 40 years to build the system. German yards did better than the British yards – shipbuilding sophistication matters.
First international container service, purpose built Fairlane discharging Rotterdam May 1966
In1966 the container “revolution” took its first step
Martin Stopford, President CRSL 21 February 2017

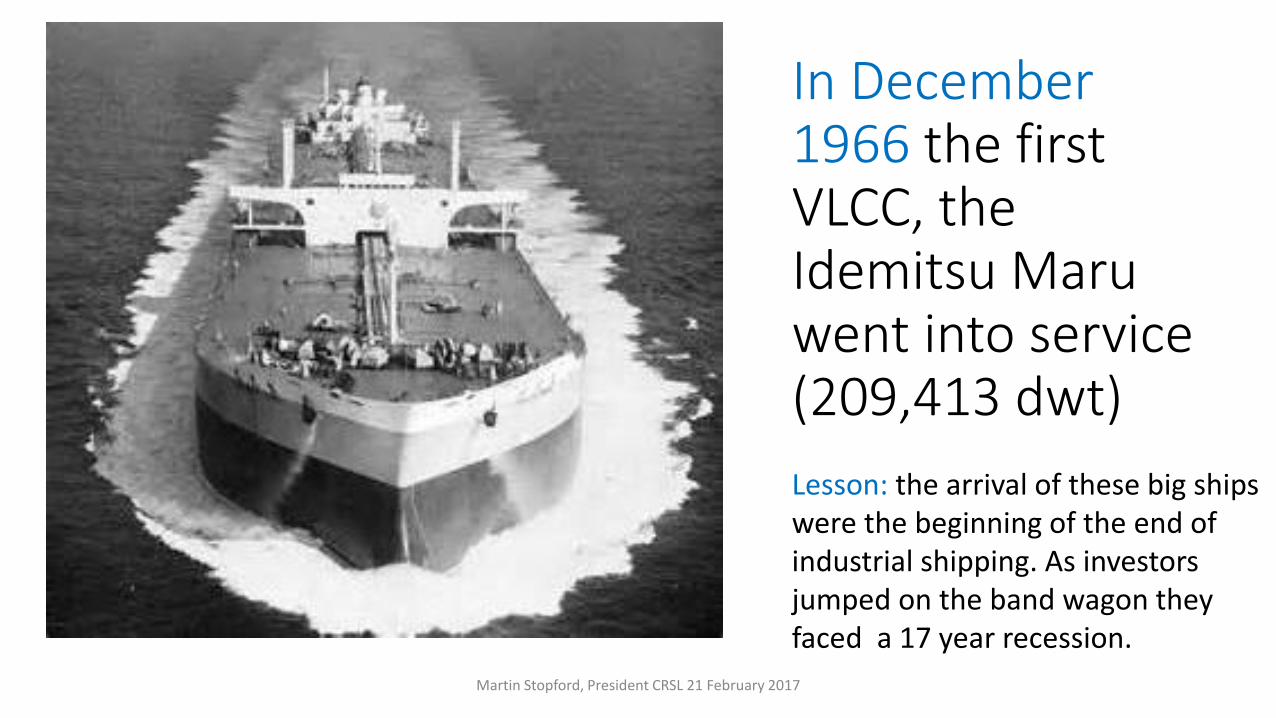
In December 1966 the first VLCC, the Idemitsu Maru went into service (209,413 dwt)
Martin Stopford, President CRSL 21 February 2017
Lesson: the arrival of these big ships were the beginning of the end of industrial shipping. As investors jumped on the band wagon they faced a 17 year recession.

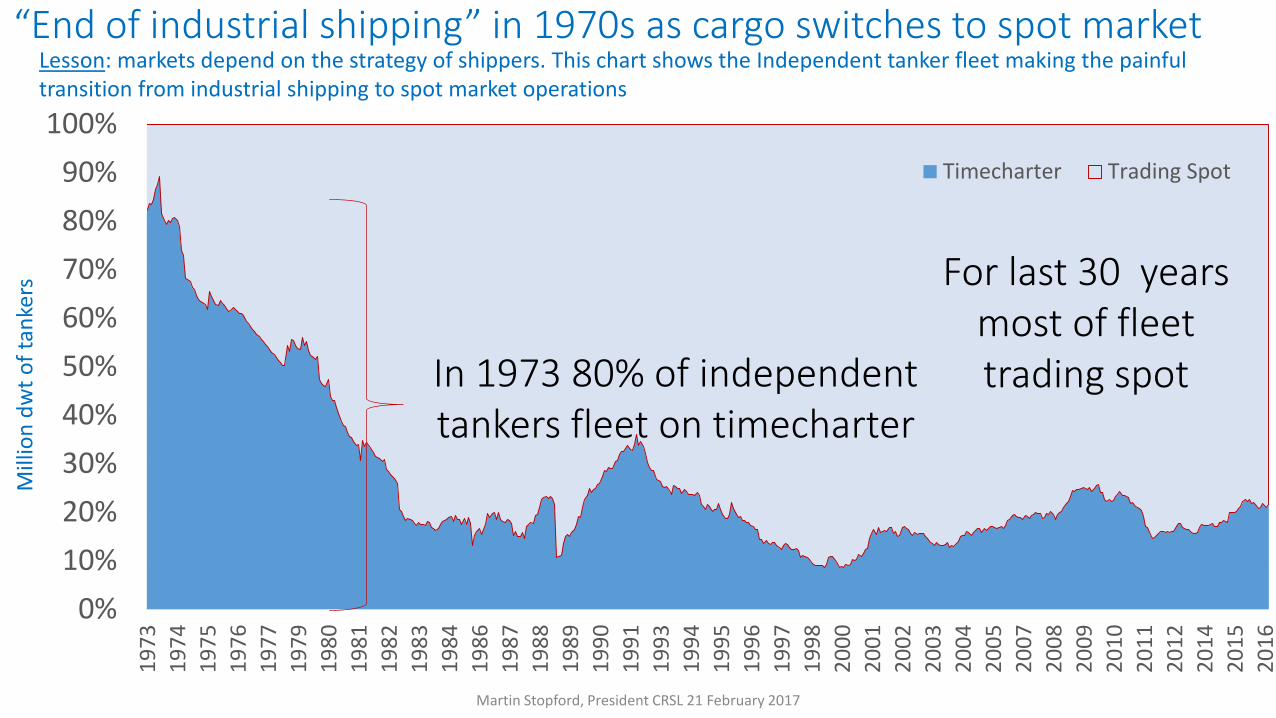
“End of industrial shipping” in 1970s as cargo switches to spot market
Martin Stopford, President CRSL 21 February 2017
Mill
ion
dw
t o
f ta
nke
rs
0%
10%
20%
30%
40%
50%
60%
70%
80%
90%
100%1
97
3
19
74
19
75
19
76
19
77
19
79
19
80
19
81
19
82
19
83
19
84
19
86
19
87
19
88
19
89
19
90
19
91
19
93
19
94
19
95
19
96
19
97
19
98
20
00
20
01
20
02
20
03
20
04
20
05
20
07
20
08
20
09
20
10
20
11
20
12
20
14
20
15
20
16
Timecharter Trading Spot
For last 30 years most of fleet trading spot In 1973 80% of independent
tankers fleet on timecharter
Lesson: markets depend on the strategy of shippers. This chart shows the Independent tanker fleet making the painful transition from industrial shipping to spot market operations

1. Shipping cycles getting longer 2. Sea trade growth changing 3. World Shipyard capacity 4. The zero emissions challenge 5. Digital revolution in shipping.
SHIPPING MARKET TODAY, RESOLUTIONS MADE TO BE BROKEN?
Martin Stopford, President CRSL 21 February 2017

1. Shipping cycles getting longer
In today’s simplistic business model, cycles are the drivers of change
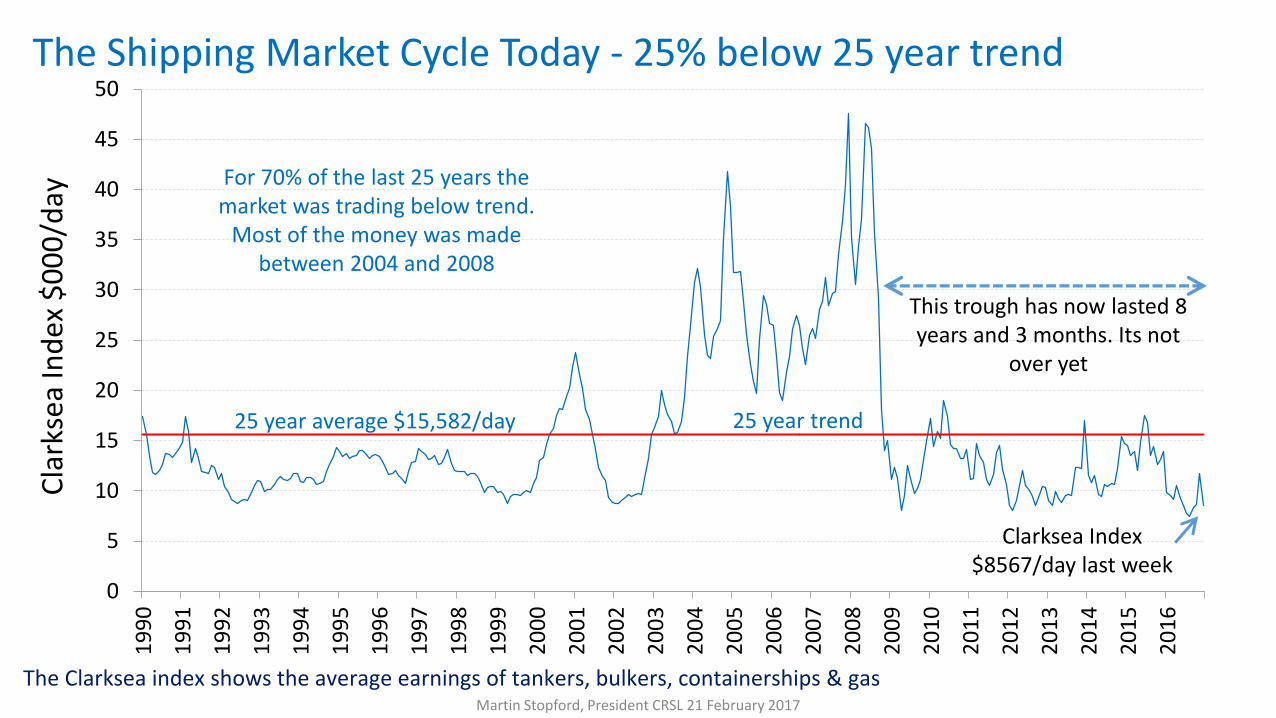
The Shipping Market Cycle Today - 25% below 25 year trend
0
5
10
15
20
25
30
35
40
45
50
19
90
19
91
19
92
19
93
19
94
19
95
19
96
19
97
19
98
19
99
20
00
20
01
20
02
20
03
20
04
20
05
20
06
20
07
20
08
20
09
20
10
20
11
20
12
20
13
20
14
20
15
20
16
Cla
rkse
a In
dex
$0
00
/day
The Clarksea index shows the average earnings of tankers, bulkers, containerships & gas
Clarksea Index $8567/day last week
25 year trend 25 year average $15,582/day
For 70% of the last 25 years the market was trading below trend.
Most of the money was made between 2004 and 2008
This trough has now lasted 8 years and 3 months. Its not
over yet
Martin Stopford, President CRSL 21 February 2017
1-Mar-17 10 © Marecon Ltd wwww.maritimelectures.com © Marecon Ltd
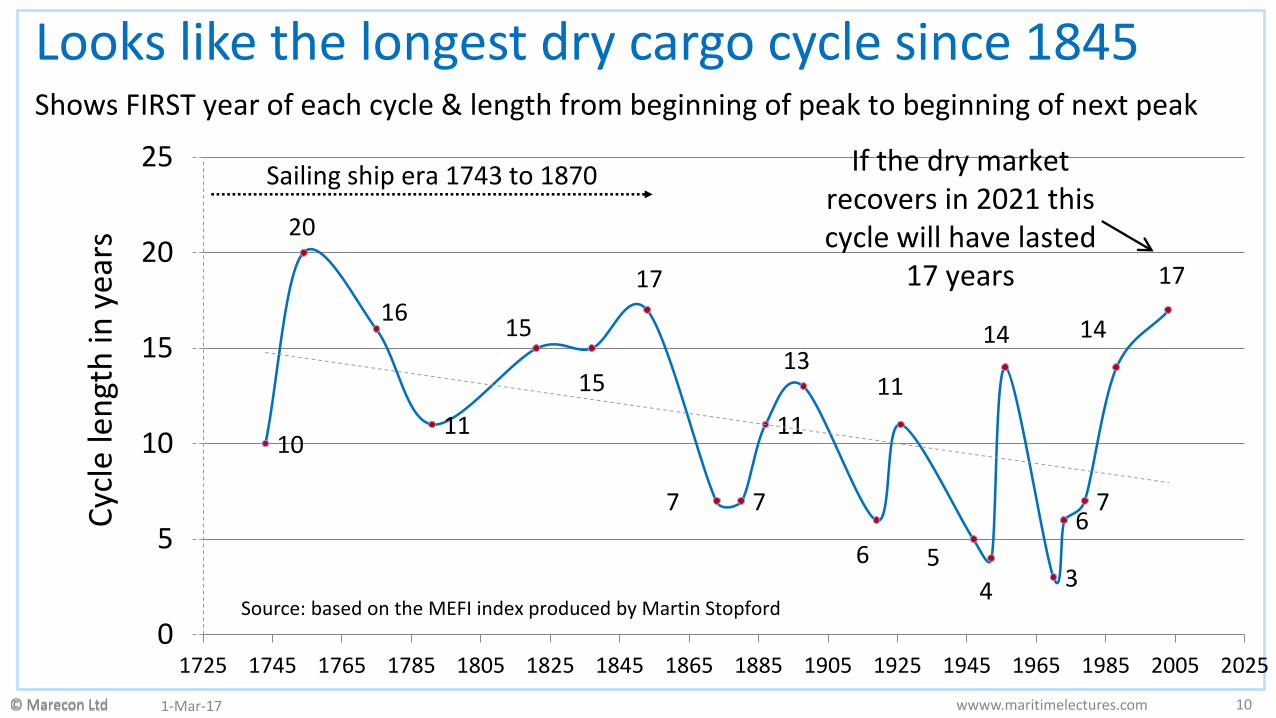
Looks like the longest dry cargo cycle since 1845
10
20
16
11
15
15
17
7 7
11
13
6
11
5
4
14
3
6 7
14
17
0
5
10
15
20
25
1725 1745 1765 1785 1805 1825 1845 1865 1885 1905 1925 1945 1965 1985 2005 2025
If the dry market recovers in 2021 this cycle will have lasted
17 years
Cyc
le le
ngt
h in
yea
rs
Sailing ship era 1743 to 1870
Source: based on the MEFI index produced by Martin Stopford
Shows FIRST year of each cycle & length from beginning of peak to beginning of next peak

1-Mar-17 11 © Marecon Ltd wwww.maritimelectures.com © Marecon Ltd
0
10
20
30
40
50
60
70
80
90
100
19
76
19
78
19
80
19
82
19
84
19
86
19
88
19
90
19
92
19
94
19
96
19
98
20
00
20
02
20
04
20
06
20
08
20
10
20
12
20
14
20
16
$ m
illio
n p
rice
Aframax 5 year old Panamax 5 year old Linear (Panamax 5 year old)
Typical ship market prices P
rice gap
Dull 1990s
Updated Feb 2017
Distress prices
asset play 87-90
declining market 2009-17
2. Sea trade growth changing
The trend growth rate of trade on a slowing trend

01/03/2017 13
-15.0
-10.0
-5.0
-
5.0
10.0
15.0
20
00
2
00
0
20
01
2
00
1
20
02
2
00
2
20
03
2
00
3
20
04
2
00
4
20
05
2
00
5
20
06
2
00
6
20
07
2
00
7
20
08
2
00
8
20
09
2
00
9
20
10
2
01
0
20
11
2
01
1
20
12
2
01
2
20
13
2
01
3
20
14
2
01
4
20
15
2
01
5
20
16
2
01
6
IND
UST
RIA
L P
RO
DU
CTI
ON
% P
A
World ip % PA
Credit Crisis Dot.com
Crisis
VERY WEAK INDUSTRIAL
GROWTH SINCE 2009
World Industry growth rate to September 2016 – very sluggish
Updated feb 2016

China’s seaborne imports and exports growing slower
0
500
1000
1500
20001
97
0
19
72
19
74
19
76
19
78
19
80
19
82
19
84
19
86
19
88
19
90
19
92
19
94
19
96
19
98
20
00
20
02
20
04
20
06
20
08
20
10
20
12
20
14
20
16
seab
orn
e t
rad
e M
t
Sea imports Sea Exports
Martin Stopford, President CRSL 21 February 2017

Seaborne imports of OECD & Non-OECD countries stagnant
0
1,000
2,000
3,000
4,000
5,000
6,000
7,000
1950 1955 1960 1965 1970 1975 1980 1985 1990 1995 2000 2005 2010 2015
Imp
ort
s –
mill
ion
to
nn
es
Source: data collected by martin stopford from various sources, mainly United Nations and UNCTAD Martin Stopford, President CRSL 21 February 2017

The bulkers & liners struggle with mature technology
5. The bulk & liner revolutions are over
6. Cargo owners have stepped away
7. Designers struggling to improve ships
8. Very big containerships disappointing
OECD share of imports half what it was 50 years ago
0%
10%
20%
30%
40%
50%
60%
70%
80%
90%
1966 1976 1986 1996 2006 2016
OECD Imports Non-OECD Imports
OECD Imports
37%
Non-OECD Imports
63%
OECD Imports
77%
Non- OECD
Imports 23%
1. OECD now imports only 37% of cargo
2. China and Asia driving trade
3. Non-OECD 63% and maybe 75% soon
4. Non-OECD has six times the population
Sea trade growing but OECD losing market share
The future – another revolution desperately needed
9. Shipping investors need a new vision
10. World economy needs new services
Seaborne imports by region (% of world trade)
Martin Stopford, President CRSL 21 February 2017

01/03/2017 17
Sea trade growth edges down - about 2.0% growth likely in 2017
7.3
%
0.7
%
3.0
%
5.7
%
6.6
%
4.5
%
4.8
%
4.5
%
2.5
%
-3.7
%
9.3
%
4.5
%
4.2
%
3.4
%
3.2
%
2.6
%
2.3
%
2.0
%
-4%
-2%
0%
2%
4%
6%
8%
10%
20
00
20
01
20
02
20
03
20
04
20
05
20
06
20
07
20
08
20
09
20
10
20
11
20
12
20
13
20
14
20
15
20
16
20
17
% g
row
th o
f tr
ade
in y
ear
forecast
SEA TRADE % GROWTH SEA TRADE % GROWTH
Weak trade outlook due to slowdown in China;
stagnation in OECD, but hopefully this is the bottom

01/03/2017 18
Sea trade growth edges down – and fleet still growing faster
7.3
%
0.7
%
3.0
%
5.7
%
6.6
%
4.5
%
4.8
%
4.5
%
2.5
%
-3.7
%
9.3
%
4.5
%
4.2
%
3.4
%
3.2
%
2.6
%
2.3
%
2.0
%
1%
3%
2% 2%
3%
6%
7% 7% 7% 7% 7%
9% 9%
6%
4% 3% 3%
3%
-4%
-2%
0%
2%
4%
6%
8%
10%
20
00
20
01
20
02
20
03
20
04
20
05
20
06
20
07
20
08
20
09
20
10
20
11
20
12
20
13
20
14
20
15
20
16
20
17
% g
row
th o
f tr
ade
in y
ear
forecast
WORLD FLEET % GROWTH
SEA TRADE % GROWTH SEA TRADE % GROWTH
1-Mar-17 19 © Marecon Ltd
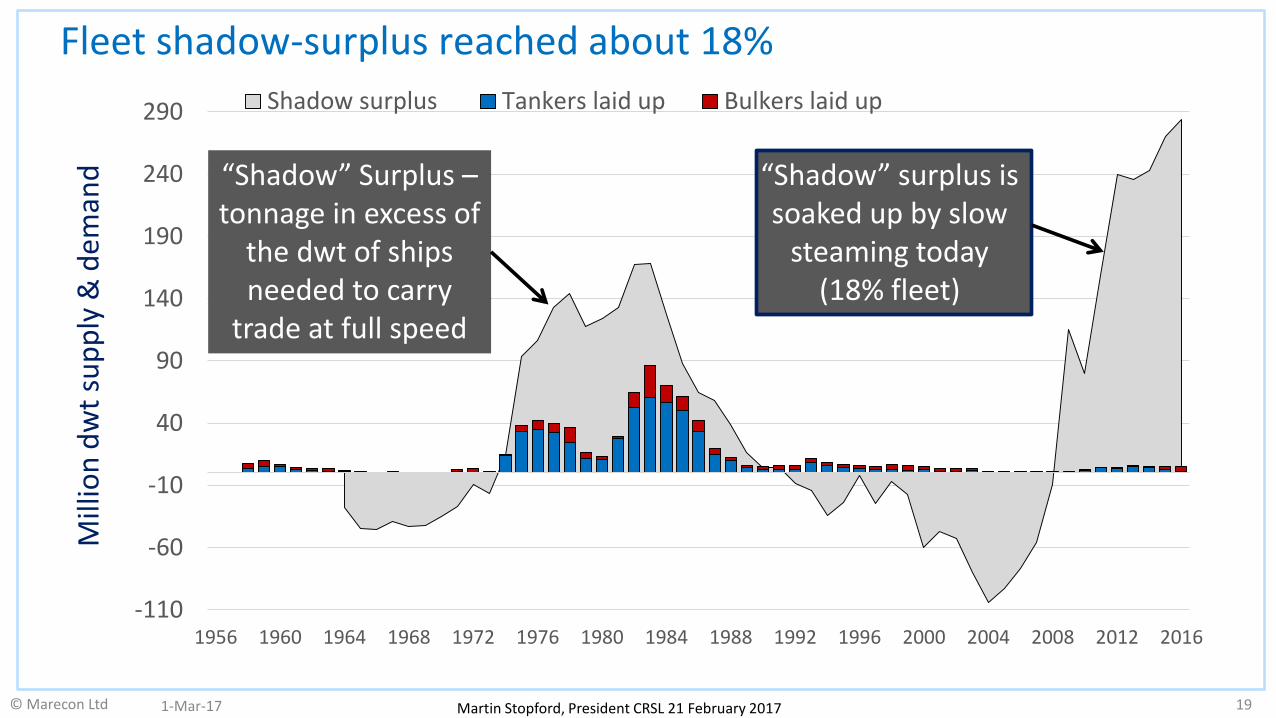
Fleet shadow-surplus reached about 18%
-110
-60
-10
40
90
140
190
240
290
1956 1960 1964 1968 1972 1976 1980 1984 1988 1992 1996 2000 2004 2008 2012 2016
Shadow surplus Tankers laid up Bulkers laid upM
illio
n d
wt
sup
ply
& d
eman
d
“Shadow” surplus is soaked up by slow
steaming today (18% fleet)
“Shadow” Surplus – tonnage in excess of
the dwt of ships needed to carry
trade at full speed
Martin Stopford, President CRSL 21 February 2017
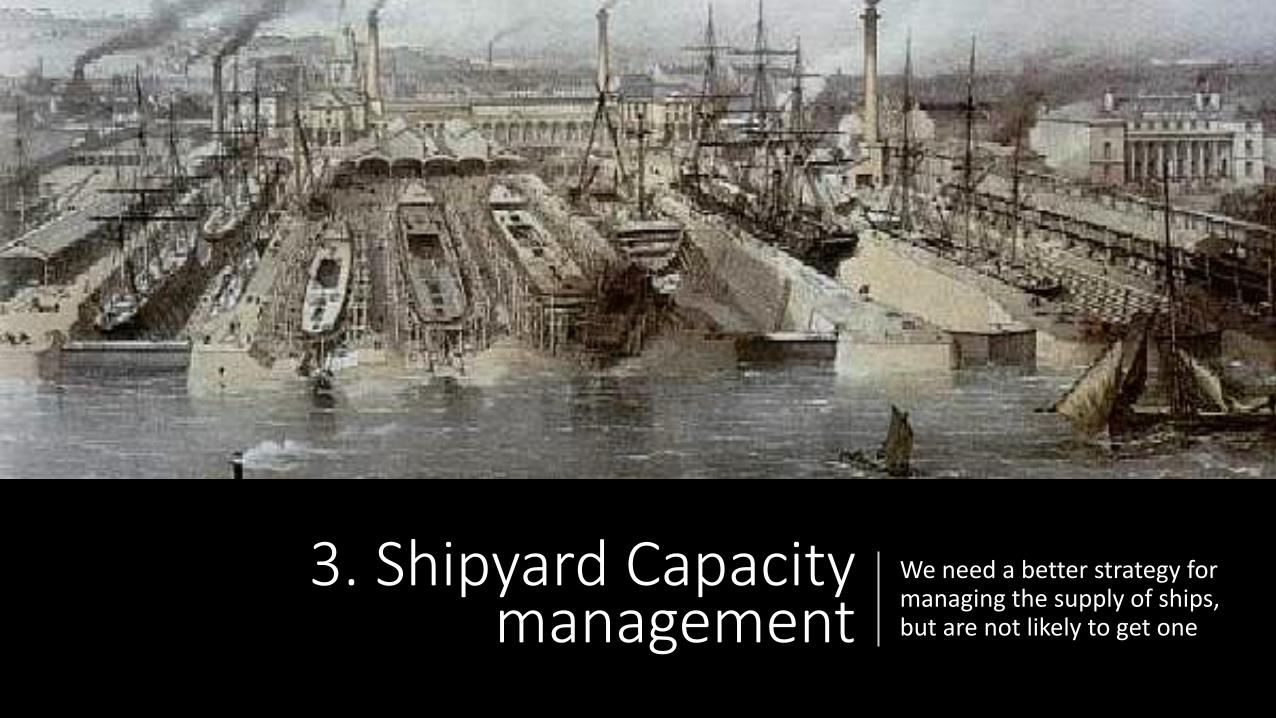
3. Shipyard Capacity management
We need a better strategy for managing the supply of ships, but are not likely to get one

0%
10%
20%
30%
40%
50%
60%
70%
80%
90%
100%
19
02
19
06
19
10
19
14
19
18
19
22
19
26
19
30
19
34
19
38
19
42
19
46
19
50
19
54
19
58
19
62
19
66
19
70
19
74
19
78
19
82
19
86
19
90
19
94
19
98
20
02
20
06
20
10
20
14
% o
f G
RT
Lau
nch
es in
yea
r
Regional Shipbuilding Trends 1902-2015: three dominant builders
Korea
Japan Europe
other countries
GT 37.3%
GT 35.4%
GT 19.1%
GT 2.4%
China
China’s shipbuilding strategy has changed from “getting bigger” to “getting stronger” GT 5.8%
Martin Stopford, President CRSL 21 February 2017
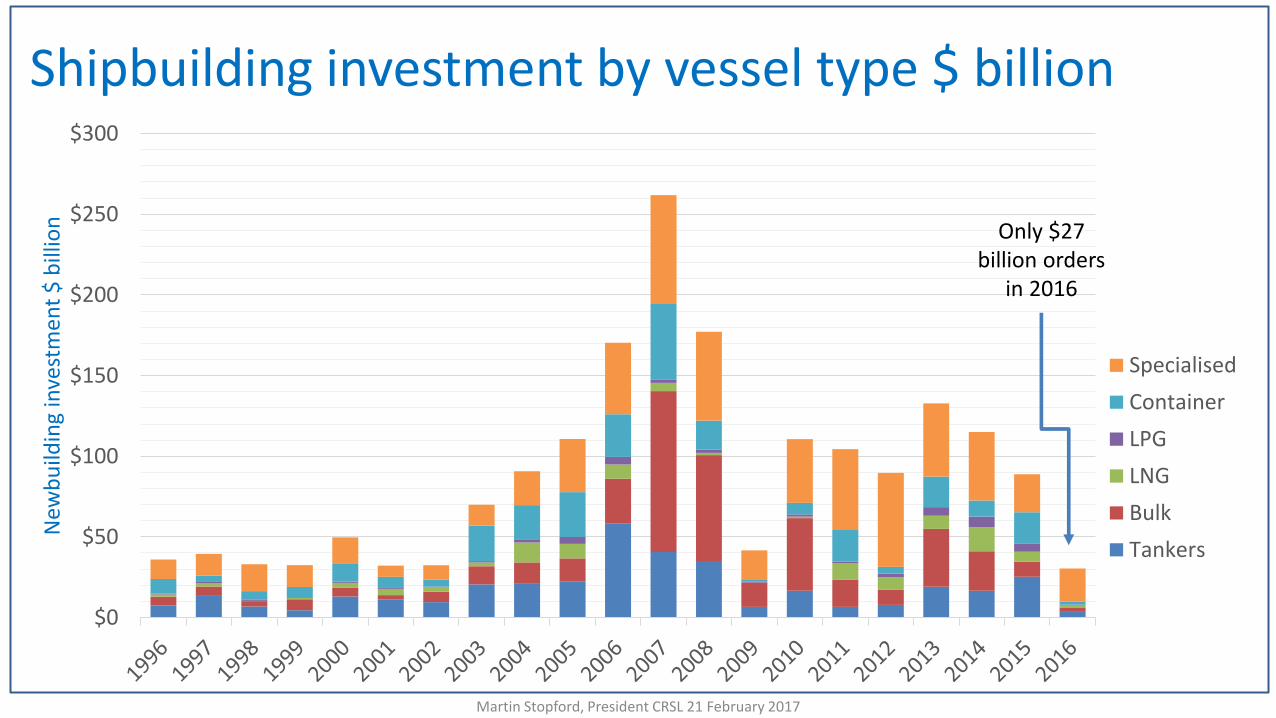
Shipbuilding investment by vessel type $ billion
$0
$50
$100
$150
$200
$250
$300
New
bu
ildin
g in
vest
men
t $
bill
ion
Specialised
Container
LPG
LNG
Bulk
Tankers
Martin Stopford, President CRSL 21 February 2017
Only $27 billion orders
in 2016

Shipbuilding contracts & deliveries 1963-2016
0
50
100
150
200
250
3001
96
3
19
65
19
67
19
69
19
71
19
73
19
75
19
77
19
79
19
81
19
83
19
85
19
87
19
89
19
91
19
93
19
95
19
97
19
99
20
01
20
03
20
05
20
07
20
09
20
11
20
13
20
15
20
17
20
19
Deliveries Delivs Fcst Contracting
deliveries
ORDERS
274m dwt
Mill
ion
dw
t co
ntr
acts
Contracting 27 m dwt in
2016
Martin Stopford, President CRSL 21 February 2017

Ratio of Orderbook to 2016 deliveries in Dwt
• Currently China has an orderbook of 99.7 m dwt and deliveries in 2016 were 33 m dwt, so that is 3 years work
• In contrast S Korea has an orderbook of 51.7 m dwt, compared with 35 m dwt deliveries in 2016. Only 1.24 years work
3.0
1.45
2.8
0.0
0.5
1.0
1.5
2.0
2.5
3.0
3.5
China S Korea JapanSeries 1 Series 2 Series 3
Martin Stopford, President CRSL 21 February 2017

Shipbuilding prices to February 2017
0
20
40
60
80
100
120
140
160
1968 1972 1976 1980 1984 1988 1992 1996 2000 2004 2008 2012 2016
$ m
illio
n p
rice
VLCC Suezmax Aframax Tanker Products
Capesize Panamax Bulk 30,000 dwt bulker 6700 TEU
Source: Compiled from several sources including Fearnleys, CRSL
??
Martin Stopford, President CRSL 21 February 2017

4. The Zero Emissions Challenge
Yamaha have a zero emission bike, but a zero emission cargo ship will need extreme technology

In 2066 seaborne trade could be 46 billion tonnes – or just 16 billion tonnes?
y = 2078e0.0308x
0
5,000
10,000
15,000
20,000
25,000
30,000
35,000
40,000
45,000
50,000
19
66
19
70
19
74
19
78
19
82
19
86
19
90
19
94
19
98
20
02
20
06
20
10
20
14
20
18
20
22
20
26
20
30
20
34
20
38
20
42
20
46
20
50
20
54
20
58
20
62
20
66
Imp
ort
s –
mill
ion
to
nn
es
Source: data collected by martin stopford from various sources, mainly United Nations and UNCTAD Martin Stopford, President CRSL 21 February 2017
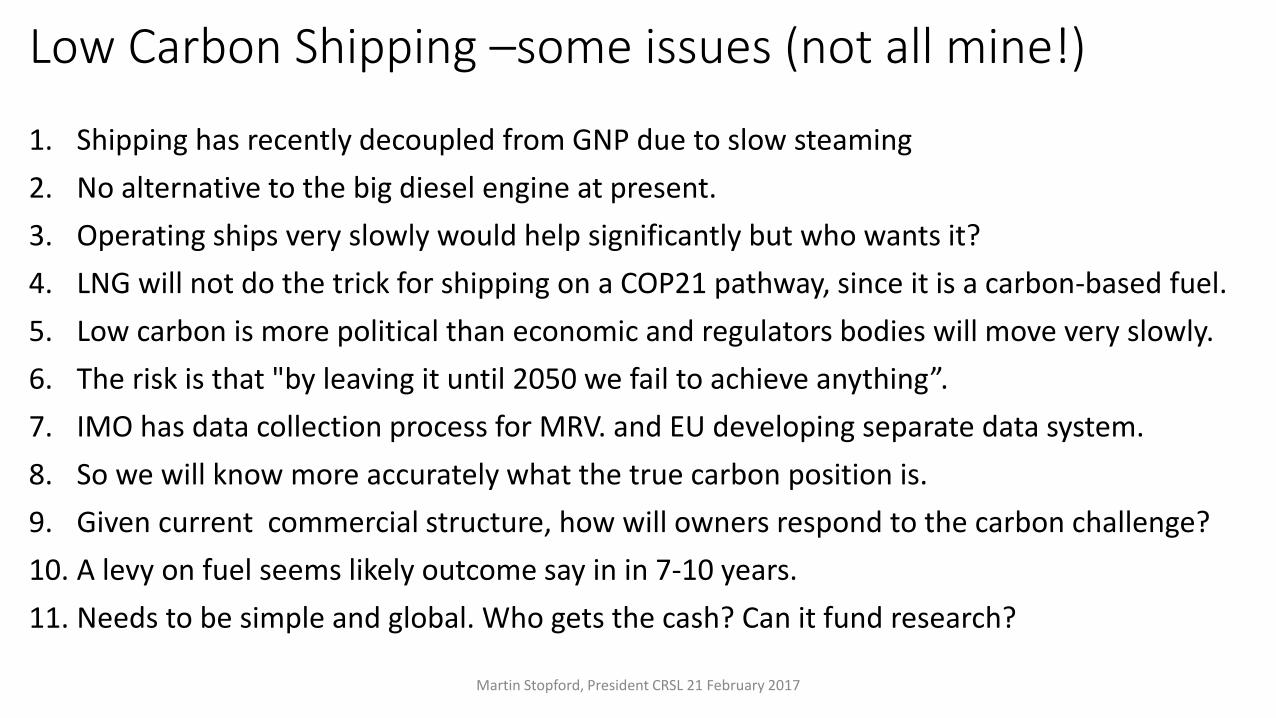
Low Carbon Shipping –some issues (not all mine!)
1. Shipping has recently decoupled from GNP due to slow steaming
2. No alternative to the big diesel engine at present.
3. Operating ships very slowly would help significantly but who wants it?
4. LNG will not do the trick for shipping on a COP21 pathway, since it is a carbon-based fuel.
5. Low carbon is more political than economic and regulators bodies will move very slowly.
6. The risk is that "by leaving it until 2050 we fail to achieve anything”.
7. IMO has data collection process for MRV. and EU developing separate data system.
8. So we will know more accurately what the true carbon position is.
9. Given current commercial structure, how will owners respond to the carbon challenge?
10. A levy on fuel seems likely outcome say in in 7-10 years.
11. Needs to be simple and global. Who gets the cash? Can it fund research?
Martin Stopford, President CRSL 21 February 2017

5. How to harness digital technology
Are we smart enough to use the information & communications technology (ICT) revolution to revolutionize sea transport?
Who is smart?

1. Smart Shipping tackles a historic problem – the global
mobility of ships and limited ship-shore communications.
2. For centuries shipping has been restricted by this
“fragmented” business model which makes each ship a
small management unit.
3. Because companies only employ 1 or 2 people on shore for
each ship at sea, big shipping companies have limited
competitive advantage over small ones.
• Smart shipping can change this because now have the
technology to run a fleet of ships as a “transport factory”
(like a BMW car factory).
Why Smart Shipping is a better investment
Martin Stopford, President CRSL 21 February 2017

S10 : The Smart-Shipping “Toolbox” creates opportunities:-
Martin Stopford, President CRSL 21 February 2017
1.Satellite communication: new INMARSAT Ka band global systems (99% reliable) broad band data to be collected, processed & beamed ashore. Submarine cables too.
2.Telematics: "sensors" & FPGAs generate digital information about equipment & ship - cheaper and better than ever.
3.Data Storage: The cloud provides storage for data generated by sensors. Analyse “Big Data” to improve performance.
4.Smart phone-style apps : to do specific jobs without big computer systems & management information
5.Information systems: management know exactly what’s going on and performance levels. “Deep learning” is getting better.
6.Automation: feedback loops allow automation of many tasks (navigation, maintenance, operations etc)
Railnova information system
Auxiliary sealed & monitored
Young engineer with degree

Three ways change the business Model
1. Smart Ships – with much better QA & efficiency standards;
2. Smart Fleets – which manage the smart ships like a transport factory (e.g. a BMW factory).
3. Smart Global Logistics – which integrate the whole thing door to door
Massively more efficient satellite communications are removing the 5000 year old need to treat the ship as the business unit
Martin Stopford, President CRSL 21 February 2017
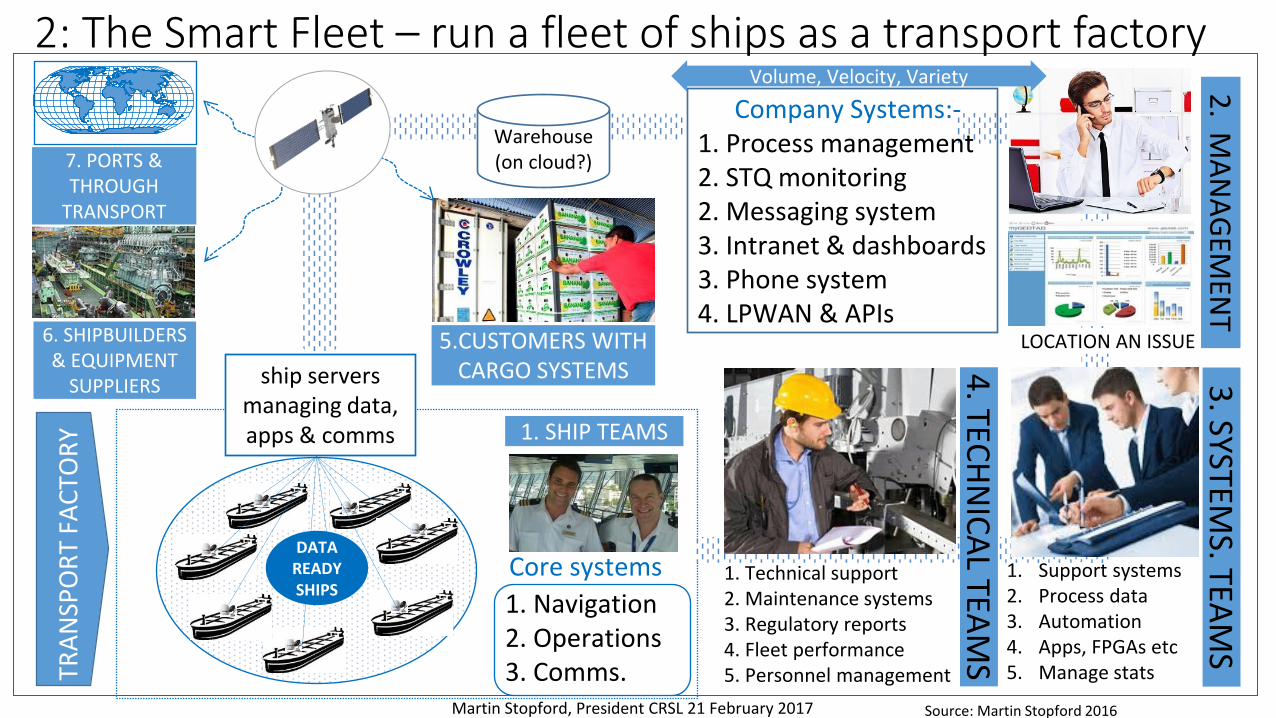
Martin Stopford, President CRSL 21 February 2017 Source: Martin Stopford 2016
DATA READY SHIPS
1. Navigation 2. Operations 3. Comms.
Core systems
1. SHIP TEAMS
ship servers managing data, apps & comms
6. SHIPBUILDERS & EQUIPMENT
SUPPLIERS
5.CUSTOMERS WITH CARGO SYSTEMS
7. PORTS & THROUGH
TRANSPORT
TRA
NSP
OR
T FA
CTO
RY
Warehouse (on cloud?)
Company Systems:- 1. Process management 2. STQ monitoring 2. Messaging system 3. Intranet & dashboards 3. Phone system 4. LPWAN & APIs
3. SYSTEM
S. TEAM
S
1. Support systems 2. Process data 3. Automation 4. Apps, FPGAs etc 5. Manage stats
1. Technical support 2. Maintenance systems 3. Regulatory reports 4. Fleet performance 5. Personnel management
4. TEC
HN
ICA
L TEAM
S
2. M
AN
AG
EMEN
T
LOCATION AN ISSUE
Volume, Velocity, Variety
2: The Smart Fleet – run a fleet of ships as a transport factory

The End
A challenging time

6. It’s about people
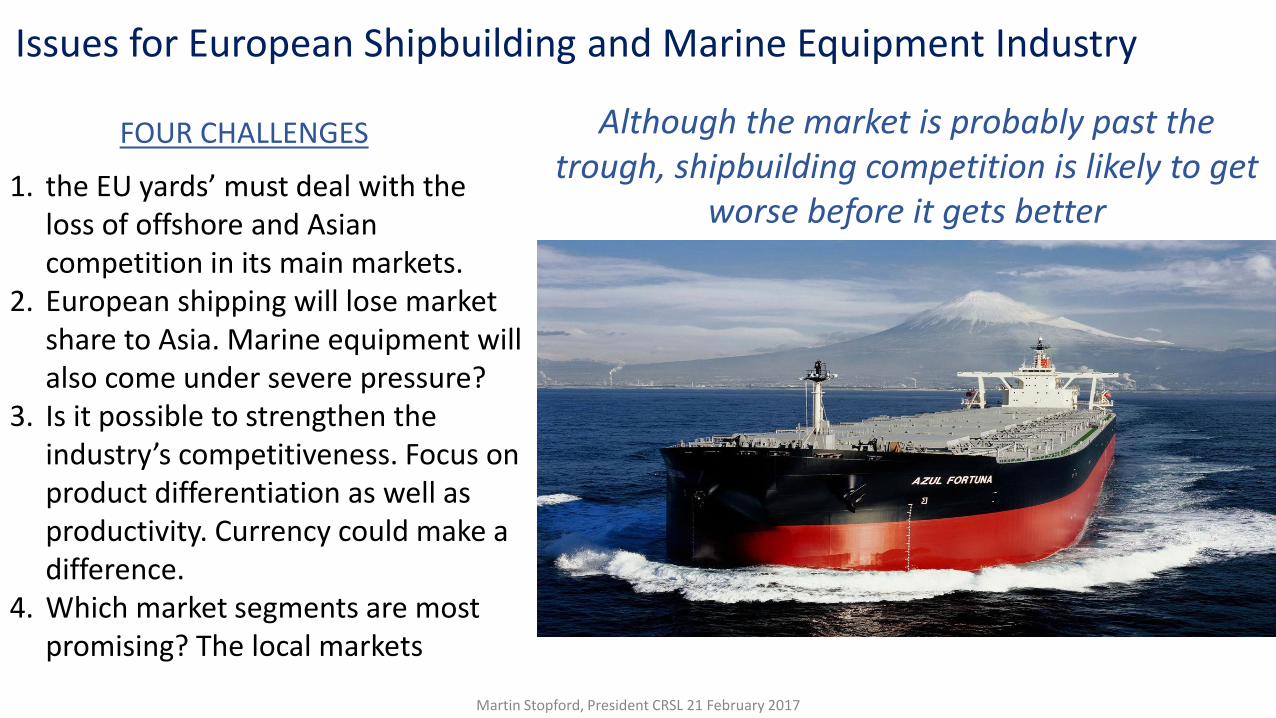
Although the market is probably past the trough, shipbuilding competition is likely to get
worse before it gets better
Issues for European Shipbuilding and Marine Equipment Industry
1. the EU yards’ must deal with the loss of offshore and Asian competition in its main markets.
2. European shipping will lose market share to Asia. Marine equipment will also come under severe pressure?
3. Is it possible to strengthen the industry’s competitiveness. Focus on product differentiation as well as productivity. Currency could make a difference.
4. Which market segments are most promising? The local markets
Martin Stopford, President CRSL 21 February 2017
FOUR CHALLENGES
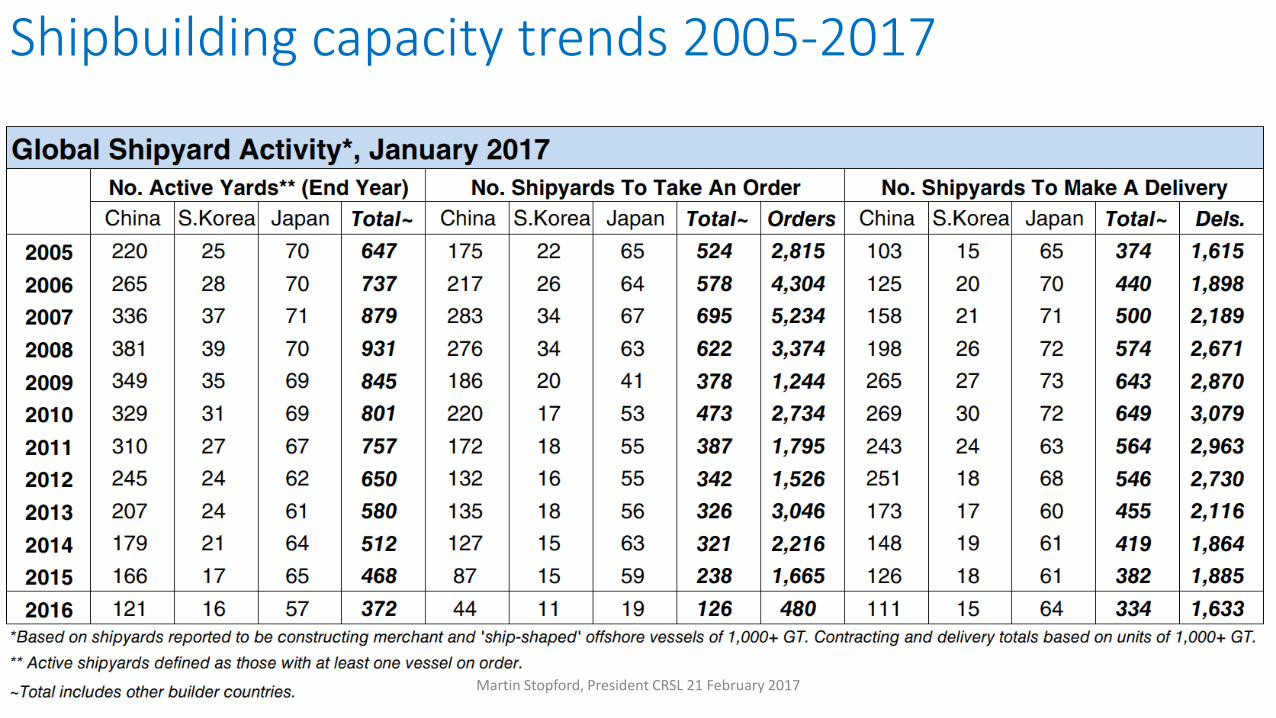
Shipbuilding capacity trends 2005-2017
Martin Stopford, President CRSL 21 February 2017
No 1 hold 12,600m3
No 2 hold 13,300m3
No 3 hold 13,000 m3
No 4 hold 12,300 m3 floodable
No 5 hold 13,000 m3
No 6 hold 13,000 m3
No 7 hold 12,200 m3
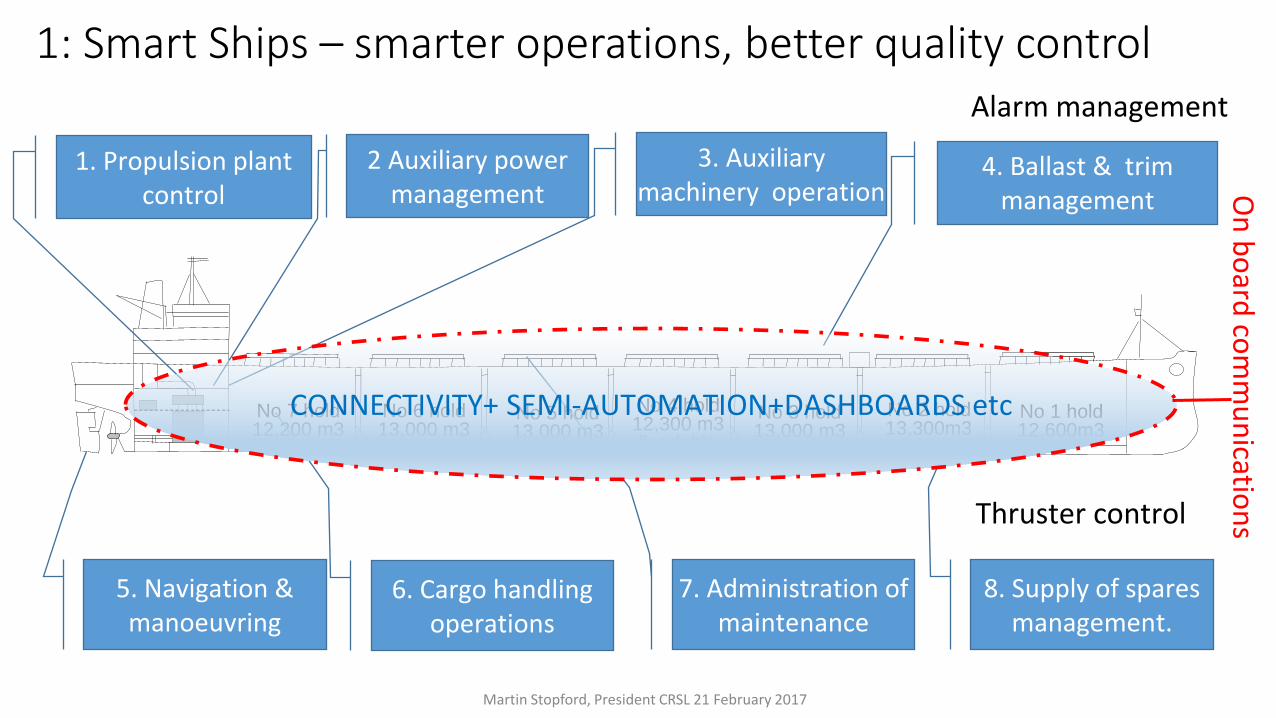
5. Navigation & manoeuvring
1. Propulsion plant control
2 Auxiliary power management
3. Auxiliary machinery operation
4. Ballast & trim management
6. Cargo handling operations
7. Administration of maintenance
8. Supply of spares management.
Alarm management
Thruster control
CONNECTIVITY+ SEMI-AUTOMATION+DASHBOARDS etc
On
bo
ard co
mm
un
ication
s 1: Smart Ships – smarter operations, better quality control
Martin Stopford, President CRSL 21 February 2017
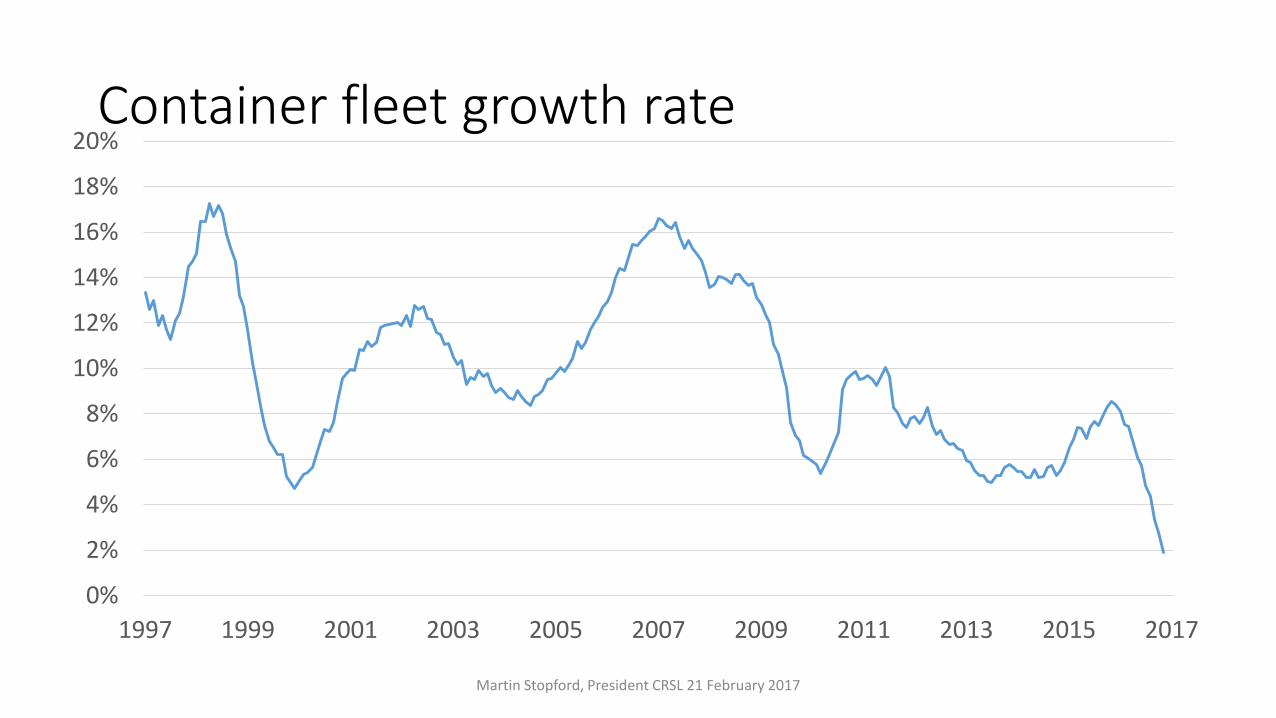
Container fleet growth rate
0%
2%
4%
6%
8%
10%
12%
14%
16%
18%
20%
1997 1999 2001 2003 2005 2007 2009 2011 2013 2015 2017
Martin Stopford, President CRSL 21 February 2017

Seaborne imports of OECD & Non-OECD countries
0
1,000
2,000
3,000
4,000
5,000
6,000
7,000
1950 1955 1960 1965 1970 1975 1980 1985 1990 1995 2000 2005 2010 2015
Imp
ort
s –
mill
ion
to
nn
es
Source: data collected by martin stopford from various sources, mainly United Nations and UNCTAD Martin Stopford, President CRSL 21 February 2017

Growth rate of tanker & bulker fleets 1971-2016
-10%
-5%
0%
5%
10%
15%
20%
19
71
19
72
19
73
19
75
19
76
19
77
19
79
19
80
19
81
19
83
19
84
19
85
19
87
19
88
19
89
19
91
19
92
19
93
19
95
19
96
19
97
19
99
20
00
20
01
20
03
20
04
20
05
20
07
20
08
20
09
20
11
20
12
20
13
20
15
20
16
Bulk Carrier fleet % pa Tanker fleet % pa
Martin Stopford, President CRSL 21 February 2017
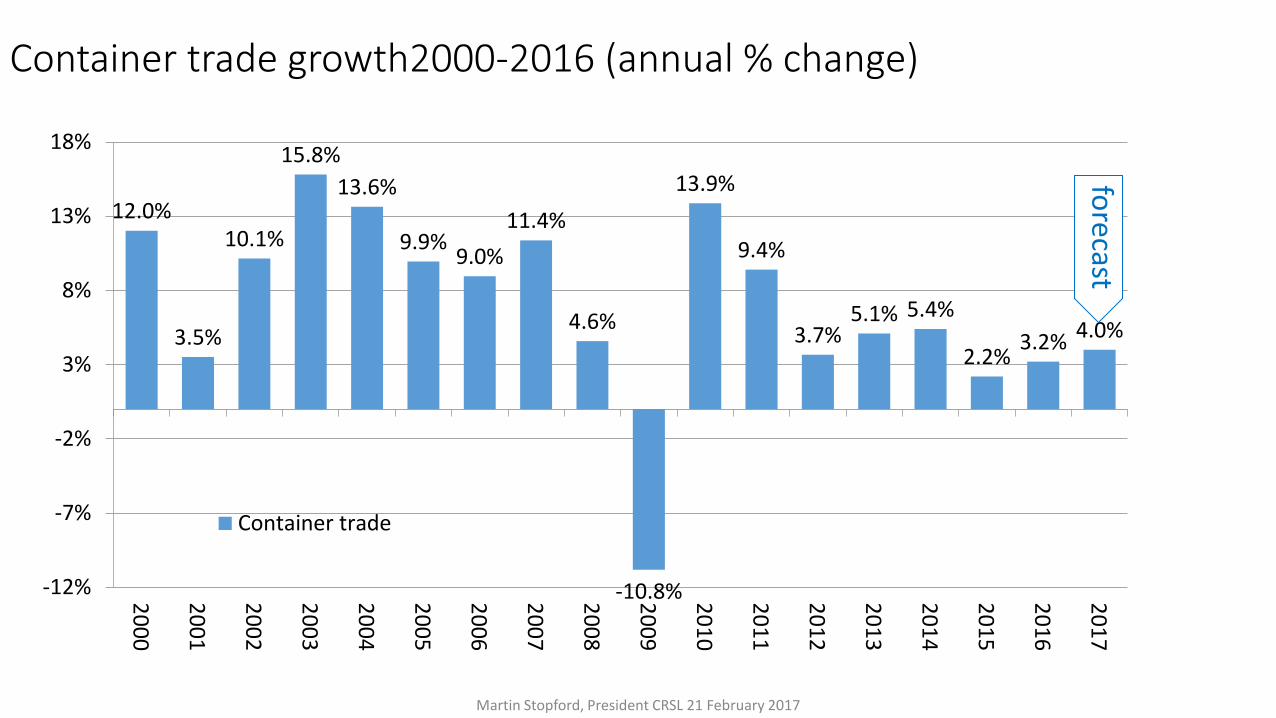
Container trade growth2000-2016 (annual % change)
12.0%
3.5%
10.1%
15.8%
13.6%
9.9% 9.0%
11.4%
4.6%
-10.8%
13.9%
9.4%
3.7% 5.1% 5.4%
2.2% 3.2% 4.0%
-12%
-7%
-2%
3%
8%
13%
18%
20
00
20
01
20
02
20
03
20
04
20
05
20
06
20
07
20
08
20
09
20
10
20
11
20
12
20
13
20
14
20
15
20
16
20
17
Container trade
forecast
Martin Stopford, President CRSL 21 February 2017
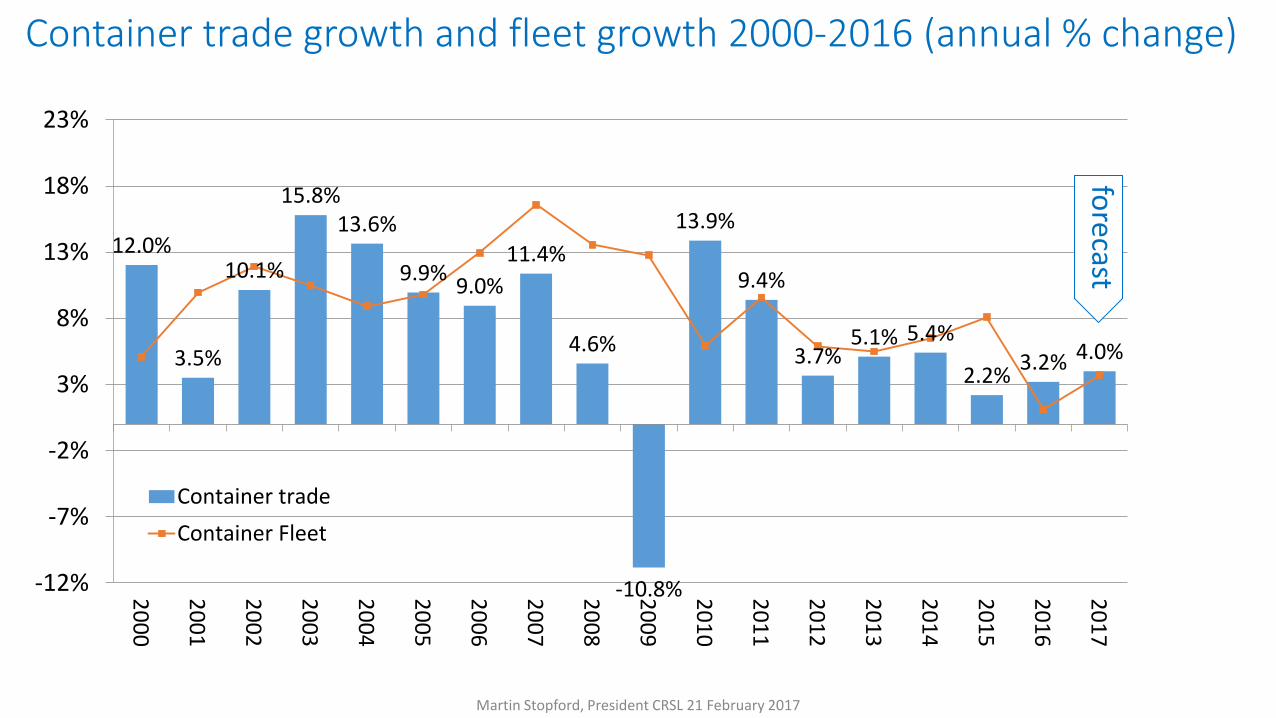
Container trade growth and fleet growth 2000-2016 (annual % change)
12.0%
3.5%
10.1%
15.8% 13.6%
9.9% 9.0%
11.4%
4.6%
-10.8%
13.9%
9.4%
3.7% 5.1% 5.4%
2.2% 3.2% 4.0%
-12%
-7%
-2%
3%
8%
13%
18%
23%
20
00
20
01
20
02
20
03
20
04
20
05
20
06
20
07
20
08
20
09
20
10
20
11
20
12
20
13
20
14
20
15
20
16
20
17
Container trade
Container Fleet
forecast
Martin Stopford, President CRSL 21 February 2017

The world in 1966: a few thoughts about the way things change
Martin Stopford, President CRSL 21 February 2017
Martin Stopford, President CRSL 21 February 2017
In 1966 Blue Funnel’s Priam multi-deck was the latest thing in liners Lesson: For 100 years the ships had improved but in the 1960s the problem was not the ships. The problem was the liner SYSTEM, which was incapable of carrying the escalating cargo. The Priam class were beautiful ships but commercial dinosaurs.
Lesson: revolutions take time - it too 40 years to build the system. German yards did better than the British yards – shipbuilding sophistication matters.
First international container service, purpose built Fairlane discharging Rotterdam May 1966
In1966 the container “revolution” took its first step
Martin Stopford, President CRSL 21 February 2017
In December 1966 the first VLCC, the Idemitsu Maru went into service (209,413 dwt)
Martin Stopford, President CRSL 21 February 2017
Lesson: the arrival of these big ships were the beginning of the end of industrial shipping. As investors jumped on the band wagon they faced a 17 year recession.
“End of industrial shipping” in 1970s as cargo switches to spot market
Martin Stopford, President CRSL 21 February 2017
Mill
ion
dw
t o
f ta
nke
rs
0%
10%
20%
30%
40%
50%
60%
70%
80%
90%
100%1
97
3
19
74
19
75
19
76
19
77
19
79
19
80
19
81
19
82
19
83
19
84
19
86
19
87
19
88
19
89
19
90
19
91
19
93
19
94
19
95
19
96
19
97
19
98
20
00
20
01
20
02
20
03
20
04
20
05
20
07
20
08
20
09
20
10
20
11
20
12
20
14
20
15
20
16
Timecharter Trading Spot
For last 30 years most of fleet trading spot In 1973 80% of independent
tankers fleet on timecharter
Lesson: markets depend on the strategy of shippers. This chart shows the Independent tanker fleet making the painful transition from industrial shipping to spot market operations


![[Dom7 Resolutions]](https://img.pdfslide.us/doc/110x75/577d33e61a28ab3a6b8c0751/dom7-resolutions.jpg)