Embed Size (px)
Citation preview
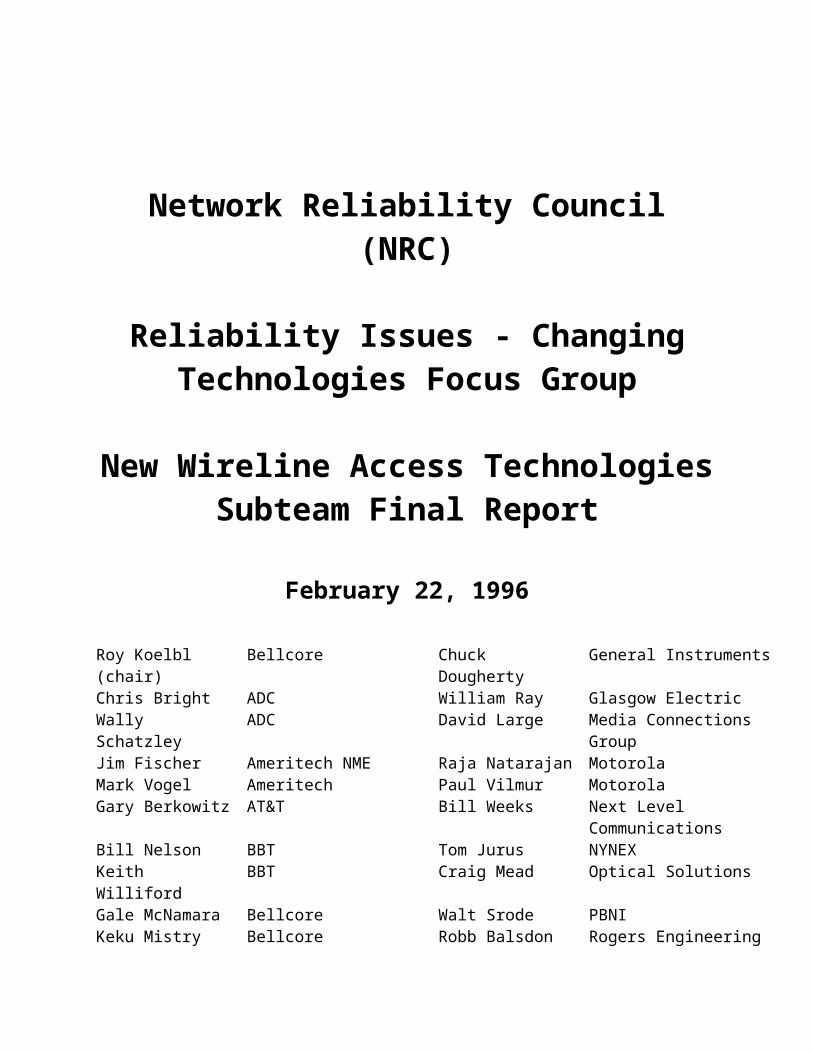
Network Reliability Council (NRC)
Reliability Issues - Changing Technologies Focus Group
New Wireline Access TechnologiesSubteam Final Report
February 22, 1996
Roy Koelbl (chair) Bellcore Chuck Dougherty General InstrumentsChris Bright ADC William Ray Glasgow ElectricWally Schatzley ADC David Large Media Connections GroupJim Fischer Ameritech NME Raja Natarajan MotorolaMark Vogel Ameritech Paul Vilmur MotorolaGary Berkowitz AT&T Bill Weeks Next Level CommunicationsBill Nelson BBT Tom Jurus NYNEXKeith Williford BBT Craig Mead Optical SolutionsGale McNamara Bellcore Walt Srode PBNIKeku Mistry Bellcore Robb Balsdon Rogers EngineeringDan Sills Bellcore Farr Farhan Scientific-AtlantaEric Tollar Bellcore Roy Thompson Scientific-AtlantaGlenn Mahony BellSouth Tim Wilk Scientific-AtlantaScott Bachman Cable Labs Donovan Dillon SNETDavid Miller Clear Communications Duane Elms SNETAlex Best Cox Communications Chris Barnhouse Time WarnerBill McDonald Fujitsu Jim Haag Time Warner
Earl Manchester U S WEST

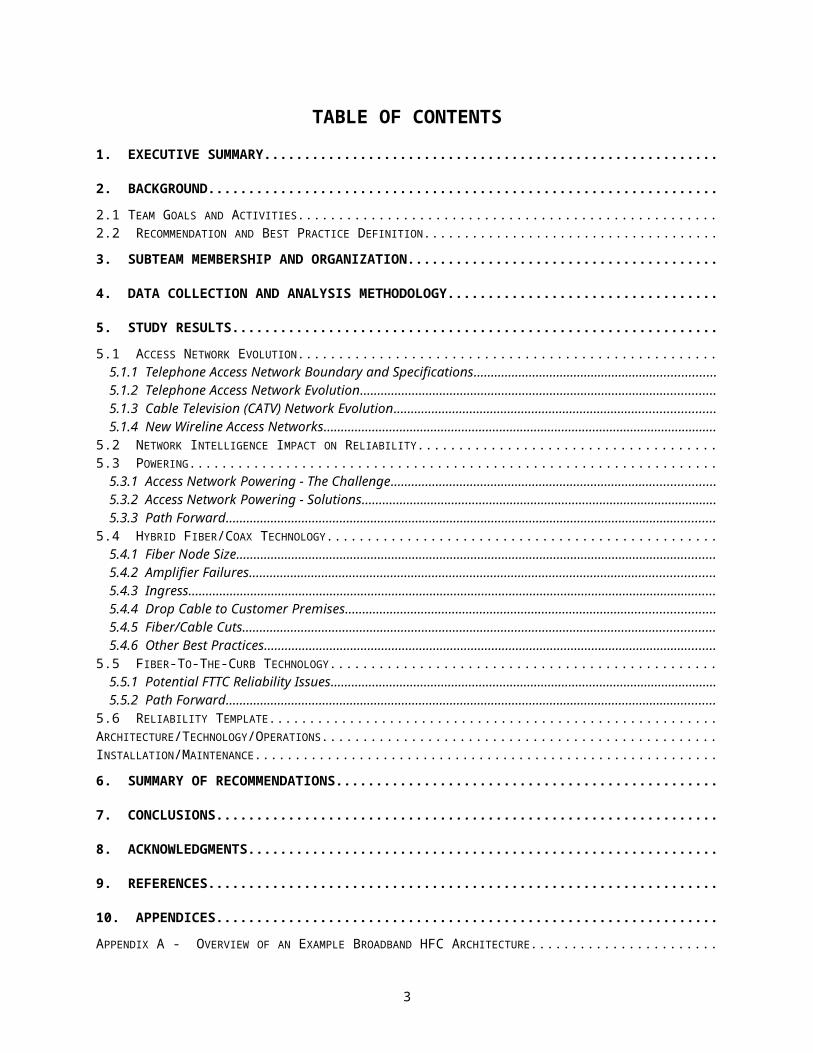
TABLE OF CONTENTS
1. EXECUTIVE SUMMARY................................................................................................................................
2. BACKGROUND...............................................................................................................................................
2.1 TEAM GOALS AND ACTIVITIES............................................................................................................................2.2 RECOMMENDATION AND BEST PRACTICE DEFINITION.........................................................................................
3. SUBTEAM MEMBERSHIP AND ORGANIZATION....................................................................................
4. DATA COLLECTION AND ANALYSIS METHODOLOGY........................................................................
5. STUDY RESULTS............................................................................................................................................
5.1 ACCESS NETWORK EVOLUTION..........................................................................................................................5.1.1 Telephone Access Network Boundary and Specifications............................................................................5.1.2 Telephone Access Network Evolution.........................................................................................................5.1.3 Cable Television (CATV) Network Evolution..............................................................................................5.1.4 New Wireline Access Networks...................................................................................................................
5.2 NETWORK INTELLIGENCE IMPACT ON RELIABILITY.............................................................................................5.3 POWERING.........................................................................................................................................................
5.3.1 Access Network Powering - The Challenge.................................................................................................5.3.2 Access Network Powering - Solutions.........................................................................................................5.3.3 Path Forward.............................................................................................................................................
5.4 HYBRID FIBER/COAX TECHNOLOGY...................................................................................................................5.4.1 Fiber Node Size..........................................................................................................................................5.4.2 Amplifier Failures......................................................................................................................................5.4.3 Ingress........................................................................................................................................................5.4.4 Drop Cable to Customer Premises..............................................................................................................5.4.5 Fiber/Cable Cuts........................................................................................................................................5.4.6 Other Best Practices...................................................................................................................................
5.5 FIBER-TO-THE-CURB TECHNOLOGY...................................................................................................................5.5.1 Potential FTTC Reliability Issues...............................................................................................................5.5.2 Path Forward.............................................................................................................................................
5.6 RELIABILITY TEMPLATE.....................................................................................................................................ARCHITECTURE/TECHNOLOGY/OPERATIONS...............................................................................................................INSTALLATION/MAINTENANCE..................................................................................................................................
6. SUMMARY OF RECOMMENDATIONS.......................................................................................................
7. CONCLUSIONS................................................................................................................................................
8. ACKNOWLEDGMENTS.................................................................................................................................
9. REFERENCES..................................................................................................................................................
10. APPENDICES.................................................................................................................................................
APPENDIX A - OVERVIEW OF AN EXAMPLE BROADBAND HFC ARCHITECTURE.........................................................APPENDIX B - INGRESS RELIABILITY ISSUES IN HFC ACCESS NETWORKS..................................................................
B.1 Introduction..................................................................................................................................................B.2 Ingress Studies..............................................................................................................................................B.3 Long-Term Ingress Studies............................................................................................................................B.4 Short-Term Ingress.......................................................................................................................................
APPENDIX C - ISSUE STATEMENT..............................................................................................................................APPENDIX D - NEW TECHNOLOGY RELIABILITY TEMPLATE.......................................................................................
2
3

1. Executive SummaryThe Network Reliability Council’s (NRC) Changing Technologies Focus Group established the New Wireline Access Technologies (NWAT) subteam as one of five subteams examining the reliability aspects of key services provided over new network technologies in the Public Switched Network (PSN). The primary objectives of the NWAT subteam were to: (1) identify, define, and clarify potential service reliability attributes (i.e., weaknesses and strengths) associated with new wireline access technologies, and (2) where possible, identify potential mitigating solutions and provide recommendations for improved reliability. A subteam of more than 30 members representing a cross-section of the industry worked on this assignment from August to December, 1995. Subteam members represented service providers and suppliers from traditional telephone service companies and newcomers, or potential newcomers, to the local telephone service market (e.g., cable television companies).
The NWAT subteam primarily investigated the reliability of telephony services transported over Hybrid Fiber/Coax (HFC) and Fiber-To-The-Curb (FTTC) access networks. These technologies were benchmarked and compared with today’s systems to understand potential failure modes and key differences that could improve or degrade reliability. Digital Loop Carrier (DLC) systems and cable television systems were used as benchmarks. Field and system test data was obtained from several sources, including publicly available data, service operators, and suppliers. Based on this data, inputs from subteam members, the following is a high-level summary of subteam findings and recommendations:
· The industry’s goal is to provide 99.99% reliability for telephony services provided over HFC and FTTC access networks.
· Deployment of HFC and FTTC systems is just beginning, therefore, gathering of critical field data is in its early stages.
· Industry has identified several key reliability issues and potential mitigating solutions.· Operators and suppliers should implement a process to gather field data on systems as they
undergo trials and are deployed.· Operators and suppliers should institute a process for root cause analysis on outages and
develop best practices to improve reliability.
Several more detailed findings and recommendations are provided throughout the report.
4
2. Background2.1 Team Goals and ActivitiesWireline access technologies are rapidly evolving to support the implementation of new, advanced services. These technologies are being deployed (or are planned to be deployed) by a proliferation of emerging service providers. However, it is expected that many of these access networks will also support telephony services such as Plain Old Telephone Service (POTS). The FCC has asked whether the high reliability of telephony services that currently exists in the public switched network is maintained with the deployment of these new access technologies. This report is aimed at investigating the reliability of such wireline access networks.
A copy of the Issue Statement for the focus group is contained in Appendix C. It was the intent of the New Wireline Access Technologies (NWAT) subteam to identify, define, and clarify potential service reliability attributes (i.e., weaknesses and strengths) associated with new wireline access technologies. Based on these findings, conclusions would be drawn and recommendations made where possible. By identifying and clarifying reliability attributes, it was hoped that ÒmythsÓ and ÒfearsÓ based on misinformation and/or the lack of information might be mitigated. On the other hand, because limited reliability data typically exists for any new technology, the subteam did not want to foster new concerns due to limited data or information. Consequently, it was decided that a more qualitative than quantitative investigative approach would be taken, with the emphasis on understanding failure modes and identifying potential mitigating solutions.
Subteam investigations focused on the reliability of HFC and FTTC access networks, because these two technologies are either being deployed now, or are expected to be deployed in the next three years to support POTS service. Fiber-To-The-Home (FTTH) was also considered, but to a much lesser extent.
This report focuses on the reliability aspects of new wireline access technologies and makes no assessment about their cost-effectiveness for providing key telephony services. Reliability issues related to the interconnection of networks based on these technologies to the PSTN are addressed in the Focus Group II report on Increased Interconnection.
2.2 Recommendation and Best Practice DefinitionThe terms “recommendation” or “Best Practice” as used in this report is defined as follows: “recommendations” are those countermeasures (but not the only countermeasures) which go furthest in eliminating the root cause(s) of outages. None of the recommendations are construed to be mandatory.
Service providers and suppliers are strongly encouraged to study and assess the applicability of all countermeasures for implementation in their company products. It is understood that all countermeasures, may not be applied universally.
3. Subteam Membership and OrganizationWith ever-increasing competition for the provision of telecommunications services, the industry is beginning to experience a proliferation of new service providers. It is therefore important that
5
any subteam addressing the reliability of new access technologies incorporate Subject Matter Experts (SME) from different segments of the industry that either offer, or plan to offer, POTS service over such networks. Each segment of the industry may have a different perspective on the technology and its reliability requirements. Consequently, subteam members include one or more representatives from the Regional Bell Operating Companies (RBOC), cable television companies, and electric utility companies. Both operators and suppliers were represented on the NWAT subteam. Subteam members and their affiliations are listed below.
Roy Koelbl (chair) BellcoreChris Bright ADCWally Schatzley ADCJim Fischer Ameritech NMEMark Vogel AmeritechGary Berkowitz AT&TBill Nelson BBTKeith Williford BBTGale McNamara BellcoreKeku Mistry BellcoreDan Sills BellcoreEric Tollar BellcoreGlenn Mahony Bell SouthScott Bachman Cable LabsDavid Miller Clear CommunicationsAlex Best Cox CommunicationsBill McDonald FujitsuChuck Dougherty General InstrumentsWilliam Ray Glasgow ElectricDavid Large Media Connections GroupRaja Natarajan MotorolaPaul Vilmur MotorolaBill Weeks Next Level CommunicationsTom Jurus NYNEXCraig Mead Optical SolutionsWalt Srode PBNIRobb Balsdon Rogers EngineeringFarr Farhan Scientific-AtlantaRoy Thompson Scientific-AtlantaTim Wilk Scientific-AtlantaDonovan Dillon SNETDuane Elms SNETChris Barnhouse Time WarnerJim Haag Time WarnerEarl Manchester US West
The NWAT subteam was divided into four working groups as follows:
6
· Current Access Networks· FTTC Access Networks· HFC Access Networks· Impact of Network Intelligence
4. Data Collection and Analysis Methodology
Because of the compressed schedule for completing the team report, a formal industry survey and collection of outage information was not conducted. Instead, the team relied on several other sources of data.
In order to obtain an understanding of how the reliability of the new technologies will compare to existing networks, it is useful to understand the differences between the new and old technologies. Specifically, this includes understanding the current failure modes, if and how they will occur in the new technology, and what potentially new failure modes will occur. To achieve this understanding, data on failure modes of current access networks (telephony and CATV) was investigated, as was system test data for the new technologies. Data was collected from several sources:
· published papers· publicly available data· telephone company and cable television company data· supplier provided data
Because much of this data is proprietary, detailed data is not included in this report. Instead, a summary of findings will be presented based on this data, as well as consensus views from subteam members. It should be noted that the data gathered for this report was from available sources. No new data was systematically gathered for this study, which made it difficult to properly compare results from different sources. Consequently, detailed recommendations that can be applied globally are limited.
5. Study Results5.1 Access Network Evolution
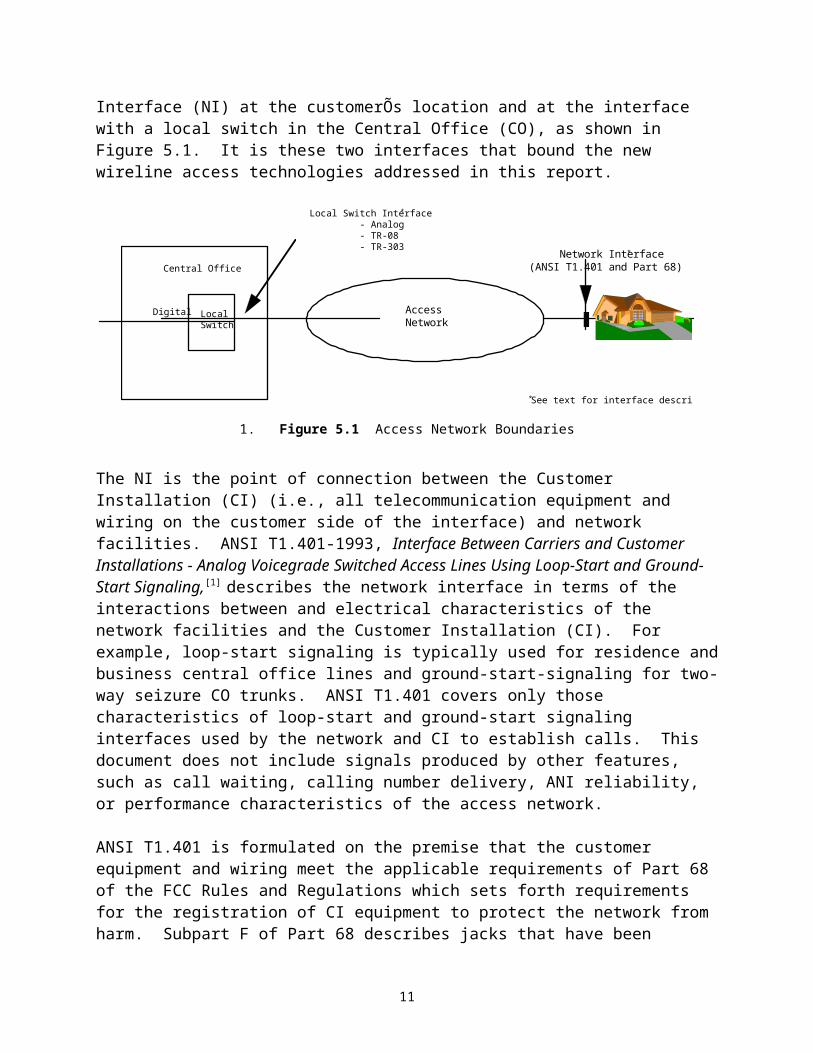
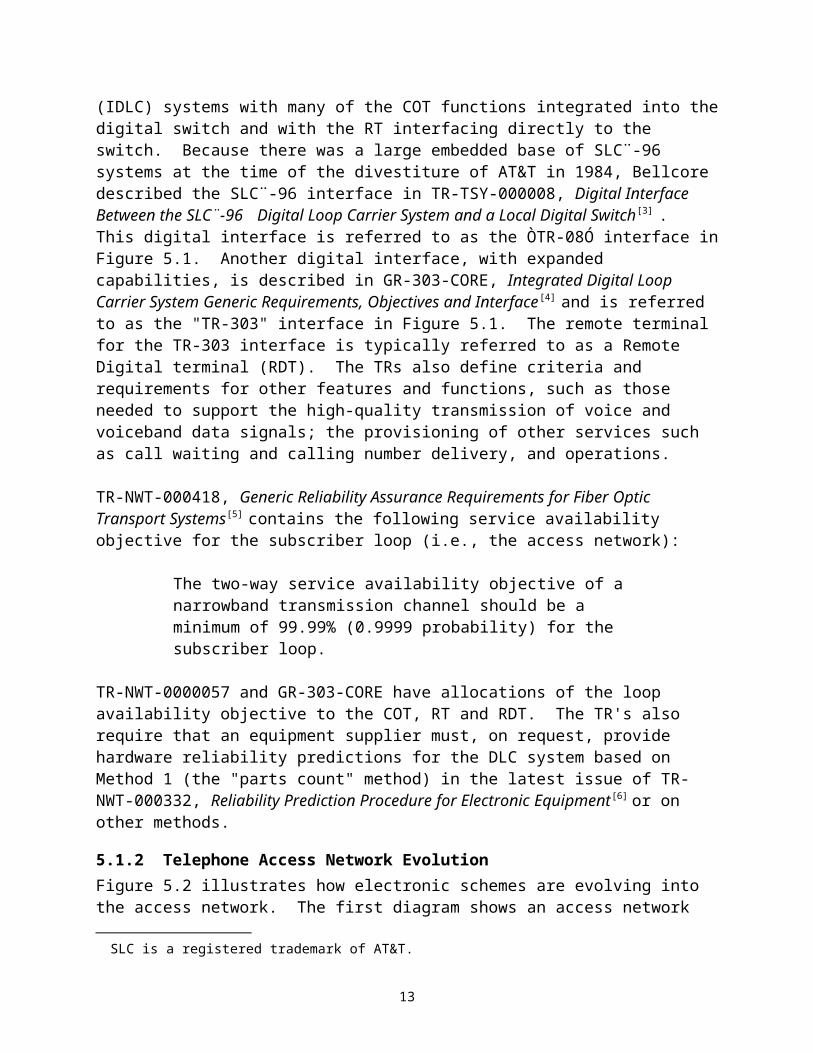
5.1.1 Telephone Access Network Boundary and SpecificationsThe telephone access network connects the local switch in a central office to individual customers terminating at a Network Interface (NI) at the customerÕs location and at the interface with a local switch in the Central Office (CO), as shown in Figure 5.1. It is these two interfaces that bound the new wireline access technologies addressed in this report.
7
LocalSwitch
Digital
Network Interface*
(ANSI T1.401 and Part 68)
AccessNetwork
Central Office
Local Switch Interface*
- Analog - TR-08 - TR-303
*See text for interface description
1. Figure 5.1 Access Network Boundaries
The NI is the point of connection between the Customer Installation (CI) (i.e., all telecommunication equipment and wiring on the customer side of the interface) and network facilities. ANSI T1.401-1993, Interface Between Carriers and Customer Installations - Analog Voicegrade Switched Access Lines Using Loop-Start and Ground-Start Signaling,[1] describes the network interface in terms of the interactions between and electrical characteristics of the network facilities and the Customer Installation (CI). For example, loop-start signaling is typically used for residence and business central office lines and ground-start-signaling for two-way seizure CO trunks. ANSI T1.401 covers only those characteristics of loop-start and ground-start signaling interfaces used by the network and CI to establish calls. This document does not include signals produced by other features, such as call waiting, calling number delivery, ANI reliability, or performance characteristics of the access network.
ANSI T1.401 is formulated on the premise that the customer equipment and wiring meet the applicable requirements of Part 68 of the FCC Rules and Regulations which sets forth requirements for the registration of CI equipment to protect the network from harm. Subpart F of Part 68 describes jacks that have been standardized through industry agreement that are installed by the telephone company at the NI for the connection of customer equipment and wiring. Part 68 also requires that telephone companies notify, in writing, customers who have registered (or grandfathered) equipment connected to telephone company facilities of any changes in facilities, equipment, operations, or procedures that can render the customerÕs terminal equipment incompatible with the telephone company facilities. On request, the telephone company will provide interface information.
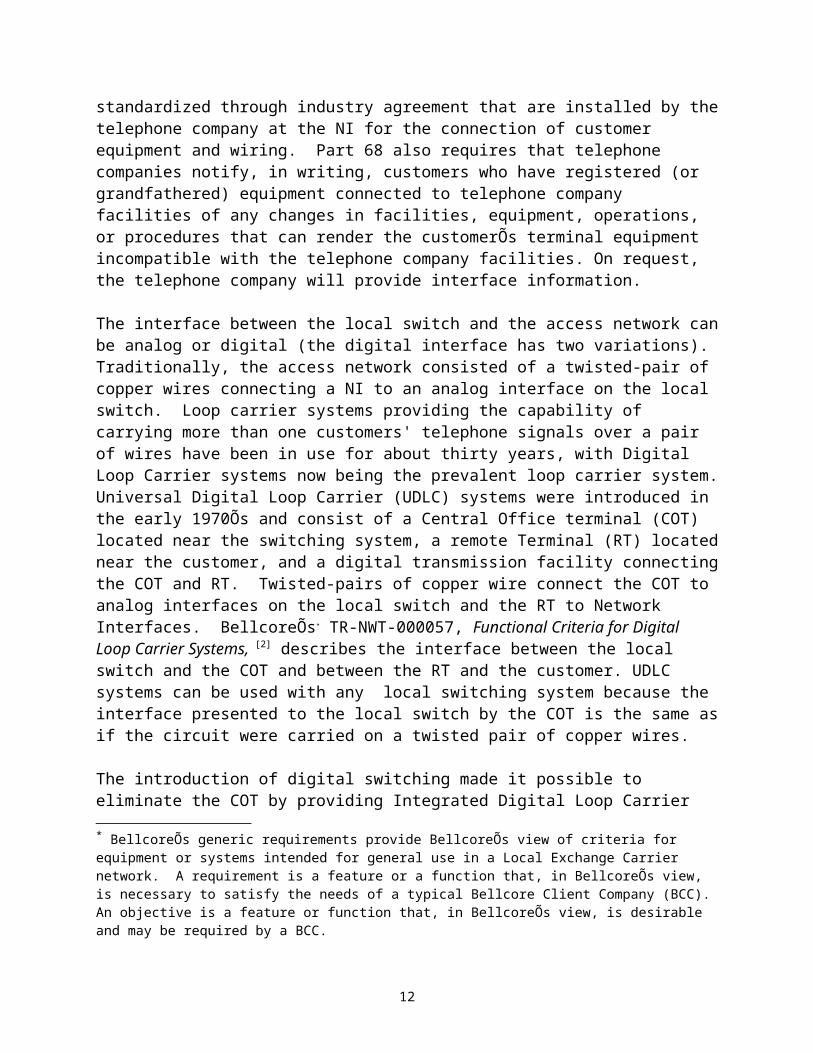
The interface between the local switch and the access network can be analog or digital (the digital interface has two variations). Traditionally, the access network consisted of a twisted-pair of copper wires connecting a NI to an analog interface on the local switch. Loop carrier systems providing the capability of carrying more than one customers' telephone signals over a pair of wires have been in use for about thirty years, with Digital Loop Carrier systems now being the prevalent loop carrier system. Universal Digital Loop Carrier (UDLC) systems were introduced in the early 1970Õs and consist of a Central Office terminal (COT) located near the switching system, a remote Terminal (RT) located near the customer, and a digital transmission facility connecting the COT and RT. Twisted-pairs of copper wire connect the COT to analog
8
interfaces on the local switch and the RT to Network Interfaces. BellcoreÕs* TR-NWT-000057, Functional Criteria for Digital Loop Carrier Systems, [2] describes the interface between the local switch and the COT and between the RT and the customer. UDLC systems can be used with any local switching system because the interface presented to the local switch by the COT is the same as if the circuit were carried on a twisted pair of copper wires.
The introduction of digital switching made it possible to eliminate the COT by providing Integrated Digital Loop Carrier (IDLC) systems with many of the COT functions integrated into the digital switch and with the RT interfacing directly to the switch. Because there was a large embedded base of SLC¨-96 systems at the time of the divestiture of AT&T in 1984, Bellcore described the SLC¨-96 interface in TR-TSY-000008, Digital Interface Between the SLC¨-96 Digital Loop Carrier System and a Local Digital Switch[3] . This digital interface is referred to as the ÒTR-08Ó interface in Figure 5.1. Another digital interface, with expanded capabilities, is described in GR-303-CORE, Integrated Digital Loop Carrier System Generic Requirements, Objectives and Interface[4] and is referred to as the "TR-303" interface in Figure 5.1. The remote terminal for the TR-303 interface is typically referred to as a Remote Digital terminal (RDT). The TRs also define criteria and requirements for other features and functions, such as those needed to support the high-quality transmission of voice and voiceband data signals; the provisioning of other services such as call waiting and calling number delivery, and operations.
TR-NWT-000418, Generic Reliability Assurance Requirements for Fiber Optic Transport Systems[5] contains the following service availability objective for the subscriber loop (i.e., the access network):
The two-way service availability objective of a narrowband transmission channel should be a minimum of 99.99% (0.9999 probability) for the subscriber loop.
TR-NWT-0000057 and GR-303-CORE have allocations of the loop availability objective to the COT, RT and RDT. The TR's also require that an equipment supplier must, on request, provide hardware reliability predictions for the DLC system based on Method 1 (the "parts count" method) in the latest issue of TR-NWT-000332, Reliability Prediction Procedure for Electronic Equipment[6] or on other methods.
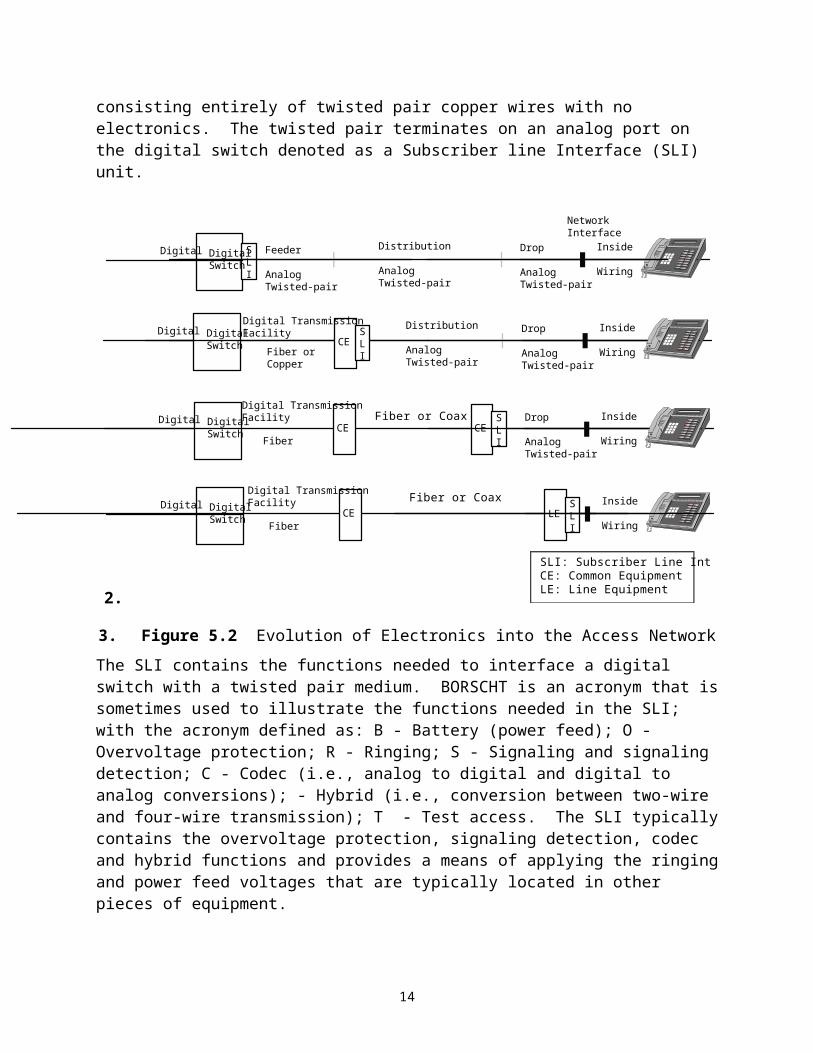
5.1.2 Telephone Access Network EvolutionFigure 5.2 illustrates how electronic schemes are evolving into the access network. The first diagram shows an access network consisting entirely of twisted pair copper wires with no electronics. The twisted pair terminates on an analog port on the digital switch denoted as a Subscriber line Interface (SLI) unit.
* BellcoreÕs generic requirements provide BellcoreÕs view of criteria for equipment or systems intended for general use in a Local Exchange Carrier network. A requirement is a feature or a function that, in BellcoreÕs view, is necessary to satisfy the needs of a typical Bellcore Client Company (BCC). An objective is a feature or function that, in BellcoreÕs view, is desirable and may be required by a BCC.
SLC is a registered trademark of AT&T.
9
2.
NetworkInterface
DigitalSwitch
SLI
Digital Feeder
AnalogTwisted-pair
Distribution
AnalogTwisted-pair
Drop
AnalogTwisted-pair
SLI
CE
Distribution
AnalogTwisted-pair
Drop
AnalogTwisted-pair
Fiber orCopper
DigitalSwitch
Digital
SLI
CEDrop
AnalogTwisted-pair
DigitalSwitch
Digital
Inside
Wiring
Inside
Wiring
Inside
Wiring
SLI
LEDigitalSwitch
Digital Inside
Wiring
Digital TransmissionFacility
SLI: Subscriber Line InterfaceCE: Common EquipmentLE: Line Equipment
CE
Digital TransmissionFacility
Fiber
Fiber or Coax
CE
Digital TransmissionFacility
Fiber
Fiber or Coax
3. Figure 5.2 Evolution of Electronics into the Access Network
The SLI contains the functions needed to interface a digital switch with a twisted pair medium. BORSCHT is an acronym that is sometimes used to illustrate the functions needed in the SLI; with the acronym defined as: B - Battery (power feed); O - Overvoltage protection; R - Ringing; S - Signaling and signaling detection; C - Codec (i.e., analog to digital and digital to analog conversions); - Hybrid (i.e., conversion between two-wire and four-wire transmission); T - Test access. The SLI typically contains the overvoltage protection, signaling detection, codec and hybrid functions and provides a means of applying the ringing and power feed voltages that are typically located in other pieces of equipment.
In the second part of Figure 5.2, the SLI is moved to the access network along with Common Equipment (CE). The CE includes Digital Transmission Facility (DTF) functions for interfacing to a DS1 facility connecting to the local digital switch. The DS1 facility could be transported over twisted pair copper wires, an asynchronous fiber optic system, or a Synchronous Optical Network (SONET) system. The fiber optic or SONET system could be configured as a ring. The CE also typically contains other functions such as power supplies and the ringing generator (each of which are typically implemented with redundant hardware).
In the third diagram, the electronics component has moved to the curb, near the customer’s premises; and finally, in the fourth diagram the electronics at the customer's premises. In both diagrams, there might be additional CE for converting between different media (i.e., fiber and coaxial cable) or between different interfaces to the same media. Note that the Line Equipment (LE) in the fourth diagram is usually dedicated to a single customer (but potentially more than
10
one line) and is not shared by multiple customers, as is the case with the common equipment in the third diagram.
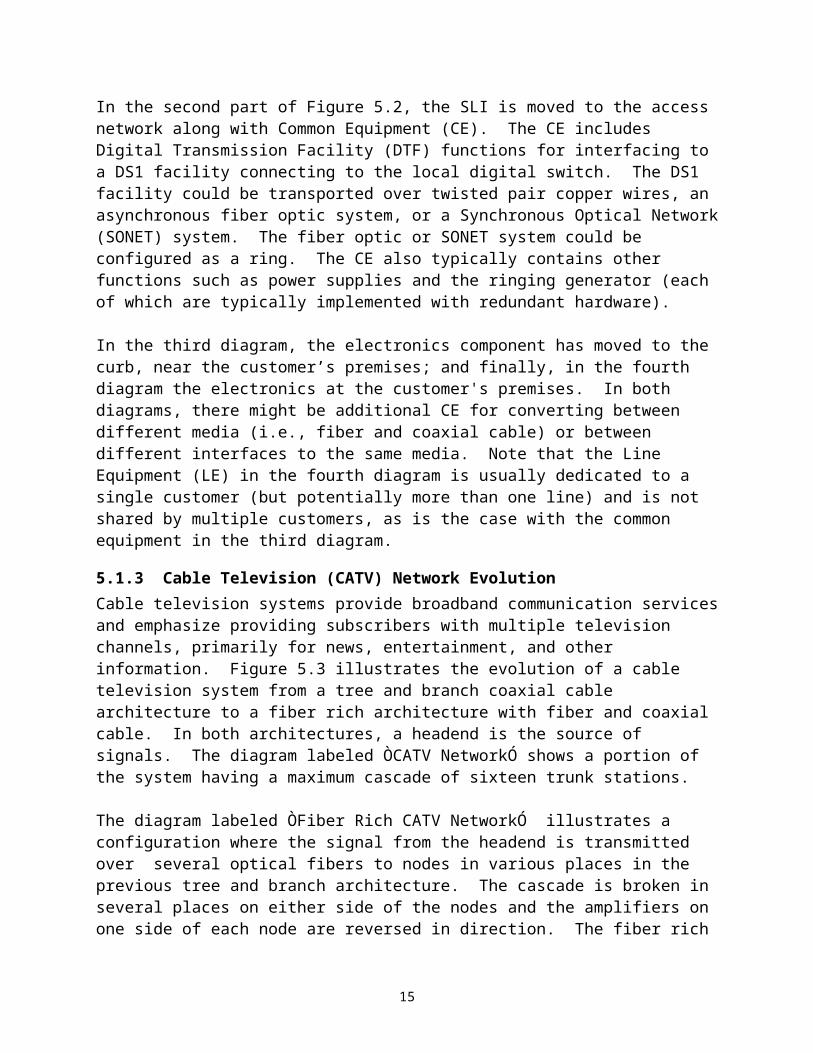
5.1.3 Cable Television (CATV) Network EvolutionCable television systems provide broadband communication services and emphasize providing subscribers with multiple television channels, primarily for news, entertainment, and other information. Figure 5.3 illustrates the evolution of a cable television system from a tree and branch coaxial cable architecture to a fiber rich architecture with fiber and coaxial cable. In both architectures, a headend is the source of signals. The diagram labeled ÒCATV NetworkÓ shows a portion of the system having a maximum cascade of sixteen trunk stations.
The diagram labeled ÒFiber Rich CATV NetworkÓ illustrates a configuration where the signal from the headend is transmitted over several optical fibers to nodes in various places in the previous tree and branch architecture. The cascade is broken in several places on either side of the nodes and the amplifiers on one side of each node are reversed in direction. The fiber rich configuration uses the same number of amplifiers to serve the same number of customers, but, depending on the number of nodes, there will be fewer amplifiers between each customer and the headend, thereby improving reliability and performance.
In an all coaxial network trunk amplifiers are powered via the coaxial cable using cable system supplies that are dispersed throughout the system and connected to power utility lines. Because of the cascade topology, utility power loss near the headend can interrupt service in a major part of the system and a subscriber experiencing the loss of service could still have AC power. For this reason, power supplies might have batteries that provide 2 to 3 hours standby power and that automatically recharge when power is available.
Headend
Headend
Fiber Node
Coaxial Cable
OpticalFiber
Trunk Station
Legend
CATV Network
Fiber Rich CATV Network
4. Figure 5.3 Evolution to Fiber Rich CATV Network
11
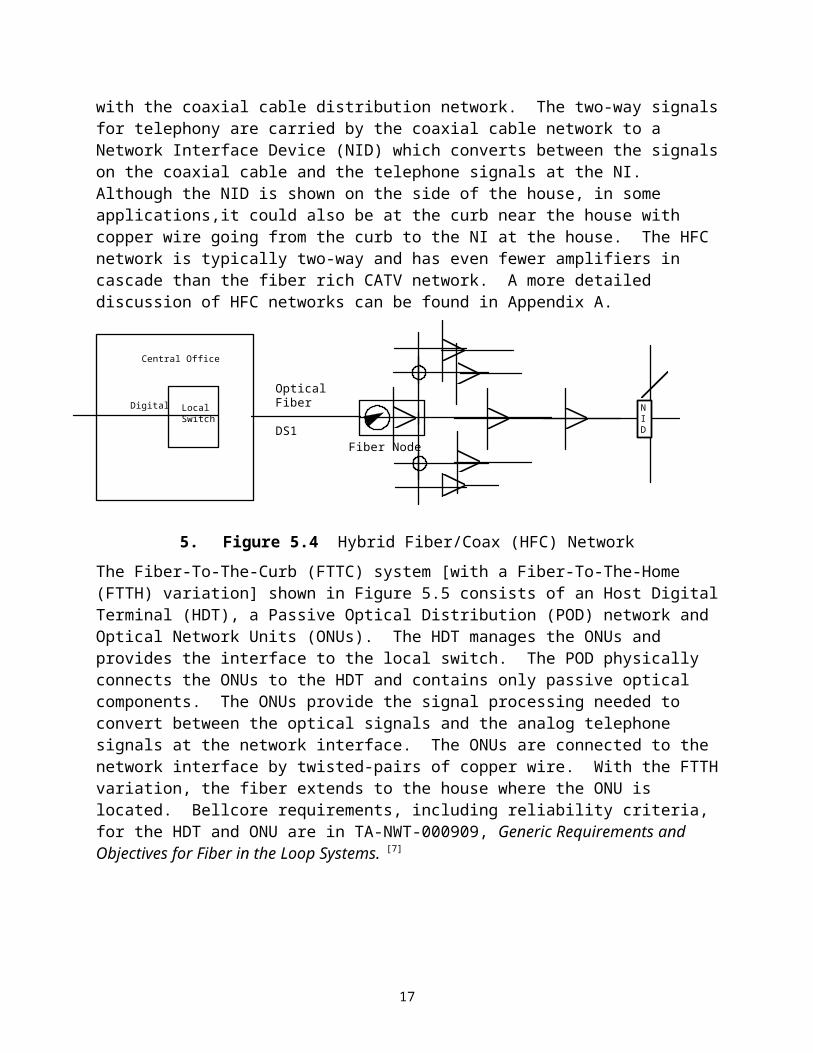
5.1.4 New Wireline Access NetworksFigures 5.4 and 5.5 show an Hybrid Fiber Coax (HFC) network and a Fiber-To-The Curb (FTTC) network used to provide telephone service. For the HFC network, digitally modulated radio frequency (RF) signals are carried over fiber between a digital interface in the CO and a fiber node where optical-to-electrical and electrical-to-optical conversions are made for interfacing with the coaxial cable distribution network. The two-way signals for telephony are carried by the coaxial cable network to a Network Interface Device (NID) which converts between the signals on the coaxial cable and the telephone signals at the NI. Although the NID is shown on the side of the house, in some applications,it could also be at the curb near the house with copper wire going from the curb to the NI at the house. The HFC network is typically two-way and has even fewer amplifiers in cascade than the fiber rich CATV network. A more detailed discussion of HFC networks can be found in Appendix A.
Fiber Node
LocalSwitch
Digital
Central Office
OpticalFiber
DS1
NID
5. Figure 5.4 Hybrid Fiber/Coax (HFC) Network
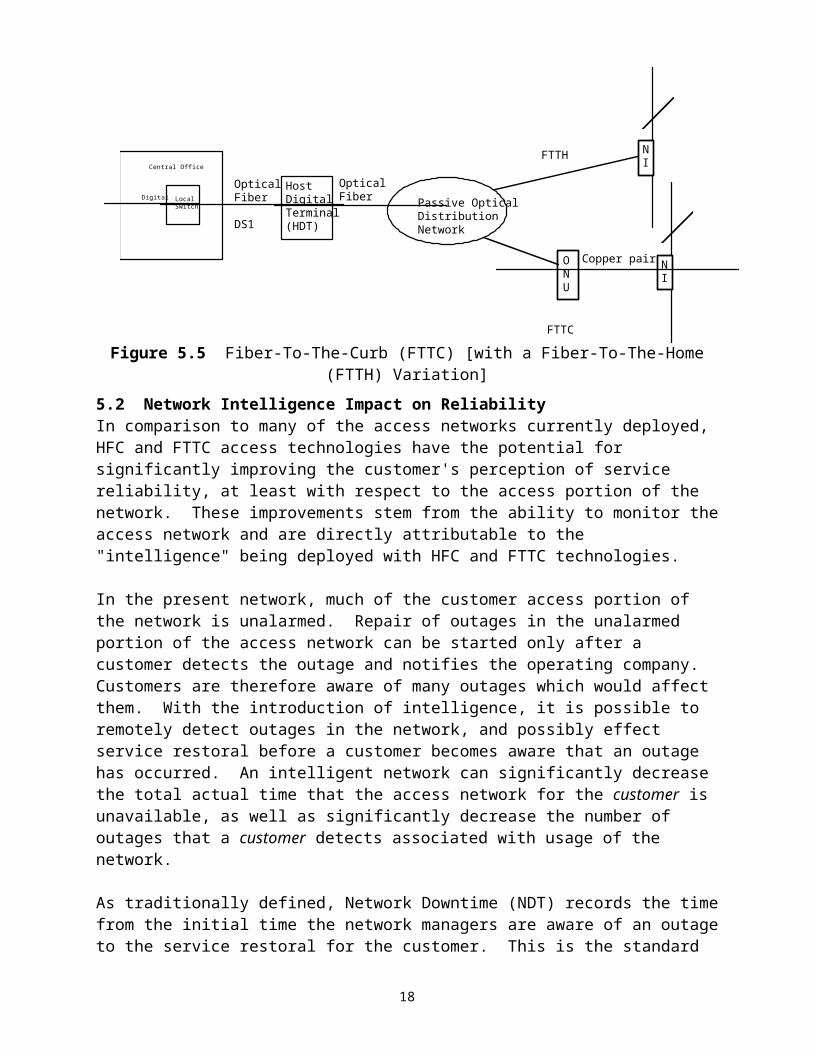
The Fiber-To-The-Curb (FTTC) system [with a Fiber-To-The-Home (FTTH) variation] shown in Figure 5.5 consists of an Host Digital Terminal (HDT), a Passive Optical Distribution (POD) network and Optical Network Units (ONUs). The HDT manages the ONUs and provides the interface to the local switch. The POD physically connects the ONUs to the HDT and contains only passive optical components. The ONUs provide the signal processing needed to convert between the optical signals and the analog telephone signals at the network interface. The ONUs are connected to the network interface by twisted-pairs of copper wire. With the FTTH variation, the fiber extends to the house where the ONU is located. Bellcore requirements, including reliability criteria, for the HDT and ONU are in TA-NWT-000909, Generic Requirements and Objectives for Fiber in the Loop Systems. [7]
12
LocalSwitch
Digital
Central Office
HostDigitalTerminal(HDT)
ONU
NI
NI
OpticalFiber
DS1
Passive OpticalDistributionNetwork
Copper pair
OpticalFiber
FTTH
FTTC
Figure 5.5 Fiber-To-The-Curb (FTTC) [with a Fiber-To-The-Home (FTTH) Variation]
5.2 Network Intelligence Impact on ReliabilityIn comparison to many of the access networks currently deployed, HFC and FTTC access technologies have the potential for significantly improving the customer's perception of service reliability, at least with respect to the access portion of the network. These improvements stem from the ability to monitor the access network and are directly attributable to the "intelligence" being deployed with HFC and FTTC technologies.
In the present network, much of the customer access portion of the network is unalarmed. Repair of outages in the unalarmed portion of the access network can be started only after a customer detects the outage and notifies the operating company. Customers are therefore aware of many outages which would affect them. With the introduction of intelligence, it is possible to remotely detect outages in the network, and possibly effect service restoral before a customer becomes aware that an outage has occurred. An intelligent network can significantly decrease the total actual time that the access network for the customer is unavailable, as well as significantly decrease the number of outages that a customer detects associated with usage of the network.
As traditionally defined, Network Downtime (NDT) records the time from the initial time the network managers are aware of an outage to the service restoral for the customer. This is the standard downtime measure used in present telephony. For comparison, let the Customer Downtime (CDT) record the time from the initial time the customer becomes aware of an outage to the service restoral for that customer. If the access network is primarily unalarmed, then clearly the two measures are essentially equal, because outages first require detection by a customer. However, if the network is alarmed, CDT could be significantly smaller than NDT, because many outages could go undetected by the customer.
The hypothetical example below illustrates the improvements in the customer's perception of reliability of the access network that could be anticipated with the new wireline access technologies. This example considers a possible access network implementation for telephony, and examines its reliability using the measures of Network Downtime (NDT) and Customer Downtime (CDT).
13
Example:
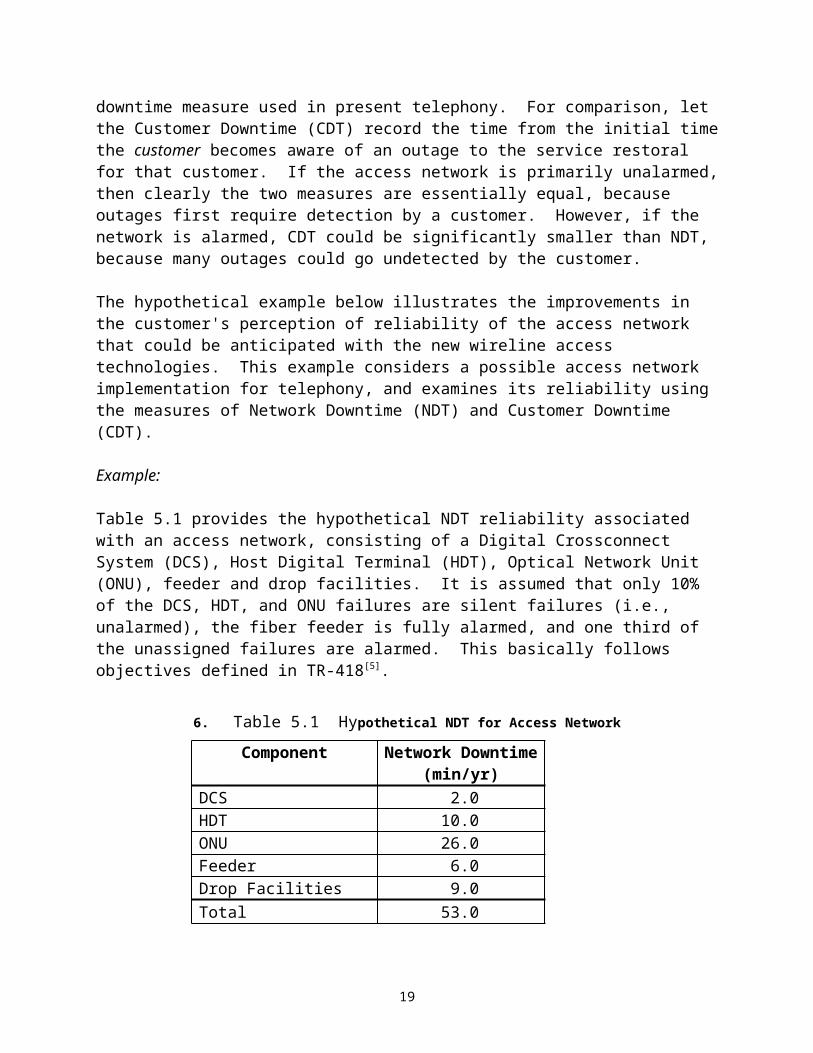
Table 5.1 provides the hypothetical NDT reliability associated with an access network, consisting of a Digital Crossconnect System (DCS), Host Digital Terminal (HDT), Optical Network Unit (ONU), feeder and drop facilities. It is assumed that only 10% of the DCS, HDT, and ONU failures are silent failures (i.e., unalarmed), the fiber feeder is fully alarmed, and one third of the unassigned failures are alarmed. This basically follows objectives defined in TR-418[5].
6. Table 5.1 Hypothetical NDT for Access Network
Component Network Downtime (min/yr)
DCS 2.0HDT 10.0ONU 26.0Feeder 6.0Drop Facilities 9.0Total 53.0
In the new technologies, counterparts to all of these elements of the access network could use the intelligence of the network for immediate detection of outages. As such, not all outages will be detected by the customers. Clearly, the customer perception of reliability depends directly on the customer’s level of network usage. If the typical call duration is 10 minutes, and the average time between calls is 100 minutes (resulting in a total telephony utilization of roughly 9%, or a little more than a total of 2 hours per day), the total downtime the customer experiences can be calculated. The results of this calculation are given in Table 5.2.
14
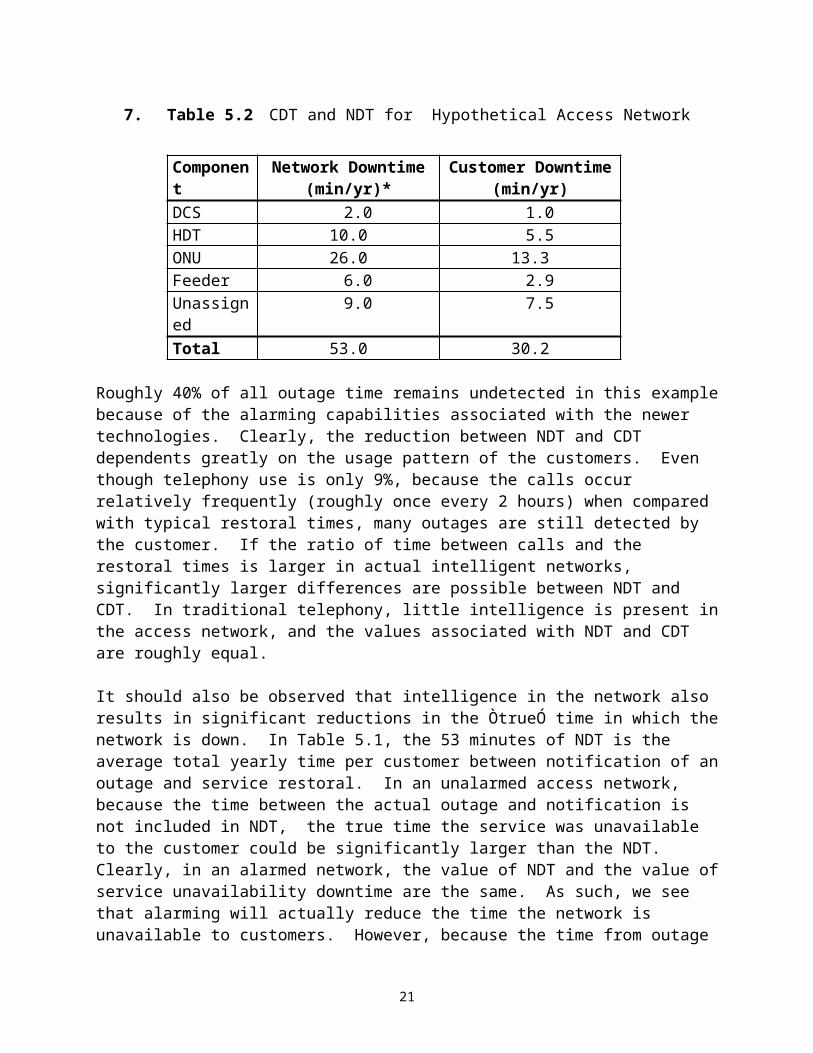
7. Table 5.2 CDT and NDT for Hypothetical Access Network
Component
Network Downtime (min/yr)*
Customer Downtime (min/yr)
DCS 2.0 1.0HDT 10.0 5.5ONU 26.0 13.3Feeder 6.0 2.9Unassigned 9.0 7.5Total 53.0 30.2
Roughly 40% of all outage time remains undetected in this example because of the alarming capabilities associated with the newer technologies. Clearly, the reduction between NDT and CDT dependents greatly on the usage pattern of the customers. Even though telephony use is only 9%, because the calls occur relatively frequently (roughly once every 2 hours) when compared with typical restoral times, many outages are still detected by the customer. If the ratio of time between calls and the restoral times is larger in actual intelligent networks, significantly larger differences are possible between NDT and CDT. In traditional telephony, little intelligence is present in the access network, and the values associated with NDT and CDT are roughly equal.
It should also be observed that intelligence in the network also results in significant reductions in the ÒtrueÓ time in which the network is down. In Table 5.1, the 53 minutes of NDT is the average total yearly time per customer between notification of an outage and service restoral. In an unalarmed access network, because the time between the actual outage and notification is not included in NDT, the true time the service was unavailable to the customer could be significantly larger than the NDT. Clearly, in an alarmed network, the value of NDT and the value of service unavailability downtime are the same. As such, we see that alarming will actually reduce the time the network is unavailable to customers. However, because the time from outage to notification cannot be determined from field data for the unalarmed network, estimates of the true unavailability are difficult, and as such are not typically reported.
As this example shows, the fundamental shift in the new technologies to increasing intelligence of the access network has the potential to significantly improve the customerÕs perception of reliability of the access network. This example did not include other effects of network intelligence, such as predictive monitoring for failures (i.e., replacing a degrading component before it actually fails) or reduced repair times due to improved diagnostic capabilities.
15
5.3 PoweringTo meet the reliability objectives of current telephone service,† backup powering methods are used to ensure the continuation of telephone service during commercial power outages. For traditional telephone service, these methods include the use of batteries, which are charged from commercial power, and secondary backup generators in the CO. These power sources together provide the reliable power needed for the operation of CO equipment and traditional telephone sets. The power is transmitted from the CO to the telephone sets over the same copper wire used for transmitting telephone signals.
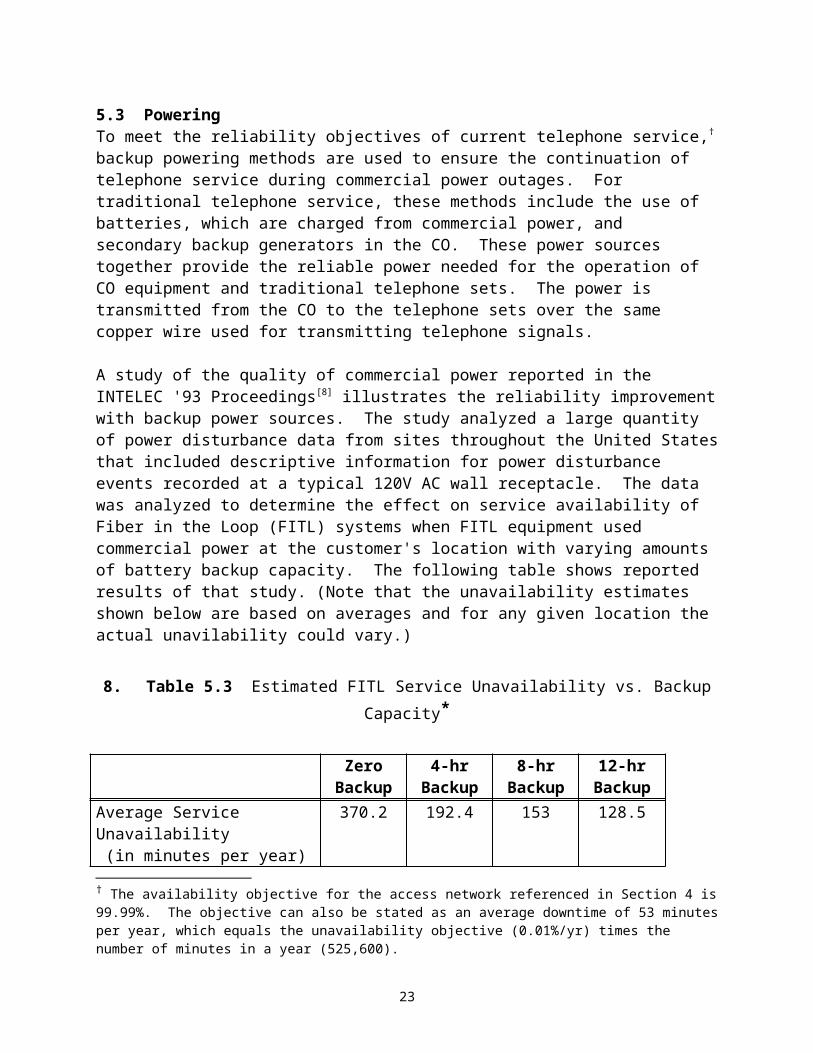
A study of the quality of commercial power reported in the INTELEC '93 Proceedings[8] illustrates the reliability improvement with backup power sources. The study analyzed a large quantity of power disturbance data from sites throughout the United States that included descriptive information for power disturbance events recorded at a typical 120V AC wall receptacle. The data was analyzed to determine the effect on service availability of Fiber in the Loop (FITL) systems when FITL equipment used commercial power at the customer's location with varying amounts of battery backup capacity. The following table shows reported results of that study. (Note that the unavailability estimates shown below are based on averages and for any given location the actual unavilability could vary.)
8. Table 5.3 Estimated FITL Service Unavailability vs. Backup Capacity*
Zero Backup
4-hr Backup
8-hr Backup
12-hr Backup
Average Service Unavailability (in minutes per year)
370.2 192.4 153 128.5
* All unavailability estimates are derived directly from the data, with no adjustment to account for possible secondary backup (e.g., generator) power during long-duration disturbances. All values are calculated based on the combined effect of outage and low-voltage events.
As table 5.3 illustrates, the unavailability for commercial powering is significantly greater than the telephone access network objective of 53 minutes per year.
Power provision becomes an important issue for the new wireline access technologies because as more optical fiber (which does not conduct electricity) and more electronics are deployed deeper (i.e., closer to the home) into the access network, it becomes increasingly costly to provide primary and secondary backup power sources. (Cost is an issue because network-powered wireline technologies compete with other technologies, such as wireless, where power for the telephone that transmits and receives the "wireless" signal is provided by the customer.) The remainder of this section describes the challenges associated with providing reliable power for the access network and reports findings on how the industry is finding innovative ways, based on local conditions, to meet these challenges.
† The availability objective for the access network referenced in Section 4 is 99.99%. The objective can also be stated as an average downtime of 53 minutes per year, which equals the unavailability objective (0.01%/yr) times the number of minutes in a year (525,600).
16
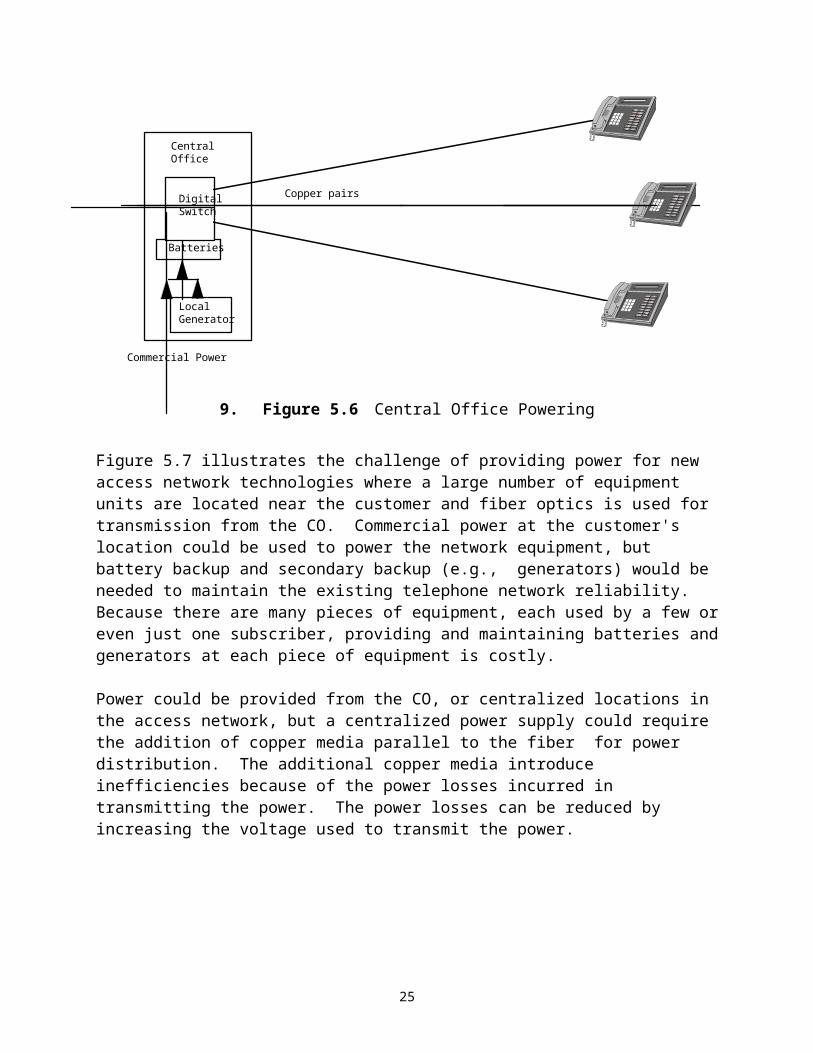
5.3.1 Access Network Powering - The ChallengeFigure 5.6 illustrates how the access network is currently powered today. Batteries provide power for the CO equipment and for transmission over the copper pairs of wire to the telephone sets. The batteries are charged from a commercial power source with secondary backup provided by a permanently available local generator. The cost of the batteries and local generator can be shared by the relatively large number of customers connected to the CO.
DigitalSwitch
Batteries
LocalGenerator
CentralOffice
Commercial Power
Copper pairs
9. Figure 5.6 Central Office Powering
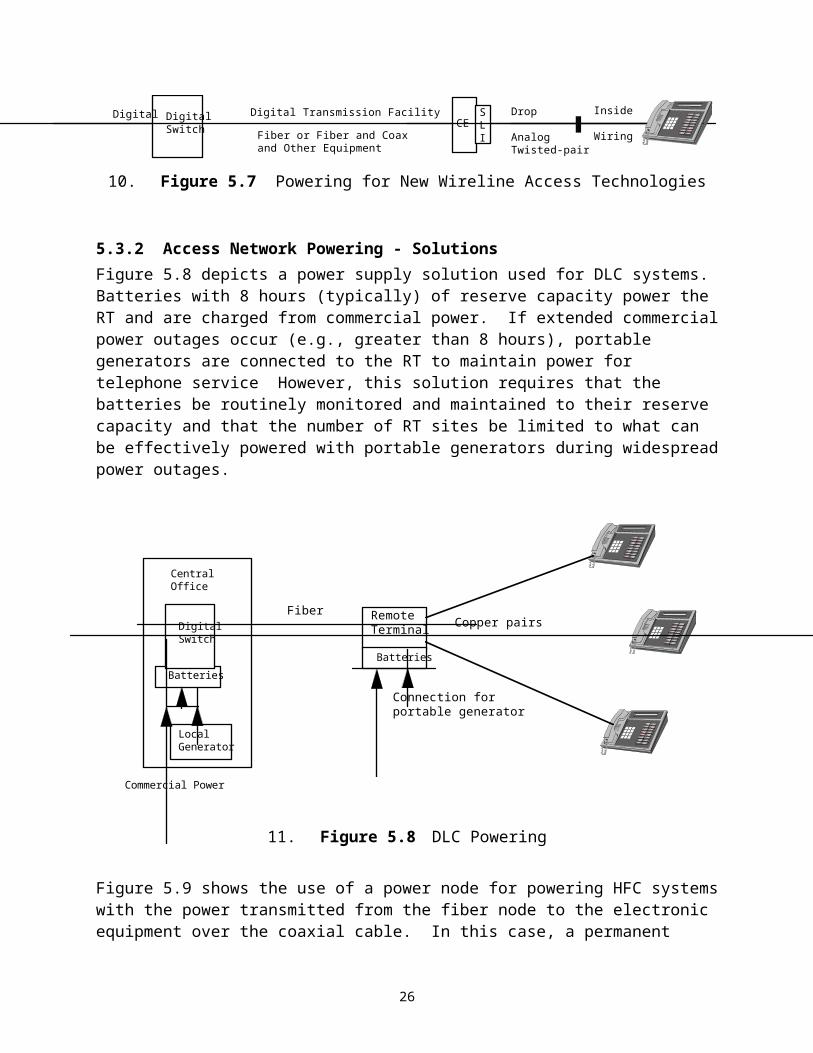
Figure 5.7 illustrates the challenge of providing power for new access network technologies where a large number of equipment units are located near the customer and fiber optics is used for transmission from the CO. Commercial power at the customer's location could be used to power the network equipment, but battery backup and secondary backup (e.g., generators) would be needed to maintain the existing telephone network reliability. Because there are many pieces of equipment, each used by a few or even just one subscriber, providing and maintaining batteries and generators at each piece of equipment is costly.
Power could be provided from the CO, or centralized locations in the access network, but a centralized power supply could require the addition of copper media parallel to the fiber for power distribution. The additional copper media introduce inefficiencies because of the power losses incurred in transmitting the power. The power losses can be reduced by increasing the voltage used to transmit the power.
SLI
CEDrop
AnalogTwisted-pair
DigitalSwitch
Digital Inside
Wiring
Digital Transmission Facility
Fiber or Fiber and Coaxand Other Equipment
17
10. Figure 5.7 Powering for New Wireline Access Technologies
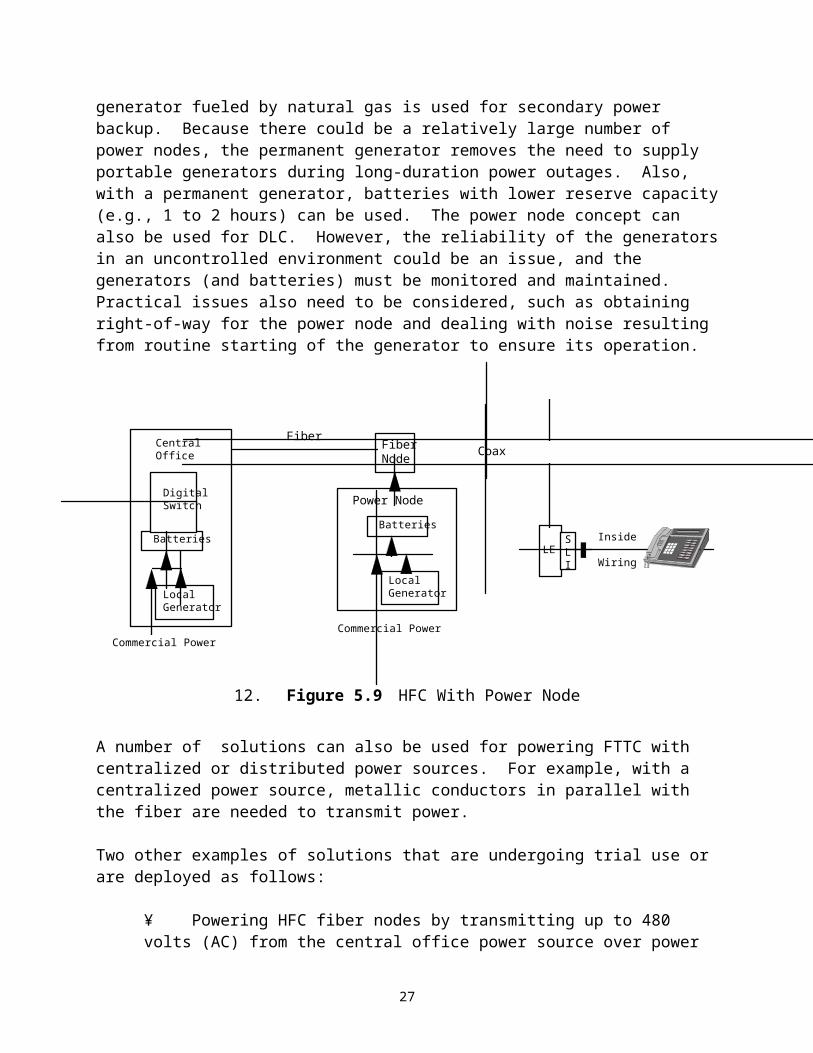
5.3.2 Access Network Powering - SolutionsFigure 5.8 depicts a power supply solution used for DLC systems. Batteries with 8 hours (typically) of reserve capacity power the RT and are charged from commercial power. If extended commercial power outages occur (e.g., greater than 8 hours), portable generators are connected to the RT to maintain power for telephone service However, this solution requires that the batteries be routinely monitored and maintained to their reserve capacity and that the number of RT sites be limited to what can be effectively powered with portable generators during widespread power outages.
DigitalSwitch
Batteries
LocalGenerator
CentralOffice
Commercial Power
Batteries
RemoteTerminal
Fiber
Connection forportable generator
Copper pairs
11. Figure 5.8 DLC Powering
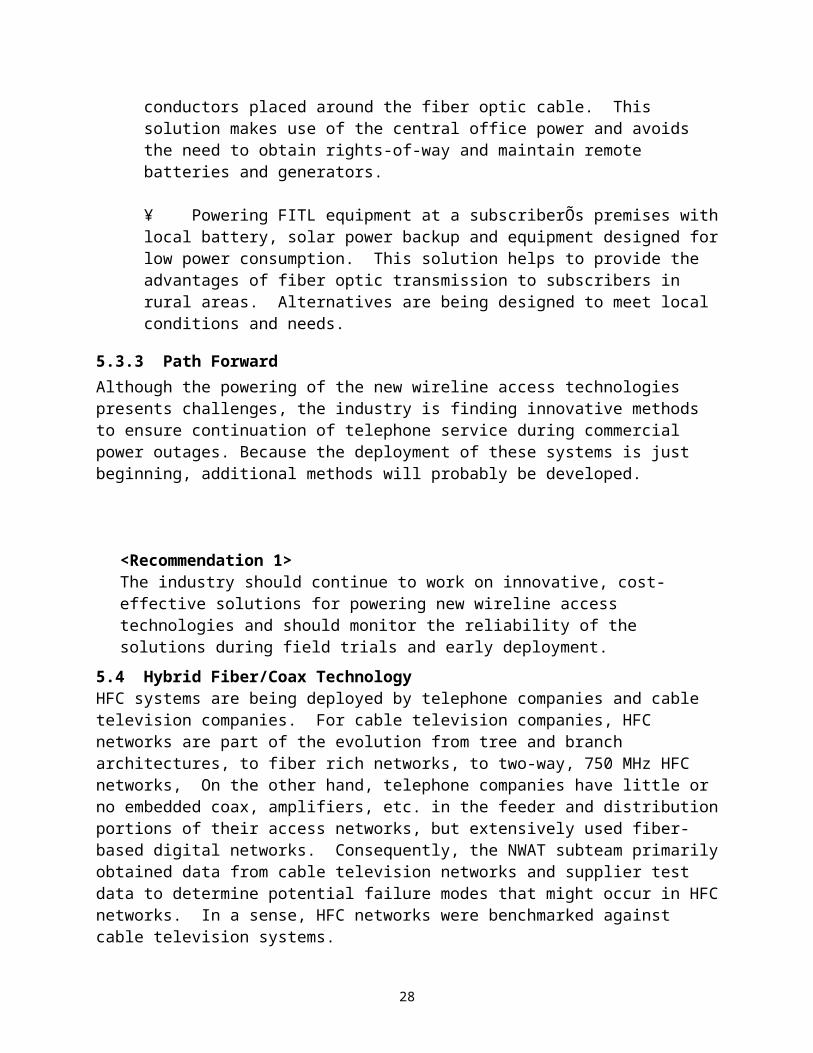
Figure 5.9 shows the use of a power node for powering HFC systems with the power transmitted from the fiber node to the electronic equipment over the coaxial cable. In this case, a permanent generator fueled by natural gas is used for secondary power backup. Because there could be a relatively large number of power nodes, the permanent generator removes the need to supply portable generators during long-duration power outages. Also, with a permanent generator, batteries with lower reserve capacity (e.g., 1 to 2 hours) can be used. The power node concept can also be used for DLC. However, the reliability of the generators in an uncontrolled environment could be an issue, and the generators (and batteries) must be monitored and maintained. Practical issues also need to be considered, such as obtaining right-of-way for the power node and dealing with noise resulting from routine starting of the generator to ensure its operation.
18
DigitalSwitch
Batteries
LocalGenerator
CentralOffice
Commercial Power
FiberNode
SLI
LEInside
Wiring
CoaxFiber
Batteries
LocalGenerator
Commercial Power
Power Node
12. Figure 5.9 HFC With Power Node
A number of solutions can also be used for powering FTTC with centralized or distributed power sources. For example, with a centralized power source, metallic conductors in parallel with the fiber are needed to transmit power.
Two other examples of solutions that are undergoing trial use or are deployed as follows:
¥ Powering HFC fiber nodes by transmitting up to 480 volts (AC) from the central office power source over power conductors placed around the fiber optic cable. This solution makes use of the central office power and avoids the need to obtain rights-of-way and maintain remote batteries and generators.
¥ Powering FITL equipment at a subscriberÕs premises with local battery, solar power backup and equipment designed for low power consumption. This solution helps to provide the advantages of fiber optic transmission to subscribers in rural areas. Alternatives are being designed to meet local conditions and needs.
5.3.3 Path ForwardAlthough the powering of the new wireline access technologies presents challenges, the industry is finding innovative methods to ensure continuation of telephone service during commercial power outages. Because the deployment of these systems is just beginning, additional methods will probably be developed.
<Recommendation 1>The industry should continue to work on innovative, cost-effective solutions for powering new wireline access technologies and should monitor the reliability of the solutions during field trials and early deployment.
19

5.4 Hybrid Fiber/Coax Technology HFC systems are being deployed by telephone companies and cable television companies. For cable television companies, HFC networks are part of the evolution from tree and branch architectures, to fiber rich networks, to two-way, 750 MHz HFC networks, On the other hand, telephone companies have little or no embedded coax, amplifiers, etc. in the feeder and distribution portions of their access networks, but extensively used fiber-based digital networks. Consequently, the NWAT subteam primarily obtained data from cable television networks and supplier test data to determine potential failure modes that might occur in HFC networks. In a sense, HFC networks were benchmarked against cable television systems.
As discussed previously, the cable television network has typically been designed with tens of amplifiers in cascade, no power backup, and is designed to provide a broadcast entertainment video service. This service’s reliability needs and service requirements are completely different from those of telephony services. In a competitive market, it will become necessary for the cable television networks to be upgraded to meet the reliability objectives of the competing telephony service provider if similar services are to be provided. From a reliability perspective, fiber-rich CATV networks differ from traditional cable television networks in that they have:
· more fiber· fewer amplifiers in cascade (typically fewer than about seven in cascade)· two-way, higher frequency amplifiers.
In addition, it is anticipated that HFC systems will incorporate one or more of the following:
· surge protection for power supplies and amplifiers· battery backup to keep the telephony services operational during commercial power outages· operational support systems that constantly monitor the network and network elements· components with higher reliability (e.g., amplifiers).
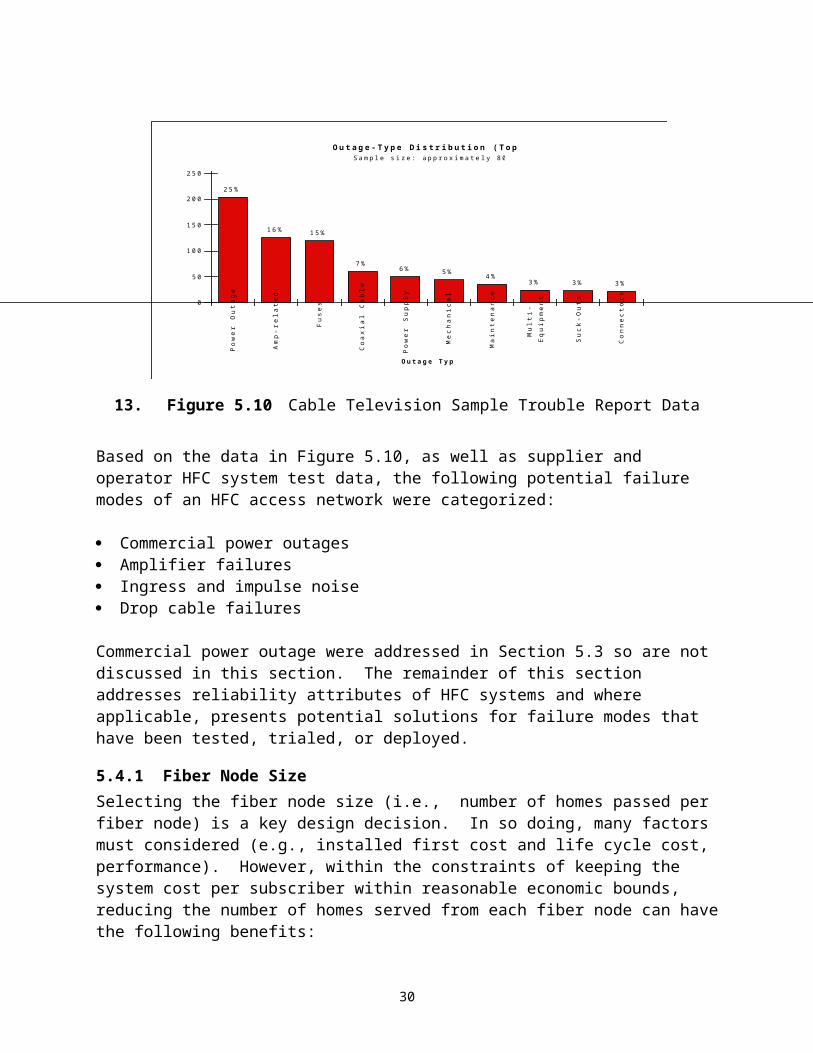
As an example of the data collected on current cable television failure modes, Figure 5.10 summarizes data collected from a state office of cable television based on a sampling of 800 trouble reports from 1994 and the first half of 1995. Although the data in Figure 5.10 does not provide failure rate information, it does show the types of failure modes that may be experienced in todayÕs cable television system. Reporting criteria were based on 50 or more customers affected for 2 or more hours, or 500 or more customers affected for 1 hour or more.
20
O u t a g e -Ty p e D is t r ib u t io n (To p 1 0 )
O u t a g e Ty p e
Inc
ide
nt
Co
un
t
0
5 0
1 0 0
1 5 0
2 0 0
2 5 0
Pow
er O
uta
ge
Am
p-r
elat
ed
Fuse
s
Coa
xial
Cab
le
Pow
er S
up
ply
Mec
han
ical
Mai
nte
nan
ce
Mu
lti-
Eq
uip
men
t
Su
ck-O
uts
Con
nec
tors
3 %3 %3 %4 %5 %6 %7 %
1 5 %1 6 %
2 5 %
S a m p le s iz e : a p p r o x im a t e ly 8 0 0 o u t a g e s
13. Figure 5.10 Cable Television Sample Trouble Report Data
Based on the data in Figure 5.10, as well as supplier and operator HFC system test data, the following potential failure modes of an HFC access network were categorized:
· Commercial power outages· Amplifier failures· Ingress and impulse noise· Drop cable failures
Commercial power outage were addressed in Section 5.3 so are not discussed in this section. The remainder of this section addresses reliability attributes of HFC systems and where applicable, presents potential solutions for failure modes that have been tested, trialed, or deployed.
5.4.1 Fiber Node SizeSelecting the fiber node size (i.e., number of homes passed per fiber node) is a key design decision. In so doing, many factors must considered (e.g., installed first cost and life cycle cost, performance). However, within the constraints of keeping the system cost per subscriber within reasonable economic bounds, reducing the number of homes served from each fiber node can have the following benefits:
1) Because the number of system amplifiers and line extenders is reduced, the single points of failure are reduced.2) Failure group sizes are smaller.3) Opportunities for ingress are reduced.
In one example, when a fiber node serving area was reduced from 2,000 homes passed to 500 homes passed, the number of amplifiers in the distribution network was reduced from 100 to 25.
21
The number of amplifiers in a cascade from the fiber node to the most distant subscriber was reduced from 7 to 4 and the maximum failure group for the fiber node was reduced from 2,000 to 500.
Reduction of the fiber node serving area must be balanced with the increased infrastructure costs per subscriber that are incurred as the serving area is reduced. Maintenance action rates must also be considered (e.g., increased number of fiber nodes versus decreased number of amplifiers).
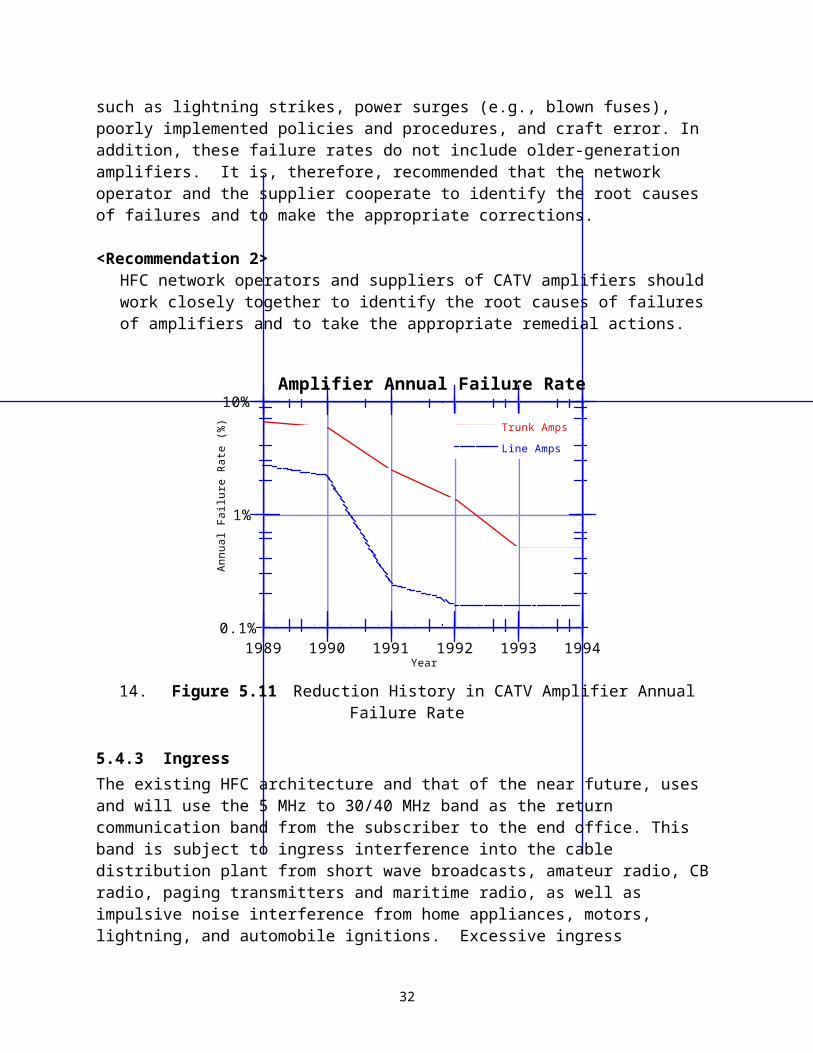
5.4.2 Amplifier FailuresThe amplifiers in the fiber serving area can be distribution amplifiers, which allow a coaxial cable trunk line to extend farther into the serving area or line extender amplifiers, which extend branches from the trunk. The number of amplifiers in the fiber node serving area is correlated to the number of homes served. To improve network availability rates, the tendency has been to reduce the number of amplifiers in cascade (e.g., by reducing the number of homes served per fiber node). At the same time, improving the reliability of amplifiers used in the distribution plant should be considered. The results published by a major supplier of amplifiers to the CATV industry are shown in Figure 5.11[9}. According to the supplier, these failures rates are based on a fully implemented field return monitoring program established in 1989. This figure illustrates that by aggressively correcting root causes of amplifier failures found in the first few years of the program, it is possible to significantly reduce the failure rate. The illustrated amplifier failure rates apply only to actual hardware failures. The amplifier failure rate in a network can be higher due to factors such as lightning strikes, power surges (e.g., blown fuses), poorly implemented policies and procedures, and craft error. In addition, these failure rates do not include older-generation amplifiers. It is, therefore, recommended that the network operator and the supplier cooperate to identify the root causes of failures and to make the appropriate corrections.
<Recommendation 2>HFC network operators and suppliers of CATV amplifiers should work closely together to identify the root causes of failures of amplifiers and to take the appropriate remedial actions.
22
0.1%
1%
10%
1989 1990 1991 1992 1993 1994
Amplifier Annual Failure Rate
Trunk AmpsLine Amps
Annu
al F
ailu
re R
ate
(%)
Year
14. Figure 5.11 Reduction History in CATV Amplifier Annual Failure Rate
5.4.3 IngressThe existing HFC architecture and that of the near future, uses and will use the 5 MHz to 30/40 MHz band as the return communication band from the subscriber to the end office. This band is subject to ingress interference into the cable distribution plant from short wave broadcasts, amateur radio, CB radio, paging transmitters and maritime radio, as well as impulsive noise interference from home appliances, motors, lightning, and automobile ignitions. Excessive ingress interference the HFC return plant will limit the capacity of services offered and degrade the quality of services offered. In extreme cases, it could completely block an offered service.
Characterization studies of the CATV return plant have been performed.‡ These studies verify that ingress interference in the return plant is a potential impediment to anticipated service offerings requiring the use of the return plant. This is a very important issue because ingress interference directly affects the ability of the HFC network to offer reliable services using the return path.
The summary of available findings reported in Appendix B, suggests that a number of steps that can be taken to either reduce the levels of ingress in the return plant, or mitigate the effects of ingress on the service offered.
‡ See Appendix B for a more detailed discussion of tests and results.
23
1) Incorporate a comprehensive return plant maintenance program. This could include:
a) Tightening all loose connectorsb) Replacing corroded connectorsc) Sealing the distribution plant from water migrationd) Examinating the distribution plant for cracked cable sheathe) Checking for proper bonding and grounding
2) Segregate the return plant bandwidth and block that portion of bandwidth allocated to telephony services against ingress from the home.
3) Provide frequency agility so that the return signal can avoid interfering carriers.
4) Use a robust modulation scheme such as Quadra-Phase-Shift Keying (QPSK), Code Division Multiple Access (CDMA) and Discrete Multitone (DMT), or include Forward Error Correction (FEC) as part of the modulation method.
<Recommendation 3>HFC network operators intending to deploy telephony services should implement a comprehensive return plant maintenance program before such services are deployed.
<Recommendation 4>Industry continue to focus on developing and implementing methods to alleviate the effects of ingress and impulse noise in HFC networks.
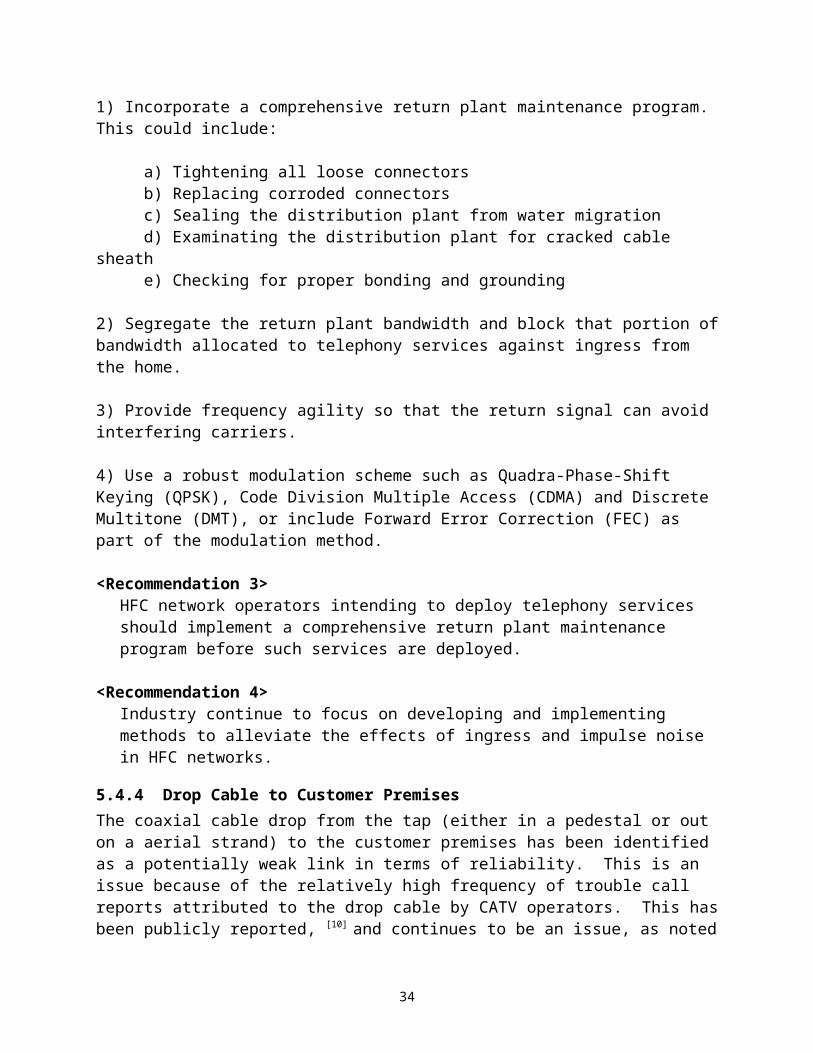
5.4.4 Drop Cable to Customer PremisesThe coaxial cable drop from the tap (either in a pedestal or out on a aerial strand) to the customer premises has been identified as a potentially weak link in terms of reliability. This is an issue because of the relatively high frequency of trouble call reports attributed to the drop cable by CATV operators. This has been publicly reported, [10] and continues to be an issue, as noted by a recent trouble call breakdown by a major CATV system operator. This breakdown is illustrated in Figure 5.12. As the data through August of 1995 shows, the cable drop was still the largest contributor to trouble calls for this operator. This is a significant issue that can directly affect the ability of the HFC network to offer reliable services because the cable drop is a single point of failure in the HFC architecture.
24
Cable Company "A" Trouble Call Breakdown Aug '94 to Aug '95
TAs5.0%
Passives4.6%
Coax4.0%
LEs3.0%
P.S.3.0%
Addressable Taps15.0%
DROP40.5%
Other3.2%
Head End16.5%
Fiber5.2%
...........
P.S. - Power Supply
LEs - Line Extenders
TAs - Trunk Amplifiers
15. Figure 5.12 Recent CATV Trouble Call Breakdown
As noted, studies of the causes of CATV trouble calls[10] prove that the drop cable and its connectors are the major sources of trouble. Some of the reasons reported are listed below:
1) Poor installation and maintenance practice including the following factors:· Improper Connector Installation -- such as improper stripping of the coax, tightening
of the connector shell to its mate, and lack of a weather seal over the connector.· Shallow cable burial - Deeper burial might avoid cuts due to typical lawn care
operations.· Burial without the protection of a containment tube.
2) Rodent Damage.3) Cable Cuts. This can be from digging equipment for buried cables and from tree falls or pole damage for aerial cables.3) Tampering with the drop by the home owner.
There appears to be no inherent reason why the coaxial drop cable cannot be made more reliable. It is believed that proper employee training and attention to installation detail will greatly alleviate the problem. Based on reports[10] and subteam inputs, some potentially mitigating solutions that might be considered include:
1) Stripping of drop cable for installation of ÒFÓ connectors.2) Creating torque specification in tightening the outer shell of the male ÒFÓ connector to its mate.3) Use of nickel plated shells on the male ÒFÓ connector to mate with nickel plated screw threads on the tap or NIU.4) Using flooded cable for underground installation.
25
5) Enclosing buried drop cable in conduits.6) Supporting aerial drop cable with an integral steel messenger line.7) Connecting of the drop cable to a properly installed grounding block at the NIU.8) Using amored drop cable where rodent damage has been a problem
Some manufacturers of coaxial cable are now supplying a higher quality coaxial cable for drops. This new cable is essentially a scaled down version of the “hard-line” coax used in the distribution plant, which is generally considered to be more reliable than the coax used for drop cables.
<Recommendation 5>It is recommended that the industry should continue to explore improved-reliability coaxial drop connection technologies for HFC networks, given their current major role in subscriber outages.
<Recommendation 6>HFC network operators intending to deploy telephony services should establish an employee training program and policies and procedures that will ensure proper installation and maintenance of the coaxial drop cable.
5.4.5 Fiber/Cable CutsBuried fiber and coaxial cable is subject to damage from accidental dig ups. Fiber/Cable cuts have contributed to a significant portion of network unavailability time. For example, Bellcore calculated an optical fiber cut rate of 4.39/year/1000 sheath miles.[11] This calculation was for both interoffice and access fiber. In an HFC system, most of the fiber will be access fiber only. Data is not available for the cut rate of just access fiber and coax. Using the Bellcore calculation, the annual failure rate due to fiber is 0.44 %/mile. For an average access fiber run of 6 miles and an average mean time to repair (MTTR) of 6 hours, an annual downtime estimate due to fiber/cable cuts is 9.5 minutes. Fiber and cable cuts remain an important issue in overall system reliability and merits review of past recommendations.
Because the fiber deployment and maintenance practice for HFC will be very similar to that used by the standard wireline telephony industry, the discussion and recommendations of Section A. ÒFiber Optic Cable Dig Ups: Causes and CuresÓ in Network Reliability: A Report to the Nation [12] should also apply to optical fiber and coaxial cable used in HFC networks. To further reduce the outage time caused by fiber cuts, some form of alternate path routing may be necessary. Route diversity in the form of unidirectional and bidirectional self-healing rings has been used in interoffice and long-haul telephone networks. This architecture, as well as other forms of route diversity, may be applicable to HFC access networks.
<Recommendation 7>Recommendations from Section A, ÒFiber Optic Cable Dig Ups: Causes and CuresÓ in Network Reliability: A Report to the Nation, should be applied to optical fiber and coaxial cable in access networks.
26
5.4.6 Other Best PracticesFollowing the Bellcore Reliability Assurance Practices for components, optoelectronic devices, and hybrid microcircuits (TRÐNWTÐ000357,[13] TRÐNWTÐ000468,[14] TRÐNWTÐ000930[15]) can serve as a key guide to improving fiber node and amplifier hardware reliability.
5.5 Fiber-To-The-Curb TechnologySeveral suppliers have developed FTTC systems, several operating companies have had field trials or early deployment of the systems, and at least one operating company has decided to continue deploying the systems. Requirements for FTTC systems were first published in 1990. Since then, research and development efforts have addressed many issues, including reliability issues associated with FTTC. Consistent with the learning curve typically associated with use of new technologies, the field trials and early deployments have identified further needed improvements, many of which were specific to a particular service provider’s operations or a particular supplier's product. However, the existing deployments have demonstrated the importance of carefully monitoring field performance during trials or early deployment, doing a root cause analysis of problems, and taking corrective action. The remainder of this section identifies reliability factors that should be considered for FTTC by comparing FTTC with an existing technology, DLC.
5.5.1 Potential FTTC Reliability IssuesSimilar to the approach used for HFC systems, one method of calculating the reliability of the new FITL technology is to benchmark the new technology to a deployed technology. By doing this, one can evaluate potential failure modes that might also occur in the new technology, as well as highlight differences that might improve or degrade the reliability of the new technology. Consequently, the NWAT subteam compared the FTTC architecture with the architecture of existing DLC systems and identified new characteristics of the FTTC architecture, including single points of failure, that could affect reliability. (Section 4 of this report describes DLC and FITL systems.)
Potential new reliability vulnerabilities relative to DLC can be identified by the single points of failure that are introduced in the FITL architecture. Single points of failure are important since traditionally they have the greatest potential of adding to network unavailability. For example, the FTTC architecture introduces unprotected hardware components such as optical components at the HDT and ONU, power supply and controller boards at the ONU, and ringing generators at the ONU. The passive distribution network also includes optical splitters that are a single point of failure. Although the splitters are passive, they are a relatively new technology and could be a source of reliability problems. The reliability of these single points of failure should be monitored during trials and early deployment. If there are high failure rates for any of these single points of failure, service providers should work with their supplier to determine and correct the root cause of the failures.
The ONU environment might be more uncontrolled than that of DLC, and ONUs will be deployed at relatively more locations. For these reasons, the environmental effects on the equipment, including ONU enclosures, should be monitored and any problems corrected before widespread deployment.
27
As discussed in Section 5.3, power supply is an issue because FTTC might be powered differently from DLC, or might have added components in the powering network, such as the copper wire used to distribute power to the ONUs. Because of power loss in the distribution and the power consumption of the added electronics, FTTC could use relatively more power than DLC (e.g., for a given number of customers served), heightening the concern about maintaining battery reliability. Added ONU equipment for broadband services, beyond telephone service, could also result in added power consumption. Integrating broadband services with telephony services during a power outage may add to the load incurred by the batteries if these services are not separable during a power outage. The effect of powering should be included in monitoring field reliability.
Effective methods, procedures, and training can be developed and tested during trials or early deployment. For example, two areas where procedures and training could increase the reliability of FTTC are fiber splicing, and bonding and grounding at the ONU. FTTC deployment will involve relatively more fiber deployment, and more fiber splices, than DLC deployment. Poor splices could become a reliability issue. Poor bonds and grounds could result in equipment and service failure due to voltage surges caused by lightning. Although splicing, bonding, and grounding can also be necessary for DLC, the relatively greater levels of fiber and equipment deployment can make these factors especially important for FTTC. Reliability problems due to inadequate methods, procedures, and training should be identified and corrected.
5.5.2 Path ForwardBecause of the learning curve associated with the deployment of new technologies, service providers should carefully monitor field reliability during trials or early deployment to identify the largest sources of failures, do a root cause analysis to identify the causes of the failures, and implement corrective action before widespread deployment. A well-designed study should be used to monitor field performance. The study should include a reliability objective for some measure (e.g., downtime or customer trouble reports) that can be used as a benchmark for the field results. Efforts should also be made to ensure that the scope of the field trial is broad enough and of sufficient duration to provide statistically significant results. The trial requires close cooperation between the network operator and the supplier to identify the root causes of failures and to make the appropriate corrections.
<Recommendation 8>Network operators, in cooperation with their suppliers, should establish a field reliability monitoring process during trials or early deployment as a means to identify sources of failures, do a root cause analysis, and implement corrective actions before widespread deployment.
5.6 Reliability TemplateThis section presents a checklist of items that should be considered when deploying new wireline access technologies. Generally, the checklist covers the technology-related issues discussed in this report and is not necessarily complete because these technologies are only in the early stages of deployment. The items are separated into two broad categories: Architecture/technology/operations and Installation/maintenance.
28
Architecture/Technology/Operations
· Does your company have a reliability objective for the access network?· Have you done a reliability analysis of the architecture?· Have you identified and addressed disaster recovery requirements (e.g., widespread power
outages)?· Have you done a reliability analysis of the systems and equipment to be used in the
deployment?· Have you reviewed the supplier's documentation and does it meet your criteria?· What is the reliability of telephone service using this technology (e.g., compared with
current technology)?· Have you identified the failure modes and the actions required to recover from each failure
mode?
Installation/Maintenance
· Have you developed standard equipment configurations?· Have you developed installation methods and procedures?· Have you documented your installation acceptance procedures?· Does your technology have capabilities for generating alarms?· Have you developed methods and procedures for routine hardware and software
maintenance?· Does the technology provide for nonservice affecting software change/maintenance
capabilities?· Do troubleshooting procedures exist, including procedures for fault visibility, trouble
verification and isolation, and recovery and repair?· Do methods exist for doing a post-mortem analysis of failures?· Is there a process to feedback findings and recommendations to improve future reliability?· Are there required craft training courses available in a timeframe consistent with the
deployment schedule?· Are new test sets required for this technology and will they be available in a time frame
consistent with the deployment scheduleIn addition, see Appendix D for a generic New Technology Reliability Template that can be used to assessment of the reliability of any new technology, including new wireline access technologies.
29
6. Summary of Recommendations
<Recommendation 1>The industry should continue working on innovative, cost-effective solutions for powering new wireline access technologies and should monitor the reliability of the solutions during field trials and early deployment.
<Recommendation 2>HFC network operators and suppliers of CATV amplifiers should work closely to identify the root causes of failures of amplifiers and take the appropriate remedial actions.
<Recommendation 3>HFC network operators intending to deploy telephony services should implement a comprehensive return plant maintenance program before such services are deployed.
<Recommendation 4>Industry should continue to focus on developing and implementing methods to alleviate the effects of ingress and impulse noise in HFC networks.
<Recommendation 5>It is recommended that the industry should continue to explore improved-reliability coaxial drop connection technologies for HFC networks, given their current major role in subscriber outages.
<Recommendation 6>HFC network operators intending to deploy telephony services should establish an employee training program and written policies and procedures that will ensure proper installation and maintenance of the coaxial drop cable.
<Recommendation 7>Recommendations from Section A. ÒFiber Optic Cable Dig Ups: Causes and CuresÓ in the Network Reliability: A Report to the Nation, should be applied to optical fiber and coaxial cable in access networks.
<Recommendation 8>Network operators, in cooperation with their suppliers, should establish a field reliability monitoring process during trials or early deployment as a means to identify sources of failures, do a root cause analysis, and implement corrective actions before widespread deployment.
30
7. ConclusionsThe new wireline access technologies subteam investigated primarily the reliability of telephony services transported over HFC and FTTC access networks. It was the intent of the subteam to investigate potential service reliability attributes (i.e., weaknesses and strengths) associated with new wireline access technologies. Based on these investigations, the most significant, high-level findings are as follows:
· Industry’s goal is to provide 99.99% reliability for telephony services provided over HFC and FTTC access networks
· Deployment of HFC and FTTC systems is just beginning; therefore, gathering of critical field data is in its early stages.
· Industry has identified several key reliability issues and potential mitigating solutions.
The most significant, high-level recommendations are as follows:
· Operators and suppliers should implement a process to gather field data on systems as they undergo trials and are deployed.
· Operators and suppliers should institute a process for root cause analysis on outages and develop best practices to improve reliability.
Some of the more significant detailed findings and recommendations are as follows:
· Commercial powering of HFC and FTTC (as well as DLC) will not meet the current reliability objectives for key services unless backup power is provided. Operators are trialing and deploying several mitigating solutions. Operators and suppliers should continue to focus on evaluating and implementing solutions to reduce the impact of commercial power outages on network reliability.
· Ingress and impulse noise can impair the ability of an HFC system to provide reliable, two-way services. Industry has identified several mitigating solutions, including system and network design, and network maintenance. Industry should continue to focus on developing and implementing methods to alleviate the effects of ingress and impulse noise.
· Coaxial drop cable failures continue to represent a significant portion of trouble calls in the cable television industry. Service providers that are planning to use coaxial drop cable must continue to consider potential ways of improving drop reliability, some of which are summarized in this report.
Additional detailed findings and recommendations are discussed throughout the text of the report.
8. AcknowledgmentsThe NWAT subteam would like to acknowledge Ken Young’s help and thank him for his support and encouragement in developing this report.
31
9. References1. ANSI T1.401-1993, Interface Between Carriers and Customer Installations - Analog
Voicegrade Switched Access Lines Using Loop-Start and Ground-Start Signaling.2. Bellcore Technical Reference TR-NWT-000057, Functional Criteria for Digital Loop
Carrier Systems, Issue 2, January 1993.3. Bellcore Technical Reference TR-TSY-000008, Digital Interface Between the SLC¨-96
Digital Loop Carrier System and a Local Digital Switch, Issue 2, August 1987, plus Revision 1, September 1993, plus Bulletin 1, October 1994.
4. Bellcore Generic Requirements GR-303-CORE, Integrated Digital Loop Carrier System Generic Requirements, Objectives and Interface, Issue 1, September 1995.
5. Bellcore TR-NWT-000418, Generic Reliability Assurance Requirements for Fiber Optic Transport Systems, Issue 2, December 1992.
6. Bellcore Technical Reference TR-NWT-000332, Reliability Prediction Procedure for Electronic Equipment, Issue 4, September 1992.
7. Bellcore Technical Reference TA-NWT-000909, Generic Requirements and Objectives for Fiber In The Loop Systems, Issue 2, December 1993.
8. Allen L. Black and James L. Spencer, “An Assessment of Commercial AC Power Quality: A Fiber-In-The Loop Perspective,” INTELEC ‘93 Proceedings.
9. Chuck Merk and Walt Srode, ÒReliability of CATV Broadband Distribution Networks for Telephony ApplicationsÐ Is it good enough ?,Ó 1995 NCTA Technical Papers, pp. 93-107.
10. Brian Bauer, ÒIn-Home Cabling for Digital Services: Future Proofing Signal Quality and Minimizing Signal Outages,Ó 1995 SCTE Conference on Emerging Technologies, pp. 95Ð100.
11. D. S. Kobayashi and M. Tesfaye, ÒAvailability of Bi-Directional Line Switched RingsÓ, Report T1X1.5/91-070, April 1991.
12. Network Reliability: A Report to the Nation, June 1993, National Engineering Consortium.13. Bellcore Technical Reference TR-NWT-000357, Generic Requirements for Assuring the
Reliability of Components Used in Telecommunication Systems, Issue 2, October 1993.14. Bellcore Technical Reference TR-NWT-000468, Reliability Assurance Practices for
Optoelectronic Devices in Central Office Applications, Issue 1, December 1991.15. Bellcore Technical Reference TR-NWT-000930, Generic Requirements for Hybrid
Microcircuits Used in Telecommunications Equipment, Issue 2, September 1993.16. CableLabs¨, ÒTwo-Way Cable Television System Characterization,Ó Final Report, April 12,
1995.17. Mark Dzuban, ÒAT&T Ingress Study,Ó Submitted to IEEE 802.14-94/003 November 1994.
32
10. AppendicesAppendix A - Overview of an Example Broadband HFC ArchitectureThe Hybrid Fiber Coax (HFC) architecture has many forms and variations. No industry standard, exists but there are basic components common to all HFC networks.
1) An optical fiber feeder from a fiber hub to a fiber serving area (FSA). The fiber feeder terminates in the serving area in a fiber node.2) The fiber serving area covers from about 100 to 2000 homes served depending on the application.3) The fiber node feeds the fiber serving area using a coaxial tree and branch type network.
Use Word 6.0c or later to
view Macintosh picture.
16. Figure A.1 Generic HFC Architecture
The fiber hub could be an end office feeding multiple fiber nodes or a remote hub feeding a single fiber node. For a telephony application, the Host Digital Terminal (HDT) could be located in the fiber node, the end office, a remote fiber hub, in a serving office feeding regional hubs, or in an operations center feeding multiple serving offices. A possible high-level depiction of a regional backbone where the HDT could be located in any one of the circles is shown in figure A.2 on the next page. For overall system reliability analysis, the total network between the HDT location and the Fiber Node must be taken into account, but in most implementations the HDT will be in the End Office or Fiber Node.
33
OC
SO
SO
EO
SO
EO
EO
FN
FN
FN
150 Homes
150 Homes
150 Homes 150 Homes
OC = Operations CenterSO = Serving OfficeEO = End OfficeFN = Fiber Node
17.
18. Figure A.2 An Example Regional HFC Network
For purposes of analysis, the network can be segmented into a series connection of functional blocks starting from the insertion of the telephony signal into the HFC network to the RJ11 interface at the in-home telephone network.
1) Backbone Network2) Serving Office3) Fiber Network and Fiber Node4) Coaxial Distribution Network5) Network Interface Unit
The backbone network between the Operations Center and the Serving Office can take many forms depending on the total network architecture of a particular system. In some cases the operations center will be co-located in the Serving Office so that there is no backbone network. If a backbone network exists, the transport path from the Operations Center to the Serving Office must be accounted for in overall system reliability calculations. In most cases, this path will be a part of a regional ring or multiple ring network. These rings are often set up as either uni-directional or bidirectional and Òself-healingÓ; that is, a single break in the path does not result in a loss of service. The Serving Office may contain the Host Digital Terminal (HDT), passive combiners, amplifiers and optical transmitter.
The fiber network consists of the optical fiber bundle (usually containing 4 to 12 individual optical fibers) between the Serving Office and the Fiber Node. The optical bundle can branch off in the network to serve more than one Fiber Node so that a fiber bundle cut could affect more than one Fiber Node depending on where the cut occurred. The Fiber Node consists of the downstream optical receiver and distribution amplifier as well as the upstream laser transmitter. It is possible for the HDT to also be located at the Fiber Node. A power supply can be co-located
34
with the Fiber Node to provide power to the Node and to other active elements in the coax distribution plant.
The coax distribution network consists of the coaxial cable, bidirectional amplifiers, any additional power supplies, and passive elements such as splitters, directional couplers, filters and taps. This network today uses the tree and branch construction technique, which is a carryover from all coaxial cable networks. For a large Fiber Serving Area (about 500 homes or greater), this will probably still be the method of choice. Any failure in a non-redundant element of this network between the Fiber Node and the home served will result in a loss of service to one or more homes depending on where the element failure occurred. Smaller Fiber Serving Areas could use a star type network, which could further limit the number of homes affected by a single-point failure.
The Network Interface Unit (NIU) provides the interface between the coaxial distribution network and the in-home telephone network. It will usually be placed on the outside of the home but could be inside for multiple dwelling units. To provide lifeline type services, the NIU will often be powered from the network either through the drop cable or through a separate twisted pair that is a part of the drop cable protective jacket.
The fiber node is a key element in the system. A failure in the fiber node can cut service to all of the homes served by that node. The fiber node contains the components for downstream and upstream operation. A block diagram showing several of the major components in a typical fiber node is shown in Figure A.3. Failures in the optical receiver, return path laser, fiber node power supply, or in amplifiers #1 and #2 affect service to all homes served by the node. A fiber node will typically have multiple coaxial ports to feed coaxial trunk lines into the serving area. Failures in any one of the amplifiers feeding these four ports will affect only those homes served from a failed port.
35
Use Word 6.0c or later to
view Macintosh picture.
19. Figure A.3 Typical Fiber Node Block Diagram
36
Appendix B - Ingress Reliability Issues in HFC Access Networks
B.1 IntroductionThe CATV industry uses the 50 MHz to 450 MHz band for downstream analog video broadcasts. New downstream services are expected use between 550 MHz and 750 MHz in the near term and up to 1 GHz in the future. The most convenient band for upstream services (from the consumer back to the serving office) is the 5 to 40 MHz spectrum below the downstream band.
One of the issues associated with the HFC architecture is that the return path below 50 MHz is very susceptible to ingress interference from many sources. These include short wave broadcasts, amateur radio, ISM (Industry, Scientific, and Medical) equipment, CB radio, and many possible interference sources from within the home. The entry points of ingress into the return plant are through loose or corroded connectors, improper grounding, improperly sealed network elements (amplifiers, couplers, taps, etc.), damaged cable drops, and worst of all ingress injected into the return plant from improper or tampered with in-home cabling. By the nature of the coaxial distribution network, all interference sources entering the network in a fiber serving area are funneled into the return fiber. In some cases, the outputs from several fiber serving areas are combined into one return fiber. All of these factors increase the effect of interference signals leaking into the return plant.
B.2 Ingress Studies
Because of the potential of this interference affecting the reliability of upstream communication from the consumer, ingress interference in the cable plant has been studied by CableLabs¨, AT&T, and Motorola (among others). The CableLabs¨ report [16] on characterization of the CATV cable plant is a comprehensive study of five different cable systems accomplished over about a one year period. The following is a very brief summary of the report:
1) Five separate cable systems were studied. All five systems had significant return plant problems that had to be corrected before meaningful tests could be made. In two of the systems, return plant problems were never completely fixed.
2) For short-term ingress measurements, the test signal for both upstream and downstream tests was a QPSK carrier modulated with a T1 data stream with no error correction. An HP test set was used to record all the error statistics. All the downstream tests on all five systems met the G.821 end-to-end objectives for Errored Seconds, Severely Errored Seconds, Degraded Minutes and percent availability. The long-term bit error rate in the downstream was in the 10-7 area with a few error bursts exceeding 10-6 during a 48 hour test run. The results in the upstream were much worse than in the downstream. For the most part G.821 (i.e., an ITU recommendation for bit error objectives on digital links) objectives were not met. Long-term BER was in the 10-5 area with numerous error bursts in the 10-3 to 10-2 area. Some of these error bursts lasted for many seconds. There was no correlation between these severe error bursts in the upstream and
37
error activity in the downstream. CableLabs¨ recommendations, based on their report, included the following: a) Plant Segmentation -- Reduce the serving area.b) Maintenance -- Must have a comprehensive and thorough plant hardening effort and precise return plant gain alignment. Fix loose and corroded connectors, splices and terminators, cracked cable sheath, poor grounding, and water migration.c) Incorporate a status monitoring systemd) Control the level of (Impulse Pay-Per-View) IPPV carrierse) Clean up the subscriber drop
The AT&T study [17] reported essentially the same ingress levels and included estimates of outage time for QPSK and 16 QAM modulated carriers in the 5 to 40 MHz return band. By current wireline telephony standards, outage time for the system tested was unacceptable for the lower half of this band, even with Forward Error Correction (FEC) used as part of the modulation scheme.
Motorola has also gathered ingress data from 10 different serving areas in 4 different CATV systems. The results of these studies are discussed in the next sections. It is important to note that these are existing CATV systems not upgraded to carry telephony services.
B.3 Long-Term Ingress StudiesLongterm ingress is characterized by ingress events that last from seconds to hours. Individual ingress carriers are usually confined to a narrow spectral line (25 kHz bandwidth or less) in the 5 to 40 MHz band. The magnitude and frequency of these events vary with the time of day, the season, and the sun spot cycle. Motorola has also found that the magnitude of these ingress carriers is strongly affected by the return plant maintenance policy of the cable operator. Shown below is the typical ingress levels from two different HFC systems, the first with 959 subscribers in the fiber serving area and the second with 7000 subscribers in the fiber serving area. As can be seen from the graphs in Figures B1 and B2, a system with a well-maintained return plant has substantially lower ingress levels than the system without such maintenance, even though the fiber node serves seven times the number of subscribers. In both cases, the scans represent incidents of peak activity.
38
Use Word 6.0c or later to
view Macintosh picture.
20. Figure B.1 An Ingress Scan From a Poorly Maintained Return Plant
-30
-20
-10
0
10
20
0 5 10 15 20 25 30
CATV System "B"
Received Level (dBmV)
Frequency (MHz)
4 / 1 4 / 9 4Sw1200 7:23:16 PM7194 Subscribers
21. Figure B.2 An Ingress Scan From a Well-Maintained Return Plant
B.4 Short-Term Ingress
Short-term ingress to the cable return plant is characterized by impulsive noise events that are quite short in duration (nanoseconds to milliseconds in time span) but can have very high amplitudes. This could be noise from any number of sources including electrical storms, motors, vehicle ignition noise, and electrical appliances in the home. Motorola has taken short-
39
term ingress measurements from four different CATV systems at three different operating companies and found the characteristics of short-term ingress to be very similar from site to site and system to system. Some of these results are shown in the graphs that follow.
Figure B.3 represents a continuous record of impulse power levels recorded every 2.6 microseconds in a 500 kHz bandwidth. A return band monitoring frequency was selected that showed no evidence of long-term ingress carriers, so any level recorded above the background noise was assumed to be impulse noise. Recording times varied from 2 hours to 20 minutes. The distribution of impulse power level from four different sites is remarkably similar. Note that high level impulses, although infrequent, were recorded from all sites. For example the curves show that in a one hour period between 2700 and 5400 impulses greater than 30 dBmV in power level were recorded. This data can be displayed in a way more meaningful to the performance of a data communication system. This is shown in Figure B.4. Here a QPSK return path modulation is assumed with no error correction. The figure shows the expected average BER due to impulse noise versus the return path carrier level. To stay within the linear dynamic range of return path lasers and amplifiers, the return carrier levels will be limited to the 20 to 30 dBmV area. Looking at Figure B.3, this means that average BER rates in the 3 x 10⁻⁵ to 3 x 10⁻⁶ range can be expected without Forward Error Correction (FEC) and can be improved significantly with FEC. (These measurements were made using individual channel bandwidths of 500 kHz. Individual channel frequencies were between 15 Mhz and 28MHz.)
Use Word 6.0c or later to
view Macintosh picture.
22. Figure B.3 Distribution of Impulse Levels
40
Use Word 6.0c or later to
view Macintosh picture.
23. Figure B.4 Average BER due to Impulse Noise Versus Carrier Level
Figure B.5 shows the cumulative distribution of impulse widths for three of the sites. A low measurement threshold was used at one site and a fairly high threshold was used at the other two sites. These curves indicate that 93% to 98 % of recorded impulses were 10 microseconds or less in duration.
41
24.
Use Word 6.0c or later to
view Macintosh picture.
25. Figure B.5 Cumulative Distribution of Impulse Widths
From it’s ingress measurement activities, Motorola concluded the following:
1) A well-planned return path maintenance policy is needed to keep the levels of long-term ingress carriers under control.2) Most of the severe ingress occurs in the 5 to 15 MHz region of the return spectrum3) The frequency and duration of impulsive type noise do not vary significantly from system to system.
42
Appendix C - Issue StatementIssue Title: Reliability Concerns Arising Out of Changing Technologies Author: Gary Handler
Bellcore
Problem Statement/Issue to be Addressed
The national Public Switched Network (PSN) which is truly a network of networks, has the deserved reputation of providing its users highly reliable, survivable and secure end-to-end services. The FCC and its Network Reliability Council (NRC) want to ensure that this remains the standard mode of operation in spite of a dramatic increase in the number of new technologies being deployed, the implementation of advanced new services offered to the public, and the emergence of a proliferation of new service providers. In specific, the NRC will study a) the reliability aspects of the provision of key services over new network facilities, (i.e., broadband hybrid fiber/coaxial cable distribution, SONET and ATM, wireless, and satellite), and b) reliability concerns arising out of new technology providing expanded services over new or traditional facilities, i.e., Advanced Intelligent Network (AIN) capabilities. The emphasis of this Focus Team should be on new technology that will be implemented in the public network within the next three years.
Areas of Concern and Problem Quantification
The following are the main areas of concern:
I Reliability Aspects of Provision of Key Services Over New Network Facilitiesa) Broadband Networks - One concern about new network technologies is how the
reliability of services such as plain old telephone service provided over new broadband networks will compare with that of the same service provided over existing wireline technology. These new systems should be modeled and analyzed for potential reliability risks and possible reliability improvement techniques. Implementation “Best Practices” should be developed and a plan for their dissemination and implementation should be derived. Two specific areas should be addressed:
b) Hybrid Fiber/Coaxial Cable Distribution Systems - This technology is expected to be providing telephone service shortly. The reliability issues with this technology need to be defined and addressed.
c) SONET Facilities and ATM Technology - SONET transport and ATM technology are rapidly progressing and will be providing new broadband services as well as existing narrowband services over common facilities. The reliability issues with these technologies need to be defined and addressed.
d) Wireless Network (Cellular and PCS) - Another example of a concern about new technologies is the role and reliability of cellular facilities in connection with line-based networks. This issue was discussed by the NRC at its September 30, 1992 meeting and in the document Network Reliability: A Report to the Nation. The reliability of the telecommunications services provided over a combination of new technologies has to be reviewed. Customers who rely on cellular technology need service providers to have and follow established “best practices.” These do
43
not now exist. Best practices for Personal Communications Services (PCS) and Networks should also be considered in this study.
e) Satellite Networks - Another area of reliability concern is the provision of telephone services over new satellite technology networks such as low earth orbiting satellites. The reliability issues with this technology should also be defined and addressed.
II Reliability Concerns Arising Out of New Technology Providing Expanded Services over New or Traditional Facilities, i.e., Advanced Intelligent Network (AIN) Capabilities - Concerns have also been raised regarding the interoperability and reliability of multiple advanced intelligent services with their inherently independently developed software management and control. As John Clendenin stated at the July 6, 1994 NRC meeting “this is not the kind of problem that could be solved (once) and laid aside”. However, to provide a near term objective from which a model or process might be developed, it is suggested that the team focus on the interoperability and reliability concerns in the development of Advanced Intelligent Network Services.
III Description of Proposed Work
The team working this issue should consider the following total quality process to identify reliability concerns arising out of changing technologies, quantify network vulnerabilities, identify the major reliability issues and propose problem solutions.
1. Identify the new technologies being introduced into the network.
2. Collect appropriate data from all available industry sources to determine and/or confirm areas/technologies of greatest criticality and risk, and those with the greatest potential for network reliability improvement potential. (Work with the ATIS Network Reliability Steering Committee (NRSC) and its Network Reliability Performance Committee to coordinate data collection activities).
3. Collect data from the industry concerning the reliability of new technologies if already deployed. (Work with the ATIS Network Reliability Steering Committee (NRSC) and its Network Reliability Performance Committee to coordinate data collection activities)
4. Perform sufficient analysis of the data to determine the root cause(s) of the problem(s).
5. From the root cause analysis determine an appropriate action plan to reduce/eliminate the possibility or severity of failures in high risk areas. Also consider ways that recovery procedures may be implemented more quickly or efficiently.
6. Determine industry “best practices” for dealing with the root cause analysis findings and share this information with industry participants as soon as possible. Deployment should consider cost/benefit tradeoffs of “best practices.”
7. Develop a timeline and metrics to measure the effectiveness of the team’s recommendations.
44
8. Consider the following tactics/ideas offered by the Steering Team as potential means to supplement the total quality process and address the findings of the root cause analysis. These represent ideas from the Steering Team that we want to share.
9. New Technology Reliability Template - Design a generic template that serves as a reliability screen for assessing the reliability of new network technologies. This could be used as a process for the rapid and reliable evolution of the telecommunications networks.
10. Provision of Key Services Over New Network Facilities
11. Broadband Networks (Hybrid Fiber/Coaxial Cable Distribution and SONET Facilities & ATM Technology), Wireless Networks (Cellular & PCS), and Satellite Networks.
12. For each technology, determine the scope of the reliability study. Develop a bounded definition of the reliability problem; for example, the provision of basic telecommunications over a new broadband hybrid fiber/coaxial cable distribution network.
13. Construct an order of magnitude (major failure modes and vulnerabilities) reliability model of a reference system for each technology.
14. Collect available reliability data (e.g. current coaxial cable systems network outage & failure data, current cellular network outage and failure data, current SONET network outage and failure data and ATM switch reliability ), concerns and “best practices” associated with each technology.
15. Analyze data to quantify reliability and determine the most significant problem areas, and the areas with the greatest risks.
16. Determine applicability of current “best practices” to the new technology and identify any additional “best practices” that describe quality as part of the introduction of new technologies (i.e., “best practices” applicable to hybrid fiber/coaxial cable networks, cellular networks, and SONET networks).
17. Recommend implementation strategies for “best practices” and on-going process information for insuring continued quality.
2. Advanced Intelligent Network (AIN) Capabilities18. Determine the reliability issues associated with AIN services (e.g.,
management of many different versions of software).19. Identify efforts taken to date to address AIN reliability issues and to ensure
AIN service reliability. Identify existing “best practices.”20. Identify potential reliability “holes” or problem areas and recommend
solutions.21. Identify the role that the IITP process might play as part of an implementation
strategy for interoperability control and as a reliability qualification process for new AIN platforms, services and software. (Coordinate
45
potential overlapping interconnection issues with the Network Interconnection Focus Team)
Existing Work Efforts
There are several work efforts that have addressed or are addressing some of these issues. The Fiber Cable Focus Team recommendations in the Network Reliability: A Report to the Nation, the Telecommunication Industry Benchmark Committee (TIBC) Report, Draft Congressional Bills S2101 and HR4394 on one-call legislation, and the ATIS/NRSC Annual Report provide significant data from which to begin to address the Provision of Key Services Over New Network Facilities issue. The ATIS Working Group on Network Survivability Performance, T1A1.2 and the News Release, DA-1343, requesting comments on Joint Petition for Rulemaking on Cable Television Wiring, RM No. 8380, November 15, 1993 provide background on the cellular and coax cable concerns. The Switching Systems (focus on software) Focus Team Recommendations in the Network Reliability: A Report to the Nation as well as ATIS/NOF/IITP charter and test plans give good background material for addressing the services and software concerns.
Recommended Team LeaderKen Young - Bellcore
46
Appendix D - New Technology Reliability TemplateThe New Technology Reliability Template is a generic template that can serve as a reliability screen for assessing the reliability of new network technologies. It would be used primarily by a service provider but also is useful to a supplier of the particular technology to understand the important reliability criteria from the service provider’s perspective. A person or organization in the service provider company who has primary responsibility for network reliability, planning for integration of a new technology, or having overall technical responsibility for a network would be potential users. These potential user's have the need to assure that all of the issues in the template have been adequately considered/addressed before the technology is integrated into the network. This template could be used as part of the service provider’s process for the rapid and reliable evolution of their telecommunications networks.
New Technology Reliability Template
Criteria Comments
1.0 ArchitectureTechnology complies with industry/company standard architecture
Specific architecture and its reliability features
Architecture is robust enough to prevent FCC reportable outage
Worst case percentage of key services restorable with this technology
New operations support systems identified and meet architectural guidelinesAll changes to existing (legacy) systems have been identifiedDisaster recovery requirements identified and addressedOfficial network interfaces consistent with networking architectural plans and guidelinesIndustry Òbest practicesÓ exist and have been considered
List industry Òbest practicesÓ to be followed
Architecture is robust enough to meet customer reliability requirements
Mechanism exists to evaluate end-to-end customer reliability for key servicesCustomers have such a mechanism
If so, what is observed reliability?
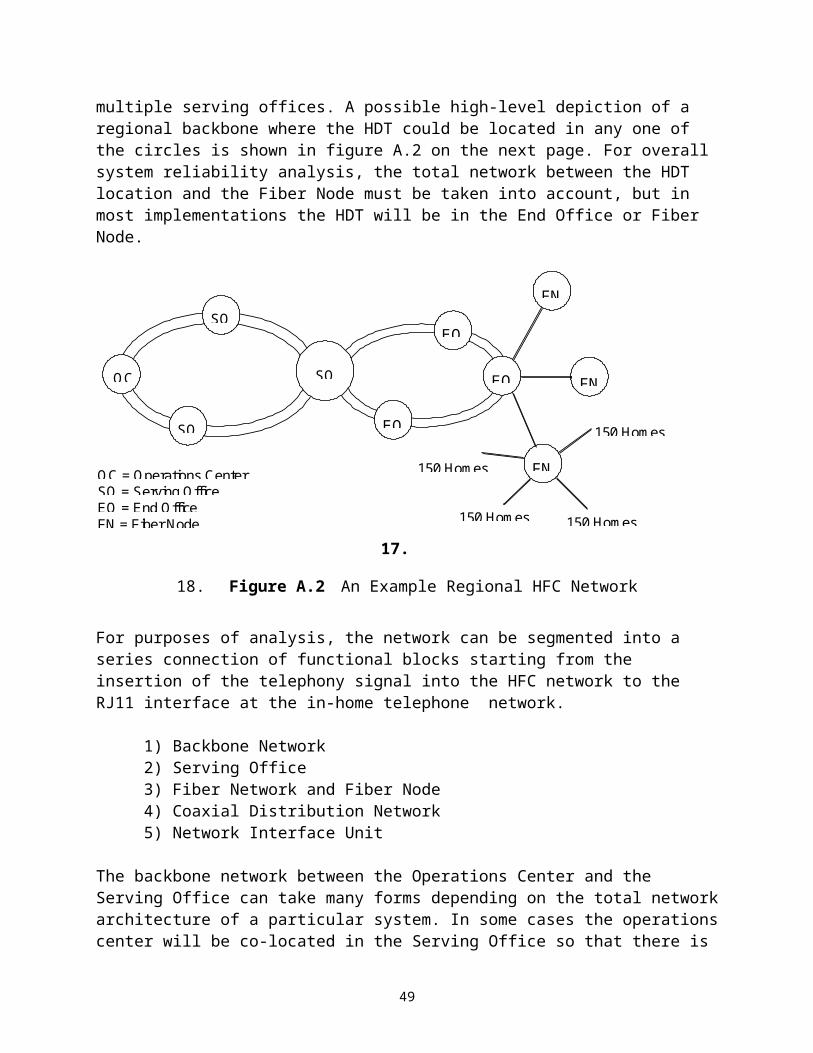
New Technology Reliability Template
2.0 Technology Reliability CommentsTechnology reliability criteria defined
Supplier documentation of reliability reviewed and meets criteriaOperations support systems reliability criteria defined and metIs provision of key services using this technology as reliability of current technology?For each major failure mode of the technology providing key services, list:
Describe the failure mode
What is the failure mode impact in terms of equivalent blocked calls?What is the estimated duration of the failure mode?What is the estimated frequency of the failure mode?What actions(s) are required to recover from the failure mode?
3.0 InstallationStandard equipment configurations developed
Installation methods and procedures developed
Acceptance procedures documented
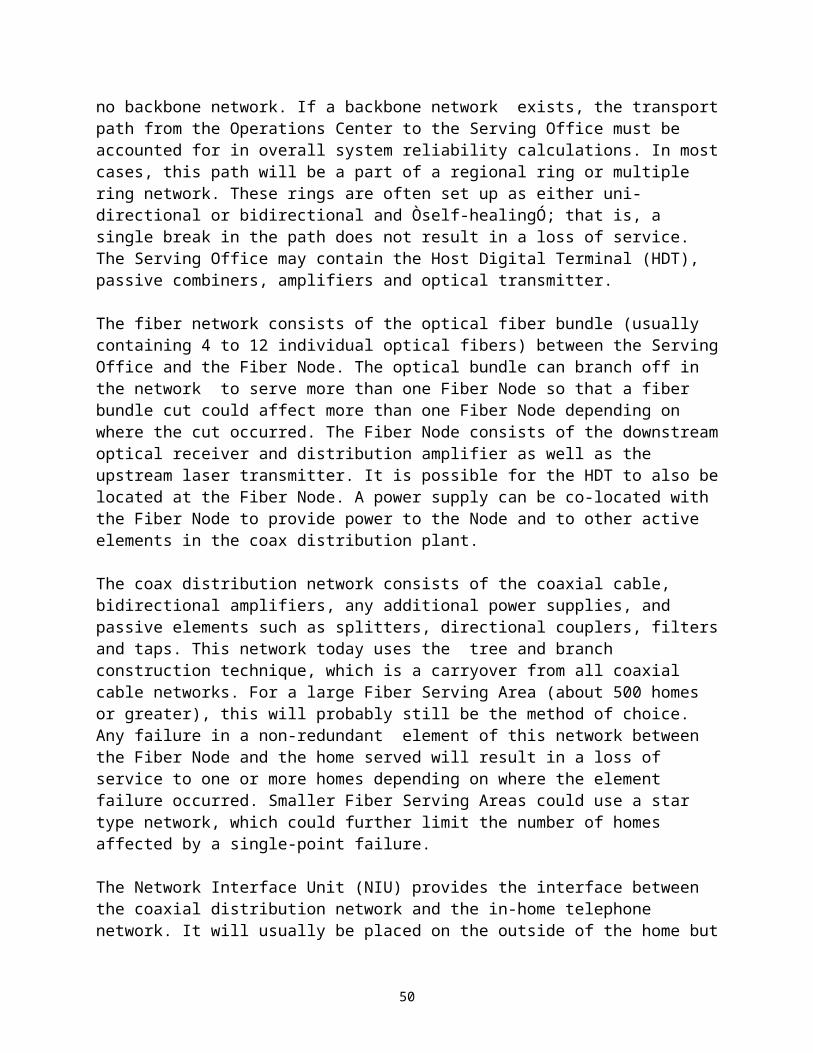
New Technology Reliability Template
4.0 Service Provisioning Comments
Service order documents have sufficient detail for field personnel and network element administrationService provisioning methods and procedures developedFeature interaction testing plan developed
5.0 MonitoringAvailability objectives exist
Technology has self-diagnostic and auditing capabilitiesTechnology can be remotely monitored and is consistent with existing monitoring system architectureTechnology has full alarming capabilities
Monitoring methods and procedures developed
Required changes to monitoring systems completedNetwork element and OSS tested to ensure surveillance integrity
New Technology Reliability Template
6.0 Maintenance/Repair CommentsTechnology operation consistent with current maintenance process flow and supporting systemsRoutine maintenance methods, procedures and time frames developedSoftware maintenance plans exist
Non-intrusive software change/maintenance capabilities existAppropriate test tools/equipment selected and availableRemote testing and inventory capability exists
OSS provides technology work force management reportsTroubleshooting procedures exist including fault visibility, trouble verification and isolation, recovery/repairIs operator action or conformation required to recover from failures?Post-mortem analysis methods exist
Process exists to feedback findings and recommendations to improve future reliability
New Technology Reliability Template
7.0 Interoperability CommentsDoes this technology interoperate with other networks in provision of key services?How does the technology achieve reliable operation when interconnecting?How is reliable operation monitored and controlled?
8.0 TrainingRequired training courses available in time frames consistent with deployment scheduleList required training
9.0 Reliability MonitoringProcess to collect outage data exists
Process to do root cause analysis on outage data existsProcess to develop best practices to improve new technology reliability exists