Embed Size (px)
Citation preview
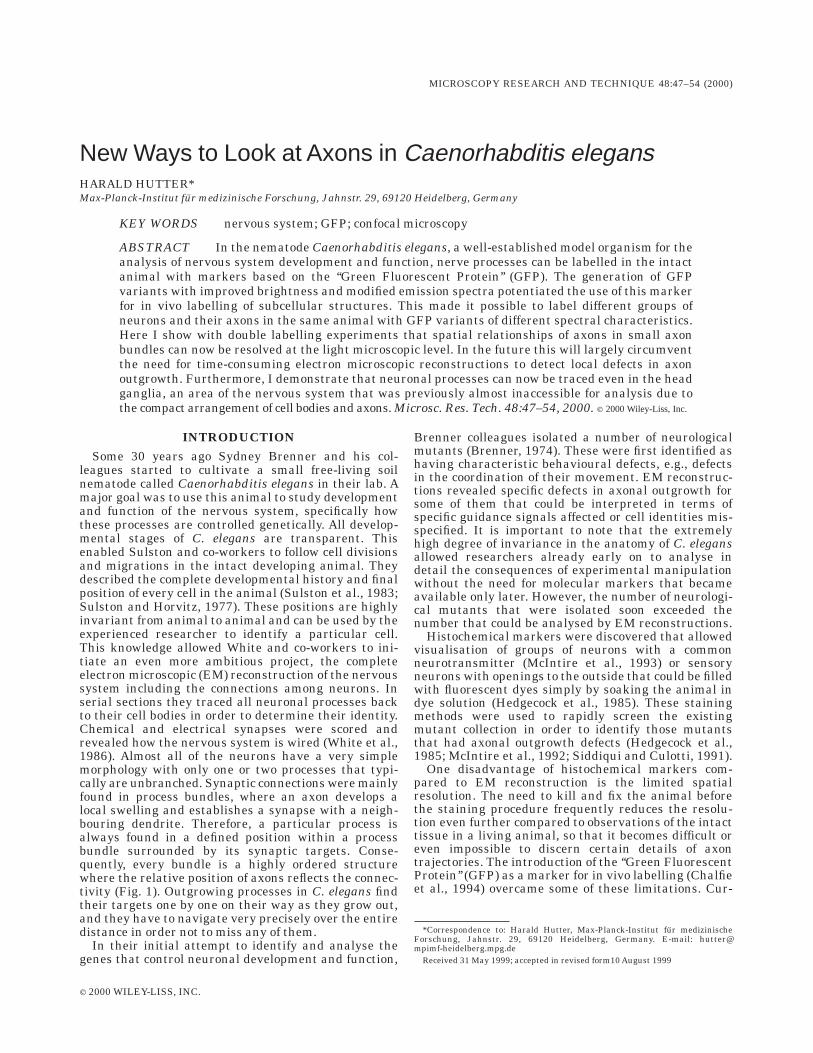
New Ways to Look at Axons in Caenorhabditis elegansHARALD HUTTER*Max-Planck-Institut fur medizinische Forschung, Jahnstr. 29, 69120 Heidelberg, Germany
KEY WORDS nervous system; GFP; confocal microscopy
ABSTRACT In the nematode Caenorhabditis elegans, a well-established model organism for theanalysis of nervous system development and function, nerve processes can be labelled in the intactanimal with markers based on the ‘‘Green Fluorescent Protein’’ (GFP). The generation of GFPvariants with improved brightness and modified emission spectra potentiated the use of this markerfor in vivo labelling of subcellular structures. This made it possible to label different groups ofneurons and their axons in the same animal with GFP variants of different spectral characteristics.Here I show with double labelling experiments that spatial relationships of axons in small axonbundles can now be resolved at the light microscopic level. In the future this will largely circumventthe need for time-consuming electron microscopic reconstructions to detect local defects in axonoutgrowth. Furthermore, I demonstrate that neuronal processes can now be traced even in the headganglia, an area of the nervous system that was previously almost inaccessible for analysis due tothe compact arrangement of cell bodies and axons. Microsc. Res. Tech. 48:47–54, 2000. r 2000 Wiley-Liss, Inc.
INTRODUCTIONSome 30 years ago Sydney Brenner and his col-
leagues started to cultivate a small free-living soilnematode called Caenorhabditis elegans in their lab. Amajor goal was to use this animal to study developmentand function of the nervous system, specifically howthese processes are controlled genetically. All develop-mental stages of C. elegans are transparent. Thisenabled Sulston and co-workers to follow cell divisionsand migrations in the intact developing animal. Theydescribed the complete developmental history and finalposition of every cell in the animal (Sulston et al., 1983;Sulston and Horvitz, 1977). These positions are highlyinvariant from animal to animal and can be used by theexperienced researcher to identify a particular cell.This knowledge allowed White and co-workers to ini-tiate an even more ambitious project, the completeelectron microscopic (EM) reconstruction of the nervoussystem including the connections among neurons. Inserial sections they traced all neuronal processes backto their cell bodies in order to determine their identity.Chemical and electrical synapses were scored andrevealed how the nervous system is wired (White et al.,1986). Almost all of the neurons have a very simplemorphology with only one or two processes that typi-cally are unbranched. Synaptic connections were mainlyfound in process bundles, where an axon develops alocal swelling and establishes a synapse with a neigh-bouring dendrite. Therefore, a particular process isalways found in a defined position within a processbundle surrounded by its synaptic targets. Conse-quently, every bundle is a highly ordered structurewhere the relative position of axons reflects the connec-tivity (Fig. 1). Outgrowing processes in C. elegans findtheir targets one by one on their way as they grow out,and they have to navigate very precisely over the entiredistance in order not to miss any of them.
In their initial attempt to identify and analyse thegenes that control neuronal development and function,
Brenner colleagues isolated a number of neurologicalmutants (Brenner, 1974). These were first identified ashaving characteristic behavioural defects, e.g., defectsin the coordination of their movement. EM reconstruc-tions revealed specific defects in axonal outgrowth forsome of them that could be interpreted in terms ofspecific guidance signals affected or cell identities mis-specified. It is important to note that the extremelyhigh degree of invariance in the anatomy of C. elegansallowed researchers already early on to analyse indetail the consequences of experimental manipulationwithout the need for molecular markers that becameavailable only later. However, the number of neurologi-cal mutants that were isolated soon exceeded thenumber that could be analysed by EM reconstructions.
Histochemical markers were discovered that allowedvisualisation of groups of neurons with a commonneurotransmitter (McIntire et al., 1993) or sensoryneurons with openings to the outside that could be filledwith fluorescent dyes simply by soaking the animal indye solution (Hedgecock et al., 1985). These stainingmethods were used to rapidly screen the existingmutant collection in order to identify those mutantsthat had axonal outgrowth defects (Hedgecock et al.,1985; McIntire et al., 1992; Siddiqui and Culotti, 1991).
One disadvantage of histochemical markers com-pared to EM reconstruction is the limited spatialresolution. The need to kill and fix the animal beforethe staining procedure frequently reduces the resolu-tion even further compared to observations of the intacttissue in a living animal, so that it becomes difficult oreven impossible to discern certain details of axontrajectories. The introduction of the ‘‘Green FluorescentProtein’’ (GFP) as a marker for in vivo labelling (Chalfieet al., 1994) overcame some of these limitations. Cur-
*Correspondence to: Harald Hutter, Max-Planck-Institut fur medizinischeForschung, Jahnstr. 29, 69120 Heidelberg, Germany. E-mail: [email protected]
Received 31 May 1999; accepted in revised form10 August 1999
MICROSCOPY RESEARCH AND TECHNIQUE 48:47–54 (2000)
r 2000 WILEY-LISS, INC.
rently several GFP variants with improved brightnessand different colours are available (Heim and Tsien,1996; Ormo et al., 1996).
Here I demonstrate that the use of GFP in combina-tion with advanced microscopy and imaging techniquesallows a new view of the nervous system of C. elegans.Double labelling experiments reveal that the spatialresolution in an intact animal is sufficient to visualiserelative positions of axons even within small axonbundles. In the brain region, which was virtually
inaccessible at the light microscopic level due to itscomplexity of cell bodies and neuronal processes, GFPlabelling now allows the detailed reconstruction of axontrajectories.
MATERIALS AND METHODSGFP Constructs
The following plasmids were used as a starting pointfor cloning experiments. KP#6 kindly provided by J.Kaplan contains the glr-1 promoter for expression of
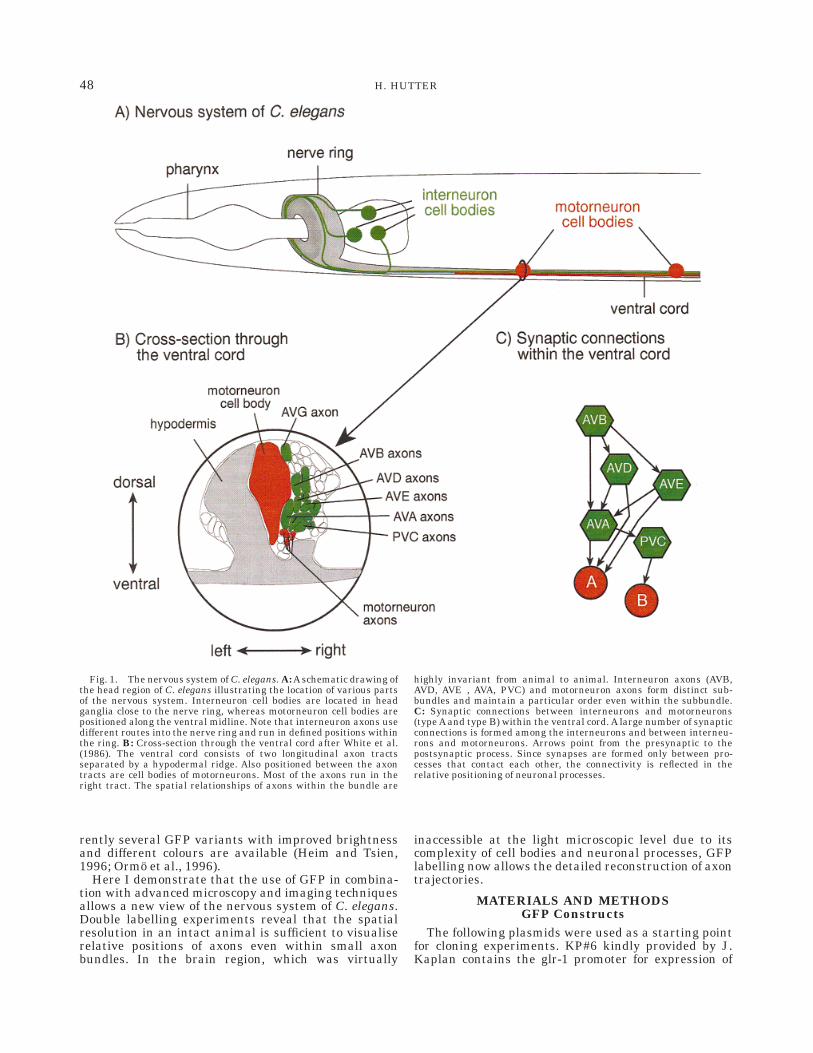
Fig. 1. The nervous system of C. elegans. A: A schematic drawing ofthe head region of C. elegans illustrating the location of various partsof the nervous system. Interneuron cell bodies are located in headganglia close to the nerve ring, whereas motorneuron cell bodies arepositioned along the ventral midline. Note that interneuron axons usedifferent routes into the nerve ring and run in defined positions withinthe ring. B: Cross-section through the ventral cord after White et al.(1986). The ventral cord consists of two longitudinal axon tractsseparated by a hypodermal ridge. Also positioned between the axontracts are cell bodies of motorneurons. Most of the axons run in theright tract. The spatial relationships of axons within the bundle are
highly invariant from animal to animal. Interneuron axons (AVB,AVD, AVE , AVA, PVC) and motorneuron axons form distinct sub-bundles and maintain a particular order even within the subbundle.C: Synaptic connections between interneurons and motorneurons(type A and type B) within the ventral cord. A large number of synapticconnections is formed among the interneurons and between interneu-rons and motorneurons. Arrows point from the presynaptic to thepostsynaptic process. Since synapses are formed only between pro-cesses that contact each other, the connectivity is reflected in therelative positioning of neuronal processes.
48 H. HUTTER
reporter genes in a subset of interneurons (Hart et al.,1995). pPD95.75 kindly provided by A. Fire is a promot-erless vector containing the S65C variant of GFP (greenGFP). pPD115.46 also provided by A. Fire is a promoter-less vector containing the Y66W N146I M154T V163Avariant of GFP (cyan variant or CFP). The 5.3 kbPstI-BamHI fragment from KP#6 containing the glr-1promoter was cloned into pPD95.75 resulting inpG75#KP6 and also into pPD115.46 resulting inpG46#KP6.
Transgenic StrainsTransgenic strains were made using standard tech-
niques (Mello and Fire, 1995). Briefly, plasmid DNA(pG75#KP6 or pG46#KP6) was injected into C. eleganshermaphrodites. dpy-20(1) DNA was used as coinjec-tion marker; injections were made into a dpy-20(e1282ts) strain. Stables lines were generated bygamma-irradiation followed by outcrossing. Animalswhere motorneurons are labelled with GFP and inter-neurons with CFP were generated by crossing a straincarrying pG46#KP6 with one expressing GFP in DAand DB motorneurons (kindly provided by J. Culotti).
Microscopy and ImagingImages for Figure 2 were taken on a Leica SP confocal
system equipped with an Argon laser using a Plan Apo100x, 1.4NA oil objective. CFP was excited at 458 nm,GFP at 488 nm. Emitted light was collected between468 and 482 nm for CFP using a 465-nm dichroic filter,and between 500 and 560 nm for GFP using a 488-nmdichroic filter. Sequential scans were used to collectimages in the two channels.
Images for Figure 3 were taken on a Leica NTconfocal microscope equipped with an Argon-Kryptonlaser using a Plan Apo 63x, 1.4NA oil objective. GFPwas excited at 488 nm, a TK500 dichroic filter was usedtogether with a BP525/50 barrier filter.
Images were further processed with the Huygens2(Bitplane AG, Switzerland) deconvolution software anddisplayed using the Imaris program. Within Huygens2the Maximum Likelihood Estimation method (MLE)algorithm (Snyder et al., 1992) was used for deconvolu-tion with a calculated point spread function.
RESULTSDetermining the Relative Positions of Axons
Within an Axon BundleIn C. elegans, the relative position of a particular
axon within an axon bundle is well conserved. Determin-ing these positions so far was only possible in time-consuming EM reconstructions. Using GFP as a markerin living animals, I attempted to visualise these spatialrelationships at the light microscopic level. To this end,I generated transgenic animals expressing two vari-ants of GFP in different groups of axons. A cyan variant(CFP) was used to label interneurons of the motorcircuit whereas a green variant was used to label asubset of motorneurons. Both groups of axons are foundin the major longitudinal axon tract, the ventral cord.From EM reconstructions we know that interneuronsand motorneurons form distinct subbundles within theventral cord with the motorneuron bundle lying ven-trally adjacent to the interneuron bundle (White et al.,1976; Fig. 1B). This relative position is maintained over
a long distance and reflects the local synaptic connec-tions within the ventral cord (Fig. 1C). The entireventral cord in cross-section is about 2 µm wide withindividual axons about 0.2 µm in diameter. A singleaxon, therefore, is at the resolution limits of a lightmicroscope and with current histochemical markersthe relative positions of axons within an axon bundlecannot be resolved. How far can the resolution limits bepushed using modern microscopy and imaging tech-niques together with in vivo markers that allow imag-ing of an intact animal?
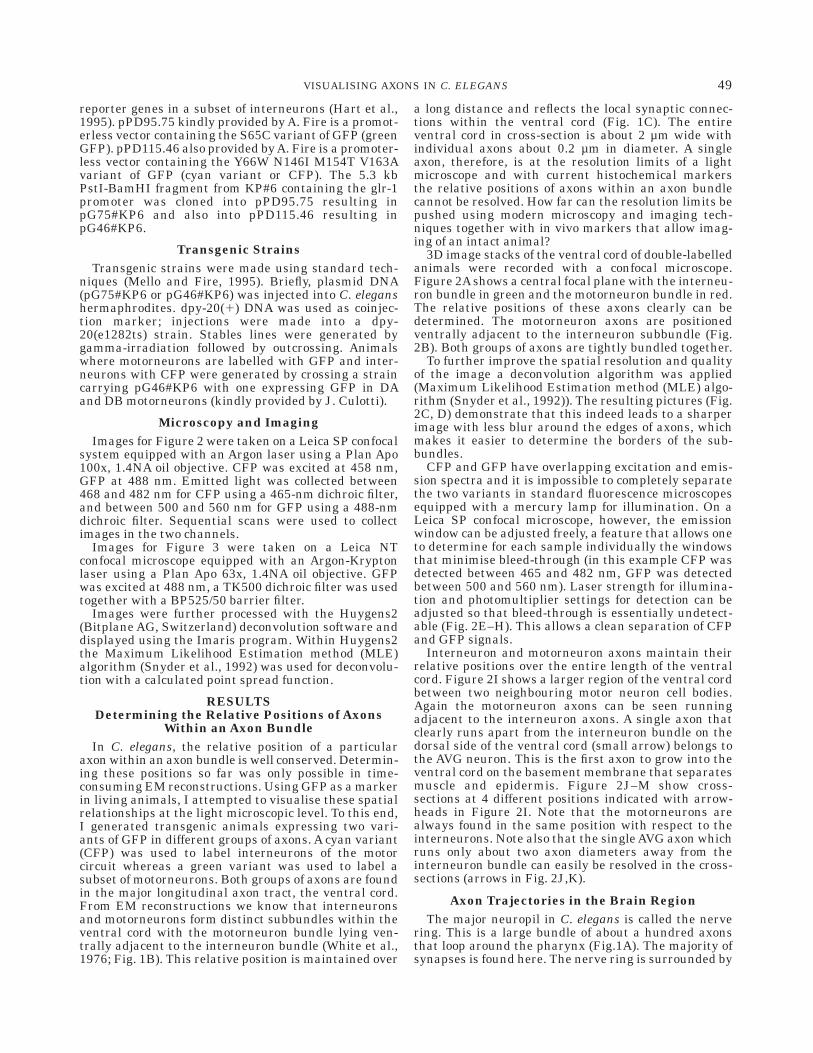
3D image stacks of the ventral cord of double-labelledanimals were recorded with a confocal microscope.Figure 2A shows a central focal plane with the interneu-ron bundle in green and the motorneuron bundle in red.The relative positions of these axons clearly can bedetermined. The motorneuron axons are positionedventrally adjacent to the interneuron subbundle (Fig.2B). Both groups of axons are tightly bundled together.
To further improve the spatial resolution and qualityof the image a deconvolution algorithm was applied(Maximum Likelihood Estimation method (MLE) algo-rithm (Snyder et al., 1992)). The resulting pictures (Fig.2C, D) demonstrate that this indeed leads to a sharperimage with less blur around the edges of axons, whichmakes it easier to determine the borders of the sub-bundles.
CFP and GFP have overlapping excitation and emis-sion spectra and it is impossible to completely separatethe two variants in standard fluorescence microscopesequipped with a mercury lamp for illumination. On aLeica SP confocal microscope, however, the emissionwindow can be adjusted freely, a feature that allows oneto determine for each sample individually the windowsthat minimise bleed-through (in this example CFP wasdetected between 465 and 482 nm, GFP was detectedbetween 500 and 560 nm). Laser strength for illumina-tion and photomultiplier settings for detection can beadjusted so that bleed-through is essentially undetect-able (Fig. 2E–H). This allows a clean separation of CFPand GFP signals.
Interneuron and motorneuron axons maintain theirrelative positions over the entire length of the ventralcord. Figure 2I shows a larger region of the ventral cordbetween two neighbouring motor neuron cell bodies.Again the motorneuron axons can be seen runningadjacent to the interneuron axons. A single axon thatclearly runs apart from the interneuron bundle on thedorsal side of the ventral cord (small arrow) belongs tothe AVG neuron. This is the first axon to grow into theventral cord on the basement membrane that separatesmuscle and epidermis. Figure 2J–M show cross-sections at 4 different positions indicated with arrow-heads in Figure 2I. Note that the motorneurons arealways found in the same position with respect to theinterneurons. Note also that the single AVG axon whichruns only about two axon diameters away from theinterneuron bundle can easily be resolved in the cross-sections (arrows in Fig. 2J,K).
Axon Trajectories in the Brain RegionThe major neuropil in C. elegans is called the nerve
ring. This is a large bundle of about a hundred axonsthat loop around the pharynx (Fig.1A). The majority ofsynapses is found here. The nerve ring is surrounded by
49VISUALISING AXONS IN C. ELEGANS
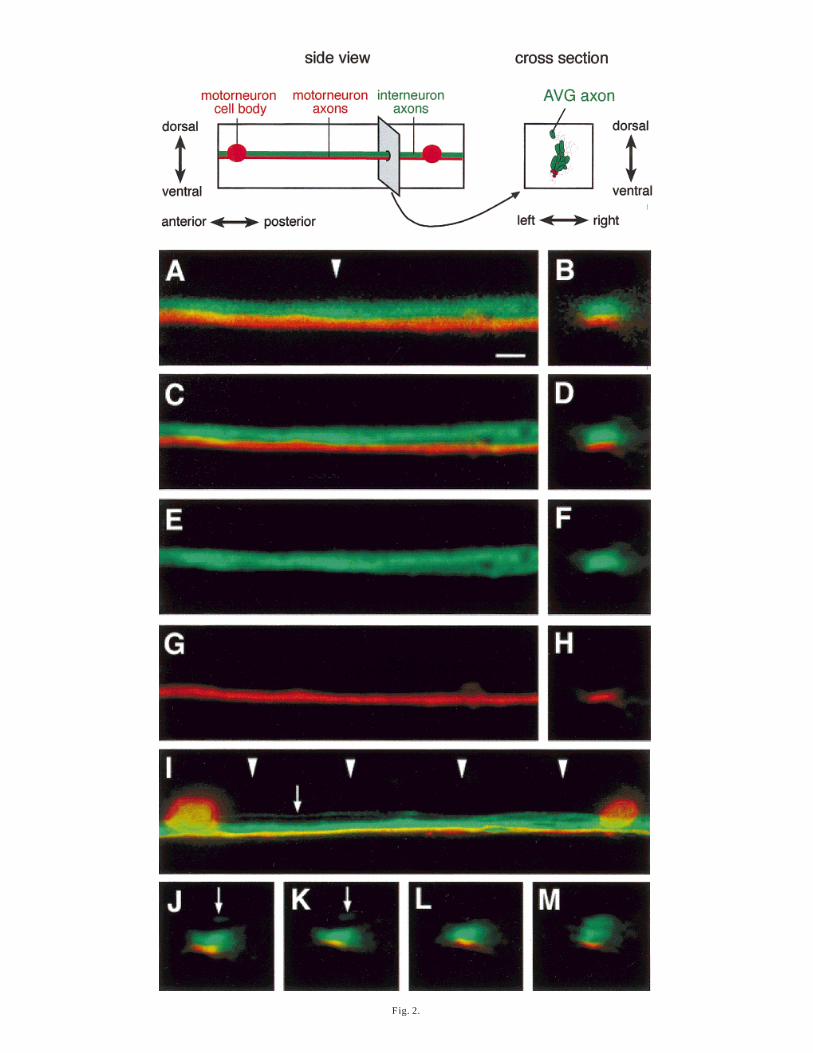
Fig. 2.
a number of ganglia containing cell bodies of neuronsprojecting their axons into the ring. There are a numberof different entry and exit points and a major nerveleaving the ring on the ventral side, which eventuallybecomes the ventral cord (Fig. 1). The large number ofcell bodies, the short distances between cell bodies andnerve ring, and the compact architecture of the ringitself made it almost impossible to discern individualfeatures with histochemical markers. The use of GFPagain changes this situation and allows one to traceaxon trajectories in the brain area even in a complexstaining pattern with many axons labelled.
GFP expressed under the control of a glutamatereceptor promoter (glr-1 promoter) was used to visual-ise axons in the brain region. The cells expressing glr-1have been described (Hart et al., 1995) and their axontrajectories are known from EM reconstructions (Whiteet al., 1986). In Figure 3 a number of axon trajectoriesinto the nerve ring are illustrated. Figure 3A shows aside view of the brain area. The picture is a projection ofseveral focal planes. Starting from the cell body, theAVJL axon can be followed as it projects anteriorlytowards the nerve ring. Upon entering the nerve ringsubdorsally, it abruptly turns and runs in a posteriorposition within the ring towards the dorsal midlinewhere it crosses over to the contralateral side. Indi-vidual focal planes illustrating different parts of thetrajectory are shown in Figure 3B–D. A dorsal aspect ofthe nerve ring illustrating the same trajectory is dis-played in Figure 3E.
Another neuron, RIML, whose cell body is close by,uses an entirely different route into the nerve ring. Itfirst projects ventrally through the amphid commisureinto the ventral cord, where it turns anteriorly to enterthe nerve ring from the ventral side (Fig. 3F).
Even for neurons that have their bodies immediatelyadjacent to the nerve ring, it is possible to follow theiraxons into the ring. In Figure 3G, the RMDL axon isshown entering the nerve ring laterally and extendinginto the anterior part of the nerve ring. Upon entering aprocess bundle, axons typically maintain their relativepositions for long distances (see Fig. 2), i.e., they travelin a constant neighbourhood surrounded by the sameaxons, which frequently are synaptic partners. Manyprocesses, however, make abrupt changes of neigh-bourhood at certain points. These points frequently arefound where process bundles meet or split up (White etal., 1986). Within the nerve ring, a prominent point ofchange is the dorsal midline. Certain processes termi-nate here whereas others make abrupt changes indirection as they cross the midline. In Figure 3H, axonscan be seen as they switch from a posterior position
within the ring to a more anterior one after crossing thedorsal midline. The high spatial resolution achieved bythe use of GFP markers in living animals in combina-tion with confocal microscopy allows the analysis ofaxonal outgrowth in areas that were almost inacces-sible before.
DISCUSSIONUnderstanding the underlying logic of a complex
process like the development of the nervous systemduring embryogenesis first of all requires a thoroughdescription of the fully developed structure and theintermediates stages through which it develops. To thisend, appropriate methods of visualisation are essential,for the developing nervous system most importantly amethod to visualise nerve processes at high resolution.For the nematode C. elegans, a uniquely detaileddescription of the adult nervous system is available inthe form of EM reconstructions (White et al., 1986).This information serves as a basis to interpret theresults of various experimental manipulations, mostnotably the inactivation of individual genes that play arole in various aspects of neuronal development. EMreconstructions were used to analyse the defects in thefirst neurological mutants isolated by Brenner andcolleagues (Brenner, 1974). However, since they arevery time-consuming and require extraordinary experi-ence, they were the method of choice only for a smallnumber of researchers and a few selected experiments.Many researchers had to limit themselves to an analy-sis at the light microscopic level with its reduced spatialresolution. This imposed certain constraints on theanalysis especially in particular regions of the nervoussystem like the brain with its complex and compactarchitecture. As a consequence, certain aspects of neu-ronal development like guidance of axons in localenvironments or synaptic target recognition were diffi-cult to analyse.
The introduction of the Green Fluorescent Protein(GFP) as in vivo marker was a technical revolution forcell biologists. In C. elegans, with its small size andtransparent body, GFP tagging can be used to followdevelopmental processes in the intact animal with hightemporal and spatial resolution.
Microscopy and imaging techniques have also beenimproved significantly over the last years. The introduc-tion of confocal microscopy techniques together withimproved image processing algorithms enable us nowto push the resolution limits of the light microscope.
New Avenues for the Analysis of NeuronalDevelopment in C. elegans
Distances within the nervous system of C. elegans aresmall enough, so that axons do not have to branchextensively in their target area to contact differentsynaptic partners. Axons develop local swellings andestablish synapses with neighbouring processes withinprocess bundles (White et al., 1986). As a consequence,these bundles are highly ordered structures whereindividual axons are found in fairly invariant positionswithin the bundle. The local signals that are used byaxons to navigate within an axon bundle as well as thesignals that initiate synapse formation with particularneighbours are essentially unknown. Identifying thesesignals was difficult, since the only way to determine
Fig. 2. Double labelling of axons in the ventral cord. A: False colourimage of interneuron (CFP-labelled) and motorneuron axons (GFP-labelled) in the ventral cord. Interneurons axons are in green,motorneuron axon in red. Side view. Animals are oriented withanterior to the left, dorsal is up. Scale bar 5 2 µm. B: Cross-sectionthrough the ventral cord at the position marked by the arrowhead in A.C,D: Same images after deconvolution with Huygens2. E–H: Singlechannel images of C,D. I: A larger region of the ventral cord with cellbodies of motorneurons visible. The single AVG axon which is thedorsalmost axon in the ventral cord can be seen running separate fromthe interneuron bundle (small arrow). J–M: Four cross-sectionsthrough the ventral cord at positions indicated by arrowheads in I.
51VISUALISING AXONS IN C. ELEGANS
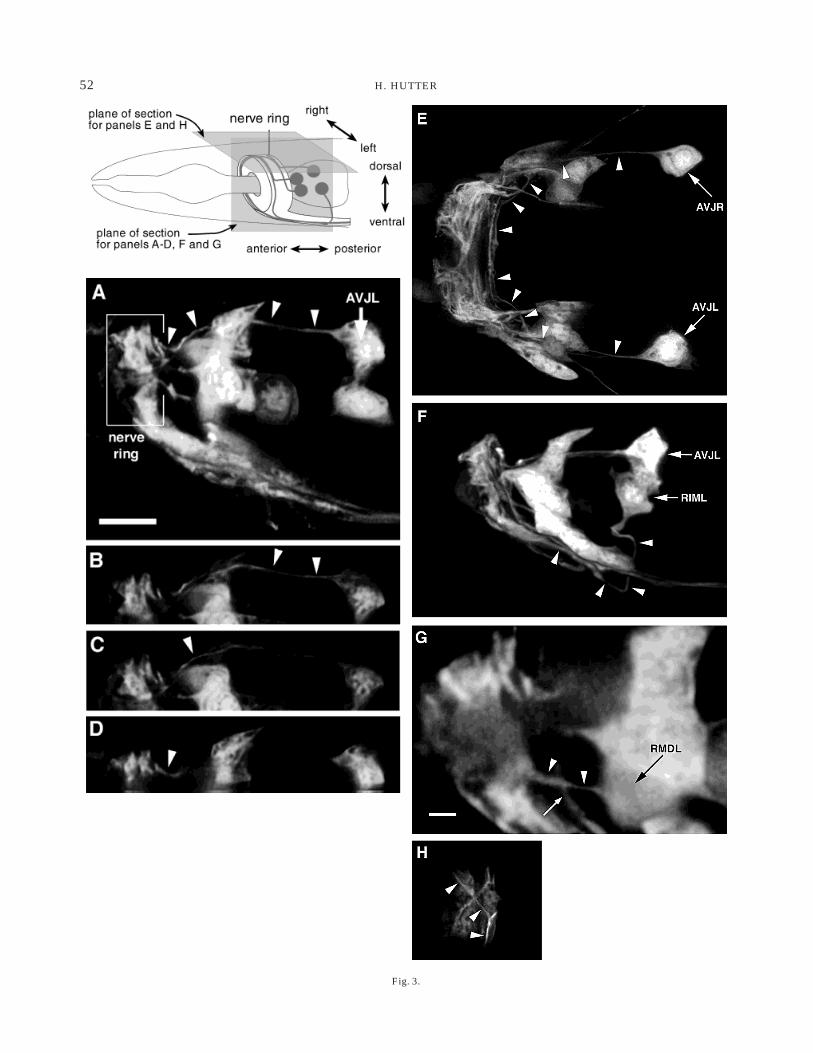
Fig. 3.
52 H. HUTTER
the position of a particular axon within a processbundle were EM reconstructions. The results presentedhere illustrate that it is now feasible to determine therelative position of axons within a process bundle at thelight microscopic level, facilitating future studies oflocal guidance signals in C. elegans.
A few signals that provide long-range orientationcues for axons have been identified already. One impor-tant signal for guidance in dorsoventral directions isencoded by the gene unc-6 (Ishii et al., 1992). The unc-6gene product, netrin, is thought to form a gradientalong the along the dorsoventral axis with its highestconcentration on the ventral side (Wadsworth et al.,1996). Certain axons are attracted towards the ventralmidline by netrin while others are repelled (Hedgecocket al., 1990). Analysis of the expression pattern re-vealed that netrin is also expressed by cells borderingthe nerve ring (Wadsworth et al., 1996). This impliesthat unc-6 signalling might also be important in thedeveloping nerve ring. Axon trajectories, however, aredifficult to determine in this region of the nervoussystem with histochemical markers due to the compactarchitecture of the head ganglia and process bundles.GFP markers in combination with confocal microscopyand imaging techniques now provide access to theseregions of the nervous system of C. elegans. An evalua-tion of outgrowth defects of axons in this area ispossible now and will lead to a deeper understanding ofhow the wiring of the nervous system is controlled.
Potential and Limitations of GFP MarkersAn individual GFP-labelled axon can be followed
until it joins a bundle containing equally labelledaxons. Beyond this point, it is impossible to unambigu-ously determine its further trajectory without addi-tional information. In combination with the EM recon-struction data, however, sometimes further conclusionscan be drawn. An example, where a large number of
axons in the nerve ring are GFP-labelled, is shown inFigure 3. At the dorsal midline, a pair of axons abruptlychanges its direction of growth (Fig. 3H). It is impos-sible to trace these axons back to their cell bodies sinceother labelled axons run close to them in the nerve ring.However, from the EM reconstructions we know thatamong the labelled axons only the two AVE axons(AVEL and AVER) exhibit such a prominent change ofdirection at the dorsal midline. These axons, therefore,are likely to be the AVER and AVEL axons. Theobservations made with the GFP reporter can serve as avaluable basis for a more detailed analysis. Double-labelling experiments would be necessary to validateand extend the observations made with the single label.However, EM reconstructions still are the method ofchoice for a complete reconstruction of many differentaxon trajectories within a single animal in C. elegans.
Although it is possible to separate GFP and CFPunder optimal conditions, this is not the ideal combina-tion for double labeling where clean separation of thesignals is required. A combination of the cyan variant ofGFP together with a yellow shifted variant (10Cvari-ant; Ormo et al., 1996) allows an easier separation witha simple microscope setup (see Ellenberg et al., 1998,1999 for a summary of GFP variants used in doublecolor imaging). This combination has recently beenused successfully to label different subcellular struc-tures in C. elegans (Miller et al., 1999). The overlappingexciation and emission spectra of CFP and GFP, whichmakes it difficult to separate them, are advantageouswhen two colors are needed in rapid time lapse record-ing experiments, since CFP and GFP can be excited andrecorded simultaneously on a confocal microscope (Zim-mermann and Siegert, 1998).
GFP markers are also used successfully in otherorganisms to improve the resolution in axonal imagingand as a label for particular neurons in living tissue(Rodriguez et al., 1999). The spacial and temporalresolution that is achived with GFP enables research-ers now to study in vivo the changes in the dendriticarchitecture in response to individual factors (Horch etal., 1999) or even the dynamics at a single synapse as itgrows (Zito et al., 1999). These and many other studieswill soon lead to a deeper understanding of developmen-tal processes in the brain.
Towards the Isolation of Genes Important for theGeneration of Neuronal Circuits
In their initial screens, Brenner and co-workers(Brenner, 1974) isolated a large number of mutantsthat were characterised by specific behavioural defects.The most prominent behavioural defects they scoredwere movement defects. The corresponding genes werecalled unc-genes, a reference to the ‘‘uncoordinated’’movement of the affected animals. Since then a numberof researchers have collected many mutants in genesaffecting all aspects of behaviour in C. elegans with theaim of understanding various aspects of neuronal devel-opment.
The collection of unc-genes now consists of 130 genes,many of which have been studied in detail. Amongthose, about one-third is important for various aspectsof muscle development (Moerman and Fire, 1997),whereas the majority affects neuronal development andfunction (Riddle et al., 1997). Among the neurological
Fig. 3. Axon trajectories into the nerve ring. Interneuron cellbodies and axons labelled with GFP under the control of the glr-1promoter. Pictures in multiple focal planes were recorded with aconfocal microscope and deconvolved with Huygens2. Arrowheadspoint to the axons in question. A–D: Head region of an animal showingthe AVJL axon projecting into the nerve ring. Side view, anterior is tothe left. The AVJL axon first projects anteriorly from the cell body,enters the nerve ring subdorsally and immediately turns dorsally(arrowheads). A: Maximum intensity projection of 14 focal planestaken at 120-nm intervals illustrating the entire axon trajectory. Scalebar 5 5 µm (valid for all panels except panel G). B–D: Single focalplane images. E: Dorsal view of a different animal illustrating theAVJL and AVJR axon trajectories from the dorsal side. Despite thelarge number of labelled axons in the ring the AVJ axons can be clearlyfollowed as they enter the ring and stay near the posterior end of thering while growing dorsally (arrowheads). F: The RIML neuron, whosecell body is located close to the AVJL cell body, sends its axon into thenerve ring by a rather different route. It first grows ventrally towardsthe ventral cord and enters the nerve ring from the ventral side. G:The RMDL cell body is located close the nerve ring. Its axon alsoextends into the ring but in contrast to the AVJL axon grows throughthe ring past the axons that the AVJL axon joins after turning dorsally(small arrow) Scale bar 5 2 µm. H: Closeup of the dorsalmost part ofthe nerve ring, dorsal view, anterior to the left. One pair of axonsgrowing dorsally near the posterior end of the nerve ring abruptlychange directions at the dorsal midline and continue to grow on thecontralateral side near the anterior end of the ring. These axons mostprobably are the AVEL and AVER axons, since those are the only onesamong the GFP-labelled ones that are known for this kind of behav-iour from EM reconstructions.
53VISUALISING AXONS IN C. ELEGANS
mutants many play a role in synaptic transmission andencode ion-channels, enzymes involved in neurotrans-mitter metabolism, or proteins important for neuro-transmitter release. A smaller number of neurologicalmutants have defects in various aspects of neuronaldevelopment most notably neuronal cell fate specifica-tion and axonal guidance. The fraction of unc-genesinvolved in this latter aspect is less than 20%, whichillustrates that a purely behavioural screen is not themost effective way to identify genes important foraxonal guidance. Evaluating the movement of an ani-mal is a rather indirect way of judging the developmen-tal state of its nervous system. With GFP-markers moredirect screens for neurological mutants, even such withonly subtle defects in axonal outgrowth are now pos-sible.
The ability to perform double-labelling experimentsin the living animal and the high spatial resolutionachieved with modern microscopy techniques will allowus to isolate and analyse genes with important roles inaspects of neuronal development that were not easilyaccessible so far. In particular, local guidance signalsthat are used only by a subset of neurons and signalsthat are used for synaptic target recognition can now beidentified through genetic screens. Our laboratory hasstarted to screen for mutants with defects in thefasciculation of interneuron axons in the ventral cord.We have collected a first set of mutants with defects inthe navigation of these axons within the ventral cord(Hutter and Hedgecock, unpublished data). Some ofthese mutants show outgrowth defects that do not leadto pronounced behavioural defects and would not havebeen found in traditional behavioural screens or inscreens that rely on histochemical markers.
ACKNOWLEDGMENTSI thank J. Kaplan, D. Baillie, and A. Fire for vectors,
J. Culotti for an unc-129::GFP strain, S. Liebe and U.Tauer at LEICA Microsystems Heidelberg GmbH fortheir help with taking images at their LEICA SPconfocal microscope, G. Giese for an introduction to theHuygens system, and I. Wacker for critical reading ofthe manuscript.
REFERENCESBrenner S. 1974. The genetics of Caenorhabditis elegans. Genetics
77:71–94.Chalfie M, Tu Y, Euskirchen G, Ward WW, Prasher DC. 1994. Green
fluorescent protein as a marker for gene expression. Science 263:802–805.
Ellenberg J, Lippincott-Schwartz J, Presley JF. 1998. Two-color greenfluorescent protein time-lapse imaging. Biotechniques 25:838–846.
Ellenberg J, Lippincott-Schwartz J, Presley JF. 1999. Dual-colourimaging with GFP variants. Trends Cell Biol 9:52–56.
Hart AC, Sims S, Kaplan J. 1995. Synaptic code for sensory modalitiesrevealed by C. elegans glr–1 glutamate receptor. Nature 378:82–85.
Hedgecock EM, Culotti JG, Hall DH. 1990. The unc–5, unc–6, andunc–40 genes guide circumferential migrations of pioneer axons andmesodermal cells on the epidermis in C. elegans. Neuron 2:61–85.
Hedgecock EM, Culotti JG, Thomson JN, Perkins LA. 1985. Axonalguidance mutants of Caenorhabditis elegans identified by fillingsensory neurons with fluorescein dyes. Dev Biol 111:158–170.
Heim R, Tsien RY. 1996. Engineering green fluorescent protein forimproved brightness, longer wavelength and fluorescence resonanceenergy transfer. Curr Biol 6:178–182.
Horch HW, Kruttgen A, Portbury SD, Katz LC. 1999. Destabilizationof cortical dendrites and spines by BDNF. Neuron 23:353–364.
Ishii N, Wadsworth WG, Stern BD, Culotti JG, Hedgecock E M. 1992.UNC–6, a laminin-related protein, guides cell and pioneer axonmigrations in C. elegans. Neuron 9:873–881.
McIntire SL, Garriga G, White J, Jacobson D, Horvitz HR. 1992.Genes necessary for directed axonal elongation or fasciculation in C.elegans. Neuron 8:307–322.
McIntire SL, Jorgensen E, Kaplan J, Horvitz HR. 1993. TheGABAergic nervous system of Caenorhabditis elegans. Nature 364:337–341.
Mello C, Fire A. 1995. DNA transformation. In: Epstein HF, ShakesDC, editors. Caenorhabditis elegans: modern biological analysis ofan organism. San Diego: Academic Press. 48:451–482.
Miller DM, Desai NS, Hardin DC, Piston DW, Patterson GH, FleenorJ, Xu S, Fire A. 1999. Two-color GFP expression system for C.elegans. BioTechniques 26:914–921.
Moerman DG, Fire A. 1997. Muscle: structure function, and develop-ment. In: Riddle DL, Blumenthal T, Meyer BJ, Priess JR, editors. C.elegans II. Cold Spring Harbor, NY: Cold Spring Harbor LaboratoryPress. p 417–470.
Ormo M, Cubitt AB, Kallio K, Gross LA, Tsien RY, Remington SJ.1996. Crystal structure of the Aequorea victoria green fluorescentprotein. Science 273:1392–1395.
Riddle DL, Blumenthal T, Meyer BJ, Priess JR. 1997. C. elegans II.Cold Spring Harbor, NY: Cold Spring Harbor Laboratory Press.
Rodriguez I, Feinstein P, Mombaerts P. 1999. Variable patterns ofaxonal projections of sensory neurons in the mouse vomeronasalsystem. Cell 97:199–208.
Siddiqui SS, Culotti JG. 1991. Examination of neurons in wild typeand mutants of caenorhabditis elegans using antibodies to horserad-ish peroxidase. J Neurogenet 7:193–211.
Snyder DL, Schulz TJ, O’Sullivan JA. 1992. Deblurring subject tononnegativity constraints. IEEE Trans Sign Proc 40:1143–1150.
Sulston JE, Horvitz HR. 1977. Post-embryonic cell lineages of thenematode Caenorhabditis elegans. Dev Biol 56:110–156.
Sulston JE, Schierenberg E, White JG, Thomson JN. 1983. Theembryonic cell lineage of the nematode Caenorhabditis elegans. DevBiol 100:64–119.
Wadsworth WG, Bhatt H, Hedgecock EM. 1996. Neuroglia and pioneerneurons express UNC–6 to provide global and local netrin cues forguiding migrations in C. elegans. Neuron 16:35–46.
White J, Southgate E, Thomson J, Brenner S. 1986. The structure ofthe nervous system of the nematode Caenorhabditis elegans. PhilTrans R Soc Lond B. 314:1–340.
White JG, Southgate E, Thomson JN, Brenner S. 1976. The structureof the ventral nerve cord of Caenorhabditis elegans. Phil Trans R SocLond B 275:327–348.
Zimmermann T, Siegert F. 1998. Simultaneous detection of two GFPspectral mutants during in vivo confocal microscopy of migratingDictyostelium cells. Biotechniques 24:458–461.
Zito K, Parnas D, Fetter RD, Isacoff EY, Goodman CS. 1999. Watchinga synapse grow: noninvasive confocal imaging of synaptic growth inDrosophila. Neuron 22:719–29.
54 H. HUTTER