Embed Size (px)
Citation preview
FrascatiPhysicsSeriesVol. XXI (2000),pp. 709–720
IX INT. CONF. ON CALORIMETRY IN PART. PHYS. - Annecy, Oct. 9-14,2000
NEW TYPES OF LEAD TUNGSTATE CRYSTALSWITH HIGH LIGHT YIELD
R.H.Mao,G.H.Ren,D.Z. Shen,Z.W. YinShanghai Institute of Ceramics, Shanghai 200050, P.R.C.
X.D. Qu,L.Y. Zhang, R.Y. ZhuCalifornia Institute of Technology, Pasadena, CA 91125, U.S.A
S.P. Stoll, C.L. WoodyBrookhaven National Laboratory, Upton, NY 11973, U.S.A
ABSTRACT
Becauseof theirhighstoppingpowerandfastscintillation,leadtungstatecrystalshaveattractedmuchattentionin thehighenergy physicsandnuclear physicscommunities.Theuseof leadtungstate,however, is limited by its low light output. An effort hasbeenmadeat theShanghai Instituteof Ceramicsto improve this. Theresultsindicatethatup to a factorof ten increasein the light output, mainly in themicrosecond de-caycomponent,maybeachieved. TheX-ray diffraction pattern, photo luminescencespectrum, light output, decaykineticsandtransmittancespectrumof new samplesarepresented. Longitudinal uniformity of a sampleof 22 radiationlengthsis studied.Possibleapplicationsfor calorimetryin high energy andnuclearphysicsexperimentsarediscussed.
IX Int. Conf. onCalorimetryin Part. Phys.,Annecy, Oct. 9-14, 2000 710
1 Introduction
In thelastfiveyearsanextensive R&D programhasbeencarriedoutby theCompact
Muon Solenoid(CMS) experiment in developingleadtungstate(PbWO � ) crystalsto
beusedin theLargeHadronCollider(LHC). As aresultof thisdevelopment program,
a total of 11.2m�
large size(25 X � ) PbWO� crystalswith fastscintillation light will
beproducedin BogoroditskTechno-ChemicalPlant(BTCP) in Tulla, Russia,andin
Shanghai Instituteof Ceramics(SIC) in Shanghai, China. Becauseof this develop-
ment,PbWO� crystalis now a maturematerialin marketwith low cost.
It, however, is interestingto notethat theY dopedPbWO � crystalschosenby
CMS have limited light output, about 10 p.e/MeV for full size samplesmeasured
with a photo multiplier (PMT) of bi-alkali cathode. This limits their applicationin
areasotherthanhigh energy andnuclearphysics. Oneapproachto modify scintilla-
tion property of a materialis alteringcrystalstructure by changing growth parameter.
Doping during crystalgrowth is another approachwhich may compensatestructure
defects, eliminateunwantedimpurities andchangescintillationproperties. In devel-
oping BGO crystalsfor theL3 experiment,Eu doping wasusedat SIC to improve its
radiation resistance1�. In developing CsI(Tl) crystalsfor the �������� andBELLE
experiments,a specialscavenger wasusedat SIC to remove oxygencontamination2�. Pentavalent(Nb) doping in PbWO � wasfirst reportedby Lecoqet al. to beeffec-
tive in improving transmittanceat 100ppmlevel 3�. Trivalent (La) doping wasfirst
reportedby Kobayashiet al. to be effective in improving both the transmittance 4�
andtheradiation hardness 5�. Consequentstudieson doping with variousions,such
asLa,Lu, Gd,Y andNb,atoptimizedlevel werereportedto beeffectivein improving
transmittanceaswell asradiationhardness 6 7�.
Early Glow DischargeMassSpectroscopy (GDMS) analysis revealedthatcon-
taminationsof certaincation,especiallyMo, wereresponsiblefor theslow scintilla-
tion component in PbWO � , asreported by Kobayashiet al. 8�
andZhu et al. 9�.
Ontheotherhand,Mo doping introducesasignificantfractionof theslow component
andthusincreasesthe light output in PbWO � crystals. Following this line, PbWO�samplesdoped with various dopant weregrown andwerefound with significantin-
creaseof light yield 10 11�. In this paperwe present scintillationandotheroptical
propertiesof PbWO� crystalsdopedwith two specialdopant A andB1. It is found
1Pendingon patentapplication, the chemical natureof particular dopant is notreleasedat present.
IX Int. Conf. onCalorimetryin Part. Phys.,Annecy, Oct. 9-14, 2000 711
thatlight output of upto tenfoldsof thatof theCMSY dopedPbWO � crystal,mainly
in themicroseconddecaycomponent,canbeachieved. PbWO � crystalsof this type
mayfind applications in highenergy andnuclear physicsexperiments,suchascrystal
calorimetersin future electronlinearcolliders or in heavy ion colliders, whereinter-
actioncross-sectionallowsanintegration time of a few � s.
2 Samples
A total of tensamples,grown by a modifiedBridgmanmethodat SIC, werestudied.
Table1 lists thedimension,dopant,peakof thephoto luminescenceandthesample
delivery date. As a comparison, a standardCMS Y dopedsampleS762, which is a
23 cm long taperedfrom �� ������� � cm� to �� ������ � cm� , is alsolisted in this table.
Two differentdopants(A andB) wereintroducedatdifferentlevelsin themeltduring
growth.
Table1: List of SamplesInvestigatedin this Paper
ID Dimension(cm) ������ (nm) DateSamplesDopedwith DopantA
S25 ���! #"$ ��!%&"'���! 570 4/23/1999S27 ���)(#"+*����)(�"$���)( 570 4/26/2000Z9 ���)(#"+*� ��!,�"'���)( 570 4/26/2000Z14 ���)(#"+*�-.�! #"$���)( 570 7/21/2000Z22 ���)(#"+*�/��)(�"$���)( 570 7/21/2000Z23 ���)(�"$ ��0-1"'���)( 570 7/21/2000Z24 ���)(�"$2��)(#"'���)( 570 9/20/2000Z25 ���)(#"+*����)(�"$���)( 570 9/20/2000
SamplesDopedwith DopantBZ20 ���)(#"+*435�)(�"$���)( 570 7/21/2000Z21 ���)(#"+*6(7�!2#"$���)( 570 7/21/2000
A StandardCMSY DopedSampleS762 ���!�&"'��2��)(8"'���!/ 430 8/25/2000
All sampleshaverectangular shapewith all surfacespolished. No further treat-
ment,otherthansimplecleaningwith alcohol, wascarriedout before measurements.
IX Int. Conf. onCalorimetryin Part. Phys.,Annecy, Oct. 9-14, 2000 712
(312
)(2
24)
(116
)
(220
)
(204
)
(004
)(112
)
(200
)
40.00 60.0020.00
(degree)2θ
Inte
nsity
(a.
u.)
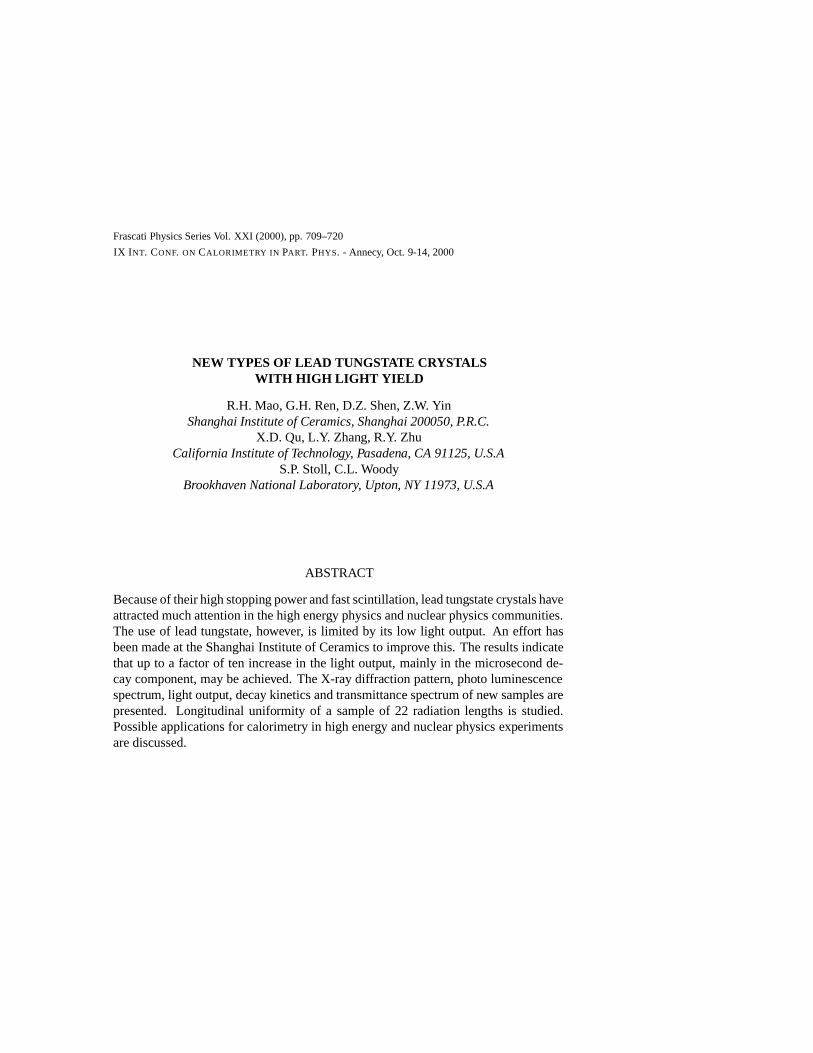
Figure1: A photoshowing, from top tobottom, a standard CMS Y dopedsam-pleS762,anA dopedsampleZ9 anda BdopedsampleZ20.
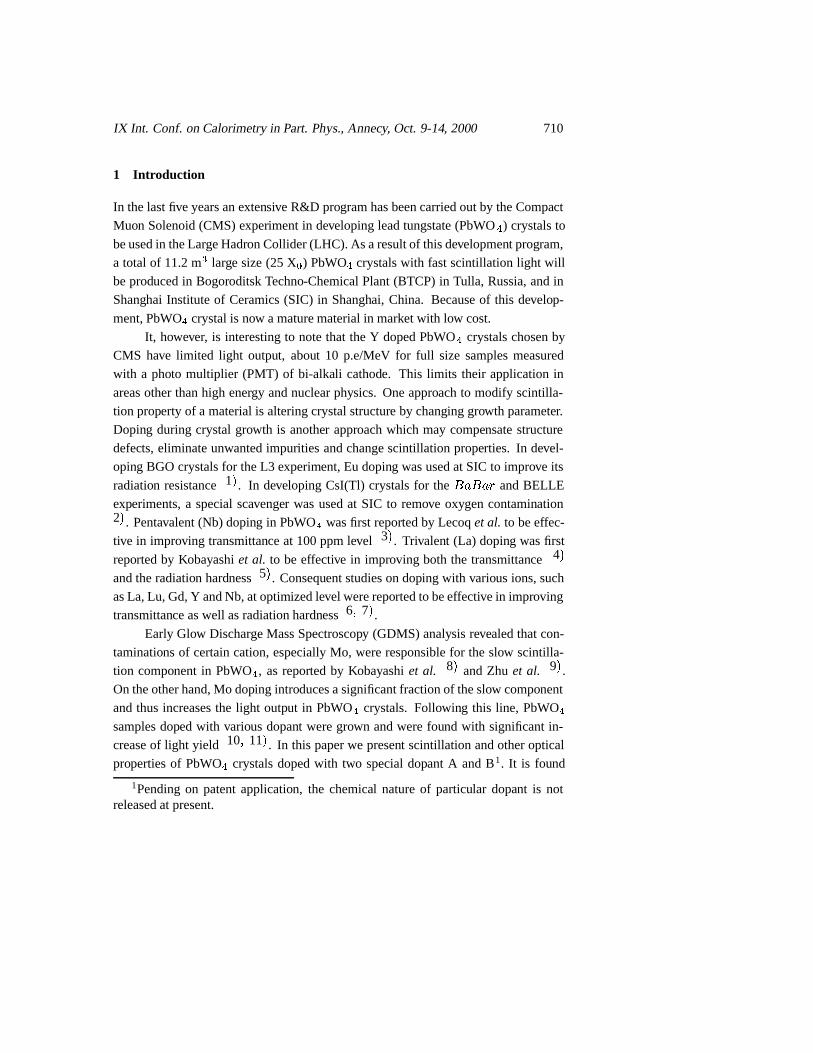
Figure2: XRD patternsfor samplesZ24andZ25.
The as-grown samplesare transparent, colourless without visible defects,suchas
cracking, inclusions, scatteringparticlesand growth striation. Figure1 is a photo
showing, from top to bottom, a standardCMS Y doped sampleS762,an A doped
sampleZ9 anda B doped sampleZ20.
Both A andB dopingsdo not change crystalstructure.Figure 2 shows theX-
ray diffraction(XRD) patternsmeasuredat SIC. Two smallblockscut from samples
Z24 andZ25 weregroundedinto powders, andthe XRD spectraweretaken by us-
ing a D/MAX-C diffractometerwith a Cu targetrunning at 40 kV, 30 A and2 9 /min.
Both patternsmatchvery well with standardpower diffraction dataof puresheelite
structure 12�. No otherphasewasobserved.
3 Emission
Photoluminescence spectrumwasmeasuredby usinga Hitachi F-4500 fluorescence
spectrophotometerequippedwith a redsensitive HamamatsuPMT R928,which ex-
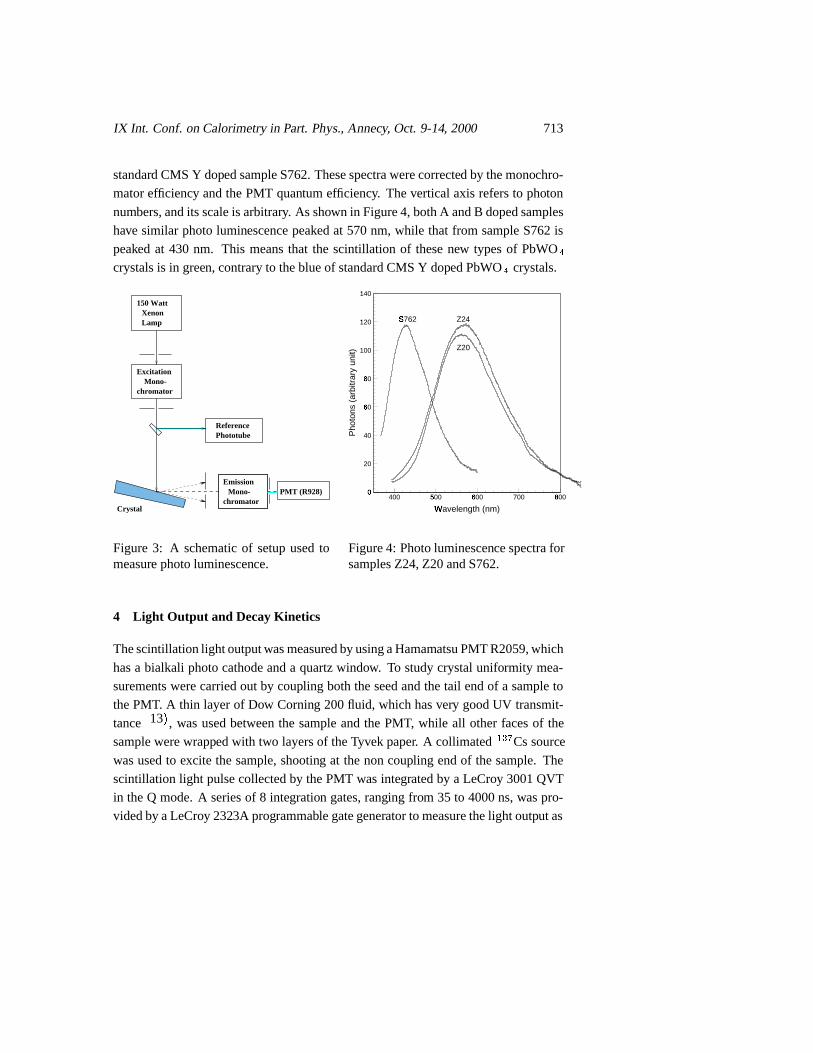
tendsmeasurement range from 220 to 800 nm. Figure3 shows a schematicof the
setup,wherethe UV excitation light wasshotto a baresurfaceof a sampleandthe
photo luminescence, without passingthrough sampleto avoid effect of self absorp-
tion, wasmeasuredby anR928PMT througha monochromator. Figure4 shows the
photo luminescence spectrafor anA dopedsampleZ24,a B doped sampleZ20anda
IX Int. Conf. onCalorimetryin Part. Phys.,Annecy, Oct. 9-14, 2000 713
standard CMSY dopedsampleS762.Thesespectrawerecorrected by themonochro-
matorefficiency andthePMT quantum efficiency. Theverticalaxis refersto photon
numbers,andits scaleis arbitrary. As shown in Figure4, bothA andB dopedsamples
have similar photoluminescencepeakedat 570nm, while that from sampleS762is
peaked at 430 nm. This meansthat the scintillation of thesenew typesof PbWO �crystalsis in green, contraryto theblueof standardCMS Y dopedPbWO � crystals.
Crystal
PMT (R928)
150 WattXenon Lamp
ExcitationMono-
chromator
ReferencePhototube
chromatorMono-
Emission0:
20
40
60;80<
100=120=140=
400 500>
600;
700 800<
S762?
Z24
Z20
Wavelength (nm)@
Pho
tons
(ar
bitr
ary
unit)
Figure3: A schematicof setupusedtomeasure photoluminescence.
Figure4: PhotoluminescencespectraforsamplesZ24,Z20andS762.
4 Light Output and Decay Kinetics
Thescintillationlight outputwasmeasuredbyusingaHamamatsuPMTR2059,which
hasa bialkali photocathodeanda quartzwindow. To studycrystaluniformity mea-
surementswerecarriedout by coupling boththeseedandthetail endof a sampleto
thePMT. A thin layerof Dow Corning 200fluid, which hasvery goodUV transmit-
tance 13�, wasusedbetweenthe sampleandthe PMT, while all otherfacesof the
samplewerewrappedwith two layersof theTyvekpaper. A collimated A �CB Cssource
wasusedto excite thesample,shooting at thenoncoupling endof thesample.The
scintillationlight pulsecollectedby thePMT wasintegratedby a LeCroy 3001QVT
in theQ mode.A seriesof 8 integration gates,ranging from 35 to 4000ns,waspro-
videdby aLeCroy 2323A programmable gategeneratorto measurethelight output as
IX Int. Conf. onCalorimetryin Part. Phys.,Annecy, Oct. 9-14, 2000 714
a function of integrationtime. The D -ray peakwasdeterminedby a simpleGaussian
fit, andwasusedto determine photoelectronnumbersby usingthesinglephotoelec-
tronpeak.Themeasuredphotoelectronnumberscanbeconvertedto thephotonyield
of thesampleby takinginto account thequantum efficiency of thephotocathodeand
theefficiency of thelight collection.
9.6
9.8
10
10.2
10.4
10.6
10.8
0 2 4 6 8
DataET Corrected DataF
Time (hrs)G
L.Y
. (p.
e./M
eV)
0
2
4
6
8
10
12
14
9.8 10 10.2 10.4 10.6 10.8
EntriesMean
RMS
20 10.35
0.1071
L.Y. (Data)
0
2
4
6
8
10
12
14
9.8 10 10.2 10.4 10.6 10.8
EntriesMean
RMS
20 10.42
0.8426E-01
L.Y. (T-Corrected Data)
0
500
1000
1500
2000
2500
3000
300 400 500 600 700 800 900 1000
ADC ChannelsH
Cou
nts
Pedestal
S762 Z20 Z24
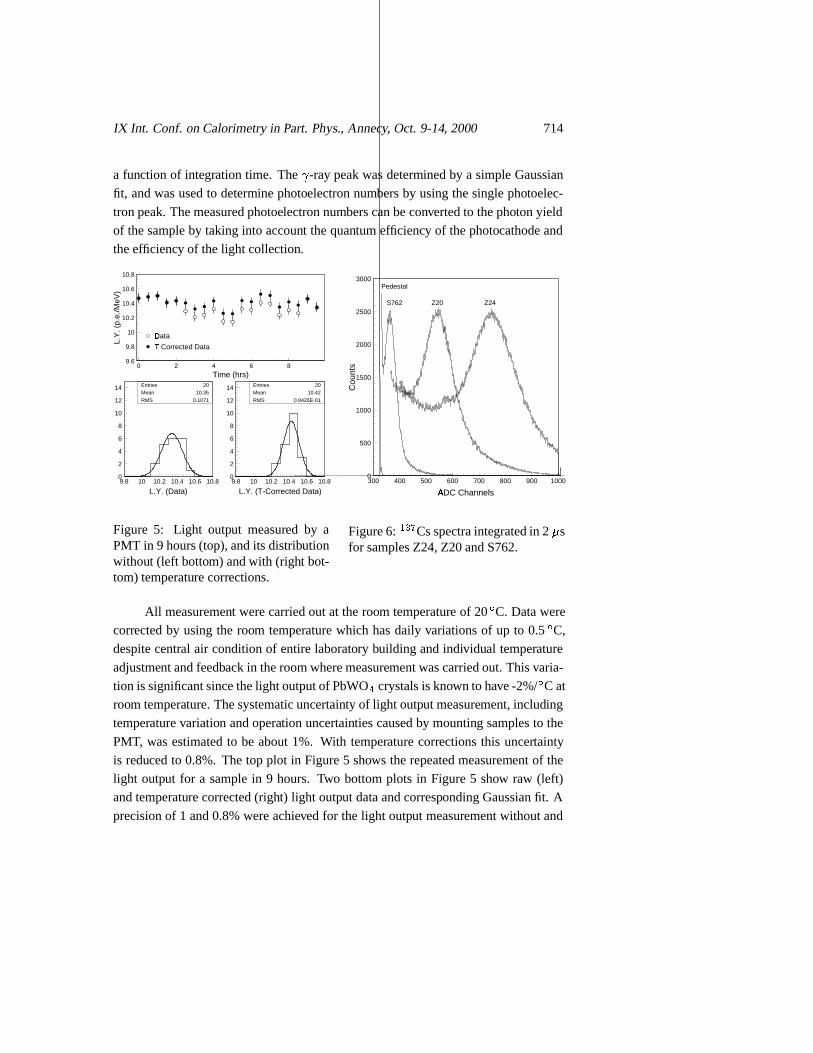
Figure 5: Light output measured by aPMT in 9 hours(top),andits distributionwithout (left bottom) andwith (right bot-tom) temperature corrections.
Figure6: A �CB Csspectraintegratedin 2 � sfor samplesZ24,Z20andS762.
All measurement werecarriedout at theroom temperature of 20 9 C. Datawere
correctedby usingthe room temperaturewhich hasdaily variationsof up to 0.5 9 C,
despitecentral air conditionof entirelaboratory building andindividual temperature
adjustment andfeedbackin theroomwheremeasurementwascarriedout. Thisvaria-
tion is significantsincethelight outputof PbWO � crystalsis known to have-2%/9 C at
room temperature.Thesystematicuncertainty of light output measurement,including
temperaturevariation andoperation uncertaintiescausedby mounting samplesto the
PMT, wasestimatedto be about1%. With temperaturecorrectionsthis uncertainty
is reducedto 0.8%. Thetop plot in Figure5 shows therepeatedmeasurementof the
light output for a samplein 9 hours. Two bottomplots in Figure5 show raw (left)
andtemperature corrected(right) light output dataandcorrespondingGaussianfit. A
precisionof 1 and0.8%wereachievedfor thelight output measurementwithout and
IX Int. Conf. onCalorimetryin Part. Phys.,Annecy, Oct. 9-14, 2000 715
with temperaturecorrectionsrespectively.
Figure6 shows A �CB Csspectraintegratedin 2 � s from anA dopedsampleZ24,
a B doped sampleZ20 anda standard Y doped CMS PbWO � sampleS762. Both
A andB dopedsampleshave significantlymorelight thanCMS sample,andthe A
dopedsampleZ24hasmore light thantheB dopedsampleZ20,partof whichcanbe
explainedby thesmallsizeof sampleZ24.
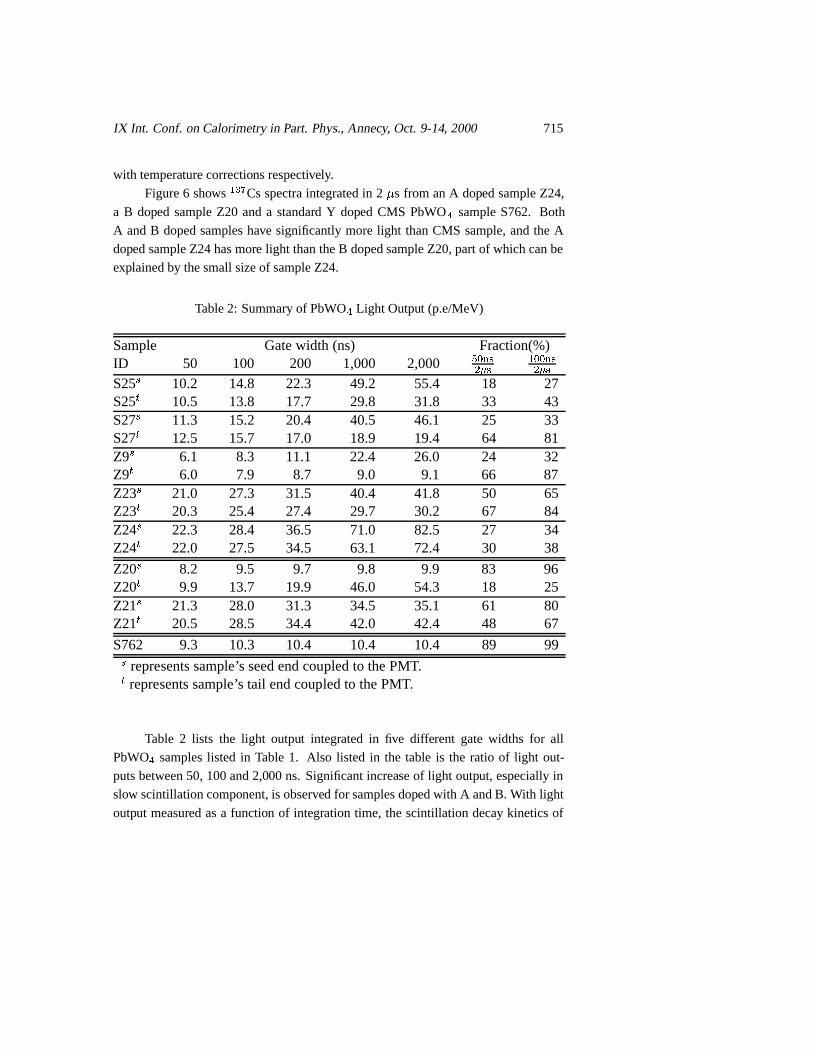
Table2: Summaryof PbWO � Light Output (p.e/MeV)
Sample Gatewidth (ns) Fraction(%)ID 50 100 200 1,000 2,000 IKJML4NOMP
NQJKJML4NOMPN
S25R 10.2 14.8 22.3 49.2 55.4 18 27S25S 10.5 13.8 17.7 29.8 31.8 33 43S27R 11.3 15.2 20.4 40.5 46.1 25 33S27S 12.5 15.7 17.0 18.9 19.4 64 81Z9R 6.1 8.3 11.1 22.4 26.0 24 32Z9S 6.0 7.9 8.7 9.0 9.1 66 87Z23R 21.0 27.3 31.5 40.4 41.8 50 65Z23S 20.3 25.4 27.4 29.7 30.2 67 84Z24R 22.3 28.4 36.5 71.0 82.5 27 34Z24S 22.0 27.5 34.5 63.1 72.4 30 38
Z20R 8.2 9.5 9.7 9.8 9.9 83 96Z20S 9.9 13.7 19.9 46.0 54.3 18 25Z21R 21.3 28.0 31.3 34.5 35.1 61 80Z21S 20.5 28.5 34.4 42.0 42.4 48 67
S762 9.3 10.3 10.4 10.4 10.4 89 99
R representssample’s seedendcoupledto thePMT.S representssample’s tail endcoupled to thePMT.
Table 2 lists the light output integrated in five different gate widths for all
PbWO� sampleslisted in Table1. Also listed in the table is the ratio of light out-
putsbetween50,100and2,000 ns. Significantincreaseof light output, especiallyin
slow scintillationcomponent,is observed for samplesdopedwith A andB. With light
output measured asa function of integration time, the scintillationdecaykineticsof
IX Int. Conf. onCalorimetryin Part. Phys.,Annecy, Oct. 9-14, 2000 716
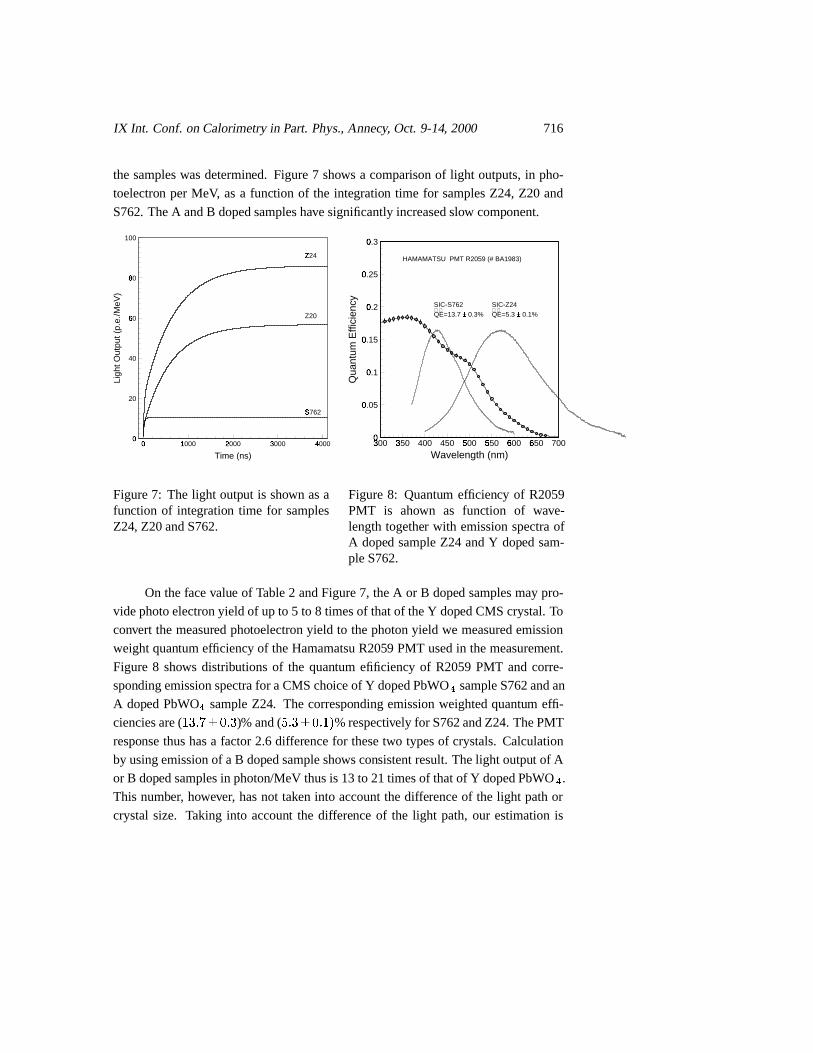
thesampleswasdetermined. Figure7 shows a comparisonof light outputs,in pho-
toelectron per MeV, asa function of the integration time for samplesZ24, Z20 and
S762. TheA andB dopedsampleshavesignificantlyincreasedslow component.
0T
20
40
60U
80V
100
0T
1000W
2000X
3000Y
4000Z
Z20
S762[
Z24\
Time (ns)
Ligh
t Out
put (
p.e.
/MeV
)
0]
0.05]
0.1]
0.15]
0.2]
0.25]
0.3]
300^
350^
400 450 500_
550_
600`
650`
700
SIC-S762
Q
E
=13.7 ±a 0.3%
SIC-Z24
Q
E
=5.3 ±a 0.1%
HAMAMATSU PMT R2059 (# BA1983)
Wavelength (nm)
Qua
ntum
Effi
cien
cy
Figure7: The light output is shown asafunction of integration time for samplesZ24, Z20andS762.
Figure8: Quantum efficiency of R2059PMT is ahown as function of wave-lengthtogether with emissionspectraofA doped sampleZ24 andY doped sam-pleS762.
On thefacevalue of Table2 andFigure7, theA or B doped samplesmaypro-
videphotoelectronyield of upto 5 to 8 timesof thatof theY dopedCMS crystal.To
convert themeasuredphotoelectronyield to thephotonyield we measuredemission
weightquantum efficiency of theHamamatsuR2059 PMT usedin themeasurement.
Figure8 shows distributionsof the quantum efificiency of R2059PMT andcorre-
spondingemissionspectrafor aCMSchoiceof Y dopedPbWO � sampleS762andan
A doped PbWO� sampleZ24. The correspondingemissionweightedquantum effi-
cienciesare( bdce �fhg1i� c )% and( j� ckg1ie 0b � % respectively for S762andZ24. ThePMT
responsethushasa factor2.6differencefor thesetwo typesof crystals.Calculation
by usingemissionof aB dopedsampleshowsconsistentresult.Thelight output of A
or B dopedsamplesin photon/MeV thusis 13to 21timesof thatof Y dopedPbWO � .This number, however, hasnot taken into accountthedifferenceof the light pathor
crystalsize. Taking into account the differenceof the light path,our estimationis
IX Int. Conf. onCalorimetryin Part. Phys.,Annecy, Oct. 9-14, 2000 717
thatup to a factorof tenincreasein light output, mainly in � secdecaycomponent,is
expectedfor theA andB dopedsamplesascomparedto thatof thestandardY doped
CMS sample.
ReadingTable2 onealsonoticesthatthedifferenceof thelight output between
theseedandthetail endcoupledto thePMT for thesamesample.This is causedby
thevariation of theemissionspectrumalongthecrystallengthandwill bediscussed
in detailsin Section6.
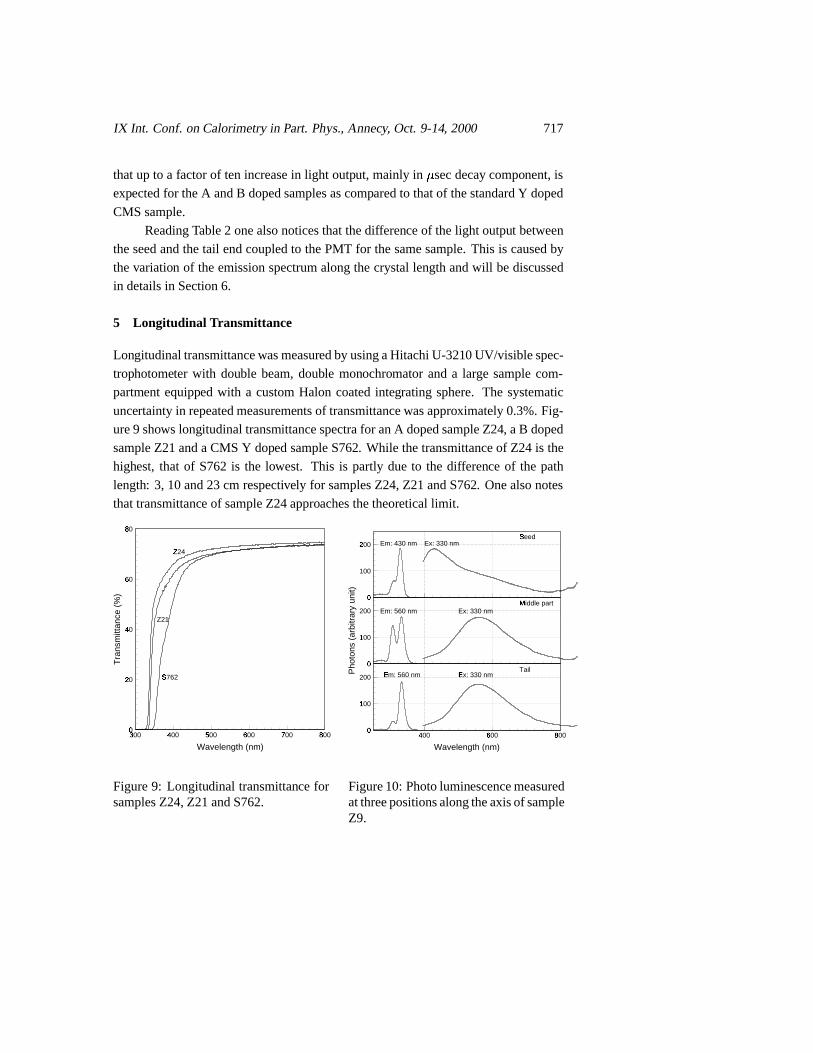
5 Longitudinal Transmittance
Longitudinaltransmittancewasmeasuredby usingaHitachiU-3210 UV/visible spec-
trophotometer with double beam,double monochromatoranda large samplecom-
partment equipped with a customHalon coatedintegrating sphere.The systematic
uncertainty in repeatedmeasurementsof transmittancewasapproximately0.3%.Fig-
ure9 shows longitudinal transmittancespectrafor anA dopedsampleZ24, aB doped
sampleZ21anda CMS Y dopedsampleS762. While thetransmittanceof Z24 is the
highest, that of S762is the lowest. This is partly dueto the difference of the path
length: 3, 10 and23 cm respectively for samplesZ24,Z21 andS762. Onealsonotes
thattransmittance of sampleZ24approachesthetheoreticallimit.
0l
20m
40n
60o
80p
300q
400n
500r
600o
700s
800p
Wavelength (nm)
Tra
nsm
ittan
ce (
%)
Z24t
Z21
S762u
0v
100
200w
400x
600y
800z
Seed{
Em: 430 nm Ex: 330 nm
0v
100|200
400x
600y
800z
Middle part}
Em: 560 nm Ex: 330 nm
Pho
tons
(ar
bitr
ary
unit)
0v
100|200
400x
600y
800z
Wavelength (nm)
TailEm: 560 nm~
Ex: 330 nm~
Figure9: Longitudinal transmittance forsamplesZ24,Z21andS762.
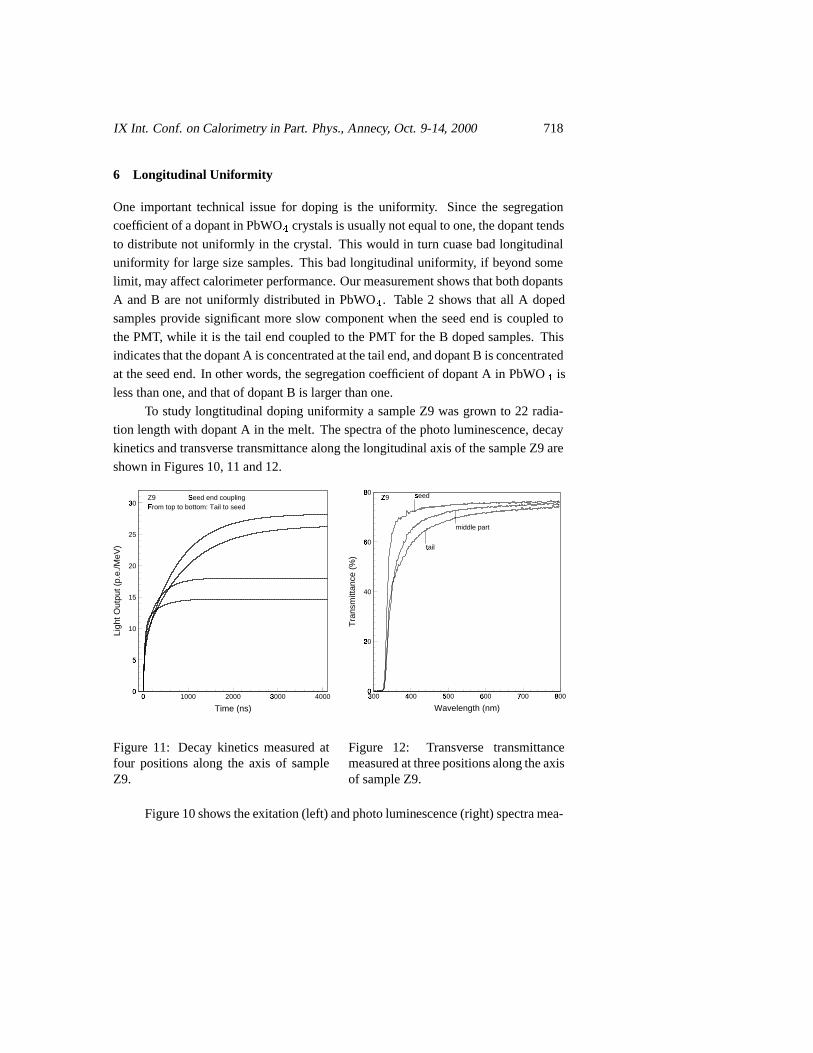
Figure10: Photoluminescencemeasuredatthreepositionsalongtheaxisof sampleZ9.
IX Int. Conf. onCalorimetryin Part. Phys.,Annecy, Oct. 9-14, 2000 718
6 Longitudinal Uniformity
One important technicalissuefor doping is the uniformity. Sincethe segregation
coefficientof adopantin PbWO � crystalsis usuallynotequalto one,thedopant tends
to distributenot uniformly in thecrystal. This would in turn cuasebadlongitudinal
uniformity for largesizesamples.This badlongitudinal uniformity, if beyondsome
limit, mayaffect calorimeterperformance.Ourmeasurementshowsthatbothdopants
A andB arenot uniformly distributed in PbWO � . Table2 shows that all A doped
samplesprovide significantmoreslow componentwhenthe seedendis coupledto
thePMT, while it is the tail endcoupled to thePMT for theB dopedsamples.This
indicatesthatthedopant A is concentratedatthetail end,anddopantB is concentrated
at theseedend. In otherwords, thesegregationcoefficient of dopantA in PbWO � is
lessthanone,andthatof dopantB is larger thanone.
To studylongtitudinal doping uniformity a sampleZ9 wasgrown to 22 radia-
tion lengthwith dopant A in themelt. Thespectraof thephotoluminescence,decay
kineticsandtransversetransmittancealongthelongitudinal axisof thesampleZ9 are
shown in Figures10,11and12.
0�5�
10
15
20
25
30�
0�
1000 2000 3000�
4000
Time (ns)
Ligh
t Out
put (
p.e.
/MeV
)
Z9 Seed end coupling�
From top to bottom: Tail to seed�
0�
20�
40
60�
80�
300�
400�
500�
600�
700�
800�
seed�
middle part
tail�
Wavelength (nm)
Tra
nsm
ittan
ce (
%)
Z9�
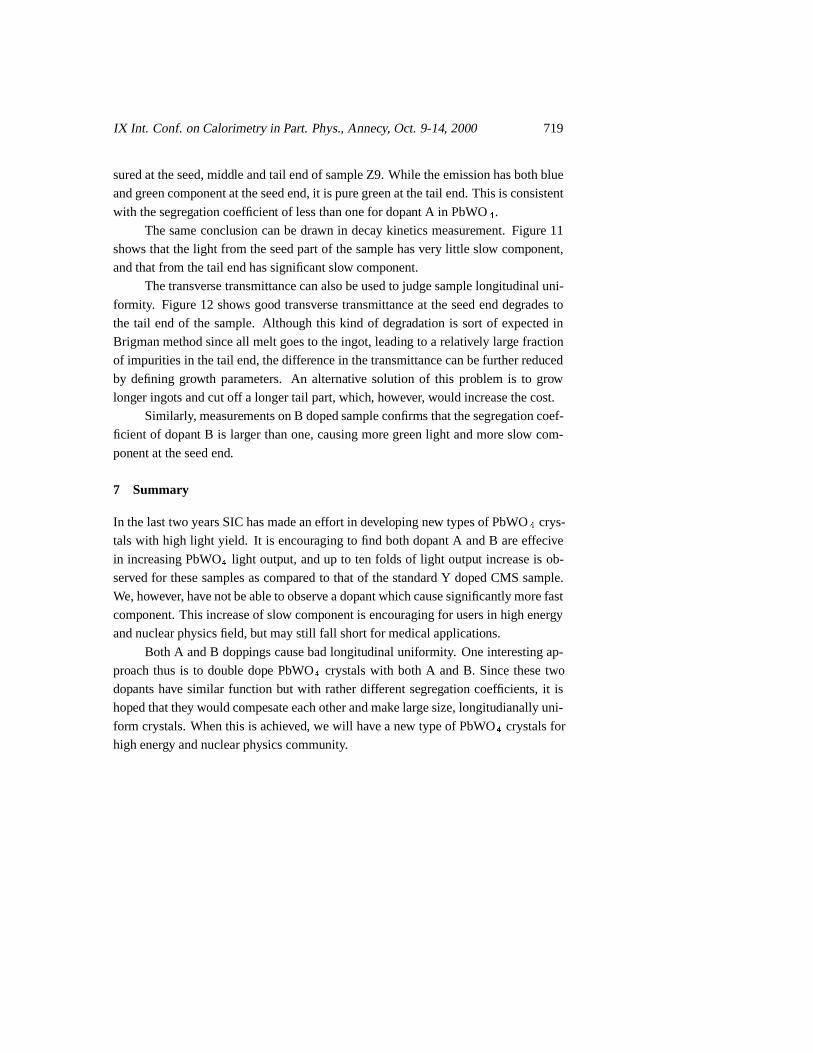
Figure 11: Decaykinetics measuredatfour positionsalong the axis of sampleZ9.
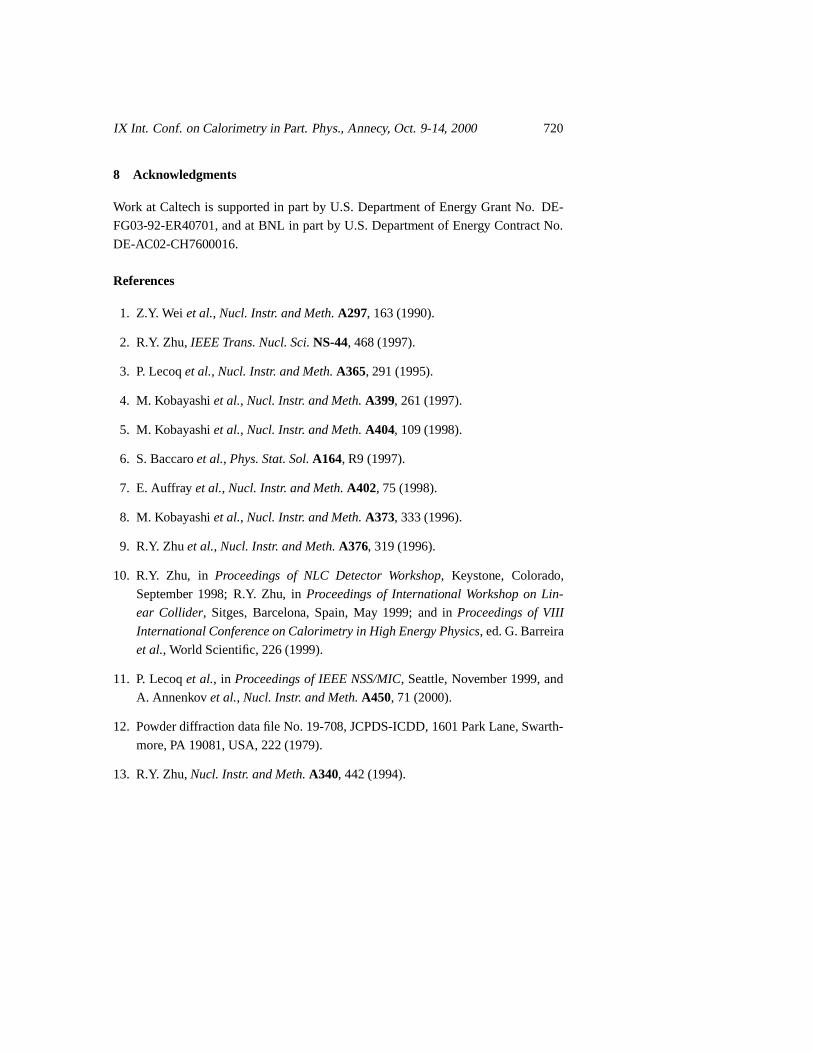
Figure 12: Transverse transmittancemeasuredatthreepositionsalongtheaxisof sampleZ9.
Figure10showstheexitation(left) andphotoluminescence(right) spectramea-
IX Int. Conf. onCalorimetryin Part. Phys.,Annecy, Oct. 9-14, 2000 719
suredat theseed,middle andtail endof sampleZ9. While theemissionhasbothblue
andgreencomponentat theseedend,it is puregreenat thetail end.This is consistent
with thesegregationcoefficient of lessthanonefor dopant A in PbWO � .Thesameconclusioncanbedrawn in decaykineticsmeasurement. Figure11
shows that the light from theseedpartof thesamplehasvery little slow component,
andthatfrom thetail endhassignificantslow component.
Thetransversetransmittancecanalsobeusedto judgesamplelongitudinaluni-
formity. Figure12 shows good transversetransmittanceat theseedenddegradesto
the tail endof the sample.Although this kind of degradationis sort of expectedin
Brigmanmethodsinceall melt goesto theingot, leading to a relatively large fraction
of impurities in thetail end,thedifferencein thetransmittancecanbefurtherreduced
by defininggrowth parameters. An alternative solutionof this problem is to grow
longer ingots andcutoff a longertail part,which, however, would increasethecost.
Similarly, measurementsonB dopedsampleconfirms thatthesegregationcoef-
ficient of dopant B is larger thanone,causingmoregreenlight andmoreslow com-
ponentat theseedend.
7 Summary
In thelasttwo yearsSIChasmadeaneffort in developingnew typesof PbWO � crys-
talswith high light yield. It is encouragingto find bothdopantA andB areeffecive
in increasingPbWO� light output, andup to ten folds of light output increaseis ob-
servedfor thesesamplesascompared to thatof thestandardY dopedCMS sample.
We,however, havenotbeableto observeadopantwhichcausesignificantlymorefast
component.This increaseof slow componentis encouragingfor usersin highenergy
andnuclearphysicsfield, but maystill fall shortfor medicalapplications.
Both A andB doppingscausebadlongitudinal uniformity. Oneinterestingap-
proachthus is to double dope PbWO � crystalswith both A andB. Sincethesetwo
dopantshave similar function but with ratherdifferentsegregation coefficients, it is
hopedthatthey wouldcompesateeachotherandmakelargesize,longitudianallyuni-
form crystals.Whenthis is achieved, we will havea new typeof PbWO � crystalsfor
highenergy andnuclearphysicscommunity.
IX Int. Conf. onCalorimetryin Part. Phys.,Annecy, Oct. 9-14, 2000 720
8 Acknowledgments
Work at Caltechis supported in part by U.S. Departmentof Energy GrantNo. DE-
FG03-92-ER40701,andat BNL in partby U.S.Departmentof Energy ContractNo.
DE-AC02-CH7600016.
References
1. Z.Y. Wei et al., Nucl. Instr. and Meth. A297, 163(1990).
2. R.Y. Zhu,IEEE Trans. Nucl. Sci. NS-44, 468(1997).
3. P. Lecoqet al., Nucl. Instr. and Meth. A365, 291(1995).
4. M. Kobayashi et al., Nucl. Instr. and Meth. A399, 261(1997).
5. M. Kobayashi et al., Nucl. Instr. and Meth. A404, 109(1998).
6. S.Baccaroet al., Phys. Stat. Sol. A164, R9 (1997).
7. E. Auffray et al., Nucl. Instr. and Meth. A402, 75 (1998).
8. M. Kobayashi et al., Nucl. Instr. and Meth. A373, 333(1996).
9. R.Y. Zhuet al., Nucl. Instr. and Meth. A376, 319(1996).
10. R.Y. Zhu, in Proceedings of NLC Detector Workshop, Keystone, Colorado,
September 1998; R.Y. Zhu, in Proceedings of International Workshop on Lin-
ear Collider, Sitges,Barcelona, Spain,May 1999; and in Proceedings of VIII
International Conference on Calorimetry in High Energy Physics, ed.G.Barreira
et al., World Scientific,226(1999).
11. P. Lecoqet al., in Proceedings of IEEE NSS/MIC, Seattle,November1999, and
A. Annenkov et al., Nucl. Instr. and Meth. A450, 71 (2000).
12. Powderdiffraction datafile No. 19-708, JCPDS-ICDD,1601 ParkLane,Swarth-
more,PA 19081, USA, 222(1979).
13. R.Y. Zhu,Nucl. Instr. and Meth. A340, 442(1994).