Embed Size (px)
Citation preview
1
EBHA – BHC Joint Annual Meeting (Milano, 11-13 June 2009) Session 11.D “Brands and Trademarks: Views from the Periphery”
New trends in world wine consumption and its impact on the Spanish
wineries during the second half of the twentieth century
Francisco J. Medina-Albaladejo∗ Universidad de Murcia
1. Introduction1
The wine sector has undergone a series of deep transformations during the
twentieth century, especially in the second half. A restructuring process occurred for
several reasons. In order to understand these changes from the point of view of the
supply, we should first bear in mind the demand, in other words, wine consumers, who
have experienced similar or even greater changes in their habits and preferences and
have participated to a large extent in causing the transformations in the sector.
This is not an isolated case, it is not a particular phenomenon of a specific
country, but has taken place on a global scale. World wine consumption has fallen
substantially since the 1960s, in a constant, regular way, in response to the changes that
the world society has undergone in terms of food and way of life.
Traditionally, the main wine consumer is in the countries of the south of Europe
(France, Italy, Spain, Greece), where the population drink wine as a part of the staple
diet. This practise is the cultural legacy of thousands of years of “Mediterranean triad”
(cereal, olive oil and wine), where grape juice has been a basic component of the diet
and a very important source of calories.
A good example of the above is the Spanish case. This country, a traditional
Mediterranean wine producer and consumer, is experiencing the new trends in a very
marked manner. In this paper, the idea is show how these new habits concern the
∗ PhD candidate in Economic History. Address: Applied Economics Department, Faculty of Economics and Business (Universidad de Murcia). Campus Espinardo, 30100, Espinardo (Murcia, Spain). Tlf. 868888752, e-mail: [email protected] 1 This study was performed under research projects 00681/PI/04 (Fundación Séneca) and SEJ 2007-60845 (Ministerio de Ciencia e Innovación de España).
2
Spanish wine businesses, especially in the productive and marketing process, with
emphasis on a particular kind of business – the cooperatives - but one which at the
same time is very important in the Spanish wine industry, and one which today controls
70 per cent of the total production.
These big factories, created in the fifties and sixties, were the basis of the
Spanish wine sector industrialization and a means of rural development in winegrowing
areas. Cooperatives produced a homogeneous wine of medium quality in large
quantities which were sold in the main by bulk. They adapted well to the market
demands of the time.
The main goal of this research is explain the impact of the new trends of wine
consumption, and the way these enterprises adapted to the circumstances. The
hypothesis is that the Spanish companies had to start a deep and traumatic restructuring
process, with the aim of surviving adequately in the changeable wine national and
international markets. Heavy technological investments were made, with serious finance
problems, during the eighties and nineties. We will see this from two specific cases, the
Cooperatives “San Isidro” and “Rosario”, located in the Region of Murcia, in the
Spanish southeast.
2. Structure and evolution of world wine consumption
2.1. Geographical location and global evolution
In the 1890s wine consumption reached very high levels, followed by a descent
until World War II. At the same time, tastes and preferences changed, with an increase
in the consumption of natural wines, of quality and low alcoholic degree, as opposed to
the traditional demand for full-bodied wines. Three causes lay behind this new trend
according to some authors: anti-alcoholic movements, the impact of World War I and
the preferential policies of some countries in the markets2. Other authors, like Vicente
Pinilla and Mª Isabel Ayuda3, show that the increase of the consumption was mainly
among the traditional producers, but also in countries with a medium consumption and
high income level, due to easier imports and low prices of wine and because of
improved sea and road transport. Only the higher social classes drank wine in these
2 Morilla (2001) 3 Pinilla and Ayuda (2002, 2005)
3
countries, with the rest of the population preferring other beverages like beer, due to
cultural factors. Wine was not a mass product in these societies.
These general trends before World War I established the evolution of wine
consumption in the second half of the twentieth century. In general, world wine
consumption at this time was in a constant fall, especially in the last quarter of the last
century, decreasing from 257.8 million hectolitres in 1979 to 237.6 in 2003, in other
words, a drop of 7.8 per cent4.
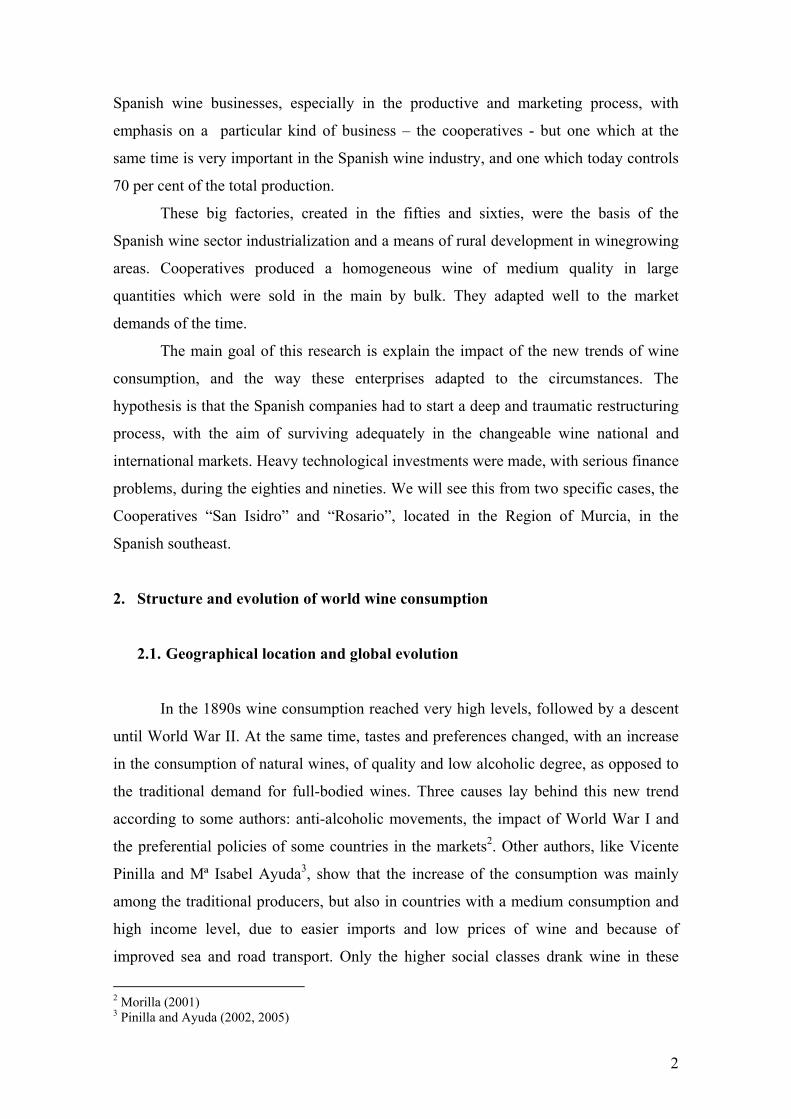
In order to make the process of geographical location, the evolution of the wine
consumption and the transformations occurred in the demand during the last fifty years
more understandable, I have established three large groups of countries with well
defined characteristics in the demand lines. I show the main existing models in
reference to wine intake worldwide.
The historical consumers and producers from the Mediterranean region in
Europe form the area I, along with a special case, as is Argentina. The second group is
made up of countries from Central Europe, traditionally consumers but less so than the
Mediterranean area. Finally, there is area III, with the new consumers from the North of
Europe and the new world producers, for instance Australia. I will analyse other
outstanding cases, due to their specific evolution or importance in the world5 (see Table
1 and Figure 1).
Table 1 Countries in the three areas designed according to the evolution of consumption AREA I AREA II AREA III OTHER CASES France Germany Netherlands United States Italy Switzerland Denmark Rumania Spain Austria Sweden South Africa Portugal Hungary United Kingdom Canada Greece Belgium Australia Chile Argentina USSR-Russia China Source: Own elaboration
4 Statistics OIV. 5 Criteria used to create the three areas are geographical location and the per capita consumption. In the Mediterranean area these must be countries with an initial level above 40 litres per capita in 1955. The second area must have a stable demand, between 5 and 40 litres per capita in the second half of the twentieth century. And in Area III there must be those countries whose initial level was very low, less than 5 litres per capita, but which in 2003 had reached a level above 15 litres per capita.
4
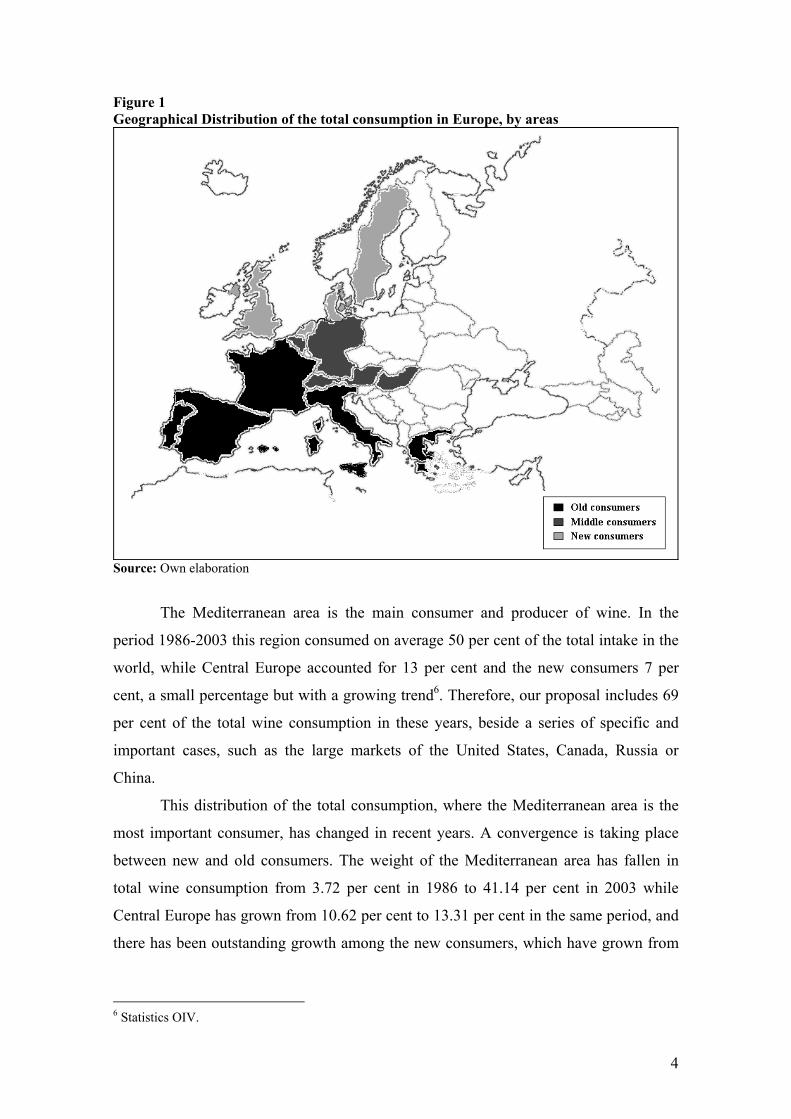
Figure 1 Geographical Distribution of the total consumption in Europe, by areas
Source: Own elaboration
The Mediterranean area is the main consumer and producer of wine. In the
period 1986-2003 this region consumed on average 50 per cent of the total intake in the
world, while Central Europe accounted for 13 per cent and the new consumers 7 per
cent, a small percentage but with a growing trend6. Therefore, our proposal includes 69
per cent of the total wine consumption in these years, beside a series of specific and
important cases, such as the large markets of the United States, Canada, Russia or
China.
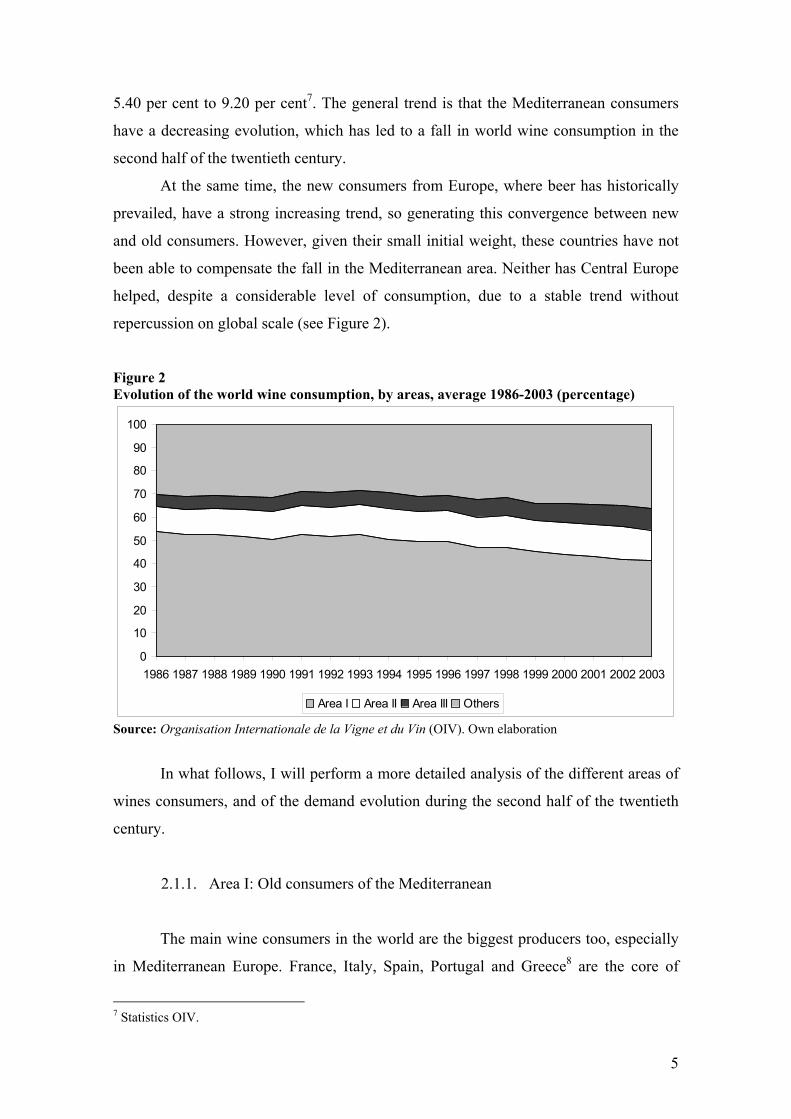
This distribution of the total consumption, where the Mediterranean area is the
most important consumer, has changed in recent years. A convergence is taking place
between new and old consumers. The weight of the Mediterranean area has fallen in
total wine consumption from 3.72 per cent in 1986 to 41.14 per cent in 2003 while
Central Europe has grown from 10.62 per cent to 13.31 per cent in the same period, and
there has been outstanding growth among the new consumers, which have grown from
6 Statistics OIV.
5
5.40 per cent to 9.20 per cent7. The general trend is that the Mediterranean consumers
have a decreasing evolution, which has led to a fall in world wine consumption in the
second half of the twentieth century.
At the same time, the new consumers from Europe, where beer has historically
prevailed, have a strong increasing trend, so generating this convergence between new
and old consumers. However, given their small initial weight, these countries have not
been able to compensate the fall in the Mediterranean area. Neither has Central Europe
helped, despite a considerable level of consumption, due to a stable trend without
repercussion on global scale (see Figure 2).
Figure 2 Evolution of the world wine consumption, by areas, average 1986-2003 (percentage)
0
10
20
30
40
50
60
70
80
90
100
1986 1987 1988 1989 1990 1991 1992 1993 1994 1995 1996 1997 1998 1999 2000 2001 2002 2003
Area I Area II Area III Others
Source: Organisation Internationale de la Vigne et du Vin (OIV). Own elaboration
In what follows, I will perform a more detailed analysis of the different areas of
wines consumers, and of the demand evolution during the second half of the twentieth
century.
2.1.1. Area I: Old consumers of the Mediterranean
The main wine consumers in the world are the biggest producers too, especially
in Mediterranean Europe. France, Italy, Spain, Portugal and Greece8 are the core of
7 Statistics OIV.
6
world wine consumption. However, there are other important cases outside this area.
For instance, Argentina is the most Europeanized country in Latin America where
Spanish and Italian immigrants have intervened in the high demand.
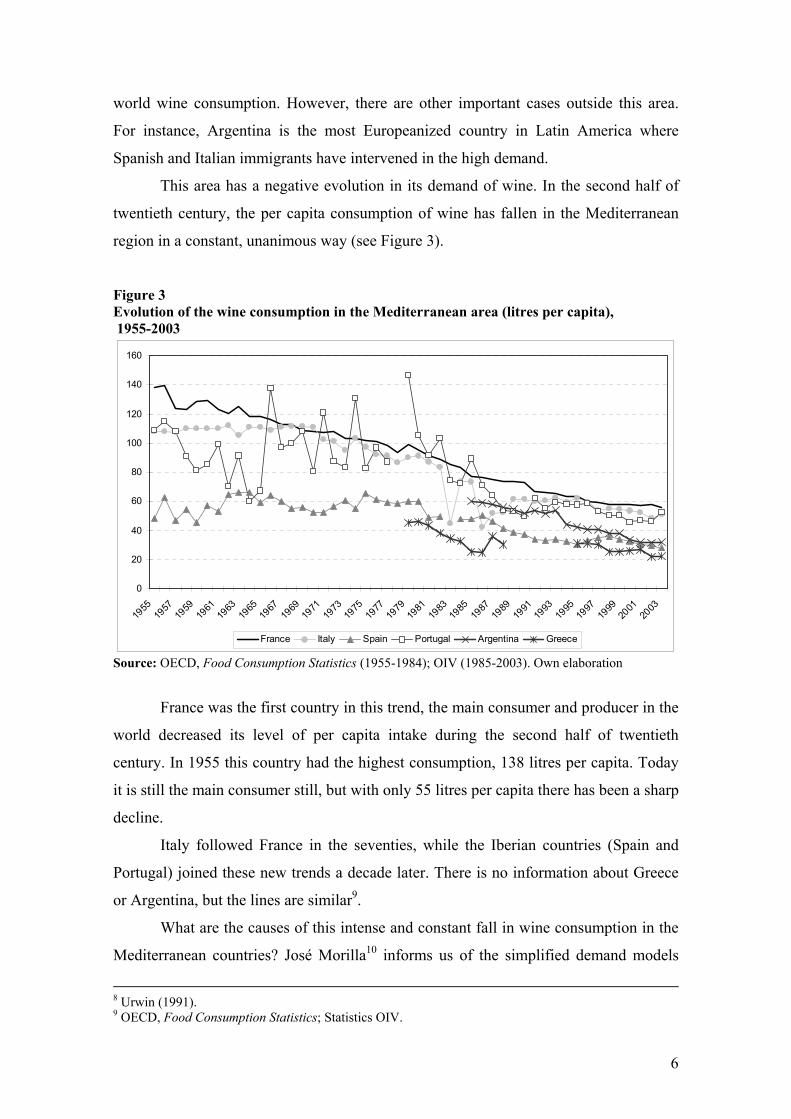
This area has a negative evolution in its demand of wine. In the second half of
twentieth century, the per capita consumption of wine has fallen in the Mediterranean
region in a constant, unanimous way (see Figure 3).
Figure 3 Evolution of the wine consumption in the Mediterranean area (litres per capita), 1955-2003
0
20
40
60
80
100
120
140
160
1955
1957
1959
1961
1963
1965
1967
1969
1971
1973
1975
1977
1979
1981
1983
1985
1987
1989
1991
1993
1995
1997
1999
2001
2003
France Italy Spain Portugal Argentina Greece
Source: OECD, Food Consumption Statistics (1955-1984); OIV (1985-2003). Own elaboration
France was the first country in this trend, the main consumer and producer in the
world decreased its level of per capita intake during the second half of twentieth
century. In 1955 this country had the highest consumption, 138 litres per capita. Today
it is still the main consumer still, but with only 55 litres per capita there has been a sharp
decline.
Italy followed France in the seventies, while the Iberian countries (Spain and
Portugal) joined these new trends a decade later. There is no information about Greece
or Argentina, but the lines are similar9.
What are the causes of this intense and constant fall in wine consumption in the
Mediterranean countries? José Morilla10 informs us of the simplified demand models
8 Urwin (1991). 9 OECD, Food Consumption Statistics; Statistics OIV.
7
according to prices and income, and their limited predictive ability in the case of wine.
This is due to differentiation trends in this product, the regulations in its markets, moral,
legal and social interferences, and irreversible demand curves of a lot of consumers.
Therefore, we have to search for other kinds of causes to explain these
transformations in the wine consumption trends. The simple changes in income or
prices are not valid, although cultural and social factors are important.
Several authors have worked on this issue, extracting diverse conclusions. For
instance, the consumption is inelastic to the price changes11, or the more consumerist a
country is the less important are the income changes of population12, due to this product
being considered as a basic commodity in the Mediterranean region. To explain this,
other authors have quoted the “hedonic functions” in the case of Australia or California,
where the demand is not defined by the price, but by the perception of quality wine, the
fashionable varieties and the area of origin13. This aspect has imposed itself in recent
years, both in the new consumer and the Mediterranean countries, where qualitative and
cultural factors have more and more importance.
There are several reasons for this general evolution in the Mediterranean region.
First, the rise in income and the higher standard of living in these countries due to the
industrialization and urbanization processes. This is not related to a higher purchasing
power, but to a population which is much more concerned about health and fitness, and
therefore a lower consumer of alcoholic drinks. The reason that more developed
countries, like France or Italy, experienced a fall in consumption earlier than the Iberian
nations is the later incorporation of these into the new food trends. Other factors are the
changes in the age structure of population or the new substitute beverages, which are
much better adapted to the demands of young, urban people.
These transformations have changed the way of life and consumption of the
society and the preferences of the wine consumer today, and so there is an ongoing
homogenization process. Nowadays, the habitual consumer does not drink table wine,
because the demand has shifted to quality wines. This product is drunk sporadically, it
is fresh, young and it has a lower alcohol degree coupled with a suitable appearance14.
10 Morilla (2001) 11 Labys (1976); Pinilla, Ayuda and Aparicio (1998); Troncoso and Aguirre (2006); Bardají (1992). 12 Tapli and Ryan (1969); Bardají (1992). 13 Golan and Shalit (1993); Oczkowski (1994). 14 Morilla (2001).
8
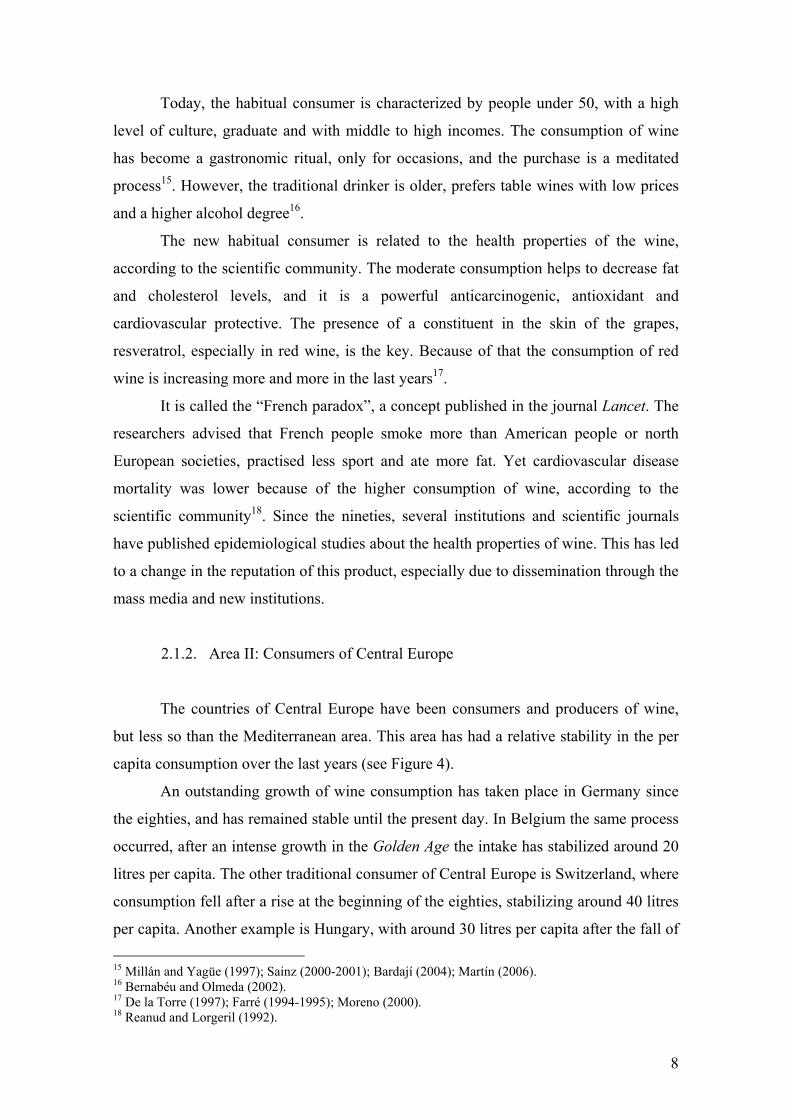
Today, the habitual consumer is characterized by people under 50, with a high
level of culture, graduate and with middle to high incomes. The consumption of wine
has become a gastronomic ritual, only for occasions, and the purchase is a meditated
process15. However, the traditional drinker is older, prefers table wines with low prices
and a higher alcohol degree16.
The new habitual consumer is related to the health properties of the wine,
according to the scientific community. The moderate consumption helps to decrease fat
and cholesterol levels, and it is a powerful anticarcinogenic, antioxidant and
cardiovascular protective. The presence of a constituent in the skin of the grapes,
resveratrol, especially in red wine, is the key. Because of that the consumption of red
wine is increasing more and more in the last years17.
It is called the “French paradox”, a concept published in the journal Lancet. The
researchers advised that French people smoke more than American people or north
European societies, practised less sport and ate more fat. Yet cardiovascular disease
mortality was lower because of the higher consumption of wine, according to the
scientific community18. Since the nineties, several institutions and scientific journals
have published epidemiological studies about the health properties of wine. This has led
to a change in the reputation of this product, especially due to dissemination through the
mass media and new institutions.
2.1.2. Area II: Consumers of Central Europe
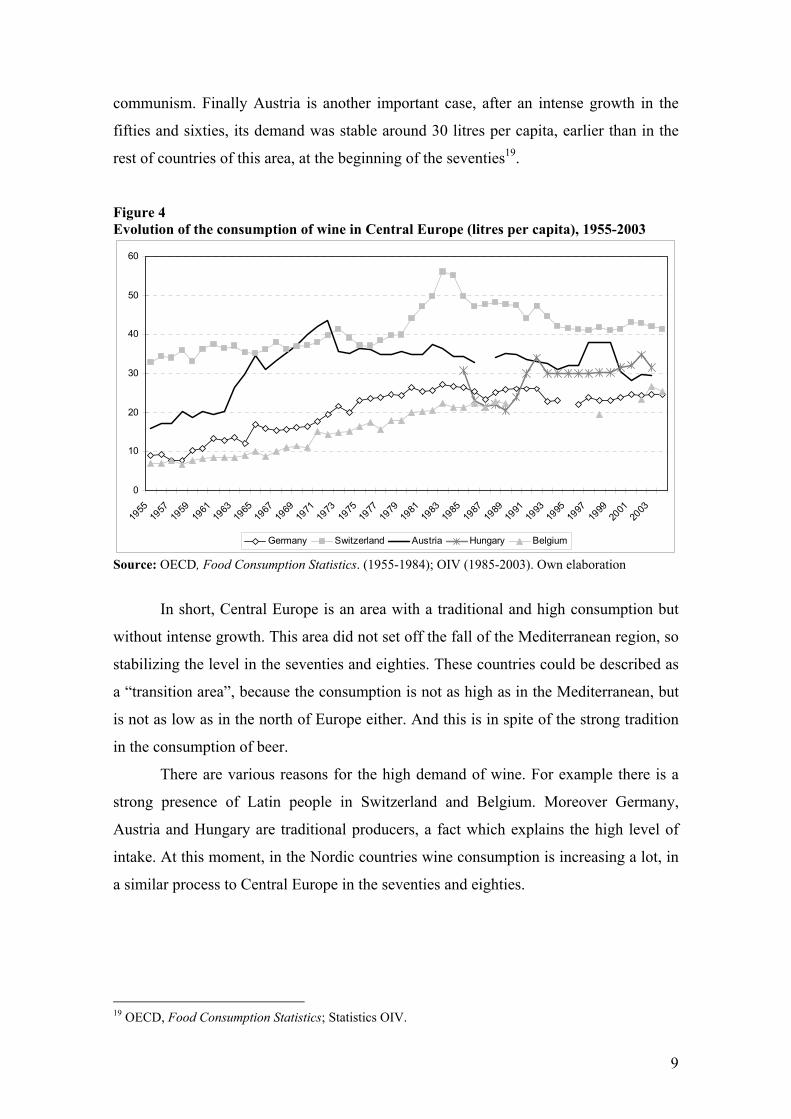
The countries of Central Europe have been consumers and producers of wine,
but less so than the Mediterranean area. This area has had a relative stability in the per
capita consumption over the last years (see Figure 4).
An outstanding growth of wine consumption has taken place in Germany since
the eighties, and has remained stable until the present day. In Belgium the same process
occurred, after an intense growth in the Golden Age the intake has stabilized around 20
litres per capita. The other traditional consumer of Central Europe is Switzerland, where
consumption fell after a rise at the beginning of the eighties, stabilizing around 40 litres
per capita. Another example is Hungary, with around 30 litres per capita after the fall of 15 Millán and Yagüe (1997); Sainz (2000-2001); Bardají (2004); Martín (2006). 16 Bernabéu and Olmeda (2002). 17 De la Torre (1997); Farré (1994-1995); Moreno (2000). 18 Reanud and Lorgeril (1992).
9
communism. Finally Austria is another important case, after an intense growth in the
fifties and sixties, its demand was stable around 30 litres per capita, earlier than in the
rest of countries of this area, at the beginning of the seventies19.
Figure 4 Evolution of the consumption of wine in Central Europe (litres per capita), 1955-2003
0
10
20
30
40
50
60
1955
1957
1959
1961
1963
1965
1967
1969
1971
1973
1975
1977
1979
1981
1983
1985
1987
1989
1991
1993
1995
1997
1999
2001
2003
Germany Switzerland Austria Hungary Belgium
Source: OECD, Food Consumption Statistics. (1955-1984); OIV (1985-2003). Own elaboration
In short, Central Europe is an area with a traditional and high consumption but
without intense growth. This area did not set off the fall of the Mediterranean region, so
stabilizing the level in the seventies and eighties. These countries could be described as
a “transition area”, because the consumption is not as high as in the Mediterranean, but
is not as low as in the north of Europe either. And this is in spite of the strong tradition
in the consumption of beer.
There are various reasons for the high demand of wine. For example there is a
strong presence of Latin people in Switzerland and Belgium. Moreover Germany,
Austria and Hungary are traditional producers, a fact which explains the high level of
intake. At this moment, in the Nordic countries wine consumption is increasing a lot, in
a similar process to Central Europe in the seventies and eighties.
19 OECD, Food Consumption Statistics; Statistics OIV.
10
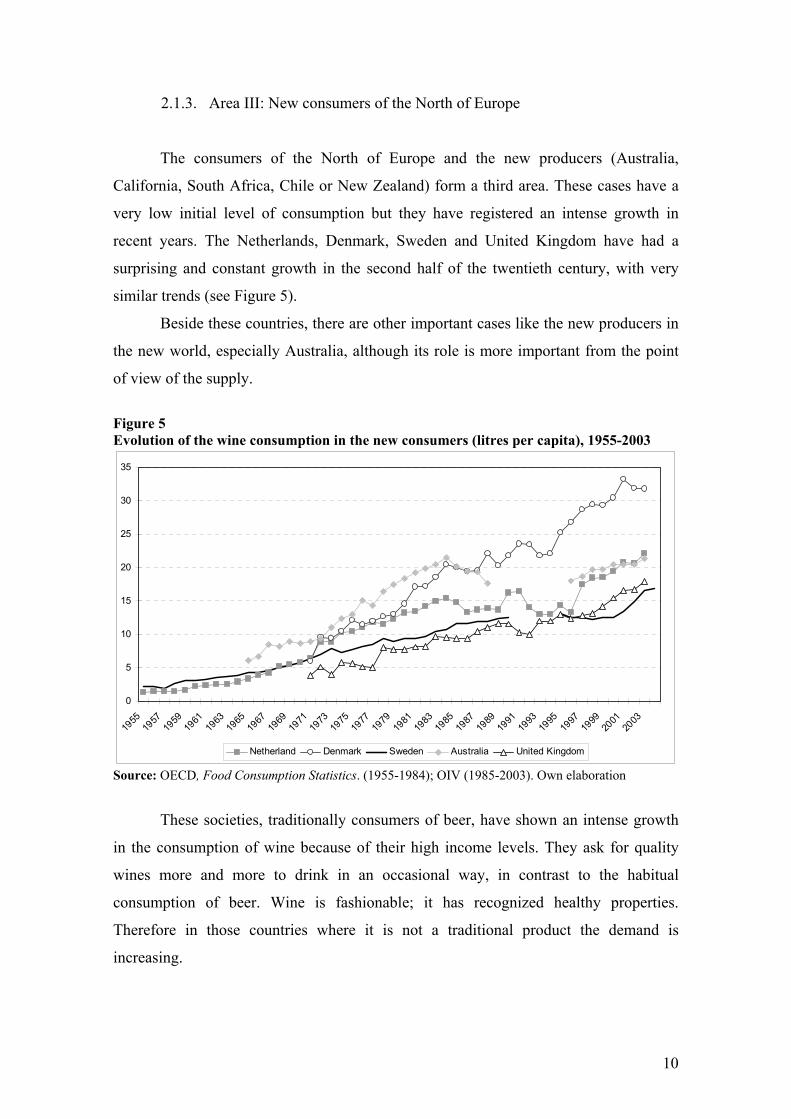
2.1.3. Area III: New consumers of the North of Europe
The consumers of the North of Europe and the new producers (Australia,
California, South Africa, Chile or New Zealand) form a third area. These cases have a
very low initial level of consumption but they have registered an intense growth in
recent years. The Netherlands, Denmark, Sweden and United Kingdom have had a
surprising and constant growth in the second half of the twentieth century, with very
similar trends (see Figure 5).
Beside these countries, there are other important cases like the new producers in
the new world, especially Australia, although its role is more important from the point
of view of the supply.
Figure 5 Evolution of the wine consumption in the new consumers (litres per capita), 1955-2003
0
5
10
15
20
25
30
35
1955
1957
1959
1961
1963
1965
1967
1969
1971
1973
1975
1977
1979
1981
1983
1985
1987
1989
1991
1993
1995
1997
1999
2001
2003
Netherland Denmark Sweden Australia United Kingdom
Source: OECD, Food Consumption Statistics. (1955-1984); OIV (1985-2003). Own elaboration
These societies, traditionally consumers of beer, have shown an intense growth
in the consumption of wine because of their high income levels. They ask for quality
wines more and more to drink in an occasional way, in contrast to the habitual
consumption of beer. Wine is fashionable; it has recognized healthy properties.
Therefore in those countries where it is not a traditional product the demand is
increasing.
11
Moreover, today wine is an ever more common product in this area, which
explains the rise in demand. It is no longer a beverage reserved to the higher social
class20.
2.1.4. Other cases
Apart from the countries include in the three areas designed, there are other
specific and important cases. For example, the United States, with a very small per
capita consumption (8.1 litres in 2003) and with a stable or even decreasing trend in
recent years, but the size of its market is extraordinary, so this country has an enormous
potential and it will be an important case in the future. In 2003, the United States
consumed 10 per cent of the total world consumption of wine, being the third country
after France and Italy21.
Something very similar is taking place in the Asian countries, especially China
and Japan, with very low demand levels, but in continuous economic growth, a higher
income level and the extraordinary size of their markets. It is an area with an important
future in wine consumption22.
As regards the new producers, there are several situations. For example,
Australia has an important growth in the demand levels. But in other cases like South
Africa the trend is different, with an initial consumption of around 10 litres per capita in
the mid-eighties, and currently this level has fallen to around 7 litres per capita litres.
Chile has a similar decreasing evolution, from 18 litres per capita in 1995 to 16 in
200323.
Another specific and outstanding case is Rumania, with an extraordinary growth
from 10 litres per capita in the mid-eighties to 22 in 2003. However, Canada is among
the countries with a clearly static intake, between 7 and 10 litres per capita litres over
the last 20 years. Demand levels in the Soviet Union have also decreased after the fall of
communist regime24.
20 Pinilla and Ayuda (2002). 21 Statistics OIV. 22 Statistics OIV. 23 Statistics OIV. 24 Statistics OIV.
12
2.2. A traditional consumer country of the Mediterranean: Spain
An exemplary case in the Mediterranean area could be Spain. This country
shows similar trends to the rest of area, although with a lower per capita consumption
than in France, Portugal or Italy. Moreover, the Spanish case is unique due to other
reasons. In the Mediterranean area the fall of wine consumption has been caused,
among other things, by the rise of substitute beverages, like beer, soft drinks, natural
juices or mineral water. But in Spain this has been especially true, with a great increase
in beer consumption in the last century.
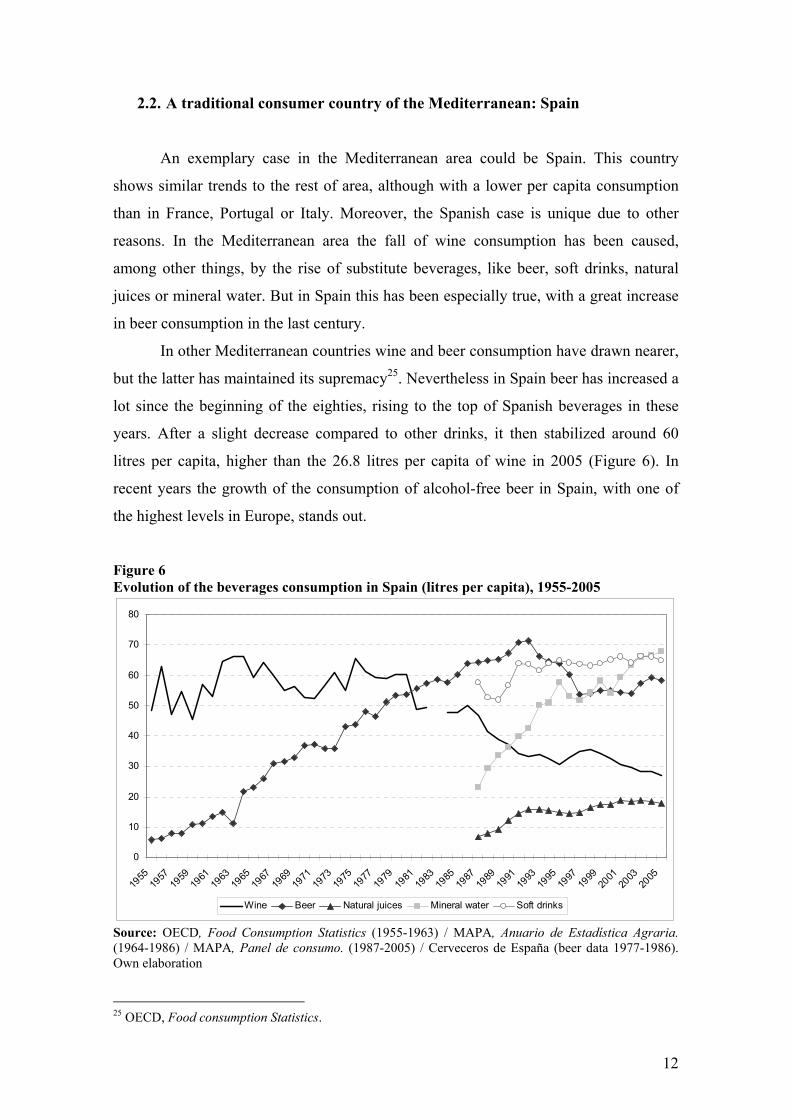
In other Mediterranean countries wine and beer consumption have drawn nearer,
but the latter has maintained its supremacy25. Nevertheless in Spain beer has increased a
lot since the beginning of the eighties, rising to the top of Spanish beverages in these
years. After a slight decrease compared to other drinks, it then stabilized around 60
litres per capita, higher than the 26.8 litres per capita of wine in 2005 (Figure 6). In
recent years the growth of the consumption of alcohol-free beer in Spain, with one of
the highest levels in Europe, stands out.
Figure 6 Evolution of the beverages consumption in Spain (litres per capita), 1955-2005
0
10
20
30
40
50
60
70
80
1955
1957
1959
1961
1963
1965
1967
1969
1971
1973
1975
1977
1979
1981
1983
1985
1987
1989
1991
1993
1995
1997
1999
2001
2003
2005
Wine Beer Natural juices Mineral water Soft drinks
Source: OECD, Food Consumption Statistics (1955-1963) / MAPA, Anuario de Estadística Agraria. (1964-1986) / MAPA, Panel de consumo. (1987-2005) / Cerveceros de España (beer data 1977-1986). Own elaboration
25 OECD, Food consumption Statistics.
13
Moreover, other beverages have become wine competitors, beverages which are
much better suited to a young urban demand. For instance, there has been an
outstandingly intense growth of natural juices or soft drinks, with the latter enjoying a
higher consumption than wine. Mineral water has increased from 20 litres per capita in
1987 to almost 70 in 2005, and today it is the main drink consumed in Spain26.
This extraordinary change in the preferences and habits of the Spanish consumer
is motivated, as in other Mediterranean countries, by the modernization of the society,
but there are other reasons too. For instance there is the climate, especially in the south
of Iberian Peninsula, where the high temperatures favour more refreshing drinks like
beer or soft drinks27. Moreover, these beverages have less alcohol or are non-alcoholic,
and are supported by intense advertising and marketing investments by big
multinationals, while the Spanish wine sector is fragmented and has an insufficient
commercial capacity28. Another reason is the advertising campaigns of the government
against the consumption of alcoholic beverages29.
A more detailed analysis of the wine demand structure help us to understand the
intense fall of this beverage in the last third of the twentieth century and the new habits
of the Spanish population. If we analyze the consumption by product type (table wine or
appellation contrôlée), we can see significant changes, with a favourable trend towards
quality wines. In 1987 the 78 per cent of wine consumed in Spain was table wine, and
the 14 per cent was AC, while in 2005 the former had decreased to 60 per cent and the
latter had grown to 33 per cent. So the fall in the consumption of wine was caused
mainly by the decrease in the demand for table wine from 36.4 to 16.1 litres per capita
in the period 1987-2005, while the quality wines show a total growth of 39.7 per cent,
from the 6.3 to 8.8 litres per capita for the same years30.
We should also see the evolution in the places where the wine is consumed. In
1987, 57.8 per cent of wine consumed was household consumption and 42.2 per cent
was in restaurants. While in 2005, 41.2 per cent was household consumption (a decrease
of around 54.9 per cent). This shows that the global trend of consumption has gone
mainly toward restaurants, with 70.3 per cent of quality wine consumption. Although
the domestic demand for quality wine is growing too.
26 MAPA, Panel del Consumo. 27 Pradas Regel (1994); Sainz (1997); Resa (2002). 28 Millán and Yagüe (1997); Rodríguez and Villarejo (1997-98). 29 Millán and Yagüe (1997). 30 MAPA, Panel de consumo.
14
In general, the Spanish population drinks less wine than their parents, and much
less than their grandparents. In recent market studies by the Spanish Federation of Wine
(FEV), we can see that just 8 per cent of the respondents younger than 24 years drink
wine. Young Spaniards think that this beverage is not modern, and is only for experts,
so it is less attractive than other products, and its consumption is something unusual31.
Moreover, we should bear in mind the dietary changes and the abandonment of
the more traditional Mediterranean diet in Spain, after three decades in which fast food
has grown a lot32. Wine forms part of that diet, as envisaged by Spanish law (Ley de la
Viña y el Vino, 2003), and by the experts, which also explains this fall33.
In short, the second half of the twentieth century saw new wine consumption
models taking shape inside new global food trends, so increasing the consumption of
food eaten outside the home and the preference for products of quality, so decreasing
the generic products. Consumption has shifted to quality, healthy and natural products34.
These changes have affected the wine consumption and they correspond to a global
context in the general food demand.
3. New trends in the wine consumption and the impact on Spanish wineries
3.1. Changes in the production process at the crossroads of quality
3.1.1. The problem of grape quality
One reason behind the creation of the wine cooperatives in Spain, according to
the historiography, was that the vine grower gained access to the modern technology in
big industrial wineries. This meant an improved production process and the economies
of scale, a bigger added value for the final product and higher grape prices. Before, the
vine grower sold the raw material on the markets, obtaining much lower prices than
would a finished product, or they made wine in small individual wineries, in inadequate
conditions. Therefore the wine was neither quality nor homogeneous.
31 Martín (2006). 32 Rodríguez Artalejo, Banegas, Graciano, Hernández and Rey (1996). 33 Moreno Ortigosa (2000) 34 Mili (2005).
15
In other words, the cooperatives meant a real industrialization of the wine sector
in Spain, according to Juan Pan-Montojo35. This fact led in the fifties, sixties and
seventies to an increase in cooperative members, who deposited their grapes, so
increasing wine production and enabling it to be sold in the markets without problems.
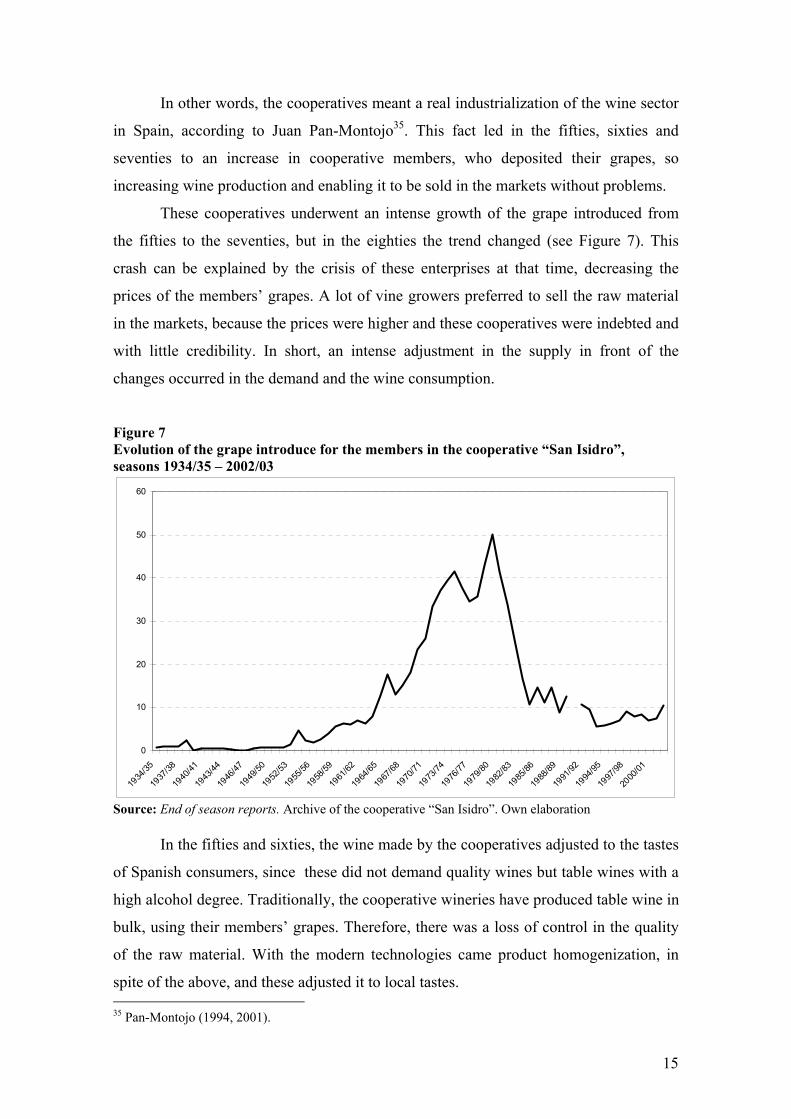
These cooperatives underwent an intense growth of the grape introduced from
the fifties to the seventies, but in the eighties the trend changed (see Figure 7). This
crash can be explained by the crisis of these enterprises at that time, decreasing the
prices of the members’ grapes. A lot of vine growers preferred to sell the raw material
in the markets, because the prices were higher and these cooperatives were indebted and
with little credibility. In short, an intense adjustment in the supply in front of the
changes occurred in the demand and the wine consumption.
Figure 7 Evolution of the grape introduce for the members in the cooperative “San Isidro”, seasons 1934/35 – 2002/03
0
10
20
30
40
50
60
1934
/35
1937
/38
1940
/41
1943
/44
1946
/47
1949
/50
1952
/53
1955
/56
1958
/59
1961
/62
1964
/65
1967
/68
1970
/71
1973
/74
1976
/77
1979
/80
1982
/83
1985
/86
1988
/89
1991
/92
1994
/95
1997
/98
2000
/01
Source: End of season reports. Archive of the cooperative “San Isidro”. Own elaboration
In the fifties and sixties, the wine made by the cooperatives adjusted to the tastes
of Spanish consumers, since these did not demand quality wines but table wines with a
high alcohol degree. Traditionally, the cooperative wineries have produced table wine in
bulk, using their members’ grapes. Therefore, there was a loss of control in the quality
of the raw material. With the modern technologies came product homogenization, in
spite of the above, and these adjusted it to local tastes. 35 Pan-Montojo (1994, 2001).
16
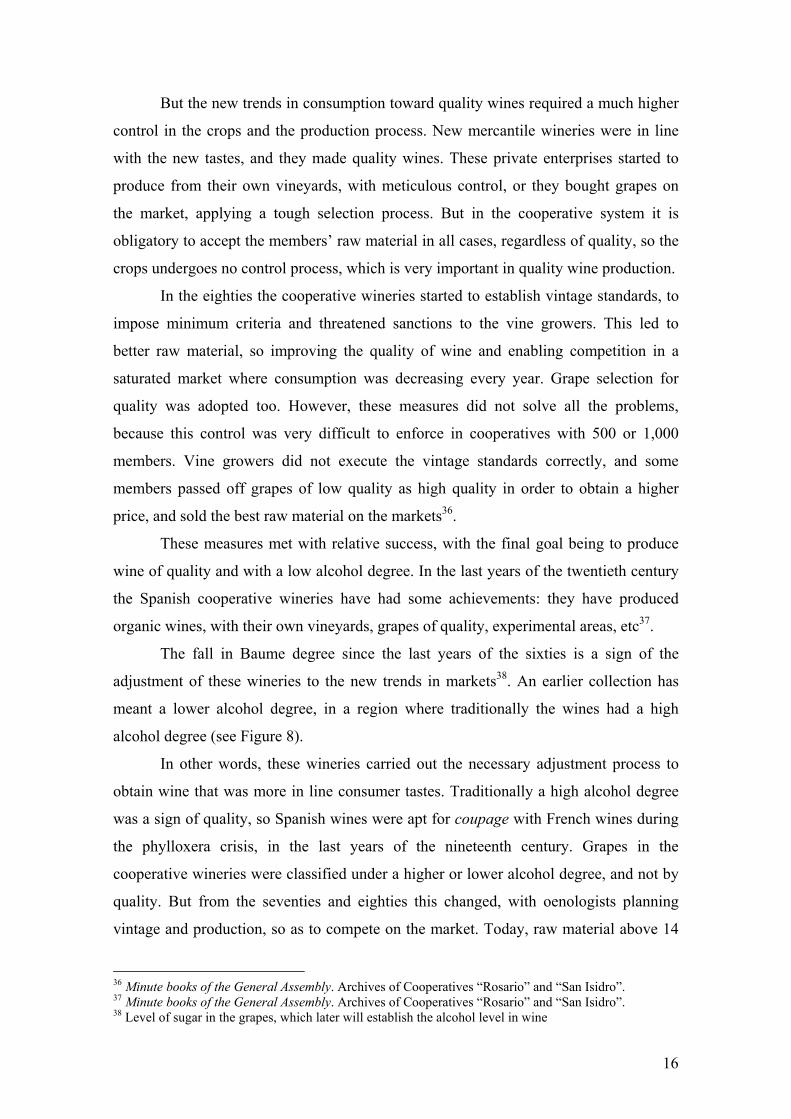
But the new trends in consumption toward quality wines required a much higher
control in the crops and the production process. New mercantile wineries were in line
with the new tastes, and they made quality wines. These private enterprises started to
produce from their own vineyards, with meticulous control, or they bought grapes on
the market, applying a tough selection process. But in the cooperative system it is
obligatory to accept the members’ raw material in all cases, regardless of quality, so the
crops undergoes no control process, which is very important in quality wine production.
In the eighties the cooperative wineries started to establish vintage standards, to
impose minimum criteria and threatened sanctions to the vine growers. This led to
better raw material, so improving the quality of wine and enabling competition in a
saturated market where consumption was decreasing every year. Grape selection for
quality was adopted too. However, these measures did not solve all the problems,
because this control was very difficult to enforce in cooperatives with 500 or 1,000
members. Vine growers did not execute the vintage standards correctly, and some
members passed off grapes of low quality as high quality in order to obtain a higher
price, and sold the best raw material on the markets36.
These measures met with relative success, with the final goal being to produce
wine of quality and with a low alcohol degree. In the last years of the twentieth century
the Spanish cooperative wineries have had some achievements: they have produced
organic wines, with their own vineyards, grapes of quality, experimental areas, etc37.
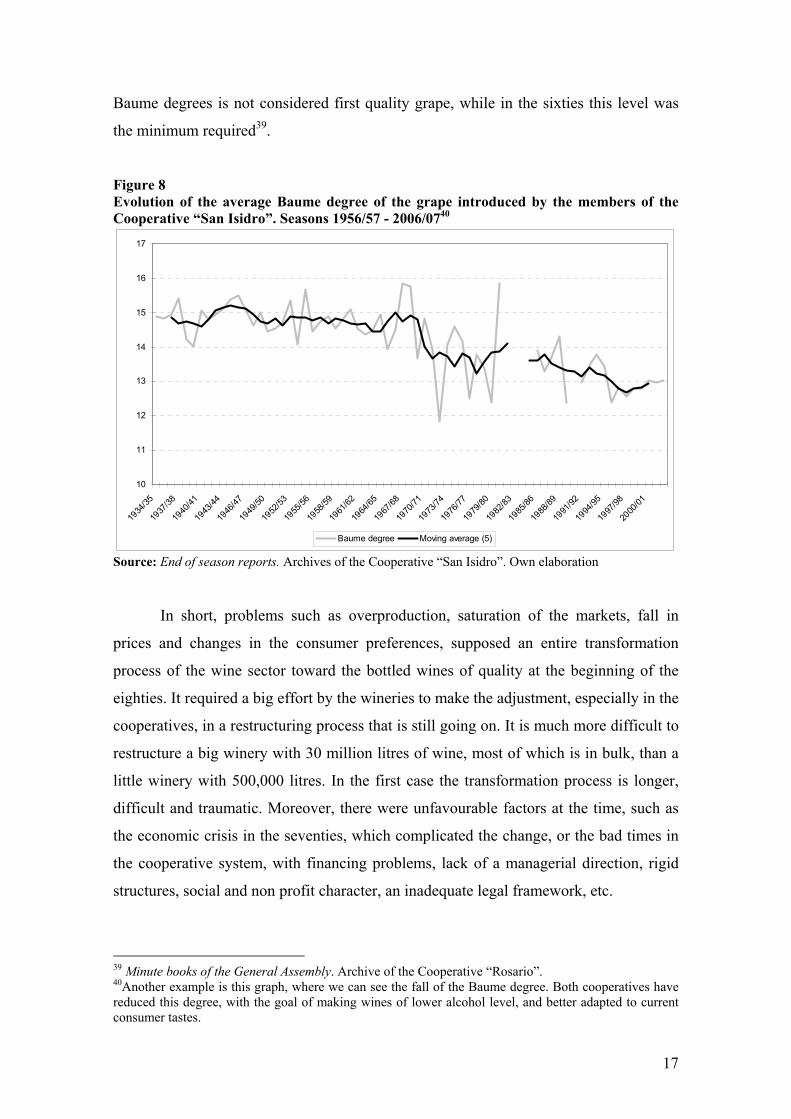
The fall in Baume degree since the last years of the sixties is a sign of the
adjustment of these wineries to the new trends in markets38. An earlier collection has
meant a lower alcohol degree, in a region where traditionally the wines had a high
alcohol degree (see Figure 8).
In other words, these wineries carried out the necessary adjustment process to
obtain wine that was more in line consumer tastes. Traditionally a high alcohol degree
was a sign of quality, so Spanish wines were apt for coupage with French wines during
the phylloxera crisis, in the last years of the nineteenth century. Grapes in the
cooperative wineries were classified under a higher or lower alcohol degree, and not by
quality. But from the seventies and eighties this changed, with oenologists planning
vintage and production, so as to compete on the market. Today, raw material above 14
36 Minute books of the General Assembly. Archives of Cooperatives “Rosario” and “San Isidro”. 37 Minute books of the General Assembly. Archives of Cooperatives “Rosario” and “San Isidro”. 38 Level of sugar in the grapes, which later will establish the alcohol level in wine
17
Baume degrees is not considered first quality grape, while in the sixties this level was
the minimum required39.
Figure 8 Evolution of the average Baume degree of the grape introduced by the members of the Cooperative “San Isidro”. Seasons 1956/57 - 2006/0740
10
11
12
13
14
15
16
17
1934
/35
1937
/38
1940
/41
1943
/44
1946
/47
1949
/50
1952
/53
1955
/56
1958
/59
1961
/62
1964
/65
1967
/68
1970
/71
1973
/74
1976
/77
1979
/80
1982
/83
1985
/86
1988
/89
1991
/92
1994
/95
1997
/98
2000
/01
Baume degree Moving average (5)
Source: End of season reports. Archives of the Cooperative “San Isidro”. Own elaboration
In short, problems such as overproduction, saturation of the markets, fall in
prices and changes in the consumer preferences, supposed an entire transformation
process of the wine sector toward the bottled wines of quality at the beginning of the
eighties. It required a big effort by the wineries to make the adjustment, especially in the
cooperatives, in a restructuring process that is still going on. It is much more difficult to
restructure a big winery with 30 million litres of wine, most of which is in bulk, than a
little winery with 500,000 litres. In the first case the transformation process is longer,
difficult and traumatic. Moreover, there were unfavourable factors at the time, such as
the economic crisis in the seventies, which complicated the change, or the bad times in
the cooperative system, with financing problems, lack of a managerial direction, rigid
structures, social and non profit character, an inadequate legal framework, etc.
39 Minute books of the General Assembly. Archive of the Cooperative “Rosario”. 40Another example is this graph, where we can see the fall of the Baume degree. Both cooperatives have reduced this degree, with the goal of making wines of lower alcohol level, and better adapted to current consumer tastes.
18
3.1.2. Technological modernization
At the same time, due to all these changes in the eighties, the production
technology of the cooperative wineries was becoming obsolete. In those years a new
system in the productive process spread through all the wine countries, therefore
Spanish cooperative wineries had to introduce that technology, despite the serious
difficulties. It was the cold technology in stainless steel tanks in the fermentation
process.
In the nineties these factories started investment plans to introduce the new
technology, human resources and structural changes, to produce wines of quality and to
compete in the Spanish and world markets. The Cooperative “San Isidro” made an
enormous investment from 1975, planning the improvement of the reception, crushed
and drained system, the expansion and renovation of the bottling plant, and the adoption
of new systems of elaboration, such as thermovinification or the use of cold
temperature.
The first consisted of heating the product though immersion, and meant a bigger
stability and uniformity in the wines41. The second allowed control in the fermentation
processes though the use of cold, so controlling the term of this wine process and the
alcohol degree. In this way the wine was adjusted to the new trends in consumption42.
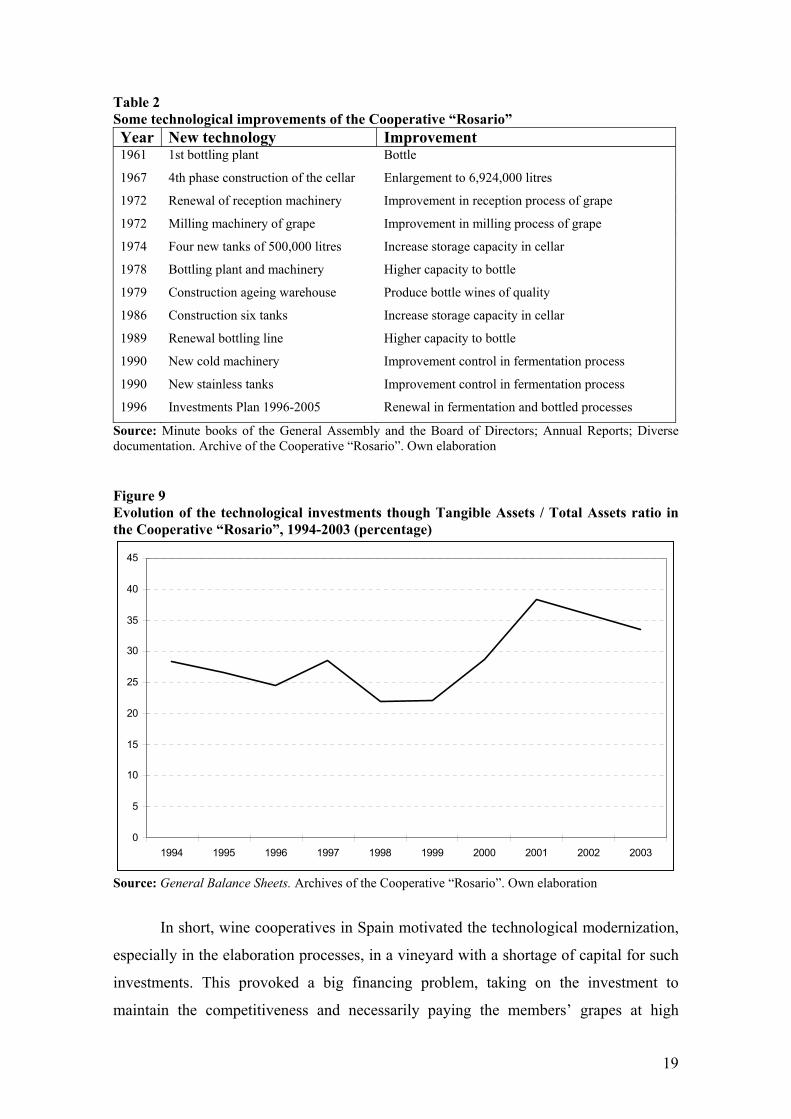
The Cooperative “Rosario” was less innovative from a technological point of
view. In the last years of the twentieth century this winery carried out an intense
technological renovation, with the complete renovation of the bottling line and the
improvement of the fermentation43 (see Table 2 and Figure 9).
41 It was a very common system in the producer countries, with industrial application from 1965. 42 Minute books of the General Assembly and the Board of Directors; Annual Reports; Diverse documentation. Archives of the Cooperative “Rosario”. 43 Minute books of the General Assembly and the Board of Directors; Annual Reports; Diverse documentation. Archives of the Cooperative “Rosario”.
19
Table 2 Some technological improvements of the Cooperative “Rosario” Year New technology Improvement 1961 1st bottling plant Bottle
1967 4th phase construction of the cellar Enlargement to 6,924,000 litres
1972 Renewal of reception machinery Improvement in reception process of grape
1972 Milling machinery of grape Improvement in milling process of grape
1974 Four new tanks of 500,000 litres Increase storage capacity in cellar
1978 Bottling plant and machinery Higher capacity to bottle
1979 Construction ageing warehouse Produce bottle wines of quality
1986 Construction six tanks Increase storage capacity in cellar
1989 Renewal bottling line Higher capacity to bottle
1990 New cold machinery Improvement control in fermentation process
1990 New stainless tanks Improvement control in fermentation process
1996 Investments Plan 1996-2005 Renewal in fermentation and bottled processes
Source: Minute books of the General Assembly and the Board of Directors; Annual Reports; Diverse documentation. Archive of the Cooperative “Rosario”. Own elaboration Figure 9 Evolution of the technological investments though Tangible Assets / Total Assets ratio in the Cooperative “Rosario”, 1994-2003 (percentage)
0
5
10
15
20
25
30
35
40
45
1994 1995 1996 1997 1998 1999 2000 2001 2002 2003
Source: General Balance Sheets. Archives of the Cooperative “Rosario”. Own elaboration
In short, wine cooperatives in Spain motivated the technological modernization,
especially in the elaboration processes, in a vineyard with a shortage of capital for such
investments. This provoked a big financing problem, taking on the investment to
maintain the competitiveness and necessarily paying the members’ grapes at high
20
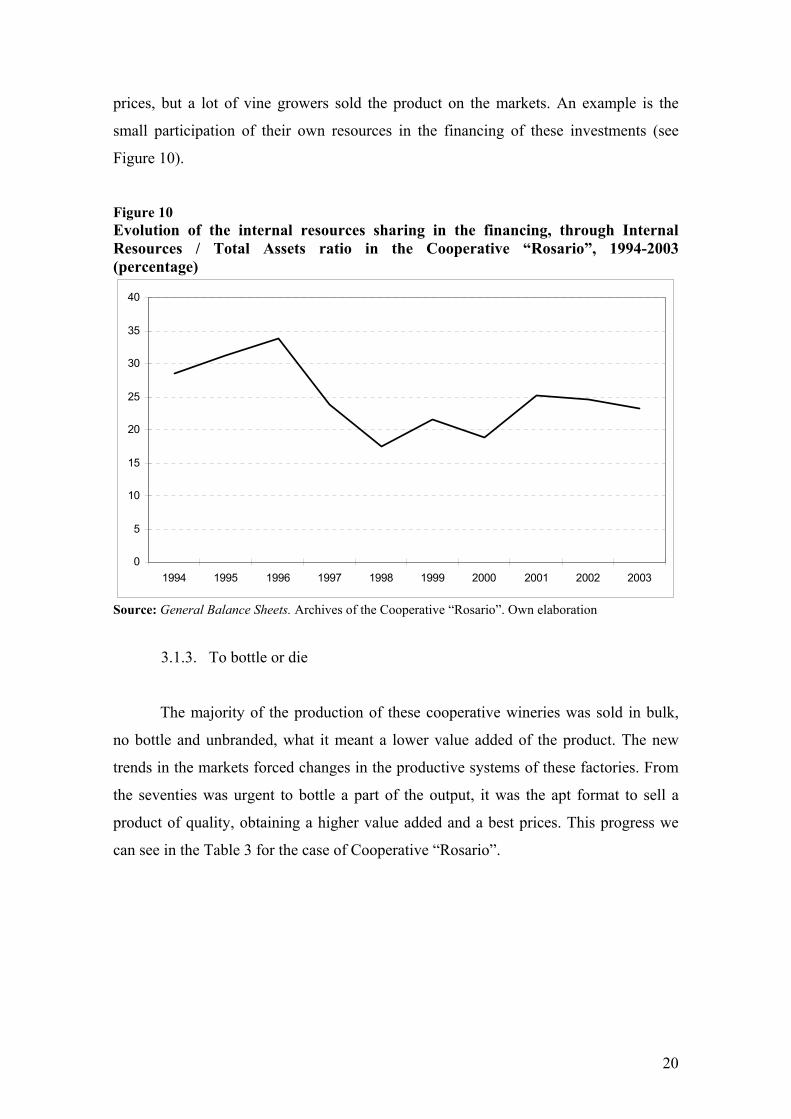
prices, but a lot of vine growers sold the product on the markets. An example is the
small participation of their own resources in the financing of these investments (see
Figure 10).
Figure 10 Evolution of the internal resources sharing in the financing, through Internal Resources / Total Assets ratio in the Cooperative “Rosario”, 1994-2003 (percentage)
0
5
10
15
20
25
30
35
40
1994 1995 1996 1997 1998 1999 2000 2001 2002 2003
Source: General Balance Sheets. Archives of the Cooperative “Rosario”. Own elaboration
3.1.3. To bottle or die
The majority of the production of these cooperative wineries was sold in bulk,
no bottle and unbranded, what it meant a lower value added of the product. The new
trends in the markets forced changes in the productive systems of these factories. From
the seventies was urgent to bottle a part of the output, it was the apt format to sell a
product of quality, obtaining a higher value added and a best prices. This progress we
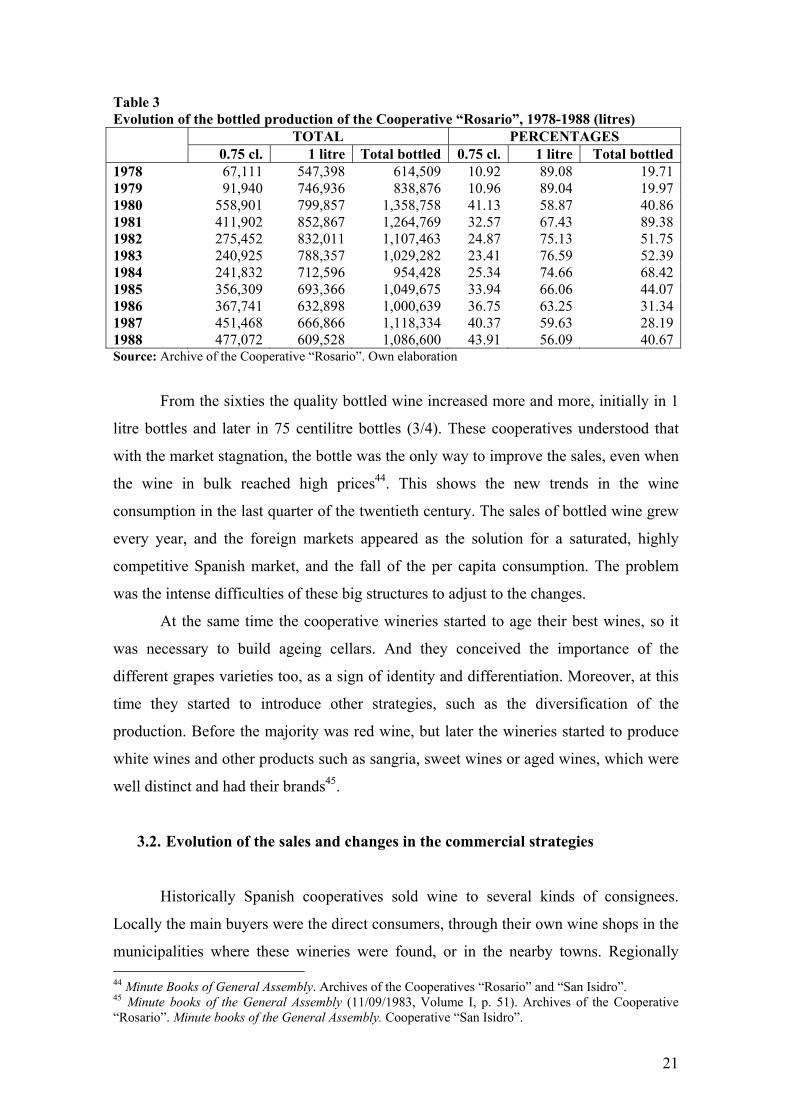
can see in the Table 3 for the case of Cooperative “Rosario”.
21
Table 3 Evolution of the bottled production of the Cooperative “Rosario”, 1978-1988 (litres)
TOTAL PERCENTAGES 0.75 cl. 1 litre Total bottled 0.75 cl. 1 litre Total bottled
1978 67,111 547,398 614,509 10.92 89.08 19.711979 91,940 746,936 838,876 10.96 89.04 19.971980 558,901 799,857 1,358,758 41.13 58.87 40.861981 411,902 852,867 1,264,769 32.57 67.43 89.381982 275,452 832,011 1,107,463 24.87 75.13 51.751983 240,925 788,357 1,029,282 23.41 76.59 52.391984 241,832 712,596 954,428 25.34 74.66 68.421985 356,309 693,366 1,049,675 33.94 66.06 44.071986 367,741 632,898 1,000,639 36.75 63.25 31.341987 451,468 666,866 1,118,334 40.37 59.63 28.191988 477,072 609,528 1,086,600 43.91 56.09 40.67Source: Archive of the Cooperative “Rosario”. Own elaboration
From the sixties the quality bottled wine increased more and more, initially in 1
litre bottles and later in 75 centilitre bottles (3/4). These cooperatives understood that
with the market stagnation, the bottle was the only way to improve the sales, even when
the wine in bulk reached high prices44. This shows the new trends in the wine
consumption in the last quarter of the twentieth century. The sales of bottled wine grew
every year, and the foreign markets appeared as the solution for a saturated, highly
competitive Spanish market, and the fall of the per capita consumption. The problem
was the intense difficulties of these big structures to adjust to the changes.
At the same time the cooperative wineries started to age their best wines, so it
was necessary to build ageing cellars. And they conceived the importance of the
different grapes varieties too, as a sign of identity and differentiation. Moreover, at this
time they started to introduce other strategies, such as the diversification of the
production. Before the majority was red wine, but later the wineries started to produce
white wines and other products such as sangria, sweet wines or aged wines, which were
well distinct and had their brands45.
3.2. Evolution of the sales and changes in the commercial strategies
Historically Spanish cooperatives sold wine to several kinds of consignees.
Locally the main buyers were the direct consumers, through their own wine shops in the
municipalities where these wineries were found, or in the nearby towns. Regionally 44 Minute Books of General Assembly. Archives of the Cooperatives “Rosario” and “San Isidro”. 45 Minute books of the General Assembly (11/09/1983, Volume I, p. 51). Archives of the Cooperative “Rosario”. Minute books of the General Assembly. Cooperative “San Isidro”.
22
distribution contracts were established with retailers, and nationwide though specific
sales contracts with bottling factories or dealer enterprises, but without continuity. Only
in the eighties did some cooperative wineries create their own system of nationwide
distribution, with the consignees being direct trading companies and consumers.
Cooperative wineries were the main producers in their regions, and they
controlled the majority of the grape and the wine produced. Therefore these enterprises
maintained prices in crisis times and saturated local and regional markets, which they
controlled perfectly, but not national and international markets.
It was a quiet situation, so commercial strategies were designed by the members
until a few years ago. In other words, these strategies were not sophisticated, focusing
especially on the fixing and maintenance of the wine at gross prices.
At the end of the seventies and especially in the eighties this changed, and the
cooperative wineries had to modernize their organizational structures. These companies
had to adapt to the changes in the markets, by using new strategies and adopting
professional management to improve sales.
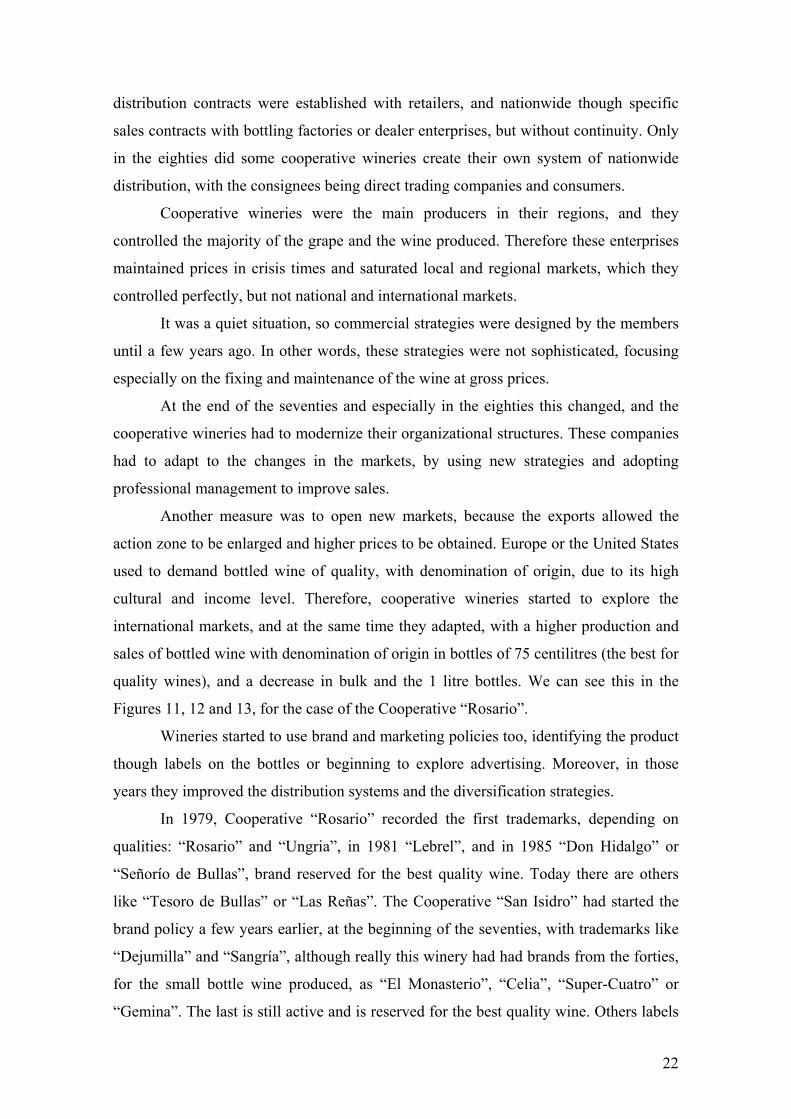
Another measure was to open new markets, because the exports allowed the
action zone to be enlarged and higher prices to be obtained. Europe or the United States
used to demand bottled wine of quality, with denomination of origin, due to its high
cultural and income level. Therefore, cooperative wineries started to explore the
international markets, and at the same time they adapted, with a higher production and
sales of bottled wine with denomination of origin in bottles of 75 centilitres (the best for
quality wines), and a decrease in bulk and the 1 litre bottles. We can see this in the
Figures 11, 12 and 13, for the case of the Cooperative “Rosario”.
Wineries started to use brand and marketing policies too, identifying the product
though labels on the bottles or beginning to explore advertising. Moreover, in those
years they improved the distribution systems and the diversification strategies.
In 1979, Cooperative “Rosario” recorded the first trademarks, depending on
qualities: “Rosario” and “Ungria”, in 1981 “Lebrel”, and in 1985 “Don Hidalgo” or
“Señorío de Bullas”, brand reserved for the best quality wine. Today there are others
like “Tesoro de Bullas” or “Las Reñas”. The Cooperative “San Isidro” had started the
brand policy a few years earlier, at the beginning of the seventies, with trademarks like
“Dejumilla” and “Sangría”, although really this winery had had brands from the forties,
for the small bottle wine produced, as “El Monasterio”, “Celia”, “Super-Cuatro” or
“Gemina”. The last is still active and is reserved for the best quality wine. Others labels
23
have been “Rumor”, “Cañalizo” and “San Isidro”. Today there are others like “Genus”
or “Sabatacha”, etc.
These trademarks are accompanied by graphic pictures, characterizing the kind
of wine and identifying the denomination of origin, quality, variety of grape, ageing,
season, etc.
As regards marketing strategies and advertisement, the cooperative wineries did
not need these measures until the seventies, when they started to participate in regional,
national and international festivals and trade fairs. Later they contracted advertisements
in regional or national press and radio. Moreover, they started to make business trips for
the direct promotion of the product, even worldwide46. In the nineties these wineries
carried out more modern strategies, such as direct promotion in shopping centres.
Figure 11 Evolution of the percentage distribution of total sales in the Cooperative “Rosario”, by destination, 2002-2006 (percentage)
0
10
20
30
40
50
60
70
80
90
100
2002 2003 2004 2005 2006
Domestic sales Exports
Source: Annual sales extracts. Archive of the Cooperative “Rosario”. Own elaboration
46 In 1975, the Cooperative “San Isidro” initiated a series of business trips to promote its product in countries like Russia, Czechoslovakia, Poland, Germany, Switzerland or France. Annual Report 1975, Archives of the Cooperative “San Isidro”.
24
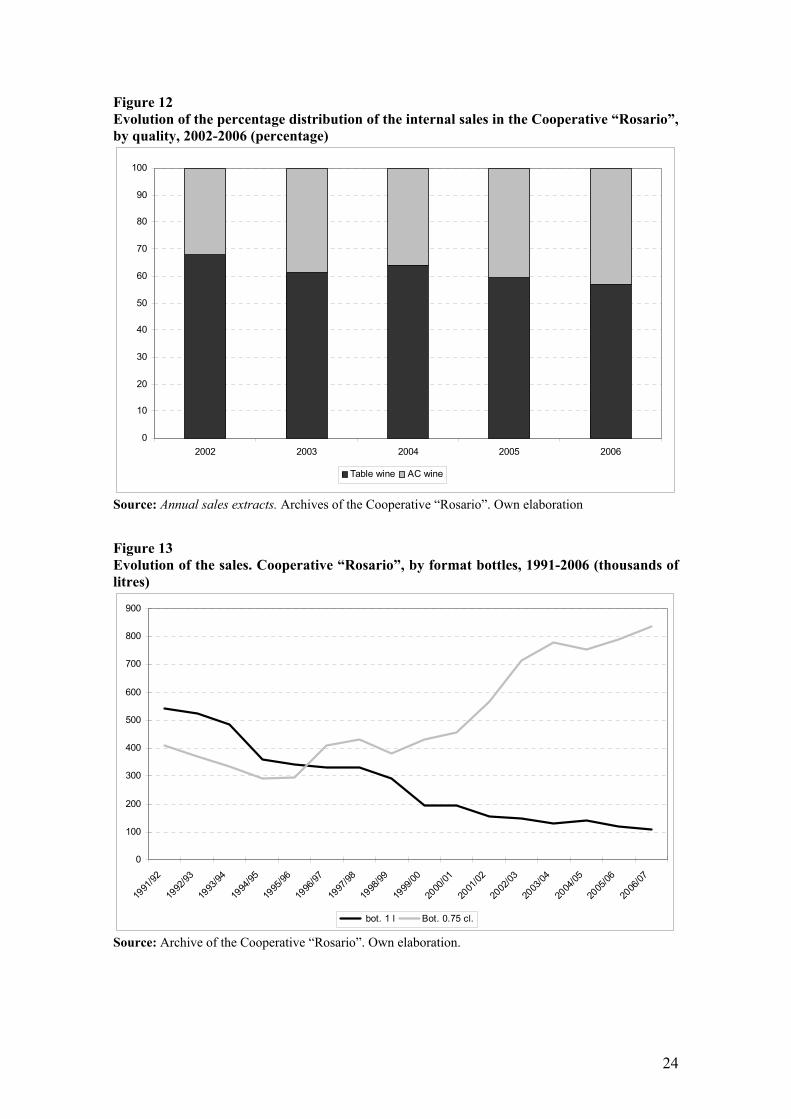
Figure 12 Evolution of the percentage distribution of the internal sales in the Cooperative “Rosario”, by quality, 2002-2006 (percentage)
0
10
20
30
40
50
60
70
80
90
100
2002 2003 2004 2005 2006
Table wine AC wine
Source: Annual sales extracts. Archives of the Cooperative “Rosario”. Own elaboration
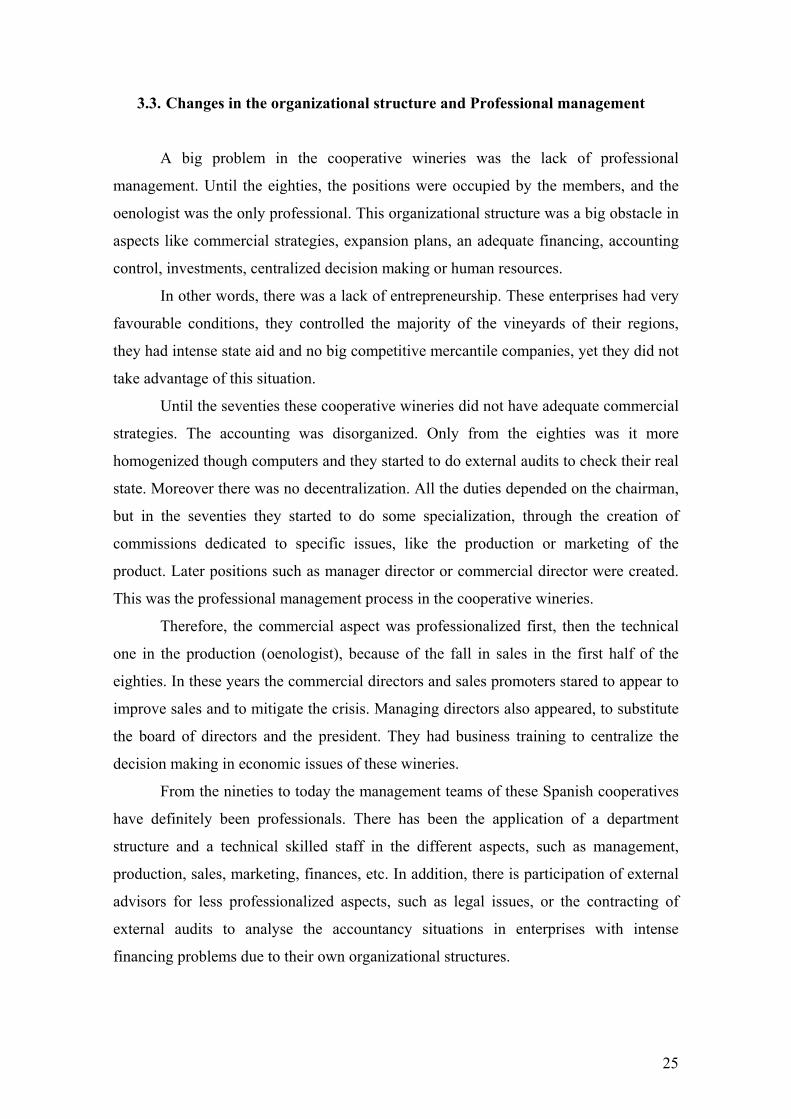
Figure 13 Evolution of the sales. Cooperative “Rosario”, by format bottles, 1991-2006 (thousands of litres)
0
100
200
300
400
500
600
700
800
900
1991
/92
1992
/93
1993
/94
1994
/95
1995
/96
1996
/97
1997
/98
1998
/99
1999
/00
2000
/01
2001
/02
2002
/03
2003
/04
2004
/05
2005
/06
2006
/07
bot. 1 l Bot. 0.75 cl.
Source: Archive of the Cooperative “Rosario”. Own elaboration.
25
3.3. Changes in the organizational structure and Professional management
A big problem in the cooperative wineries was the lack of professional
management. Until the eighties, the positions were occupied by the members, and the
oenologist was the only professional. This organizational structure was a big obstacle in
aspects like commercial strategies, expansion plans, an adequate financing, accounting
control, investments, centralized decision making or human resources.
In other words, there was a lack of entrepreneurship. These enterprises had very
favourable conditions, they controlled the majority of the vineyards of their regions,
they had intense state aid and no big competitive mercantile companies, yet they did not
take advantage of this situation.
Until the seventies these cooperative wineries did not have adequate commercial
strategies. The accounting was disorganized. Only from the eighties was it more
homogenized though computers and they started to do external audits to check their real
state. Moreover there was no decentralization. All the duties depended on the chairman,
but in the seventies they started to do some specialization, through the creation of
commissions dedicated to specific issues, like the production or marketing of the
product. Later positions such as manager director or commercial director were created.
This was the professional management process in the cooperative wineries.
Therefore, the commercial aspect was professionalized first, then the technical
one in the production (oenologist), because of the fall in sales in the first half of the
eighties. In these years the commercial directors and sales promoters stared to appear to
improve sales and to mitigate the crisis. Managing directors also appeared, to substitute
the board of directors and the president. They had business training to centralize the
decision making in economic issues of these wineries.
From the nineties to today the management teams of these Spanish cooperatives
have definitely been professionals. There has been the application of a department
structure and a technical skilled staff in the different aspects, such as management,
production, sales, marketing, finances, etc. In addition, there is participation of external
advisors for less professionalized aspects, such as legal issues, or the contracting of
external audits to analyse the accountancy situations in enterprises with intense
financing problems due to their own organizational structures.
26
Conclusions
A serial of intense transformations has taken place in the wine sector worldwide
in the second half of the twentieth century, both in the productive aspect and in the
demand. During this period, wine consumption has fallen constantly and the habits and
preferences of the consumer have changed, with an intense restructuring process in the
productive sector provoked by these new trends. Hence, the wineries had to start a
necessary adjustment.
In this study, we have tried to offer a detailed analysis of the reasons for these
changes in the demand patterns. We have seen that the fall in wine consumption in the
world is due to the decrease in the countries of the main consumer and producer area -
Mediterranean Europe. Traditionally in these societies the consumers drank wine daily
as an essential part of their diet. But due to the modernization and industrialization of
these countries, the new consumers drink wine only occasionally and demand a quality
product which is well presented and identified by Appellation Contrôlée.
At the same time, in other regions of the world where this product was not so
common, wine intake has grown a lot, as in the North of Europe or the new producers
outside Europe. But this growth has not been sufficient to compensate the decrease in
consumption of the Mediterranean region. In other words, a process of convergence has
taken place in the consumption patterns between new and old consumer countries, with
a homogenization of the demand based on bottled wine of quality, which is natural, of
low gradation and of good appearance.
A good example of these new trends is Spain, traditionally a consumer and
producer of wine where the fall of the consumption has been constant in the second half
of the twentieth century, due to the intense growth of new substitute beverages, in line
with the changes in the food habits of the Spanish population.
This overview has focused mainly on the wine sector, with the decrease in
vineyards and the higher production of wine with denomination of origin. But it has
especially been concerned with the restructuring process of the business, in a country
where today 70 per cent of the total output is made by cooperative wineries, with big
factories being set up under the Franco dictatorship as a development model in
depressed areas. Traditionally these enterprises made a product which adjusted to the
old consumption trends, so from the seventies it had to start a traumatic restructuring
process to adjust its product to the new patterns of demand.
27
The cooperative wineries had to bring in greater control of the productive
processes, checking for the best quality of the grapes, a decrease of the alcohol degree
and a technological modernization, with the application of cold processes and the
installation of bottling plants, along with wider diversification of the product and a
better appearance of the wine too.
At the same time, due to the fall in consumption and the new habits of demand,
the cooperative wineries started to incorporate professional management in order to use
commercial brands and marketing policies, to maintain the sales in times of change in
the wine sector with a product of quality that is well differentiated by its denomination
of origin. These business had to begin huge investment plans to carry out these changes,
and they entered a strong crisis due to their traditional large financing problems.
In short, a new trend in the consumptions models has provoked an intense and
traumatic restructuring process in the wine sector and its business, so that it can adjust
to these transformations.
References
ANDERSON, K. (2004): The World’s Wine Markets. Globalization at Work. Cheltenham (UK) – Northampton (USA): Edward Elgar.
BARDAJÍ AZCÁRATE, I. (1992): “El consumo de vino”, Revista de Estudios Agro-sociales, nº 162 (October-December), pp. 153-182.
BARDAJÍ AZCÁRATE, I. (2004): “Tendencias en el mercado español de vino”, Distribución y Consumo (November-December), pp. 57-68.
BERNABÉU, R. and OLMEDA, M. (2002): “Factores que condicionan la frecuencia de consumo de vino”, Distribución y consumo, nº 57 (September-October 2002), pp. 57-61.
DE LA TORRE BORONAT, Mª C. (1997): “Ideas actuales sobre la composición del vino. Situación que apoya la hipótesis <<vino y salud>>”, Distribución y Consumo (February-March), pp. 67-73.
FARRÉ, R. (1994-1995): “El vino como componente de la dieta”, Distribución y Consumo (December-January), pp. 126-127.
GOLAN, A. and SHALIT, H. (1993): “Wine quality differentials in hedonic grape pricing”, Journal of Agricultural Economics, nº 44, pp. 311-321.
LABYS, W. A. (1976): “An international comparison of price and income elasticities for wine consumption”, Australian Journal of Agricultural Economics, nº 20, pp. 33-36.
LE GARS, C. and ROUDIÉ P. (dirs.): Des vignobles et des vins à travers le monde. Bordeaux: Presses Universitaires de Bordeaux.
MANTECA, V. (2003): “El nuevo escenario normativo del sector vitivinícola”, Distribución y Consumo (September-October), pp. 94-105.
28
MARTÍN CERDEÑO, V. J. (2006): “Consumo de vinos. Principales características y distribución comercial”, Distribución y Consumo (January-February), pp. 60-101.
MILI, S. (2005): “Transformaciones del consumo alimentario y su repercusión en el sistema agroalimentario”, Revista de Estudios Agrosociales y Pesqueros, nº 205, pp. 221-247.
MILLÁN CAMPOS, A. and YAGÜE GUILLÉN, Mª J. (1997): “Consumo de vino. Evolución y tendencias”, Distribución y Consumo (February-March), pp. 17-41.
MORENO ORTIGOSA, A. (2000): “Efectos saludables del consumo moderado de vino”, Zubía, nº 12, pp. 59-102.
MORILLA CRITZ, J. (2001): “Cambios en las preferencias de los consumidores de vino y respuestas de los productores en los dos últimos siglos”, in CARMONA, J. Colomé, J. Pan-Montojo and J. Simpson (eds). Viñas, bodegas y mercados. El cambio técnico en la vitivinicultura española, 1850-1936, Zaragoza: Prensas Universitarias de Zaragoza, pp. 13-38.
OECD (1955-1984). Food consumption statistics. Paris. OCZKOWSKI, E. (1994): “A hedonic price function for Australian premium table
wine”, Australian Journal of Agricultural Economics, nº 38-1, pp. 93-110. PAN-MONTOJO, J. (1994): La bodega del mundo. La vid y el vino en España (1800-
1936). Madrid: Alianza Universidad. PAN-MONTOJO, J. (2001): “Las industrias vinícolas españolas: desarrollo y
diversificación productiva entre el siglo XVIII y 1960” in CARMONA, COLOMÉ, PAN-MONTOJO and SIMPSON (eds). Viñas, bodegas y mercados. El cambio técnico en la vitivinicultura española, 1850-1936, Prensas Universitarias de Zaragoza, Zaragoza, 2001, pp. 313-334.
PINILLA NAVARRO, V.; AYUDA BIOSQUE, M. I. and APARICIO, G. (1998): “The international wine market, 1850-1938: an opportunity for export growth in Southern Europe?” XII International Economic History Congress (session C30. Vines and wines: production and consumption since 1850). Madrid.
PINILLA NAVARRO, V. and AYUDA BIOSQUE, M. I. (2002): “Pautas de consumo y comercio internacional de productos agrarios: el caso del vino, 1850-1938”, in J. M. Lana Berasain, (coord.), En torno a la Navarra del siglo XX. Veintiún reflexiones acerca de Sociedad, Economía e Historia, Pamplona: Universidad Pública de Navarra, pp. 61-78.
PINILLA NAVARRO, V. and AYUDA BIOSQUE, M. I. (2005): “El mercado internacional del vino, 1850/1938: ¿un asunto mediterráneo?”, Acts of the III Congreso de Historia Vitivinícola Uruguaya, I Congreso de Historia Vitivinícola Regional, Montevideo, 10-11 November.
PRADAS REGEL, R. (1994): “Cervezas, aguas, zumos y refrescos. El mercado de bebidas se orienta hacia los productos sin alcohol”, Distribución y Consumo (August-September), pp. 108-122.
RENAUD, S. and de LORGERIL, M. (1992): “Wine, alcohol, platelets, and the French Paradox for coronary heart disease”, Lancet, 339, pp. 1523-1526.
RESA, S. (2002): “Aguas envasadas, zumos, refrescos y cervezas: una demanda en crecimiento”, Distribución y consumo, nº 64, pp. 75-85.
RODRÍGUEZ ARTALEJO, J. R.; BANEGAS, M. A.; GRACIANI, R.; HERNÁNDEZ DE VECINO, R. and REY CALERO, J. (1996): “El consumo de alimentos y nutrientes en España en el periodo 1940-1988. Análisis de su consistencia con la dieta mediterránea”, Medicina Clínica, vol. 106 (nº 5), pp. 161-168.
29
RODRÍGUEZ, C. J. and VILLAREJO RAMOS, A. F. (1997-1998): “El comportamiento de los jóvenes frente a los vinos de calidad. Una propuesta para la aplicación de la experimentación comercial”, Distribución y Consumo (December-january), pp. 133-144.
SAINZ, H. (1997): “Aguas, cervezas y refrescos. Un consumo marcado por la estacionalidad y el clima”, Distribución y Consumo (June-July), pp. 57-70.
SAINZ, H. (2000-2001): “La actitud de los consumidores ante los vinos con Denominación de Origen”, Distribución y Consumo (December-January), pp. 131-146.
SAUMELL SOLER, A. (2004): “El cooperativisme vitivinícola i els processos de modernització agrària al Penedès (1960-2002)”, Recerques, nº 49, pp. 97-132.
Statistics Organisation Internationale de la vigne et du vin (OIV). http://www.oiv.int TAPLI, J. and RYAN, W. (1969): “The prospects for wine in Australia”, Quarterly
Review of Agricultural Economics, nº 22, pp. 197-209. TRONCOSO, J. L. and AGUIRRE, M. (2006): “Demanda y oferta de vino en el periodo
1980-2004: un análisis econométrico”, Panorama socioeconómico, nº 44, pp- 26-32.
UNWIN, T. (1991): Wine and the vine: an historical geography of viticulture and the wine trade. London: Routledge.