Embed Size (px)
Citation preview

1
New to 6th Grade: • Understand the concept of a ratio and use ratio language to describe a ratio relationship between two
quantities (6.RP.1) • Understand the concept of a unit rate a/b associated with a ratio a:b, with b ≠ 0, and use rate language in
the context of a ratio relationship (6.RP.2) • Use ratio and rate reasoning to solve real-world and mathematical problems, e.g., by reasoning about tables
of equivalent ratios, tape diagrams, double number line diagrams, or equations; use the concept of ratios, unit rates, etc. in a variety of situations, such as measurement conversion, unit pricing, constant speed, and percent (6.RP.3)
• Solve word problems involving division of fractions by fractions (6.NS.1) • Understand that positive and negative numbers are used together to describe quantities having opposite
directions or values (6.NS.5) • Understand absolute value of rational numbers (6.NS.7) • Solve real-world and mathematical problems by graphing points in all four quadrants of the coordinate
plane. Include use of coordinates and absolute value to find distances between points with the same first coordinate or the same second coordinate (6.NS.8)
• Write and evaluate numerical expressions involving whole-number exponents (6.EE.1) • Apply the properties of operations to generate equivalent expressions (6.EE.3) • Use variables to represent two quantities in a real-world problem that change in relationship to one another;
write an equation to express one quantity, thought of as the dependent variable, in terms of the other quantity, thought of as the independent variable; analyze the relationship between the dependent and independent variables using graphs and tables and relate these to the equation (6.EE.9)
• Find the area of right triangles, other triangles, special quadrilaterals, and polygons by composing into rectangles or decomposing into triangles and other shapes (6.G.1)
• Volume of right rectangular prisms with fractional edges (6.G.2) • Surface area with nets (only triangle and rectangle faces) (6.G.4) • Display numerical data in plots on a number line, including dot plots, histograms, and box plots (6.SP .4)
Moved from 6th Grade: • Assess the reasonableness of answers using estimation and rounding (4th Grade) • Multiply four-digit whole numbers (4th Grade) • Add and subtract mixed numbers (4th Grade) • Use the area formula for a rectangle as a multiplication equation with an unknown factor (4th Grade) • Classify angles as right, acute, or obtuse (4th Grade) • Write simple expressions that record calculations with numbers and interpret numerical expressions without
evaluating them (5th Grade) • Explain the meaning of the division of rational numbers (5th Grade) • Explain the meaning of multiplication of rational numbers (5th Grade) • Use scale factors to perform dilations and to solve ratio and proportion problems (5th Grade) • Explain the meaning of the division of rational numbers (5th Grade) • Formulate algebraic expressions, equations, and inequalities to reflect a given situation (5th Grade) • Use conversions of measurements to solve problems (5th Grade) • Classify two-dimensional figures in a hierarchy based on properties (5th Grade) • Compare, classify, and construct transformations (8th Grade)

2
Examples of Key Advances from Grade 5 to Grade 6 • Students’ prior understanding of and skill with multiplication, division, and fractions
contribute to their study of ratios, proportional relationships and unit rates (6.RP). • Students begin using properties of operations systematically to work with variables,
variable expressions, and equations (6.EE). • Students extend their work with the system of rational numbers to include using positive
and negative numbers to describe quantities (6.NS.5), extending the number line and coordinate plane to represent rational numbers and ordered pairs (6.NS.6), and understanding ordering and absolute value of rational numbers (6.NS.7).
• Having worked with measurement data in previous grades, students begin to develop notions of statistical variability, summarizing and describing distributions (6.SP).
Fluency Expectations or Examples of Culminating Standards • 6.NS.2 Students fluently divide multi-digit numbers using the standard algorithm. This is
the culminating standard for several years’ worth of work with division of whole numbers. • 6.NS.3 Students fluently add, subtract, multiply, and divide multi-digit decimals using the
standard algorithm for each operation. This is the culminating standard for several years’ worth of work relating to the domains of Number and Operations in Base Ten, Operations and Algebraic Thinking, and Number and Operations — Fractions.
• 6.NS.1 Students interpret and compute quotients of fractions and solve word problems involving division of fractions by fractions. This completes the extension of operations to fractions.
Examples of Major Within-Grade Dependencies • Equations of the form px = q (6.EE.7) are unknown-factor problems; the solution will
sometimes be the quotient of a fraction by a fraction (6.NS.1). • Solving problems by writing and solving equations (6.EE.7) involves not only an
appreciation of how variables are used (6.EE.6) and what it means to solve an equation (6.EE.5) but also some ability to write, read, and evaluate expressions in which letters stand for numbers (6.EE.2).
• Students must be able to place rational numbers on a number line (6.NS.7) before they can place ordered pairs of rational numbers on a coordinate plane (6.NS.8). The former standard about ordering rational numbers is much more fundamental.

3
Ratios and Proportional Relationships 6.RP Understand ratio concepts and use ratio reasoning to solve problems. 6.RP.1 Understand the concept of a ratio and use ratio language to describe a ratio relationship between two quantities. Examples, “The ratio of wings to beaks in the bird house at the zoo was 2:1, because for every 2 wings there was 1 beak.” “For every vote candidate A received, candidate C received nearly three votes.” I Can… • Describe a ratio relationship by comparing two quantities using ratio language. • Write a ratio notation using a colon, the word “to”, and as a fraction. • Write a ratio in simplest form. • Analyze ratios to determine if they are equivalent.
5th Grade 7th Grade Use pictures, models, known number relationships, and/or mathematical reasoning to represent and describe proportional relationships between amounts. (5.NF.5)
Recognize and write ratios as a comparison of two quantities written as a fraction, using a colon, or the word “to”. (7.RP.1)
Examples 6.RP.1 A ratio is the comparison of two quantities or measures. The comparison can be part-to-whole (ratio of guppies to all fish in an aquarium) or part-to-part (ratio of guppies to goldfish). Example 1:
A comparison of 6 guppies and 9 goldfish could be expressed in any of the following forms: !!, 6 to 9
or 6:9. If the number of guppies is represented by black circles and the number of goldfish is represented by white circles, this ratio could be modeled as
These values can be regrouped into 2 black circles (goldfish) to 3 white circles (guppies), which would
reduce the ratio to, !!
, 2 to 3 or 2:3.
Students should be able to identify and describe any ratio using “For every _____ ,there are _____” In the example above, the ratio could be expressed saying, “For every 2 goldfish, there are 3 guppies”.

4
Ratios and Proportional Relationships 6.RP Understand ratio concepts and use ratio reasoning to solve problems. 6.RP.2 Understand the concept of a unit rate a/b associated with a ratio a:b with b ≠ 0, and use rate language in the context of a ratio relationship. For example, "This recipe has a ratio of 3 cups of flour to 4 cups of sugar, so there is 3/4 cup of flour for each cup of sugar." "We paid $75 for 15 hamburgers, which is a rate of $5 per hamburger."
I Can… • Define a unit • Define a rate • Write a unit rate as a ratio • Describe a unit rate using rate language
5th Grade 7th Grade Interpret a fraction as splitting an amount a into b equal groups. Use pictures, manipulatives, and/or known number relationships to model & solve word problems involving the division of a whole number into equal groups. (5.NF.3)
Compute unit rates of complex fractions, (i.e. a fraction over a fraction). (7.RP.1)
Examples 6.RP.2 A unit rate expresses a ratio as part-to-one, comparing a quantity in terms of one unit of another quantity. Common unit rates are cost per item or distance per time. Students are able to name the amount of either quantity in terms of the other quantity. Students will begin to notice that related unit rates (i.e. miles / hour and hours / mile) are reciprocals as in the second example below. At this level, students should use reasoning to find these unit rates instead of an algorithm or rule. In 6th grade, students are not expected to work with unit rates expressed as complex fractions. Both the numerator and denominator of the original ratio will be whole numbers. Example 1: There are 2 cookies for 3 students. What is the amount of cookie each student would receive? (i.e. the unit rate)
Solution: This can be modeled as shown below to show that there is !! of a cookie for 1 student, so the unit rate is
!!:1.
Example 2: On a bicycle Jack can travel 20 miles in 4 hours. What are the unit rates in this situation, (the distance Jack can travel in 1 hour and the amount of time required to travel 1 mile)?
Solution: Jack can travel 5 miles in 1 hour written as !!"!"!
and it takes !! of a hour to travel each mile written as
!!!!
!!".
Students can represent the relationship between 20 miles and 4 hours.

5
Ratios and Proportional Relationships 6.RP Understand ratio concepts and use ratio reasoning to solve problems. 6.RP.3a Use ratio and rate reasoning to solve real-world and mathematical problems, e.g., by reasoning about tables of equivalent ratios, tape diagrams, double number line diagrams, or equations. a) Make tables of equivalent ratios relating quantities with whole-number measurements, find missing values in
the tables, and plot the pairs of values on the coordinate plane. Use tables to compare ratios. I Can… • Complete a table of equivalent ratios with whole number values including measurements. • Create a function table and compare proportional quantities. • Plot pairs of values on a coordinate plane.
5th Grade 7th Grade Represent real world and mathematical problems by graphing points in Quadrant 1 on the coordinate plane. (5.G.2)
Recognize that ordered pairs are proportional if they form a straight line through the origin. Translate a proportion into a table to determine equivalency. Translate a real world situation into an equation and create a table to demonstrate proportionality. (7.RP.2)
Examples 6.RP.3 Ratios and rates can be used in ratio tables and graphs to solve problems. Previously, students have used additive reasoning in tables to solve problems. To begin the shift to proportional reasoning, students need to begin using multiplicative reasoning. To aid in the development of proportional reasoning the cross-product algorithm is not expected at this level. When working with ratio tables and graphs, whole number measurements are the expectation for this standard. Example 1: At Books Unlimited, 3 paperback books cost $18. What would 7 books cost? How many books could be purchased with $54. Solution: To find the price of 1 book, divide $18 by 3. One book costs $6. To find the price of 7 books, multiply $6 (the cost of one book times 7 to get $42. To find the number of books that can be purchased with $54, multiply $6 times 9 to get $54 and then multiply 1 book times 9 to get 9 books. Students use ratios, unit rates and multiplicative reasoning to solve problems in various contexts, including measurement, prices, and geometry. Notice in the table below, a multiplicative relationship exists between the numbers both horizontally (times 6) and vertically (ie. 1 • 7 = 7; 6 • 7 = 42). Red numbers indicate solutions.
Students use tables to compare ratios. Another bookstore offers paperback books at the prices below. Which bookstore has the best buy? Explain your answer.

6
To help understand the multiplicative relationship between the number of books and cost, students write equations to express the cost of any number of books. Writing equations is foundational for work in 7th grade. For example, the equation for the first table would be C = 6n, while the equation for the second bookstore is C = 5n. The numbers in the table can be expressed as ordered pairs (number of books, cost) and plotted on a coordinate plane. Students are able to plot ratios as ordered pairs. For example, a graph of Books Unlimited would be:
Example 2: Ratios can also be used in problem solving by thinking about the total amount for each ratio unit. The ratio of cups of orange juice concentrate to cups of water in punch is 1: 3. If James made 32 cups of punch, how many cups of orange did he need? Solution: Students recognize that the total ratio would produce 4 cups of punch. To get 32 cups, the ratio would need to be duplicated 8 times, resulting in 8 cups of orange juice concentrate. Example 3: Using the information in the table, find the number of yards in 24 feet.
Solution: There are several strategies that students could use to determine the solution to this problem: • Add quantities from the table to total 24 feet (9 feet and 15 feet); therefore the number of yards in 24feet
must be 8 yards (3 yards and 5 yards). • Use multiplication to find 24 feet: 1) 3 feet x 8 = 24 feet; therefore 1 yard x 8 = 8 yards, or 2) 6 feet x 4 = 24
feet; therefore 2 yards x 4 = 8 yards. Example 4: Compare the number of black circles to white circles. If the ratio remains the same, how many black circles will there be if there are 60 white circles?
Solution: There are several strategies that students could use to determine the solution to this problem • Add quantities from the table to total 60 white circles (15 + 45). Use the corresponding numbers to
determine the number of black circles (20 + 60) to get 80 black circles. • Use multiplication to find 60 white circles (one possibility 30 x 2). Use the corresponding numbers and
operations to determine the number of black circles (40 x 2) to get 80 black circles.

7
Ratios and Proportional Relationships 6.RP Understand ratio concepts and use ratio reasoning to solve problems. 6.RP.3b Use ratio and rate reasoning to solve real-world and mathematical problems, e.g., by reasoning about tables of equivalent ratios, tape diagrams, double number line diagrams, or equations. b) Solve unit rate problems including those involving unit pricing and constant speed. For example, if it took 7
hours to mow 4 lawns, then at that rate, how many lawns could be mowed in 35 hours? At what rate were lawns being mowed?
I Can… • Solve unit rate problems involving unit pricing. • Solve unit rate problems involving constant speed.
5th Grade 7th Grade None – This skill is introduced in 6th grade. Translate a proportion into a table to determine
equivalency. Determine the constant of proportionality (unit rate). (7.RP.2)
Examples Students recognize the use of ratios, unit rate and multiplication in solving problems, which could allow for the use of fractions and decimals. Example 1: In trail mix, the ratio of cups of peanuts to cups of chocolate candies is 3 to 2. How many cups of chocolate candies would be needed for 9 cups of peanuts.
Solution: One possible solution is for students to find the number of cups of chocolate candies for 1 cup of peanuts by
dividing both sides of the table by 3, giving !! cup of chocolate for each cup of peanuts. To find the amount of
chocolate needed for 9 cups of peanuts, students multiply the unit rate by nine (9 • !!), giving 6 cups of
chocolate. Example 2: If steak costs $2.25 per pound, how much does 0.8 pounds of steak cost? Explain how you determined your answer. Solution: The unit rate is $2.25 per pound so multiply $2.25 x 0.8 to get $1.80 per 0.8 lb. of steak.

8
Ratios and Proportional Relationships 6.RP Understand ratio concepts and use ratio reasoning to solve problems. 6.RP.3c Use ratio and rate reasoning to solve real-world and mathematical problems, e.g., by reasoning about tables of equivalent ratios, tape diagrams, double number line diagrams, or equations. c) Find a percent of a quantity as a rate per 100 (e.g., 30% of a quantity means 30/100 times the quantity);
solve problems involving finding the whole, given a part and the percent.
I Can… • Convert among fractions, decimals, and percents. • Solve problems finding the whole, given the part and the percent. • Explain that a percent is a ratio of a number to 100.
5th Grade 7th Grade None – This skill is introduced in 6th grade. Convert between fractions, decimals, and percents.
Recognize that a percent is a proportional relationship out of 100. Solve multi-step ratio and percent problems to calculate tax, markup and markdowns, gratuities, commissions, fees, percent increase and decrease and percent error. (7.RP.3)
Examples This is the students’ first introduction to percents. Percentages are a rate per 100. Models, such as percent bars or 10 x 10 grids should be used to model percents. Students use ratios to identify percents.
Example 1: What percent is 12 out of 25? Solution: One possible solution method is to set up a ratio table: Multiply 25 by 4 to get 100. Multiplying 12 by 4 will give 48, meaning that 12 out of 25 is equivalent to 48 out of 100 or 48%. Students use percentages to find the part when given the percent, by recognizing that the whole is being divided into 100 parts and then taking a part of them (the percent). Example 2: What is 40% of 30? Solution: There are several methods to solve this problem. One possible solutionusing rates is to use a 10 x 10grid to represent the whole amount (or 30). If the30 is divided into 100 parts, the rate for one block is 0.3. Forty percent would be 40 of the blocks, or 40 x 0.3, which equals 12. See the weblink below for more information. http://illuminations.nctm.org/LessonDetail.aspx?id=L249 Students also determine the whole amount, given a part and the percent.

9
Example 3: If 30% of the students in Mrs. Rutherford’s class like chocolate ice cream, then how many students are in Mrs. Rutherford’s class if 6 like chocolate ice cream?
(Solution: 20) Example 4: A credit card company charges 17% interest fee on any charges not paid at the end of the month. Make a ratio table to show how much the interest would be for several amounts. If the bill totals $450 for this month, how much interest would you have to be paid on the balance? Solution:
One possible solution is to multiply 1 by 450 to get 450 and then multiply 0.17 by 450 to get $76.50.

10
Ratios and Proportional Relationships 6.RP Understand ratio concepts and use ratio reasoning to solve problems. 6.RP.3d Use ratio and rate reasoning to solve real-world and mathematical problems, e.g., by reasoning about tables of equivalent ratios, tape diagrams, double number line diagrams, or equations. d) Use ratio reasoning to convert measurement units; manipulate and transform units appropriately when
multiplying or dividing quantities.
I Can… • Convert measurement units using ratios.
5th Grade 7th Grade None – This skill is introduced in 6th grade. Distinguish the need to convert to common units of
measure and write in simplest form. Compute units to demonstrate the relationship to one (1) and with proper labeling. (7.RP.1)
Examples A ratio can be used to compare measures of two different types, such as inches per foot, milliliters per liter and centimeters per inch. Students recognize that a conversion factor is a fraction equal to 1 since the numerator and
denominator describe the same quantity. For example, !"!"!!"
is a conversion factor since the numerator and
denominator equal the same amount. Since the ratio is equivalent to 1, the identity property of multiplication
allows an amount to be multiplied by the ratio. Also, the value of the ratio can also be expressed as !!"!"!"
allowing
for the conversion ratios to be expressed in a format so that units will “cancel”. Students use ratios as conversion factors and the identity property for multiplication to convert ratio units. Example 1: How many centimeters are in 7 feet, given that 1 inch ≈ 2.54 cm. Solution: 7 feet x 12 inches x 2.54 cm = 7 feet x 12 inches x 2.54 cm = 7 x 12 x 2.54 cm = 213.36 cm Note: Conversion factors will be given. Conversions can occur both between and across the metric and English system. Estimates are not expected.

11
The Number System 6.NS Apply and extend previous understandings of multiplication and division to divide fractions by fractions. 6.NS.1 Interpret and compute quotients of fractions, and solve word problems involving division of fractions by fractions, e.g., by using visual fraction models and equations to represent the problem. For example, create a story context for (2/3) ÷ (3/4) and use a visual fraction model to show the quotient; use the relationship between multiplication and division to explain that (2/3) ÷ (3/4) = 8/9 because 3/4 of 8/9 is 2/3. (In general, (a/b) ÷ (c/d) = ad/bc.) How much chocolate will each person get if 3 people share 1/2 lb of chocolate equally? How many 3/4-cup servings are in 2/3 of a cup of yogurt? How wide is a rectangular strip of land with length 3/4 mi and area 1/2 square mi?
I Can… • Interpret and compute quotients of fractions and mixed numbers. • Interpret and solve word problems involving division of fractions by fractions using visual fraction models. • Interpret and solve word problems involving division of fractions by fractions.
5th Grade 7th Grade Use pictures, models, known number relationships, and/or mathematical reasoning to solve problems involving dividing unit fractions by a whole number and visa versa. (5.NF.7)
Apply properties (associative, distributive, identity, multiplicative inverse, and commutative) to multiply and divide rational numbers. (7.NS.2c)
Examples 6.NS.1 In 5th grade students divided whole numbers by unit fractions and divided unit fractions by whole numbers. Students continue to develop this concept by using visual models and equations to divide whole numbers by fractions and fractions by fractions to solve word problems. Students develop an understanding of the relationship between multiplication and division. Example 1:
Students understand that a division problem such as 3 ÷ !! is asking, “how many !
! are in 3?” One possible visual
model would begin with three whole and divide each into fifths. There are 7 groups of two-fifths in the three
wholes. However, one-fifth remains. Since one-fifth is half of a two-fifths group, there is a remainder of !!.
Therefore, 3 ÷ !! = 7!
!, meaning there are
7!! groups of two-fifths. Students interpret the solution, explaining how division by fifths can result in an answer
with halves.
Students also write contextual problems for fraction division problems. For example, the problem, !
! ÷ !
! can be
illustrated with the following word problem: Example 2:
Susan has !! of an hour left to make cards. It takes her about !
! of an hour to make each card. About how many
can she make?

12
This problem can be modeled using a number line. a. Start with a number line divided into thirds.
b. The problem wants to know how many sixths are in two-thirds. Divide each third in half to create sixths.
c. Each circled part represents !!. There are four sixths in two-thirds; therefore, Susan can make 4 cards.
Example 3:
Michael has !! of a yard of fabric to make book covers. Each book cover is made from !
! of a yard of fabric. How
many book covers can Michael make? Solution: Michael can make 4 book covers.
Example 4:
Represent !!+ !
! in a problem context and draw a model to show your solution.
Context: A recipe requires !! of a cup of yogurt. Rachel has !
! of a cup of yogurt from a snack pack. How much of
the recipe can Rachel make? Explanation of Model:
The first model shows !! cup. The shaded squares in all three models show the !
! cup.
The second model shows !! cup and also shows !
! cups horizontally.
The third model shows !! cup moved to fit in only the area shown by !
! of the model. !
! is the new referent unit
(whole).
3 out of the 4 squares in the !! portion are shaded. A !
! cup is only !
! of a !
! cup portion, so only !
! of the recipe can
be made.

13
The Number System 6.NS Compute fluently with multi-digit numbers and find common factors and multiples. 6.NS.2 Fluently divide multi-digit numbers using the standard algorithm.
I Can… • Fluently divide multi-digit numbers using the standard algorithm with speed and accuracy.
5th Grade 7th Grade Find whole- number quotients of whole numbers with up to 4-digit dividends and 2-digit divisors using strategies based on place value, properties of operations, or the relationship between multiplication and division. (5.NBT.6)
Solve real-world and mathematical problems involving the four operations with rational numbers. (7.NS.3)
Examples 6.NS.2 In the elementary grades, students were introduced to division through concrete models and various strategies to develop an understanding of this mathematical operation (limited to 4- digit numbers divided by 2-digit numbers). In 6th grade, students become fluent in the use of the standard division algorithm, continuing to use their understanding of place value to describe what they are doing. Place value has been a major emphasis in the elementary standards. This standard is the end of this progression to address students’ understanding of place value. Example 1: When dividing 32 into 8456, students should say, “there are 200 thirty-twos in 8456” as they write a 2 in the quotient. They could write 6400 beneath the 8456 rather than only writing 64.

14
The Number System 6.NS Compute fluently with multi-digit numbers and find common factors and multiples. 6.NS.3 Fluently add, subtract, multiply, and divide multi-digit decimals using the standard algorithm for each operation.
I Can… • Fluently add multi-digit decimals using the standard algorithm with speed and accuracy. • Fluently subtract multi-digit decimals using the standard algorithm with speed and accuracy. • Fluently multiply multi-digit decimals using the standard algorithm with speed and accuracy. • Fluently divide multi-digit decimals using the standard algorithm with speed and accuracy.
5th Grade 7th Grade Add, subtract, multiply, and divide decimals to hundredths, using concrete models or drawings and strategies based on place value, properties of operations, and/or the relationship between addition and subtraction; relate the strategy to a written method and explain the reasoning used. (5.NBT.7)
Solve real-world and mathematical problems involving the four operations with rational numbers. (7.NS.3)
Examples 6.NS.3 Procedural fluency is defined by the Common Core as “skill in carrying out procedures flexibly, accurately, efficiently and appropriately”. In 4th and 5th grades, students added and subtracted decimals. Multiplication and division of decimals were introduced in 5th grade (decimals to the hundredth place). At the elementary level, these operations were based on concrete models or drawings and strategies based on place value, properties of operations, and/or the relationship between addition and subtraction. In 6th grade, students become fluent in the use of the standard algorithms of each of these operations. The use of estimation strategies supports student understanding of decimal operations. Example 1: First estimate the sum of 12.3 and 9.75. Solution: An estimate of the sum would be 12 + 10 or 22. Student could also state if their estimate is high or low. Answers of 230.5 or 2.305 indicate that students are not considering place value when adding.

15
The Number System 6.NS Compute fluently with multi-digit numbers and find common factors and multiples. 6.NS.4 Find the greatest common factor of two whole numbers less than or equal to 100 and the least common multiple of two whole numbers less than or equal to 12. Use the distributive property to express a sum of two whole numbers 1-100 with a common factor as a multiple of a sum of two whole numbers with no common factor. For example, express 36 + 8 as 4 (9 + 2).
I Can… • Derive the greatest common factor of two whole numbers less than or equal to 100. • Derive the least common multiple of two whole numbers less than or equal to 12. • Identify the distributive property. • Apply the distributive property to express the sum of two whole numbers 1-100.
5th Grade 7th Grade Write simple expressions that record calculations with numbers, and interpret numerical expressions without evaluating them. (5.OA.2)
None – students are expected to have mastered this standard by the end of 6th grade.
Examples In elementary school, students identified primes, composites and factor pairs (4.OA.4). In 6th grade students will find the greatest common factor of two whole numbers less than or equal to 100. For example, the greatest common factor of 40 and 16 can be found by 1) Listing the factors of 40 (1, 2, 4, 5, 8, 10, 20, 40) and 16 (1, 2, 4, 8, 16), then taking the greatest common
factor (8). Eight (8) is also the largest number such that the other factors are relatively prime (two numbers with no common factors other than one). For example, 8 would be multiplied by 5 to get 40; 8 would be multiplied by 2 to get 16. Since the 5 and 2 are relatively prime, then 8 is the greatest common factor. If students think 4 is the greatest, then show that 4 would be multiplied by 10 to get 40, while 16 would be 4 times 4. Since the 10 and 4 are not relatively prime (have 2 in common), the 4 cannot be the greatest common factor.
2) Listing the prime factors of 40 (2 ∙ 2 ∙ 2 ∙ 5) and 16 (2 ∙ 2 ∙ 2 ∙ 2) and then multiplying the common factors (2 ∙ 2 ∙ 2 = 8).
Students also understand that the greatest common factor of two prime numbers is 1. Example 1: What is the greatest common factor (GCF) of 18 and 24? Solution: 2×3! = 18 and 2!×3 = 24. Students should be able to explain that both 18 and 24 will have at least one factor of 3 in common, making 2, 3, or 6 the GCF. Given various pairs of addends using whole numbers from 1-100, students should be able to identify if the two numbers have a common factor. If they do, the y identify the common factor and use the distributive property to rewrite the expression. They prove that they are correct by simplifying both expressions.

16
Example 2: Use the greatest common factor and the distributive property to find the sum of 36 and 8. Solution: 36 + 8 = 4(9) + 4(2) 44 = 4(9+2) 44 = 4(11) 44 = 44 Example 3: Ms. Spain and Mr. France have donated a total of 90 hotdogs and 72 bags of chips for the class picnic. Each student will receive the same amount of refreshments. All refreshments must be used. a) What is the greatest number of students that can attend the picnic? b) How many bags of chips will each student receive? c) How many hotdogs will each student receive? Solution: a) Eighteen (18) is the greatest number of students that can attend the picnic. b) Each student would receive 4 bags of chips. c) Each student would receive 5 hot dogs. Students find the least common multiple of two whole numbers less than or equal to twelve. For example, the least common multiple of 6 and 8 can be found by: 1) Listing the multiples of 6 (6, 12, 18, 24, 30, …) and 8 (8, 16, 24, 32, 40, …), then taking the least common
from the list (24); or 2) Using the prime factorization.
Step 1: find the prime factors of 6 and 8. 6 = 2 ∙ 3 8 = 2 ∙ 2 ∙ 2 Step 2: Find the common factors between 6 and 8. In this example, the common factor is 2. Step 3: Multiply the common factors and any extra factors 2 ∙ 2 ∙ 2 ∙ 3 or 24 (one of the twos is in common; the other twos and the three are the extra factors.
Example 4: The elementary school lunch menu repeats every 20 days; the middle school lunch menu repeats every 15 days. Both schools are serving pizza today. In how many days will both schools serve the same meal again? Solution: The solution to this problem will be the least common multiple (LCM) of 15 and 20. Students should be able to explain that the least common multiple is the smallest number that is a multiple of 15 and a multiple of 20. One-way to find the least common multiple is to find the prime factorization of each number: 2!×5 = 20 and 3×5 = 15. To be a multiple of 20, a number must have two factors of 2 and one factor of 5 (2×2×5). To be a multiple of 15, a number must have factors of 3 and 5. The least common multiple of 20 and 15 must have 2 factors of 2, one factor of 3, and one factor of 5 (2×2×3×5) or 60.

17
The Number System 6.NS Apply and extend previous understandings of numbers to the system of rational numbers. 6.NS.5 Understand that positive and negative numbers are used together to describe quantities having opposite directions or values (e.g., temperature above/below zero, elevation above/below sea level, credits/debits, positive/negative electric charge); use positive and negative numbers to represent quantities in real-world contexts, explaining the meaning of 0 in each situation.
I Can… • Represent and describe quantities in real world situations using positive and negative numbers. • Explain where zero fits into real world situation represented by integers.
5th Grade 7th Grade None – This skill is introduced in 6th grade. Identify that opposite quantities have the sum of zero
(0). (7.NS.1a)
Examples 6.NS.5 Students use rational numbers (fractions, decimals, and integers) to represent real-world contexts and understand the meaning of 0 in each situation. Example 1: a. Use an integer to represent 25 feet below sea level b. Use an integer to represent 25 feet above sea level. c. What would 0 (zero) represent in the scenario above? Solution: a. -25 b. +25 c. 0 would represent sea level

18
The Number System 6.NS Apply and extend previous understandings of numbers to the system of rational numbers. 6.NS.6a Understand a rational number as a point on the number line. Extend number line diagrams and coordinate axes familiar from previous grades to represent points on the line and in the plane with negative number coordinates. a) Recognize opposite signs of numbers as indicating locations on opposite sides of 0 on the number line;
recognize that the opposite of the opposite of a number is the number itself, e.g., -(-3) = 3, and that 0 is its own opposite.
I Can… • Identify a rational number as a point on a number line. • Identify the location of zero on a number line in relation to positive and negative numbers. • Recognize opposite signs of numbers as locations on opposites sides of zero on a number line.
5th Grade 7th Grade None – This skill is introduced in 6th grade. Use a number line to add and subtract rational
numbers (i.e. fractions, decimals, integers, etc.) (7.NS.1)
Examples 6.NS.6 In elementary school, students worked with positive fractions, decimals and whole numbers in the number line and in quadrant 1 of the coordinate plane. In the 6th grade, students extend the number line to represent all rational numbers and recognize that number lines may be either horizontal or vertical (i.e. thermometer) which facilities the movement from number lines to coordinate grids. Students recognize that a number and its opposite are equal distance from zero (reflections about zero). The opposite sign (-) shifts the number to the opposite side of 0. For example, -4 could be read as “the opposite of 4” which would be negative 4. In the example, -(-6.4) would be read as “the opposite of the opposite of 6.4” which would be 6.4. Zero is its own opposite.
Example 1:
What is the opposite of 2 !!? Explain your answer.
Solution:
-2!! because it is the same distance from 0 on the opposite side.

19
The Number System 6.NS Apply and extend previous understandings of numbers to the system of rational numbers. 6.NS.6b Understand a rational number as a point on the number line. Extend number line diagrams and coordinate axes familiar from previous grades to represent points on the line and in the plane with negative number coordinates. b) Understand signs of numbers in ordered pairs as indicating locations in quadrants of the coordinate plane;
recognize that when two ordered pairs differ only by signs, the locations of the points are related by reflections across one or both axes.
I Can… • Label quadrants on a coordinate plane. • Plot a point on the coordinate plane in any quadrant using ordered pairs. • Recognize a reflection as being two ordered pairs that differ only in signs.
5th Grade 7th Grade Describe how the x value in an ordered pair represents a distance from the origin on the horizontal axis and how the y value in an ordered pair represents a distance from the origin on the vertical axis. Locate a given point in the coordinate plane using an ordered pair of numbers, called coordinates. (5.G.1)
The full coordinate system is introduced in 6th grade and then picked back up in the function standards found in 8th grade.
Examples Students worked with Quadrant I in elementary school. As the x-axis and y-axis are extending to include negatives, students begin to with the Cartesian Coordinate system. Students recognize the point where the x-axis and y-axis intersect as the origin. Students identify the four quadrants and are able to identify the quadrant for an ordered pair based on the signs of the coordinates. For example, students recognize that in Quadrant II, the signs of all ordered pairs would be (–, +). Students understand the relationship between two ordered pairs differing only by signs as reflections across one or both axes. For example, in the ordered pairs (-2, 4) and (-2, -4), the y-coordinates differ only by signs, which represents a reflection across the x-axis. A change is the x-coordinates from (-2, 4) to (2, 4), represents a reflection across the y-axis. When the signs of both coordinates change, [(2, -4) changes to (-2, 4)], the ordered pair has been reflected across both axes. Example1: Graph the following points in the correct quadrant of the coordinate plane. If the point is reflected across the x-axis, what are the coordinates of the reflected points? What similarities are between coordinates of the original point and the reflected point?
Solution:
The coordinates of the reflected points would be !!, 3 !
!, − !
!, 3 , 0.25,−0.75 . Note that the y- coordinates are
opposites.

20
The Number System 6.NS Apply and extend previous understandings of numbers to the system of rational numbers. 6.NS.6c Understand a rational number as a point on the number line. Extend number line diagrams and coordinate axes familiar from previous grades to represent points on the line and in the plane with negative number coordinates. c) Find and position integers and other rational numbers on a horizontal or vertical number line diagram; find
and position pairs of integers and other rational numbers on a coordinate plane.
I Can… • Find and position integers on a horizontal and/or vertical number line. • Find and position rational numbers (fractions and decimals) on a horizontal and/or vertical number line. • Find and position integers in a coordinate plane. • Find and position rational numbers (fractions and decimals) on a coordinate plane.
5th Grade 7th Grade Describe how the x value in an ordered pair represents a distance from the origin on the horizontal axis and how the y value in an ordered pair represents a distance from the origin on the vertical axis. Locate a given point in the coordinate plane using an ordered pair of numbers, called coordinates. (5.G.1)
Use a number line to add and subtract rational numbers (i.e. fractions, decimals, integers, etc.) (7.NS.1)
Examples Example 1:
Students place the where the following numbers would be on a number line: -4.5, 3.2, -3!!, -2, 0.2, 2, !!
!. Based
on number placement, numbers can be placed in order. Solution: The numbers in order from least to greatest are:
-4.5, -3!!, -2, 0.2, 2, 3.2, !!
!
Students place each of these numbers on a number line to justify this order.

21
The Number System 6.NS Apply and extend previous understandings of numbers to the system of rational numbers. 6.NS.7a Understand ordering and absolute value of rational numbers. a) Interpret statements of inequality as statements about the relative position of two numbers on a number line
diagram. For example, interpret -3 > -7 as a statement that -3 is located to the right of -7 on a number line oriented from left to right.
I Can… • Interpret statements of inequality as statements about relative position of two numbers on a number line
diagram.
5th Grade 7th Grade None – This skill is introduced in 6th grade. Solve, create, and graph solutions to two-step
inequalities. (7.EE.4b) Examples
6.NS.7 Students use inequalities to express the relationship between two rational numbers, understanding that the value of numbers is smaller moving to the left on a number line. Common models to represent and compare integers include number line models, temperature models and the profit-loss model. On a number line model, the number is represented by an arrow drawn from zero to the location of the number on the number line; the absolute value is the length of this arrow. The number lone can also be viewed as a thermometer where each point on the number line is a specific temperature. In the profit-loss model, a positive number corresponds to profit and the negative number corresponds to a loss. Each of these models is useful for examining values but can also be used in later grades when students begin to perform operations on integers. Operations with integers are not the expectation at this level. In working with number line models, students internalize the order of the numbers; larges numbers on the right (horizontal or top (vertical) of the number line and smaller numbers to the left (horizontal) or bottom (vertical) of the number line. They use the order to correctly locate integers and other rational numbers on the number line. By placing two numbers in the same number line, they are able to write inequalities and make statements about the relationships between two numbers.

22
Example 1:
Write a statement to compare -4!! and -2. Explain your answer.
Solution:
-4!! < -2 because -4!
! is located to the left of -2 on the number line. Students recognize the distance from zero as
the absolute value or magnitude of a rational number. Students need multiple experiences to understand the relationships between numbers, absolute values, and statements.

23
The Number System 6.NS Apply and extend previous understandings of numbers to the system of rational numbers. 6.NS.7b Understand ordering and absolute value of rational numbers. b) Write, interpret, and explain statements of order for rational numbers in real-world contexts. For example,
write -3°C > -7°C to express the fact that -3°C is warmer than -7°C.
I Can… • Write statements of order for rational numbers in real-world contexts. • Interpret statements of order for rational numbers in real-world contexts. • Explain statements of order for rational numbers in real-world contexts.
5th Grade 7th Grade None – This skill is introduced in 6th grade. Solve word problems leading to inequalities. (7.EE.4b)
Examples Students write statements using < or > to compare rational numbers in context. However, explanations should reference the context rather than “less than” or “greater than”. Example 1: The balance in Sue’s checkbook was -$12.55. The balance in John’s checkbook was -$10.45. Write an inequality to show the relationship between these amounts. Who owes more? Solution: -$12.55 < -$10.45, Sue owes more tan John. The interpretation could also be “John owes less than Sue”.
Example 2: One of the thermometers shows -3℃ and the other shows -7℃. Which thermometer shows which temperature? Which is the colder temperature? How much colder? Write an inequality to show the relationship between the temperatures and explain how the model shows this relationship. Solution: The thermometer on the left is -7; right is -3. The left thermometer is colder by 4 degrees. Either -7<-3 or -3>-7. Although 6.NS.7a is limited to two numbers, this part of the standard expands the ordering of rational numbers to more than two numbers in context.

24
Example 3: A meteorologist recorded temperatures in four cities around the world. List three cities in order from coldest temperature to warmest temperature: Albany 5° Anchorage -6° Buffalo -7° Juneau -9° Reno 12° Solution: Juneau -9° Buffalo -7° Anchorage -6° Albany 5° Reno 12°

25
The Number System 6.NS Apply and extend previous understandings of numbers to the system of rational numbers. 6.NS.7c Understand ordering and absolute value of rational numbers. c) Understand the absolute value of a rational number as its distance from 0 on the number line; interpret
absolute value as magnitude for a positive or negative quantity in a real-world situation. For example, for an account balance of -30 dollars, write |-30| = 30 to describe the size of the debt in dollars.
I Can… • Define the absolute value of a rational number as its distance from zero on a number line. • Use absolute value to describe size or magnitude in a real-world situation.
5th Grade 7th Grade None – This skill is introduced in 6th grade. Apply the principle that the distance between two
points on a number line is the difference in their absolute values and apply this principle in real world context. (7.NS.1c)
Examples Students understand absolute value as the distance from zero and recognize the symbols ∥ as representing absolute value. Example 1: Which numbers have an absolute value of 7? Solution: 7 and -7 since both numbers have a distance of 7 units from 0 on the number line. Example 2:
What is the −3 !!
?
Solution:
3!!
In real-world contexts, the absolute value can be used to describe size or magnitude. For example, for an ocean depth of 900 feet, write −900 =900 to describe the distance below sea level.

26
The Number System 6.NS Apply and extend previous understandings of numbers to the system of rational numbers. 6.NS.7d Understand ordering and absolute value of rational numbers. d) Distinguish comparisons of absolute value from statements about order. For example, recognize that an
account balance less than -30 dollars represents a debt greater than 30 dollars.
I Can… • Distinguish comparisons of absolute value from statements about order and apply to real world context.
5th Grade 7th Grade None – This skill is introduced in 6th grade. Apply the principle that the distance between two
points on a number line is the difference in their absolute values and apply this principle in real world context. (7.NS.1c)
Examples When working with positive numbers, the absolute value (distance from zero) of the number and the value of the number is the same; therefore, ordering is not problematic. However, negative numbers have a distinction that students need to understand. As the negative number increases (moves to the left on a number line), the value of the number decreases. For example, –24 is less than –14 because –24 is located to the left of –14 on the number line. However, absolute value is the distance from zero. In terms of absolute value (or distance) the absolute value of –24 is greater than the absolute value of –14. For negative numbers, as the absolute value increases, the value of the negative number decreases.

27
The Number System 6.NS Apply and extend previous understandings of numbers to the system of rational numbers. 6.NS.8 Solve real-world and mathematical problems by graphing points in all four quadrants of the coordinate plane. Include use of coordinates and absolute value to find distances between points with the same first coordinate or the same second coordinate.
I Can… • Solve real-world and mathematical problems by graphing points in all four quadrants. • Find the distance between two points on the coordinate plane given only coordinates.
5th Grade 7th Grade Represent real world and mathematical problems by graphing points in Quadrant 1 on the coordinate plane. (5.G.2)
Apply the principle that the distance between two points on a number line is the difference in their absolute values and apply this principle in real world context. (7.NS.1c)
Examples 6.NS.8 Students find the distance between points when ordered pairs have the same x-coordinate (vertical) or same y-coordinate (horizontal). Example: What is the distance between (-2, 2) and (-9, 2)? Solution: The distance would be 4 units. This would be a horizontal line since the y-coordinates are the same. In this scenario, both coordinates are in the same quadrant. The distance can be found by using a number line to find the distance between -5 and -9. Students could also recognize that -5 is 5 units from 0 (absolute value) and that -9 is 9 units from 0 (absolute value). Since both of these are in the same quadrant, the distance can be found by finding the difference between the distances 9 and 5. 9 − 5 . Coordinates could also be in two quadrants and include rational numbers. Example 2:
What is the distance between 3,−5 !!
and 3, 2 !!
?
Solution:
The distance between 3,−5 !!
and 3, 2 !!
would be 7!! units. This would be a vertical line since the x-
coordinates are the same. The distance can be found by using a number line to count from -5!! to 2!
! or by
recognizing that the distance (absolute value) from -5!! to 0 is 5!
! and the distance (absolute value from 0 to 2!
! is
2!! units so the total distance would be 5!
! + 2!
! or 7!
! units.
Students graph coordinates for polygons and find missing vertices based on properties of triangles and quadrilaterals.

28
Expressions and Equations 6.EE Apply and extend previous understandings or arithmetic expressions. 6.EE.1 Write and evaluate numerical expressions involving whole-number exponents.
I Can… • Write numerical expressions involving whole number exponents. • Evaluate numerical expressions involving whole number exponents. • Solve order of operations that contain exponents.
5th Grade 7th Grade Use simple expressions to describe the relationships between numbers and/or variables. (Ex: “2 less than a number” could be written as “x – 2”). (5.OA.2)
Apply properties of operation as strategies to add, subtract, factor, and expand linear, (algebraic) expressions with rational coefficients. (7.EE.1)
Examples 6.EE.1 Students demonstrate the meaning of exponents to write and evaluate numerical expressions with whole
number exponents. The base can be a whole number, positive decimal or a positive fraction (i.e. !!
!can be
written !! ∙ !! ∙ !! ∙ !! ∙ !! which has the same value as !
!". Students recognize that an expression with a variable
represents the same mathematics (i.e. x5 can be written as x • x • x • x • x) and write algebraic expressions from verbal expressions. Order of operations is introduced throughout elementary grades, including the use of grouping symbols, ( ), { }, and [ ] in 5th grade. Order of operations with exponents is the focus in 6th grade. Example 1: What is the value of: 0.23
Solution: 0.008 5 + 24 ∙ 6 Solution: 101 72– 24 ÷3 + 26 Solution: 67 Example 2: What is the area of a square with a side length of 3x? Solution: 3x ∙ 3x = 9x2 Example 3: 4x = 64 Solution: x = 3 because 4 ∙ 4 ∙ 4 = 64

29
Expressions and Equations 6.EE Apply and extend previous understandings or arithmetic expressions. 6.EE.2a Write, read, and evaluate expressions in which letters stand for numbers. a) Write expressions that record operations with numbers and with letters standing for numbers. For example,
express the calculation "Subtract y from 5" as 5 - y.
I Can… • Translate written phrases into algebraic expressions. • Translate algebraic expressions into written phrases. • Evaluate algebraic expressions using variables.
5th Grade 7th Grade Use simple expressions to describe the relationships between numbers and/or variables. (Ex: “2 less than a number” could be written as “x – 2”). (5.OA.2)
Calculate multi-step word problems with rational numbers in any form. (7.EE.3)
Examples 6.EE.2 Students write expressions from verbal descriptions using letters and numbers, understanding order is important in writing subtraction and division problems. Students understand that the expression “5 times any number, n” could be represented with 5n and that a number and letter written together means to multiply. All rational numbers may be used in writing expressions when operations are not expected. Students use appropriate mathematical language to write verbal expressions from algebraic expressions. It is important for students to read algebraic expressions in a manner that reinforces that the variable represents a number. Example Set 1: Students read algebraic expressions:
• r + 21 as “some number plus 21” as well as “r plus 21” • n x 6 as “some number times 6” as well as “n times 6” • s ÷ 6 as “as some number divided by 6” as well as “s divided by 6”
Example Set 2: Students write algebraic expressions:
• 7 less than 3 times a number Solution: 3x – 7
• 3 times the sum of a number and 5 Solution: 3 (x + 5)
• 7 less than the product of 2 and a number Solution: 2x – 7
• Twice the difference between a number and 5 Solution: 2(z – 5)
• The quotient of the sum of x plus 4 and 2
Solution: !!!!

30
Expressions and Equations 6.EE Apply and extend previous understandings or arithmetic expressions. 6.EE.2b Write, read, and evaluate expressions in which letters stand for numbers. b) Identify parts of an expression using mathematical terms (sum, term, product, factor, quotient, coefficient);
view one or more parts of an expression as a single entity. For example, describe the expression 2 (8 + 7) as a product of two factors; view (8 + 7) as both a single entity and a sum of two terms.
I Can… • Identify the parts of an expression using mathematical terms. (sum, term, product, factors, quotient,
coefficient). • Identify the terms of an expression. • Identify parts of an expression as a single entity, even if not a monomial.
5th Grade 7th Grade Use simple expressions to describe the relationships between numbers and/or variables. (Ex: “2 less than a number” could be written as “x – 2”). (5.OA.2)
Write equivalent expressions with fractions, decimals, percents, and integers. (7.EE.2)
Examples Students can describe expressions such as 3 (2 + 6) as the product of two factors: 3 and (2 + 6). The quantity (2 + 6) is viewed as one factor consisting of two terms. Terms are the parts of a sum. When the term is an explicit number, it is called a constant. When the term is a product of a number and a variable, the number is called the coefficient of the variable. Students should identify the parts of an algebraic expression including variables, coefficients, constants, and the names of operations (sum, difference, product, and quotient). Variables are letters that represent numbers. There are various possibilities for the number they can represent. Consider the following expression: 𝑥! + 5𝑦 + 3𝑥 + 6 The variables are x and y. There are 4 terms, x2, 5y, 3x, and 6. There are 3 variable terms, x2, 5y, 3x. They have coefficients of 1, 5, and 3 respectively. The coefficient of x2 is 1, since x2 = 1x2. The term 5y represent 5y’s or 5 ∙ 𝑦. There is one constant term, 6. The expression represents a sum of all four terms.

31
Expressions and Equations 6.EE Apply and extend previous understandings or arithmetic expressions. 6.EE.2c Write, read, and evaluate expressions in which letters stand for numbers. c) Evaluate expressions at specific values of their variables. Include expressions that arise from formulas used in
real-world problems. Perform arithmetic operations, including those involving whole-number exponents, in the conventional order when there are no parentheses to specify a particular order (Order of Operations). For example, use the formulas V = s3 and A = 6 s2 to find the volume and surface area of a cube with sides of length s = 1/2.
I Can… • Evaluate expressions, substituting specific values for variables. • Apply a formula to evaluate expressions using real world problems. • Solve an expression with exponents. • Solve an expression with the order of operations without parentheses.
5th Grade 7th Grade Use simple expressions to describe the relationships between numbers and/or variables. (Ex: “2 less than a number” could be written as “x – 2”). (5.OA.2)
Calculate multi-step word problems with rational numbers in any form. (7.EE.3)
Examples Students evaluate algebraic expressions, using order of operations as needed. Problems such as example 1 below require students to understand that multiplication is understood when numbers and variables are written together and to use the order of operations to evaluate. Order of operations is introduced throughout elementary grades, including the use of grouping symbols, ( ), { }, and [ ] in 5th grade. Order of operations with exponents is the focus in 6th grade. Example 1: Evaluate the expression 3x + 2y when x is equal to 4 and y is equal to 2.4. Solution: 3 • 4 + 2 • 2.4 12 + 4.8 16.8 Example 2:
Evaluate 5(n + 3) – 7n, when n = !!
Solution:
512+ 3 − 7
12
5 3 !!− 3 !
! Note: 7 !
!= !
!= 3 !
!
17!! - 3!
!
14
Students may also reason that 5 groups of 3!! take away 1 group of 3!
! would give 4 groups of 3!
!. Multiply 4
times 3!! to get 14.

32
Example 3: Evaluate 7xy when x = 2.5 and y = 9 Solution: Students recognize that two or more terms written together indicates multiplication. 7 (2.5) (9) 157.5 In 5th grade students worked with the grouping symbols ( ), [ ], and { }. Students understand that the fraction bar can also serve as a grouping symbol (treats numerator operations as one group and denominator operations as another group) as well as a division symbol. Example 4: Evaluate the following expression when x = 4 and y = 2 𝑥! + 𝑦!
3
Solution: ! !! ! !
! substitute the values for x and y
!"!!!
raise the numbers to the powers
!"!
divide 24 by 3
8
Given a context and the formula arising from the context, students could write an expression and then evaluate for any number. Example 5: It costs $100 to rent the skating rink plus $5 per person. Write an expression to find the cost for any number (n) of people. What is the cost for 25 people? Solution: The cost for any number (n) of people could be found by the expression, 100 + 5n. To find the cost of 25 people substitute 25 in for n and solve to get 100 + 5 * 25 = 225.

33
Expressions and Equations 6.EE Apply and extend previous understandings or arithmetic expressions. 6.EE.3 Apply the properties of operations to generate equivalent expressions. For example, apply the distributive property to the expression 3 (2 + x) to produce the equivalent expression 6 + 3x; apply the distributive property to the expression 24x + 18y to produce the equivalent expression 6 (4x + 3y); apply properties of operations to y + y + y to produce the equivalent expression 3y.
I Can… • Identify properties of operations (associative, commutative, distributive, identity, and zero). • Apply the properties of operations to generate equivalent expressions.
5th Grade 7th Grade Use simple expressions to describe the relationships between numbers and/or variables. (Ex: “2 less than a number” could be written as “x – 2”). (5.OA.2)
Apply properties of operation as strategies to add, subtract, factor, and expand linear, (algebraic) expressions with rational coefficients. (7.EE.1)
Examples 6.EE.3 Students use the distributive property to write equivalent expressions. Using their understanding of area models from elementary students illustrate the distributive property with variables. Properties are introduced throughout elementary grades (3.OA.5); however, there has not been an emphasis on recognizing and naming the property. In 6th grade students are able to use the properties and identify by name as used when justifying solution methods (see example 4). Example 1: Given that the width is 4.5 units and the length can be represented by x + 3, the area of the flowers below can be expressed as 4.5(x + 3) or 4.5x + 13.5.
When given an expression representing area, students need to find the factors. Example 2: The expression 10x + 15 can represent the area of the figure below. Students find the greatest common factor (5) to represent the width and then use the distributive property to find the length (2x + 3). The factors (dimensions) of this figure would be 5(2x + 3).

34
Example 3: Students use their understanding of multiplication to interpret 3 (2 + x) as 3 groups of (2 + x). They use a model to represent x, and make an array to show the meaning of 3(2 + x). They can explain why it makes sense that 3(2 + x) is equal to 6 + 3x. An array with 3 columns and x + 2 in each column:
Students interpret y as referring to one y. Thus, they can reason that one y plus one y plus one y must be 3y. They also use the distributive property, the multiplicative identity property of 1, and the commutative property for multiplication to prove that y + y + y = 3y: Example 4: Prove that y + y + y = 3y Solution: y + y + y y • 1 + y • 1 + y • 1 Multiplicative Identity y • (1 + 1 + 1) Distributive Property y • 3 3y Commutative Property

35
Expressions and Equations 6.EE Apply and extend previous understandings or arithmetic expressions. 6.EE.4 Identify when two expressions are equivalent (i.e., when the two expressions name the same number regardless of which value is substituted into them). For example, the expressions y + y + y and 3y are equivalent because they name the same number regardless of which number y stands for.
I Can… • Justify that two equations are equivalent regardless of which value is substituted.
5th Grade 7th Grade Use simple expressions to describe the relationships between numbers and/or variables. (Ex: “2 less than a number” could be written as “x – 2”). (5.OA.2)
Write equivalent expressions with fractions, decimals, percents, and integers. (7.EE.2)
Examples 6.EE.4 Students demonstrate an understanding of like terms as quantities being added or subtracted with the same variables and exponents. For example, 3x + 4x are like terms and can be combined as 7x; however, 3x + 4x2 are not like terms since the exponents with the x are not the same. This concept can be illustrated by substituting in a value for x. For example, 9x – 3x = 6x not 6. Choosing a value for x, such as 2, can prove non-equivalence.
9(2) – 3(2) = 6(2) however 9(2) – 3(2) = 6 18 – 6 = 12 18– 6 = 6
12 = 12 12 ≠ 6 Students can also generate equivalent expressions using the associative, commutative, and distributive properties. They can prove that the expressions are equivalent by simplifying each expression into the same form. Example 1: Are the expressions equivalent? Explain your answer? 4m + 8, 4(m+2), 3m + 8 + m, 2 + 2m + m + 6 + m

36
Expressions and Equations 6.EE Reason about and solve one-variable equations and inequalities. 6.EE.5 Understand solving an equation or inequality as a process of answering a question: which values from a specified set, if any, make the equation or inequality true? Use substitution to determine whether a given number in a specified set makes an equation or inequality true.
I Can… • Understand solutions equations. • Understand possible solutions to inequalities. • Determine whether a given number makes an equation or an inequality true using substitution.
5th Grade 7th Grade None – This skill is introduced in 6th grade. Solve one-step, two-step, and multi-step equations to
include distributive property in both mathematical and real-world contexts. (7.EE.4a)
Examples In elementary grades, students explored the concept of equality. In 6th grade, students explore equations as expressions being set equal to a specific value. The solution is the value of the variable that will make the equation or inequality true. Students use various processes to identify the value(s) that when substituted for the variable will make the equation true. Example 1: Joey had 26 papers in his desk. His teacher gave him some more and now he has 100. How many papers did his teacher give him? This situation can be represented by the equation 26 + n = 100 where n is the number of papers the teacher gives to Joey. This equation can be stated as “some number was added to 26 and the result was 100.” Students ask themselves “What number was added to 26 to get 100?” to help them determine the value of the variable that makes the equation true. Students could use several different strategies to find a solution to the problem:
• Reasoning: 26 + 70 is 96 and 96 + 4 is 100, so the number added to 26 to get 100 is 74. • Use knowledge of fact families to write related equations: n + 26 = 100, • 100 - n = 26, 100 - 26 = n. Select the equation that helps to find n easily. • Use knowledge of inverse operations: Since subtraction “undoes” addition then subtract 26 from 100 to
get the numerical value of n • Scale model: There are 26 blocks on the left side of the scale and 100 blocks on the right side of the
scale. All the blocks are the same size. 74 blocks need to be added to the left side of the scale to make the scale balance.
• Bar Model: Each bar represents one of the values. Students use this visual representation to demonstrate that 26 and the unknown value together make 100.
Solution: Students recognize the value of 74 would make a true statement if substituted for the variable. 26 + n = 100 26 + 74 = 100 100 = 100 ✓

37
Example 2: The equation 0.44 s = 11 where s represents the number of stamps in a booklet. The booklet of stamps costs 11 dollars and each stamp costs 44 cents. How many stamps are in the booklet? Explain the strategies used to determine the answer. Show that the solution is correct using substitution. Solution: There are 25 stamps in the booklet. I got my answer by dividing 11 by 0.44 to determine how many groups of 0.44 were in 11. By substituting 25 in for s and then multiplying, I get 11. 0.44(25) = 11 11 = 11 ✓ Example 3: Twelve is less than 3 times another number can be shown by the inequality 12 < 3n. What numbers could possibly make this a true statement? Solution: Since 3 • 4 is equal to 12 I know the value must be greater than 4. Any value greater than 4 will make the
inequality true. Possibilities are 4.13, 6, 5!!, and 200. Given a set of values, students identify the values that make
the inequality true.

38
Expressions and Equations 6.EE Reason about and solve one-variable equations and inequalities. 6.EE.6 Use variables to represent numbers and write expressions when solving a real-world or mathematical problem; understand that a variable can represent an unknown number, or, depending on the purpose at hand, any number in a specified set.
I Can… • Use variables to represent unknown numbers. • Write variable expressions when solving real-world and mathematical problems. • Solve a variable expression using substitution in a real-world situation.
5th Grade 7th Grade Use simple expressions to describe the relationships between numbers and/or variables. (Ex: “2 less than a number” could be written as “x – 2”). (5.OA.2)
Rewrite an expression in an equivalent form in order to provide insight about how quantities are related in a problem context. (7.EE.2)
Examples 6.EE.6. Students write expressions to represent various real-world situations. Example Set 1:
• Write an expression to represent Susan’s age in three years, when a represents her present age. • Write an expression to represent the number of wheels, w, on any number of bicycles. • Write an expression to represent the value of any number of quarters, q.
Solutions:
• a + 3 • 2n • 0.25q
Given a contextual situation, students define variables and write an expression to represent the situation. Example 2: The skating rink charges $100 to reserve the place and then $5 per person. Write an expression to represent the cost for any number of people. n = the number of people 100 + 5n No solving is expected with this standard; however, 6.EE.2c does address the evaluating of the expressions. Students understand the inverse relationships that can exist between two variables. For example, if Sally has 3
times as many bracelets as Jane, then Jane has !! the amount of Sally. If S represents the number of bracelets
Sally has, the !!𝑠 or !
! represents the amount Jane has.
Connecting writing expressions with story problems and/or drawing pictures will give students a context for this work. It is important for students to read algebraic expressions in a manner that reinforces that the variable represents a number.

39
Example Set 3:
• Maria has three more than twice as many crayons as Elizabeth. Write an algebraic expression to represent the number of crayons that Maria has.
Solution: 2c + 3 where c represents the number of crayons that Elizabeth has
• An amusement park charges $28 to enter and $0.35 per ticket. Write an algebraic expression to represent the total amount spent.
Solution: 28 + 0.35t where t represents the number of tickets purchased
• Andrew has a summer job doing yard work. He is paid $15 per hour and a $20 bonus when he completes the yard. He was paid $85 for completing one yard. Write an equation to represent the amount of money he earned.
Solution: 15h + 20 = 85 where h is the number of hours worked
• Describe a problem situation that can be solved using the equation 2c + 3 = 15; where c represents the cost of an item
Possible solution: Sarah spent $15 at a craft store.
• She bought one notebook for $3. • She bought 2 paintbrushes for x dollars.
If each paintbrush cost the same amount, what was the cost of one brush?
• Bill earned $5.00 mowing the lawn on Saturday. He earned more money on Sunday. Write an expression that shows the amount of money Bill has earned.
• Solution: $5.00 + n

40
Expressions and Equations 6.EE Reason about and solve one-variable equations and inequalities. 6.EE.7 Solve real-world and mathematical problems by writing and solving equations of the form x + p = q and px = q for cases in which p, q and x are all nonnegative rational numbers.
I Can… • Define inverse operations. • Use inverse operations to solve one variable equations with nonnegative rational numbers. • Write mathematical equations for real-world situations using nonnegative rational numbers. • Solve mathematical equations for real-world situations using nonnegative rational numbers.
5th Grade 7th Grade None – This skill is introduced in 6th grade. Solve one-step, two-step, and multi-step equations to
include distributive property in both mathematical and real-world contexts. (7.EE.4a)
Examples 6.EE.7 Students have used algebraic expressions to generate answers given values for the variable. This understanding is now expanded to equations where the value of the variable is unknown but the outcome is known. For example, in the expression, x + 4, any value can be substituted for the x to generate a numerical answer; however, in the equation x + 4 = 6, there is only one value that can be used to get a 6. Problems should be in context when possible and use only one variable. Students write equations from real-world problems and then use inverse operations to solve one-step equations based on real world situations. Equations may include fractions and decimals with non-negative solutions.
Students recognize that dividing by 6 and multiplying by !! produces the same result. For example, !
! = 9 and !
!x =
9 will produce the same result. Beginning experiences in solving equations require students to understand the meaning of the equation and the solution in the context of the problem. Example 1: Meagan spent $56.58 on three pairs of jeans. If each pair of jeans costs the same amount, write an algebraic equation that represents this situation and solve to determine how much one pair of jeans cost.

41
Sample Solution: Students might say: “I created the bar model to show the cost of the three pairs of jeans. Each bar labeled T is the same size because each pair of jeans costs the same amount of money. The bar model represents the equation 3T = $56.58. To solve the problem, I need to divide the total cost of 56.58 between the three pairs of jeans. I know that it will be more than $10 each because 10 x 3 is only 30 but less than $20 each because 20 x 3 is 60. If I start with $15 each, I am up to $45. I have $11.58 left. I then give each pair of jeans $3. That’s $9 more dollars. I only have $2.58 left. I continue until all the money is divided. I ended up giving each pair of jeans another $0.86. Each pair of jeans costs $18.86 (15+3+0.86). I double check that the jeans cost $18.86 each because $18.86 x 3 is $56.58.” Example 2: Julie gets paid $20 for babysitting. She spends $1.99 on a package of trading cards and $6.50 on lunch. Write and solve an equation to show how much money Julie has left.
Solution: 20 = 1.99 + 6.50 + x, x = $11.51

42
Expressions and Equations 6.EE Reason about and solve one-variable equations and inequalities. 6.EE.8 Write an inequality of the form x > c or x < c to represent a constraint or condition in a real-world or mathematical problem. Recognize that inequalities of the form x > c or x < c have infinitely many solutions; represent solutions of such inequalities on number line diagrams.
I Can… • Write an inequality based on a number line. • Graph solutions to inequalities. • Represent possible solutions to inequalities. • Justify that there are infinite solutions to an inequality.
5th Grade 7th Grade None – This skill is introduced in 6th grade. Solve and graph one-step, two-step, and multi-step
inequalities to include distributive property in both mathematical and real-world contexts. (7.EE.4b)
Examples 6.EE.8 Many real-world situations are represented by inequalities. Students write inequalities to represent real world and mathematical situations. Students use the number line to represent inequalities from various contextual and mathematical situations. Example 1: The class must raise at least $100 to go on the field trip. They have collected $20. Write an inequality to represent the amount of money, m, the class still needs to raise. Represent this inequality on a number line. Solution: The inequality m ≥ $80 represents this situation. Students recognize that possible values can include too many decimal values to name. Therefore, the values are represented on a number line by shading.
A number line diagram is drawn with an open circle when an inequality contains a < or > symbol to show solutions that are less than or greater than the number but not equal to the number. The circle is shaded, as in the example above, when the number is to be included. Students recognize that possible values can include fractions and decimals, which are represented on the number line by shading. Shading is extended through the arrow on a number line to show that an inequality has an infinite number of solutions. Example 2: Graph x ≤ 4. Example 3: The Flores family spent less than $200.00 last month on groceries. Write an inequality to represent this amount and graph this inequality on a number line. Solution: 200 > x, where x is the amount spent on groceries.

43
Expressions and Equations 6.EE Represent and analyze quantitative relationships between dependent and independent variables. 6.EE.9 Use variables to represent two quantities in a real-world problem that change in relationship to one another; write an equation to express one quantity, thought of as the dependent variable, in terms of the other quantity, thought of as the independent variable. Analyze the relationship between the dependent and independent variables using graphs and tables, and relate these to the equation. For example, in a problem involving motion at constant speed, list and graph ordered pairs of distances and times, and write the equation d = 65t to represent the relationship between distance and time.
I Can… • Define independent and dependent variables. • Use variables to represent two different quantities in a real-world problem that change in relationship to one
another. • Complete a function table for a real-world situation that uses variables. • Create a function table for a real-world situation that uses variables. • Create a graph that represents two different quantities from a function table. • Write equations for a given function table. • Analyze the relationship between the dependent and independent variables.
5th Grade 7th Grade Generate 2 numerical patterns using 2 given rules. Describe relationships within numerical patterns and between numerical patterns. (5.OA.3)
Translate a real world situation into an equation and create a table to demonstrate proportionality. (7.RP.2c)
Examples 6.EE.9 The purpose of this standard is for students to understand the relationship between two variables, which begins with the distinction between dependent and independent variables. The independent variable is the variable that can be changed; the dependent variable is the variable that is affected by the change in the independent variable. Students recognize that the independent variable is graphed on the x-axis; the dependent variable is graphed on the y-axis. Students recognize that not all data should be graphed with a line. Data that is discrete would be graphed with coordinates only. Discrete data is data that would not be represented with fractional parts such as people, tents, records, etc. For example, a graph illustrating the cost per person would be graphed with points since part of a person would not be considered. A line is drawn when both variables could be represented with fractional parts. Students are expected to recognize and explain the impact on the dependent variable when the independent variable changes (As the x variable increases, how does the y variable change?) Relationships should be proportional with the line passing through the origin. Additionally, students should be able to write an equation from a word problem and understand how the coefficient of the dependent variable is related to the graph and /or a table of values. Students can use many forms to represent relationships between quantities. Multiple representations include describing the relationship using language, a table, an equation, or a graph. Translating between multiple representations helps students understand that each form represents the same relationship and provides a different perspective.

44
Example 1: What is the relationship between the two variables? Write an expression that illustrates the relationship.
Solution: y = 2.5x

45
Geometry 6.G Solve real-world and mathematical problems involving area, surface area, and volume. 6.G.1 Find the area of right triangles, other triangles, special quadrilaterals, and polygons by composing into rectangles or decomposing into triangles and other shapes; apply these techniques in the context of solving real-world and mathematical problems.
I Can… • Discuss, develop, apply and justify formulas for triangles. • Discuss, develop, apply and justify formulas for parallelograms. • Apply the techniques of composing and/or decomposing to find the area of triangles, special quadrilaterals
and polygons to solve mathematical and real world situations, (complex figures).
5th Grade 7th Grade Apply the formula for area of a rectangle to solve real world and mathematical problems using an unknown factor (variable). (4.MD4)
Recall and deconstruct the formulas for volume, area, and surface area of two-and three-dimensional objects composed of triangles, quadrilaterals, polygons, cubes, and right prisms. (7.G.6)
Examples 6.G.1 Students continue to understand that area is the number of squares needed to cover a plane figure. Students should know the formulas for rectangles and triangles. “Knowing the formula” does not mean memorization of the formula. To “know” means to have an understanding of why the formula works and how the formula relates to the measure (area) and the figure. This understanding should be for all students. Finding the area of triangles is introduced in relationship to the area of rectangles – a rectangle can be decomposed into two congruent triangles. Therefore, the area of the triangle is ½ the area of the rectangle. The area of a rectangle can be found by multiplying base x height; therefore, the area of the triangle is ½ bh or (b x h)/2. The following site helps students to discover the area formula of triangles. http://illuminations.nctm.org/LessonDetail.aspx?ID=L577 Students decompose shapes into rectangles and triangles to determine the area. For example, a trapezoid can be decomposed into triangles and rectangles (see figures below). Using the trapezoid’s dimensions, the area of the individual triangle(s) and rectangle can be found and then added together. Special quadrilaterals include rectangles, squares, parallelograms, trapezoids, and rhombi.
Note: Students recognize the marks on the isosceles trapezoid indicating the two sides have equal measure.

46
Example 1: Find the area of a right triangle with a base length of three units, a height of four units, and a hypotenuse of 5. Solution: Students understand that the hypotenuse is the longest side of a right triangle. The base and height would form the 90 degree angle and would be used to find the area using:
A = !!
bh
A = !! (3 units)(4 units)
A = !!12 units2
A = 6 units2
Example 2: Find the area of the trapezoid shown below using the formulas for rectangles and triangles.
Solution: The trapezoid could be decomposed into a rectangle with a length of 7 units and a height of 3 units. The area of the rectangle would be 21 units2. The triangles on each side would have the same area. The height of the triangles is 3 units. After taking away the middle rectangle’s base length, there are a total of 5 units remaining for both of the side triangles. The base length of each triangle is half of 5. The base of each triangle is 2.5 units. The area of one triangle would be ½ (2.5 units)(3 units) or 3.75 units2. Using this information, the area of the trapezoid would be: 21 units2 3.75 units2 +3.75 units2 28.5 units2 Example 3: A rectangle measures 3 inches by 4 inches. If the lengths of each side double, what is the effect on the area? Solution: The new rectangle would have side lengths of 6 inches and 8 inches. The area of the original rectangle was 12 inches2. The area of the new rectangle is 48 inches2. The area increased 4 times (quadrupled). Students may also create a drawing to show this visually.

47
Example 4: The lengths of the sides of a bulletin board are 4 feet by 3 feet. How many index cards measuring 4 inches by 6 inches would be needed to cover the board? Solution: Change the dimensions of the bulletin board to inches (4 feet = 48 inches; 3 feet = 36 inches). The area of the board would be 48 inches x 36 inches or 1728 inches2. The area of one index card is 12 inches2. Divide 1728 inches2 by 24 inches2 to get the number of index cards. 72 index cards would be needed. Example 5: The sixth grade class at Hernandez School is building a giant wooden H for their school. The “H” will be 10 feet tall and 10 feet wide and the thickness of the block letter will be 2.5 feet. 1. How large will the H be if measured in square feet? 2. The truck that will be used to bring the wood from the lumberyard to the school can only hold a piece of wood that is 60 inches by 60 inches. What pieces of wood (how many and which dimensions) will need to be bought to complete the project?
Solution: 1. One solution is to recognize that, if filled in, the area would be 10 feet tall and 10 feet wide or 100 ft2. The size of one piece removed is 5 feet by 3.75 feet or 18.75 ft. There are two of these pieces. The area of the “H” would be 100 ft2 – 18.75 ft2 – 18.75 ft2, which is 62.5ft2. A second solution would be to decompose the “H” into two tall rectangles measuring 10 ft by 2.5 ft and one smaller rectangle measuring 2.5 ft by 5 ft. The area of each tall rectangle would be 25 ft2 and the area of the smaller rectangle would be 12.5 ft2. Therefore the area of the “H” would be 25 ft2 + 25 ft2 + 12.5 ft2 or 62.5ft2. 2. Sixty inches is equal to 5 feet, so the dimensions of each piece of wood are 5ft by 5ft. Cut two pieces of wood in half to create four pieces 5 ft. by 2.5 ft. These pieces will make the two taller rectangles. A third piece would be cut to measure 5ft. by 2.5 ft. to create the middle piece. Example 6: A border that is 2 ft wide surrounds a rectangular flowerbed 3 ft by 4 ft. What is the area of the border? Solution: Two sides 4 ft. by 2 ft. would be 8ft2 x 2 or 16 ft2
Two sides 3 ft. by 2 ft. would be 6ft2 x 2 or 12 ft2
Four corners measuring 2 ft. by 2 ft. would be 4 ft2 x 4 or 16 ft2 The total area of the border would be 16 ft2 + 12 ft2 + 16 ft2 or 44 ft2

48
Geometry 6.G Solve real-world and mathematical problems involving area, surface area, and volume. 6.G.2 Find the volume of a right rectangular prism with fractional edge lengths by packing it with unit cubes of the appropriate unit fraction edge lengths, and show that the volume is the same as would be found by multiplying the edge lengths of the prism. Apply the formulas V = l w h and V = b h to find volumes of right rectangular prisms with fractional edge lengths in the context of solving real-world and mathematical problems.
I Can… • Find the volume of a rectangular prism using unit cubes. • Find the volume of a rectangular prism using the formula 𝑉 = 𝑙 ∙ 𝑤 ∙ ℎ.
5th Grade 7th Grade Find the volume of a rectangular prism with whole- number side lengths by building it with unit cubes. Apply the formulas V = l x w x h and V = b x h to find volumes of rectangular prisms with whole number lengths in the context of real world problems. (5.MD.5)
Recall and deconstruct the formulas for volume, area, and surface area of two-and three-dimensional objects composed of triangles, quadrilaterals, polygons, cubes, and right prisms. (7.G.6)
Examples 6.G.2 Previously students calculated the volume of right rectangular prisms (boxes) using whole number edges. The use of models was emphasized as students worked to derive the formula V = Bh (5.MD.3, 5.MD.4, 5.MD.5) The unit cube was 1 x 1 x 1.
In 6th grade the unit cube will have fractional edge lengths. (ie. !! • !
! • !
!) Students find the volume of the right
rectangular prism with these unit cubes. Students need multiple opportunities to measure volume by filling rectangular prisms with blocks and looking at the relationship between the total volume and the area of the base. Through these experiences, students derive the volume formula (volume equals the area of the base times the height). Students can explore the connection between filling a box with unit cubes and the volume formula using interactive applets such as the Cubes Tool on NCTM’s Illuminations (http://illuminations.nctm.org/ActivityDetail.aspx?ID=6). In addition to filling boxes, students can draw diagrams to represent fractional side lengths, connecting with multiplication of fractions. This process is similar to composing and decomposing two-dimensional shapes. Example 1:
A right rectangular prism has edges of 1!!”, 1” and 1!
!”. How many cubes with side lengths of . ” would be
needed to fill the prism? What is the volume of the prism? Solution:
The numbers of !!" cubes can be found by recognizing the smaller cubes would be !
!” on all edges, changing the
dimensions to !!", !
!", and !
!". The number of one-fourth inch unit cubes making up the prism is 120 (5 x 4 x 6).
Each smaller cube has a volume of !!"
!!"× !
!"× !
!" , meaning 64 small cubes would make up the unit cube.
Therefore, the volume is !!× !!× !! or !"#
!" (120 smaller cubes with volumes of !
!") or 1!"
!"→ 1 unit cube with 56
smaller cubes with a volume of !!"
.

49
Example 2: The model shows a cubic foot filled with cubic inches. The cubic inches can also be labeled as a fractional cubic
unit with dimensions of !!"
ft3.
Example 3:
The model shows a rectangular prism with dimensions !!, !!, and !
! inches. Each of the cubic units in the model is
!!in. on each side. Students work with the model to illustrate !
!× !!× !!= 3 × 5 × 5 × !
!. Students reason that a
small cube has volume of !! in3 because 8 of them fit in a unit cube.

50
Geometry 6.G Solve real-world and mathematical problems involving area, surface area, and volume. 6.G.3 Draw polygons in the coordinate plane given coordinates for the vertices; use coordinates to find the length of a side joining points with the same first coordinate or the same second coordinate. Apply these techniques in the context of solving real-world and mathematical problems.
I Can… • Construct polygons in the coordinate plane given the coordinates for the vertices in real-world and
mathematical problems. • Use given coordinates to find the length of a side joining points with the same first coordinates in real-world
and mathematical problems.
5th Grade 7th Grade Represent real world and mathematical problems by graphing points in Quadrant 1 on the coordinate plane. (5.G.2)
The coordinate system is not covered in 7th grade, but is a fundamental skill for students to know in 8th grade.
Examples 6.G.3 Students are given the coordinates of polygons to draw in the coordinate plane. If both x-coordinates are the same (2, -1) and (2, 4), then students recognize that a vertical line has been created and the distance between these coordinates is the distance between -1 and 4, or 5. If both the y-coordinates are the same (-5, 4) and (2, 4), then students recognize that a horizontal line has been created and the distance between these coordinates is the distance between -5 and 2, or 7. Using this understanding, student solve real-world and mathematical problems, including finding the area and perimeter of geometric figures drawn on a coordinate plane. This standard can be taught in conjunction with 6.G.1 to help students develop the formula for the triangle by using the squares of the coordinate grid. Given a triangle, students can make the corresponding square or
rectangle and realize the triangle is !!.
Students progress from counting the squares to making a rectangle and recognizing the triangle as !! to the
development of the formula for the area of a triangle. Example 1: If the points on the coordinate plane below are the three vertices of a rectangle, what are the coordinates of the fourth vertex? How do you know? What are the length and width of the rectangle? Find the area and the perimeter of the rectangle.

51
Solution: To determine the distance along the x-axis between the point (-4, 2) and (2, 2) a student must recognize that -4 is|-4| or 4 units to the left of 0 and 2 is |2| or 2 units to the right of zero, so the two points are total of 6 units apart along the x-axis. Students should represent this on the coordinate grid and numerically with an absolute value expression, |-4| + |2|. The length is 6 and the width is 5. The fourth vertex would be (2, -3). The area would be 5 x 6 or 30 units2. The perimeter would be 5 + 5 + 6 + 6 or 22 units. Example 2: On a map, the library is located at (-2, 2), the city hall building is located at (0,2), and the high school is located at (0,0). Represent the locations as points on a coordinate grid with a unit of 1 mile.
1. What is the distance from the library to the city hall building? The distance from the city hall building to the high school? How do you know?
2. What shape does connecting the three locations form? The city council is planning to place a city park in this area. How large is the area of the planned park?
Solution:
1. The distance from the library to city hall is 2 miles. The coordinates of these buildings have the same y-coordinate. The distance between the x-coordinates is 2 (from -2 to 0).
2. The three locations form a right triangle. The area is 2 mi2.

52
Geometry 6.G Solve real-world and mathematical problems involving area, surface area, and volume. 6.G.4 Represent three-dimensional figures using nets made up of rectangles and triangles, and use the nets to find the surface area of these figures. Apply these techniques in the context of solving real-world and mathematical problems.
I Can… • Construct a net of three-dimensional figures made up of rectangles and triangles. • Apply knowledge of calculating the area of rectangles and triangles to a net and combine the areas for each
shape into one answer representing the surface area of a 3-d figure. • Solve real-world and mathematical problems involving surface area using nets.
5th Grade 7th Grade None – This skill is introduced in 6th grade. Recall and deconstruct the formulas for volume, area,
and surface area of two-and three-dimensional objects composed of triangles, quadrilaterals, polygons, cubes, and right prisms. (7.G.6)
Examples 6.G.4 A net is a two-dimensional representation of a three-dimensional figure. Students represent three-dimensional figures whose nets are composed of rectangles and triangles. Students recognize that parallel lines on a net are congruent. Using the dimensions of the individual faces, students calculate the area of each rectangle and/or triangle and add these sums together to find the surface area of the figure. Students construct models and nets of three-dimensional figures, describing them by the number of edges, vertices, and faces. Solids include rectangular and triangular prisms. Students are expected to use the net to calculate the surface area. Students can create nets of 3D figures with specified dimensions using the Dynamic Paper Tool on NCTM’s Illuminations (http://illuminations.nctm.org/ActivityDetail.aspx?ID=205). Students also describe the types of faces needed to create a three-dimensional figure. Students make and test conjectures by determining what is needed to create a specific three-dimensional figure. Example 1: Describe the shapes of the faces needed to construct a rectangular pyramid. Cut out the shapes and create a model. Did your faces work? Why or why not? Example 2: Create the net for a given prism or pyramid, and then use the net to calculate the surface area.

53
Statistics and Probability 6.SP Develop understanding of statistical variability. 6.SP.1 Recognize a statistical question as one that anticipates variability in the data related to the question and accounts for it in the answers. For example, "How old am I?" is not a statistical question, but "How old are the students in my school?" is a statistical question because one anticipates variability in students' ages.
I Can… • Distinguish between a statistical question and a non-statistical question. • Recognize that data can have variability.
5th Grade 7th Grade Create a line plot to display data set of measurements and fractions of a unit. (5.MD.2)
Recognize statistics terms such as population, sample, sample size, random sampling, generalizations, valid, biased, and unbiased. (7.SP.1)
Examples 6.SP.1 Statistics are numerical data relating to a group of individuals; statistics is also the name for the science of collecting, analyzing and interpreting such data. A statistical question anticipates an answer that varies from one individual to the next and is written to account for the variability in the data. Data are the numbers produced in response to a statistical question. Data are frequently collected from surveys or other sources (i.e. documents). Students differentiate between statistical questions and those that are not. A statistical question is one that collects information that addresses differences in a population. The question is framed so that the responses will allow for the differences. For example, the question, “How tall am I?” is not a statistical question because there is only one response; however, the question, “How tall are the students in my class?” is a statistical question since the responses anticipates variability by providing a variety of possible anticipated responses that have numerical answers. Questions can result in a narrow or wide range of numerical values. Students might want to know about the fitness of the students at their school. Specifically, they want to know about the exercise habits of the students. So rather than asking "Do you exercise?" they should ask about the amount of exercise the students at their school get per week. A statistical question for this study could be: “How many hours per week on average do students at Jefferson Middle School exercise?”

54
Statistics and Probability 6.SP Develop understanding of statistical variability. 6.SP.2 Understand that a set of data collected to answer a statistical question has a distribution that can be described by its center, spread, and overall shape.
I Can… • Describe data distribution by its center (median/mean). • Describe data distribution by its spread (range). • Describe data distribution by its clusters, peaks, gaps, symmetry, and overall shape (line plot).
5th Grade 7th Grade Create a line plot to display data set of measurements and fractions of a unit. (5.MD.2)
Identify measures of center and measures of variation. Compare two numerical data distributions on a graph and by measures. (7.SP.3)
Examples 6.SP.2 The distribution is the arrangement of the values of a data set. Distribution can be described using center (median or mean), and spread. Data collected can be represented on graphs, which will show the shape of the distribution of the data. Students examine the distribution of a data set and discuss the center, spread and overall shape with dot plots, histograms and box plots. Example 1: The dot plot shows the writing scores for a group of students on organization. Describe the data.
Solution: The values range from 0 – 6. There is a peak at 3. The median is 3, which means 50% of the scores are greater than or equal to 3 and 50% are less than or equal to 3. The mean is 3.473. If all students scored the same, the score would be 3.50. NOTE: Mode as a measure of center and range as a measure of variability are not addressed in the CCSS and as such are not a focus of instruction. These concepts can be introduced during instruction as needed.

55
Statistics and Probability 6.SP Develop understanding of statistical variability. 6.SP.3 Recognize that a measure of center for a numerical data set summarizes all of its values with a single number, while a measure of variation describes how its values vary with a single number.
I Can… • Calculate the range, median, mean, and mode of a set of data. • Summarize a set a data using measures of central tendencies. • Describe the variability by examining graphs of data for spread and overall shape.
5th Grade 7th Grade None – This skill is introduced in 6th grade. Identify measures of center and measures of variation.
Compare two numerical data distributions on a graph and by measures. (7.SP.3)
Examples 6.SP.3 Data sets contain many numerical values that can be summarized by one number such as a measure of center. The measure of center gives a numerical value to represent the center of the data (ie. midpoint of an ordered list or the balancing point). Another characteristic of a data set is the variability (or spread) of the values. Measures of variability are used to describe this characteristic. Example 1: Consider the data shown in the dot plot of the six trait scores for organization for a group of students.
• How many students are represented in the data set? • What are the mean and median of the data set? What do these values mean? How do they compare? • What is the range of the data? What does this value mean?
Solution:
• 19 students are represented in the data set. • The mean of the data set is 3.5. The median is 3. The mean indicates that is the values were equally
distributed, all students would score a 3.5. The median indicates that 50% of the students scored a 3 or higher; 50% of the students scored a 3 or lower.
• The range of the data is 6, indicating that the values vary 6 points between the lowest and highest scores.

56
Statistics and Probability 6.SP Summarize and describe distributions. 6.SP.4 Display numerical data in plots on a number line, including dot plots, histograms, and box plots.
I Can… • Identify the components of dot plots, histograms, and box plots. • Find the median quartiles and interquartile range of a set of data. • Display numerical data on a number line. • Display numerical data on a histogram. • Display numerical data on a box-and-whisker plot.
5th Grade 7th Grade Create a line plot to display data set of measurements and fractions of a unit. (5.MD.2)
Identify measures of center and measures of variation. Compare two numerical data distributions on a graph and by measures. (7.SP.3)
Examples 6.SP.4 Students display data graphically using number lines. Dot plots, histograms and box plots are three graphs to be used. Students are expected to determine the appropriate graph as well as read data from graphs generated by others. Dot plots are simple plots on a number line where each dot represents a piece of data in the data set. Dot plots are suitable for small to moderate size data sets and are useful for highlighting the distribution of the data including clusters, gaps, and outliers. A histogram shows the distribution of continuous data using intervals on the number line. The height of each bar represents the number of data values in that interval. In most real data sets, there is a large amount of data and many numbers will be unique. A graph (such as a dot plot) that shows how many ones, how many twos, etc. would not be meaningful; however, a histogram can be used. Students group the data into convenient ranges and use these intervals to generate a frequency table and histogram. Note that changing the size of the bin changes the appearance of the graph and the conclusions may vary from it. A box plot shows the distribution of values in a data set by dividing the set into quartiles. It can be graphed either vertically or horizontally. The box plot is constructed from the five-number summary (minimum, lower quartile, median, upper quartile, and maximum). These values give a summary of the shape of a distribution. Students understand that the size of the box or whiskers represents the middle 50% of the data. Students can use applets to create data displays. Examples of applets include the Box Plot Tool and Histogram Tool on NCTM’s Illuminations. Box Plot Tool - http://illuminations.nctm.org/ActivityDetail.aspx?ID=77 Histogram Tool -- http://illuminations.nctm.org/ActivityDetail.aspx?ID=78 Example 1: Nineteen students completed a writing sample that was scored on organization. The scores for organization were 0,1, 2, 2, 3, 3, 3, 3, 3, 3, 4, 4, 4, 4, 5, 5, 5, 6, 6. Create a data display. What are some observations that can be made from the data display?
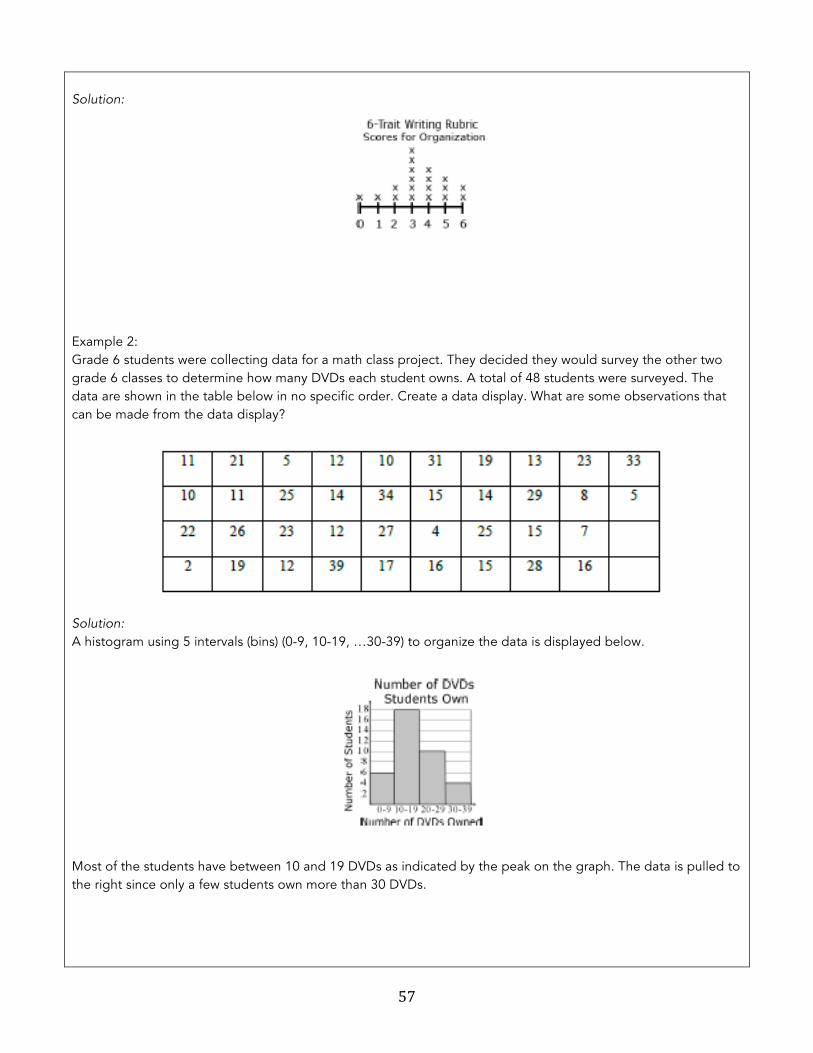
57
Solution:
Example 2: Grade 6 students were collecting data for a math class project. They decided they would survey the other two grade 6 classes to determine how many DVDs each student owns. A total of 48 students were surveyed. The data are shown in the table below in no specific order. Create a data display. What are some observations that can be made from the data display?
Solution: A histogram using 5 intervals (bins) (0-9, 10-19, …30-39) to organize the data is displayed below.
Most of the students have between 10 and 19 DVDs as indicated by the peak on the graph. The data is pulled to the right since only a few students own more than 30 DVDs.

58
Example 3: Ms. Wheeler asked each student in her class to write their age in months on a sticky note. The 28 students in the class brought their sticky note to the front of the room and posted them in order on the white board. The data set is listed below in order from least to greatest. Create a data display. What are some observations that can be made from the data display?
Solution: Five number summary Minimum – 130 months Quartile 1 (Q1) – (132 + 133) ÷ 2 = 132.5 months Median (Q2) – 139 months Quartile 3 (Q3) – (142 + 143) ÷ 2 = 142.5 months Maximum – 150 months
This box plot shows that
• !! of the students in the class are from 130 to 132.5 months old
• !! of the students in the class are from 142.5 months to 150 months old
• !! of the class are from 132.5 to 142.5 months old
• The median class age is 139 months.

59
Statistics and Probability 6.SP Summarize and describe distributions. 6.SP.5 Summarize numerical data sets in relation to their context, such as by: a) Reporting the number of observations. b) Describing the nature of the attribute under investigation, including how it was measured and its units of
measurement. c) Giving quantitative measures of center (median and/or mean) and variability (interquartile range and/or
mean absolute deviation), as well as describing any overall pattern and any striking deviations from the overall pattern with reference to the context in which the data were gathered.
d) Relating the choice of measures of center and variability to the shape of the data distribution and the context in which the data were gathered.
I Can… • Organize and display data in tables and graphs. • Summarize numerical data sets by reporting the number of observations in a data set or display.
5th Grade 7th Grade None – This skill is introduced in 6th grade. Identify measures of center and measures of variation.
Compare two numerical data distributions on a graph and by measures. (7.SP.3)
Examples 6.SP.5 Students summarize numerical data by providing background information about the attribute being measured, methods and unit of measurement, the context of data collection activities (addressing random sampling), the number of observations, and summary statistics. Summary statistics include quantitative measures of center (median and median) and variability (interquartile range and mean absolute deviation) including extreme values (minimum and maximum), mean, median, mode, range, and quartiles. Students record the number of observations. Using histograms, students determine the number of values between specified intervals. Given a box plot and the total number of data values, students identify the number of data points that are represented by the box. Reporting of the number of observations must consider the attribute of the data sets, including units (when applicable). Measures of Center Given a set of data values, students summarize the measure of center with the median or mean. The median is the value in the middle of a ordered list of data. This value means that 50% of the data is greater than or equal to it and that 50% of the data is less than or equal to it. The mean is the arithmetic average; the sum of the values in a data set divided by how many values there are in the data set. The mean measures center in the sense that it is the value that each data point would take on if the total of the data values were redistributed equally, and also in the sense that it is a balance point. Students develop these understandings of what the mean represents by redistributing data sets to be level or fair (equal distribution) and by observing that the total distance of the data values above the mean is equal to the total distance of the data values below the mean (balancing point). Students use the concept of mean to solve problems. Given a data set represented in a frequency table, students calculate the mean. Students find a missing value in a data set to produce a specific average.

60
Example 1: Susan has four 20-point projects for math class. Susan’s scores on the first 3 projects are shown below: Project 1: 18 Project 2: 15 Project 3: 16 Project 4: ?? What does she need to make on Project 4 so that the average for the four projects is 17? Explain your reasoning. Solution: One possible solution to is calculate the total number of points needed (17 x 4 or 68) to have an average of 17. She has earned 49 points on the first 3 projects, which means she needs to earn 19 points on Project 4 (68 – 49 = 19). Measures of Variability Measures of variability/variation can be described using the interquartile range or the Mean Absolute Deviation. The interquartile range (IQR) describes the variability between the middle 50% of a data set. It is found by subtracting the lower quartile from the upper quartile. It represents the length of the box in a box plot and is not affected by outliers. Students find the IQR from a data set by finding the upper and lower quartiles and taking the difference or from reading a box plot. Example 1: What is the IQR of the data below:
Solution: The first quartile is 132.5; the third quartile is 142.5. The IQR is 10 (142.5 – 132.5). This value indicates that the values of the middle 50% of the data vary by 10. Mean Absolute Deviation (MAD) describes the variability of the data set by determining the absolute deviation (the distance) of each data piece from the mean and then finding the average of these deviations. Both the interquartile range and the Mean Absolute Deviation are represented by a single numerical value. Higher values represent a greater variability in the data.

61
Example 2: The following data set represents the size of 9 families: 3, 2, 4, 2, 9, 8, 2, 11, 4. What is the MAD for this data set? Solution: The mean is 5. The MAD is the average variability of the data set. To find the MAD:
1. Find the deviation from the mean. 2. Find the absolute deviation for each of the values from step 1 3. Find the average of these absolute deviations.
The table below shows these calculations:
This value indicates that on average family size varies 2.89 from the mean of 5. Students understand how the measures of center and measures of variability are represented by graphical displays. Students describe the context of the data, using the shape of the data and are able to use this information to determine an appropriate measure of center and measure of variability. The measure of center that a student chooses to describe a data set will depend upon the shape of the data distribution and context of data collection. The mode is the value in the data set that occurs most frequently. The mode is the least frequently used as a measure of center because data sets may not have a mode, may have more than one mode, or the mode may not be descriptive of the data set. The mean is a very common measure of center computed by adding all the umbers in the set and dividing by the number of values. The mean can be affected greatly by a few data points that are very low or very high. In this case, the median or middle value of the data set might be more descriptive. In data sets that are symmetrically distributed, the mean and median will be very close to the same. In data sets that are skewed, the mean and median will be different, with the median frequently providing a better overall description of the data set.