Embed Size (px)
Citation preview

NEW TECHNOLOGIES TO DRIVE DRUG DISCOVERY AND DEVELOPMENT INTRODUCING NEXT GENERATION DECISION SUPPORT & INFORMATICS SOLUTIONS FOR LIFE SCIENCES COMPANIES

TURNING INFORMATION INTO INSIGHT IS DIFFICULT
• Content is hidden behind product
interfaces
• Different content sources are difficult to
combine and require time to curate
• Analyses tend to be either “one size fits all”
or so specific that they can’t be re-used
• The presentation of data often depends on
the skills and personal preferences of a
presenter

IDEALLY, INFORMATION IS…
• Relevant and timely
• Able to be combined with other data and/or internal
business logic
• Presented so it is natural for users to consume and
interact with it
• Possible to interrogate and evaluate
• Easily updated

CLINICAL DECISION SUPPORT NEW TECHNOLOGIES IN ACTION
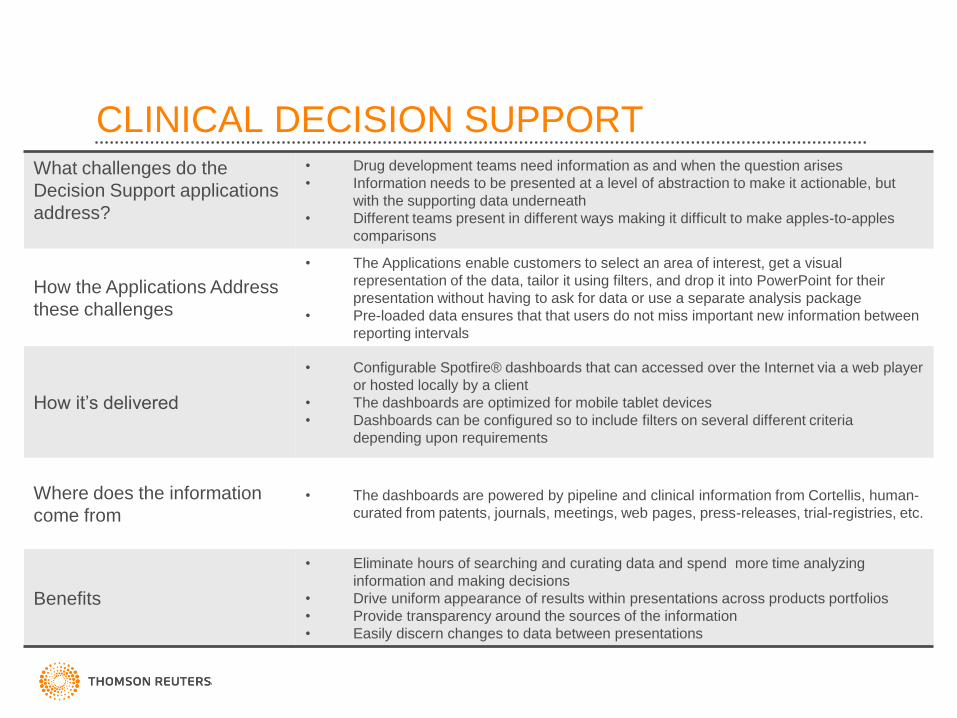
CLINICAL DECISION SUPPORT What challenges do the
Decision Support applications
address?
• Drug development teams need information as and when the question arises
• Information needs to be presented at a level of abstraction to make it actionable, but
with the supporting data underneath
• Different teams present in different ways making it difficult to make apples-to-apples
comparisons
How the Applications Address
these challenges
• The Applications enable customers to select an area of interest, get a visual
representation of the data, tailor it using filters, and drop it into PowerPoint for their
presentation without having to ask for data or use a separate analysis package
• Pre-loaded data ensures that that users do not miss important new information between
reporting intervals
How it’s delivered
• Configurable Spotfire® dashboards that can accessed over the Internet via a web player
or hosted locally by a client
• The dashboards are optimized for mobile tablet devices
• Dashboards can be configured so to include filters on several different criteria
depending upon requirements
Where does the information
come from • The dashboards are powered by pipeline and clinical information from Cortellis, human-
curated from patents, journals, meetings, web pages, press-releases, trial-registries, etc.
Benefits
• Eliminate hours of searching and curating data and spend more time analyzing
information and making decisions
• Drive uniform appearance of results within presentations across products portfolios
• Provide transparency around the sources of the information
• Easily discern changes to data between presentations

THE FIRST 5 CLINICAL DECISION SUPPORT APPLICATIONS – OPTIMISED FOR THE iPAD

TRIAL DURATION VIEWER
What questions does the
viewer answer?
• What is the timeline for drugs in clinical trials, by class of drug, indication,
company?
• What are the likely durations of trials in an indication by phase?
How is data selected? • Users can select data for a drug, indication or trial sponsor
What visualisations are
available?
• A GANTT-like timeline view including projected end dates when no sponsor
estimate is available
• A box-plot of trial durations for completed trials
What drill-downs are
available?
• All drug records have links to the records on Cortellis
• Summary information on the trial includes biomarkers, patient numbers, title &
references
Benefits • View the competitive landscape around a trial in progress
• Gain insight into the likely durations of clinical trials

TRIAL DURATION VIEWER – SELECTING WHAT TO VIEW
Search/br
owse by
indication,
sponsor
or drug
Link to Cortellis
Select a
visualization
Select a term

TRIAL DURATION VIEWER – THE TIMELINE VIEW
Navigation
controls
Details of
selected
trial(s)
Filtered to
P2-3 trials,
not
terminated,
sponsored
by drug
owner

TRIAL DURATION VIEWER – THE DURATIONS VIEW
outliers
Details of
selected
trial(s)
Variance in
trial
duration by
phase
Filters
allow, e.g.
looking at
impact of
patient
numbers

PORTFOLIO VIEWER
What questions does the
viewer answer?
• What is the competitive position of a drug in development?
How is data selected? • Users can select data for an action, company or indication
What visualisations are
available?
• A bubble chart landscape visualization that shows the “crowdedness” of the
competitive space
• A funnel visualization that shows the progress of drugs through the pipeline
• A visualization of the drug development history for one or more drugs
What drill-downs are
available? • All drug records have links to the records on Cortellis
• Status of the drug in all indications in all regulatory authorities
Benefits • View the competitive landscape for a drug
• Highlight recent changes in the competitive position

PORTFOLIO VIEWER – THE FUNNEL VIEW
Choose
drug labels
& colours
Details of
selected
drug(s)
Link to
Cortellis
Navigation
controls
Filtered to
exclude
withrawn,
suspended,
discontinued,
no
development
reported
drugs
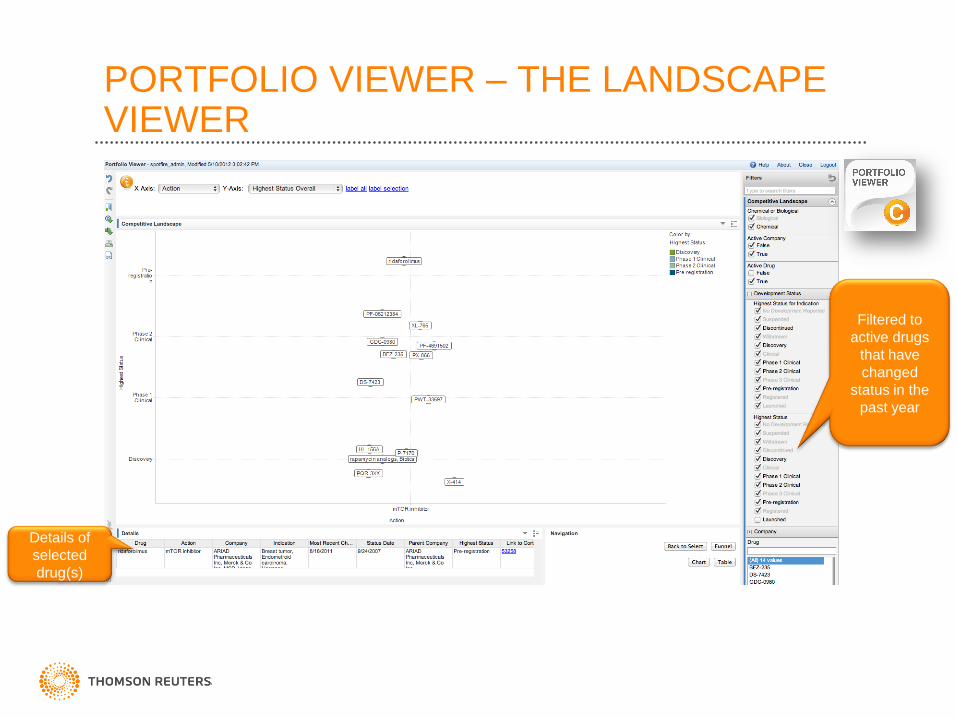
PORTFOLIO VIEWER – THE LANDSCAPE VIEWER
Details of
selected
drug(s)
Filtered to
active drugs
that have
changed
status in the
past year

PORTFOLIO VIEWER – THE DEVELOPMENT HISTORY CHART VIEW
Filtered to US
(FDA) events
Columns
show
status by
indication
& company
by country
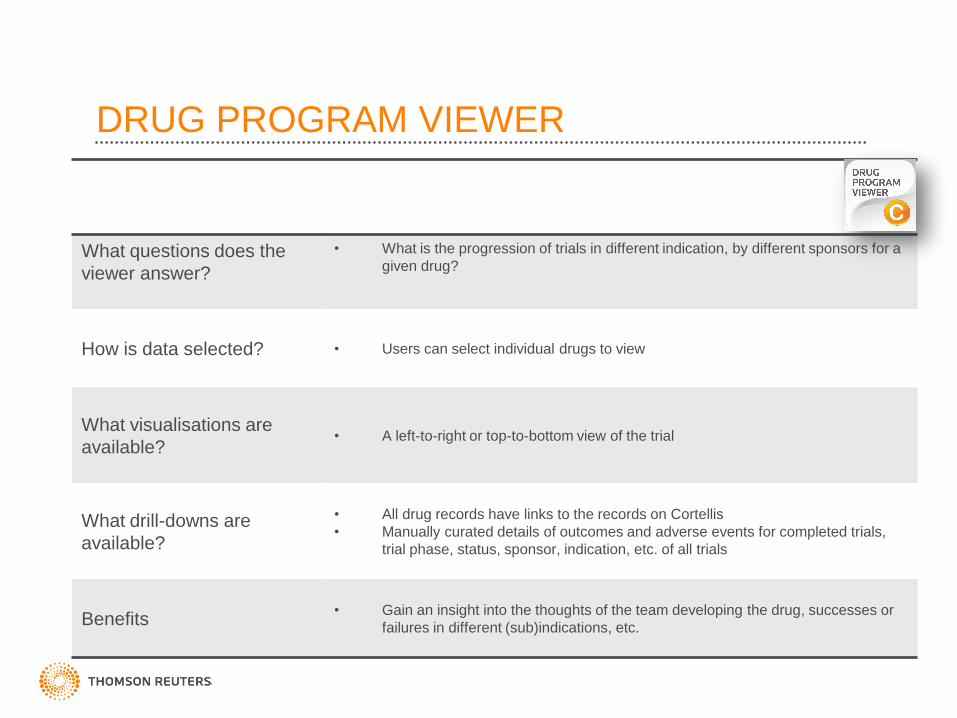
DRUG PROGRAM VIEWER
What questions does the
viewer answer?
• What is the progression of trials in different indication, by different sponsors for a
given drug?
How is data selected? • Users can select individual drugs to view
What visualisations are
available? • A left-to-right or top-to-bottom view of the trial
What drill-downs are
available?
• All drug records have links to the records on Cortellis
• Manually curated details of outcomes and adverse events for completed trials,
trial phase, status, sponsor, indication, etc. of all trials
Benefits • Gain an insight into the thoughts of the team developing the drug, successes or
failures in different (sub)indications, etc.

DRUG PROGRAM VIEWER – LEFT-TO-RIGHT (PERT) VIEW
Choose
labels &
colours
Filtered to
NSLC
Details of
selected
trial(s)

DRUG PROGRAM VIEWER– DETAILS VIEW

DISEASE AREA VIEWER
What questions does the
viewer answer?
• What segments in an indication are competitors going after?
How is data selected? • Users can select data for an indication from the Cortellis indication hierarchy
What visualisations are
available?
• A Pie-chart view of trials by phase showing unsegmented vs molecular-
segmented trials
• A bar chart of trials showing which segments have been looked at in trials
What drill-downs are
available?
• The statements made in the trial protocol that suggest that this trial is in a
segmented population
Benefits • View the actual competition for a targeted therapy as opposed to all the drugs in
this indication
• See the level of confidence in targeted subpopulations in an indication

DISEASE AREA VIEWER – SEGMENTS BY PHASE
Segments
by trials or
drugs
Evidence
for
segmentati
on

DRUG SAFETY VIEWER
What questions does the
viewer answer?
• What is the adverse event profile of a competitor drug disclosed in clinical trials?
How is data selected? • Users can select a set of drugs to compare by name or mechanism of action
What visualisations are
available? • A Heat Map showing the adverse events reported in trials by number of trials or
number of patients affected
What drill-downs are
available?
• All drug records have links to the records on Cortellis
• Status, Phase, Indications, title and a summary of the adverse events reported in
each trial
Benefits • Compare a number of drugs to aid in differentiating a drug from its competitors by
safety profile

DRUG SAFETY VIEWER – DRUG SELECTION
Search by
name or
action
Pick drugs
of interest
Manage list
of selected
drugs
Navigation
controls

DRUG SAFETY VIEWER – HEAT MAP VIEW
Choose
view
parameters
Details of
selected
trials

WEB SERVICES APIS NEW TECHNOLOGIES IN ACTION
WEB SERVICES APIs
• Industry-Standard way to make structured, “Deep
Web” content available to users
– Works through firewalls
– Many tools available to consume APIs
• Two common protocols, we support both
– REpresentional State Transfer (REST)
– Simple Object Access Protocol (SOAP)

API SUPPORT
• Support site at
http://developercenter.thomsonreuters.com
• Documentation
• Sample Code
• Tips & Tricks
• Support community

INVESTIGATIONAL DRUGS - SEARCH
Autocomplete getDrugResults
getCIMatrix
getTaxonomy
TopLevel
getCompanyResults,
getDealResults
Sample client built in Drupal (PHP, PERL)

INVESTIGATIONAL DRUGS - BROWSE
exportDrugResults getCompanyResults
getDiseaseResults
getDrugResults
getDrugRecord Sample client built in Drupal (PHP, PERL)

INVESTIGATIONAL DRUGS – FULL RECORD
Sample client built in Microsoft
SharePoint Web Parts (C#)

INVESTIGATIONAL DRUGS – CI MATRIX
Sample client built in Microsoft
SilverLight

TARGETS - SEARCH
Sample client built in Microsoft
SharePoint Web Parts (C#)
getTargetResults
getTaxonomy
TopLevel

TARGETS - BROWSE
getTargetRecord
Sample client built in Microsoft
SharePoint Web Parts (C#)

TARGETS - RESULTS
Sample client built in Drupal (PHP, PERL)
getReference
Record
getDrugRecord
getPatentRecord
Mash-up with
PDB API

TARGETS – DRUG RECORDS
Sample client built in Microsoft
SharePoint Web Parts (C#) & ChemAxon’s Marvin
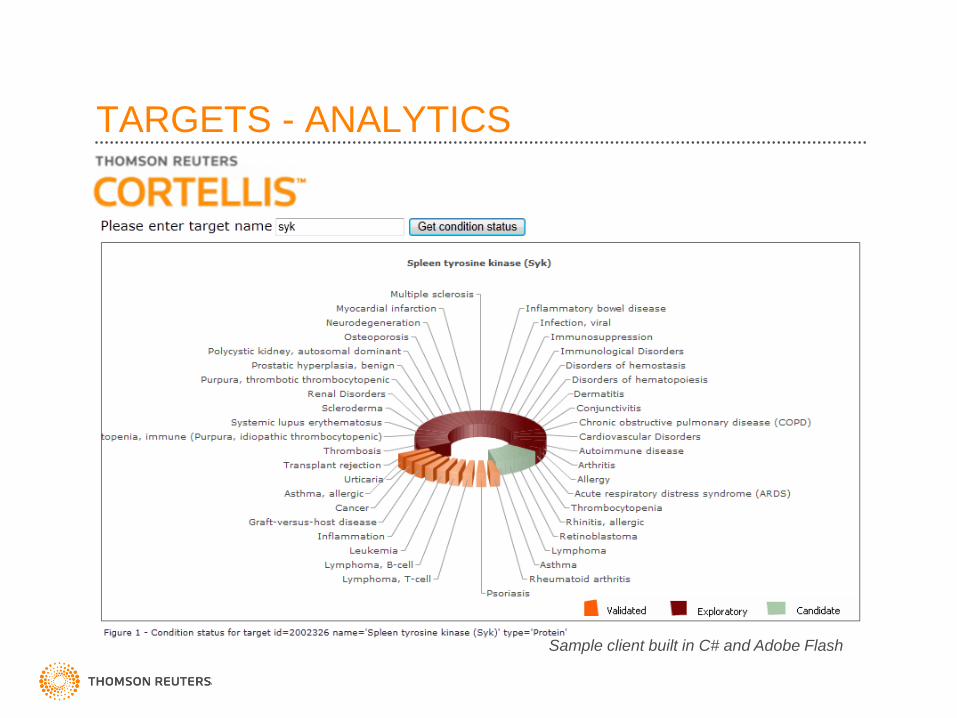
TARGETS - ANALYTICS
Sample client built in C# and Adobe Flash

ONTOLOGIES – TAXONOMY SEARCH/BROWSE
REST Call to browse the root terms: https://lsapi.thomson-
pharma.com/ws/rs/ontologies-v1/taxonomy/condition/root
Get the children of a node:
https://lsapi.thomson-
pharma.com/ws/rs/ontologies-
v1/taxonomy/condition/children/182
Search the entire tree: https://lsapi.thomson-pharma.com/ws/rs/ontologies-
v1/taxonomy/condition/search/arteriopathy?operationType=flat

ONTOLOGIES – SYNONYM RESOLUTION https://lsapi.thomson-pharma.com/ws/rs/ontologies-v1/synonyms/drug/cele

PATENTS – SEARCH & RETRIEVE RESULTS
getPatentResults
SSQL query
language
Sample client built in Microsoft
SharePoint Web Parts (C#)

PATENT – DETAILED RECORD
exportPatentResults
Sample client built in Microsoft
SharePoint Web Parts (C#)

CLINICAL – SEARCH & RETRIEVE RESULTS
getTrialResults
getTrialRecord
Sample client built in Microsoft
SharePoint Web Parts (C#)

CLINICAL – DETAILED TRIAL RECORD
exportTrialResults
Sample client built in Microsoft
SharePoint Web Parts (C#)
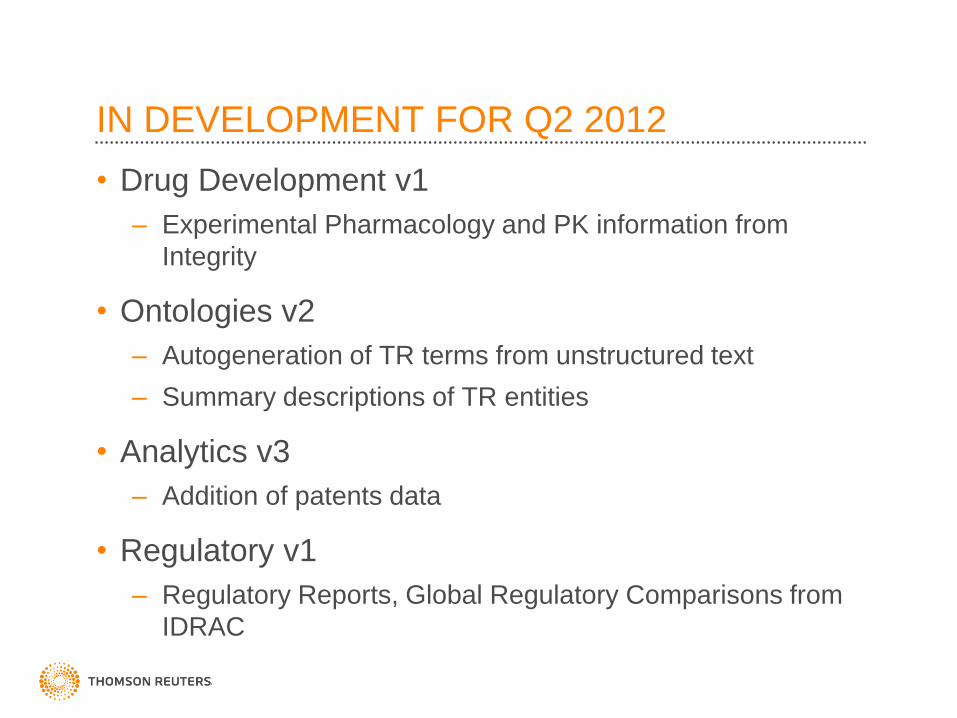
IN DEVELOPMENT FOR Q2 2012
• Drug Development v1
– Experimental Pharmacology and PK information from
Integrity
• Ontologies v2
– Autogeneration of TR terms from unstructured text
– Summary descriptions of TR entities
• Analytics v3
– Addition of patents data
• Regulatory v1
– Regulatory Reports, Global Regulatory Comparisons from
IDRAC

API ROADMAP
Q1 Q2 Q3 Q4 2013
Investigational
Drugs
V3 Structure Search,
Integrated
Deals/Drugs/Companies
Targets V3 Structure Search
Ontologies V2 Auto indexing V3 New mappings V4 MetaCore
Analytics V2 Trials V3 Patents
Patents V1 V2 Extended
Drug Design V1 Core Drugs, PK/PD
& Exp. Pharm.
V2 Structure Search
DMPK & Property
Calculation
Clinical V1 Trials V2 Literature, Meetings V3 Biomarkers
Regulatory V1 Regulatory Reports
& Comparisons
Omics V1 Pathways
Omics
Analytics
V1 List processing
News V1 Cortellis News
Generics V1

PARTNERSHIP ECOSYSTEM
“To enable better decision making for our customers by making Thomson
Reuters knowledge available at the point of need.”
Thomson Reuters’ content should be seamlessly integrated into our clients
work flow at the point where it adds most value.
Relevant knowledge should be presented at the pertinent time clearing the way
for our clients to make more informed decisions.

PARTNERSHIP ECOSYSTEM

PIPELINE PILOT COMPONENTS - TARGETS

DRUG TARGET REPORT – SAMPLE PROTOCOL


• Show me all targets associated with both the Activated Toll-like
Receptor 4 Signaling pathway and Amyloidosis and then all
compounds which are inhibitors of those targets
TripleMap

IDBS ELECTRONIC LAB NOTEBOOK
Integrating biology, chemistry and pharmacology data on more than 320,000 compounds
with demonstrated biological activity and almost 140,000 patent family records

IDBS ELECTRONIC LAB NOTEBOOK

INFORSENSE WORKFLOWS

KNIME – COMING SOON!
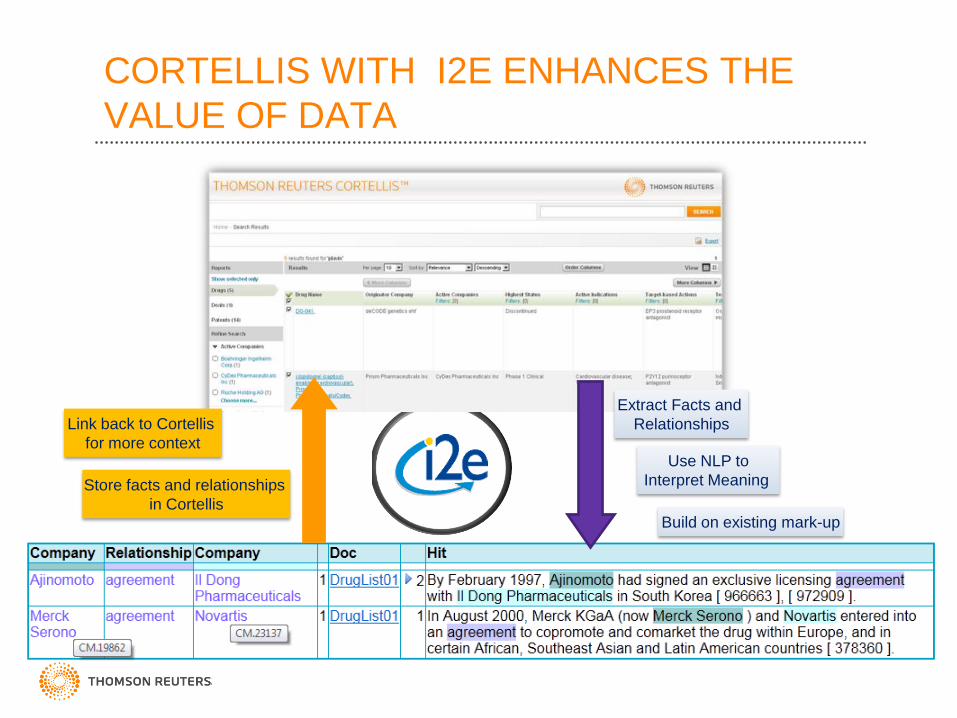
Extract Facts and
Relationships
Use NLP to
Interpret Meaning
Link back to Cortellis
for more context
Store facts and relationships
in Cortellis Build on existing mark-up
CORTELLIS WITH I2E ENHANCES THE
VALUE OF DATA

SEARCH GENIUS FOR SHAREPOINT™
• SharePoint is the market leading document management system for storing loose document records:
however, it lacks structure searching capability
• E-Notebook is the market leading electronic notebook, capturing a variety of scientific workflows but
often capturing extensive chemical reaction information
• SearchGenius For SharePoint™ provides chemical searching capability for SharePoint and federated
searching across SharePoint, E-Notebook, Thomson Reuters Cortellis and the web