Embed Size (px)
Citation preview
September 2011
New Technologies in Pre-K to Grade 3 Needs Assessment
Submitted to: The Corporation for Public Broadcasting (CPB)
The Public Broadcasting Service (PBS)
Submitted by: Betsy McCarthy, Ph.D.
Danielle YumolJohn Rice, Ph.D.
Jonathan Nakamoto, Ph.D. Armando Tafoya
Sara AtienzaLisa Michel
Sharon HerpinChris Harrison, Ed.D.Jennifer Mullin, Ph.D.

CONTENTS
Highlights of the Findings ............................................................................................... 1
Executive Summary ......................................................................................................... 2Research Method ......................................................................................................................... 2
Needs Assessment 1: Methods for Communicating with Parents of PK-3 Children ...................................................................................................................... 3
Needs Assessment 2: Access to and Capacity for Interactive Whiteboard Technology in PK-3 Schools and Programs ............................................................. 3
Needs Assessment 3: Access to and Capacity for Other Technologies in PK–3 Schools and Programs ......................................................................................... 3
Findings ...........................................................................................................................................4
Findings About Methods for Communicating with Parents of PK-3 Children .................................................................................................................................4
Findings About Access to and Capacity for Interactive Whiteboard Technology in PK-3 Schools and Programs ............................................................. 5
Findings About Access to and Capacity for Other Technologies in PK-3 Schools and Programs ..........................................................................................6
Conclusions .................................................................................................................................... 7
Interest in Using More Technology in PK-3 Classrooms ..................................... 8
Potential Areas for Content Development .............................................................. 8
Areas of Challenge ............................................................................................................9
Recommendations ..................................................................................................................... 10
Introduction .................................................................................................................... 11Overview of the Study ...............................................................................................................11
Needs Assessment 1: Methods for Communicating with Parents of PK-3 Children .....................................................................................................................12
Needs Assessment 2: Access to and Capacity for Interactive Whiteboard Technology in PK-3 Schools and Programs ...................................12
Needs Assessment 3: Access to and Capacity for Other Technologies in PK-3 Schools and Programs ....................................................................................12

Method .............................................................................................................................14Recruitment.................................................................................................................................. 14
Data Collection Instruments and Methods ....................................................................... 16
Administrator Survey Data .......................................................................................... 16
Administrator Interviews ...............................................................................................17
Parent Survey Data ..........................................................................................................17
On-site Parent Interviews ..............................................................................................17
Teacher Survey Data .......................................................................................................17
Teacher Focus Groups ....................................................................................................18
Study Design and Analysis ..................................................................................................... 19
Findings ..........................................................................................................................20Methods for Working with Parents of PK-3 Children .................................................. 20
What types of communication technologies do parents in underserved communities use in their homes? Do they have access to computers, Internet, smartphones, iPhones, iPads, webcams, etc.? ................................... 20
What types of communication technologies are used in schools and programs for underserved students to inform parents about their children’s learning? Are these technologies used to inform parents about their children’s learning in literacy and math? .........................................22
What types of communication technologies are preferred by parents of underserved students in order to inform them about their children’s learning? .........................................................................................................26
How comfortable are parents of underserved students with webcams in their home, capturing an image of their child? ...............................................27
Summary ...........................................................................................................................27
Access to and Capacity for Interactive Whiteboard Technology in PK-3 Schools and Programs .............................................................................................................28
What are the barriers, facilitators, and opportunities for interactive whiteboard technology in public schools and after-school programs within underserved communiities? ..........................................................................28
What is the penetration of interactive whiteboard technology in public schools and after-school programs with underserved students? .. 30
What kind of products are currently used with the interactive whiteboard technology in schools and after-school programs with underserved students? ............................................................................................... 30
What types of products would be useful for PBS to develop to use with interactive whiteboard technology in schools and after-school programs with underserved students? ..................................................................32
Summary ............................................................................................................................33

Access to and Capacity for Other Technologies in PK-3 Schools and Programs ............................................................................................................................. 34
What technologies do classrooms and programs in underserved schools have access to? Do they have access to computers, Internet, iPads, iPhones, or other interactive educational technologies? .................... 34
How do these classrooms and programs acquire or fund these technologies? Do they receive grants or donations? If so, from what source(s)? ...........................................................................................................................38
Are the computers and other technologies used by teachers and students adequate and/or in good working condition? ..................................39
In these schools and programs, is there a tolerance for students using interactive technologies such as smartphones, iPods, and/or iPads? ...................................................................................................................42
Are there protocols for students regarding accessing wireless Internet and/or video streaming? ............................................................................ 44
Do these sites use webcams? Do these sites consider webcams an intrusion of privacy? ...................................................................................................... 44
Summary ........................................................................................................................... 45
Conclusion ......................................................................................................................46Interest in Using More Technology in PK-3 Classrooms ............................................ 46
Potential Areas for Content Development ........................................................................47
Products for Interactive Whiteboards and Classroom Computers ...............47
Products with Webcam Features .............................................................................47
Products that Utilize Progress Tracking .................................................................47
Communicating with Parents to Support Student Learning ......................... 48
Areas of Challenge ................................................................................................................... 48
Reaching the Lowest-Income Parents and Schools ........................................... 48
Introducing Digital Products in the Preschool Environment .......................... 48
Recommendations .................................................................................................................... 49
L IST OF EXH IB ITSExhibit 1: Participating District Demographic Information .................................................15
Exhibit 2: Data Collection Methods Used ................................................................................ 16
Exhibit 3: Overview of Data Collection ......................................................................................18
Exhibit 4: Percentage of Parents Reporting Access to Communication Technologies in the Home ..............................................................................................................21
Exhibit 5: Percentage of Parents who Reported Schools and Out-of-School Time Groups Used Selected Methods to Communicate with Them about Their Children’s Learning ..........................................................................................................................23
Exhibit 6: Administrator and Teacher Ratings of the Effectiveness of Methods Teachers Used to Communicate with Parents about Students’ Learning ....................24
Exhibit 7: Percentage of Parents who Preferred Selected Methods to Receive Information about Their Children’s Learning ..........................................................................26
Exhibit 8: Parents’ Comfort Level with Their Children Using Webcams at Home ....27
Exhibit 9: Availability of Interactive Whiteboard Technology in Schools as Reported by Teachers and Administrators .............................................................................28
Exhibit 10: Teacher and Administrator Reported Barriers to Interactive Whiteboard Technology ................................................................................................................29
Exhibit 11: Administrator Reported Types of Products Currently Used with Interactive Whiteboard Technology ...........................................................................................31
Exhibit 12: Teacher Reported Usefulness of Technology Products for the Classroom ...................................................................................................................................32
Exhibit 13: Availability of Technology Tools in Schools as Reported by Teachers and Administrators ..........................................................................................................................35
Exhibit 14: Teachers’ Use of Technology to Deliver Literacy and Mathematics Curricula as Reported by Teachers and Administrators .....................................................38
Exhibit 15: Administrator Reports of the Sources of Funds Used for Technology Purchases ............................................................................................................................................39
Exhibit 16: Reliability of Technology Used in Classrooms as Reported by Teachers and Administrators ......................................................................................................40
Exhibit 17: Condition of the Computers in Selected Areas of Schools as Reported by Teachers and Administrators .............................................................................42
Exhibit 18: Allowed Access of Students to Technology Tools in the Schools as Reported by Administrators .................................................................................................. 43
Exhibit 19: Guidelines and/or Procedures and Restrictions on Video Streaming as Reported by Administrators .................................................................................................. 44
Exhibit 20: Reasons Why Teachers Do Not Have Access to Webcams as Reported by Teachers and Administrators ............................................................................ 45
page1WestEd // New Technologies in Pre-K to Grade 3 Needs Assessment // HIGHLIGHTSWestEd // New Technologies in Pre-K to Grade 3 Needs Assessment // HIGHLIGHTS
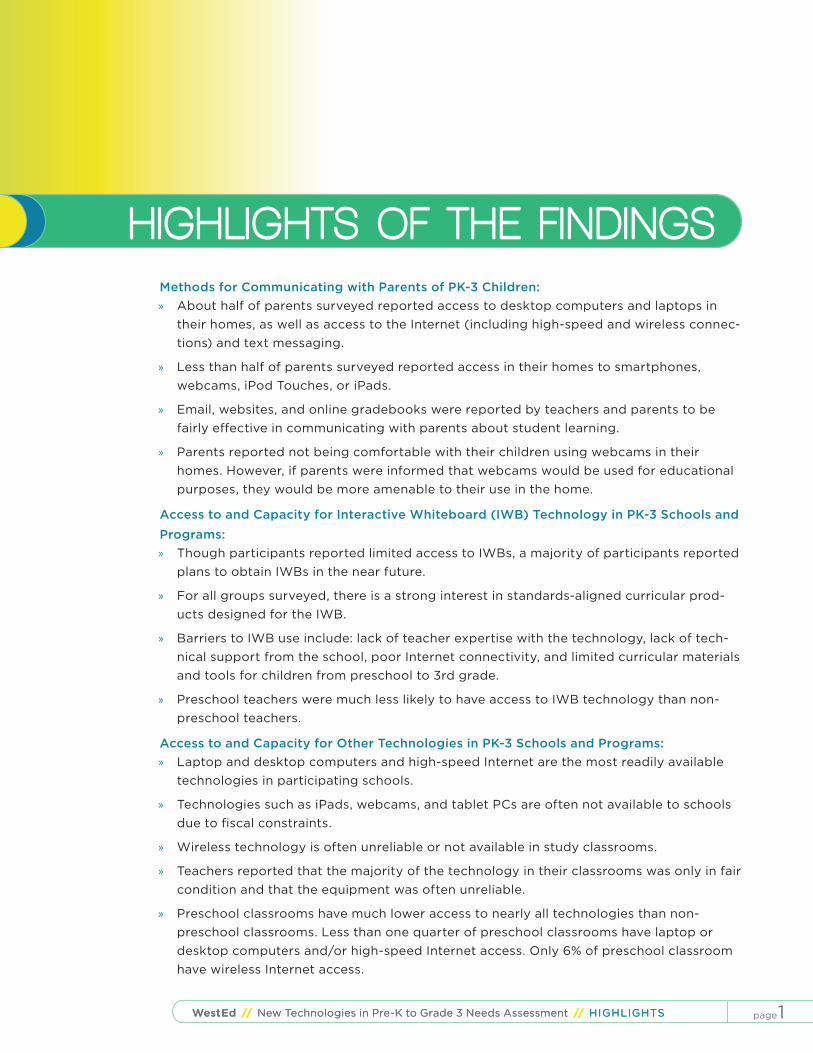
HIGHLIGHTS OF THE FINDINGSMethods for Communicating with Parents of PK-3 Children: » About half of parents surveyed reported access to desktop computers and laptops in
their homes, as well as access to the Internet (including high-speed and wireless connec-tions) and text messaging.
» Less than half of parents surveyed reported access in their homes to smartphones, webcams, iPod Touches, or iPads.
» Email, websites, and online gradebooks were reported by teachers and parents to be fairly effective in communicating with parents about student learning.
» Parents reported not being comfortable with their children using webcams in their homes. However, if parents were informed that webcams would be used for educational purposes, they would be more amenable to their use in the home.
Access to and Capacity for Interactive Whiteboard (IWB) Technology in PK-3 Schools and
Programs: » Though participants reported limited access to IWBs, a majority of participants reported
plans to obtain IWBs in the near future.
» For all groups surveyed, there is a strong interest in standards-aligned curricular prod-ucts designed for the IWB.
» Barriers to IWB use include: lack of teacher expertise with the technology, lack of tech-nical support from the school, poor Internet connectivity, and limited curricular materials and tools for children from preschool to 3rd grade.
» Preschool teachers were much less likely to have access to IWB technology than non-preschool teachers.
Access to and Capacity for Other Technologies in PK-3 Schools and Programs: » Laptop and desktop computers and high-speed Internet are the most readily available
technologies in participating schools.
» Technologies such as iPads, webcams, and tablet PCs are often not available to schools due to fiscal constraints.
» Wireless technology is often unreliable or not available in study classrooms.
» Teachers reported that the majority of the technology in their classrooms was only in fair condition and that the equipment was often unreliable.
» Preschool classrooms have much lower access to nearly all technologies than non-preschool classrooms. Less than one quarter of preschool classrooms have laptop or desktop computers and/or high-speed Internet access. Only 6% of preschool classroom have wireless Internet access.

page2WestEd // New Technologies in Pre-K to Grade 3 Needs Assessment // EXECUTIVE SUMMARY
EXECUTIVE SUMMARYThis report describes three comprehensive needs assessments that were conducted to deter-
mine (1) the readiness of underserved preschools, K-3 classrooms, and out-of-school time
programs to implement interactive educational technologies on a variety of platforms, and
(2) the readiness of these programs to communicate with parents and guardians about their
children’s academic progress using technology. The study is part of WestEd’s larger Ready to
Learn evaluation activities for the Corporation for Public Broadcasting (CPB) and the Public
Broadcasting Service (PBS). Funded by the U.S. Department of Education, the CPB/PBS Ready
to Learn grant supports the development of educational digital media targeted at preschool
and early elementary school children and their families. Its overarching goal is to promote early
learning and school readiness, with a particular interest in reaching children from low-income
families. Data were collected from parents, teachers, and non-teaching district and school staff
(e.g., principals, IT coordinators, and curriculum and instruction specialists) throughout the
United States using surveys, semi-structured interviews, and focus groups. Data were col-
lected in order to measure the capacity and interests of participants with regard to educational
technologies such as computers, interactive whiteboards (IWB), iPads, and iPods, as well as
digital content for these devices. Data were analyzed to better understand the capacity of
both schools and out-of-school-time programs to support these technologies. The results of
the needs assessments are intended to inform the work of CPB and PBS as they plan product
creation, including digital media for low-income schools and families. The focus areas of the
needs assessments are: 1) methods for communicating with parents of PK-3 children, 2) access
to and capacity for interactive whiteboard technology in PK-3 education settings, and 3) access
to and capacity for other technologies in PK-3 education settings. The study took place from
May to September 2011.
RESEARCH METHODResearchers implemented a mixed methods design for each of the three needs assessments.
Participant surveys, interview protocols, and focus group protocols were created based on
research questions for each needs assessment. Specific research questions for each needs
assessment are listed below.
page3WestEd // New Technologies in Pre-K to Grade 3 Needs Assessment // EXECUTIVE SUMMARY
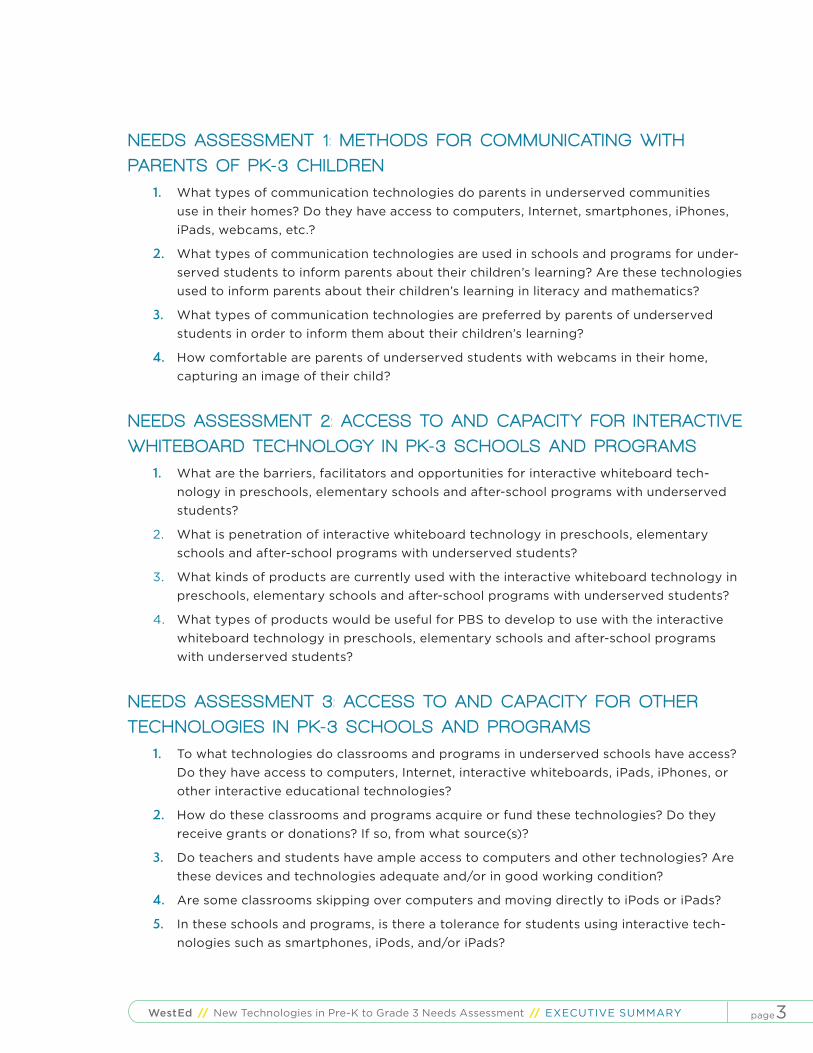
NEEDS ASSESSMENT 1 : METHODS FOR COMMUNICATING WITH
PARENTS OF PK-3 CHILDREN
1. What types of communication technologies do parents in underserved communities use in their homes? Do they have access to computers, Internet, smartphones, iPhones, iPads, webcams, etc.?
2. What types of communication technologies are used in schools and programs for under-served students to inform parents about their children’s learning? Are these technologies used to inform parents about their children’s learning in literacy and mathematics?
3. What types of communication technologies are preferred by parents of underserved students in order to inform them about their children’s learning?
4. How comfortable are parents of underserved students with webcams in their home, capturing an image of their child?
NEEDS ASSESSMENT 2: ACCESS TO AND CAPACITY FOR INTERACTIVE
WHITEBOARD TECHNOLOGY IN PK-3 SCHOOLS AND PROGRAMS
1. What are the barriers, facilitators and opportunities for interactive whiteboard tech-nology in preschools, elementary schools and after-school programs with underserved students?
2. What is penetration of interactive whiteboard technology in preschools, elementary schools and after-school programs with underserved students?
3. What kinds of products are currently used with the interactive whiteboard technology in preschools, elementary schools and after-school programs with underserved students?
4. What types of products would be useful for PBS to develop to use with the interactive whiteboard technology in preschools, elementary schools and after-school programs with underserved students?
NEEDS ASSESSMENT 3 : ACCESS TO AND CAPACITY FOR OTHER
TECHNOLOGIES IN PK-3 SCHOOLS AND PROGRAMS
1. To what technologies do classrooms and programs in underserved schools have access? Do they have access to computers, Internet, interactive whiteboards, iPads, iPhones, or other interactive educational technologies?
2. How do these classrooms and programs acquire or fund these technologies? Do they receive grants or donations? If so, from what source(s)?
3. Do teachers and students have ample access to computers and other technologies? Are these devices and technologies adequate and/or in good working condition?
4. Are some classrooms skipping over computers and moving directly to iPods or iPads?
5. In these schools and programs, is there a tolerance for students using interactive tech-nologies such as smartphones, iPods, and/or iPads?

page4WestEd // New Technologies in Pre-K to Grade 3 Needs Assessment // EXECUTIVE SUMMARY
6. Do these sites allow students to access wireless Internet and/or video streaming? If so, is there a protocol for students accessing these technologies?
7. Do these sites use webcams? Do these sites consider webcams an intrusion of privacy?
Participants in the study included 65 teachers, 75 administrators and district staff, and over 400
parents from small, medium, and large school districts with preschools, elementary schools, and
out-of-school-time programs that provided instruction for PK-3 students. Participants were from
public and charter schools in rural, suburban, and urban areas in the following states: Arizona,
Arkansas, California, Connecticut, Michigan, Mississippi, Nevada, New Mexico, Rhode Island,
Tennessee, and Utah.1
Data collection included: 1) a parent survey addressing technology access and use, current
methods of communication with schools, and preferred methods of communication; 2) a teacher
survey addressing availability and reliability of technology in the classroom, school guidelines
regarding technology, barriers to use of technology in the classroom, and communication with
parents; 3) an administrator survey (modeled on the teacher survey and addressing similar
issues); 4) teacher focus groups addressing use of technology in the classroom, barriers, and
resources; 5) administrator interviews addressing access to technology, district policies, and
funding; and 6) informal parent interviews focused on communication with school and after-
school programs, as well as access to and use of technology in the home.
F IND INGSThe findings include data from the parent, administrator, and teacher surveys, as well as data
from participant interviews and focus groups. Highlighted findings are presented below, in
relationship to the study’s research questions.
F INDINGS ABOUT METHODS FOR COMMUNICATING WITH PARENTS
OF PK-3 CHILDREN
1. What types of communication technologies do parents in underserved communities use in their homes? Do they have access to computers, Internet, smartphones, iPhones, iPads, webcams, etc.?
— Cell phones and phones with the ability to text message are by far the most popular technologies present in the home.
— Only about half of the parents surveyed reported access to desktop and laptop computers in their homes as well as access to the Internet (including high speed and wireless).
1 Though the primary purpose of these needs assessments are to inform PBS and CBP as they plan product creation, the nationwide sample allows the reader to make some assumption that trends identified here may be generalizable.
page5WestEd // New Technologies in Pre-K to Grade 3 Needs Assessment // EXECUTIVE SUMMARY
— Less than one-third of parents surveyed reported they had access in the home to smartphones and webcams, and even fewer parents reported they had access to iPod Touches, or iPads.
2. What types of communication technologies are used in schools and programs for under-served students to inform parents about their children’s learning? Are these technologies used to inform parents about their children’s learning in literacy and math?
— Non-technologically based methods of communication such as flyers sent home, the U.S. mail, and voicemail are still the most popularly used methods for schools and programs with underserved students to inform parents about their children’s learning.
— Nearly one-third (33%) of parents indicated that schools used email to inform them about their children’s learning, and 25% of parents reported that schools used online gradebooks.
— Email, websites, and online gradebooks were reported by teachers and parents to be fairly effective in communicating with parents about student learning.
— About half (45%-53%) of both teachers and administrators surveyed reported that texting is not used as a means for communicating about student learning.
— Educators reported that use of texting to communicate with parents about student progress is not particularly effective.
3. What types of communication technologies are preferred by parents of underserved students in order to inform them about their children’s learning?
— Flyers sent home with their children (62%) and email (60%) were the two most commonly preferred methods reported by parents to receive updates on their children’s learning progress.
— Nearly one-third (32%) of the parents reported that they wanted to receive updates on their children’s learning via an online gradebook.
4. How comfortable are parents of underserved students with webcams in their home, capturing an image of their child?
— Parents reported not being comfortable with their children using webcams in the home. However, if parents were told webcams would be used for educational purposes, they were more amenable to their use.
F INDINGS ABOUT ACCESS TO AND CAPACITY FOR INTERACTIVE
WHITEBOARD TECHNOLOGY IN PK-3 SCHOOLS AND PROGRAMS
1. What are the barriers, facilitators and opportunities for interactive whiteboard tech-nology in public schools and after-school programs with underserved students?
— Barriers to interactive whiteboard use include lack of teacher expertise in using whiteboards, lack of technical support, poor Internet connectivity, and limited curricular materials and tools for children from preschool to 3rd grade.
— Though participants reported limited access to interactive whiteboards, a majority of participants reported plans to obtain boards in the near future.
page6WestEd // New Technologies in Pre-K to Grade 3 Needs Assessment // EXECUTIVE SUMMARY
2. What is penetration of interactive whiteboard technology in preschools, public schools, and after-school programs with underserved students?
— Preschool teachers were much less likely to have access to interactive white-board technology (67% did not have access) than non-preschool teachers (27% did not have access).
— 85% of administrators indicated that whiteboard technology was used by at least one of the teachers in their district or school.
3. What kinds of products are currently used with the interactive whiteboard technology in schools and after-school programs with underserved students?
— Administrators reported that the most commonly used products with the interac-tive whiteboard technology were various software programs such as Microsoft Office, Treasures, AVERPEN, Utips, and Spelling City, followed closely by Internet websites, such as streaming videos from Discovery Education.
— Teachers reported that they used programs on the interactive whiteboards that were tied to curricula, such as Plato, Read180, and Accelerated Reader.
— Preschool teachers’ survey responses differed markedly from those of non-pre-school teachers. Preschool teachers were less likely to rate educational products for interactive whiteboards as useful and were much more likely to mark “don’t know” when asked about the usefulness of educational products for interactive whiteboards.
4. What types of products would be useful for PBS to develop to use with the interactive whiteboard technology in schools and after-school programs with underserved students?
— For all groups surveyed, there is a strong interest in curricular products for the interactive whiteboard that are standards-aligned.
F INDINGS ABOUT ACCESS TO AND CAPACITY FOR OTHER
TECHNOLOGIES IN PK-3 SCHOOLS AND PROGRAMS
1. To what technologies do classrooms and programs in underserved schools have access? Do they have access to computers, Internet, interactive whiteboards, iPads, iPhones, or other interactive educational technologies?
— Laptop and desktop computers and high speed Internet are the most readily available technologies in study schools.
— Technologies such as iPads, webcams, and tablet PCs are often not available to schools due to fiscal constraints.
2. How do these classrooms and programs acquire or fund these technologies? Do they receive grants or donations? If so, from what source(s)?
— Title I (Improving the Academic Achievement of the Disadvantaged) was the most commonly reported source of funding for these technologies, mentioned by more than 10% of administrators. Small grants (usually less than $5000) from local organizations were also noted by about 10% of administrators. Ten percent
page7WestEd // New Technologies in Pre-K to Grade 3 Needs Assessment // EXECUTIVE SUMMARY
of teachers noted that they often supplement technology funds with their own money or personal fundraising efforts.
— Other funding sources reported by at least 5% of administrators were: 21st Century Community Learning Center Grants, School Improvement Grants, grants from the Bureau of Indian Affairs, and larger foundations such as the Skillman Foundation and the W. K. Kellogg Foundation.
3. Do teachers and students have ample access to computers and other technologies? Are these devices and technologies adequate and/or in good working condition?
— Teachers reported that the majority of the technology in their classrooms was only in fair condition and that the equipment was often unreliable.
— Preschool classrooms have much lower access to nearly all technologies than non-preschool classrooms. Less than one-quarter of preschool classrooms have laptop or desktop computers and/or high speed Internet access. Only 6% have wireless Internet access.
4. Are some classrooms skipping over computers and moving directly to iPods or iPads?
— Administrators most commonly reported that iPods, and/or iPads were not accessible to students.
5. In these schools and programs, is there a tolerance for students using interactive tech-nologies such as smartphones, iPods, and/or iPads?
— There is some evidence that there is a tolerance for students using interactive technologies for educational purposes.
6. Do these sites allow students to access wireless Internet and/or video streaming? If so, is there a protocol for students accessing these technologies?
— Wireless technology is often unreliable or not available in study classrooms.
— 33% of administrators reported that there were protocols for students accessing video streaming.
7. Do these sites use webcams? Do these sites consider webcams an intrusion of privacy?
— 45% of administrators reported that teachers in their schools and districts had access to webcams in their classrooms.
— Security or privacy concerns were the second most commonly identified reason (after lack of funds) for webcams not being considered an important or useful teaching tool.
CONCLUSIONSThe results of the needs assessments suggest that there is a strong interest in using technology
in PK-3 classrooms. Additionally, results identify potential areas for effectively developing
educational digital content for low-income schools and families. At the same time, there are still
enormous challenges to reaching parents, teachers, and students in underserved communities.

page8WestEd // New Technologies in Pre-K to Grade 3 Needs Assessment // EXECUTIVE SUMMARY
INTEREST IN USING MORE TECHNOLOGY IN PK-3 CLASSROOMS
Findings show that there is a strong interest for more use of technology in PK-3 classrooms.
Teachers and administrators reported that digital curricula are engaging and effective.
Administrators reported district and school plans to purchase more technology in the near
future, and indicated the need for PK-3 digital curriculum and tools. There is a strong desire for
these products, and the current study suggests that this desire will continue to grow.
POTENTIAL AREAS FOR CONTENT DEVELOPMENT
The results suggest that there are particular areas of opportunity that can be targeted by PBS
for product development. These include: products for the interactive whiteboard and classroom
computers, products with webcam features, products that utilize progress tracking, and strate-
gies for using technology to communicate with parents of PK-3 children.
Products for Interactive Whiteboard and Classroom Computers
Teachers and administrators were very interested in standards-aligned content for the interac-
tive whiteboard. These respondents indicated that there is a strong need for PK-3 curricular
content and tools for interactive whiteboards. Though not a particular focus of the needs assess-
ments, educators also mentioned that many of the products for the interactive whiteboard (e.g.,
Plato, Read180) also had components for classroom computers. They mentioned that they liked
having complementary content for each device. In addition, 76% of administrators mentioned
that their districts and schools have plans to purchase interactive whiteboards in the near future.
These findings suggest that products created for the interactive whiteboard would be well
received in low-income schools.
Products with Webcam Features
Though many schools and districts have some restrictions on webcam use and parents indicated
some reservations about their use, there is a strong interest in the use of webcams for learning
academic content. Findings indicate that as long as webcams are used for educational purposes,
schools and families are open to using them. About half of elementary schools and one-third of
families indicated they had access to webcams. As technology products are updated in coming
years, these percentages are expected to rise. Products with webcam features would most likely
be used in many low-income schools and homes in future years.
Products That Uti l ize Progress Tracking
Though the topic of progress tracking was not specifically targeted in the study, it did come
up in numerous focus groups and interviews. Elementary school teachers and administrators
mentioned that they had some experience with progress tracking in other digital products, and
they felt the concept held great promise. Many elementary school teachers and administrators
page9WestEd // New Technologies in Pre-K to Grade 3 Needs Assessment // EXECUTIVE SUMMARY
understand that one benefit of digital curricula and tools is that valuable data can be collected
from students while products are being used. Many teachers and administrators had used prod-
ucts in which individual student data had been extracted and they reported that this feature was
useful. Products with progress tracking may be welcomed at some schools.
Communicating with Parents to Support Student Learning
Though the study found that low-income parents often had limited access to technology, many
are finding ways to communicate with their schools using technology. Teachers reported that
they found online gradebooks and teacher-created class websites to be effective ways to com-
municate with parents. Teachers report that though parents may not have computers or access
to the Internet in their home, parents might visit the library or use school computers to check
these webpages. Some parents reported having access to the Internet via their phone rather
than a home computer. In focus groups, teachers reported that many parents used “pay as you
go” cell phones. Though these phones accepted text messages, parents often have to pay extra
for them. Therefore, teachers said that sending text messages was not always the best way to
communicate with the parents of their students. One point of entry for parent digital content
that supports student learning may be web-based content that parents can access via teacher
webpages, online gradebooks or mobile applications. Another strategy for reaching parents
may involve giving parents multiple options for accessing content, including web-based and
texting options.
AREAS OF CHALLENGE
The needs assessment study addressed needs in three areas: methods for communicating with
parents of PK-3 children, access to and capacity for interactive whiteboard technology in PK-3
education settings, and access to and capacity for other technologies in PK-3 education set-
tings. The findings suggest that tremendous challenges continue to exist in these three areas.
Particular challenges at the elementary school level are related to the capacity of parents and
schools to access digital media. Challenges at the preschool level involve access as well as ques-
tions about teacher capacity to effectively integrate digital media into instruction.
Reaching the Lowest- Income Parents and Schools
Equipment and connectivity continue to be a tremendous hurdle to technology use in low-
income schools and homes. About half the homes included in the study did not have access
to computers or high speed Internet. Elementary schools have more access to computers and
connection to the Internet, but their computers are often in poor condition and unreliable. In
addition, most low-income classrooms do not have access to interactive whiteboards, iPods or
iPads. In the near term, a large proportion of low-income schools and families will struggle to
access digital media.

page10WestEd // New Technologies in Pre-K to Grade 3 Needs Assessment // EXECUTIVE SUMMARY
Introducing Digita l Products in the Preschool Environment
The preschool age group currently poses particular challenges for producers seeking to provide
digital content for underserved students. Preschools in the study reported extremely low access
to technology, including computers and Internet access. Very few preschools had access to
technology other than computers. In addition, focus group data suggest that preschool teachers
are not familiar with the benefits of technology such as interactive whiteboards and iPads,
highlighting the need for ongoing professional development in this area. Preschool teachers also
indicated that they were less comfortable using various technologies compared to their elemen-
tary school colleagues.
RECOMMENDAT IONSThe following recommendations stem from the studies’ findings.
» Continue to study how low-income families access and use digital media.
» Pilot test methods of media delivery to low-income parents and high-need schools to ensure that content and delivery are amenable to the target populations.
» Explore methods to reach low-income classrooms that do not have reliable Internet connectivity.
» Continue to explore which types of interactive whiteboard curricula and tools are most desired by PK-3 teachers.
» Create guidelines for webcam use that can be used by schools and parents to help allay safety concerns associated with webcam use.
» Explore the use of online gradebooks to communicate with parents about their children’s learning.
» Pilot test early progress tracking models in low-income schools.
» Pilot test early models of communicating with low-income parents about their students’ learning. Consider using models that give parents multiple pathways to access informa-tion (e.g., email, online gradebooks and texting).
page11WestEd // New Technologies in Pre-K to Grade 3 Needs Assessment // INTRODUCTION
INTRODUCTION
OVERVIEW OF THE STUDYThis report describes three comprehensive needs assessments that were conducted to deter-
mine (1) the readiness of underserved preschools, K-3 classrooms, and out-of-school time
programs to implement interactive educational technologies on a variety of platforms, and
(2) the readiness of these programs to communicate with parents and guardians about their
children’s academic progress using technology. The study is part of WestEd’s larger Ready to
Learn evaluation activities for the Corporation for Public Broadcasting (CPB) and the Public
Broadcasting Service (PBS). Funded by the U.S. Department of Education, the CPB/PBS Ready
to Learn grant supports the development of educational digital media targeted at preschool
and early elementary school children and their families. Its overarching goal is to promote early
learning and school readiness, with a particular interest in reaching children from low-income
families. Data were collected from parents, teachers,2 and non-teaching district and school
staff (e.g., principals, IT coordinators, and curriculum and instruction specialists)3 throughout
the United States using surveys, semi-structured interviews, and focus groups. Data were col-
lected in order to measure the capacity and interests of participants with regard to educational
technologies such as computers, interactive whiteboards (IWB), iPads, and iPods, as well as
digital content for these devices. Data were analyzed to better understand the capacity of
both schools and out-of-school-time programs to support these technologies. The results of
the needs assessments are intended to inform the work of CPB and PBS as they plan product
creation, including digital media for low-income schools and families. The focus areas of the
needs assessments are: 1) methods for communicating with parents of PK-3 children, 2) access
to and capacity for interactive whiteboard technology in PK-3 education settings, and 3) access
to and capacity for other technologies in PK-3 education settings. The study took place from
May to September 2011.
The study addressed research questions for each needs assessment.
2 Throughout this report, ‘teachers’ will refer to all teachers included in the study. Where there are discernible differences in the responses of teachers at the preschool level, we will refer to ‘preschool teachers’ and ‘non-preschool teachers’.
3 Throughout this report, this group of participants will be referred to as ‘administrators’.
page12WestEd // New Technologies in Pre-K to Grade 3 Needs Assessment // INTRODUCTION
NEEDS ASSESSMENT 1 : METHODS FOR COMMUNICATING WITH
PARENTS OF PK-3 CHILDREN
1. What types of communication technologies do parents in underserved communities use in their homes? Do they have access to computers, Internet, smartphones, iPhones, iPads, webcams, etc?
2. What types of communication technologies are used in schools and programs for under-served students to inform parents about their children’s learning? Are these technologies used to inform parents about their children’s learning in literacy and math?
3. What types of communication technologies are preferred by parents of underserved students in order to inform them about their children’s learning?
4. How comfortable are parents of underserved students with webcams in their home, capturing an image of their child?
NEEDS ASSESSMENT 2: ACCESS TO AND CAPACITY FOR INTERACTIVE
WHITEBOARD TECHNOLOGY IN PK-3 SCHOOLS AND PROGRAMS
1. What are the barriers, facilitators and opportunities for interactive whiteboard tech-nology in preschools, elementary schools and after-school programs with underserved students?
2. What is penetration of interactive whiteboard technology in preschools, elementary schools and after-school programs with underserved students?
3. What kinds of products are currently used with the interactive whiteboard technology in preschools, elementary schools and after-school programs with underserved students?
4. What types of products would be useful for PBS to develop to use with the interactive whiteboard technology in preschools, elementary schools and after-school programs with underserved students?
NEEDS ASSESSMENT 3 : ACCESS TO AND CAPACITY FOR OTHER
TECHNOLOGIES IN PK-3 SCHOOLS AND PROGRAMS
1. To what technologies do classrooms and programs in underserved schools have access? Do they have access to computers, Internet, interactive whiteboards, iPads, iPhones, or other interactive educational technologies?
2. How do these classrooms and programs acquire or fund these technologies? Do they receive grants or donations? If so, from what source(s)?
3. Do teachers and students have ample access computers and other technologies? Are these devices and technologies adequate and/or in good working condition?
4. Are some classrooms skipping over computers and moving directly to iPods or iPads?
5. In these schools and programs, is there a tolerance for students using interactive tech-nologies such as smartphones, iPods, and/or iPads?
page13WestEd // New Technologies in Pre-K to Grade 3 Needs Assessment // INTRODUCTION
6. Do these sites allow students to access wireless Internet and/or video streaming? If so, is there a protocol for students accessing these technologies?
7. Do these sites use webcams? Do these sites consider webcams an intrusion of privacy?
Participants in the study included 65 teachers, 75 administrators and district staff, and over
400 parents and were from small, medium, and large school districts, elementary schools,
preschools, and out-of-school-time programs. Data collection included: 1) a parent survey
addressing technology in the home, comfort with technology, current methods of communica-
tion with schools, and preferred methods of communication; 2) a teacher survey addressing
availability and reliability of technology in the classroom, school guidelines regarding tech-
nology, barriers to use of technology in the classroom, and communication with parents; 3) an
administrator survey (modeled on the teacher survey and addressing similar issues); 4) teacher
focus groups addressing use of technology in the classroom, barriers, and resources; 5) adminis-
trator interviews concerning access to technology, district policies, and funding; and 6) informal
parent interviews focused on communication with school and after-school programs, as well as
technology in the home.
page14WestEd // New Technologies in Pre-K to Grade 3 Needs Assessment // METHOD
METHODIn this section, we describe recruitment, study participation, data collection instruments, and
study design.
RECRU ITMENTThe recruitment process for the study took place from May to July 2011. WestEd researchers
contacted over 1800 district leaders, principals, teachers, and school staff across the United
States and asked them to either complete an online intake survey or pass the information along
to candidates appropriate for the study.4 District administrators, parents, school principals,
teachers, and non-teaching staff were chosen from WestEd’s extensive database of state, dis-
trict, and school contacts and were targeted for their work in schools that address the needs of
underserved students (including students of color, English language learners, and students from
low-income communities) in Pre-K through 3rd grade. A website was established to communi-
cate pertinent information to prospective participants of the study.
Over 400 teachers, district administrators, principals, program coordinators, and non-teaching
staff responded to WestEd’s invitation to participate in the study by completing an online pre-
screening survey. Prospective participants were screened for: access to parents of PK-3 stu-
dents, technological expertise, position type, awareness of educational needs of students, and
availability for a phone interview and/or focus group.
A total of 190 teachers and administrators from the pre-screening survey were selected as
participants for the needs assessment project. This sample of respondents included about
74% working with elementary schools, 26% working with preschools, and 9% working with
out-of-school-time programs. Almost half of the respondents to the pre-screening survey were
teachers. A little more than half of the pre-screening survey respondents included district
administrators (e.g., IT directors, early learning program directors, superintendents) and/or
non-teaching staff members (e.g., principals, vice-principals, after-school program directors/
coordinators, IT coordinators). Out of 190 respondents selected to participate in the project,
135 continued their participation in terms of completing surveys and/or participating in inter-
views or focus groups.
4 Study design and instruments were reviewed by WestEd’s IRB and determined that the research did not meet the federal regulatory definition of “research” (45 CFR 46.102[d]) and did not require formal IRB review.
page15WestEd // New Technologies in Pre-K to Grade 3 Needs Assessment // METHOD
Sites eligible to participate in this project were from small, medium, and large school districts,
elementary schools (including out-of-school-time programs), and preschools that provided
instruction to PK-3 students. Participants were from public and charter schools and districts
in rural, suburban and urban areas across the following states: Arizona, Arkansas, California,
Connecticut, Michigan, Mississippi, Nevada, New Mexico, Rhode Island, Tennessee, and Utah.5
Teachers selected to participate in this project received a packet in the mail which included a
cover letter, 12 parent surveys with parent cover letters (in Spanish and English), address forms
for participating parents to receive an optional $15 Amazon gift card, and a stipend request form
(in the amount of $200) for the teacher. Teachers were also sent a notification email explaining
their participant tasks (which included identifying at least six parents to take the paper-based
parent survey) along with a web-link to complete the online teacher survey. In addition,
researchers visited two schools in low-income districts to collect parent surveys at the schools’
back-to-school nights. In all, 410 parents from low-income communities completed surveys.
District administrators and non-teaching staff received an email explaining their participant tasks
along with a web-link to complete the online administrator survey. Administrators and non-
teaching staff received a stipend (in the amount of $100) after completing their participant tasks.
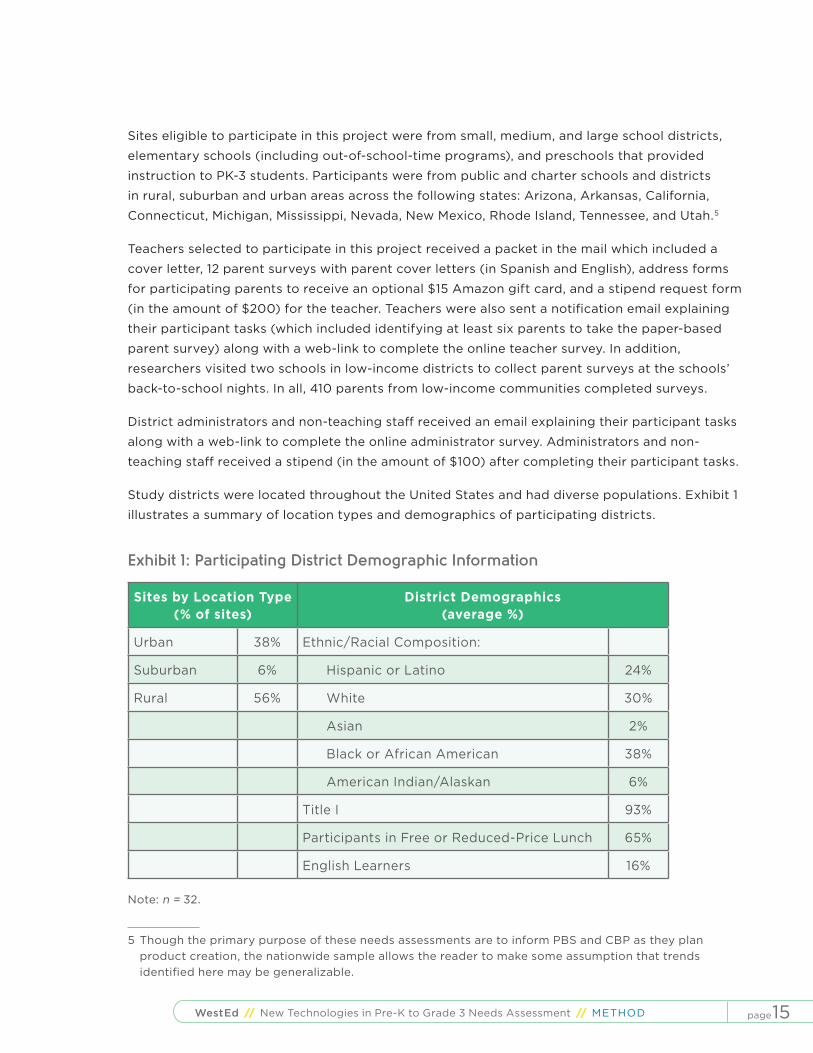
Study districts were located throughout the United States and had diverse populations. Exhibit 1
illustrates a summary of location types and demographics of participating districts.
Exhibit 1: Participating District Demographic Information
Sites by Location Type(% of sites)
District Demographics (average %)
Urban 38% Ethnic/Racial Composition:
Suburban 6% Hispanic or Latino 24%
Rural 56% White 30%
Asian 2%
Black or African American 38%
American Indian/Alaskan 6%
Title I 93%
Participants in Free or Reduced-Price Lunch 65%
English Learners 16%
Note: n = 32.
5 Though the primary purpose of these needs assessments are to inform PBS and CBP as they plan product creation, the nationwide sample allows the reader to make some assumption that trends identified here may be generalizable.
page16WestEd // New Technologies in Pre-K to Grade 3 Needs Assessment // METHOD
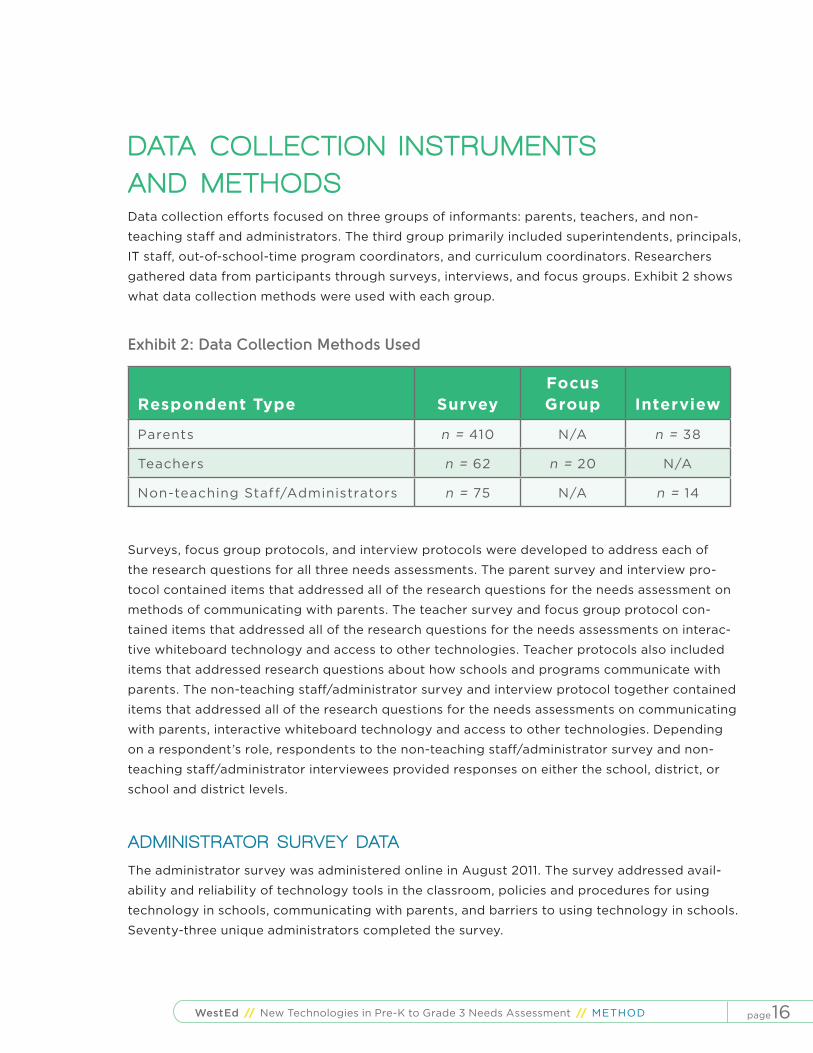
DATA COLLECT ION INSTRUMENTS AND METHODSData collection efforts focused on three groups of informants: parents, teachers, and non-
teaching staff and administrators. The third group primarily included superintendents, principals,
IT staff, out-of-school-time program coordinators, and curriculum coordinators. Researchers
gathered data from participants through surveys, interviews, and focus groups. Exhibit 2 shows
what data collection methods were used with each group.
Exhibit 2: Data Collection Methods Used
Respondent Type SurveyFocus Group Interview
Parents n = 410 N/A n = 38
Teachers n = 62 n = 20 N/A
Non-teaching Staff/Administrators n = 75 N/A n = 14
Surveys, focus group protocols, and interview protocols were developed to address each of
the research questions for all three needs assessments. The parent survey and interview pro-
tocol contained items that addressed all of the research questions for the needs assessment on
methods of communicating with parents. The teacher survey and focus group protocol con-
tained items that addressed all of the research questions for the needs assessments on interac-
tive whiteboard technology and access to other technologies. Teacher protocols also included
items that addressed research questions about how schools and programs communicate with
parents. The non-teaching staff/administrator survey and interview protocol together contained
items that addressed all of the research questions for the needs assessments on communicating
with parents, interactive whiteboard technology and access to other technologies. Depending
on a respondent’s role, respondents to the non-teaching staff/administrator survey and non-
teaching staff/administrator interviewees provided responses on either the school, district, or
school and district levels.
ADMIN ISTRATOR SURVEY DATA
The administrator survey was administered online in August 2011. The survey addressed avail-
ability and reliability of technology tools in the classroom, policies and procedures for using
technology in schools, communicating with parents, and barriers to using technology in schools.
Seventy-three unique administrators completed the survey.

page17WestEd // New Technologies in Pre-K to Grade 3 Needs Assessment // METHOD
ADMIN ISTRATOR INTERVIEWS
Administrator interviews were conducted via telephone in August 2011. Each session lasted
approximately 45 minutes. The interview protocol consisted of questions on general technology
use in schools, interactive whiteboard use, district procedures for acquiring and deploying new
technology, and communicating with parents. This protocol was carefully aligned to the research
questions and the administrator survey, and was designed to complement the survey data with
more in-depth qualitative descriptions.
PARENT SURVEY DATA
The parent survey was administered in two phases to ensure a focus on the needs of low-income
families. Phase I consisted of asking teacher participants to select six parents from their class-
rooms to complete the survey on paper. The survey was available in both English and Spanish.
Phase I took place during June – July 2011. Three hundred fifty-six completed surveys were
collected during Phase I. Phase II consisted of distributing the survey at back-to-school nights
at two low-income schools in California. Teams of researchers went to two different elementary
schools and encouraged parents to complete the survey on paper while their children were
invited to play games from PBS on iPads and iPhones. Fifty-four completed surveys were col-
lected during Phase II. Thirteen percent of parents opted to complete their surveys in Spanish.
Parent surveys addressed what technologies parents had access to in the home as well as what
technologies parents felt comfortable using. In addition, parents were asked to indicate their
preferred method of communication about their children’s learning, and whether schools or
community groups currently communicate with them via technology.
ON-SITE PARENT INTERVIEWS
Additional qualitative data were collected during the Phase II administration of the parent
survey. Researchers attended back-to-school nights at two low-income schools and were avail-
able to assist parents in completing the survey. In addition, researchers informally interviewed
parents to gain additional insight on the uses of technology in the home and barriers to access.
TEACHER SURVEY DATA
The teacher survey was administered online in August 2011. The survey addressed availability
and reliability of technology tools in the classroom, policies and procedures for using technology
in the classroom, effective methods of communicating with parents, and barriers to using tech-
nology in the classroom.

page18WestEd // New Technologies in Pre-K to Grade 3 Needs Assessment // METHOD
TEACHER FOCUS GROUPS
Teacher focus groups were conducted via telephone in August 2011. Four focus groups were
convened, with a total of 20 participants. Each focus group lasted approximately one hour. The
focus group protocol consisted of questions on general technology use in schools, interactive
whiteboard use, and communicating with parents. This protocol was carefully aligned to the
research questions and the teacher survey, and was designed to complement the survey data
with more in-depth qualitative descriptions.
Exhibit 3 shows time frames for data collection for the needs assessments.
Exhibit 3: Overview of Data Collection
AUGUST 2011
Administrator Interviews
JULY – AUGUST 2011
Administrator SurveyParent SurveyTeacher Survey
SEPTEMBER 2011
On-site Parent Survey and InterviewsAdministrator
JUNE – JULY 2011
Participant Recruitment
page19WestEd // New Technologies in Pre-K to Grade 3 Needs Assessment // METHOD
STUDY DES IGN AND ANALYSISThe study implemented a mixed methods design, utilizing quantitative data (quantitative items
on surveys) and qualitative data (focus groups, interviews, and open-response items on surveys)
to address the research questions. Quantitative data were tabulated to create tables showing
percentage of responses for each survey item. Qualitative data analysis of interviews, focus
groups, and open-ended answers on the surveys used a two-step process. First, individual
transcripts of the interviews and focus groups, as well as open-ended items on the surveys, were
analyzed for themes. The themes were associated with at least one of the research questions
and used for the second step in the analysis. In the second step, the data were examined as part
of a cross-site analysis to determine the consistency of the identified themes across sites and to
corroborate findings salient to the study.
page20WestEd // New Technologies in Pre-K to Grade 3 Needs Assessment // FINDINGS
FINDINGS
METHODS FOR WORKING WITH PARENTS OF PK-3 CH ILDREN The findings are divided into three main sections. The first section of findings pertains to schools
using technology to communicate with parents of children in preschool to 3rd grade.6 The
second set of findings is concerned with access to capacity for interactive whiteboard tech-
nology in schools and programs that serve students in preschool through 3rd grade. Findings
about access to and capacity for technologies other than interactive whiteboards in programs
and schools that serve children in preschool to 3rd grade are discussed in the third and final sec-
tion. All findings include data from the parent, administrator, or teacher surveys. Findings also
include data from participant interviews and focus groups.
WHAT TYPES OF COMMUNICATION TECHNOLOGIES DO PARENTS
IN UNDERSERVED COMMUNIT IES USE IN THEIR HOMES? DO THEY
HAVE ACCESS TO COMPUTERS, INTERNET, SMARTPHONES, IPHONES,
IPADS, WEBCAMS, ETC.?
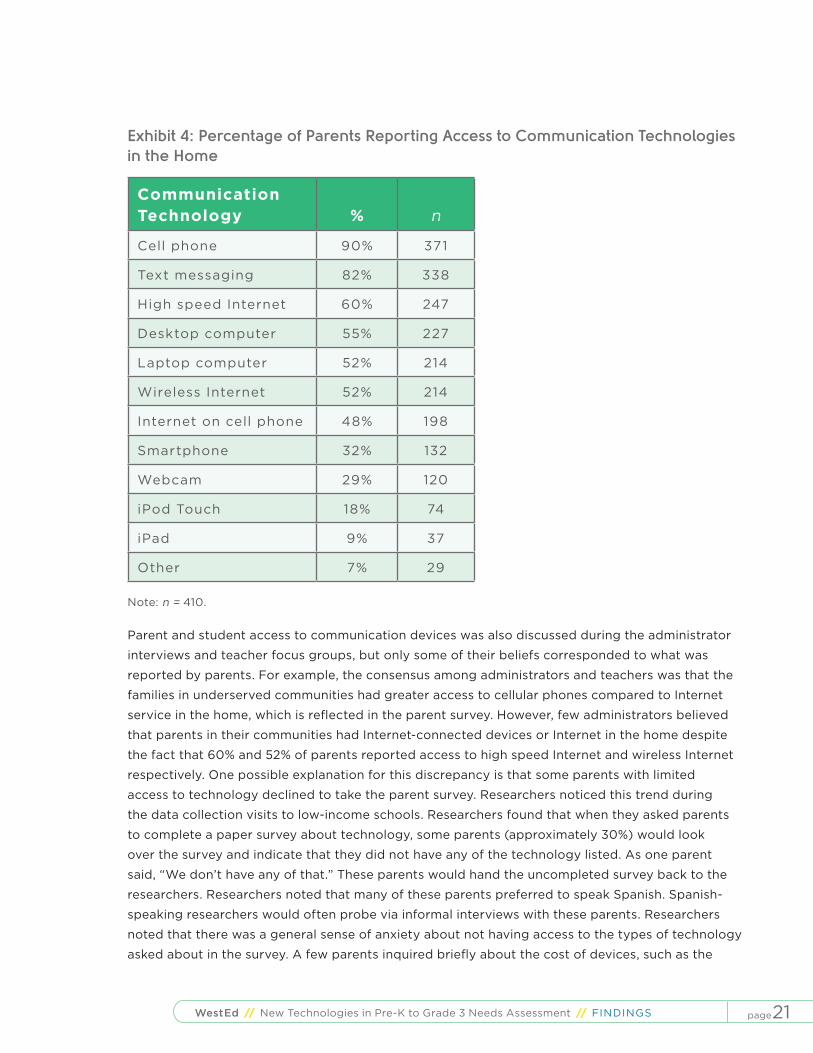
The types of communication technologies that parents in underserved communities used in
their homes are shown in Exhibit 4. Cell phones and phones with the ability to text message
were by far the most popular technologies present in the home. More than half of the parents
surveyed also reported that they had computers and access to high speed Internet. In contrast,
devices such as webcams, iPod Touches, and iPads were used by less than one-third of the
survey respondents. A small number of respondents reported having access to other technology
devices in their homes, which most often included gaming consoles, such as the Wii and Xbox
360, but MP3 players and e-readers (e.g., the Kindle) were also mentioned. The average number
of communication technologies identified by the parents was 5.8 (SD = 2.7) and the number
identified overall ranged from zero to 11.
6 The pattern of responses to study questions was similar for parents of preschool-aged children and parents of K-3 children. Therefore, results are collapsed across those two groups.
page21WestEd // New Technologies in Pre-K to Grade 3 Needs Assessment // FINDINGS
Exhibit 4: Percentage of Parents Reporting Access to Communication Technologies in the Home
Communication Technology % n
Cell phone 90% 371
Text messaging 82% 338
High speed Internet 60% 247
Desktop computer 55% 227
Laptop computer 52% 214
Wireless Internet 52% 214
Internet on cell phone 48% 198
Smartphone 32% 132
Webcam 29% 120
iPod Touch 18% 74
iPad 9% 37
Other 7% 29
Note: n = 410.
Parent and student access to communication devices was also discussed during the administrator
interviews and teacher focus groups, but only some of their beliefs corresponded to what was
reported by parents. For example, the consensus among administrators and teachers was that the
families in underserved communities had greater access to cellular phones compared to Internet
service in the home, which is reflected in the parent survey. However, few administrators believed
that parents in their communities had Internet-connected devices or Internet in the home despite
the fact that 60% and 52% of parents reported access to high speed Internet and wireless Internet
respectively. One possible explanation for this discrepancy is that some parents with limited
access to technology declined to take the parent survey. Researchers noticed this trend during
the data collection visits to low-income schools. Researchers found that when they asked parents
to complete a paper survey about technology, some parents (approximately 30%) would look
over the survey and indicate that they did not have any of the technology listed. As one parent
said, “We don’t have any of that.” These parents would hand the uncompleted survey back to the
researchers. Researchers noted that many of these parents preferred to speak Spanish. Spanish-
speaking researchers would often probe via informal interviews with these parents. Researchers
noted that there was a general sense of anxiety about not having access to the types of technology
asked about in the survey. A few parents inquired briefly about the cost of devices, such as the
page22WestEd // New Technologies in Pre-K to Grade 3 Needs Assessment // FINDINGS
iPad, and reacted with a laugh or a grimace. Survey data from Spanish-preference parents at the
two low-income schools visited by researchers show that this population may have less access to
technology than other parent respondents. Only 69% reported having access to cell phones (com-
pared to the overall sample’s 90%), 56% use text messaging (compared to 82%), 44% said they had
access to high speed Internet (compared to 60%), 19% report having access to wireless Internet
(compared to 52%), and 19% have laptops (compared to 52%). This evidence suggests that there
may be some bias in the parent survey data toward parents who have and use technology.
WHAT TYPES OF COMMUNICATION TECHNOLOGIES ARE USED
IN SCHOOLS AND PROGRAMS FOR UNDERSERVED STUDENTS
TO INFORM PARENTS ABOUT THEIR CHILDREN’S LEARNING? ARE
THESE TECHNOLOGIES USED TO INFORM PARENTS ABOUT THEIR
CHILDREN’S LEARNING IN L ITERACY AND MATH?
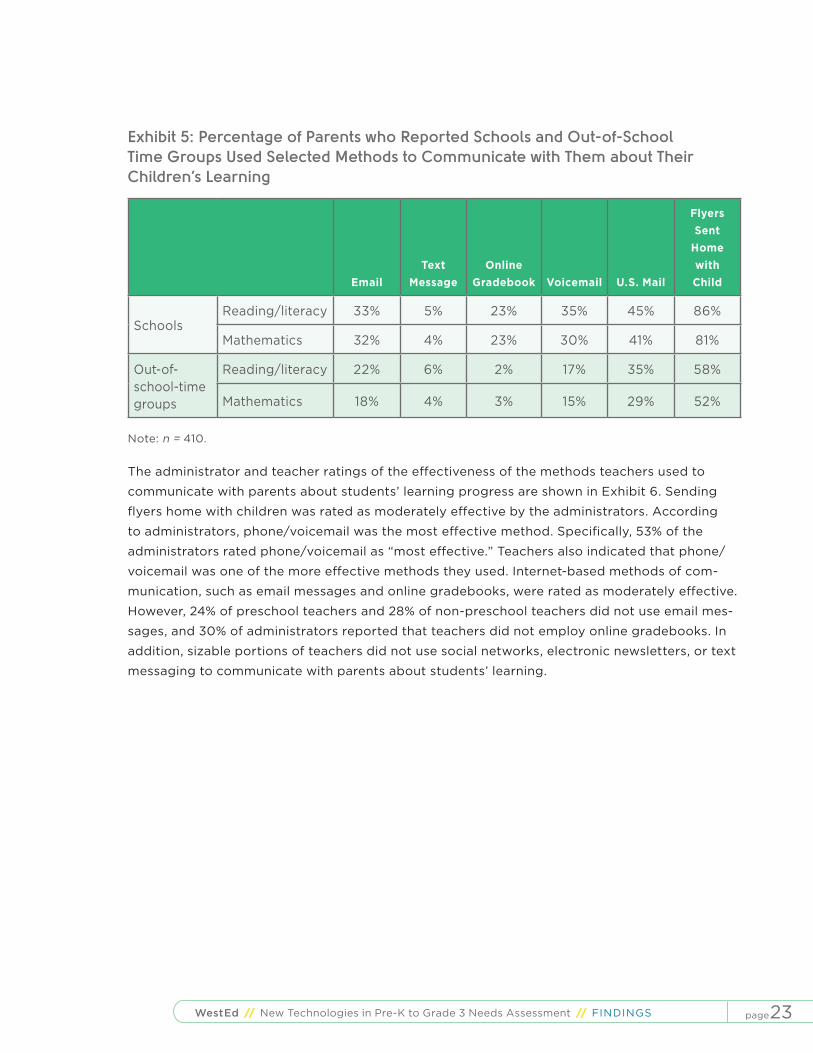
The percentage of parents who reported that schools and out-of-school time groups used email,
text messaging, online gradebooks, voicemail, U.S. mail, and flyers sent home with children to
communicate with them about their children’s learning in reading/literacy and mathematics is
shown in Exhibit 5. Sending flyers home with children was the most commonly used way for
schools and out-of-school-time groups to inform parents about their children’s learning. In addi-
tion, 30-45% of parents reported that schools used U.S. mail and voicemail to communicate
with them about their children’s learning. In terms of Internet-based methods of communication,
nearly one third of parents indicated that schools used email to inform them about their children’s
learning. Furthermore, almost one quarter of the respondents reported that schools used online
gradebooks. Overall, the out-of-school-time groups used fewer methods to communicate with par-
ents about their children’s learning, which is likely a result of the non-academic focus of many of
the out-of-school-time groups. Nevertheless, 15-35% of parents indicated that out-of-school-time
groups used U.S. mail, email, and voicemail to communicate regarding their children’s learning.
page23WestEd // New Technologies in Pre-K to Grade 3 Needs Assessment // FINDINGS
Exhibit 5: Percentage of Parents who Reported Schools and Out-of-School Time Groups Used Selected Methods to Communicate with Them about Their Children’s Learning
EmailText
MessageOnline
Gradebook Voicemail U.S. Mail
Flyers Sent
Home with Child
SchoolsReading/literacy 33% 5% 23% 35% 45% 86%
Mathematics 32% 4% 23% 30% 41% 81%
Out-of-school-time groups
Reading/literacy 22% 6% 2% 17% 35% 58%
Mathematics 18% 4% 3% 15% 29% 52%
Note: n = 410.
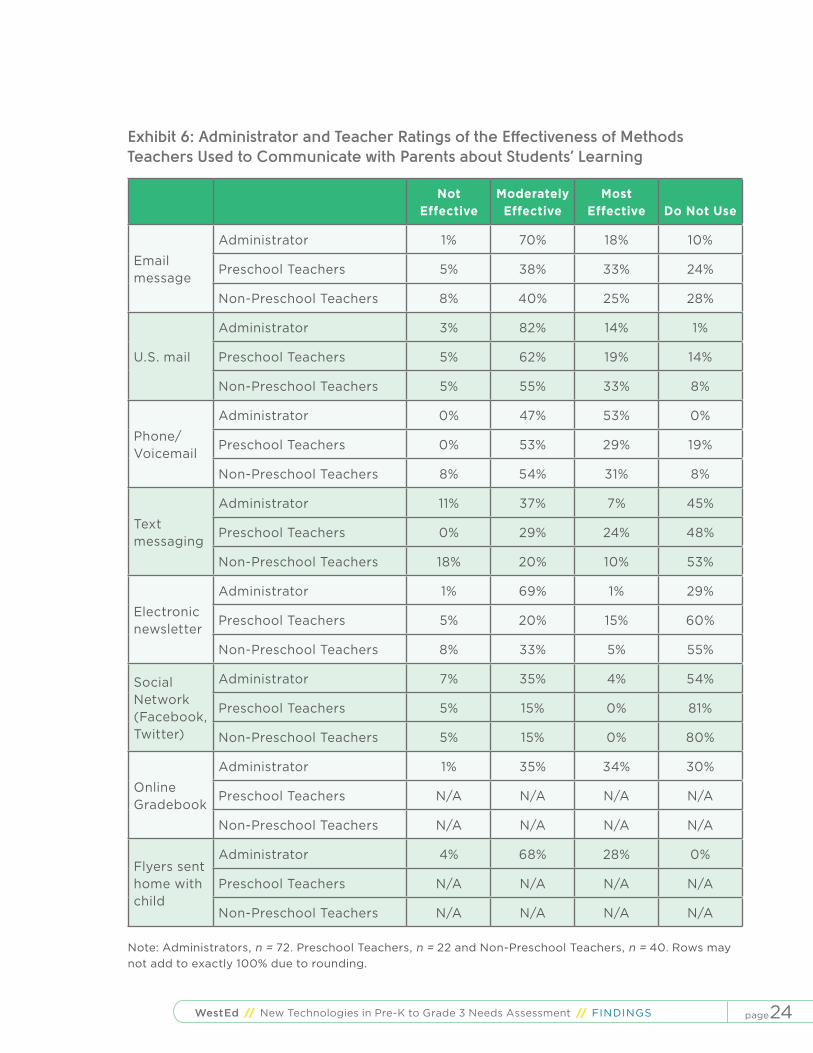
The administrator and teacher ratings of the effectiveness of the methods teachers used to
communicate with parents about students’ learning progress are shown in Exhibit 6. Sending
flyers home with children was rated as moderately effective by the administrators. According
to administrators, phone/voicemail was the most effective method. Specifically, 53% of the
administrators rated phone/voicemail as “most effective.” Teachers also indicated that phone/
voicemail was one of the more effective methods they used. Internet-based methods of com-
munication, such as email messages and online gradebooks, were rated as moderately effective.
However, 24% of preschool teachers and 28% of non-preschool teachers did not use email mes-
sages, and 30% of administrators reported that teachers did not employ online gradebooks. In
addition, sizable portions of teachers did not use social networks, electronic newsletters, or text
messaging to communicate with parents about students’ learning.
page24WestEd // New Technologies in Pre-K to Grade 3 Needs Assessment // FINDINGS
Exhibit 6: Administrator and Teacher Ratings of the Effectiveness of Methods Teachers Used to Communicate with Parents about Students’ Learning
Not Effective
Moderately Effective
Most Effective Do Not Use
Email message
Administrator 1% 70% 18% 10%
Preschool Teachers 5% 38% 33% 24%
Non-Preschool Teachers 8% 40% 25% 28%
U.S. mail
Administrator 3% 82% 14% 1%
Preschool Teachers 5% 62% 19% 14%
Non-Preschool Teachers 5% 55% 33% 8%
Phone/Voicemail
Administrator 0% 47% 53% 0%
Preschool Teachers 0% 53% 29% 19%
Non-Preschool Teachers 8% 54% 31% 8%
Text messaging
Administrator 11% 37% 7% 45%
Preschool Teachers 0% 29% 24% 48%
Non-Preschool Teachers 18% 20% 10% 53%
Electronic newsletter
Administrator 1% 69% 1% 29%
Preschool Teachers 5% 20% 15% 60%
Non-Preschool Teachers 8% 33% 5% 55%
Social Network (Facebook, Twitter)
Administrator 7% 35% 4% 54%
Preschool Teachers 5% 15% 0% 81%
Non-Preschool Teachers 5% 15% 0% 80%
Online Gradebook
Administrator 1% 35% 34% 30%
Preschool Teachers N/A N/A N/A N/A
Non-Preschool Teachers N/A N/A N/A N/A
Flyers sent home with child
Administrator 4% 68% 28% 0%
Preschool Teachers N/A N/A N/A N/A
Non-Preschool Teachers N/A N/A N/A N/A
Note: Administrators, n = 72. Preschool Teachers, n = 22 and Non-Preschool Teachers, n = 40. Rows may not add to exactly 100% due to rounding.
page25WestEd // New Technologies in Pre-K to Grade 3 Needs Assessment // FINDINGS
The survey findings with regard to the communication technologies most used by schools and
programs were largely corroborated by the administrator interviews and teacher focus groups.
Administrators and teachers reported that schools and school districts utilized the traditional
method of newsletters and flyers to communicate with parents. A majority of administrators
and teachers also indicated that schools and districts employed recorded and automated phone
messages (i.e. robocalls) to disseminate general information to parents including announce-
ments of school closures, upcoming school events, or other important messages. However,
a few schools and districts also employed newer methods of communication. For example, a
small number of administrators indicated that their schools utilized websites to disseminate
information. Also, a small number of teachers said they had created their own websites whereby
they communicated classroom-specific information to parents. One administrator noted that
the schools in that district used the school’s Facebook, Twitter, and blog pages to disseminate
school-level information to parents.
Approximately half of the teachers and administrators reported that teachers did not use text
messaging to communicate with parents about their students’ learning (see Exhibit 6 above).
When teachers did use text messaging to communicate with parents, it was typically rated as
moderately effective. Specifically, 29% of preschool teachers, 20% of non-preschool teachers,
and 37% of administrators indicated that teachers’ use of text messaging was moderately effec-
tive. Only 7% of administrators and 24% of teachers in preschools, and 10% of non-preschool
teachers rated text messaging as “most effective.” Through interviews and focus groups, admin-
istrators indicated that while text messaging was an additional tool for more direct communica-
tions with parents, it was not a practical means to inform parents about students’ academic
performance. Administrators and teachers both noted that a small number of teachers were
known to use text messaging as a means of communicating with parents, particularly for chil-
dren requiring support at home. However, according to administrators and teachers, no school
or district utilized text messaging to parents as a systemic means of communication.
WHAT TYPES OF COMMUNICATION TECHNOLOGIES ARE PREFERRED
BY PARENTS OF UNDERSERVED STUDENTS IN ORDER TO INFORM
THEM ABOUT THEIR CHILDREN’S LEARNING?
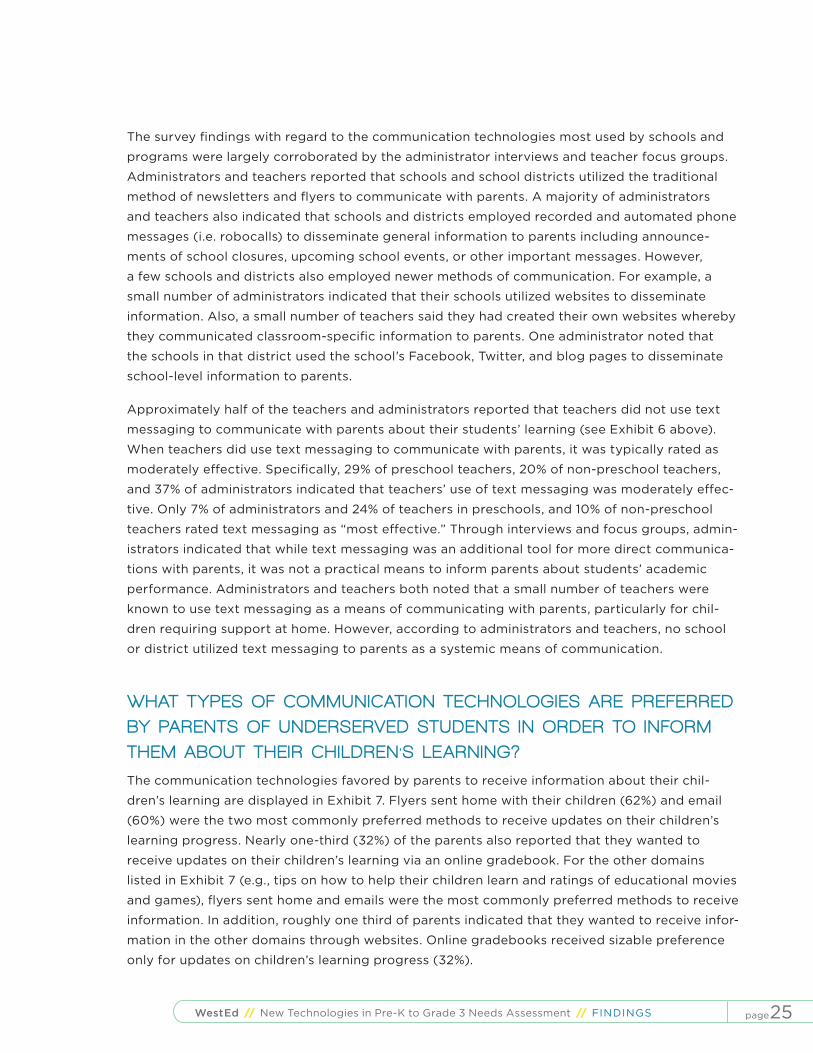
The communication technologies favored by parents to receive information about their chil-
dren’s learning are displayed in Exhibit 7. Flyers sent home with their children (62%) and email
(60%) were the two most commonly preferred methods to receive updates on their children’s
learning progress. Nearly one-third (32%) of the parents also reported that they wanted to
receive updates on their children’s learning via an online gradebook. For the other domains
listed in Exhibit 7 (e.g., tips on how to help their children learn and ratings of educational movies
and games), flyers sent home and emails were the most commonly preferred methods to receive
information. In addition, roughly one third of parents indicated that they wanted to receive infor-
mation in the other domains through websites. Online gradebooks received sizable preference
only for updates on children’s learning progress (32%).
page26WestEd // New Technologies in Pre-K to Grade 3 Needs Assessment // FINDINGS
Exhibit 7: Percentage of Parents who Preferred Selected Methods to Receive Information about Their Children’s Learning
EmailText
MessageOnline
Gradebook Website Voicemail U.S. Mail
Flyers Sent
Home with Child
Updates on your child’s learning progress
60% 26% 32% 23% 29% 43% 62%
Tips on how to help your child learn
58% 18% 13% 35% 22% 39% 65%
Information about interactive media and video
57% 16% 8% 36% 18% 30% 53%
Links to web pages, downloads, education-related news updates, etc.
61% 17% 9% 36% 15% 28% 48%
Rating of educational movies and games
58% 17% 8% 37% 16% 29% 47%
Reviews of educational electronic toys and devices
56% 15% 8% 34% 15% 29% 46%
Note: n = 410.
HOW COMFORTABLE ARE PARENTS OF UNDERSERVED STUDENTS
WITH WEBCAMS IN THEIR HOME, CAPTURING AN IMAGE OF
THEIR CHILD?
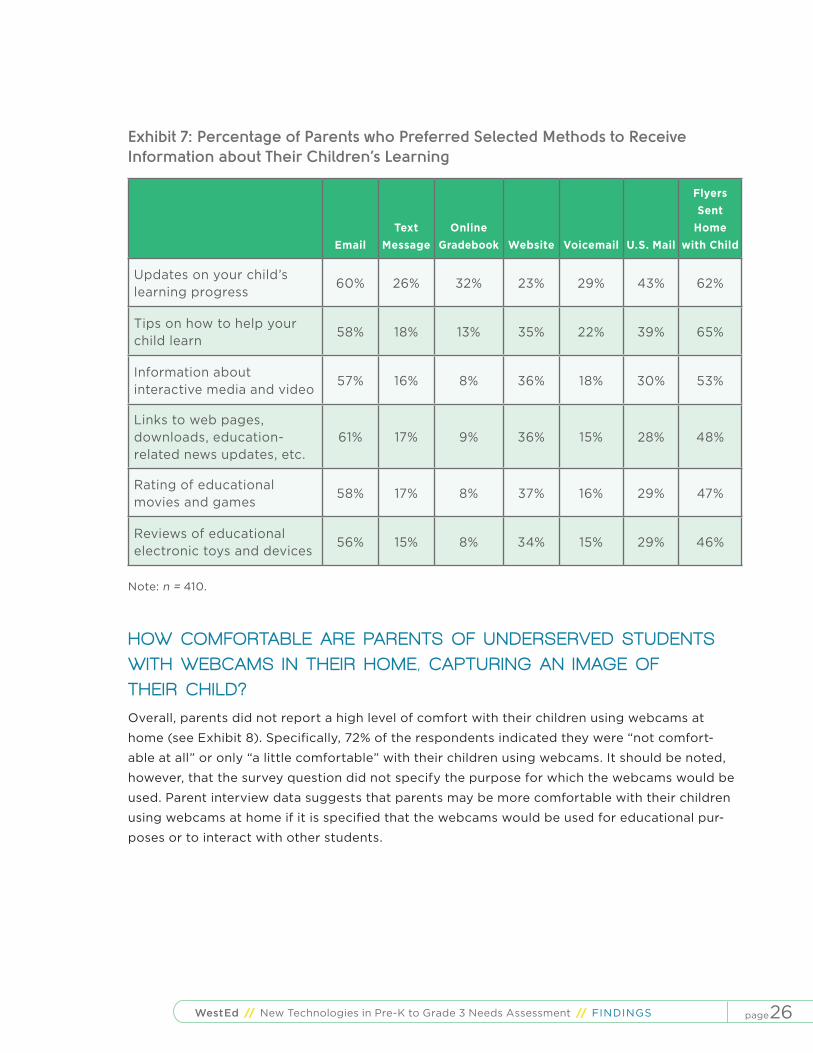
Overall, parents did not report a high level of comfort with their children using webcams at
home (see Exhibit 8). Specifically, 72% of the respondents indicated they were “not comfort-
able at all” or only “a little comfortable” with their children using webcams. It should be noted,
however, that the survey question did not specify the purpose for which the webcams would be
used. Parent interview data suggests that parents may be more comfortable with their children
using webcams at home if it is specified that the webcams would be used for educational pur-
poses or to interact with other students.

page27WestEd // New Technologies in Pre-K to Grade 3 Needs Assessment // FINDINGS
Exhibit 8: Parents’ Comfort Level with Their Children Using Webcams at Home
0
5
10
15
20
25
30
35
40
45
50
Very Comfortable
Comfortable A Little Comfortable
Not Comfortable at All
Per
cent
age
Note: n = 410.
SUMMARY
About half of the parents surveyed in underserved communities reported access to desktop
and laptop computers in their homes as well as access to the Internet (including high speed and
wireless) and text messaging. Less than half of parents surveyed reported they had access in
the home to smartphones, webcams, iPod Touches, or iPads. Analysis of parent interview data
suggests that some low-income parents have even less access to technology than parents in the
survey sample. Parents also reported that schools and out-of-school-time groups largely use
paper flyers and U.S. mail to communicate with them about their children’s learning progress
and that these were their most preferred ways to be informed about their children’s learning.
However, the majority of both teachers and administrators reported that paper flyers and U.S.
mail were only moderately effective means through which to report about student learning to
parents in underserved communities. The most effective means were reported to be phone
or voicemail. Further, despite the access to text messaging by parents in underserved com-
munities, about half of the teachers and administrators surveyed reported that it is not used
as a means for communicating about student learning. When it is used to communicate about
student progress, teachers and administrators report that it is not particularly effective. Email,
websites, and online gradebooks were reported by teachers and parents to be fairly effective in
communicating with parents about student learning. Finally, parents of students in underserved
communities, by and large, are not comfortable with their children using webcams in the home.
However, if parents are told webcams will be used for educational purposes, they are more
amenable to use.

page28WestEd // New Technologies in Pre-K to Grade 3 Needs Assessment // FINDINGS
ACCESS TO AND CAPACITY FOR INTERACT IVE WHITEBOARD TECHNOLOGY IN PK-3 SCHOOLS AND PROGRAMS
WHAT ARE THE BARRIERS, FACIL ITATORS, AND OPPORTUNIT IES FOR
INTERACTIVE WHITEBOARD TECHNOLOGY IN PUBLIC SCHOOLS AND
AFTER-SCHOOL PROGRAMS WITH IN UNDERSERVED COMMUNI IT IES?
Access to interactive whiteboard technology was clearly limited at the preschool level. More
than two-thirds of the preschool teachers surveyed (67%) reported that interactive whiteboard
technology was not available to them, as opposed to only 27% of non-preschool teachers.
Exhibit 9: Availability of Interactive Whiteboard Technology in Schools as Reported by Teachers and Administrators
Technology RespondentNot available
Available monthly or weekly
Available daily or as needed
Interactive whiteboard technology (e.g., SMART Boards)
Preschool Teachers 67% 11% 22%
Non-Preschool Teachers 27% 9% 64%
Administrators 18% 6% 77%
Note: Preschool Teachers (n = 22) and Non-Preschool Teachers (n = 40) reported on the availability in their classrooms and administrators (n = 72) reported on the availability in their district, school, and/or preschool sites. Rows may not add to exactly 100% due to rounding.
With regard to barriers to interactive whiteboard technology (Exhibit 10), 25% of teachers
reported that training for using this technology was not available, while 16% reported that the
training they did receive was inadequate. Two barriers mentioned by 30% of teacher respon-
dents were that technology problems were not addressed in a timely manner and that the
district/school firewall blocked too many resources.
Only 9% of administrators reported that there was no training available to teachers on how to use
the interactive whiteboards (Exhibit 10). However, 43% of administrators noted that the available
training was not adequate (compared to only 16% of the teachers). Also, 22% of administrators
reported that technology problems were not addressed in a timely manner, and 18% reported
that the curriculum resources for the interactive whiteboard technology were not adequate. Only
14% of administrators reported that district/school firewalls blocked too many resources.
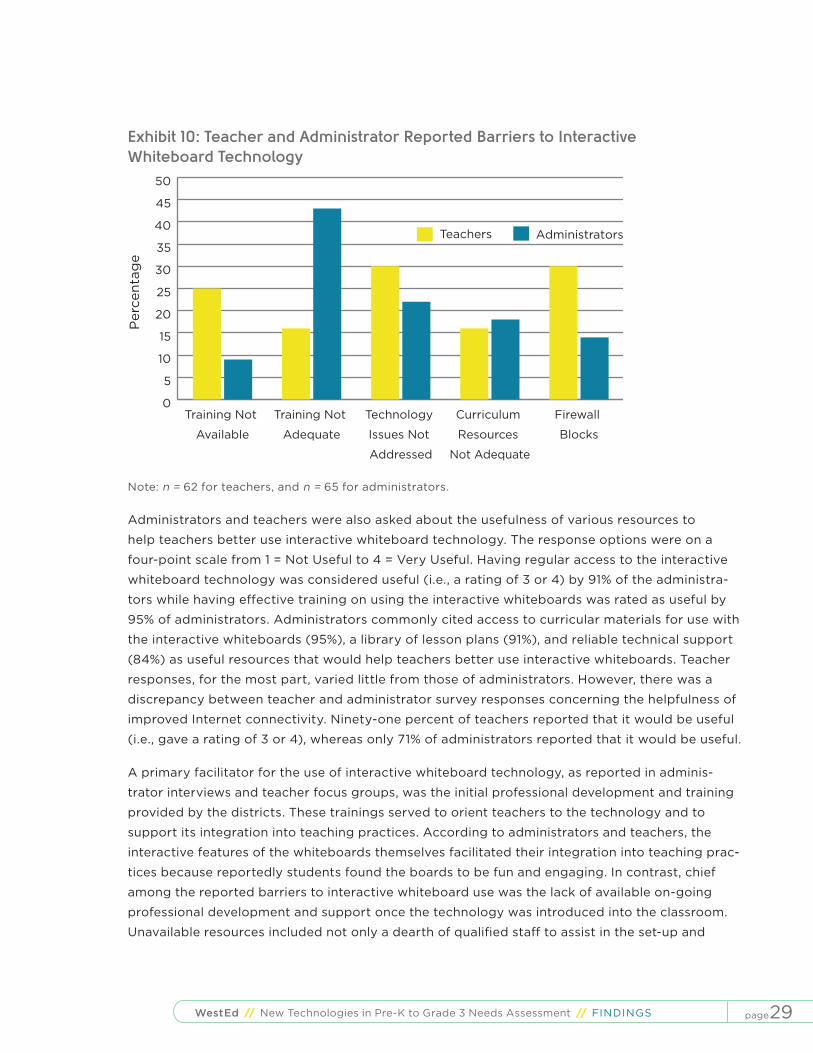
page29WestEd // New Technologies in Pre-K to Grade 3 Needs Assessment // FINDINGS
Exhibit 10: Teacher and Administrator Reported Barriers to Interactive Whiteboard Technology
0
5
10
15
20
25
30
35
40
45
50
AdministratorsTeachers
Firewall
Blocks
Curriculum
Resources
Not Adequate
Technology
Issues Not
Addressed
Training Not
Adequate
Training Not
Available
Per
cent
age
Note: n = 62 for teachers, and n = 65 for administrators.
Administrators and teachers were also asked about the usefulness of various resources to
help teachers better use interactive whiteboard technology. The response options were on a
four-point scale from 1 = Not Useful to 4 = Very Useful. Having regular access to the interactive
whiteboard technology was considered useful (i.e., a rating of 3 or 4) by 91% of the administra-
tors while having effective training on using the interactive whiteboards was rated as useful by
95% of administrators. Administrators commonly cited access to curricular materials for use with
the interactive whiteboards (95%), a library of lesson plans (91%), and reliable technical support
(84%) as useful resources that would help teachers better use interactive whiteboards. Teacher
responses, for the most part, varied little from those of administrators. However, there was a
discrepancy between teacher and administrator survey responses concerning the helpfulness of
improved Internet connectivity. Ninety-one percent of teachers reported that it would be useful
(i.e., gave a rating of 3 or 4), whereas only 71% of administrators reported that it would be useful.
A primary facilitator for the use of interactive whiteboard technology, as reported in adminis-
trator interviews and teacher focus groups, was the initial professional development and training
provided by the districts. These trainings served to orient teachers to the technology and to
support its integration into teaching practices. According to administrators and teachers, the
interactive features of the whiteboards themselves facilitated their integration into teaching prac-
tices because reportedly students found the boards to be fun and engaging. In contrast, chief
among the reported barriers to interactive whiteboard use was the lack of available on-going
professional development and support once the technology was introduced into the classroom.
Unavailable resources included not only a dearth of qualified staff to assist in the set-up and

page30WestEd // New Technologies in Pre-K to Grade 3 Needs Assessment // FINDINGS
maintenance of the equipment, but also a lack of resources to continue the use of the interactive
whiteboards in the classroom, such as sample lessons aligned with the district curricula.
WHAT IS THE PENETRATION OF INTERACTIVE WHITEBOARD
TECHNOLOGY IN PUBLIC SCHOOLS AND AFTER-SCHOOL PROGRAMS
WITH UNDERSERVED STUDENTS?
Eighty-five percent (n = 61) of administrators indicated that whiteboard technology was used by
at least one of the teachers in their district or school. However, the availability of the technology
did not extend to preschool or after-school programs. Twenty-nine percent (n = 21) of adminis-
trators indicated after-school and preschool programs had access to any interactive whiteboard
technology. Seventy-six percent (n = 55) of administrators thought that their district, school, or
preschool would acquire new or more interactive whiteboards in the next five years.
Teachers who reported using interactive whiteboard technology (n = 55, 56%) said they used it
for a variety of purposes in the classroom. More than half of teachers reported using the interac-
tive whiteboards to teach a traditional curriculum to students (58%), create interactive activi-
ties (57%), display online content to the class (56%), access web-based interactive activities
or games (56%), and show visualization of difficult concepts or demonstrate skills (55%). Less
common uses of interactive whiteboards included to save, print, and share notes taken during
class time (22%) or to communicate with others using programs such as Skype (8%).
WHAT KIND OF PRODUCTS ARE CURRENTLY USED WITH THE
INTERACTIVE WHITEBOARD TECHNOLOGY IN SCHOOLS AND
AFTER-SCHOOL PROGRAMS WITH UNDERSERVED STUDENTS?
Administrators were asked about the kinds of products currently used with interactive white-
boards in their districts, schools, or preschools. Based on these administrator responses, several
products emerged as more commonly used by teachers. The most common were various soft-
ware programs, mentioned by 33% of administrators (Exhibit 11). These included programs such
as Microsoft Office, Treasures, AVERPEN, Utips, and Spelling City. The next most commonly
cited use was with Internet websites (30%), such as streaming videos from Discovery Education.
Other products used with interactive whiteboard technology mentioned by more than two
respondents included use of response systems with students (17%), use of document cameras
(13%), and use of software (13%) that is included with the interactive whiteboards.
Interviews further revealed limited knowledge among administrators regarding the features and
functionality of their interactive whiteboards. Many administrators reported an awareness of the
interactive and engaging interface, but lacked detailed knowledge of the feature list. A small
number of administrators were able to delineate general features such as wireless connectivity,
multi-response process, and printing.
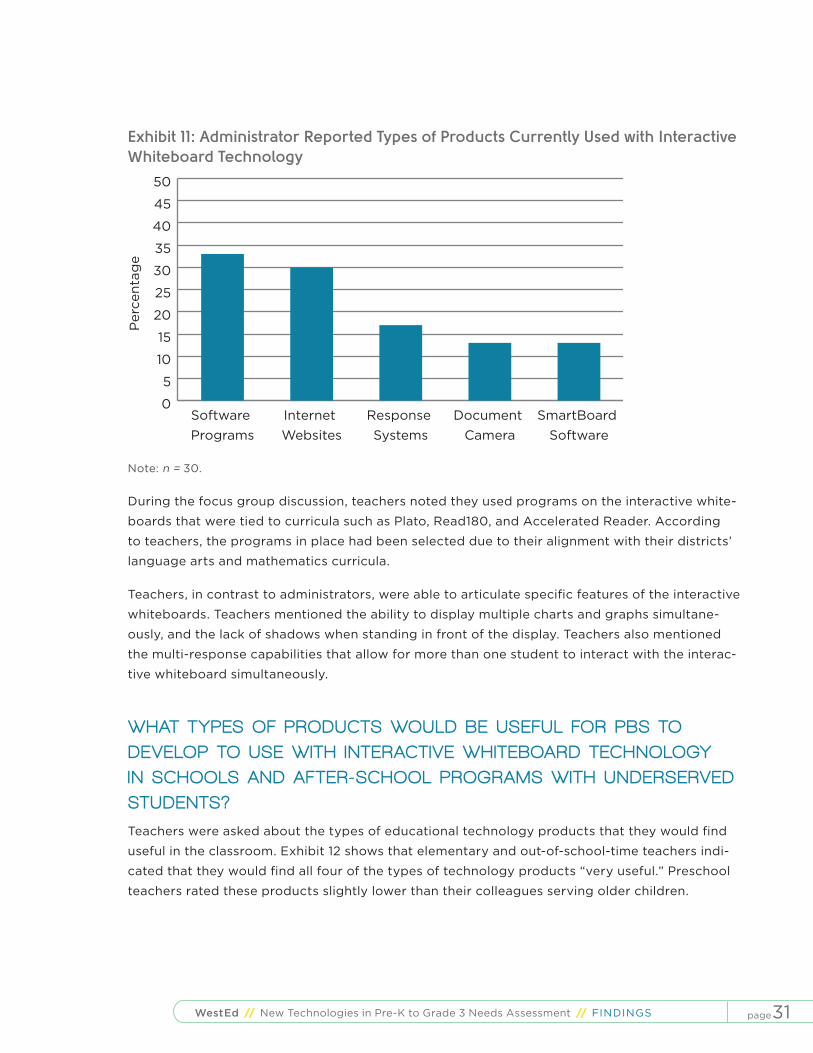
page31WestEd // New Technologies in Pre-K to Grade 3 Needs Assessment // FINDINGS
Exhibit 11: Administrator Reported Types of Products Currently Used with Interactive Whiteboard Technology
0
5
10
15
20
25
30
35
40
45
50
SmartBoard Software
Document Camera
Response Systems
Internet Websites
Software Programs
Per
cent
age
Note: n = 30.
During the focus group discussion, teachers noted they used programs on the interactive white-
boards that were tied to curricula such as Plato, Read180, and Accelerated Reader. According
to teachers, the programs in place had been selected due to their alignment with their districts’
language arts and mathematics curricula.
Teachers, in contrast to administrators, were able to articulate specific features of the interactive
whiteboards. Teachers mentioned the ability to display multiple charts and graphs simultane-
ously, and the lack of shadows when standing in front of the display. Teachers also mentioned
the multi-response capabilities that allow for more than one student to interact with the interac-
tive whiteboard simultaneously.
WHAT TYPES OF PRODUCTS WOULD BE USEFUL FOR PBS TO
DEVELOP TO USE WITH INTERACTIVE WHITEBOARD TECHNOLOGY
IN SCHOOLS AND AFTER-SCHOOL PROGRAMS WITH UNDERSERVED
STUDENTS?
Teachers were asked about the types of educational technology products that they would find
useful in the classroom. Exhibit 12 shows that elementary and out-of-school-time teachers indi-
cated that they would find all four of the types of technology products “very useful.” Preschool
teachers rated these products slightly lower than their colleagues serving older children.
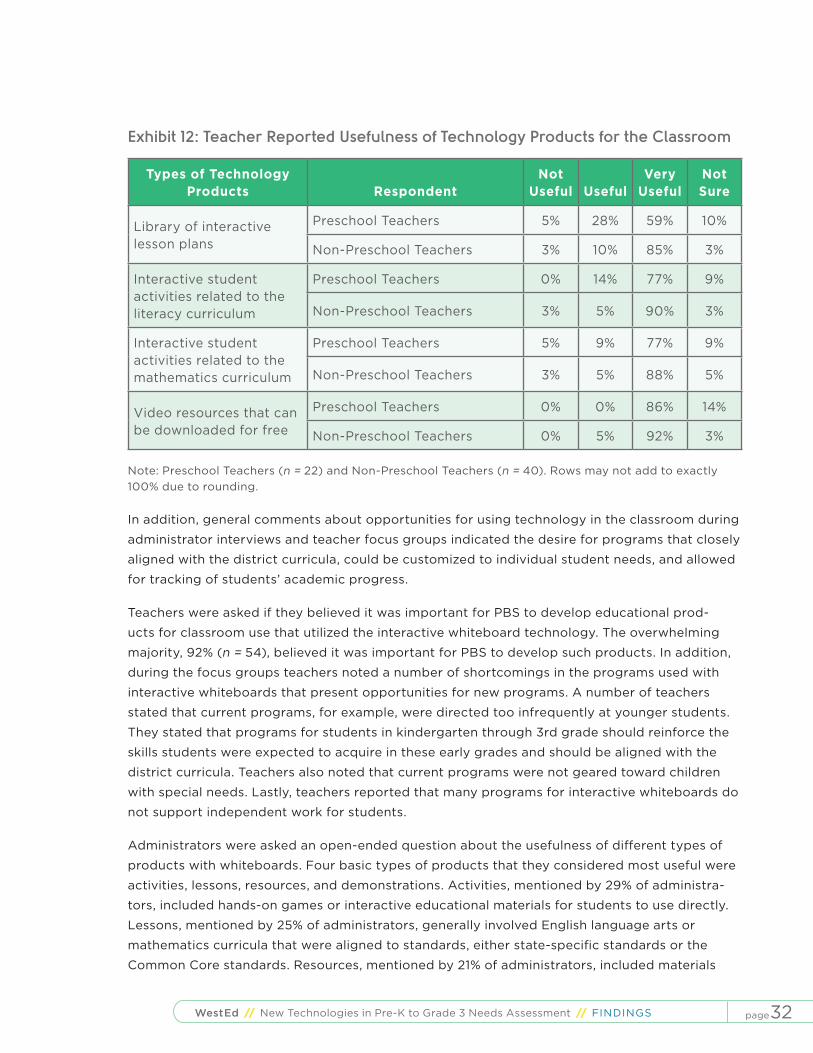
page32WestEd // New Technologies in Pre-K to Grade 3 Needs Assessment // FINDINGS
Exhibit 12: Teacher Reported Usefulness of Technology Products for the Classroom
Types of Technology Products Respondent
Not Useful Useful
Very Useful
Not Sure
Library of interactive lesson plans
Preschool Teachers 5% 28% 59% 10%
Non-Preschool Teachers 3% 10% 85% 3%
Interactive student activities related to the literacy curriculum
Preschool Teachers 0% 14% 77% 9%
Non-Preschool Teachers 3% 5% 90% 3%
Interactive student activities related to the mathematics curriculum
Preschool Teachers 5% 9% 77% 9%
Non-Preschool Teachers 3% 5% 88% 5%
Video resources that can be downloaded for free
Preschool Teachers 0% 0% 86% 14%
Non-Preschool Teachers 0% 5% 92% 3%
Note: Preschool Teachers (n = 22) and Non-Preschool Teachers (n = 40). Rows may not add to exactly 100% due to rounding.
In addition, general comments about opportunities for using technology in the classroom during
administrator interviews and teacher focus groups indicated the desire for programs that closely
aligned with the district curricula, could be customized to individual student needs, and allowed
for tracking of students’ academic progress.
Teachers were asked if they believed it was important for PBS to develop educational prod-
ucts for classroom use that utilized the interactive whiteboard technology. The overwhelming
majority, 92% (n = 54), believed it was important for PBS to develop such products. In addition,
during the focus groups teachers noted a number of shortcomings in the programs used with
interactive whiteboards that present opportunities for new programs. A number of teachers
stated that current programs, for example, were directed too infrequently at younger students.
They stated that programs for students in kindergarten through 3rd grade should reinforce the
skills students were expected to acquire in these early grades and should be aligned with the
district curricula. Teachers also noted that current programs were not geared toward children
with special needs. Lastly, teachers reported that many programs for interactive whiteboards do
not support independent work for students.
Administrators were asked an open-ended question about the usefulness of different types of
products with whiteboards. Four basic types of products that they considered most useful were
activities, lessons, resources, and demonstrations. Activities, mentioned by 29% of administra-
tors, included hands-on games or interactive educational materials for students to use directly.
Lessons, mentioned by 25% of administrators, generally involved English language arts or
mathematics curricula that were aligned to standards, either state-specific standards or the
Common Core standards. Resources, mentioned by 21% of administrators, included materials
page33WestEd // New Technologies in Pre-K to Grade 3 Needs Assessment // FINDINGS
teachers could use with students, such as sight words, how to form letters, or story mapping.
Demonstrations, mentioned by 6% of administrators, were ways to engage students in lessons,
such as using real-life mathematics and science situations.
There was much less consistency across administrator responses related to what products
teachers would find most valuable to use in the classroom. While some administrators repeated
their previous answers regarding lessons or activities, others focused more on content areas,
such as English language arts, mathematics, or science. Some administrators further broke the
content areas down into specific topics such as vocabulary, reading, phonics, language acquisi-
tion, measurement, or number sense. Other administrators mentioned the need for games and
interactive materials that engage students, or programs that differentiated instruction.
SUMMARY
Though participants reported limited access to interactive whiteboards, a majority of partici-
pants reported plans to obtain interactive whiteboards in the near future. These findings suggest
a strong interest in the use of interactive whiteboards in schools and districts. Barriers to inter-
active whiteboard use include lack of teacher expertise in using interactive whiteboards, lack of
technical support, poor Internet connectivity, and limited curricular materials and tools for chil-
dren from preschool to 3rd grade. One notable trend in the findings is that preschool teachers’
responses differed markedly from non-preschool teachers (elementary and out-of-school-time
educators). Exhibit 9 (above) shows that preschool teachers were much less likely to have access
to interactive whiteboard technology than non-preschool teachers. These data, along with data
from preschool teacher interviews, suggest that barriers to interactive whiteboard technologies
are somewhat magnified at the preschool level. In addition to lack of teacher expertise and tech-
nical support, poor classroom Internet connectivity, and limited access to curricular materials,
preschool teachers may not be familiar with the benefits of the interactive whiteboard.
page34WestEd // New Technologies in Pre-K to Grade 3 Needs Assessment // FINDINGS
ACCESS TO AND CAPACITY FOR OTHER TECHNOLOGIES IN PK-3 SCHOOLS AND PROGRAMS
WHAT TECHNOLOGIES DO CLASSROOMS AND PROGRAMS IN
UNDERSERVED SCHOOLS HAVE ACCESS TO? DO THEY HAVE
ACCESS TO COMPUTERS, INTERNET, IPADS, IPHONES, OR OTHER
INTERACTIVE EDUCATIONAL TECHNOLOGIES?
Teachers and administrators7 reported on the availability of technology in their schools (see
Exhibit 13). The data revealed that students either generally had the various technologies listed
in Exhibit 13 available to them daily or as needed, or did not have them available at all. A very
small percentage of the teachers and administrators reported that the technologies were avail-
able monthly or weekly. All or nearly all of the non-preschool (elementary and out-of-school-
time) teachers and administrators indicated that high-speed Internet and desktop computers
were available daily or as needed in their schools. In addition, the majority of respondents
serving elementary out-of-school-time students noted that wireless Internet, whiteboards,
laptops, and document cameras were available daily or as needed. Approximately half of the
teachers and administrators reported that webcams were available daily or as needed. In
contrast, the majority of the teachers and administrators reported that iPads, tablet PCs, iPod
Touches, electronic readers, and MP3 players generally were not available to their students.
Preschool teachers noted much lower access to technology. Only 22% reported access to high
speed Internet, 6% had wireless, 19% had webcams, and 22% had interactive whiteboards,
laptops, and/or desktop computers.
7 Administrators were not separated into preschool and non-preschool groups due to the majority of them having overlapping responsibilities.
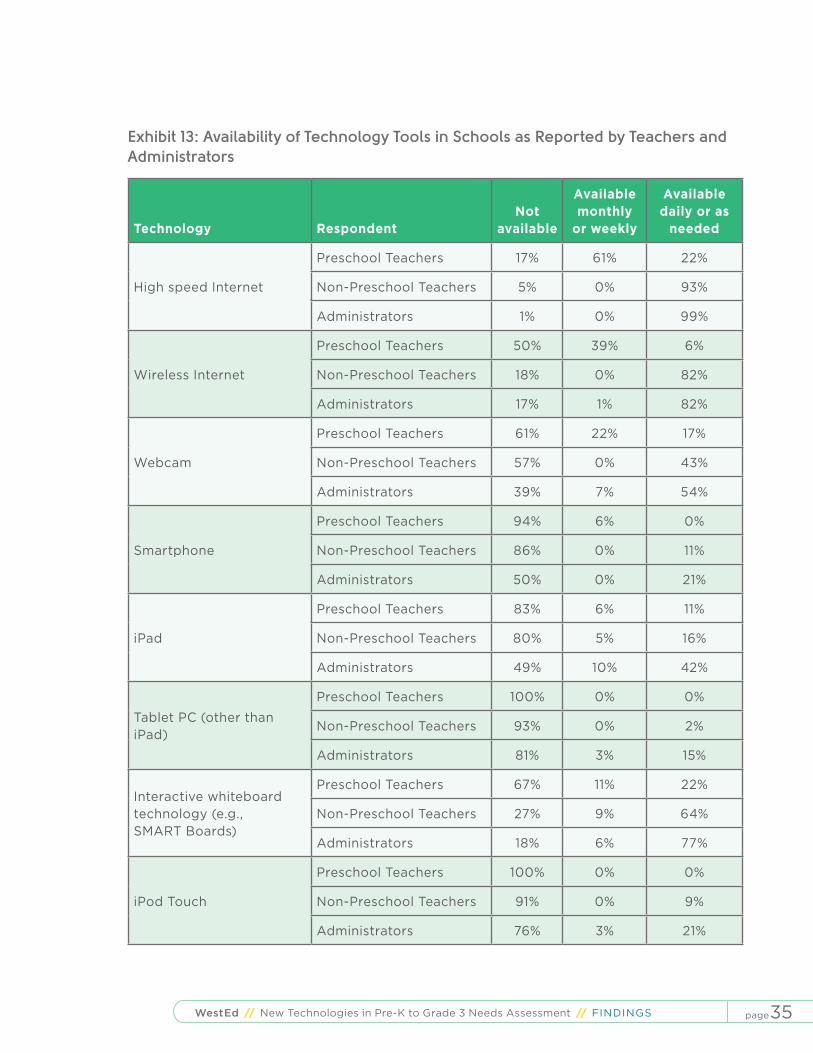
page35WestEd // New Technologies in Pre-K to Grade 3 Needs Assessment // FINDINGS
Exhibit 13: Availability of Technology Tools in Schools as Reported by Teachers and Administrators
Technology RespondentNot
available
Available monthly
or weekly
Available daily or as
needed
High speed Internet
Preschool Teachers 17% 61% 22%
Non-Preschool Teachers 5% 0% 93%
Administrators 1% 0% 99%
Wireless Internet
Preschool Teachers 50% 39% 6%
Non-Preschool Teachers 18% 0% 82%
Administrators 17% 1% 82%
Webcam
Preschool Teachers 61% 22% 17%
Non-Preschool Teachers 57% 0% 43%
Administrators 39% 7% 54%
Smartphone
Preschool Teachers 94% 6% 0%
Non-Preschool Teachers 86% 0% 11%
Administrators 50% 0% 21%
iPad
Preschool Teachers 83% 6% 11%
Non-Preschool Teachers 80% 5% 16%
Administrators 49% 10% 42%
Tablet PC (other than iPad)
Preschool Teachers 100% 0% 0%
Non-Preschool Teachers 93% 0% 2%
Administrators 81% 3% 15%
Interactive whiteboard technology (e.g., SMART Boards)
Preschool Teachers 67% 11% 22%
Non-Preschool Teachers 27% 9% 64%
Administrators 18% 6% 77%
iPod Touch
Preschool Teachers 100% 0% 0%
Non-Preschool Teachers 91% 0% 9%
Administrators 76% 3% 21%

page36WestEd // New Technologies in Pre-K to Grade 3 Needs Assessment // FINDINGS
Technology RespondentNot
available
Available monthly
or weekly
Available daily or as
needed
Laptop
Preschool Teachers 44% 33% 22%
Non-Preschool Teachers 21% 2% 77%
Administrators 11% 4% 85%
Desktop computer
Preschool Teachers 0% 78% 22%
Non-Preschool Teachers 0% 0% 100%
Administrators 1% 1% 97%
Video projector
Preschool Teachers 44% 6% 44%
Non-Preschool Teachers 18% 0% 82%
Administrators 4% 2% 93%
Document camera (e.g., ELMO Teacher’s Tool, Lumen’s Ladybug)
Preschool Teachers 50% 33% 17%
Non-Preschool Teachers 36% 5% 59%
Administrators 19% 5% 75%
Electronic reader (e.g., Nook, Kindle, etc.)
Preschool Teachers N/A N/A N/A
Non-Preschool Teachers 98% 0% 2%
Administrators 83% 4% 13%
MP3 player
Preschool Teachers N/A N/A N/A
Non-Preschool Teachers 91% 0% 9%
Administrators 74% 8% 17%
Video streaming
Preschool Teachers N/A N/A N/A
Non-Preschool Teachers N/A N/A N/A
Administrators 22% 4% 74%
Note: Preschool Teachers (n = 22) and Non-Preschool Teachers (n = 40) reported on the availability in their classrooms and administrators (n = 72) reported on the availability in their district, school, and/or preschool sites. Rows may not add to exactly 100% due to rounding.
During interviews and focus groups, administrators and non-preschool teachers serving elemen-
tary and out-of-school-time students reported having a number of technologies in the class-
room; foremost among these are laptop and desktop computers. Approximately a quarter of
respondents reported the use of computers “on wheels,” or movable carts with computers that

page37WestEd // New Technologies in Pre-K to Grade 3 Needs Assessment // FINDINGS
allowed for multiple classrooms to share a set of laptop computers. Many of these computers
on wheels were reported to utilize a central Internet access point, or hub, for wireless Internet
connectivity. A majority of teachers also reported access to fixed-location computers in the
classroom and/or computer labs. Additional technologies frequently reported by non-preschool
teachers and administrators include document cameras, projectors, and ELMOs (Electronic
Light-Modulated Overhead). In contrast, preschool teachers reported little access to technology.
Some reported having Little Tykes computers, or similar desktops with limited access to the
Internet. Some reported having access to laptops for teacher use, or access to an interactive
whiteboard at a neighboring school.
According to administrators, other technologies that were less common included iPads, clickers
for the interactive whiteboards, smartphones, and webcams. iPads and other tablets were
reported to present fiscal challenges because of the relative newness of the technology and
because discounts were difficult for schools and districts to obtain. In addition, administrators
reported that other technologies, such as the smartphones and webcams, presented limited
functionality for use in the classroom.
Administrators and teachers interviewed also reported that schools and districts were experi-
menting with using iPads at different grade levels. However, the expense of each device proved
prohibitive. Administrators indicated that less expensive, but still functional, alternatives such
as electronic readers and Android-based devices were more appealing to school districts with
restricted budgets. Similarly, teachers reported that inability to customize learning experiences
for students on iPads or other tablets, and inability to track students’ academic progress, were
disincentives to the adoption of tablet technology.
As shown in Exhibit 14, the majority of non-preschool teachers (79-82%) and administrators
(80-86%) reported that the teachers used technology to deliver literacy and mathematics
curricula. A significantly lower percentage of preschool teachers (55-59%) used technology to
deliver literacy and mathematics content. The teachers and administrators identified a number of
programs that they used technology to deliver. These programs included the Treasures Reading
Program, Everyday Mathematics, Houghton Mifflin Language Arts and Mathematics, and Scott
Foresman-Addison Wesley enVisionMATH. The teachers and administrators also reported using
technology to access a variety of websites, such as the Discovery Education website, starfall.com,
and educationcity.com.
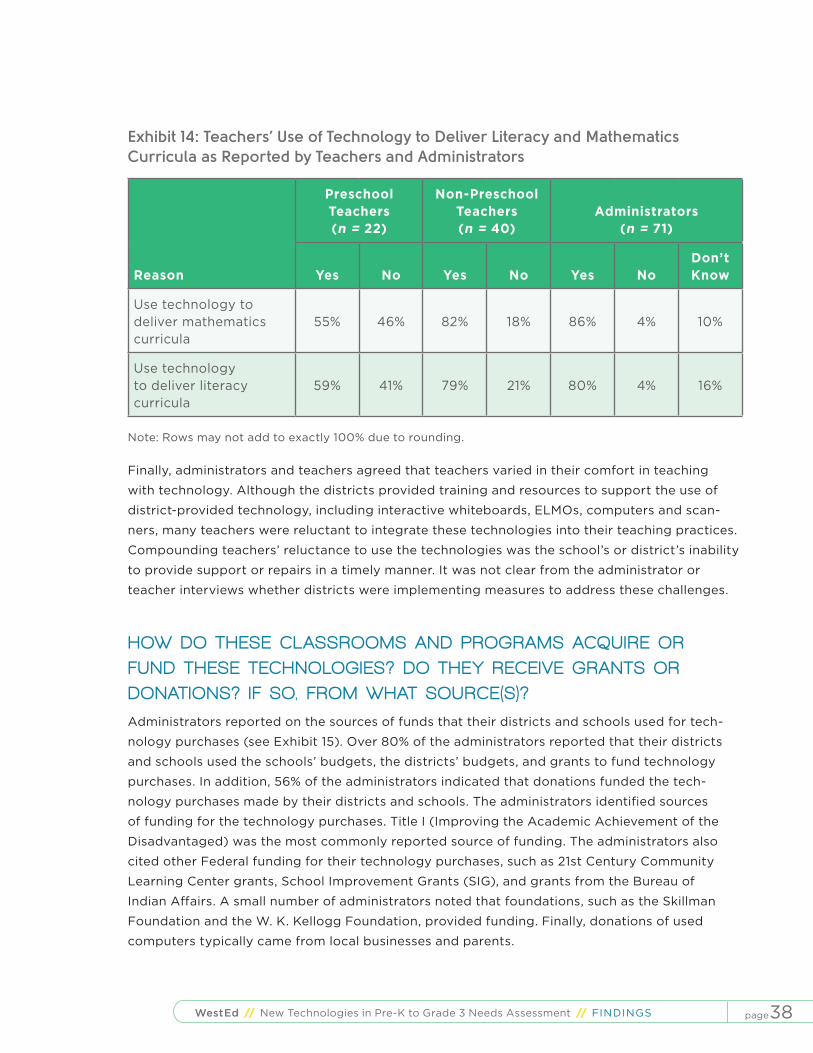
page38WestEd // New Technologies in Pre-K to Grade 3 Needs Assessment // FINDINGS
Exhibit 14: Teachers’ Use of Technology to Deliver Literacy and Mathematics Curricula as Reported by Teachers and Administrators
Reason
Preschool Teachers (n = 22)
Non-Preschool Teachers (n = 40)
Administrators (n = 71)
Yes No Yes No Yes NoDon’t Know
Use technology to deliver mathematics curricula
55% 46% 82% 18% 86% 4% 10%
Use technology to deliver literacy curricula
59% 41% 79% 21% 80% 4% 16%
Note: Rows may not add to exactly 100% due to rounding.
Finally, administrators and teachers agreed that teachers varied in their comfort in teaching
with technology. Although the districts provided training and resources to support the use of
district-provided technology, including interactive whiteboards, ELMOs, computers and scan-
ners, many teachers were reluctant to integrate these technologies into their teaching practices.
Compounding teachers’ reluctance to use the technologies was the school’s or district’s inability
to provide support or repairs in a timely manner. It was not clear from the administrator or
teacher interviews whether districts were implementing measures to address these challenges.
HOW DO THESE CLASSROOMS AND PROGRAMS ACQUIRE OR
FUND THESE TECHNOLOGIES? DO THEY RECEIVE GRANTS OR
DONATIONS? IF SO, FROM WHAT SOURCE(S)?
Administrators reported on the sources of funds that their districts and schools used for tech-
nology purchases (see Exhibit 15). Over 80% of the administrators reported that their districts
and schools used the schools’ budgets, the districts’ budgets, and grants to fund technology
purchases. In addition, 56% of the administrators indicated that donations funded the tech-
nology purchases made by their districts and schools. The administrators identified sources
of funding for the technology purchases. Title I (Improving the Academic Achievement of the
Disadvantaged) was the most commonly reported source of funding. The administrators also
cited other Federal funding for their technology purchases, such as 21st Century Community
Learning Center grants, School Improvement Grants (SIG), and grants from the Bureau of
Indian Affairs. A small number of administrators noted that foundations, such as the Skillman
Foundation and the W. K. Kellogg Foundation, provided funding. Finally, donations of used
computers typically came from local businesses and parents.
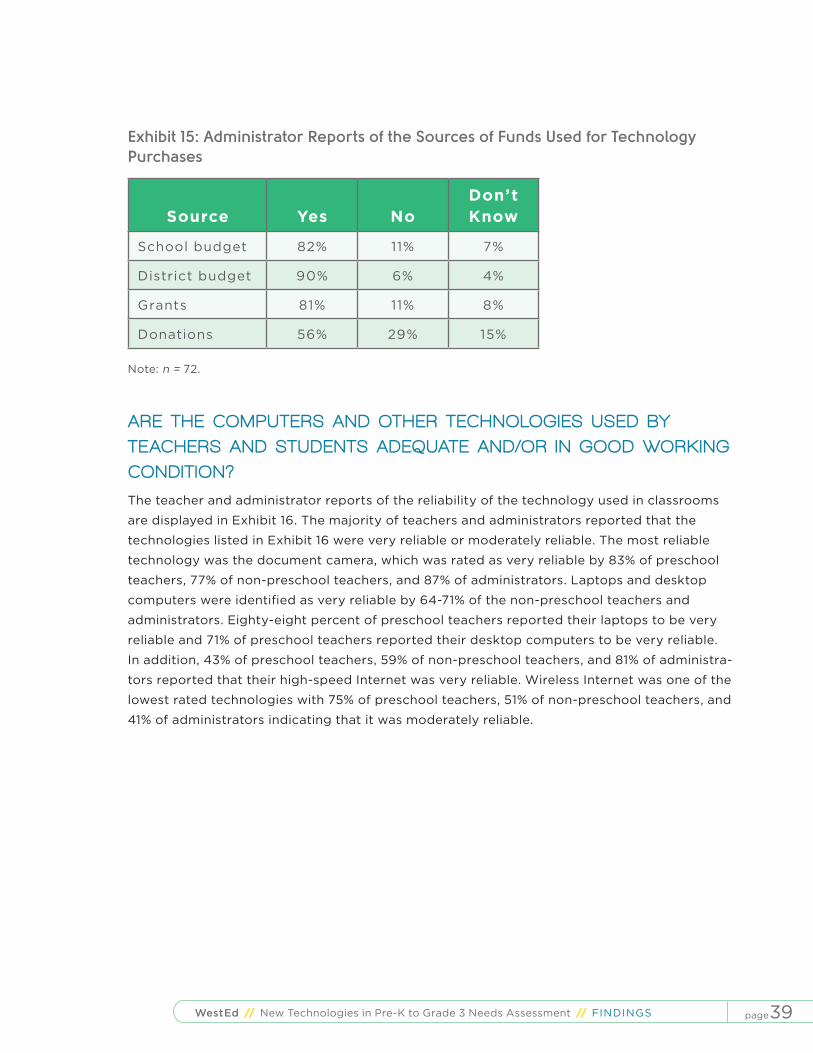
page39WestEd // New Technologies in Pre-K to Grade 3 Needs Assessment // FINDINGS
Exhibit 15: Administrator Reports of the Sources of Funds Used for Technology Purchases
Source Yes NoDon’t Know
School budget 82% 11% 7%
District budget 90% 6% 4%
Grants 81% 11% 8%
Donations 56% 29% 15%
Note: n = 72.
ARE THE COMPUTERS AND OTHER TECHNOLOGIES USED BY
TEACHERS AND STUDENTS ADEQUATE AND/OR IN GOOD WORKING
CONDIT ION?
The teacher and administrator reports of the reliability of the technology used in classrooms
are displayed in Exhibit 16. The majority of teachers and administrators reported that the
technologies listed in Exhibit 16 were very reliable or moderately reliable. The most reliable
technology was the document camera, which was rated as very reliable by 83% of preschool
teachers, 77% of non-preschool teachers, and 87% of administrators. Laptops and desktop
computers were identified as very reliable by 64-71% of the non-preschool teachers and
administrators. Eighty-eight percent of preschool teachers reported their laptops to be very
reliable and 71% of preschool teachers reported their desktop computers to be very reliable.
In addition, 43% of preschool teachers, 59% of non-preschool teachers, and 81% of administra-
tors reported that their high-speed Internet was very reliable. Wireless Internet was one of the
lowest rated technologies with 75% of preschool teachers, 51% of non-preschool teachers, and
41% of administrators indicating that it was moderately reliable.
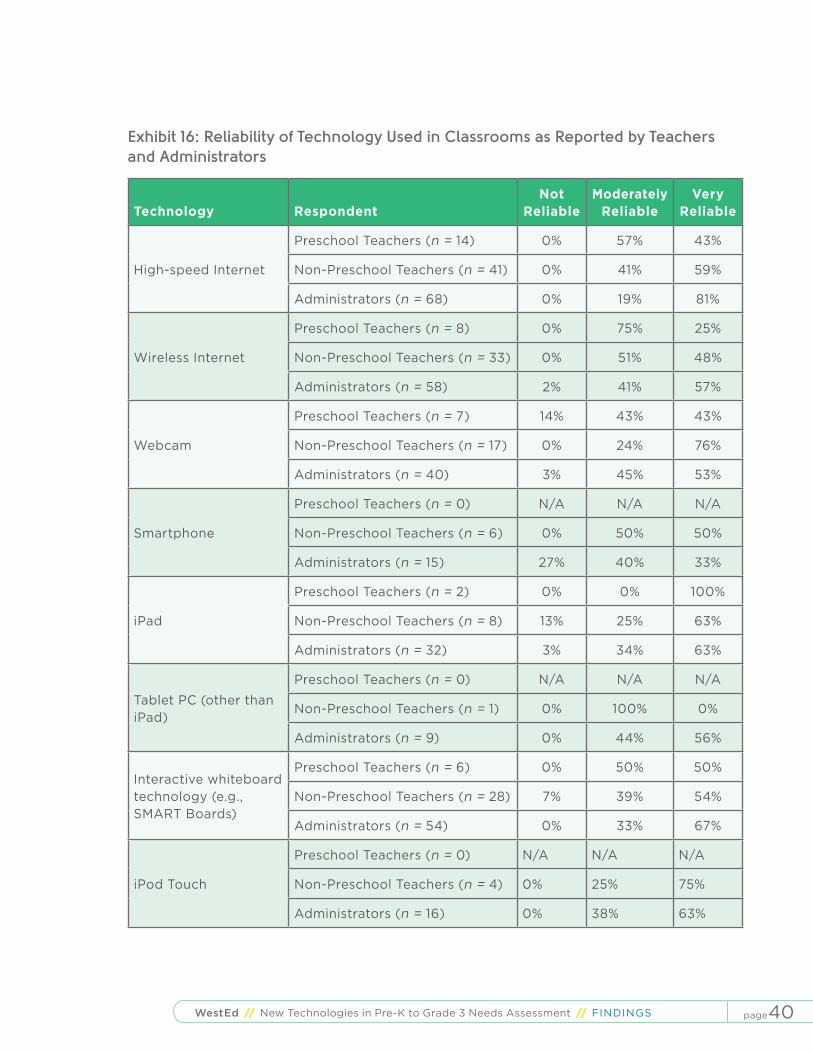
page40WestEd // New Technologies in Pre-K to Grade 3 Needs Assessment // FINDINGS
Exhibit 16: Reliability of Technology Used in Classrooms as Reported by Teachers and Administrators
Technology RespondentNot
ReliableModerately
ReliableVery
Reliable
High-speed Internet
Preschool Teachers (n = 14) 0% 57% 43%
Non-Preschool Teachers (n = 41) 0% 41% 59%
Administrators (n = 68) 0% 19% 81%
Wireless Internet
Preschool Teachers (n = 8) 0% 75% 25%
Non-Preschool Teachers (n = 33) 0% 51% 48%
Administrators (n = 58) 2% 41% 57%
Webcam
Preschool Teachers (n = 7) 14% 43% 43%
Non-Preschool Teachers (n = 17) 0% 24% 76%
Administrators (n = 40) 3% 45% 53%
Smartphone
Preschool Teachers (n = 0) N/A N/A N/A
Non-Preschool Teachers (n = 6) 0% 50% 50%
Administrators (n = 15) 27% 40% 33%
iPad
Preschool Teachers (n = 2) 0% 0% 100%
Non-Preschool Teachers (n = 8) 13% 25% 63%
Administrators (n = 32) 3% 34% 63%
Tablet PC (other than iPad)
Preschool Teachers (n = 0) N/A N/A N/A
Non-Preschool Teachers (n = 1) 0% 100% 0%
Administrators (n = 9) 0% 44% 56%
Interactive whiteboard technology (e.g., SMART Boards)
Preschool Teachers (n = 6) 0% 50% 50%
Non-Preschool Teachers (n = 28) 7% 39% 54%
Administrators (n = 54) 0% 33% 67%
iPod Touch
Preschool Teachers (n = 0) N/A N/A N/A
Non-Preschool Teachers (n = 4) 0% 25% 75%
Administrators (n = 16) 0% 38% 63%
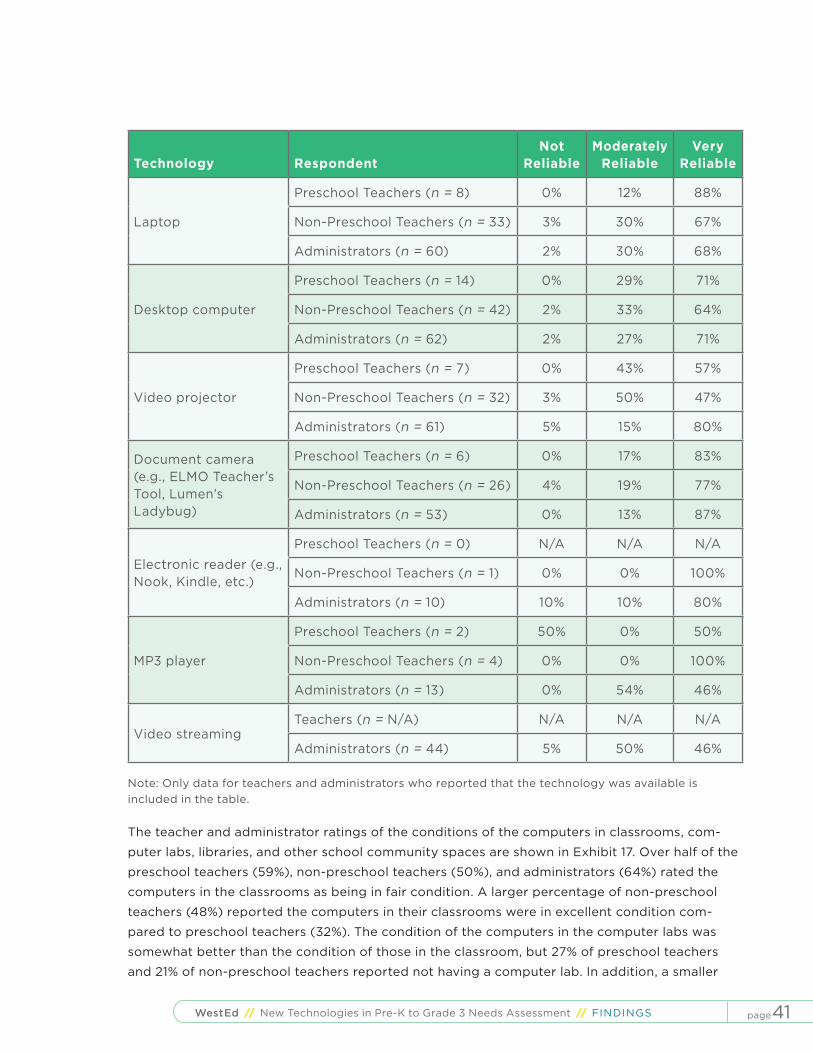
page41WestEd // New Technologies in Pre-K to Grade 3 Needs Assessment // FINDINGS
Technology RespondentNot
ReliableModerately
ReliableVery
Reliable
Laptop
Preschool Teachers (n = 8) 0% 12% 88%
Non-Preschool Teachers (n = 33) 3% 30% 67%
Administrators (n = 60) 2% 30% 68%
Desktop computer
Preschool Teachers (n = 14) 0% 29% 71%
Non-Preschool Teachers (n = 42) 2% 33% 64%
Administrators (n = 62) 2% 27% 71%
Video projector
Preschool Teachers (n = 7) 0% 43% 57%
Non-Preschool Teachers (n = 32) 3% 50% 47%
Administrators (n = 61) 5% 15% 80%
Document camera (e.g., ELMO Teacher’s Tool, Lumen’s Ladybug)
Preschool Teachers (n = 6) 0% 17% 83%
Non-Preschool Teachers (n = 26) 4% 19% 77%
Administrators (n = 53) 0% 13% 87%
Electronic reader (e.g., Nook, Kindle, etc.)
Preschool Teachers (n = 0) N/A N/A N/A
Non-Preschool Teachers (n = 1) 0% 0% 100%
Administrators (n = 10) 10% 10% 80%
MP3 player
Preschool Teachers (n = 2) 50% 0% 50%
Non-Preschool Teachers (n = 4) 0% 0% 100%
Administrators (n = 13) 0% 54% 46%
Video streamingTeachers (n = N/A) N/A N/A N/A
Administrators (n = 44) 5% 50% 46%
Note: Only data for teachers and administrators who reported that the technology was available is included in the table.
The teacher and administrator ratings of the conditions of the computers in classrooms, com-
puter labs, libraries, and other school community spaces are shown in Exhibit 17. Over half of the
preschool teachers (59%), non-preschool teachers (50%), and administrators (64%) rated the
computers in the classrooms as being in fair condition. A larger percentage of non-preschool
teachers (48%) reported the computers in their classrooms were in excellent condition com-
pared to preschool teachers (32%). The condition of the computers in the computer labs was
somewhat better than the condition of those in the classroom, but 27% of preschool teachers
and 21% of non-preschool teachers reported not having a computer lab. In addition, a smaller

page42WestEd // New Technologies in Pre-K to Grade 3 Needs Assessment // FINDINGS
percentage of preschool teachers, non-preschool teachers, and administrators rated the condi-
tion of the computers in the library and other school community spaces as fair to excellent.
Twenty-four percent of preschool teachers, 31% of non-preschool teachers, and 17% of admin-
istrators reported not having any computers in their library. Forty-five percent of preschool
teachers, 42% of non-preschool teachers, and 22% of administrators reported not having any
computers in an additional school community space.
Exhibit 17: Condition of the Computers in Selected Areas of Schools as Reported by Teachers and Administrators
Area RespondentPoor
ConditionFair
ConditionExcellent Condition
Don’t Know
Do Not
Have
Classroom
Preschool Teachers 10% 59% 32% 0% 0%
Non-Preschool Teachers 3% 50% 48% 0% 0%
Administrators 3% 64% 29% 3% 1%
Computer lab
Preschool Teachers 0% 32% 41% 0% 27%
Non-Preschool Teachers 3% 31% 44% 3% 21%
Administrators 0% 46% 47% 4% 3%
Library
Preschool Teachers 0% 33% 43% 0% 24%
Non-Preschool Teachers 5% 36% 26% 3% 31%
Administrators 3% 47% 32% 1% 17%
Other school community space
Preschool Teachers 0% 25% 20% 10% 45%
Non-Preschool Teachers 0% 25% 28% 6% 42%
Administrators 4% 42% 25% 7% 22%
Note: n = 22 for Preschool Teachers, 40 for Non-Preschool Teachers, and n = 73 for Administrators.
IN THESE SCHOOLS AND PROGRAMS, IS THERE A TOLERANCE
FOR STUDENTS USING INTERACTIVE TECHNOLOGIES SUCH AS
SMARTPHONES, IPODS, AND/OR IPADS?
Administrators were asked about the extent to which students in their districts, schools, or
preschools were allowed access to various technological devices (Exhibit 18). According to
administrators, the most common devices that students were allowed access to on a daily basis
or as needed were high-speed Internet (88%), desktop computers (81%), interactive whiteboards
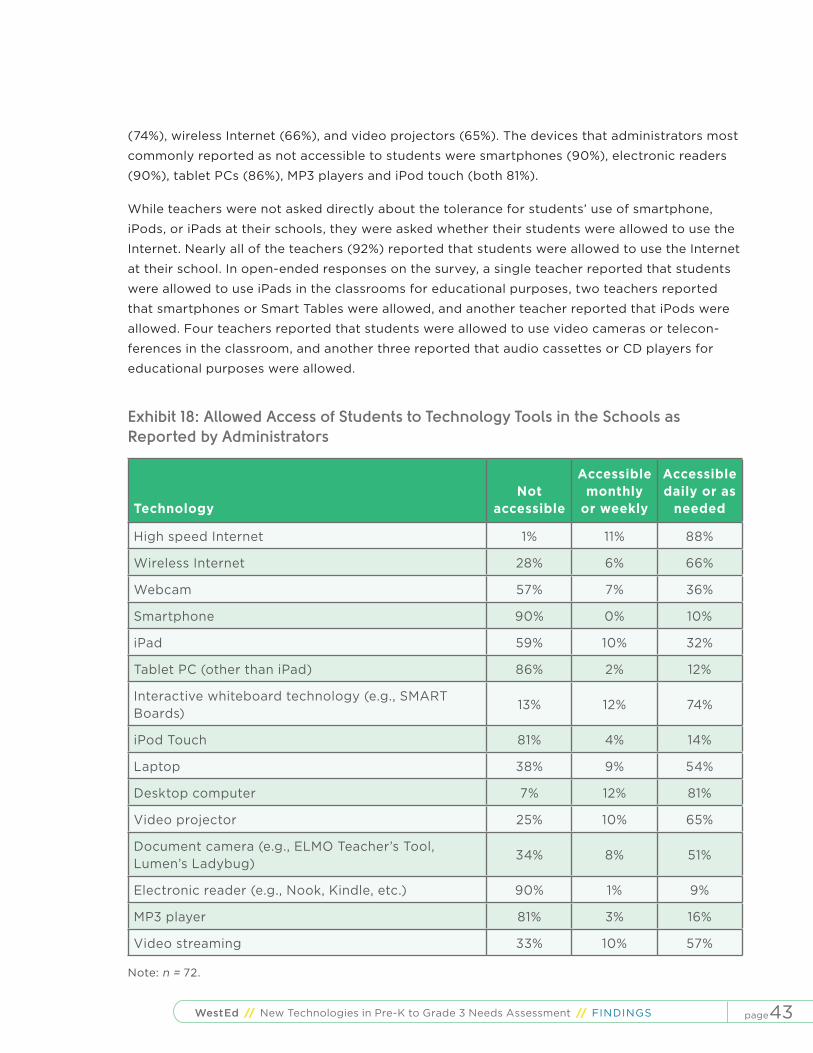
page43WestEd // New Technologies in Pre-K to Grade 3 Needs Assessment // FINDINGS
(74%), wireless Internet (66%), and video projectors (65%). The devices that administrators most
commonly reported as not accessible to students were smartphones (90%), electronic readers
(90%), tablet PCs (86%), MP3 players and iPod touch (both 81%).
While teachers were not asked directly about the tolerance for students’ use of smartphone,
iPods, or iPads at their schools, they were asked whether their students were allowed to use the
Internet. Nearly all of the teachers (92%) reported that students were allowed to use the Internet
at their school. In open-ended responses on the survey, a single teacher reported that students
were allowed to use iPads in the classrooms for educational purposes, two teachers reported
that smartphones or Smart Tables were allowed, and another teacher reported that iPods were
allowed. Four teachers reported that students were allowed to use video cameras or telecon-
ferences in the classroom, and another three reported that audio cassettes or CD players for
educational purposes were allowed.
Exhibit 18: Allowed Access of Students to Technology Tools in the Schools as Reported by Administrators
TechnologyNot
accessible
Accessible monthly
or weekly
Accessible daily or as
needed
High speed Internet 1% 11% 88%
Wireless Internet 28% 6% 66%
Webcam 57% 7% 36%
Smartphone 90% 0% 10%
iPad 59% 10% 32%
Tablet PC (other than iPad) 86% 2% 12%
Interactive whiteboard technology (e.g., SMART Boards)
13% 12% 74%
iPod Touch 81% 4% 14%
Laptop 38% 9% 54%
Desktop computer 7% 12% 81%
Video projector 25% 10% 65%
Document camera (e.g., ELMO Teacher’s Tool, Lumen’s Ladybug)
34% 8% 51%
Electronic reader (e.g., Nook, Kindle, etc.) 90% 1% 9%
MP3 player 81% 3% 16%
Video streaming 33% 10% 57%
Note: n = 72.

page44WestEd // New Technologies in Pre-K to Grade 3 Needs Assessment // FINDINGS
ARE THERE PROTOCOLS FOR STUDENTS REGARDING ACCESSING
WIRELESS INTERNET AND/OR VIDEO STREAMING?
Administrators reported on whether their districts and schools had guidelines and/or proce-
dures for video streaming and restrictions on video streaming (see Exhibit 19). One third of the
administrators reported that there were guidelines and/or procedures for video streaming and
44% reported that there were student restrictions on video streaming.
Exhibit 19: Guidelines and/or Procedures and Restrictions on Video Streaming as Reported by Administrators
Yes NoDon’t Know
School Doesn’t
Have this Technology
Not Allowed to
Use
Guidelines and/or procedures for video streaming
33% 21% 17% 18% 11%
Restrictions on video streaming
44% 11% 23% 22% N/A
Note: n = 73.
DO THESE SITES USE WEBCAMS? DO THESE SITES CONSIDER
WEBCAMS AN INTRUSION OF PR IVACY?
Thirty-two percent of all teachers (n = 19) had access to webcams in their classrooms and 45%
of administrators (n = 33) reported that teachers in their schools and districts had access to
webcams in their classrooms. Of the teachers with webcams, 32% (n = 6) used the webcams for
teaching and learning activities. The administrators also reported on how the teachers in their
schools and districts used webcams. According to administrators, the vast majority of the teachers
used the webcams for Skype and other video conferencing software applications, such as Google
Chat. The teachers used the video conferencing software applications to have their classes
interact with classes in other parts of the country and world. Students also used the webcams to
create video presentations and to take virtual field trips. Finally, the teachers used the webcams to
communicate with district personnel, engage in distance learning, and attend webinars.
The teachers and administrators who did not have access to webcams identified the reasons
why they did not have access (see Exhibit 20). Approximately 70% of the respondents indicated
that a lack of funds was the reason they did not have access to webcams. Security or privacy
concerns were the next most commonly identified reason followed by webcams not being
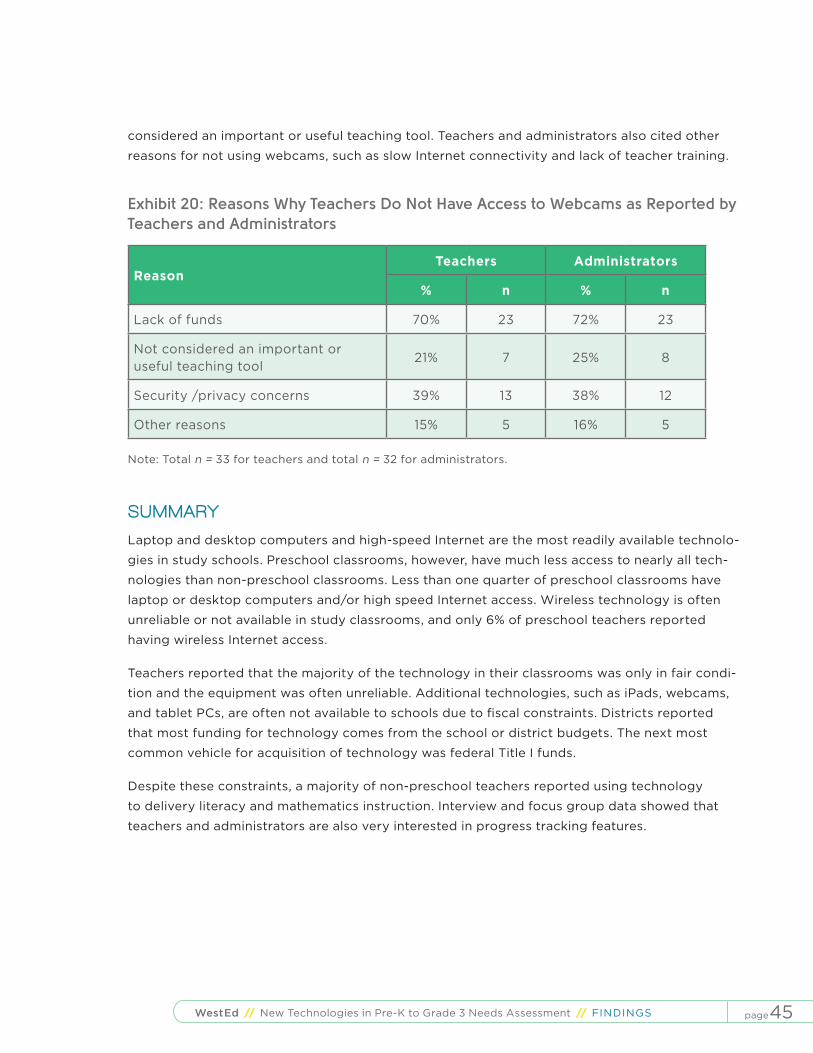
page45WestEd // New Technologies in Pre-K to Grade 3 Needs Assessment // FINDINGS
considered an important or useful teaching tool. Teachers and administrators also cited other
reasons for not using webcams, such as slow Internet connectivity and lack of teacher training.
Exhibit 20: Reasons Why Teachers Do Not Have Access to Webcams as Reported by Teachers and Administrators
ReasonTeachers Administrators
% n % n
Lack of funds 70% 23 72% 23
Not considered an important or useful teaching tool
21% 7 25% 8
Security /privacy concerns 39% 13 38% 12
Other reasons 15% 5 16% 5
Note: Total n = 33 for teachers and total n = 32 for administrators.
SUMMARY
Laptop and desktop computers and high-speed Internet are the most readily available technolo-
gies in study schools. Preschool classrooms, however, have much less access to nearly all tech-
nologies than non-preschool classrooms. Less than one quarter of preschool classrooms have
laptop or desktop computers and/or high speed Internet access. Wireless technology is often
unreliable or not available in study classrooms, and only 6% of preschool teachers reported
having wireless Internet access.
Teachers reported that the majority of the technology in their classrooms was only in fair condi-
tion and the equipment was often unreliable. Additional technologies, such as iPads, webcams,
and tablet PCs, are often not available to schools due to fiscal constraints. Districts reported
that most funding for technology comes from the school or district budgets. The next most
common vehicle for acquisition of technology was federal Title I funds.
Despite these constraints, a majority of non-preschool teachers reported using technology
to delivery literacy and mathematics instruction. Interview and focus group data showed that
teachers and administrators are also very interested in progress tracking features.
page46WestEd // New Technologies in Pre-K to Grade 3 Needs Assessment // CONCLUSION
CONCLUSIONThis report describes three comprehensive needs assessments that were conducted to deter-
mine (1) the readiness of underserved preschools, K-3 schools, and out-of-school time pro-
grams to implement interactive educational technologies on a variety of platforms, and (2) the
readiness of parents and guardians to receive communication about their children’s academic
progress using technology. Data were collected from parents, teachers, and non-teaching
district and school staff (e.g., principals, IT coordinators, and curriculum and instruction special-
ists) throughout the United States using surveys, semi-structured interviews, and focus groups.
The results of the needs assessments are intended to inform the work of CPB and PBS as they
plan product creation, including digital media for low-income schools and families. The focus
areas of the needs assessments are: 1) methods for communicating with parents of PK-3 chil-
dren, 2) access to and capacity for interactive whiteboard technology in PK-3 education set-
tings, and 3) access to and capacity for other technologies in PK-3 education settings.
The results of the needs assessments suggest that there is a strong interest in using technology
in PK-3 classrooms. Additionally, results identify potential areas for effectively developing
educational digital content for low-income schools and families. At the same time, there are still
enormous challenges to reaching parents, teachers, and students in underserved communities
with technology.
INTEREST IN US ING MORE TECHNOLOGY IN PK-3 CLASSROOMS Findings show that there is a strong interest for more use of technology in PK-3 classrooms.
Teachers and administrators reported that digital curricula are engaging and effective.
Administrators reported district and school plans to purchase more technology in the near
future, and indicated the need for PK-3 digital curriculum and tools. There is a strong desire for
these products, and the current study suggests that this desire will continue to grow.

page47WestEd // New Technologies in Pre-K to Grade 3 Needs Assessment // CONCLUSION
POTENT IAL AREAS FOR CONTENT DEVELOPMENTThe results suggest that there are particular areas of opportunity that can be targeted by PBS
for product development. These include: products for the interactive whiteboard, products with
webcam features, products that utilize progress tracking, and strategies for using technology to
communicate with parents of PK-3 children.
PRODUCTS FOR INTERACTIVE WHITEBOARDS AND CLASSROOM
COMPUTERS
Teachers and administrators were very interested in standards-aligned content for the interac-
tive whiteboard. These respondents indicated that there is a strong need for PK-3 curricular
content and tools for interactive whiteboards. Though not a particular focus of the needs assess-
ments, educators also mentioned that many of the products for the interactive whiteboard (e.g.,
Plato, Read180) also had components for classroom computers. They mentioned that they liked
having complementary content for each device. In addition, 76% of administrators mentioned
that their districts and schools have plans to purchase interactive whiteboards in the near future.
These findings suggest that products created for the interactive whiteboard would be well
received in low-income schools.
PRODUCTS WITH WEBCAM FEATURES
Though many schools and districts have some restrictions on webcam use and parents indicated
some reservations about their use, there is a strong interest in the use of webcams for learning
academic content. Findings indicate that as long as webcams are used for educational purposes,
schools and families are open to using them. About half of elementary schools and one-third of
families indicated they had access to webcams. As technology products are updated in coming
years, these percentages are expected to rise. Products with webcam features would most likely
be used in many low-income schools and homes in future years.
PRODUCTS THAT UTIL IZE PROGRESS TRACKING
Though the topic of progress tracking was not specifically targeted in the study, it did come
up in numerous focus groups and interviews. Elementary school teachers and administrators
mentioned that they had some experience with progress tracking in other digital products, and
they felt the concept held great promise. Many elementary school teachers and administrators
understand that one benefit of digital curricula and tools is that valuable data can be collected
from students while products are being used. Many teachers and administrators had used prod-
ucts in which individual student data had been extracted and they reported that this feature was
useful. Products with progress tracking may be welcomed at some schools.
page48WestEd // New Technologies in Pre-K to Grade 3 Needs Assessment // CONCLUSION
COMMUNICATING WITH PARENTS TO SUPPORT STUDENT LEARNING
Though the study found that many low-income parents had limited access to technology, many
are finding ways to communicate with their schools using technology. Teachers reported that
they found online gradebooks and teacher-created class websites to be effective ways to com-
municate with parents. Teachers report that though parents may not have computers or access
to the Internet in their homes, parents might visit the library or use school computers to check
these webpages. Some parents reported having access to the Internet via their phone rather than
a home computer. In focus groups, teachers reported that many parents used “pay as you go” cell
phones. Though these phones accepted text messages, parents often have to pay extra for them.
Therefore, teachers said that sending text messages was not always the best way to communi-
cate with the parents of their students. One point of entry for parent digital content that supports
student learning may be web-based content that parents can access via teacher webpages,
online gradebooks, or mobile applications. Another strategy for reaching parents may involve
giving parents multiple options for accessing content, including web-based and texting options.
AREAS OF CHALLENGEThe needs assessment study addressed needs in three areas: methods for communicating with
parents of PK-3 children, access to and capacity for interactive whiteboard technology in PK-3
education settings, and access to and capacity for other technologies in PK-3 education set-
tings. The findings suggest that tremendous challenges continue to exist in these three areas.
Particular challenges at the elementary school level are related to the capacity of parents and
schools to access digital media. Challenges at the preschool level also involve access, in addition
to questions about teachers’ capacity to effectively integrate digital media into instruction.
REACHING THE LOWEST- INCOME PARENTS AND SCHOOLS
Equipment and connectivity continue to be a tremendous hurdle to technology use in low-
income schools and homes. About half the homes included in the study did not have access
to computers or high speed Internet. Elementary schools have more access to computers and
connection to the Internet, but their computers are often in poor condition and unreliable. In
addition, most low-income classrooms do not have access to interactive whiteboards, iPods or
iPads. In the near term, a large proportion of low-income schools and families will struggle to
access digital media.
INTRODUCING DIGITAL PRODUCTS IN THE PRESCHOOL ENVIRONMENT
The preschool age group currently poses particular challenges for producers seeking to pro-
vide digital content for underserved classrooms. Preschools in the study reported extremely
low access to technology, including computers and Internet access. Very few preschools had

page49WestEd // New Technologies in Pre-K to Grade 3 Needs Assessment // CONCLUSION
access to technology other than computers. In addition, focus group data suggest that pre-
school teachers are not familiar with the benefits of technology such as interactive whiteboards
and iPads, highlighting the need for ongoing professional development in this area. Preschool
teachers also indicated they were less comfortable using various technologies compared to their
elementary school colleagues.
RECOMMENDAT IONSThe following recommendations stem from the studies’ findings.
» Continue to study how low-income families access and use digital media.
» Pilot test methods of media delivery to low-income parents and high-need schools to ensure that content and delivery are amenable to the target populations.
» Explore methods to reach low-income classrooms that do not have reliable Internet connectivity.
» Continue to explore which types of interactive whiteboard curricula and tools that are most desired by PK-3 teachers.
» Create guidelines for webcam use that can be used by schools and parents to help allay safety concerns associated with webcam use.
» Explore the use of online gradebooks to communicate with parents about their children’s learning.
» Pilot test early project tracking models in low-income schools.
» Pilot test early models of communicating with low-income parents about their students’ learning. Consider using models that give parents multiple pathways to access informa-tion (e.g., email, online gradebooks and texting).