Embed Size (px)
Citation preview
The Central Sydney Walk to School Research Program
2005-2007
New South Wales Health Promotion Demonstration
Research Grants Scheme
Produced by:
Centre for Health Advancement
Population Health Division
NSW DEPARTMENT OF HEALTH
73 Miller St
North Sydney NSW 2060 Australia
Tel. (02) 9391 9000
Fax. (02) 9391 9101
TTY: (02) 9391 9900
www.health.nsw.gov.au
This work is copyright. It may be reproduced in whole or part for study or training purposes
subject to the inclusion of an acknowledgment of the source. It may not be reproduced
for commercial usage or sale. Reproduction for purposes other than those indicated above
requires written permission from the NSW Department of Health.
© NSW Department of Health 2009
Suggested citation: Fry D, Wen L M, Merom D, Dirkis H, Rissel C, Balafas A. The Central
Sydney Walk to School Research Program 2005-2007. Sydney: NSW Department of Health,
2009.
This is the report of a project sponsored by the New South Wales Health Promotion
Demonstration Research Grants Scheme funded by the NSW Department of Health.
The project was conducted by the Health Promotion Service of Sydney South West Area
Health Service.
SHPN (CHA) 090101
ISBN 978-1-74187-369-6
Further copies of this publication can be obtained from the NSW Department of Health
website at: www.health.nsw.gov.au
Disclaimer: Content within this publication was accurate at the time of publication.
September 2009
Central Sydney Walk to School Research Program NSW HealtH PAGE i
Contents
Acknowledgments ........................................................................................................................................ ii
List of tables and figures ............................................................................................................................. iv
Abbreviations and acronyms .......................................................................................................................v
Executive summary ..................................................................................................................................... vi
1 Introduction ............................................................................................................................................1
2 Aims and objectives ..............................................................................................................................5
3 The intervention .....................................................................................................................................6
4 Research and evaluation methods .....................................................................................................13
5 Results .................................................................................................................................................17
6 Discussion ............................................................................................................................................24
7 Conclusions and recommendations ...................................................................................................29
References ..................................................................................................................................................31
List of appendices ......................................................................................................................................34
For copies of Appendices A-N, please contact:
Health Promotion with Schools team
Health Promotion Service
Sydney South West Area Health Service
level 9 Nth, KGV Building
Missenden Rd Camperdown NSW 2050
Ph: 02 9515 9055
email: [email protected]
PAGE ii NSW HealtH Central Sydney Walk to School Research Program
the Central Sydney Walk to School Research Program
was funded by NSW Health through the NSW Health
Promotion Demonstration Research Grants Scheme and
conducted by the Health Promotion Service of Sydney
South West area Health Service. the project was carried
out between 2004 and 2007.
this project has been supported by the following:
Project Management Team
li Ming Wen, Helen Dirkis, Chris Rissel, angela Balafas
(Health Promotion Service, Sydney South West area
Health Service) and Dafna Merom (Centre for Physical
activity and Health)
Project Officer: Denise Fry
Advisory committeeHealth Promotion Service, Sydney South West Area Health ServiceChris Rissel, li Ming Wen, Helen Dirkis, angela Balafas
Centre for Physical Activity and HealthDafna Merom
Leichhardt CouncilVera Zaccari (Road Safety Officer)
Department of Education and Training Paul Doorn (formerly Road Safety Consultant,
Department of education and training)
Sandra Coppe (Road Safety Consultant, St George
Region, Department of education and training)
Peter Crawshaw (Principal, annandale North Public
School, 2004-5)
Roger Rieger (Principal, Harcourt Public School, Campsie)
Federation of Parent and Citizens AssociationsJennifer Barker
Centre for Health Advancement, NSW Department of Healthandrew Milat and Peta lucas
Schools and NSW Department of Education and Training Sincere thanks to the NSW Department of education and
training and to the 24 participating primary schools,
especially principals, assistant principals, office and
support staff, Year 4, 5 and 6 teachers, students and
parents. Without the enthusiastic involvement of all these
people, the program could not have taken place.
the schools were:
abbotsford Public School
ashfield Public School
Beverly Hills North Public School
Birchgrove Public School
Campsie Public School
Camdenville Public School
Concord Public School
Dobroyd Point Public School
enfield Public School
Five Dock Public School
Glebe Public School
Haberfield Public School
Homebush Public School
lewisham Public School
Marrickville Public School
Newtown Public School
Orange Grove Public School
Petersham Public School
Rozelle Public School
Strathfield North Public School
Strathfield South Public School
Summer Hill Public School
tempe Public School
Ultimo Public School
acknowledgments
Central Sydney Walk to School Research Program NSW HealtH PAGE iii
We wish to thank the following people and organisations
for their valuable contributions to the program:
n Road Safety Officers, traffic engineers and other
officers in the councils of ashfield, Burwood, Canada
Bay, Canterbury, City of Sydney, leichhardt,
Marrickville, and Strathfield who assisted with safety
reviews of the schools and their vicinities, and with the
provision of large-scale maps to schools
n Mr Sonny Cabalag of the State transit authority who
kindly supplied multiple copies of bus route maps and
timetables for distribution with the school travel access
Guides, and City Rail which also supplied train
timetables for the same purpose
n Staff members of the Health Promotion Service, Sydney
South West area Health Service at Camperdown who
assisted, including Jeni Bindon who led the parent
walks and angela Balafas and Denise Barry for
communication and design work
n Penny Biggins and Kim Paul for organisation,
distribution, collection and processing of student and
parent surveys, and for preparation of school specific
reports
n McNair Ingenuity Research for data entry
n Professor Jennifer Peat for technical assistance with the
data analyses.

PAGE iv NSW HealtH Central Sydney Walk to School Research Program
list of tables and figures
table 1 Overview and sequence of program activities ................................................................................................7
table 2 Schools and numbers of participating classes and students in the Walk to School (intervention)
and the Healthy lunch (control) groups ........................................................................................................8
table 3 Implementation of strategies for the Walk to School group in 2005 and 2006 .............................................10
table 4 Comparison of baseline characteristics of students who completed baseline and follow-up surveys ..............17
table 5 Baseline patterns of travel to and from school in control and intervention groups ........................................18
table 6 Change in travel mode between baseline and follow-up in control and intervention groups
(from student data) .....................................................................................................................................19
table 7 Change in percentage of students who walked all the way to school (all days and some days) in
intervention and control groups from baseline to follow-up .........................................................................19
table 8 Change in percentage of students who walked all the way home (all days and some days) in
intervention and control groups from baseline to follow-up .........................................................................20
table 9a Change in the percentage of students who walked all the way to school in a usual week, from
parent data (n=807) at follow-up, stratified by student age and distance from home to school. ...................21
table 9b Change in percentage of students who went to school by car in a usual week, from parent data
(n=807) at follow-up, stratified by student age and distance from home to school .......................................21
table 10 Predictors (by multivariate analysis) of student non-car travel in 1,234 students following the
intervention, based on student survey data ..................................................................................................22
Figure 1 evaluation design .........................................................................................................................................13
Central Sydney Walk to School Research Program NSW HealtH PAGE v
abbreviations and acronyms
the following abbreviations and acronyms are used in this report:
CS Central Sydney
CSaHS Central Sydney area Health Service
Det NSW Department of education and training
Hl Healthy lunch
lGa local Government area
RCt Randomised Controlled trial
Rta NSW Roads and traffic authority
SSWaHS Sydney South West area Health Service
taG travel access Guide
tDC transport Data Centre
WSB Walking School Bus
WtS Walk to School

PAGE vi NSW HealtH Central Sydney Walk to School Research Program
executive summary
Issue
the Central Sydney Walk to School Research Program
was conducted in response to the ongoing decline in the
percentage of school children who walk to and from
school, and because of the significant health, social and
environmental benefits that result from reduced car use
and increased walking.
Methods
the program was conducted by the Health Promotion
Service of Sydney South West area Health Service from
2004 to 2007. the program was a cluster randomised
controlled trial which developed, implemented and
evaluated a multi-component intervention to increase the
number of upper primary school children who walked all
or some of the way to and from school. More than 2,200
students (aged 10-12 years) and their parents in 24
public primary schools participated. Before and after the
program’s interlinked interventions, surveys were
completed by students and their parents on how
students travelled to school and from school.
the interventions consisted of education strategies for
teachers, students and their parents (professional
development for teachers, parent newsletters, classroom
resources, development of a travel access Guide for each
school, pedometer programs, and preparation for high
school); and working with councils to identify and fix
hazards to safety and walkability near participating
schools and their vicinities.
Results
the baseline survey found that car travel was the main
mode of travel to and from school. there was a high
variation from school to school in student travel patterns,
and the factor most strongly associated with students
travelling by car was their parents’ car journey to work.
the evaluation produced a mixed result, as the increase
in walking found in the data reported by parents was not
found in the data reported by students. Follow-up survey
results from the cohort of 807 parents (who completed
baseline and follow-up surveys) found that the
intervention had a positive effect (9.8% of students
increased their walking, p=0.05), but analysis of the data
reported by students did not yield a similar result. For the
journey to school, walking increased in some schools in
the intervention and the control groups, with a large
range in the rates of change (-14.3% to 20%). the
program achieved limited improvements in making
schools and their vicinities more suitable for active and
safe travel.
Conclusions
It is likely that key factors influencing how students travel
to and from school are their parent’s journey to work,
availability and frequency of public transport, and safety
and walkability of neighbourhoods. It was hard to discern
an overall pattern in the results, due to the high variation
in the percentages of students in the intervention and
control schools who changed their travel mode. the
research identified the strong influence of the parent’s
journey to work on their child’s journey to school. Making
environments more suitable for active and safe travel
requires the involvement of additional agencies and
improvements to physical infrastructure and public
transport.
So What?
a complex interaction of multiple social and local factors
influences student and parent travel to school. Future
active travel to school programs should include the
parent journey to work. It is essential to collaborate with
local councils and state public transport, roads, and
environmental protection agencies that have the capacity
to change the main determinants of travel to school. the
impacts of climate change provide additional compelling
reasons to develop effective active travel programs.
Central Sydney Walk to School Research Program NSW HealtH PAGE 1
the Central Sydney (CS) Walk to School (WtS) Research
Program, hereafter referred to as the WtS Program, was
conducted in response to the ongoing decline in the
percentage of school children who walk to and from
school, and the lack of rigorous evidence on the
effectiveness of programs established to increase active
travel to and from school.1 the project was conducted by
the Health Promotion Service of Sydney South West area
Health Service (SSWaHS) from 2004 to 2007. In 2005
Central Sydney area Health Service (CSaHS) was
amalgamated with South West Sydney area Health
Service to become SSWaHS.
the WtS Program involved the development and
implementation of a multi-component intervention that
aimed to increase the number of upper primary school
children (aged 10-12 years) who walked all or some of
the way to and from school; and used a cluster
randomised controlled trial (RCt) to evaluate the
intervention’s effectiveness.
Within the WtS Program, 12 schools were in the Walk to
School (WtS) (intervention) group and 12 schools were in
the Healthy lunch (Hl) (control) group. the program’s
interventions were designed to be sequential (so that
initial strategies informed later strategies) and synergistic
(making key strategies interactive to maximise their
effects). the program’s survey data on travel patterns
were used to tailor and adjust the interventions for
specific schools in response to their differing needs.
this Final Report describes the rationale for the WtS
Program and reviews the impact of other interventions to
increase safe and active travel to school. It describes the
program’s goals and objectives, research design and
methods, and the interventions developed and
implemented during 2005 and 2006.
this report contains an evaluation of the program’s
effectiveness, based on data analyses and results from
the student and parent surveys, and other process data.
the report ends with a discussion of the evaluation
findings, and conclusions and recommendations.
SeCtION 1
Introduction
Rationale
Reduced use of cars and increased rates of walking can
lead to health, environmental and social benefits for
children and adults.2,3 Contemporary public health
research and policy recognises that transport systems and
urban design at international, national, regional and local
levels affect the health and safety of populations in terms
of injuries due to road crashes, air pollution, traffic
congestion and noise, insufficient levels of physical
activity, access to essential goods and services and social
exclusion of those without transport.4,5
Many adults remember walking or cycling to school, but
today most primary school children travel to and from
school by car, even though many of them live within
walking distance of their school. From 1971-2003, the
percentage of children aged five to nine years walking to
school has been steadily decreasing, from 57.7 per cent
in 1971 to 25.5 per cent in 1999-2003. the percentage
of students travelling to school by car has been steadily
increasing, from 22.8 per cent in 1971 to 47.8 per cent
in 1999-2003.6
the NSW Schools Physical activity and Nutrition Study
conducted in 2004 found that while 70 per cent of
secondary school students went to school by active travel
(walking, cycling and/or public transport), in primary
schools just over 20 per cent of Year 6 students, aged
11-12 years, walked to school every day of the school
week, 20 per cent used public transport, 35 per cent
travelled by car and the remaining percentage used more
than one travel mode during the week.7
travel patterns are often formed in childhood, with
children learning what they perceive to be a ‘normal’
pattern from their parents.8 the journey to and from
school has been an opportunity for children to take their
first independent journey in their own neighbourhood,
and to do some physical activity regularly.
PAGE 2 NSW HealtH Central Sydney Walk to School Research Program
the National Guidelines on Physical activity for Children
recommend that children aged five to 12 years should
spend at least 60 minutes a day doing moderate to
vigorous physical activity.9 While walking or cycling to
and from school may help to meet these physical activity
requirements, there is insufficient evidence on the
effectiveness of interventions that aim to increase active
travel.
Many factors are seen as inhibiting children walking to
and from school, and their physical activity generally.
Many parents believe that their children live in
environments that are more dangerous than in previous
times, and some parents are reluctant to let their children
go to places independently due to fears of crime and of
dangerous traffic.10,11 these views reinforce children’s
dependence and restrict their mobility.12,13 Such trends
have a cumulative effect, particularly when parental
concerns lead to more parents driving their children to
school, thus increasing the traffic congestion and hazards
around schools.14
the way that parents travel to work has a strong
influence on how their children travel to school. an
increased level of walking to school in children has been
found to be independently associated with their parents’
active travel journey to work.15 Other studies have found
an inverse association between students walking to
school and their parents’ perceptions that there is not
enough time in the morning to walk with their children
to school and to get to work on time,16 and parents
reporting limited access to public transport.17
another factor that contributes to the increased number
of students who go to school by car is their attendance at
schools outside their local area, which usually means that
schools are located more than a walkable distance from
students’ homes.8 two australian studies have
demonstrated that the level of walking to school sharply
declines when distance from home to school, whether
objectively measured17 or self-reported,15 exceeds 0.8km.
Interventions to increase walking to and from school
In the last five years the number of health and transport
interventions that aim to reduce car use and increase
active travel has rapidly expanded.1 active travel is
defined as walking, cycling and/or public transport, either
separately or in combination.18,19 Schools, like
workplaces, generate a significant volume of weekday
traffic. an increase in active travel to and from school
may reduce traffic congestion near schools, and assist
large numbers of children and their parents to increase
their levels of physical activity. Since the start of the WtS
Program, UK and several european countries have funded
programs that aim to change the way students travel to
and from school, from being driven to walking, cycling
and/or public transport.20
Since 1998, the Ministry of transport in the UK has
funded more than 2,000 schools to employ travel
advisors to develop and implement School travel Plans.
Some local government authorities have also built cycle
routes and introduced infrastructure and traffic
management changes designed to improve safety on
school routes.21 an evaluation of the impact of School
travel Plans in North london found that student travel
patterns did not change at schools that had travel
coordinators to implement the plans, and parental fears
were not reduced.22
Since 1997 a number of US states have funded programs
to improve the safety of school children walking and
bicycling to school. the programs include funds for
infrastructure, education and enforcement. the Safe
Routes to School Program in California provided
competitive funds to schools and other local
organisations for educational programs and construction
projects such as footpaths, traffic lights, pedestrian
crossing improvements and bicycle paths. an evaluation
of the program examined the relationship between
changes to urban form and rates of walking and bicycle
travel to school.23 the study found that children who
passed completed Safe Routes to School construction
projects on their way to school were more likely to show
increases in walking or bicycling to school than were
children who did not pass such projects (15% compared
to 4%).
Central Sydney Walk to School Research Program NSW HealtH PAGE 3
In 2005 the US National Safe Routes to School Program
was established with federal legislation and funds. the
program is providing $612 million over five years to State
Departments of transportation in the 51 states of the
USa to improve the ability of students to walk and
bicycle safely to school. like the Californian program, the
Federal Safe Routes to School Program includes capital
funds for infrastructure and traffic management projects,
as well as funds for school and community-based
education.24 States have been keen to participate, with
29 states providing additional funds for 686 schools in
local or state-wide programs.25 at this stage an
evaluation of the effectiveness of this ambitious program
is not available, but this program is of interest as it
provides substantial funds for improving the safety and
walkability of the physical environment of schools and
their vicinities.
In australia a number of programs aimed at increasing
the numbers of students who walk or cycle to school
have been funded by national and state agencies. Most
of these projects have used education as their main
strategy, and their budgets have not included funds to
modify or improve physical environments.26 these
projects include the travelsmart series of projects on
active travel (including active travel to school), in several
states and territories including aCt, Wa, Vic, Qld and Sa.
these programs were cost-shared between the australian
Greenhouse Office in the australian Department of
environment and Heritage, and participating state
governments. a review of these programs found their
evaluation methods to be generally weak.20
the Walking School Bus (WSB) is a strategy that has
received broad publicity and wide implementation in
Victoria. the Victorian Health Promotion Foundation
allocated $4.5 million from 2001-2010 to fund 60
councils to work with schools and parents to establish
WSBs. the WSB is a way of supervising children walking
to and from school. Children walk in a group with adults
who act as a ‘driver’ at the front and a ‘conductor’ at the
rear of the group. the ‘bus’ travels a set route and picks
up passengers at designated stops on the way. an
evaluation of the VicHealth funded program found that
its reach was small, with each WSB coordinator working
with three to four schools, and organising an average of
three-and-a-half WSBs per school.27
VicHealth has calculated that the average number of
children per WSB was nine-and-a-half, with less than six
per cent of the student population in participating
schools taking part in a WSB.28
these evaluation findings make it hard to judge the WSB
strategy as either effective in changing how most
students and parents travel to and from school, or
cost-effective given the large amount of funds required
to achieve a small effect. In addition, the WSB enables
parents to continue to drive to work, and so does not
necessarily reduce car use. On the basis of these findings,
VicHealth decided not to fund WSB programs beyond
2010. VicHealth’s new Streets ahead program takes a
different approach by aiming to increase children’s
independent mobility. this program has funded six
councils to improve the walkability and safety of
neighbourhoods in their municipalities.29 While the WSB
may be a useful strategy for some communities, it should
not be the only approach used to increase active travel to
school. Other strategies are needed.
In NSW an annual Walk Safely to School Day has been
run since 2001 by the Pedestrian Council of NSW. the
day is held on a Friday in april or May, and information
and marketing strategies have been used to encourage
parents to walk to school with their children. an
evaluation of the program found that 28 per cent of all
NSW primary schools participated in the day’s activities.
two telephone surveys of parents of children aged five to
12 years indicated that of the surveyed children who
usually travelled to school by car on a Friday, 6.2 per cent
walked to school on Walk Safely to School Day in 2001,
as did 11.3 per cent in 2002. However, it is unclear if
parents and students would or could extend the change
they made from one day of the year to their regular
journey to school.30
In general these programs have either been low level
awareness raising activities, or have engaged with a small
percentage of the intended participants. Most programs
have not been well evaluated and there are few examples
of studies that use intervention and control groups. as
yet it is still unclear to what degree school-based WtS
interventions can increase the proportion of students
who walk to and from school.

PAGE 4 NSW HealtH Central Sydney Walk to School Research Program
Previous work on active travel to school by Health Promotion Unit, Central Sydney Area Health Service
From 2000 - 2003 the Health Promotion Unit of CSaHS
worked with leichhardt Council on active travel projects
with primary schools in the leichhardt local government
area (lGa). these projects sought to reduce car trips to
and from school and to increase the numbers of students
walking.
In 2001 a pilot project with Forest lodge Public School
(involving all 243 students, aged five to 12 years) aimed
to raise awareness about the benefits of walking, and
increase the number of students who walked to school
instead of being driven. Students completed travel diaries
in class that collected baseline and follow-up data on
how they travelled to and from school.
a series of interventions was used to encourage walking,
including the mapping of home to school routes by
students, newsletters to parents, development of a
school travel policy and a road safety audit of the school
and its vicinity conducted by leichhardt Council. at the
end of the project, the percentage of car trips had
decreased by 3.4 per cent and the percentage of walking
trips increased by 3.4 per cent. the project concluded a
longer-term study with a control group was needed to
better assess the effects of walk to school programs.31
the Health Promotion Unit and leichhardt Council
continued their collaboration during 2002 and 2003 by
working with three primary schools in annandale and
with three closely located primary schools in Balmain. as
a result, a Walk to School Partnership agreement was
developed between the leichhardt Council and the
Health Promotion Unit.32
the Health Promotion Unit concluded that a larger scale
study with a rigorous design and evaluation was required
to advance the work on active travel to and from school,
and so the Unit collaborated with the NSW Department
of education and training (Det), developed a study
proposal and sought an external grant to fund it. the
Research ethics Committees of CSaHS and of Det
approved the proposal.

Central Sydney Walk to School Research Program NSW HealtH PAGE 5
SeCtION 2
aims and objectives
Aims
to increase the percentage of upper primary school
children (aged 10 to12 years) who walked all or some of
the way to school and/or from school, and to reduce the
number of car trips taken to and/or from school by these
students.
Objectives
the objectives of the WtS Program were to:
n establish a baseline measure of the ways in which
upper primary school students in participating schools
travelled to school and from school
n explain the concept of active travel and its benefits to
upper primary students and their parents in
participating schools
n encourage these students and their parents to go to
and/or from school by active travel
n Improve participating students’ road safety skills,
independence and knowledge of their local area
n Work with local councils to identify and remedy
possible hazards to safety and amenity in the vicinities
of the schools
n Identify factors that encourage active travel to and from
school, and those that act as a barrier to it
n Identify ways to sustain improvements in active travel to
and from participating schools.

PAGE 6 NSW HealtH Central Sydney Walk to School Research Program
Context
the WtS Program developed and implemented over two
years a series of interventions with schools, students and
their parents, and with local councils. It recruited
participating schools during term 4 2004, and began its
research and intervention phases in term 1 2005. a
two-year intervention period was considered necessary to
implement the series of interventions and to enable
longer-term education and collaboration with other
sectors to take place.
the WtS Program budget was a total of $289,013 (GSt
exempt) for a period of three years. a project officer was
employed to implement and coordinate the program.
Other people in the Health Promotion Service at
Camperdown, including the Health Promoting Schools
Coordinator, the Communications Officer and the
Research and evaluation Coordinator also contributed
significant amounts of their time to the program, as did
other co–investigators.
the program was developed in the context of the Health
Promoting Schools Policy Framework, which recommends
that programs promoting health in schools take a
comprehensive whole-of-school approach and include
the curriculum, school organisation and environment,
and partnerships with the community.33
the interventions for the program were designed to have
multiple components and to be sequential and
synergistic. Intervention strategies were designed for
students, their parents, teachers and local councils. the
demographic and travel data collected by the student
and parent surveys throughout the program provided a
detailed and ongoing picture of student travel patterns
for each school. this school-specific information was
used throughout the program to tailor and adjust
interventions to meet the differing needs of the schools.
as the program evaluation was designed as a RCt, the
24 schools that volunteered to participate were placed by
random allocation in either the WtS group (the
intervention group), or in the Hl group (the control
group). the 12 schools in the WtS group received a
SeCtION 3
the intervention
series of interlinked activities to encourage more walking
and active travel to and from school during 2005 and
2006. During that time the12 schools in the Hl group
(the control group) received a number of interlinked
activities to promote healthy eating at school.
In 2005 the program focused on Year 4 and 5 students
(aged 10 to 11 years), their teachers and their parents,
and in 2006 on Year 5 and 6 students (aged 11 to 12
years) their teachers and their parents.
Children aged 10 to 12 years are at the developmental
stage when it is both possible and necessary for them to
learn to cross roads safely and to go to places
independently. the NSW Roads and traffic authority
(Rta) and the Det recommend in their advice to parents
that children up to eight years old should hold an adult’s
hand when on the footpath, around traffic and when
crossing the road, and children up to 10 years old should
be supervised when around traffic and hold an adult’s
hand while crossing the road.34 these recommendations
are in the Road Safety Policy Statement Preschool to
Year 1235 and the Road Safety component of the
Personal Development, Health and Physical education
curriculum of the Det.36 all primary school children in
NSW receive road safety education as part of this
curriculum.
It was desirable and strategic for the WtS Program to
focus on students in Years 4 to 6 (aged 10 to 12 years)
and their parents, as parents generally decide how their
children travel to and from school. It was considered
important for the program’s goals and interventions to be
consistent with the Rta and Det recommendations on
road safety for children.
therefore, the program encouraged parents to walk with
their children, and encouraged parents to decide when
their children were ready and able to walk to school
independently. In 2006, program activities included
encouraging Year 6 students to develop independence,
as a necessary skill for going to high school the following
year. table 1 gives an overview of the program and the
sequence of its activities.
Central Sydney Walk to School Research Program NSW HealtH PAGE 7
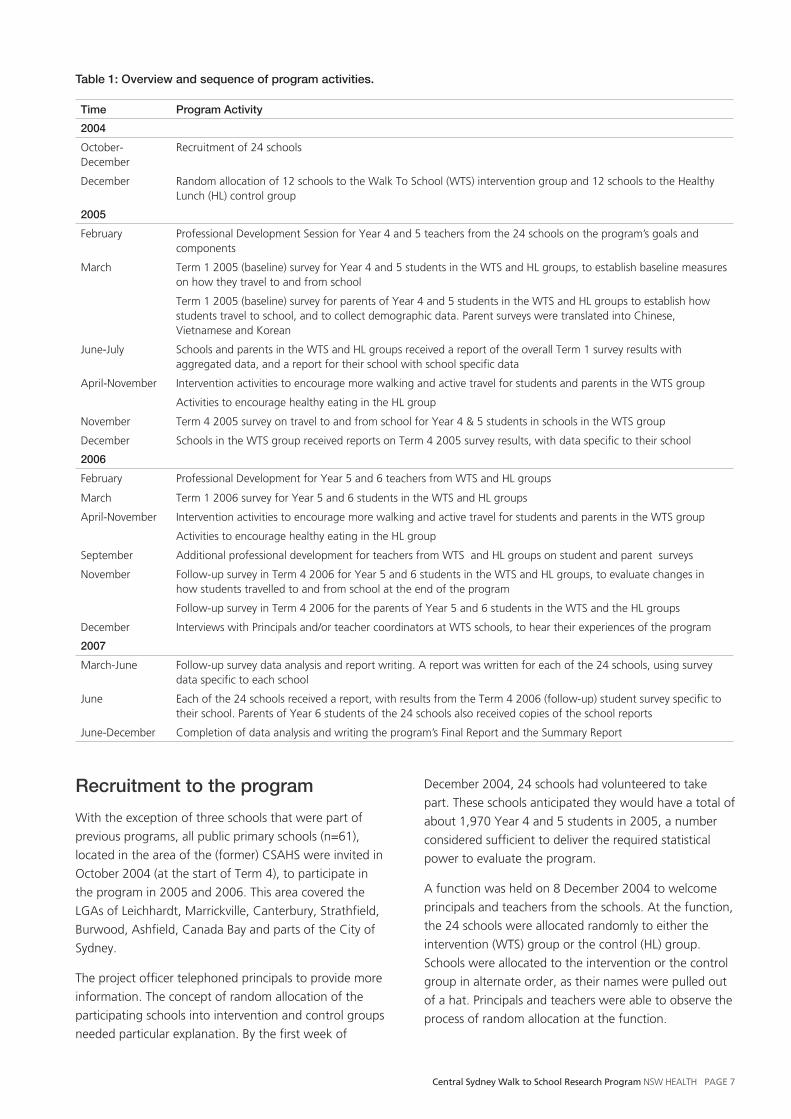
Table 1: Overview and sequence of program activities.
Time Program Activity
2004
October-December
Recruitment of 24 schools
December Random allocation of 12 schools to the Walk to School (WtS) intervention group and 12 schools to the Healthy lunch (Hl) control group
2005
February Professional Development Session for Year 4 and 5 teachers from the 24 schools on the program’s goals and components
March term 1 2005 (baseline) survey for Year 4 and 5 students in the WtS and Hl groups, to establish baseline measures on how they travel to and from school
term 1 2005 (baseline) survey for parents of Year 4 and 5 students in the WtS and Hl groups to establish how students travel to school, and to collect demographic data. Parent surveys were translated into Chinese, Vietnamese and Korean
June-July Schools and parents in the WtS and Hl groups received a report of the overall term 1 survey results with aggregated data, and a report for their school with school specific data
april-November Intervention activities to encourage more walking and active travel for students and parents in the WtS group
activities to encourage healthy eating in the Hl group
November term 4 2005 survey on travel to and from school for Year 4 & 5 students in schools in the WtS group
December Schools in the WtS group received reports on term 4 2005 survey results, with data specific to their school
2006
February Professional Development for Year 5 and 6 teachers from WtS and Hl groups
March term 1 2006 survey for Year 5 and 6 students in the WtS and Hl groups
april-November Intervention activities to encourage more walking and active travel for students and parents in the WtS group
activities to encourage healthy eating in the Hl group
September additional professional development for teachers from WtS and Hl groups on student and parent surveys
November Follow-up survey in term 4 2006 for Year 5 and 6 students in the WtS and Hl groups, to evaluate changes in how students travelled to and from school at the end of the program
Follow-up survey in term 4 2006 for the parents of Year 5 and 6 students in the WtS and the Hl groups
December Interviews with Principals and/or teacher coordinators at WtS schools, to hear their experiences of the program
2007
March-June Follow-up survey data analysis and report writing. a report was written for each of the 24 schools, using survey data specific to each school
June each of the 24 schools received a report, with results from the term 4 2006 (follow-up) student survey specific to their school. Parents of Year 6 students of the 24 schools also received copies of the school reports
June-December Completion of data analysis and writing the program’s Final Report and the Summary Report
Recruitment to the program
With the exception of three schools that were part of
previous programs, all public primary schools (n=61),
located in the area of the (former) CSaHS were invited in
October 2004 (at the start of term 4), to participate in
the program in 2005 and 2006. this area covered the
lGas of leichhardt, Marrickville, Canterbury, Strathfield,
Burwood, ashfield, Canada Bay and parts of the City of
Sydney.
the project officer telephoned principals to provide more
information. the concept of random allocation of the
participating schools into intervention and control groups
needed particular explanation. By the first week of
December 2004, 24 schools had volunteered to take
part. these schools anticipated they would have a total of
about 1,970 Year 4 and 5 students in 2005, a number
considered sufficient to deliver the required statistical
power to evaluate the program.
a function was held on 8 December 2004 to welcome
principals and teachers from the schools. at the function,
the 24 schools were allocated randomly to either the
intervention (WtS) group or the control (Hl) group.
Schools were allocated to the intervention or the control
group in alternate order, as their names were pulled out
of a hat. Principals and teachers were able to observe the
process of random allocation at the function.
PAGE 8 NSW HealtH Central Sydney Walk to School Research Program
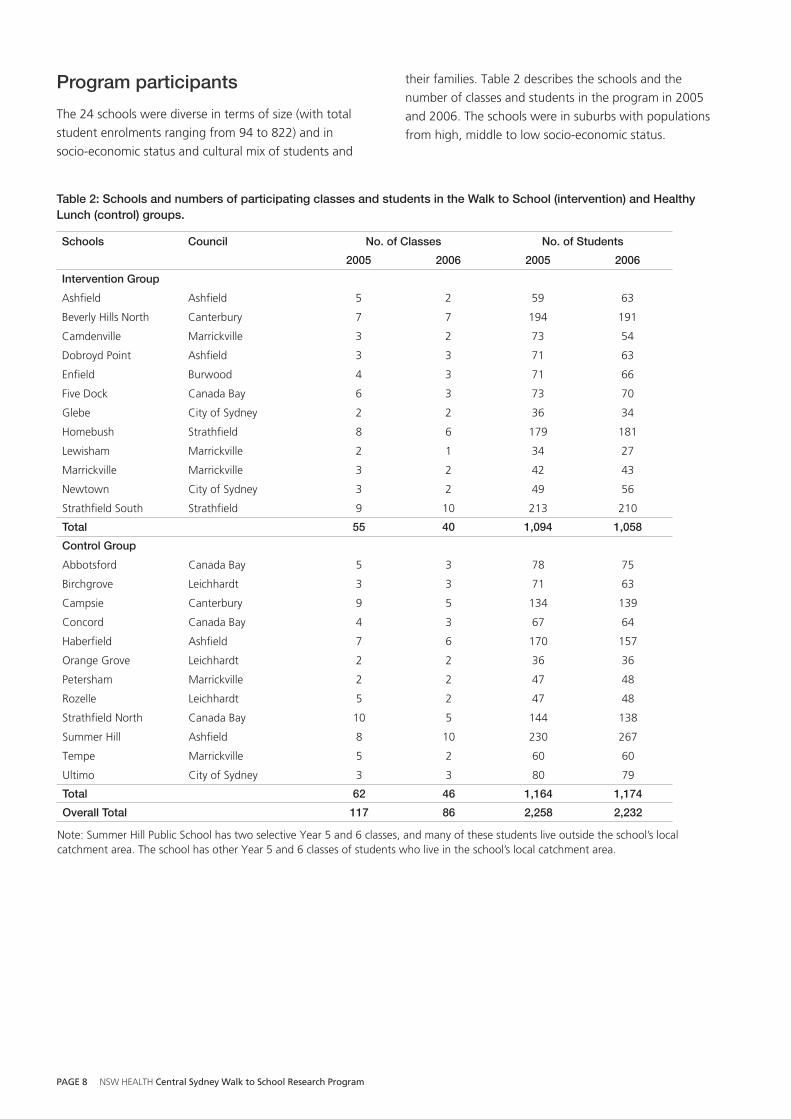
Table 2: Schools and numbers of participating classes and students in the Walk to School (intervention) and Healthy Lunch (control) groups.
Schools Council No. of Classes No. of Students
2005 2006 2005 2006
Intervention Group
ashfield ashfield 5 2 59 63
Beverly Hills North Canterbury 7 7 194 191
Camdenville Marrickville 3 2 73 54
Dobroyd Point ashfield 3 3 71 63
enfield Burwood 4 3 71 66
Five Dock Canada Bay 6 3 73 70
Glebe City of Sydney 2 2 36 34
Homebush Strathfield 8 6 179 181
lewisham Marrickville 2 1 34 27
Marrickville Marrickville 3 2 42 43
Newtown City of Sydney 3 2 49 56
Strathfield South Strathfield 9 10 213 210
Total 55 40 1,094 1,058
Control Group
abbotsford Canada Bay 5 3 78 75
Birchgrove leichhardt 3 3 71 63
Campsie Canterbury 9 5 134 139
Concord Canada Bay 4 3 67 64
Haberfield ashfield 7 6 170 157
Orange Grove leichhardt 2 2 36 36
Petersham Marrickville 2 2 47 48
Rozelle leichhardt 5 2 47 48
Strathfield North Canada Bay 10 5 144 138
Summer Hill ashfield 8 10 230 267
tempe Marrickville 5 2 60 60
Ultimo City of Sydney 3 3 80 79
Total 62 46 1,164 1,174
Overall Total 117 86 2,258 2,232
Note: Summer Hill Public School has two selective Year 5 and 6 classes, and many of these students live outside the school’s local catchment area. the school has other Year 5 and 6 classes of students who live in the school’s local catchment area.
Program participants
the 24 schools were diverse in terms of size (with total
student enrolments ranging from 94 to 822) and in
socio-economic status and cultural mix of students and
their families. table 2 describes the schools and the
number of classes and students in the program in 2005
and 2006. the schools were in suburbs with populations
from high, middle to low socio-economic status.
Central Sydney Walk to School Research Program NSW HealtH PAGE 9
In 2005, the WtS group of 12 schools had 1,094 Year 4
and 5 students and the Hl group of 12 schools had
1,164, with an overall total of 2,258 student participants.
In 2006 the WtS group had 1,058 Year 5 and 6 students
and the Hl group had 1,174, making an overall total of
2,232 student participants. the number of participating
students in each of the schools ranged from 22 to 267.
the number of classes of participating students per
school ranged from one to 10. the number of teachers
involved per school ranged from one to 12.
a total of 117 teachers in 2005 and 86 teachers in 2006
were directly involved in program activities, including
surveys. about half the Year 5 and 6 teachers in 2006
had not been involved in the program in 2005. as the
project officer needed an effective way to communicate
with the upper primary teachers at the 24 schools,
schools were asked to identify a teacher who would
coordinate their school’s activities, and the project officer
communicated directly with this teacher.
the organisation of classes at the participating schools
was varied and complex, as schools decide on class
format and numbers due to factors specific to their
school. In 2005, classes for Year 4 and 5 students in the
24 schools were organised in the following ways: Year 4
students only; Year 5 students only; and in composite
classes of Year 3 and 4 students, of Year 4 and 5
students, and of Year 5 and 6 students. two schools had
composite classes containing students from Years 3, 4,
and 5. In 2006, classes for Year 5 and 6 students in the
24 schools were organised in the following ways: Year 5
only; Year 6 only; and in composite classes of Year 4 and
5 students, and of Year 5 and 6 students.
the schools also varied in terms of the landscape, safety
and amenity of their locations and their vicinities. Some
schools were located on busy roads that are used by
heavy traffic; other schools were surrounded by quiet
leafy streets. the proximity, frequency and routes of
public transport available near the 24 schools also varied.
Initial visits to schools in 2004
all 24 participating schools were visited following their
recruitment to the program in term 4 2004. the project
officer met the principal and key teachers to explain the
program, and to hear their views on the travel and safety
issues at the school. On site visits enabled the project
officer to learn more about the geography, safety and
amenity of each school and its vicinity.
a brochure describing the WtS Program’s goals and
components was developed for principals, teachers and
parents (appendix a), and sent to the 24 participating
schools.
Program Advisory Committee
a Program advisory Committee was established whose
main role was to advise the program team on program
development and its implementation (appendix B).
Members included representatives from the NSW
Department of Health, the Det, the Centre for Physical
activity and Health, local government, a principal from a
public primary school that was not part of the program
and the NSW Federation of Parent and Citizen
associations (appendix C).
Implementation of program interventions in 2005 and 2006
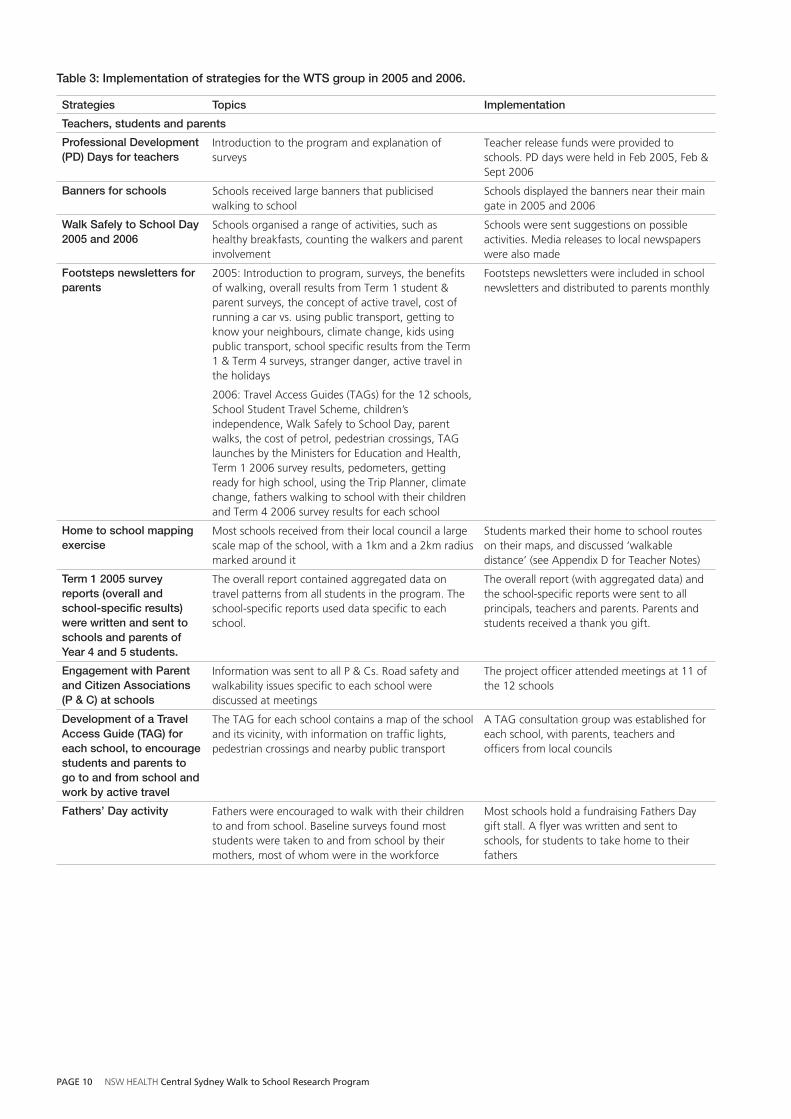
table 3 summarises the program interventions and their
implementation during 2005 and 2006 for the schools in
the WtS group. appendix D describes these program
interventions and their implementation in more detail.
Program strategies for the WtS group were in two broad
categories:
n education and information strategies for teachers,
students and their parents on the benefits of active
travel and the options for active travel for school and
work in their local area
n Working with local councils to modify the environment
around the schools, to make these environments more
conducive to active and safe travel.
PAGE 10 NSW HealtH Central Sydney Walk to School Research Program
Table 3: Implementation of strategies for the WTS group in 2005 and 2006.
Strategies Topics Implementation
Teachers, students and parents
Professional Development (PD) Days for teachers
Introduction to the program and explanation of surveys
teacher release funds were provided to schools. PD days were held in Feb 2005, Feb & Sept 2006
Banners for schools Schools received large banners that publicised walking to school
Schools displayed the banners near their main gate in 2005 and 2006
Walk Safely to School Day 2005 and 2006
Schools organised a range of activities, such as healthy breakfasts, counting the walkers and parent involvement
Schools were sent suggestions on possible activities. Media releases to local newspapers were also made
Footsteps newsletters for parents
2005: Introduction to program, surveys, the benefits of walking, overall results from term 1 student & parent surveys, the concept of active travel, cost of running a car vs. using public transport, getting to know your neighbours, climate change, kids using public transport, school specific results from the term 1 & term 4 surveys, stranger danger, active travel in the holidays
Footsteps newsletters were included in school newsletters and distributed to parents monthly
2006: travel access Guides (taGs) for the 12 schools, School Student travel Scheme, children’s independence, Walk Safely to School Day, parent walks, the cost of petrol, pedestrian crossings, taG launches by the Ministers for education and Health, term 1 2006 survey results, pedometers, getting ready for high school, using the trip Planner, climate change, fathers walking to school with their children and term 4 2006 survey results for each school
Home to school mapping exercise
Most schools received from their local council a large scale map of the school, with a 1km and a 2km radius marked around it
Students marked their home to school routes on their maps, and discussed ‘walkable distance’ (see appendix D for teacher Notes)
Term 1 2005 survey reports (overall and school-specific results) were written and sent to schools and parents of Year 4 and 5 students.
the overall report contained aggregated data on travel patterns from all students in the program. the school-specific reports used data specific to each school.
the overall report (with aggregated data) and the school-specific reports were sent to all principals, teachers and parents. Parents and students received a thank you gift.
Engagement with Parent and Citizen Associations (P & C) at schools
Information was sent to all P & Cs. Road safety and walkability issues specific to each school were discussed at meetings
the project officer attended meetings at 11 of the 12 schools
Development of a Travel Access Guide (TAG) for each school, to encourage students and parents to go to and from school and work by active travel
the taG for each school contains a map of the school and its vicinity, with information on traffic lights, pedestrian crossings and nearby public transport
a taG consultation group was established for each school, with parents, teachers and officers from local councils
Fathers’ Day activity Fathers were encouraged to walk with their children to and from school. Baseline surveys found most students were taken to and from school by their mothers, most of whom were in the workforce
Most schools hold a fundraising Fathers Day gift stall. a flyer was written and sent to schools, for students to take home to their fathers

Central Sydney Walk to School Research Program NSW HealtH PAGE 11
Strategies Topics Implementation
Teachers, students and parents
Be Active Take Steps (BATS) pedometer program for three schools
Pedometers and an associated classroom program were used to encourage more walking with 571 students in three schools
Pedometers were lent to students, and teachers were supplied with the BatS resources
Parent walks the aim of the walks was to show parents not used to walking that a walk of about 1km is easy and pleasant
Walks were organised at six schools, with variable response
Production of ‘City of Canterbury: Your Public Transport Guide’
this publication, produced by Canterbury Council, aimed to encourage more active travel in the lGa. It contains a map and detailed information on local public transport
the program gave some funds to this project, and copies were distributed to all parents at Beverly Hill North Public School to encourage more active travel
Preparation for high school
Year 6 students were encouraged, in class and via the ‘Footsteps’ newsletter, to develop road safety skills and independence
Students used the trip Planner in class to plan their active journey to high school for next year
Information on the Trip Planner (on the NSW public transport website)
Planning active travel journeys, using the trip Planner Resource materials were developed and distributed to teachers
Distribution of school TAGs and local public transport information to schools and parents
active travel information (from City Rail and Sydney Buses) for parents
local bus and train routes & timetables were distributed with the taGs to schools and parents
TAG launches at seven schools, from March to August 2006
the taG launches encouraged discussion of the concept of active travel at school and broader community levels
taGs were launched at the schools by the Ministers for Health and for education, local Members of Parliament and mayors
Follow-up survey results (with school-specific data) sent to schools
Preliminary results of the term 4 2006 (follow-up) surveys were tallied and sent to schools.
the project officer attended end of year assemblies at eight schools and presented their results
Thank you gifts for parents and students
Parents and students were thanked for completing the follow-up surveys
Parents received a notepad and students received a highlighter pen
Councils
Safety reviews of schools and their vicinities were conducted with council Road Safety Officers and/or Traffic Engineers, teachers and parents
the purpose of the safety review of each school and its vicinity was to identify possible hazards to safe and active travel
Councils took different approaches to the reviews. Most were happy to conduct reviews, but some preferred to do their own reviews, or draw on previous work. two councils preferred not to put findings in writing
Work with councils to fix problems
Councils were usually willing to consider improvements, but could not guarantee funds or priority for any needed infrastructure works (major or minor). Other improvements to infrastructure (eg traffic lights, pedestrian crossings) are the responsibility of the Rta
Negotiation processes required to make improvements and resolve problems were lengthy. the program did not have the time or resources to deal with these issues thoroughly, particularly in relation to 12 different school environments
Table 3 (cont'd): Implementation of strategies for the WTS group in 2005 and 2006.
PAGE 12 NSW HealtH Central Sydney Walk to School Research Program
Healthy Lunch (control) group - program interventions 2005 and 2006
the original grant proposal had planned to support
schools in the program’s control group to implement the
Fresh tastes @ School canteen policy (supported by NSW
Health and Det) at their school. Several Hl schools either
had no canteen or a part-time canteen with no manager,
so a different strategy was needed.
therefore, it was decided that interventions for the
control group would have a broader focus on healthy
eating at school. the strategies for the Hl group of
schools included provision of information to parents via a
newsletter called tastebuds, and a small grants program
for schools. each school in the Hl group was eligible to
apply for a ‘Healthy eating Grant’ to support food-related
activities as part of classroom learning on healthy eating.
the grants were $500 or $1,000, depending on the
school’s size. Details of the small grants program, the
tastebuds newsletter and other activities for the Hl
group of schools are contained in appendix e.
School-specific reports on survey results for WTS and HL schools
Baseline survey results in 2005
a finding of the baseline survey was the high variation in
travel patterns from school to school (the Results section
gives details). as the primary interest of each participating
school was in how their own students travelled, a report
was written using school-specific data on the baseline
student survey results for each of the 24 schools in the
intervention and the control groups.
Principals, Parent and Citizen associations and parents of
Year 5 and 6 students at the 24 schools received their
school-specific reports over a period from June to
September 2005. Reports for schools in the control group
contained less detail than those for intervention schools.
appendix J is an example of these school-specific reports
for which the principal of the school provided permission
for inclusion. Schools valued this localised information.
Follow-up survey results in 2006
Results from the 2006 follow-up surveys showed a high
variation from school to school in student travel patterns.
Preliminary results from the follow-up surveys, based on
tallies of data specific to each school, were given to
schools in December 2006, so that Year 6 (final year)
students and their parents could receive this information
before they left primary school.
In 2007 a detailed report on the 2006 survey results was
written for each of the 24 schools, using school-specific
data. the reports included data on student travel patterns
to and from school from 2005 to 2006, and on parent
travel patterns to work in both years. these reports were
sent to school principals, teachers and Parent and Citizen
associations at all 24 schools. appendix K contains one
of these reports.

Central Sydney Walk to School Research Program NSW HealtH PAGE 13
SeCtION 4
Research and evaluation methods
the study design was a cluster RCt in which participating
schools, rather than individual students, were allocated to
the intervention or the control group. this is an
appropriate design when an intervention is implemented
at an organisational level and the organisation is the unit
of analysis.37 Schools were allocated to the intervention
or the control group in alternate order, as their names
were pulled out of a hat. Figure 1 describes the
evaluation design.
the evaluation sought to assess the effectiveness of the
program’s interventions to increase the percentage of
upper primary school students who walked all or some of
the way to and/or from school. the intervention was
evaluated by comparing travel data from students and
their parents in the intervention group with travel data
from students and their parents in the control group.
the travel data came from a cohort of students who had
completed both the baseline and follow-up surveys, and
a cohort of parents who had completed both the
baseline and follow-up surveys in the intervention and
control groups.
Figure 1: Evaluation Design
61 Schools invited to participate
24 Schools volunteered to participate
Students n=2,258
Schools randomly allocated to intervention and control
groups
Walk to School (Intervention) group12 Schools
Student participants n=1,094 Student survey respondents n=976
Parent survey respondents n=772 (71%)
Healthy Lunch (Control) group12 Schools
Student participants n=1,164 Student survey respondents n=990
Parent survey respondents n=834 (72%)
Baseline Survey 2005
Students lost to follow-up (did not complete both
surveys, and/or unable to be matched) n=292
Students lost to follow-up (did not complete both
surveys, and/or unable to be matched) n=395
Walk to School (Intervention) groupStudent survey respondents n=983
Students who did both surveys n=683Parent follow-up survey respondents n= 616
Parents who did both surveys n= 403
Healthy Lunch (Control) groupStudent survey respondents n=992
Students who did both surveys n=594Parent follow-up survey respondents n=746
Parents who did both surveys n=404
Follow-up Survey 2006

PAGE 14 NSW HealtH Central Sydney Walk to School Research Program
Sample size
the required sample size was calculated on the basis of
the number of students in each school and data from the
2001 pilot study.31 the program aimed to have 80 per
cent power to detect average changes of eight per cent
in binary outcome variables with a five per cent
significance level, assuming an intra-class correlation
coefficient of 0.01 and an average size of 70 children for
each school. this is a design effect of 1.7.
Survey participants and response rates
In 2005, a total of 2,258 students participated in the
program (1,094 students in the WtS group and 1,164 in
the Hl group) and of these, 1,966 students completed
baseline surveys (976 in WtS and 990 in Hl) and 1,606
of their parents completed parent surveys (71% response
rate).
In 2006, a total of 2,232 students participated in the
program (1,058 students in the WtS group and 1,174 in
the Hl group) and of these 1,975 students completed
follow-up surveys (a response rate of 88.5%). For the
parent surveys, 1,362 parents completed follow-up
surveys, giving a response rate of 69 per cent, which was
higher in the Hl control group (75%) than in the WtS
intervention group (62.6%).
Data matching processes
Baseline and follow-up data from each student who
completed both surveys were matched through a
previously used confidential record linkage technique.38
this technique used a school code (added to each survey
by the researchers) and information completed in the
survey by students on the first letter of their first name,
their year at school, their gender and their date of birth.
this information was arranged to form a ‘data string’ of
numbers and letters unique to each student.
Parent surveys contained the code number of the school
attended by their child, and information completed by
parents on the first letter of their child’s first name, year
at school, gender and date of birth. the resulting ‘data
string’ was designed to match parent baseline surveys
with their child’s data. Social and demographic data in
relation to each student (whose baseline and follow-up
data were matched) were derived from their parent’s
baseline surveys.
The student cohort and the parent cohort
after matching the surveys from students who had
completed both baseline and follow-up surveys, 698
students were lost from the data set. a total of 1,277
students completed both the baseline and follow-up
surveys (683 in the intervention and 594 in the control
group, giving a follow-up rate of 65%). Comparisons
were made between the main characteristics of students
who remained in the study and of those lost to follow-
up. there were no statistically significant differences in
gender, student age, the distance from the student’s
home to their school and modes of travel to or from
school between the two groups.
Students were lost to follow-up for several reasons,
including students leaving and enrolling at the
participating schools, students not completing both
surveys due to absence on the day(s) of the surveys, and
students whose baseline and follow-up surveys were
unable to be matched by the matching technique used.
Results from the term 1 2006 student survey (appendix
M) found there were 160 students (55 in the WtS group
and 105 in the Hl group) who were newly enrolled at
their schools in that year, and so had not completed
baseline surveys in 2005.
the surveys from parents who had completed both
baseline and follow-up surveys were also matched. the
final parent cohort comprised 807 parents who
completed both parent surveys. Of the 799 parents who
were lost to follow-up (369 in intervention schools and
430 in control schools), 150 were parents of students
who were new to their school in 2006, 245 parents had
completed the baseline survey only, and 404 could not
be matched with their child’s survey data because their
child’s identifying indicator was not the same in both
surveys.
the only significant difference between the final parent
cohort and those lost to follow-up, in terms of socio-
demographic characteristics, was a greater drop-out of
fathers (p=0.01). No differences were found in relation to
student’s travel mode at baseline, or for parents’ travel
mode to work. However, there were significant
differences for distance from home to school, as more
parents from the control group who lived closer to school
(<1.5km, p=0.01) were lost to follow-up, whereas there
was no difference in the drop out rate of parents in the
intervention group in relation to distance from home to
school.
Central Sydney Walk to School Research Program NSW HealtH PAGE 15
Data collection
Baseline data was collected from students and their
parents in term 1 2005 and follow-up data was collected
from the same cohort of students and their parents in
term 4 2006. the methods and measures of data
collection were identical at both time points.
Student surveys
the baseline student survey was completed in March 2005
in class by all Year 4 and 5 students who were at school
on the days of the survey, and the follow-up student
survey was completed in October 2006 in class by all Year
5 and 6 students who were at school on the days of the
survey. Survey completion was a class activity and was
supervised by teachers, so parental consent for each
student was not required. Students completed questions
on five consecutive days (Monday, tuesday, Wednesday,
thursday and Friday) in a school week, on how they had
travelled to and from school on the previous (school) day.
appendices F and G contain the baseline and follow-up
student surveys.
Parent surveys
the baseline parent survey was for parents of the
students participating in the program. the parent surveys
were given by class teachers to Year 4 and 5 students to
take home to their parents in 2005. the same process
was used in 2006 for the follow-up parent survey for
parents of Year 5 and 6 students. Detailed explanatory
material was included with the parent surveys.
Parents completed the surveys at home, if they chose to
participate, and returned their completed survey to the
class teacher. there were two reminders sent home to
parents with students. as several schools reported they
had significant numbers of parents who did not speak
and/or read english, the baseline parent surveys were
translated into Chinese, Vietnamese and Korean and
distributed to these schools and parents. appendices H
and I contain the baseline and follow-up parent surveys.
Family and demographic information
Family and demographic information was collected from
the parent survey, which was completed by the parent or
carer who had main responsibility for the child’s travel to
school. the parent survey included questions on the
parent’s attitudes towards their child walking to school
and the parent’s mode of travel to work.
Main outcome measures
Student mode of travel, as reported by students
the baseline and follow-up student surveys contained
questions which students completed on five consecutive
school days in a week on how they travelled to and from
school on each of those days. the reliability and validity
of this student survey had been tested in the pilot
study.31
Students answered the questions ‘how did you get to
school yesterday?’ and ‘how did you get home
yesterday?’ by selecting one of eight options that
described different modes of travel to and from school
and their possible combinations (for example, walked all
the way, walked part of the way, went by car, went by
bus or train, rode a bike).
Data from the student surveys on how students travelled
to and from school for five days were used to compute
whether students walked all the way all days, walked all
the way some days, walked some of the way some days
or whether they travelled by car only on all days. the
number of students who reported using public transport
with no walking or riding their bicycle was small and was
categorised as ‘other’.
Student mode of travel, as reported by parents
In the parent survey, parents recorded how their child
travelled to and from school for 10 trips in a usual school
week. Parents answered the question ‘In a usual school
week, how many mornings does your child go to school
by each of the following ways?’ there was a similar
question on how their child travelled from school to
home for five afternoons in a usual school week. to
avoid categories with small numbers, the data were
recoded as zero, one to four, and five days.
Data on number of days in a usual school week that
students travelled to and from school by each mode of
travel (as reported by the 807 parents who completed
baseline and follow-up surveys) were used to calculate
increases or decreases in the number of walking and/or
car-only trips to school by students.
PAGE 16 NSW HealtH Central Sydney Walk to School Research Program
Methods of analysis
Data were analysed using the computer package SPSS for
Windows 14.0. Descriptive analyses were conducted to
describe the characteristics of the study population. For
primary analyses, the percentage of students with each
mode of travel in the intervention and the control group
was computed and analyses were conducted. to adjust
for the design effect of cluster randomisation, data were
then summarised for each school.39
the percentage of students with each mode of travel was
computed for each school and the mean percentage and
standard deviation for each group was then calculated.
Independent t-tests were used to test for differences in
mean proportions between the intervention and the
control groups, using Simple Interactive Statistical
analysis (SISa).40 although the percentages by school
within each group were not always normally distributed,
independent t-tests were used because they are robust to
departures from normality when the group sizes are
equal.41 In these analyses, the unit of analysis was the
number of schools (n=24) and not the number of
students (n=1,277) and therefore the 95 per cent
confidence intervals were inflated and statistical power
was reduced.
Multivariate modelling methods were used to analyse
student travel modes (as reported by parents) and to
compute the within-school intra-class correlation
coefficient (ICC) for each outcome, using one-way
analysis of variance. the F value was then used to
compute the design effect. the average cluster size was
51. Chi-square values from contingency tables were then
adjusted for the design effect and P values were re-
estimated using a statistical function in excel.
logistic regression modelling was used to predict non-car
use in the follow-up data (as reported by parents), in
order to determine the predictors that were
independently related to non-car use. a forwards
selection process was used, so that predictor variables
were tested in the model in order of their unadjusted
association with the outcome variable, and only the
predictors with a P value <0.1 were retained. adjusted
odds ratios (ORs) with 95 per cent confidence intervals
(CI) were calculated as a measure of the strength of
associations. Wald values from the logistic regression
model were then adjusted for the design effect and P
values were re-estimated using statistical functions in
excel. Days with missing values were ignored, so that all
students were included in the analyses, and the final
classification of data reflected the students’ main modes
of travel over the five day data collection period.
Qualitative evaluation
Interviews were conducted with principals and teacher/
coordinators at the schools in the WtS group, to gather
their views on the program’s implementation at their
school. appendix l contains a list of the questions that
guided the interviews.

Central Sydney Walk to School Research Program NSW HealtH PAGE 17
SeCtION 5
Results
Table 4: Comparison of baseline characteristics of students who completed baseline and follow-up surveys.
Characteristics Control group (n=594)
%
Intervention group (n=683)
%
P value
Year 4 students (2005) 45.1 49.0
Year 5 students (2005) 54.9 51.0 0.16
Female students 51.9 56.5 0.10
Size of school attended by students:
Small (150 or less students) 3.2 3.8 0.80
Medium (approx 350) 38.4 37.3
large (500 or more) 58.4 58.9
Distance from student’s home to school:
< 1 km 52 51.7 0.78
>1 km 47.4 48.3
Main language spoken at home:
english 66.5 62.8 0.09
Not english 33.5 37.2 0.09
Parent who completed survey was female 82.7 80.2 0.33
age of parent:
<40 years 33.8 39.4 0.08
40 years 66.2 60.6
% of parents with children in the following age groups at home:
0-4 yrs 12.8 18.4 0.02
5-9 yrs 65.5 67.3 0.55
10-12 yrs 68.6 60.5 0.01
13-17 yrs 29.1 30.3 0.53
Parent’s highest level of education:
High school 28.6 34.8 0.02
technical 24.8 27.6
University 46.7 37.6
Parent employed 66.3 65.2 0.72
% of parents employed who work outside home 93.8 93.3 0.77
Partner employed 83.7 85.3 0.53
Baseline characteristics of students who completed both surveys
table 4 describes and compares the baseline
characteristics of students in the intervention and
control groups who completed the baseline and follow-
up surveys.
In general, the demographic characteristics of the survey
respondents in the intervention and control groups were
similar. although the differences between the two
groups were statistically significant in relation to age of
children at home and to parent’s level of education, the
absolute percentage difference between the groups
was small.
PAGE 18 NSW HealtH Central Sydney Walk to School Research Program
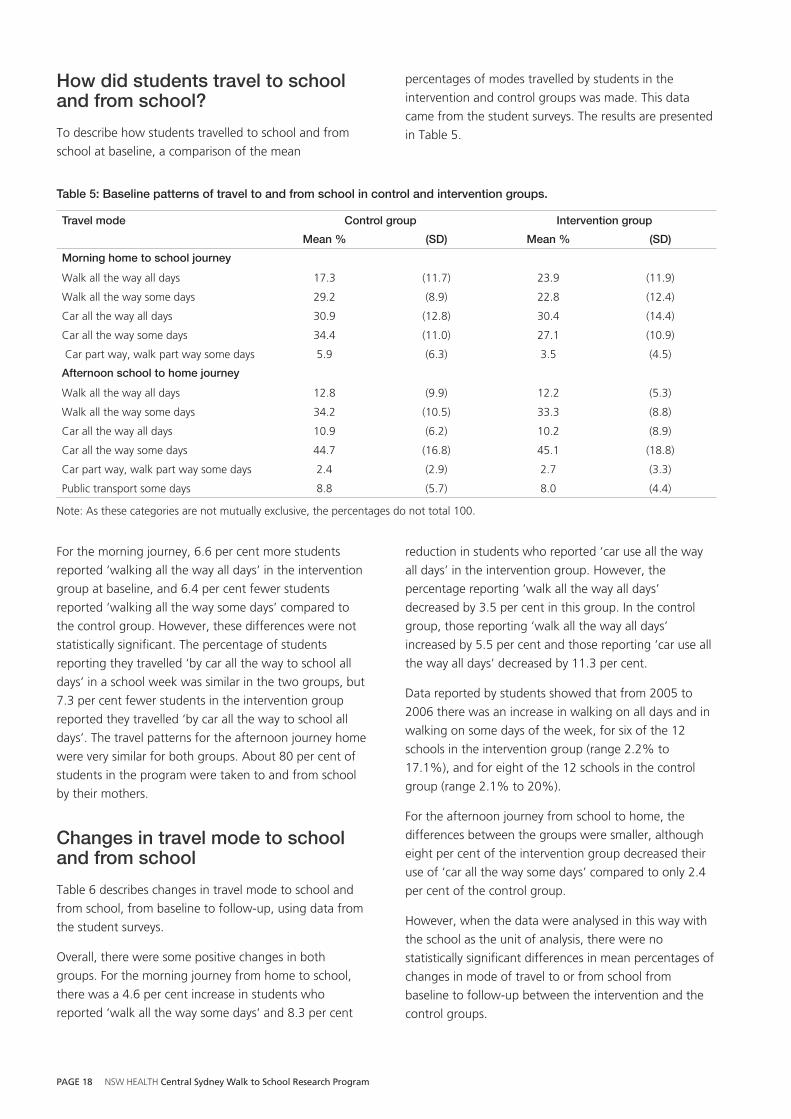
Table 5: Baseline patterns of travel to and from school in control and intervention groups.
Travel mode Control group Intervention group
Mean % (SD) Mean % (SD)
Morning home to school journey
Walk all the way all days 17.3 (11.7) 23.9 (11.9)
Walk all the way some days 29.2 (8.9) 22.8 (12.4)
Car all the way all days 30.9 (12.8) 30.4 (14.4)
Car all the way some days 34.4 (11.0) 27.1 (10.9)
Car part way, walk part way some days 5.9 (6.3) 3.5 (4.5)
Afternoon school to home journey
Walk all the way all days 12.8 (9.9) 12.2 (5.3)
Walk all the way some days 34.2 (10.5) 33.3 (8.8)
Car all the way all days 10.9 (6.2) 10.2 (8.9)
Car all the way some days 44.7 (16.8) 45.1 (18.8)
Car part way, walk part way some days 2.4 (2.9) 2.7 (3.3)
Public transport some days 8.8 (5.7) 8.0 (4.4)
Note: as these categories are not mutually exclusive, the percentages do not total 100.
For the morning journey, 6.6 per cent more students
reported ‘walking all the way all days’ in the intervention
group at baseline, and 6.4 per cent fewer students
reported ‘walking all the way some days’ compared to
the control group. However, these differences were not
statistically significant. the percentage of students
reporting they travelled ‘by car all the way to school all
days’ in a school week was similar in the two groups, but
7.3 per cent fewer students in the intervention group
reported they travelled ‘by car all the way to school all
days’. the travel patterns for the afternoon journey home
were very similar for both groups. about 80 per cent of
students in the program were taken to and from school
by their mothers.
Changes in travel mode to school and from school
table 6 describes changes in travel mode to school and
from school, from baseline to follow-up, using data from
the student surveys.
Overall, there were some positive changes in both
groups. For the morning journey from home to school,
there was a 4.6 per cent increase in students who
reported ‘walk all the way some days’ and 8.3 per cent
reduction in students who reported ‘car use all the way
all days’ in the intervention group. However, the
percentage reporting ‘walk all the way all days’
decreased by 3.5 per cent in this group. In the control
group, those reporting ‘walk all the way all days’
increased by 5.5 per cent and those reporting ‘car use all
the way all days’ decreased by 11.3 per cent.
Data reported by students showed that from 2005 to
2006 there was an increase in walking on all days and in
walking on some days of the week, for six of the 12
schools in the intervention group (range 2.2% to
17.1%), and for eight of the 12 schools in the control
group (range 2.1% to 20%).
For the afternoon journey from school to home, the
differences between the groups were smaller, although
eight per cent of the intervention group decreased their
use of ‘car all the way some days’ compared to only 2.4
per cent of the control group.
However, when the data were analysed in this way with
the school as the unit of analysis, there were no
statistically significant differences in mean percentages of
changes in mode of travel to or from school from
baseline to follow-up between the intervention and the
control groups.
How did students travel to school and from school?
to describe how students travelled to school and from
school at baseline, a comparison of the mean
percentages of modes travelled by students in the
intervention and control groups was made. this data
came from the student surveys. the results are presented
in table 5.
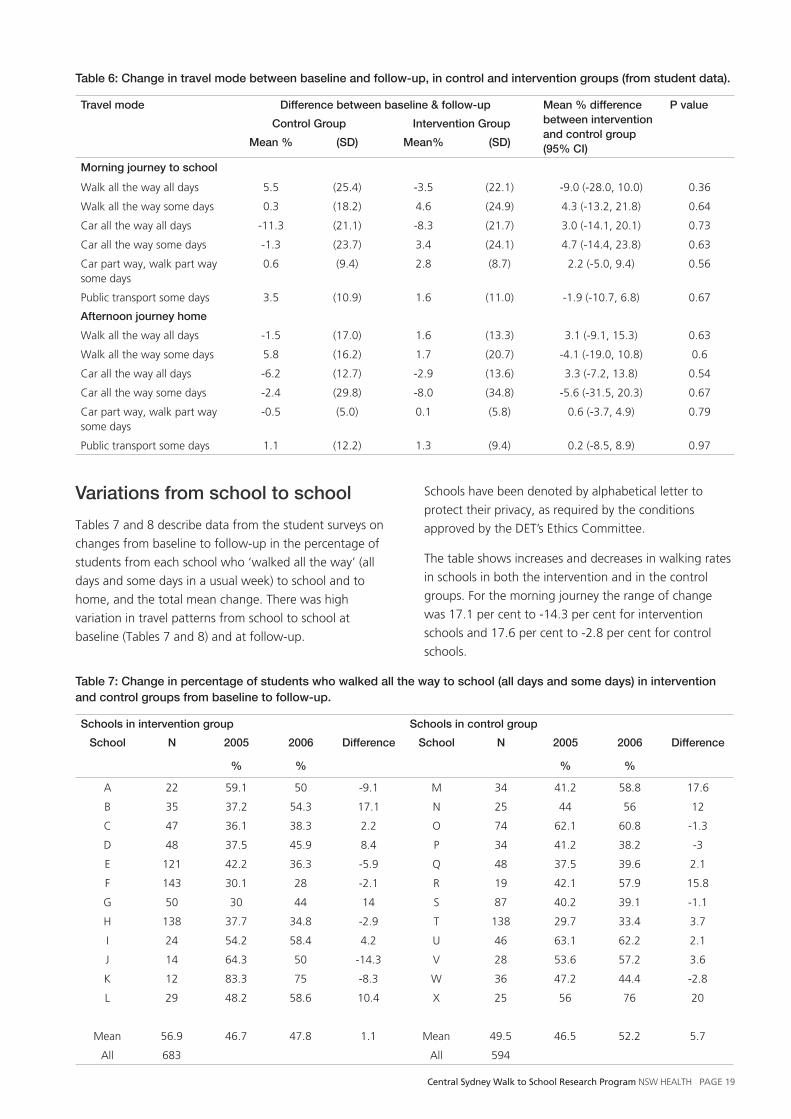
Central Sydney Walk to School Research Program NSW HealtH PAGE 19
Table 6: Change in travel mode between baseline and follow-up, in control and intervention groups (from student data).
Travel mode Difference between baseline & follow-up Mean % difference between intervention and control group (95% CI)
P value
Control Group Intervention Group
Mean % (SD) Mean% (SD)
Morning journey to school
Walk all the way all days 5.5 (25.4) -3.5 (22.1) -9.0 (-28.0, 10.0) 0.36
Walk all the way some days 0.3 (18.2) 4.6 (24.9) 4.3 (-13.2, 21.8) 0.64
Car all the way all days -11.3 (21.1) -8.3 (21.7) 3.0 (-14.1, 20.1) 0.73
Car all the way some days -1.3 (23.7) 3.4 (24.1) 4.7 (-14.4, 23.8) 0.63
Car part way, walk part way some days
0.6 (9.4) 2.8 (8.7) 2.2 (-5.0, 9.4) 0.56
Public transport some days 3.5 (10.9) 1.6 (11.0) -1.9 (-10.7, 6.8) 0.67
Afternoon journey home
Walk all the way all days -1.5 (17.0) 1.6 (13.3) 3.1 (-9.1, 15.3) 0.63
Walk all the way some days 5.8 (16.2) 1.7 (20.7) -4.1 (-19.0, 10.8) 0.6
Car all the way all days -6.2 (12.7) -2.9 (13.6) 3.3 (-7.2, 13.8) 0.54
Car all the way some days -2.4 (29.8) -8.0 (34.8) -5.6 (-31.5, 20.3) 0.67
Car part way, walk part way some days
-0.5 (5.0) 0.1 (5.8) 0.6 (-3.7, 4.9) 0.79
Public transport some days 1.1 (12.2) 1.3 (9.4) 0.2 (-8.5, 8.9) 0.97
Variations from school to school
tables 7 and 8 describe data from the student surveys on
changes from baseline to follow-up in the percentage of
students from each school who ‘walked all the way’ (all
days and some days in a usual week) to school and to
home, and the total mean change. there was high
variation in travel patterns from school to school at
baseline (tables 7 and 8) and at follow-up.
Schools have been denoted by alphabetical letter to
protect their privacy, as required by the conditions
approved by the Det’s ethics Committee.
the table shows increases and decreases in walking rates
in schools in both the intervention and in the control
groups. For the morning journey the range of change
was 17.1 per cent to -14.3 per cent for intervention
schools and 17.6 per cent to -2.8 per cent for control
schools.
Table 7: Change in percentage of students who walked all the way to school (all days and some days) in intervention and control groups from baseline to follow-up.
Schools in intervention group Schools in control group
School N 2005
%
2006
%
Difference School N 2005
%
2006
%
Difference
a 22 59.1 50 -9.1 M 34 41.2 58.8 17.6
B 35 37.2 54.3 17.1 N 25 44 56 12
C 47 36.1 38.3 2.2 O 74 62.1 60.8 -1.3
D 48 37.5 45.9 8.4 P 34 41.2 38.2 -3
e 121 42.2 36.3 -5.9 Q 48 37.5 39.6 2.1
F 143 30.1 28 -2.1 R 19 42.1 57.9 15.8
G 50 30 44 14 S 87 40.2 39.1 -1.1
H 138 37.7 34.8 -2.9 t 138 29.7 33.4 3.7
I 24 54.2 58.4 4.2 U 46 63.1 62.2 2.1
J 14 64.3 50 -14.3 V 28 53.6 57.2 3.6
K 12 83.3 75 -8.3 W 36 47.2 44.4 -2.8
l 29 48.2 58.6 10.4 X 25 56 76 20
Mean 56.9 46.7 47.8 1.1 Mean 49.5 46.5 52.2 5.7
all 683 all 594

PAGE 20 NSW HealtH Central Sydney Walk to School Research Program
Table 8: Change in the percentage of students who walked all the way home (all days and some days) in intervention and control groups from baseline to follow-up.
Intervention group Control group
School N 2005
%
2006
%
Difference School N 2005
%
2006
%
Difference
a 22 54.6 59.1 4.5 M 34 53 58.8 5.8
B 35 48.5 51.4 2.9 N 25 56 44 -12
C 47 38.3 38.3 0 O 74 62.2 58.1 -4.1
D 48 43.8 52.1 8.3 P 34 32.3 41.2 8.9
e 121 44.7 35.6 -9.1 Q 48 37.5 45.8 8.3
F 143 24.5 27.3 2.8 R 19 52.6 52.6 0
G 50 34 40 6 S 87 42.5 49.4 6.9
H 138 41.3 42.7 1.4 t 138 29.7 36.9 7.2
I 24 45.8 58.3 12.5 U 46 52.1 52.2 0.1
J 14 50 57.1 7.1 V 28 57.2 53.5 -3.7
K 12 75 58.3 -16.7 W 36 36.2 47.2 11
l 29 44.8 65.5 20.7 X 25 52 76 24
Mean 56.9 45.4 48.8 3.4 Mean 49.5 46.9 51.3 4.3
all 683 all 594
Changes in travel mode to school, using data from parents
Changes in travel mode for the morning journey to
school were assessed by calculating increases or
decreases in the number of morning journeys in a usual
school week that students made by walking or by car,
using baseline and follow-up data reported by parents.
tables 9a and 9b describe increases and decreases at
follow-up in the percentage of students who walked all
the way to school and who went by car only in a usual
week. this data has been stratified by student age and
the distance between their homes and schools.
table 8 describes the afternoon journey home and
changes in the percentage of students walking all the
way for schools in the intervention and control groups.
again, there was a large variation in both groups. the
range of the rates of change in walking to school for the
intervention schools was -16.7 per cent to +20.7 per
cent, and for the control schools -12.0 per cent to +24.0
per cent. Overall, there were very similar increases
(+3.4% and +4.3%) in both groups. there seems to be
no consistent pattern to suggest that a low level of
walking at baseline (<50%) was associated with more
schools increasing their walking, and/or a high level at
baseline (>50%) was associated with a decline.
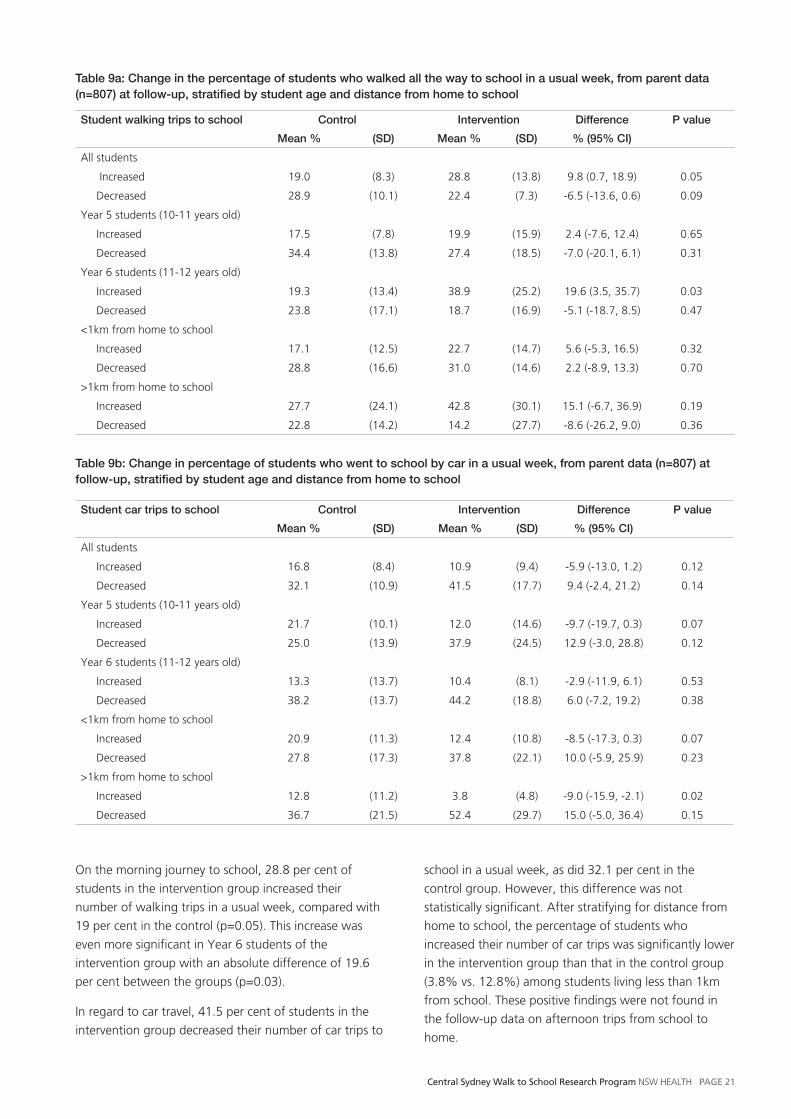
Central Sydney Walk to School Research Program NSW HealtH PAGE 21
Student walking trips to school Control Intervention Difference P value
Mean % (SD) Mean % (SD) % (95% CI)
all students
Increased 19.0 (8.3) 28.8 (13.8) 9.8 (0.7, 18.9) 0.05
Decreased 28.9 (10.1) 22.4 (7.3) -6.5 (-13.6, 0.6) 0.09
Year 5 students (10-11 years old)
Increased 17.5 (7.8) 19.9 (15.9) 2.4 (-7.6, 12.4) 0.65
Decreased 34.4 (13.8) 27.4 (18.5) -7.0 (-20.1, 6.1) 0.31
Year 6 students (11-12 years old)
Increased 19.3 (13.4) 38.9 (25.2) 19.6 (3.5, 35.7) 0.03
Decreased 23.8 (17.1) 18.7 (16.9) -5.1 (-18.7, 8.5) 0.47
<1km from home to school
Increased 17.1 (12.5) 22.7 (14.7) 5.6 (-5.3, 16.5) 0.32
Decreased 28.8 (16.6) 31.0 (14.6) 2.2 (-8.9, 13.3) 0.70
>1km from home to school
Increased 27.7 (24.1) 42.8 (30.1) 15.1 (-6.7, 36.9) 0.19
Decreased 22.8 (14.2) 14.2 (27.7) -8.6 (-26.2, 9.0) 0.36
Table 9b: Change in percentage of students who went to school by car in a usual week, from parent data (n=807) at follow-up, stratified by student age and distance from home to school
Student car trips to school Control Intervention Difference P value
Mean % (SD) Mean % (SD) % (95% CI)
all students
Increased 16.8 (8.4) 10.9 (9.4) -5.9 (-13.0, 1.2) 0.12
Decreased 32.1 (10.9) 41.5 (17.7) 9.4 (-2.4, 21.2) 0.14
Year 5 students (10-11 years old)
Increased 21.7 (10.1) 12.0 (14.6) -9.7 (-19.7, 0.3) 0.07
Decreased 25.0 (13.9) 37.9 (24.5) 12.9 (-3.0, 28.8) 0.12
Year 6 students (11-12 years old)
Increased 13.3 (13.7) 10.4 (8.1) -2.9 (-11.9, 6.1) 0.53
Decreased 38.2 (13.7) 44.2 (18.8) 6.0 (-7.2, 19.2) 0.38
<1km from home to school
Increased 20.9 (11.3) 12.4 (10.8) -8.5 (-17.3, 0.3) 0.07
Decreased 27.8 (17.3) 37.8 (22.1) 10.0 (-5.9, 25.9) 0.23
>1km from home to school
Increased 12.8 (11.2) 3.8 (4.8) -9.0 (-15.9, -2.1) 0.02
Decreased 36.7 (21.5) 52.4 (29.7) 15.0 (-5.0, 36.4) 0.15
Table 9a: Change in the percentage of students who walked all the way to school in a usual week, from parent data (n=807) at follow-up, stratified by student age and distance from home to school
On the morning journey to school, 28.8 per cent of
students in the intervention group increased their
number of walking trips in a usual week, compared with
19 per cent in the control (p=0.05). this increase was
even more significant in Year 6 students of the
intervention group with an absolute difference of 19.6
per cent between the groups (p=0.03).
In regard to car travel, 41.5 per cent of students in the
intervention group decreased their number of car trips to
school in a usual week, as did 32.1 per cent in the
control group. However, this difference was not
statistically significant. after stratifying for distance from
home to school, the percentage of students who
increased their number of car trips was significantly lower
in the intervention group than that in the control group
(3.8% vs. 12.8%) among students living less than 1km
from school. these positive findings were not found in
the follow-up data on afternoon trips from school to
home.

PAGE 22 NSW HealtH Central Sydney Walk to School Research Program
the strongest predictors of students’ non-car travel at
follow-up were distance from home to school, access to
public transport, and if students did not travel by car at
baseline. after accounting for these factors, the odds
ratio of students in the intervention group not travelling
by car was 1.6 compared to the control group. after
adjustment for clustering, the factors that remained
significant predictors of non-car use at follow-up were
distance from home to school and non-car use at
baseline.
Qualitative evaluation
Interviews were conducted with principals and/or teacher
coordinators at 11 of the 12 schools in the intervention
group. In general, principals and teacher/coordinators
supported the program and its goals. at several schools
teachers and principals said they thought that reaching
and influencing parents was the key strategy for effective
active travel to school programs, as parents made the
decisions about how their children travelled to and from
Table 10: Predictors (by multivariate analysis) of student non-car travel in 1,234 students following the intervention, based on student survey data.
Predictor % non-car users exposed to predictor
% non-car users not exposed to
predictor
Unadjusted OR (95%CI)
Adjusted OR (95% CI)
P value Adjusted P value
Walk to school group
45.1 37.6 1.37 (1.09, 1.72) 1.60 (1.08, 2.22) 0.02 0.53
Home to school distance < 1km
59.7 25.0 4.44 (3.48, 5.66) 4.27 (3.08, 5.93) <0.0001 <0.0001
Student at a school with high access* to public transport vs. school with medium/low access*
36.3 53.2 0.50 (0.39, 0.64) 0.43 (0.28, 0.66) <0.0001 0.19
Student at a school with medium access* to public transport vs. school with high/low access*
44.3 37.8 1.31 (1.04, 1.65) 0.64 (0.41, 1.01) 0.053 0.65
Student travelled by ways other than car in 2005
64.7 28.3 4.65 (3.29, 6.56) 4.11 (2.83, 5.98) <0.0001 0.002
* Participating schools were classified as having high, medium or low access to public transport, depending on the availability, proximity and frequency of public transport near the school. Information on distance from home to school was obtained from parent surveys matched to their child’s survey data.
Predictors of non-car use following the intervention
to predict the factors that determined student travel by
methods other than car, logistic regression was applied
to follow-up data collected from students. table 10
shows the factors that were found to predict student
travel by methods other than car.
school. Several interviewees stated that at their schools,
engagement with parents was a general issue, and cited
lack of english language skills and long hours in the paid
workforce as barriers to parent involvement.
Schools with significant numbers of parents who did not
speak and/or read english noted that the translated parent
surveys (into Chinese, Vietnamese and Korean) were
appreciated by parents. Some schools had community
liaison officers who translated parts of the Footsteps
newsletters and distributed this material to parents.
When asked which aspects of the program worked best
at their school, a majority of interviewees listed the
Footsteps newsletter for parents and the taGs developed
for the schools. the home to school mapping exercise
was also mentioned very positively in several interviews.
Interviewees from the three schools that had been lent
pedometers as part of the Be active take Steps
component of the program42 emphasised that their
students enjoyed using the pedometers and the
associated activities.

Central Sydney Walk to School Research Program NSW HealtH PAGE 23
When asked to identify the factors that assisted the
school in implementing the program, a majority of
interviewees described the importance of continuity of
teachers. three principals said that their teacher/
coordinators had been at their school for a long time and
their excellent relationships with fellow teachers and
parents helped the program to run smoothly.
Interviewees from two schools mentioned that staff
changes and having relieving teachers were barriers to
effective implementation. all interviewees stated that
running the program over two years was a strength, as it
enabled teachers involved in 2005 to mentor other
teachers the following year, and students to develop and
extend their skills in relation to road safety and
independence as they matured.
Several interviewees described the physical environments
around their schools as not conducive to active and safe
travel. Several principals had raised these issues with their
local council and the Rta. at some schools, principals
and teachers said their local councils were keen to do
what they could to improve the environments, but others
described less positive experiences. Several schools had
tried to have additional pedestrian crossings or traffic
lights installed, but had not been successful.
In general, all interviewees stated their experience of the
program had been positive, and all schools planned to
distribute their taG at Kindergarten Orientation sessions
and to newly enrolled students and their parents.
PAGE 24 NSW HealtH Central Sydney Walk to School Research Program
SeCtION 6
Discussion
Strengths of the WTS Program
the strengths of the WtS Program included:
n Rigorous evaluation, including a control group, baseline
and follow-up surveys, and data analyses that took
account of the cluster design
n Data on student travel patterns were collected from
students and from their parents before and after the
program
n the intervention activities aimed to reach parents,
because they decide how their children travel to and
from school, compared to most other active travel or
WtS programs that focus on students, via the school
curriculum
n the program was able to produce overall and localised
survey findings on student travel patterns, using
aggregated data and school-specific data
n Schools were given timely and localised feedback on
their survey results. a baseline and a follow-up report
was written for each of the 24 schools, based on data
specific to their school, and these reports were
distributed to principals, teachers and parents
n all 24 of the participating schools stayed in the
program for the two-year study period, which can be
seen as a reflection of the program’s acceptability
n the development of a taG for each of the 12
intervention schools was an innovation, as was the
distribution of the taG with local public transport route
and timetable information to individual parents
n the program had multiple potential benefits, including
increased physical activity, improved air quality, reduced
car use and associated traffic congestion around
schools, which motivated several groups (such as school
principals, students, parents and local councils) to be
involved.
Variations in changes in student travel
analyses of aggregated data from the student surveys did
not yield a significant intervention effect. the results of
the data from the student surveys showed that students
in both the intervention and control groups increased
their walking and reduced their car travel. this shift may
be partly explained by the greater independence that
children develop (and expect to have) as they mature,
particularly between the ages of 10-12 years.
there were variations in increases in walking from school
to school in the intervention and the control groups. Data
reported by students showed that from 2005 to 2006
there was an increase in walking on all days, and on
some days of the week for six of the12 schools in the
intervention group (range 2.2% to 17.1%), and for eight
of the 12 schools in the control group (range 2.1% to
20%).
Four schools in the intervention group and three schools
in the control group showed larger increases in walking,
from 8.4 per cent to 20 per cent, but analysis of
aggregated data diminished the demonstration of these
local effects.
these results demonstrate a high degree of
heterogeneity, which suggests that the pattern of travel
for each school is influenced, at least in part, by factors
that operate at the local level. this high variation in travel
patterns is reflected in data analysed and published in
2008 by the NSW transport Data Centre. this data is on
how people travel to workplaces in different geographic
areas of Sydney, and has been derived by the NSW
transport Data Centre from the 2006 Census.43 For
example, the proportions of people travelling by car to
workplaces located in the Sydney Central Business
District, the Ultimo/Pyrmont area, the University of
Sydney/Royal Prince alfred Hospital at Camperdown and
Burwood (all areas included in the WtS Program) were
16 per cent, 45 per cent, 37 per cent and 75 per cent
respectively.
Central Sydney Walk to School Research Program NSW HealtH PAGE 25
there were differences between intervention and control
schools that may have contributed to the variations in
walking and driving rates. these included students
leaving and joining schools, access to and frequency of
public transport, and traffic conditions near schools.
analysis of data reported by parents in response to the
question ‘how does your child travel to school in a usual
week’ found a significant intervention effect in the
intervention group. the proportion of students in the
intervention group who increased the days they walked
in a usual week was higher than the proportion that
decreased their walking, whereas in the control group it
was the other way around.
the increase in walking in the intervention group was
greater than the increase in the control group, the
difference being 9.8 per cent. the decrease in walking in
the intervention group was smaller than the decrease in
the control group, the difference being 6.5 per cent.
the decrease in number of days travelled by car was
greater in the intervention group than the decrease in the
control group, the difference being 9.4 per cent.
However, the differences between the groups were not
statistically significant. as the program explicitly aimed to
increase walking to and from school, it is possible that
some parents felt obligated to give 'the right answer' and
so reported increased walking. these differences could
also be explained by possible discrepancies between
modes of travel in a usual week (as reported by parents)
and modes of travel in one specific week (as reported by
students).
Methodological issues
Survey response and follow-up rates
the follow-up rate for students was moderate (65%).
the possibility that student survey data was biased due to
numbers lost at the 2006 survey was checked. No major
differences were found between students who
completed the follow-up surveys and those who did not,
in terms of socio-demographic characteristics, distance
from their home to school or travel mode measured at
baseline.
the overall response rate to the baseline parent survey
was very good (71%), and the response rate for the
follow-up parent surveys in 2006 was slightly less (69%).
the wide range of response rates for the parent follow-
up survey from the 24 schools (from 35% to 87%) may
have influenced the results.
Sample size
the sample size was calculated to enable eight per cent
difference in any travel mode to be detected, whereas
the differences observed were smaller, which reduced the
power. Further, the design effect was larger (2.6) than
that anticipated (1.7) indicating large variability within
each school, which further compromised the statistical
power.
Balanced distribution of factors across intervention and control groups
Since the unit of randomisation was the participating
school and not individual students, balanced distributions
of major factors known to influence travel mode
between the intervention and control groups could not
be ensured. there was a higher proportion of students in
the intervention group who walked all the way all days at
baseline, thus creating a ‘ceiling’ on the percentage of
students who could increase their number of walking
trips.
Measurement issues
Part of the explanation for the lack of a strong effect
could be associated with issues of measurement. the
program collected data from students on their actual
travel to and from school for five consecutive school days
and data from parents on their child’s travel for five
morning and five afternoon trips in a usual week. It is
possible that different results may have been obtained if
data on actual travel over five days had been collected
from parents, but this would have required additional
resources and may have resulted in a lower parent
response rate.
It was important for the WtS Program’s surveys to collect
data on the pattern of students’ travel within a week, as
previous research had found that many students travel by
more than one mode throughout the school week. In
NSW, 20.2 per cent of students regularly went to and
from school by active travel when all 10 trips in a school
week were considered, as did 33.3 per cent when at least
five trips were considered, and 42.3 per cent if one trip
was considered.15
the actual travel patterns of students in a specific week
(the data collected in the student surveys) may not be the
same as the usual pattern in a typical week (the data
collected in the parent surveys). In addition, data on
students’ travel patterns in a specific week at the end of
a two-year intervention may not be sufficiently sensitive
or comprehensive to reflect the overall effect of the
intervention.
PAGE 26 NSW HealtH Central Sydney Walk to School Research Program
From 2005 and 2006 a number of class teachers changed
within schools, which may have influenced the teachers’
supervision of the student surveys. about half of the 86
Year 5 and 6 teachers in the program (intervention and
control schools) in 2006 had not been involved in the
program in 2005. Some teachers who supervised classes
during the week of the survey were relieving teachers.
this may explain why some students in some classes did
not record data for all five days.
It is possible that the survey results may have been
influenced by the weather. Baseline surveys were
conducted in March 2005 and follow-up surveys in
October 2006, when similar temperatures could be
expected. However the RCt design meant that weather
that may have discouraged walking at the time of both
surveys would have equally affected students from
intervention and control schools.
Contextual issues and the effectiveness of the intervention
Intensity of the intervention
the implementation of this program included a series of
tailored interventions for the 12 intervention schools, a
series of interventions on healthy eating for the 12
control schools, and the organisation and coordination of
surveys in 24 schools for more than 2,200 students and
their parents, requiring the involvement of 117 teachers
in 2005 and 86 teachers in 2006. about half of the
teachers involved in 2006 had not been part of the
program in 2005. the program’s schedule and scale,
including its extensive evaluation components, may have
meant that the intervention activities for the WtS schools
were not as intensive as needed.
Extended implementation of a complex program
the 24 schools were diverse in relation to their size, class
organisation, socio-economic and cultural mix of
students, location and access to public transport, and
therefore the intervention and evaluation components of
the program took place, in effect, in 24 different settings.
to facilitate working with 24 schools, the project officer
asked each school to nominate a teacher who could
coordinate information and activity for that school, and
work with other teachers and classes in the program.
this created an extended ‘chain of implementation’ for
the program, which brought additional complexity to its
coordination and assessment of its reach. Inevitably the
extent and intensity of each school’s involvement
depended to a degree on the enthusiasm and ability of
their teacher/coordinator. these teacher/coordinators had
between one to 10 other teachers to work with,
according to the size of their school. about half of the 86
teachers involved in the program in 2006 (intervention
and control groups) were involved in the program’s
implementation for the full two-year period.
the interest and commitment of the school principals
was also a critical factor, and the extent to which schools
were involved in other major projects.
Other influences beyond the intervention
Parents and teachers at schools in the control group may
have been influenced by other programs and initiatives to
increase walking and to reduce car use, thus diluting the
program’s effect in the intervention schools. In NSW, the
Pedestrian Council of NSW runs Walk Safely to School
Day each year, and schools, including those in the control
group, are encouraged to participate by local councils
and the NSW Department of education.
all primary school children in NSW learn about the
benefits of physical activity as part of the Personal
Development, Health and Physical education Key
learning area. the curriculum for Stage 3 (Year 5 and 6
students) includes the benefits of accumulated physical
activity.
Widespread public debate during 2005 and 2006 on
climate change and the need to reduce greenhouse gas
emissions may have influenced some parents in the
control schools to reduce their car trips and/or walk with
their children. During this time the cost of petrol
increased, as did the number of passengers using Sydney
Buses.44
Central Sydney Walk to School Research Program NSW HealtH PAGE 27
Individual and family factors
the program’s results indicate that it is difficult to modify
some of the factors that influence active travel to school,
even with significantly more resources than those
available to this program. this program adopted an
organisation-based approach and tailored the
interventions to the differing needs of students and
parents in the schools.
Decisions about the way children travel to school are
influenced by many factors, including some specific to
individuals (for example the child’s involvement in other
activities, their preferences), some reflect family situations
(for example employment, extent to which responsibilities
are shared between both parents), and some are linked
to the local physical environment (such as traffic
congestion, road safety, walkability, access to public
transport).
Schools and their vicinities
to address road safety issues, the program worked with
councils to identify problems and to improve the physical
environments of the 12 intervention schools. the
program’s safety reviews of schools and their vicinities
identified physical hazards or barriers to active and safe
travel. after the reviews, councils facilitated some
adjustments to improve safety in the environments
around some schools.
However, it proved difficult for the program to make the
environments around all the intervention schools more
conducive to active and safe travel. the negotiation
processes needed to resolve problems were lengthy, and
in retrospect it was clear that the program did not have
sufficient resources and time to deal with these issues
thoroughly, particularly in relation to 12 different school
environments. as well, the program was without specific
funds for infrastructure works or the capacity to
negotiate changes with the Rta and public transport
agencies.
Previous work on active travel to school conducted by the
Health Promotion Unit of CSaHS had been done with
officers from one council. these people were highly
aware of active and safe travel issues, and were keen to
improve environments if they had the capacity and funds
to do so. It is possible that these conditions were not
present to the same degree in other councils.
these issues of capacity may have compromised the
success of the intervention in schools where the safety of
the physical environment and/or the lack of access to
public transport may have deterred parents and students
from active travel.
Making the physical environments around schools and
their vicinities more conducive to active and safe travel is
a demanding task. In NSW there is complex and divided
jurisdiction between the multiple agencies responsible for
improving safety, walkability and amenity of schools and
their vicinities. these agencies include the Rta, councils,
public transport bodies, police, and schools.45
the process of improving environments for active and
safe travel is therefore complicated. there is currently no
multi-sectoral forum where these key agencies can
discuss active travel issues.46 to achieve effective
collaboration between these disparate agencies would
require high level commitment, policy innovation and
additional resources.
local and state governments need to develop more
systematic approaches to making the environments of
schools and their vicinities more conducive to active and
safe travel. an example is the City of Sydney Council’s
decision on 27 august 2007 that their local area traffic
Management Schemes will identify and implement safety
improvements including traffic management measures
around schools and on identified walking routes to those
schools.47 the City east local area traffic Management
Scheme, approved in May 2008, included a Safe Routes
to School audit of all schools in the area and a
recommendation to implement its findings.48
Some schools in NSW are using the issue of climate
change as a framework to address sustainability issues,
including travel to and from school, through the School
environment Management Plans, required by the Det.49
PAGE 28 NSW HealtH Central Sydney Walk to School Research Program
Sharing responsibilities for travel to school between parents
In NSW, the increased number of mothers in the paid
workforce and the need to drop off and pick up children
on the way to and from work has been seen as a major
factor in the decline in walking to school.50 the WtS
Program’s baseline survey showed that for about 80 per
cent of participating students, mothers took their
children to and from school, even though about two-
thirds of these mothers were in the full or part-time paid
workforce.51 another study has found that if the father
was responsible for taking the child to school the child
was more likely to walk regularly.16 a US study with
similar findings has concluded that policy makers could
encourage both parents to share the task of taking their
children to school to address time constraints.52
the WtS Program’s Fathers’ Day activity conducted in
2005 and 2006 aimed to encourage greater sharing of
responsibility between parents by suggesting fathers walk
with their children to and from school. as the program
did not collect any data on the extent of implementation
of these activities at school level or on their impact, it is
not possible to comment on their effects. Future
programs could explore a more equal sharing of
responsibilities between mothers and fathers, and
encourage fathers to take their children to and from
school by active travel.
Parents’ journey to work
the WtS Program’s baseline survey confirmed that
children were more likely to be driven to school if the
parent taking them to school went to work by car.51
Parent journey to work is a difficult factor to change. It
was anticipated that only a small percentage of parents
in the WtS Program would or could be able to change
from car travel to active travel, but it was thought
worthwhile to encourage parents to try.
the development of a taG for the 12 WtS schools was a
strategy to encourage parents to go to work by active
travel after taking their children to school. the taGs and
local bus and train timetable and route information were
distributed to parents at the 12 schools from March to
July in 2006, and this may have been too late in the year
to influence the travel patterns of students and parents.
the taGs may have a role in influencing student and
parent travel patterns, if schools distribute their taGS to
new parents when their children enrol at school.
It may be more strategic to increase active travel to work
among employees through workplace-based programs.
In a 2004 systematic review by Ogilvie, six out of 22
interventions aimed to reduce car travel to work, and
none of these interventions included children’s travel to
school.18 the majority of the workplace interventions
focused on costs (such as financial incentives for not
using cars, free bus passes, free bikes), and only one
study demonstrated statistically significant effects. this
Californian program included incentives for employees to
choose cash in lieu of an employer-provided parking
subsidy and it produced a (statistically significant) shift of
one per cent from car use to active travel.53
In general, few active travel programs have focused on
trips that include more than one destination, for example
the home-school-work journey. In australia, government
tax policies on fringe benefits enable many employers to
provide selected employees with significant incentives for
car travel.54, 55
Central Sydney Walk to School Research Program NSW HealtH PAGE 29
SeCtION 7
Conclusions and recommendations
the WtS Program’s data from parent surveys showed
that its intervention to increase walking to and from
primary school had a positive effect, but this same effect
was not found in the data from student surveys. the high
variation in rates of walking and car travel from school to
school meant it was hard to discern an overall pattern
within and between the intervention and control schools.
Given the variation from school to school, it is probable
that programs tailored to meet local needs will have a
stronger impact than uniform programs.
the WtS Program found that parent journey to work has
a major influence on the student journey to school, and
so needs to be a focus of active travel to school
programs. It is likely that other influential factors are
location and hours of parent employment, availability and
frequency of public transport, and walkability and safety
of the physical environments around schools.
It is often assumed that students should be the main
focus and schools the most obvious and appropriate
organisational settings for active travel to school
programs.26 this is despite evidence that parents
generally decide how their children will travel to school.16
International and australian experience shows that
schools and their larger organisations (such as Det) do
not have the funds, capacity or policy goals to address
the main determinants of travel to and from school.20, 56
to be effective, active travel to school programs need to
address the complex interaction of the multiple factors
that influence travel to school and to work. Schools are
indispensible partners in active travel to school programs,
but it is more likely that agencies responsible for public
transport, health, roads and road safety, and
environmental protection, and local government have
greater capacity to make the changes required for
increased active travel. Coordinated workplace and
school active travel programs may also have benefits.
Further active travel programs require collaboration with
these key state and local government agencies and funds
to make environments more conducive for active and
safe travel. In the UK and USa governments have funded
large scale active travel programs with significant budgets
for physical infrastructure works, including cycling and
walking paths.57, 58 the City of Sydney Council has
allocated $77 million to build a 55km network of
separated cycleways in its area during 2009-2013.59
Since the WtS Program was funded, the australian and
NSW governments have acknowledged the impact of
climate change and its far-reaching implications for
population health, transport, urban design and the
economy.60,61 the effects of climate change provide
compelling reasons for the development of active travel
programs and other communication, health and social
change programs to reduce greenhouse gas
emissions.62,63,64 the NSW Government has policies that
support a widespread shift in the population from car use
to active travel.65 Such a shift requires significant
expansion and upgrading of public transport systems,66 a
less central role for cars in economic and social life,67 and
the participation of young people. Walking to and from
school can provide children with experiences of active
travel in their early years, and set a foundation for them
to continue to travel in this way in their adolescence and
adulthood.
the findings of the WtS Program and more recent
initiatives can inform the development of future active
travel programs to schools, workplaces and other
destinations.
PAGE 30 NSW HealtH Central Sydney Walk to School Research Program
Recommendations
n Programs should be funded for at least two years, to
accord with the long-term planning processes of
schools.
n More resources are required for complex, large scale
programs (such as the WtS Program), to implement
interventions at a sufficiently intensive level and to
organise the program’s research and evaluation
components.
n Programs need to be tailored in response to local
circumstances, including the variation in travel patterns
from school to school.
n Research and evaluation designs for active travel
programs need to anticipate and allow for the complex
interaction of factors that influence travel. evaluation
measures should have sufficient capacity to assess the
wider impact of their interventions.
n active travel programs should work with geographic
clusters of schools and/or workplaces to maximise the
benefits of reduced car use and traffic congestion and
of improvements to safety and walkability of
environments.
n active travel to school programs should not focus on
schools and students alone. Programs need to involve
key state and local government agencies such as the
Rta, public transport organisations and local councils
with the capacity to increase active travel to school and
work. Collaboration between these sectors is
particularly necessary if schools and their vicinities are
to become more conducive to active and safe travel.
n Future programs should aim to increase active travel
(defined as walking, cycling and/or the use of public
transport, either separately or in combination) rather
than having a specific focus on walking or cycling. this
more general approach is suitable for adults, young
people and children. the inclusion of public transport in
the definition of active travel broadens its applicability
and makes active travel a practical option for more
people (for example parents in the paid workforce and
families living more than one kilometre from school
and/or work).
n Future programs should focus on the parent journey to
work and linked trip journeys (trips that have more than
one destination), particularly the home-school-work
journey. this could be done by running coordinated
and/or simultaneous programs with workplaces and
schools linked by public transport corridors.
Central Sydney Walk to School Research Program NSW HealtH PAGE 31
References
1. Davison K, Werder J, lawson C. Children’s active
Commuting to School: Current Knowledge and
Future Directions. Preventing Chronic Disease. July
2008; 5(3).
2. World Health Organisation. Charter on Transport,
Environment and Health. Geneva; 1999.
3. leyden K. Social Capital and the Built environment: the
importance of walkable neighbourhoods. Am J Public
Health. 2003; 93(9):1546-1551.
4. Dora C, Phillips M, editors. Transport, Environment and
Health. Copenhagen: World Health Organisation
Regional Office for europe; 2000.
5. Frumkin H. Urban Sprawl and Public Health: designing,
planning and building for healthy communities.
Washington DC: Island Press; 2004.
6. van der Ploeg H, Merom D, Corpuz G, Bauman a.
trends in australian children travelling to school
1971-2003: burning petrol or carbohydrates? Prev
Med. 2008; 46(1):60-62.
7. Booth M, Okely aD, Denney-Wilson e, Hardy l, Yang
B, Dobbins t. NSW Schools Physical Activity and
Nutrition Survey (SPANS) 2004: Summary Report.
Sydney: NSW Department of Health; 2006.
8. DiGuiseppi C, Robert I, leah li, allen D. Determinants
of car travel on daily journeys to school: cross
sectional survey of primary school children. Brit Med J.
1998; 316:1426-1428.
9. Department of Health and ageing. Australia’s Physical
Activity Recommendations for 5-12 year olds.
Canberra: DHa; 2004.
10. tranter P, Pawson e. Children’s access to local
environments: a case study of New Zealand. Local
Environment. 2001; 6(1):27-48.
11. Roberts I. Why have child pedestrian death rates
fallen? Brit Med J. 1993; 306:1737-1739.
12. tranter P, Malone K. Out of bounds: Insights from
children to support a cultural shift towards sustainable
and child-friendly cities. Proceedings of the National
Conference of the State of australian Cities, Sydney;
2003.
13. Cairns S, Sloman l, Newson C, anable J, Kirkbride a,
Goodwin P. Smarter Choices – changing the way we
travel. Report to Department for transport, london;
2004.
14. Bradshaw R, Jones P. The Family and the School Run:
What Would Make a Real Difference? Scoping Report
to aa Foundation for Road Safety Research, london:
University of Westminster; 2000.
15. Merom D, tudor- locke C, Bauman a, Rissel C.
active commuting to school among NSW primary
school children: implications for public health. Health
and Place. 2006; 12:678-687.
16. McDonald N. Household interactions and children’s
school travel: the effect of parental work patterns on
walking and biking to school. Journal of Transport
Geography. 2008; 16(5):324-331.
17. timperio a, Ball K, Salmon J, Roberts R, Giles-Corti B,
Simmons D, et al. Personal, family, social and
environmental correlates of active commuting to
school. Am J Prev Med. 2006; 30(1):45-51.
18. Ogilvie D, egan M, Hamilton V, Pettigrew M.
Interventions to promote walking and cycling as an
alternative to using cars: a systematic review. Brit Med
J. 2004; 329:763-6.
19. Mason C. transport and Health: en route to a
healthier australia? Med J Australia. 2000; 172:30-
232.
20. Urbantrans. School Travel Plans: International
Research Summary. Report for australian Government
Department of environment, Water, Heritage and the
arts; March 2008.
21. Department for education and Skills and Department
of transport. Travelling to School: an action plan.
United Kingdom; 2003.
22. Rowland D, DiGuiseppe C, Gross M, afolabi e;
Roberts I. a randomised controlled trial of site-specific
advice on school travel plans. Arch Dis Child. 2003;
88:8-11.
PAGE 32 NSW HealtH Central Sydney Walk to School Research Program
23. Boarnet M, anderson C, Day K, McMillan t, alfonzo
M. evaluation of the California Safe Routes to School
legislation: Urban form changes and children’s active
transportation to school. Am J Prev Med. 2005;
28(2):143-140.
24. Centre for Health training. Safe Routes to School:
Practice and Promise. US National Highway traffic
Safety administration; 2004 [cited 7 May 2009].
available from: http://drusilla.hsrc.unc.edu/cms/
downloads/SafeRoute2Schlo.pdf.
25. Safe Routes to School National Partnership. Safe
Routes to School: 2007 State of the States Report.
2007 [cited 30 april 2009]. available from: http://
www.saferoutespartnership.org.media/file/rpt_
SRS.2007.pdf.
26. australian Greenhouse Office. evaluation of
Australian Travelsmart Projects in ACT, South
Australia, Queensland, Victoria and Western Australia
2001-2005. Canberra: Report to australian
Greenhouse Office, Department of environment and
Heritage; 2006.
27. VicHealth. It’s more than just walking! The value-
adding impact of the Walking School Bus program on
local environments and communities. Melbourne:
Victorian Health Promotion Foundation; 2007 [cited
30 april 2009]. available from: http://www.vichealth.
vic.gov.au/~/media/ProgramsandProjects/
Physicalactivity/attachments/Its%20more%20
than%20just%20walking%20publication%20
final%20aug07.ashx.
28. VicHealth. Walking School Bus Snapshot Data
Information Sheet November 2007. Melbourne,
Victorian Health Promotion Foundation; 2007 [cited
30 april 2009]. available from: http://www.vichealth.
vic.gov.au/~/media/ProgramsandProjects/
Physicalactivity/attachments/WSB%20more%20files/
WSB%20Snapshot%202005-2007.ashx.
29. VicHealth. Streets Ahead: supporting children to get
active in their neighbourhoods. Victorian Health
Promotion Foundation; 2008 [cited 30 april 2009].
available from: http://www.vichealth.vic.gov.au/~/
media/ProgramsandProjects/Physicalactivity/
attachments/streets%20ahead%20FINal.ashx.
30. Merom D, Rissel C, Mahmic a, Bauman ae. Process
evaluation of the New South Wales Walk Safely to
School Day. Health Promotion Journal of Australia.
2005; 16(2):100-106.
31. Zaccari V, Dirkis H. Walking to School in Inner
Sydney. Health Promotion Journal of Australia. 2003;
14(2):140-143.
32. Health Promotion Unit, Central Sydney area Health
Service. Walk to School Partnership Agreement.
Camperdown; 2003.
33. NSW Health. Health Promotion with Schools. A policy
for the health system. Sydney; 2003.
34. Roads and traffic authority. Road Safety 2010. A
framework for saving 2000 lives by 2010 in NSW.
Sydney; 2005.
35. Department of education. Road Safety Education
Policy Statement: Preschool to Year 12 1995. Sydney:
NSW Department of education. available from: http://
www.det.nsw.edu.au/policies.
36. Board of Studies of NSW. Personal Development,
Health and Physical Education Kindergarten – Year 6
Syllabus. Sydney; 1999.
37. Ukoumunne O, Gulliford M, Chinn S, Sterne J,
Burney P. Methods for evaluating area-wide and
organisation-based interventions in health and
health-care: a systematic review. Health Technol
Asses. 1999; 3(5).
38. Winchester l, Dobbinson S, Rissel C, Bauman A.
anonymous record linkage using respondent-
generated ID codes - a tool for health promotion
research. Health Promotion Journal of Australia.
1996; 6(2):52-54.
39. Kerry SM, Bland JM. analysis of a trial randomised in
clusters. Brit Med J. 1998; 316-354.
40. Uitenbroek, DG. SISA – Binomial. 1997 [cited 12 May
2009]. available from: http://www.quantitativeskills.
com/sisa/distributions/binomial.htm.
41. Kerry SM, Bland JM. trials which randomise practices:
How should they be analysed? Fam Pract. 1998;
15:80-83.
42. Centre for Health Promotion. Be Active Take Steps:
Pedometer Activities for Schools. adelaide: Women’s
and Children’s Hospital; 2004.
43. transport Data Centre. Transfigures: Employment and
Commuting in Sydney’s Centres, 1996-2006. Sydney:
NSW Ministry of transport; 2008.
44. transport Data Centre. 2005 Household Travel Survey
Summary Report. Sydney: NSW Ministry of transport;
2007.
45. PPM Consultants. Active Travel to School in NSW:
Issues and Opportunities. a report commissioned by
the NSW travelsmart Schools Program Steering
Committee (SSWaHS) 2007.
Central Sydney Walk to School Research Program NSW HealtH PAGE 33
46. Fry D. NSW Travelsmart Schools Program 2006-2007
Summary Report. Camperdown: Health Promotion
Service, Sydney South West area Health Service;
2008.
47. City of Sydney Council Cultural and Community
Services Committee. Item 3 Walking to School. 2007
[cited 4 May 2009]. available from: http://www.
cityofsydney.nsw.gov.au.
48. Council of the City of Sydney. City East Local Area
Traffic Management Plan 2008. [cited 4 May 2009].
available from: http://www cityofsydney.nsw.gov.au.
49. NSW Department of education and training.
Environmental Education Policy for Schools. Sydney:
2006 [cited 30 april 2009]. available from: http://
www.det.nsw.edu.au/polics/curriculum/schools/
envir_educ/PD20020049.shtm.
50. transport Data Centre. Household Travel Survey
Summary Report. Sydney: NSW Department of
transport; 2001.
51. Wen l, Fry D, Rissel C, Dirkis H, Balafas a, Merom D.
Factors associated with children being driven to
school: implications for walk to school programs.
Health Educ Res. 2008; 23(2):325-334.
52. Salmon J, Salmon l, Crawford D, Hume C.
associations among Individual, Social, and
environmental Barriers and Children Walking and
Cycling to school. Am J Health Promot. 2007;
22(2):107-113.
53. Shoup DC. evaluating the effect of cashing out
employer-paid parking. Transp Policy. 1997; 4(4):201-
216.
54. National Preventative Health Strategy. Submission to
the Review on Australia’s Future Tax System. 2008
[cited 5 May 2009]. available from: http://www.
taxreview.gov.au/submissions.
55. Public transport Users association. A tax system for
sustainable transport. Submission to the Review on
australia’s Future tax System. 2008 [cited 5 May
2009]. available from: http://www.taxreview.gov.au/
submissions.
56. Wen l M, Fry D, Merom D, Rissel, Dirkis H, Balafas a.
Increasing active travel to school: are we on the right
track? a cluster randomised trial from Sydney,
australia. Prev Med. 2008; 47(6):612-618.
57. Sustrans. Travel Actively: Walking and cycling for
health and wellbeing. Summary of projects 2008.
[cited 30 april 2009]. available from: http://www.
sustrans.org.uk.
58. Safe Routes to School National Partnership. Safe
Routes to School 2009 Policy Report. March 2009
[cited 30 april 2009]. available from: http://www.
saferoutespartnership.org/media/file/SRtS-
09FinalPolicy.pdf.
59. City of Sydney Council. Draft Corporate Plan and
Budget 2010 -2013. [cited 18 May 2009]. available
from: http://www.cityofsydney.nsw.gov.au/Council/
Onexhibition/DraftCorporatePlan.asp.
60. Garnaut R. The Garnaut Climate Change Review:
Report to Commonwealth, State and Territory
Governments of Australia. Melbourne: Cambridge
University Press; 2008.
61. NSW Government. NSW Greenhouse Plan Executive
Summary. Sydney: NSW Greenhouse Office; 2005.
62. Woodcock J, Banister D, edwards P, Prentice aM,
Roberts I. energy and transport. Lancet. 2007;
370(9592):1078-88.
63. Moser S, Dilling l, editors. Creating a Climate for
Change: Communicating climate change and
facilitating social change. Cambridge University Press,
2007.
64. Stott R. What should we do about climate change?
Brit Med J. 2006; 333:983-984.
65. NSW Government. A New Direction for NSW - The
NSW State Plan. Sydney; 2006.
66. Newman P, Beatley t, Boyer H. Resilient Cities.
Responding to Peak Oil and Climate Change.
Washington: Island Press; 2009.
67. Woodcock J, aldred R. Cars, corporations and
commodities: Consequences for the social
determinants of health. Emerging Themes in
Epidemiology. 2008 [cited 30 april 2009]; 5:4.
available from: http://www.ete-online.com/
contents/5/1/4.
PAGE 34 NSW HealtH Central Sydney Walk to School Research Program
For copies of these Appendices, please contact:
Health Promotion with Schools team
Health Promotion Service
Sydney South West Area Health Service
level 9 Nth, KGV Building
Missenden Rd Camperdown NSW 2050
Ph: 02 9515 9055
email: [email protected]
Appendix A explanatory brochure for schools and parents
Appendix B Project advisory Committee terms of Reference
Appendix C Project advisory Committee Membership 2005 -2007
Appendix D Program interventions and their implementation for schools in the Walk to School
(intervention) group 2005 and 2006
n Index of appendix D components
n Detailed description of program interventions and their implementation
n teacher Professional Development Days 2005 and 2006
n teacher Briefing Notes for Student Surveys
n Footsteps newsletters 2005 and 2006
n Media Release Walk Safely to School Day 3 May 2005
n Home to School Mapping exercise
n Fathers’ Day materials 2005 and 2006
n travel access Guides
n launch of travel access Guides
n active travel and the trip Planner – notes for teachers
n Be active take Steps materials
n Parent walks
n Media articles
list of appendices

Central Sydney Walk to School Research Program NSW HealtH PAGE 35
Appendix E Program interventions for schools in the Healthy lunch (control) group 2005 and 2006
n Index of appendix e components
n Program interventions for schools in the Healthy lunch group, 2005 and 2006
n tastebuds parent newsletters 2005
n tastebuds parent newsletters 2006
n Media report
Appendix F Baseline Student Survey term 1 2005
Appendix G Follow-up Student Survey term 4 2006
Appendix H Baseline Parent Survey term 1 2005
Appendix I Follow-up Parent Survey term 4 2006
Appendix J School-specific report with baseline survey results
Appendix K School-specific report with baseline and follow-up survey results
Appendix L Interview Questions for Principals and/or teacher coordinators
Appendix M Student Survey term 1 2006
Appendix N Publications and Presentations
Wen lM, Fry D, Rissel C, Dirkis H, Balafas a, Merom D. Factors associated with children being driven to school:
implications for walk to school programs. Health Educ Res. 2008; 23(2):325-334.
Wen lM, Fry D, Merom D, Rissel C. Dirkis H, Balafas. a Increasing active travel to school: are we on the right track? a
cluster randomised controlled trial in Sydney, australia. Prev Med. 2008; 47(6): 612-618.
Wen lM, Kite J, Merom D, Rissel C. time spent playing outdoors after school and its relationship with independent
mobility: a cross-sectional survey of children aged 10-12 years in Sydney, australia. International Journal of Behavioural
Nutrition and Physical Activity. 2009; 6:15. doi:10.1186/1479-5868-6-15.
Fry D. Linked trips and active travel. Presentation to On Your Bike Conference, NSW Department of environment and
Climate Change, Newcastle: July 2008.
Fry D. Active Travel to School – how you can support it. Presentation to NSW Sustainable Schools expo, Campbelltown.
NSW Department of education; September 2008.
Fry D. Active Travel to School. Presentation to NSW Health Promotion Symposium, Sydney; November 2008.

PAGE 36 NSW HealtH Central Sydney Walk to School Research Program

Central Sydney Walk to School Research Program NSW HealtH PAGE 37

PAGE 38 NSW HealtH Central Sydney Walk to School Research Program

SHPN (CHA) 090101