Embed Size (px)
Citation preview
Professional people with purpose
Making the people of New South Wales proud of the work we do.
Level 15, 1 Margaret Street Sydney NSW 2000 Australia
t +61 2 9275 7100 f +61 2 9275 7200e [email protected] office hours 8.30 am–5.00 pm
audit.nsw.gov.au
New South Wales Auditor-General’s ReportPerformance Audit
Reducing ambulance turnaround time at hospitals Ambulance Service of NSWNSW Ministry of Health
New
South W
ales Aud
itor-G
eneral’s Rep
ort | P
erform
ance Aud
it | Red
ucing amb
ulance turnaround tim
e at hosp
itals233
Professional people with purpose
audit.nsw.gov.au
The role of the Auditor-GeneralThe roles and responsibilities of the Auditor- General, and hence the Audit Office, are set out in the Public Finance and Audit Act 1983.
Our major responsibility is to conduct financial or ‘attest’ audits of State public sector agencies’ financial statements. We also audit the Total State Sector Accounts, a consolidation of all agencies’ accounts.
Financial audits are designed to add credibility to financial statements, enhancing their value to end-users. Also, the existence of such audits provides a constant stimulus to agencies to ensure sound financial management.
Following a financial audit the Audit Office issues a variety of reports to agencies and reports periodically to parliament. In combination these reports give opinions on the truth and fairness of financial statements, and comment on agency compliance with certain laws, regulations and government directives. They may comment on financial prudence, probity and waste, and recommend operational improvements.
We also conduct performance audits. These examine whether an agency is carrying out its activities effectively and doing so economically and efficiently and in compliance with relevant laws. Audits may cover all or parts of an agency’s operations, or consider particular issues across a number of agencies.
Performance audits are reported separately, with all other audits included in one of the regular volumes of the Auditor-General’s Reports to Parliament – Financial Audits.
audit.nsw.gov.au
GPO Box 12Sydney NSW 2001
The Legislative AssemblyParliament HouseSydney NSW 2000
In accordance with section 38E of the Public Finance andAudit Act 1983, I present a report titled Reducing ambulance turnaround time at hospitals: Ambulance Service of NSW, NSW Ministry of Health.
Peter Achterstraat Auditor-General
24 July 2013
© Copyright reserved by the Audit Office of New South Wales. All rights reserved. No part of this publication may be reproduced without prior consent of the Audit Office of New South Wales.
The Audit Office does not accept responsibility for loss or damage suffered by any person acting on or refraining from action as a result of any of this material.
ISBN 978 1921252 730
Our visionTo make the people of New South Wales
proud of the work we do.
Our mission To perform high quality independent audits
of government in New South Wales.
Our values Purpose – we have an impact, are accountable, and work as a team.
People – we trust and respect others and have a balanced approach to work.
Professionalism – we are recognised for our independence and integrity
and the value we deliver.
The Legislative CouncilParliament HouseSydney NSW 2000
NSW Auditor-General's Report to Parliament ∣Reducing ambulance turnaround time at hospitals ∣Contents
1
Contents
Executive summary 2
Background 2 Conclusion 2 Supporting findings 3 Recommendations 5 Response from the NSW Health 7
Introduction 14
1.1 What is ambulance turnaround time and why is it important? 14 1.2 What is the benchmark for turnaround time? 14 1.3 How do efforts to reduce turnaround time fit into broader health reforms? 15 1.4 What is the audit about? 16
Key findings 17
2. Do NSW Health’s strategies to reduce ambulance delays at emergency departments free up ambulances to respond to other incidents? 17
2.1 Are ambulance delays at emergency departments monitored and analysed? 17 2.2 Are there strategies in place to reduce ambulance delays at emergency departments? 20 2.3 Do strategies reduce time spent by ambulance crews at emergency departments? 26 3. Do the Ambulance Service’s demand management strategies limit the number of patients it
takes to emergency departments? 33 3.1 Is demand for emergency services monitored and analysed? 33 3.2 Are there strategies to limit the number of patients taken to emergency departments? 35 3.3 Has the number of unnecessary transports to emergency departments reduced? 39
Appendices 42
Appendix 1: About the audit 42 Appendix 2: Off-stretcher performance: NSW Hospitals 45 Appendix 3: Quarterly off-stretcher performance: case study hospitals 47 Appendix 4: Annual off-stretcher performance: case study hospitals 48 Appendix 5: Monthly transfer of care performance: case study hospitals 49
Performance auditing 50
Performance audit reports 51
NSW Auditor-General's Report to Parliament ∣Reducing ambulance turnaround time at hospitals ∣ Executive summary
2
Executive summary Background
The Ambulance Service of New South Wales plays an important role in our health system. Its paramedics provide frontline emergency care to the community. They treat sick and injured patients at the scene of an emergency, and if necessary, take them to hospital emergency departments.
However ambulances sometimes get delayed at hospitals. Most often it is because paramedics are unable to move their patient into a bed in the emergency department. When this happens they wait with their patient on the ambulance stretcher until a bed becomes available.
There are many causes of ambulance delays. Increasing demand for hospital services, both emergency and inpatient care, can limit hospital capacity and cause overcrowding in the emergency department, particularly during winter. The Ministry of Health reports that since 2005-06 emergency department presentations have grown at almost three times the population rate. And ambulance arrivals have grown more, at over four times the population rate.
Furthermore, there are often patients in the emergency department who are waiting for beds to become available in hospital wards. This limits the number of beds in the emergency department making it harder for paramedics to off-load their patients when they arrive.
It is important that paramedics spend as little time as possible at emergency departments so they can respond to other triple-zero calls in the community. Even a five minute delay might mean the difference between life and death for someone waiting for an ambulance.
The Ministry of Health, Ambulance Service, and Local Health Districts acknowledge the problem and have put a number of strategies in place to reduce delays. A key aim of the Minister for Health’s 2012 ambulance reforms, Reform Plan for NSW Ambulance, is to release ambulances more promptly.
NSW Health requires hospitals to off-stretcher or transfer 90 per cent of ambulance patients into their care within 30 minutes. The total time spent by ambulance crews at emergency departments is called turnaround time, and also includes the time spent by paramedics getting ready to respond to the next job.
This audit assessed whether there are effective strategies in place to reduce the time spent by ambulance crews at emergency departments. We answered the following questions:
do NSW Health’s strategies to reduce ambulance delays at emergency departments free up ambulances to respond to other incidents?
do the Ambulance Service’s demand management strategies limit the number of patients it takes to emergency departments?
To help us answer these questions we analysed key performance data and reviewed statewide policies and procedures relevant to this issue. We interviewed over 100 staff across six hospitals and five ambulance sector offices to get their views on ambulance delays and observe how strategies to reduce delays work in practice. We also examined approaches in other jurisdictions.
Conclusion
We found that ambulances wait longer at hospital emergency departments today than in previous years. Each day the Ambulance Service loses an average of 18 ambulances on the road due to hospital delays greater than 30 minutes, potentially costing $13.6 million annually to replace. This is an increase from six ambulance crews seven years ago. NSW Health has never met its target to offload 90 per cent of ambulance patients in 30 minutes. Therefore initiatives to reduce delays have had limited impact statewide.
NSW Auditor-General's Report to Parliament ∣Reducing ambulance turnaround time at hospitals ∣Executive summary
3
However the results for individual hospitals varied. In 2011-12 just over a quarter of NSW hospitals met the off-stretcher target. Others did not meet the target, but recently improved performance. Therefore strategies put in place by some hospitals to reduce delays are working.
We found that the Ambulance Service’s demand management strategies limit the number of patients transported to emergency departments. However these strategies are not used to their full potential. There is further scope for the Ambulance Service to reduce unnecessary transports to hospitals.
Supporting findings
Do NSW Health’s strategies to reduce ambulance delays at emergency departments free up ambulances to respond to other incidents?
Although the Ambulance Service and hospitals have put a range of strategies in place to reduce ambulance delays, average statewide performance has declined. In 2011-12, one in three ambulances was delayed more than 30 minutes at hospital emergency departments. We found that over the last seven years:
average off-stretcher time, the time to offload ambulance patients, rose from 24.4 to 31.6 minutes
average turnaround time, the total time spent by ambulances at hospitals, rose from 30.5 to 42.1 minutes
the proportion of ambulance patients offloaded in 30 minutes fell from 77 to 65 per cent
the number of hospitals not offloading 90 per cent of patients in 30 minutes rose from 34 to 64
the median response time for the highest priority emergency calls rose from 9.5 to 10.9 minutes.
Although statewide performance is declining, some hospitals perform better than others. In 2011-12 just over one in four hospitals met the off-stretcher target. These were mainly small regional hospitals. Reducing ambulance delays is more challenging for larger, busier hospitals, particularly in metropolitan areas. None of the 20 hospitals with the highest number of ambulance presentations met the target during the last seven years. Rising demand for hospital services during this period may have contributed to the problem.
There is some good news. Performance has improved in some of the larger hospitals. Of the six hospitals we visited, two had improved off-stretcher performance. Both had put a range of strategies in place to improve patient flow in the hospital and reduce overcrowding in the emergency department. The key strategies they believe improved off-stretcher performance were:
moving emergency department patients admitted to hospital to temporary beds in the wards (over-census inpatient beds)
rapid triage and early assessment of emergency department patients by senior doctors.
Other strategies that release ambulances include calling in additional paramedics to care for patients on stretchers at the hospital (Ambulance Release Teams), moving patients to the waiting room, and moving patients to dedicated ambulance treatment areas (ambulance bays). However while these strategies free up ambulances, they do not reduce overcrowding in the hospital. Performance may improve in the short-term, but may not be sustainable.
It is important that strategies to reduce delays and emergency department overcrowding involve the whole hospital. Initiatives like temporary beds on the wards, although not a long-term solution, attempt to address this by focusing on one of the key causes of delays –access to inpatient beds. Ideally, hospitals should focus on sustainable solutions involving the hospital wards, such as better discharge planning. This requires all hospital staff to accept responsibility for ambulance delays.
NSW Auditor-General's Report to Parliament ∣Reducing ambulance turnaround time at hospitals ∣ Executive summary
4
Another issue relates to inter-hospital transfers by ambulance. Paramedics and hospital staff told us that patients stable enough to be admitted straight to the wards, were instead admitted through the emergency department. This means there are potentially more transports to the emergency department than necessary, further contributing to overcrowding and delays.
In 2012, the Ministry replaced off-stretcher time with transfer of care as its key measure of hospital performance in reducing delays. It puts the onus on hospitals, not paramedics, to record when patient handover has occurred. This is a positive development as it gives hospitals more ownership of the performance measure and therefore more incentive to reduce delays.
In the 11 months from April 2012 to February 2013, 83 per cent of patients were transferred into hospital care within 30 minutes. We cannot directly compare this result to off-stretcher performance because patient handover is recorded earlier in the process, yet the Ministry uses the same the 30 minute benchmark. The Ministry advises that the change management process it put in place when implementing transfer of care may have given hospitals a renewed focus on transfer of care. However more time is needed to see whether hospitals will improve against this new measure. Other ways to release ambulance crews are needed. Change needs to occur in the wards, where a key part of the problem lies.
In 2011-12, nearly one in ten ambulances waited longer than an hour to offload their patients. Under current practice, paramedics can wait indefinitely until a bed becomes free. In the meantime, there may be sick and injured people in the community waiting for ambulances. NSW Health needs to decide the maximum time it will let paramedics wait with patients before they can move them from the ambulance stretcher and into a hospital bed or treatment area. The Ambulance Service should not become a surrogate hospital ward.
Although hospital overcrowding is a key cause of ambulance delays, some ambulance crews can take a long time to leave hospital after they hand over a patient. It is important that the Ambulance Service understands the main reasons paramedics are delayed. For example, paramedics said that it could take a while to prepare an ambulance after a trauma, or to print a patient’s medical record. Addressing unnecessary delays after patients have been offloaded will also help to reduce turnaround time and improve paramedics’ capacity to respond to other calls in the community.
Do the Ambulance Service’s demand management strategies limit the number of ambulance patients it takes to emergency departments?
Currently four in five emergency calls result in patients being taken to hospital by ambulance. This is higher than in previous years. Meanwhile, demand for emergency transport has been rising by an average of 4.1 per cent each year.
Given increasing demand and an ageing population, it is important that only patients who require emergency treatment are taken to the emergency department. In response to these pressures, the Ambulance Service has put in place a number of strategies to limit the number of unnecessary transports to hospital. These include:
diverting non-urgent triple-zero calls to a telephone advice line
allowing paramedics to treat less complex conditions and refer patients to health services in the community.
Although the Ambulance Service does not routinely monitor unnecessary transports, the results for these specific initiatives are promising. We found that:
telephone advice lines reduce the number of ambulances sent out to incidents
in 2011 one in four incidents where patients were treated under new low acuity protocols, did not result in hospital transport
in 2010 two in five incidents attended by Extended Care Paramedics, who are trained to treat a range of less complex conditions, did not result in hospital transport.
NSW Auditor-General's Report to Parliament ∣Reducing ambulance turnaround time at hospitals ∣Executive summary
5
However these results could have been even better if these initiatives were used to their full potential. We found that only two in five eligible calls are transferred to the telephone advice line. Also two-thirds of the workload of Extended Care Paramedics is currently high priority response work rather than patients who may be treated and referred to alternate care.
Unrealistic public expectations about the role of the Ambulance Service also result in inappropriate calls and transports. For example, calling to get a script renewed or blood pressure checked is inappropriate. Some patients also think that calling an ambulance will fast-track them into a hospital bed. Current protocols require paramedics to take patients to hospital if they insist on transport, even if their clinical assessment indicates that hospital treatment is unnecessary. This needs to change.
The Ambulance Service aims to prevent about 125,000 hospital transports a year by 2021. To meet this goal the Ambulance Service needs to optimise current demand management strategies. It also plans to implement new initiatives including nursing home in-reach programs, and paramedics playing a role in preventative health. We agree with this approach but the Ambulance Service cannot do it alone. It will need the support and assistance of Local Health Districts and the Ministry of Health.
The Ambulance Service is a key entry point to the health system. Redirecting patients to the most appropriate care is an important, and necessary, demand management strategy. But it should not lose focus on its core role: providing an emergency response to sick or injured people. The Ambulance Service says inadequate resources in the face of growing demand will continue to put pressure on response times. Its challenge will be to achieve the right balance between its emergency response and demand management role.
Recommendations
Reducing transfer of care time
1. Regarding its performance measure for transfer of care, the Ministry of Health, in consultation with the Ambulance Service of NSW and Local Health Districts, should:
a) by December 2013, clarify the tasks which should occur before transfer of care is complete (page 18)
b) by July 2014, consider reducing the benchmark for transfer of care from 30 to 20 minutes in line with most other Australian state and territories (page 30).
2. By July 2014, the Ministry of Health and Agency of Clinical Innovation, in consultation with Local Health Districts, should provide guidance and advice on the development of hospital escalation plans to ensure they include:
a) ambulance delays as a response trigger
b) a whole-of-hospital response involving wards and other hospital services
c) what actions should occur, who is responsible for them, and within what timeframe (page 19).
3. By July 2014, Local Health Districts should evaluate the effectiveness of strategies to move emergency department patients to hospital wards, ie in line with National Emergency Access Targets, in reducing transfer of care time (page 24).
4. By December 2014 NSW Health should make hospitals more responsive to ambulance delays by:
a) determining the maximum time paramedics should wait with patients at emergency departments before hospitals must move patients from the ambulance stretcher and into their care
b) phasing out Ambulance Release Teams and redirecting resources to patient flow strategies in the hospital that help reduce transfer of care time (page 25).
NSW Auditor-General's Report to Parliament ∣Reducing ambulance turnaround time at hospitals ∣ Executive summary
6
5. By July 2014, to reduce ambulance turnaround time, the Ambulance Service of NSW:
a) review the main reasons for delays that occur after a patient has been off-loaded at hospital and introduce strategies to address these
b) introduce benchmarks for make-ready time and monitor performance against these (page 25).
Improving the patient flow of booked ambulances 6. By December 2013, the Ministry of Health should re-enforce compliance with its policy
on inter-facility transfers for patients requiring special care, to ensure Local Health Districts admit patients direct to inpatient beds and not through the emergency department (page 32).
7. By December 2014, NSW Health improve the patient flow of booked emergency ambulances, especially inter-hospital transfers and bookings made by health staff in the community, by:
a) reviewing the volume, type, and distribution of booked ambulance patients presenting to NSW hospitals
b) reviewing the process for booking ambulance patients by hospitals or health staff in the community to identify any problems which may need to be addressed
c) introduce strategies to address any gaps and improve patient flow of booked ambulance patients (page 32).
Reducing unnecessary hospital transports We recommend that the Ambulance Service of New South Wales:
8. By December 2014, reduce unnecessary ambulance responses by:
a) increasing the proportion of eligible calls referred to the telephone advice line healthdirect
b) stop assigning ambulances to calls transferred to healthdirect
c) in conjunction with NSW Health, review the impact of telephone advice referrals on ambulance and emergency department activity (page 36).
9. By December 2014, increase the non-transport rate by enabling paramedics to treat more patients at the scene by:
a) optimising the use Low Acuity Pathway protocols by removing any barriers that prevent paramedics from using them
b) improving the tasking arrangements of Extended Care Paramedics to ensure they are not automatically used for high priority emergency work (page 38).
10. Enable paramedics to determine, based on their clinical assessment, that hospital transport is not required. This may include:
c) by December 2014, introducing a process where paramedics can refuse to transport a patient to a hospital emergency department where it is clear that transport is not warranted
d) by July 2015, in consultation with relevant stakeholders, investigating alternate referral options or transport destinations, such as outpatient clinics and medical centres (page 39).
11. By July 2014, regularly monitor and report on the non-transport rate of its demand management initiatives to determine the success of its strategies to reduce unnecessary hospital transports (page 41).
NSW Auditor-General's Report to Parliament ∣Reducing ambulance turnaround time at hospitals ∣Executive summary
7
Response from the NSW Health
NSW Auditor-General's Report to Parliament ∣Reducing ambulance turnaround time at hospitals ∣ Executive summary
8
NSW Auditor-General's Report to Parliament ∣Reducing ambulance turnaround time at hospitals ∣Executive summary
9
NSW Auditor-General's Report to Parliament ∣Reducing ambulance turnaround time at hospitals ∣ Executive summary
10
NSW Auditor-General's Report to Parliament ∣Reducing ambulance turnaround time at hospitals ∣Executive summary
11
NSW Auditor-General's Report to Parliament ∣Reducing ambulance turnaround time at hospitals ∣ Executive summary
12
NSW Auditor-General's Report to Parliament ∣Reducing ambulance turnaround time at hospitals ∣Executive summary
13
NSW Auditor-General's Report to Parliament ∣Reducing ambulance turnaround time at hospitals ∣ Introduction
14
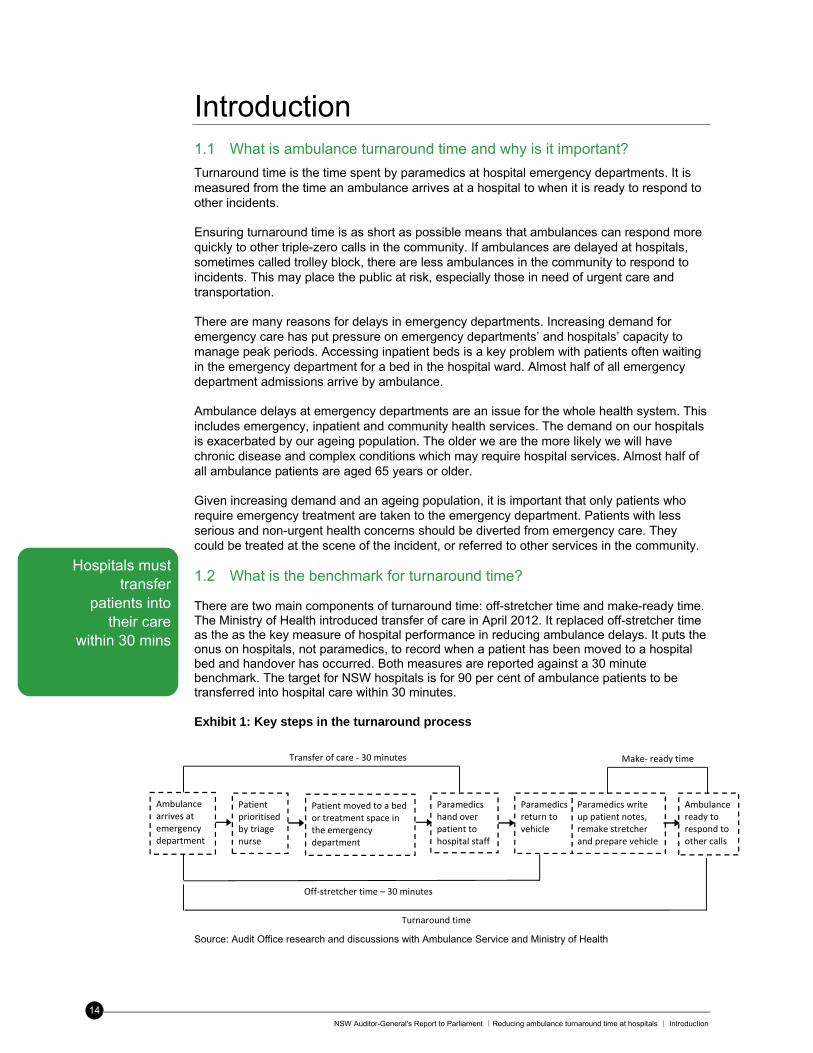
Introduction 1.1 What is ambulance turnaround time and why is it important?
Turnaround time is the time spent by paramedics at hospital emergency departments. It is measured from the time an ambulance arrives at a hospital to when it is ready to respond to other incidents. Ensuring turnaround time is as short as possible means that ambulances can respond more quickly to other triple-zero calls in the community. If ambulances are delayed at hospitals, sometimes called trolley block, there are less ambulances in the community to respond to incidents. This may place the public at risk, especially those in need of urgent care and transportation. There are many reasons for delays in emergency departments. Increasing demand for emergency care has put pressure on emergency departments’ and hospitals’ capacity to manage peak periods. Accessing inpatient beds is a key problem with patients often waiting in the emergency department for a bed in the hospital ward. Almost half of all emergency department admissions arrive by ambulance. Ambulance delays at emergency departments are an issue for the whole health system. This includes emergency, inpatient and community health services. The demand on our hospitals is exacerbated by our ageing population. The older we are the more likely we will have chronic disease and complex conditions which may require hospital services. Almost half of all ambulance patients are aged 65 years or older. Given increasing demand and an ageing population, it is important that only patients who require emergency treatment are taken to the emergency department. Patients with less serious and non-urgent health concerns should be diverted from emergency care. They could be treated at the scene of the incident, or referred to other services in the community. 1.2 What is the benchmark for turnaround time? There are two main components of turnaround time: off-stretcher time and make-ready time. The Ministry of Health introduced transfer of care in April 2012. It replaced off-stretcher time as the as the key measure of hospital performance in reducing ambulance delays. It puts the onus on hospitals, not paramedics, to record when a patient has been moved to a hospital bed and handover has occurred. Both measures are reported against a 30 minute benchmark. The target for NSW hospitals is for 90 per cent of ambulance patients to be transferred into hospital care within 30 minutes. Exhibit 1: Key steps in the turnaround process
Source: Audit Office research and discussions with Ambulance Service and Ministry of Health
Hospitals must transfer
patients into their care
within 30 mins
Make‐ ready timeTransfer of care ‐ 30 minutes
Turnaround time
Off‐stretcher time – 30 minutes
Ambulance arrives at emergency department
Patient prioritised by triage nurse
Paramedics hand over patient to hospital staff
Ambulance ready to respond to other calls
Patient moved to a bedor treatment space in the emergency department
Paramedics write up patient notes, remake stretcher and prepare vehicle
Paramedics return to vehicle
NSW Auditor-General's Report to Parliament ∣Reducing ambulance turnaround time at hospitals ∣Introduction
15
Note that although transfer of care may not have occurred, Ministry of Health protocols stipulate that hospital clinicians have responsibility for overall clinical management once an ambulance patient enters the emergency department. This is includes the waiting room or ambulance entrance.
The Ambulance Service has not set a benchmark for make-ready time, although it monitors ambulance crews with make-ready time of 30 minutes or more.
Reducing ambulance turnaround time is a challenge for jurisdictions worldwide. Most Australian States and Territories have developed measures to see whether their performance is improving. Transfer of care benchmarks varied considerably from 15 to 40 minutes. This makes it difficult to compare NSW’s performance with other jurisdictions.
1.3 How do efforts to reduce turnaround time fit into broader health reforms?
There are many reforms currently taking place in NSW hospitals and the Ambulance Service which aim to improve access to health services by the community.
A key reform was the introduction of the National Emergency Access Target by Commonwealth and State governments in 2011. Its aim is to ensure that 90 per cent of patients leave an emergency department within four hours, either discharged or admitted to hospital. In response to this reform, and building on existing work in this area, the Ministry of Health has initiated many projects aimed at improving patient flow in hospitals. This includes:
a patient flow framework identifying the key principles of good patient flow
a patient flow portal with tools to help hospitals predict and monitor bed status
new models of care to streamline a patient’s journey through the health system.
Activity based funding is also being introduced as part of recent national agreements which will provide more direct funding of public hospital services. It will put pressure on hospitals to deliver services more efficiently.
In 2012 the Minister for Health also released a Reform Plan for NSW Ambulance. This sets out the Government’s plan for the Ambulance Service of NSW focusing on five strategic areas. One of these focuses on developing new models of care and demand management initiatives to reduce delays at hospitals.
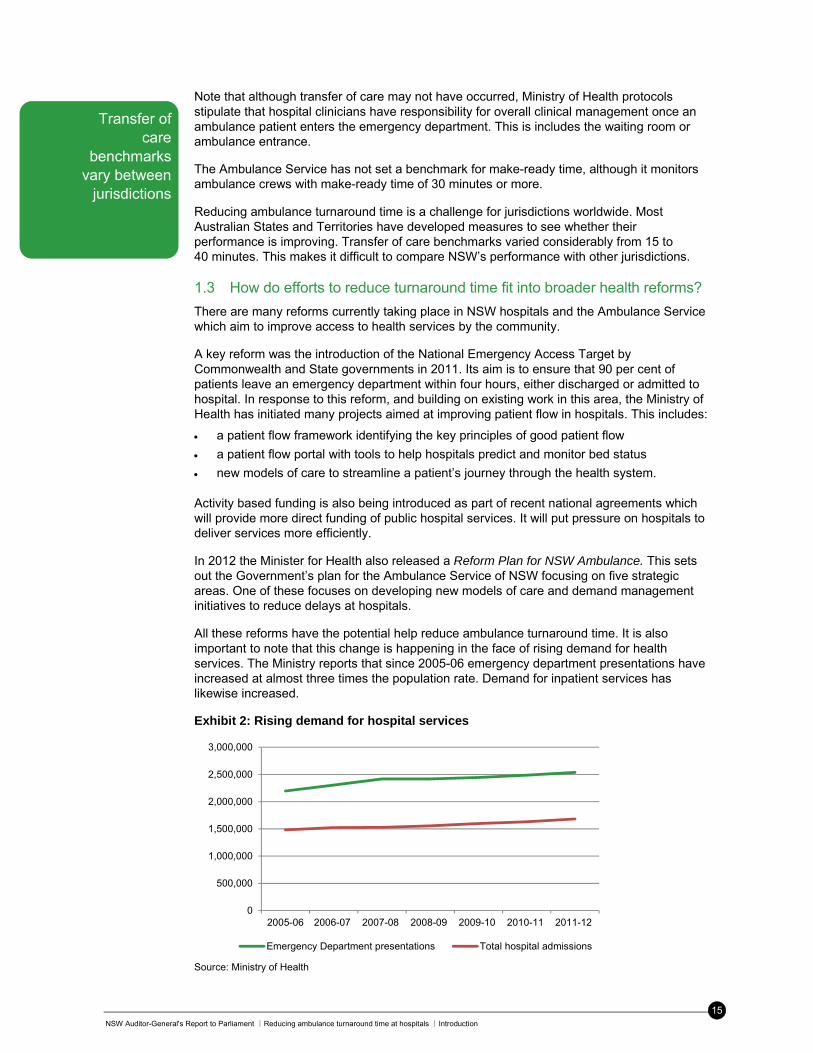
All these reforms have the potential help reduce ambulance turnaround time. It is also important to note that this change is happening in the face of rising demand for health services. The Ministry reports that since 2005-06 emergency department presentations have increased at almost three times the population rate. Demand for inpatient services has likewise increased.
Exhibit 2: Rising demand for hospital services
Source: Ministry of Health
0
500,000
1,000,000
1,500,000
2,000,000
2,500,000
3,000,000
2005-06 2006-07 2007-08 2008-09 2009-10 2010-11 2011-12
Emergency Department presentations Total hospital admissions
Transfer of care
benchmarks vary between
jurisdictions
NSW Auditor-General's Report to Parliament ∣Reducing ambulance turnaround time at hospitals ∣ Introduction
16
The Ambulance Service also advised that, over the same period, the number of people aged 65 or over increased by more than two and a half times the population rate. The ageing population and rising demand for hospital services will continue to put pressure on health services, making patient flow improvements even more important.
1.4 What is the audit about?
This audit assessed whether there are effective strategies in place to reduce the time spent by ambulance crews at emergency departments. We answered the following questions:
do NSW Health’s strategies to reduce ambulance delays at emergency departments free up ambulances to respond to other incidents?
do the Ambulance Service’s demand management strategies limit the number of patients it takes to emergency departments?
For the purpose of this report, the term ‘emergency’ as in ‘emergency incidents’ or ‘emergency transport’ refers to ambulance response categories P1 to P3, or emergency and time critical cases.
See Appendix 1 for more information on the audit scope and focus and Audit Office site visits.
NSW Auditor-General's Report to Parliament ∣Reducing ambulance turnaround time at hospitals ∣Key findings
17
Key findings 2. Do NSW Health’s strategies to reduce ambulance delays at
emergency departments free up ambulances to respond to other incidents?
Statewide off-stretcher performance has declined over the last seven years, although some hospitals perform better than others. In 2011-12, just over one in four hospitals met the off-stretcher target. Most of these were small regional hospitals.
Of the six hospitals we visited, two had improved off-stretcher performance. Both hospitals had put a range of patient flow strategies in place to reduce overcrowding. The key strategies they believe improved off-stretcher performance were: moving emergency department patients admitted to hospital to temporary ‘over-census’
beds in the wards
rapid triage and early assessment of patients by senior emergency doctors.
Other strategies that free up ambulances include Ambulance Release Teams, offloading patients to the waiting room, and a dedicated ambulance bay. However as these strategies do not reduce overcrowding in the hospital, performance may only improve in the short-term.
Initiatives put in place by emergency departments to improve patient flow included fast track areas, short stay units, and replacing beds with recliners. However their effectiveness could be limited by poor hospital layout, or lack of senior doctors and nursing staff. And some hospital staff we spoke to did not accept responsibility for reducing ambulance delays.
Other key findings: average off-stretcher time in 2011-12 was 31.6 minutes, up 7.2 minutes from 2005-06
in the 11 months from April 2012 to February 2013 average transfer of care time, the Ministry’s new measure for ambulance delays, was 15.8 minutes
ambulance and health staff regularly monitored the extent of ambulance delays
the quality of hospital escalation plans varied.
2.1 Are ambulance delays at emergency departments monitored and analysed?
Finding: The Ambulance Service, Ministry of Health and hospitals monitor and report the extent of ambulance delays. They monitor performance measures to inform strategic planning, and monitor real-time delays so they can escalate incidents. However we found that hospital staff had different views about when transfer of care occurs. This means it may be more difficult to compare performance across hospitals.
Monitoring key performance measures for ambulance delays Both the Ambulance Service and Ministry of Health have comprehensive systems in place to monitor ambulance delays. The Ambulance Service regularly monitors off-stretcher time, its key performance indicator for time spent by ambulances at hospitals. Managers monitor daily, weekly and monthly performance including:
average off-stretcher time
the proportion of ambulance patients offloaded within 30 minutes and other time intervals
the time spent by crews at hospitals of more than 20 or 30 minutes (lost minutes)
the time from patient offload to clearance for other calls (make-ready time)
the time from ambulance arrival at hospital to clearance for other calls (turnaround time).
The extent of ambulance
delays is regularly
monitored
NSW Auditor-General's Report to Parliament ∣Reducing ambulance turnaround time at hospitals ∣ Key findings
18
All six hospitals we visited monitor transfer of care, the Ministry’s new measure for ambulance delays, as part of routine management reporting. Managers can monitor daily, weekly or monthly performance against the target for hospitals within their Local Health District or peer group, and trends over time.
The Ministry holds each Local Health District accountable for its performance in reducing transfer of care time through its service agreement with each district. The Bureau of Health Information publicly reports quarterly off-stretcher performance for each hospital and will soon start reporting transfer of care results.
The NSW Health definition of transfer of care is the transfer of accountability and responsibility for patient care from an ambulance paramedic to a hospital clinician. This is to occur when a patient moves from the ambulance stretcher to a hospital treatment area.
However we found that hospital staff had different views about when transfer of care occurs. Some thought it occurred when paramedics handed over patients to hospital staff at the bedside. Others thought it occurred when a patient was allocated a bed by the triage nurse. In the latter scenario, paramedics said that although a bed had been allocated, they were sometimes unable to unload patients. Hospital staff may be unavailable for patient handover, the bed may not be made, or there is a patient in the bed who must first be transferred to a ward.
Ideally, for transfer of care to have occurred, paramedics should have offloaded their patient from the stretcher and completed patient handover. Defining transfer of care in terms of the tasks to be completed, including patient handover, will help improve data accuracy and ensure transfer of care is a reliable measure of hospital performance.
Although transfer of care is the new measure for hospital delays, the Ambulance Service continues to monitor off-stretcher time. This is because off-stretcher time is also the basis for make-ready time, which includes the time it takes paramedics to complete the patient’s notes and prepare the vehicle for the next job. We support this as it is the part of turnaround time which is within the Ambulance Service’s control and will assist in managing delays.
We recommend that by December 2013, the Ministry of Health, in consultation with the Ambulance Service of NSW and Local Health Districts, clarify the tasks which should occur before transfer of care is complete, to improve the data integrity of its performance measure for transfer of care.
Real-time monitoring and escalation of ambulance delays Hospital staff and paramedics also monitor real-time delays using the ambulance status board. The status board displays information on emergency and pre-scheduled ambulances arriving at each hospital and their status. This includes:
the number of ambulances that have arrived in the last hour
the number of ambulances en route and their estimated time of arrival
the status of each incident including its priority code and the time elapsed since arrival.
Paramedics and hospital staff said that the status board is an excellent tool to monitor off-stretcher performance real-time and helps hospitals plan for ambulances arrivals. The only issue was that ambulance supervisors could not access it while on the road. This would help them monitor all hospitals in their area and keep them informed of delays at all times.
Real time monitoring helps staff determine whether they need to escalate incidents. The Ambulance Service has an escalation process in place for delays at hospitals. Paramedics report their off-stretcher status to the Control Centre every 30 mins. Ambulance supervisors and Ambulance Liaison Officers (ALOs) then monitor delays and escalate problems to ambulance and hospital management.
There are differing views
on when transfer of care
is complete
Ambulance Liaison Officers
help reduce delays and free up ambulances
NSW Auditor-General's Report to Parliament ∣Reducing ambulance turnaround time at hospitals ∣Key findings
19
Ambulance Liaison Officers play a key role in the escalation process. They work closely with hospital staff to reduce delays and free up ambulances. A large part of their role is to facilitate communication between hospitals and the Ambulance Service, escalate problems, and work with hospital staff to reduce delays. Paramedics and hospital staff said they generally worked well together. In fact most said their relationship had improved recently.
We believe Ambulance Liaison Officers play a key role in managing hospital delays, especially in the current environment. The Ambulance Service should continue to support this role and fill any vacancies as soon as they arise.
All six hospitals we visited had processes in place to notify their executive of the hospital’s bed status. Bed managers sent daily text messages or emails about the hospital’s bed capacity and any ambulance delays.
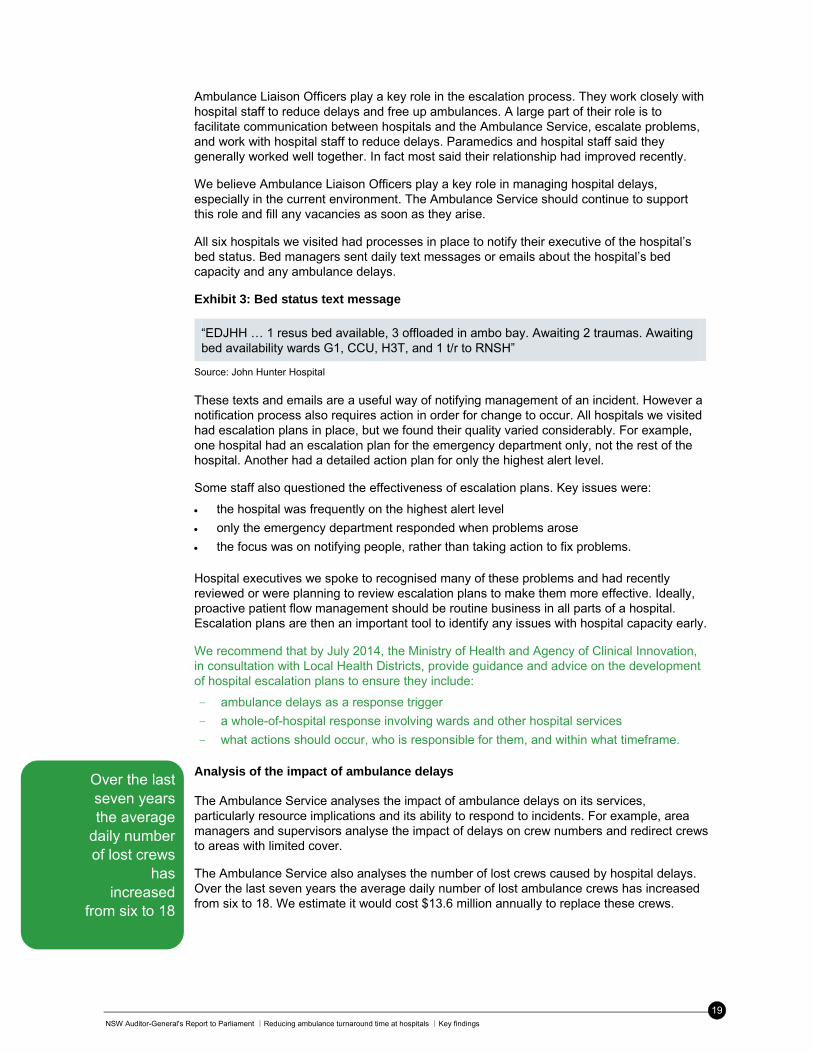
Exhibit 3: Bed status text message
“EDJHH … 1 resus bed available, 3 offloaded in ambo bay. Awaiting 2 traumas. Awaiting bed availability wards G1, CCU, H3T, and 1 t/r to RNSH”
Source: John Hunter Hospital These texts and emails are a useful way of notifying management of an incident. However a notification process also requires action in order for change to occur. All hospitals we visited had escalation plans in place, but we found their quality varied considerably. For example, one hospital had an escalation plan for the emergency department only, not the rest of the hospital. Another had a detailed action plan for only the highest alert level.
Some staff also questioned the effectiveness of escalation plans. Key issues were:
the hospital was frequently on the highest alert level
only the emergency department responded when problems arose
the focus was on notifying people, rather than taking action to fix problems. Hospital executives we spoke to recognised many of these problems and had recently reviewed or were planning to review escalation plans to make them more effective. Ideally, proactive patient flow management should be routine business in all parts of a hospital. Escalation plans are then an important tool to identify any issues with hospital capacity early.
We recommend that by July 2014, the Ministry of Health and Agency of Clinical Innovation, in consultation with Local Health Districts, provide guidance and advice on the development of hospital escalation plans to ensure they include:
- ambulance delays as a response trigger
- a whole-of-hospital response involving wards and other hospital services
- what actions should occur, who is responsible for them, and within what timeframe. Analysis of the impact of ambulance delays The Ambulance Service analyses the impact of ambulance delays on its services, particularly resource implications and its ability to respond to incidents. For example, area managers and supervisors analyse the impact of delays on crew numbers and redirect crews to areas with limited cover.
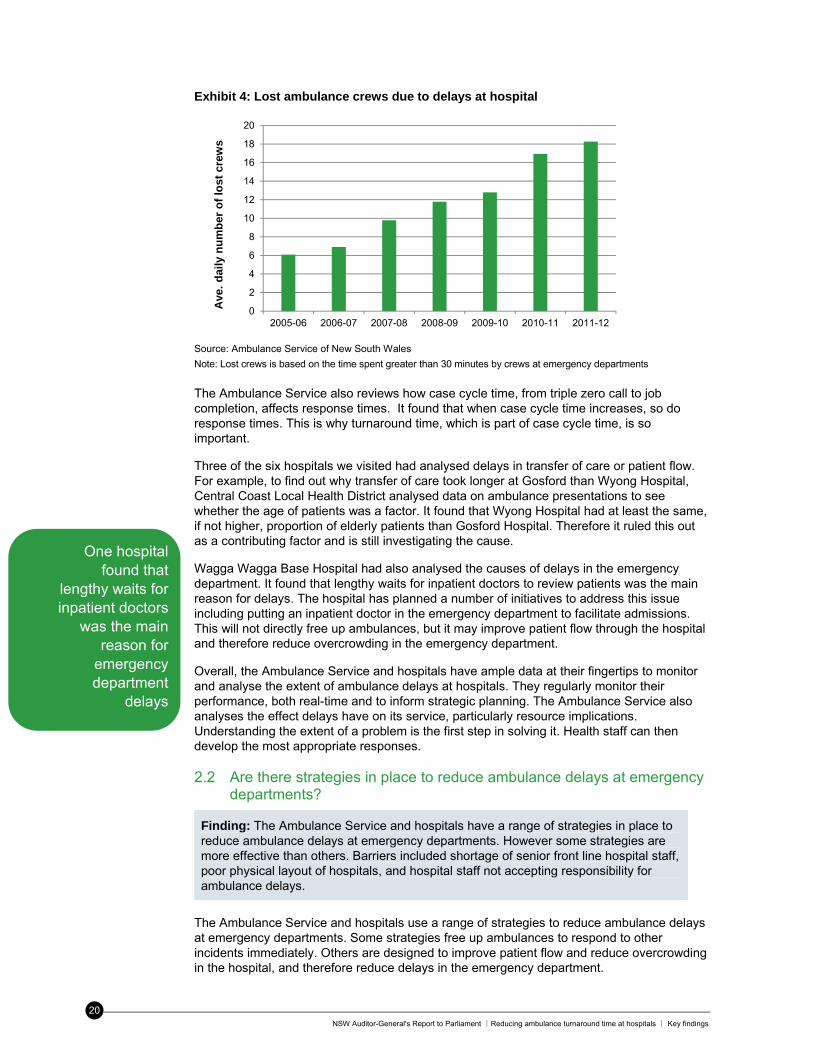
The Ambulance Service also analyses the number of lost crews caused by hospital delays. Over the last seven years the average daily number of lost ambulance crews has increased from six to 18. We estimate it would cost $13.6 million annually to replace these crews.
Over the last seven years the average
daily number of lost crews
has increased
from six to 18
NSW Auditor-General's Report to Parliament ∣Reducing ambulance turnaround time at hospitals ∣ Key findings
20
Exhibit 4: Lost ambulance crews due to delays at hospital
Source: Ambulance Service of New South Wales
Note: Lost crews is based on the time spent greater than 30 minutes by crews at emergency departments
The Ambulance Service also reviews how case cycle time, from triple zero call to job completion, affects response times. It found that when case cycle time increases, so do response times. This is why turnaround time, which is part of case cycle time, is so important.
Three of the six hospitals we visited had analysed delays in transfer of care or patient flow. For example, to find out why transfer of care took longer at Gosford than Wyong Hospital, Central Coast Local Health District analysed data on ambulance presentations to see whether the age of patients was a factor. It found that Wyong Hospital had at least the same, if not higher, proportion of elderly patients than Gosford Hospital. Therefore it ruled this out as a contributing factor and is still investigating the cause.
Wagga Wagga Base Hospital had also analysed the causes of delays in the emergency department. It found that lengthy waits for inpatient doctors to review patients was the main reason for delays. The hospital has planned a number of initiatives to address this issue including putting an inpatient doctor in the emergency department to facilitate admissions. This will not directly free up ambulances, but it may improve patient flow through the hospital and therefore reduce overcrowding in the emergency department.
Overall, the Ambulance Service and hospitals have ample data at their fingertips to monitor and analyse the extent of ambulance delays at hospitals. They regularly monitor their performance, both real-time and to inform strategic planning. The Ambulance Service also analyses the effect delays have on its service, particularly resource implications. Understanding the extent of a problem is the first step in solving it. Health staff can then develop the most appropriate responses.
2.2 Are there strategies in place to reduce ambulance delays at emergency departments?
Finding: The Ambulance Service and hospitals have a range of strategies in place to reduce ambulance delays at emergency departments. However some strategies are more effective than others. Barriers included shortage of senior front line hospital staff, poor physical layout of hospitals, and hospital staff not accepting responsibility for ambulance delays.
The Ambulance Service and hospitals use a range of strategies to reduce ambulance delays at emergency departments. Some strategies free up ambulances to respond to other incidents immediately. Others are designed to improve patient flow and reduce overcrowding in the hospital, and therefore reduce delays in the emergency department.
0
2
4
6
8
10
12
14
16
18
20
2005-06 2006-07 2007-08 2008-09 2009-10 2010-11 2011-12
Ave
. d
aily
nu
mb
er o
f lo
st c
rew
s
One hospital found that
lengthy waits for inpatient doctors
was the main reason for
emergency department
delays
NSW Auditor-General's Report to Parliament ∣Reducing ambulance turnaround time at hospitals ∣Key findings
21
Strategies which directly free-up ambulances We found three strategies which release ambulance crews immediately to respond to other incidents. They include:
moving suitable patients from the ambulance trolley to the waiting room after triage
moving patients to beds in a dedicated ambulance bay in the emergency department
calling in additional paramedics to care for patients on ambulance trolleys at the hospital (Ambulance Release Teams).
The Ambulance Service and hospital staff also organise ‘hot swaps’ where possible. This occurs when an ambulance crew offloads one patient by swapping them with another patient waiting to be discharged from hospital. This strategy helps to free up hospital capacity, but the ambulance crew is not immediately free to respond to other calls. However they are able to leave the hospital and potentially avoid a lengthy delay.
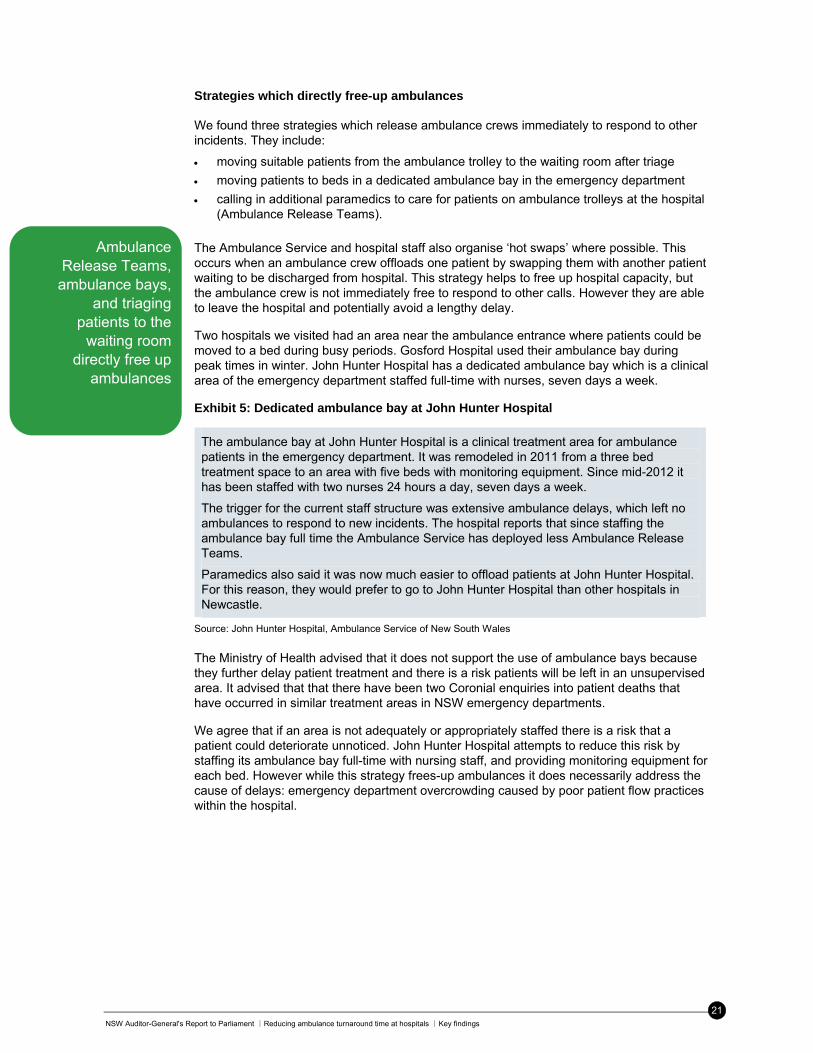
Two hospitals we visited had an area near the ambulance entrance where patients could be moved to a bed during busy periods. Gosford Hospital used their ambulance bay during peak times in winter. John Hunter Hospital has a dedicated ambulance bay which is a clinical area of the emergency department staffed full-time with nurses, seven days a week.
Exhibit 5: Dedicated ambulance bay at John Hunter Hospital
The ambulance bay at John Hunter Hospital is a clinical treatment area for ambulance patients in the emergency department. It was remodeled in 2011 from a three bed treatment space to an area with five beds with monitoring equipment. Since mid-2012 it has been staffed with two nurses 24 hours a day, seven days a week.
The trigger for the current staff structure was extensive ambulance delays, which left no ambulances to respond to new incidents. The hospital reports that since staffing the ambulance bay full time the Ambulance Service has deployed less Ambulance Release Teams.
Paramedics also said it was now much easier to offload patients at John Hunter Hospital. For this reason, they would prefer to go to John Hunter Hospital than other hospitals in Newcastle.
Source: John Hunter Hospital, Ambulance Service of New South Wales
The Ministry of Health advised that it does not support the use of ambulance bays because they further delay patient treatment and there is a risk patients will be left in an unsupervised area. It advised that that there have been two Coronial enquiries into patient deaths that have occurred in similar treatment areas in NSW emergency departments.
We agree that if an area is not adequately or appropriately staffed there is a risk that a patient could deteriorate unnoticed. John Hunter Hospital attempts to reduce this risk by staffing its ambulance bay full-time with nursing staff, and providing monitoring equipment for each bed. However while this strategy frees-up ambulances it does necessarily address the cause of delays: emergency department overcrowding caused by poor patient flow practices within the hospital.
Ambulance Release Teams, ambulance bays,
and triaging patients to the
waiting room directly free up
ambulances
NSW Auditor-General's Report to Parliament ∣Reducing ambulance turnaround time at hospitals ∣ Key findings
22
Ambulance Release Teams (ART) were introduced in 2004 and are used mainly in metropolitan areas. They are made up of two paramedics, generally called in on overtime. Their vehicle is a utility truck which has three stretchers. It does not have cardiac monitoring equipment which means only patients not requiring cardiac monitoring can be cared for by these paramedics. They are triggered in any of the following circumstances:
two ambulances are delayed more than 30 minutes at an emergency department
one ambulance is delayed more than an hour at an emergency department
ambulances may be held up indefinitely ie no immediate plans to offload
a hospital requests it to help ease pressure on the emergency department.
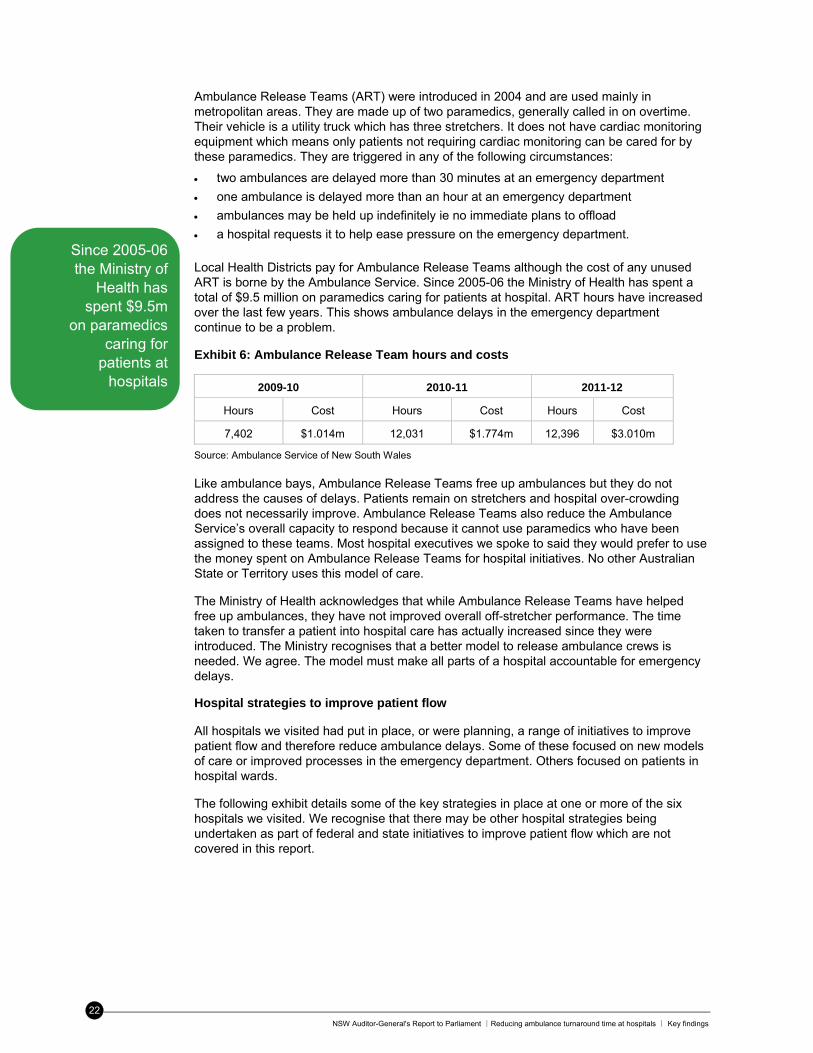
Local Health Districts pay for Ambulance Release Teams although the cost of any unused ART is borne by the Ambulance Service. Since 2005-06 the Ministry of Health has spent a total of $9.5 million on paramedics caring for patients at hospital. ART hours have increased over the last few years. This shows ambulance delays in the emergency department continue to be a problem.
Exhibit 6: Ambulance Release Team hours and costs
2009-10 2010-11 2011-12
Hours Cost Hours Cost Hours Cost
7,402 $1.014m 12,031 $1.774m 12,396 $3.010m
Source: Ambulance Service of New South Wales Like ambulance bays, Ambulance Release Teams free up ambulances but they do not address the causes of delays. Patients remain on stretchers and hospital over-crowding does not necessarily improve. Ambulance Release Teams also reduce the Ambulance Service’s overall capacity to respond because it cannot use paramedics who have been assigned to these teams. Most hospital executives we spoke to said they would prefer to use the money spent on Ambulance Release Teams for hospital initiatives. No other Australian State or Territory uses this model of care.
The Ministry of Health acknowledges that while Ambulance Release Teams have helped free up ambulances, they have not improved overall off-stretcher performance. The time taken to transfer a patient into hospital care has actually increased since they were introduced. The Ministry recognises that a better model to release ambulance crews is needed. We agree. The model must make all parts of a hospital accountable for emergency delays.
Hospital strategies to improve patient flow All hospitals we visited had put in place, or were planning, a range of initiatives to improve patient flow and therefore reduce ambulance delays. Some of these focused on new models of care or improved processes in the emergency department. Others focused on patients in hospital wards.
The following exhibit details some of the key strategies in place at one or more of the six hospitals we visited. We recognise that there may be other hospital strategies being undertaken as part of federal and state initiatives to improve patient flow which are not covered in this report.
Since 2005-06 the Ministry of
Health has spent $9.5m
on paramedics caring for
patients at hospitals
NSW Auditor-General's Report to Parliament ∣Reducing ambulance turnaround time at hospitals ∣Key findings
23
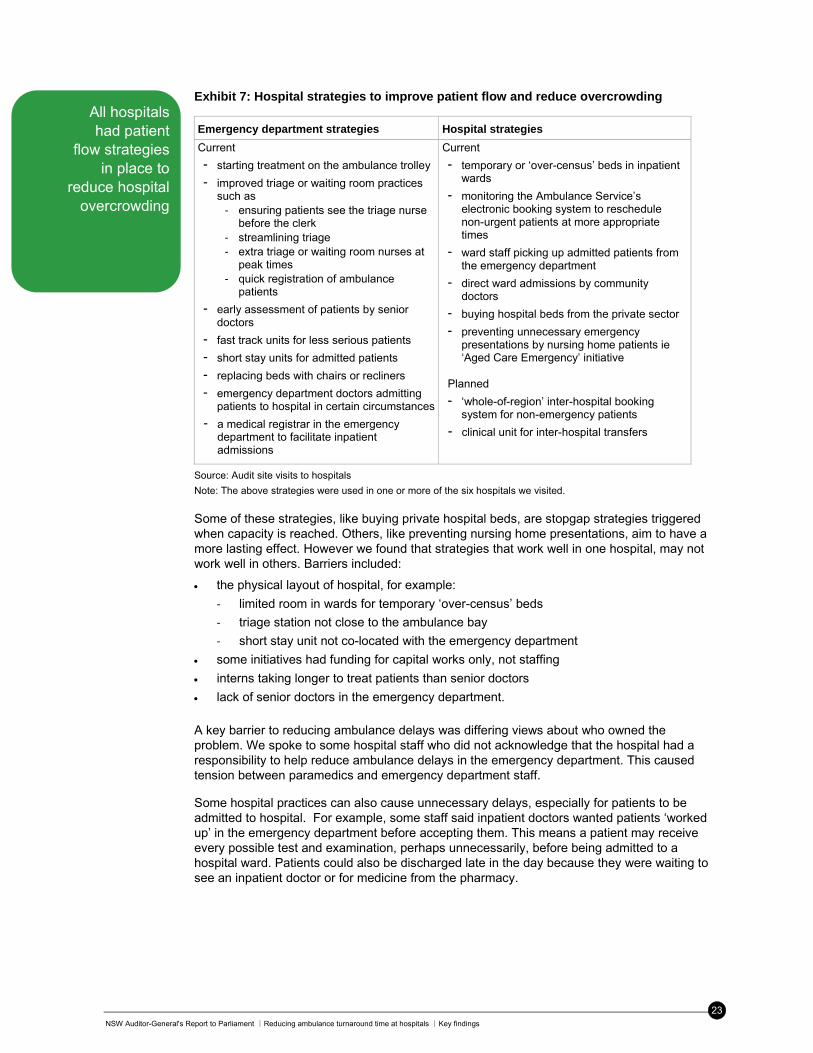
Exhibit 7: Hospital strategies to improve patient flow and reduce overcrowding
Emergency department strategies Hospital strategies
Current
- starting treatment on the ambulance trolley
- improved triage or waiting room practices such as
- ensuring patients see the triage nurse before the clerk
- streamlining triage - extra triage or waiting room nurses at
peak times - quick registration of ambulance
patients
- early assessment of patients by senior doctors
- fast track units for less serious patients
- short stay units for admitted patients
- replacing beds with chairs or recliners
- emergency department doctors admitting patients to hospital in certain circumstances
- a medical registrar in the emergency department to facilitate inpatient admissions
Current
- temporary or ‘over-census’ beds in inpatient wards
- monitoring the Ambulance Service’s electronic booking system to reschedule non-urgent patients at more appropriate times
- ward staff picking up admitted patients from the emergency department
- direct ward admissions by community doctors
- buying hospital beds from the private sector
- preventing unnecessary emergency presentations by nursing home patients ie ‘Aged Care Emergency’ initiative
Planned
- ‘whole-of-region’ inter-hospital booking system for non-emergency patients
- clinical unit for inter-hospital transfers
Source: Audit site visits to hospitals
Note: The above strategies were used in one or more of the six hospitals we visited. Some of these strategies, like buying private hospital beds, are stopgap strategies triggered when capacity is reached. Others, like preventing nursing home presentations, aim to have a more lasting effect. However we found that strategies that work well in one hospital, may not work well in others. Barriers included:
the physical layout of hospital, for example:
‐ limited room in wards for temporary ‘over-census’ beds
‐ triage station not close to the ambulance bay
‐ short stay unit not co-located with the emergency department
some initiatives had funding for capital works only, not staffing
interns taking longer to treat patients than senior doctors
lack of senior doctors in the emergency department.
A key barrier to reducing ambulance delays was differing views about who owned the problem. We spoke to some hospital staff who did not acknowledge that the hospital had a responsibility to help reduce ambulance delays in the emergency department. This caused tension between paramedics and emergency department staff.
Some hospital practices can also cause unnecessary delays, especially for patients to be admitted to hospital. For example, some staff said inpatient doctors wanted patients ‘worked up’ in the emergency department before accepting them. This means a patient may receive every possible test and examination, perhaps unnecessarily, before being admitted to a hospital ward. Patients could also be discharged late in the day because they were waiting to see an inpatient doctor or for medicine from the pharmacy.
All hospitals had patient
flow strategies in place to
reduce hospital overcrowding
NSW Auditor-General's Report to Parliament ∣Reducing ambulance turnaround time at hospitals ∣ Key findings
24
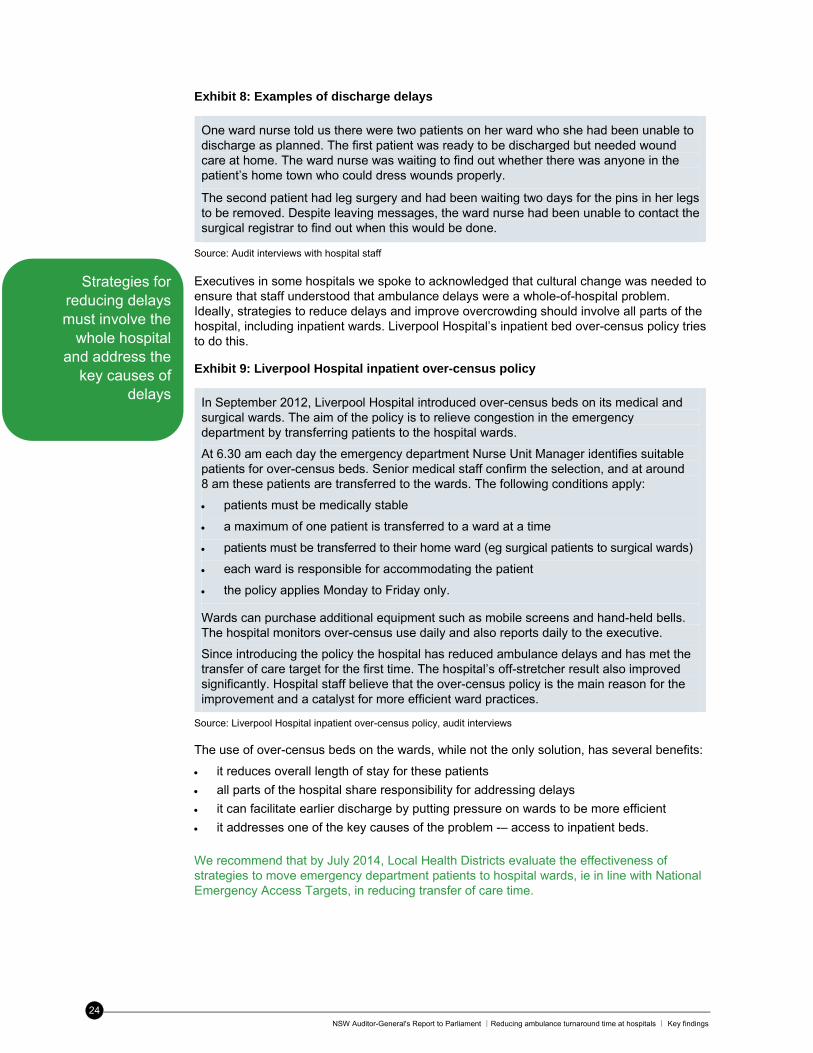
Exhibit 8: Examples of discharge delays
One ward nurse told us there were two patients on her ward who she had been unable to discharge as planned. The first patient was ready to be discharged but needed wound care at home. The ward nurse was waiting to find out whether there was anyone in the patient’s home town who could dress wounds properly.
The second patient had leg surgery and had been waiting two days for the pins in her legs to be removed. Despite leaving messages, the ward nurse had been unable to contact the surgical registrar to find out when this would be done.
Source: Audit interviews with hospital staff Executives in some hospitals we spoke to acknowledged that cultural change was needed to ensure that staff understood that ambulance delays were a whole-of-hospital problem. Ideally, strategies to reduce delays and improve overcrowding should involve all parts of the hospital, including inpatient wards. Liverpool Hospital’s inpatient bed over-census policy tries to do this.
Exhibit 9: Liverpool Hospital inpatient over-census policy
In September 2012, Liverpool Hospital introduced over-census beds on its medical and surgical wards. The aim of the policy is to relieve congestion in the emergency department by transferring patients to the hospital wards.
At 6.30 am each day the emergency department Nurse Unit Manager identifies suitable patients for over-census beds. Senior medical staff confirm the selection, and at around 8 am these patients are transferred to the wards. The following conditions apply:
patients must be medically stable
a maximum of one patient is transferred to a ward at a time
patients must be transferred to their home ward (eg surgical patients to surgical wards)
each ward is responsible for accommodating the patient
the policy applies Monday to Friday only.
Wards can purchase additional equipment such as mobile screens and hand-held bells. The hospital monitors over-census use daily and also reports daily to the executive.
Since introducing the policy the hospital has reduced ambulance delays and has met the transfer of care target for the first time. The hospital’s off-stretcher result also improved significantly. Hospital staff believe that the over-census policy is the main reason for the improvement and a catalyst for more efficient ward practices.
Source: Liverpool Hospital inpatient over-census policy, audit interviews The use of over-census beds on the wards, while not the only solution, has several benefits:
it reduces overall length of stay for these patients
all parts of the hospital share responsibility for addressing delays
it can facilitate earlier discharge by putting pressure on wards to be more efficient
it addresses one of the key causes of the problem -– access to inpatient beds.
We recommend that by July 2014, Local Health Districts evaluate the effectiveness of strategies to move emergency department patients to hospital wards, ie in line with National Emergency Access Targets, in reducing transfer of care time.
Strategies for reducing delays must involve the
whole hospital and address the
key causes of delays
NSW Auditor-General's Report to Parliament ∣Reducing ambulance turnaround time at hospitals ∣Key findings
25
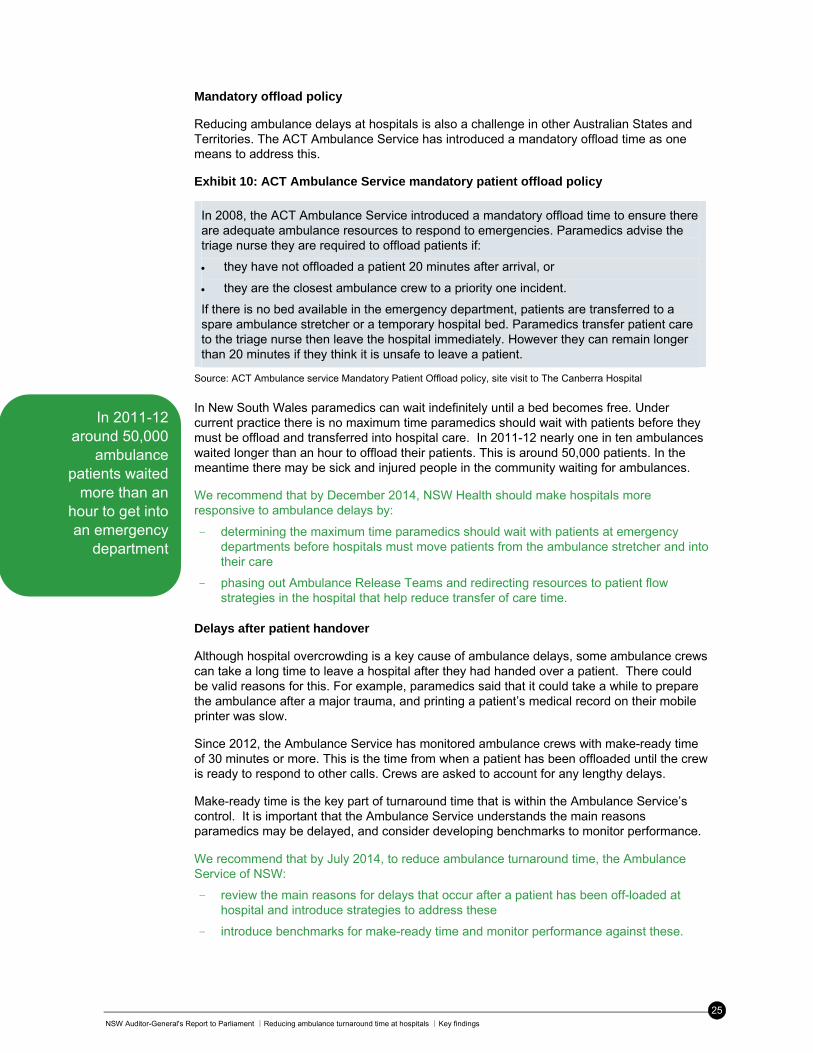
Mandatory offload policy
Reducing ambulance delays at hospitals is also a challenge in other Australian States and Territories. The ACT Ambulance Service has introduced a mandatory offload time as one means to address this.
Exhibit 10: ACT Ambulance Service mandatory patient offload policy
In 2008, the ACT Ambulance Service introduced a mandatory offload time to ensure there are adequate ambulance resources to respond to emergencies. Paramedics advise the triage nurse they are required to offload patients if:
they have not offloaded a patient 20 minutes after arrival, or
they are the closest ambulance crew to a priority one incident.
If there is no bed available in the emergency department, patients are transferred to a spare ambulance stretcher or a temporary hospital bed. Paramedics transfer patient care to the triage nurse then leave the hospital immediately. However they can remain longer than 20 minutes if they think it is unsafe to leave a patient.
Source: ACT Ambulance service Mandatory Patient Offload policy, site visit to The Canberra Hospital
In New South Wales paramedics can wait indefinitely until a bed becomes free. Under current practice there is no maximum time paramedics should wait with patients before they must be offload and transferred into hospital care. In 2011-12 nearly one in ten ambulances waited longer than an hour to offload their patients. This is around 50,000 patients. In the meantime there may be sick and injured people in the community waiting for ambulances.
We recommend that by December 2014, NSW Health should make hospitals more responsive to ambulance delays by:
- determining the maximum time paramedics should wait with patients at emergency departments before hospitals must move patients from the ambulance stretcher and into their care
- phasing out Ambulance Release Teams and redirecting resources to patient flow strategies in the hospital that help reduce transfer of care time.
Delays after patient handover
Although hospital overcrowding is a key cause of ambulance delays, some ambulance crews can take a long time to leave a hospital after they had handed over a patient. There could be valid reasons for this. For example, paramedics said that it could take a while to prepare the ambulance after a major trauma, and printing a patient’s medical record on their mobile printer was slow.
Since 2012, the Ambulance Service has monitored ambulance crews with make-ready time of 30 minutes or more. This is the time from when a patient has been offloaded until the crew is ready to respond to other calls. Crews are asked to account for any lengthy delays.
Make-ready time is the key part of turnaround time that is within the Ambulance Service’s control. It is important that the Ambulance Service understands the main reasons paramedics may be delayed, and consider developing benchmarks to monitor performance.
We recommend that by July 2014, to reduce ambulance turnaround time, the Ambulance Service of NSW:
- review the main reasons for delays that occur after a patient has been off-loaded at hospital and introduce strategies to address these
- introduce benchmarks for make-ready time and monitor performance against these.
In 2011-12 around 50,000
ambulance patients waited
more than an hour to get into an emergency
department
NSW Auditor-General's Report to Parliament ∣Reducing ambulance turnaround time at hospitals ∣ Key findings
26
2.3 Do strategies reduce time spent by ambulance crews at emergency departments?
Finding: The Ambulance Service, Ministry of Health and hospitals regularly check their overall performance in reducing the time spent by ambulances at hospitals. Statewide off-stretcher performance has declined over the last seven years, although some hospitals have performed better than others. It is too early to know whether performance against transfer of care, the Ministry’s new measure of ambulance delays, will improve.
Evaluating strategies to reduce ambulance delays
The Ambulance Service and Ministry of Health regularly review how well they reduce ambulance delays at hospitals. Both monitor state-wide and regional performance against targets, and trends over time.
The Ministry of Health monitors each Local Health District as part of its Performance Management Framework. Each district is reviewed at least quarterly against a range of performance measures, including transfer of care, which are outlined in its Service Agreements with the Director-General of NSW Health. Poor performing Local Health Districts are monitored more frequently and must develop a recovery plan to address any issues.
Two hospitals we visited had recently reviewed strategies to improve patient flow. Wagga Wagga Base Hospital had trialled three initiatives to improve access to hospital wards via the emergency department. These were:
sending empty ward beds to the emergency department to facilitate patient transfers
ward staff picking up emergency department patients
giving mobile phones to staff who made bed allocation decisions.
The hospital found these initiatives increased the proportion of patients reaching the wards within one hour from 24 to 34 per cent. Nepean Hospital had also reviewed its emergency department Waiting Room Acute Care unit, where senior doctors assess patients early in the treatment process. As a result of the review, the emergency department increased its capacity by replacing beds with chairs and creating an internal waiting room.
The Ambulance Service also introduced another way to resource Ambulance Release Teams. When it was first introduced paramedics volunteered for it and were paid overtime as the work was in addition to their standard roster. While this model still exists, in January 2012 the Ambulance Service also introduced ‘duty ART’, where paramedics agree to be part of an Ambulance Release Team during their normal shift. The Ambulance Service says it uses ‘duty ART’ when rostered overtime Ambulance Release Teams are unavailable and there are significant delays at hospital emergency departments.
State-wide results – off-stretcher time performance
We found that statewide off-stretcher performance has declined over the last seven years. The proportion of ambulance patients offloaded within 30 minutes has fallen, and the target has never been met. Average turnaround and off-stretcher times are also increasing.
We found that one in three ambulance crews were delayed at hospitals more than 30 minutes during 2011-12. Make-ready time, the difference between off-stretcher and turnaround time, has increased from around six to 11 minutes.
One in three ambulances are delayed
more than 30 minutes at
hospitals
NSW Auditor-General's Report to Parliament ∣Reducing ambulance turnaround time at hospitals ∣Key findings
27
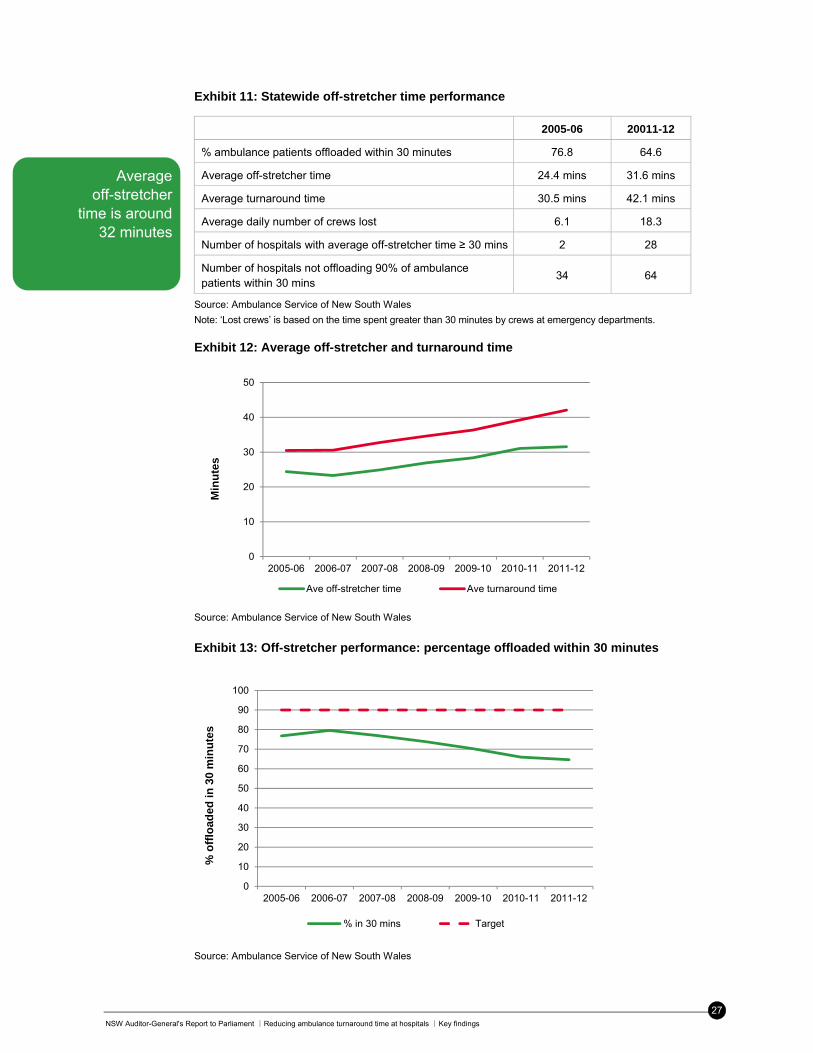
Exhibit 11: Statewide off-stretcher time performance
2005-06 20011-12
% ambulance patients offloaded within 30 minutes 76.8 64.6
Average off-stretcher time 24.4 mins 31.6 mins
Average turnaround time 30.5 mins 42.1 mins
Average daily number of crews lost 6.1 18.3
Number of hospitals with average off-stretcher time ≥ 30 mins 2 28
Number of hospitals not offloading 90% of ambulance patients within 30 mins
34 64
Source: Ambulance Service of New South Wales
Note: ‘Lost crews’ is based on the time spent greater than 30 minutes by crews at emergency departments.
Exhibit 12: Average off-stretcher and turnaround time
Source: Ambulance Service of New South Wales
Exhibit 13: Off-stretcher performance: percentage offloaded within 30 minutes
Source: Ambulance Service of New South Wales
0
10
20
30
40
50
2005-06 2006-07 2007-08 2008-09 2009-10 2010-11 2011-12
Min
ute
s
Ave off-stretcher time Ave turnaround time
0
10
20
30
40
50
60
70
80
90
100
2005-06 2006-07 2007-08 2008-09 2009-10 2010-11 2011-12
% o
fflo
aded
in 3
0 m
inu
tes
% in 30 mins Target
Average off-stretcher
time is around 32 minutes
NSW Auditor-General's Report to Parliament ∣Reducing ambulance turnaround time at hospitals ∣ Key findings
28
We also found that as off-stretcher performance declined, response times increased. Since 2005-06 the median response time for the highest priority emergency calls rose from 9.5 to 10.9 minutes.
Exhibit 14: Ambulance response times
Source: Ambulance Service of New South Wales
Notes: Graph shows the time by which 50 per cent and 90 per cent of ambulances have responded.
Response time is the time from when a triple-zero call is received to when the first ambulance arrives at the scene.
We also examined off-stretcher performance by time interval. We found that the while the majority, around two thirds, of patients were off-loaded within 30 minutes, nine per cent were waiting on the stretcher more than an hour.
Exhibit 15: Off-stretcher time by time interval, 2011-12
Source: Ambulance Service of New South Wales
Statewide results – transfer of care performance
The Ministry of Health has been measuring transfer of care since April 2012. It has yet to meet the target but has been getting closer in recent months. In the 11 months from April 2013 to February 2012:
average transfer of care time was 15.8 minutes
83 per cent of patients were transferred into the hospital’s care within 30 minutes.
0
5
10
15
20
25
2005-06 2006-07 2007-08 2008-09 2009-10 2010-11 2011-12
Min
ute
s
50th percentile response time 90th percentile response time
0
5
10
15
20
25
30
35
< 10mins
10-19mins
20-29mins
30-39mins
40-49mins
50-59mins
60-119mins
> 119mins
% a
mb
ula
nce
pat
ien
ts o
ff-l
oad
ed
In 2011-12 around two
thirds of ambulance
patients were off-loaded
within 30 minutes
NSW Auditor-General's Report to Parliament ∣Reducing ambulance turnaround time at hospitals ∣Key findings
29
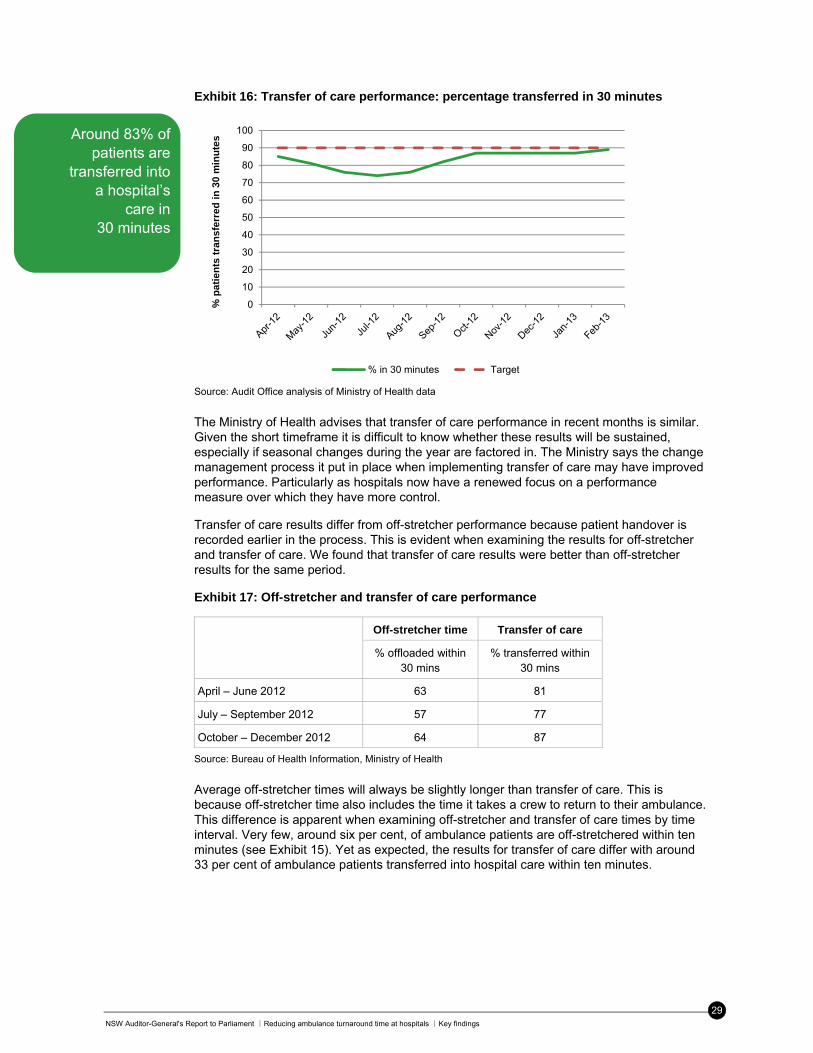
Exhibit 16: Transfer of care performance: percentage transferred in 30 minutes
Source: Audit Office analysis of Ministry of Health data
The Ministry of Health advises that transfer of care performance in recent months is similar. Given the short timeframe it is difficult to know whether these results will be sustained, especially if seasonal changes during the year are factored in. The Ministry says the change management process it put in place when implementing transfer of care may have improved performance. Particularly as hospitals now have a renewed focus on a performance measure over which they have more control.
Transfer of care results differ from off-stretcher performance because patient handover is recorded earlier in the process. This is evident when examining the results for off-stretcher and transfer of care. We found that transfer of care results were better than off-stretcher results for the same period.
Exhibit 17: Off-stretcher and transfer of care performance
Off-stretcher time Transfer of care
% offloaded within 30 mins
% transferred within 30 mins
April – June 2012 63 81
July – September 2012 57 77
October – December 2012 64 87
Source: Bureau of Health Information, Ministry of Health
Average off-stretcher times will always be slightly longer than transfer of care. This is because off-stretcher time also includes the time it takes a crew to return to their ambulance. This difference is apparent when examining off-stretcher and transfer of care times by time interval. Very few, around six per cent, of ambulance patients are off-stretchered within ten minutes (see Exhibit 15). Yet as expected, the results for transfer of care differ with around 33 per cent of ambulance patients transferred into hospital care within ten minutes.
0
10
20
30
40
50
60
70
80
90
100
% p
ati
en
ts t
ran
sfer
red
in
30
min
ute
s
% in 30 minutes Target
Around 83% of patients are
transferred into a hospital’s
care in 30 minutes
NSW Auditor-General's Report to Parliament ∣Reducing ambulance turnaround time at hospitals ∣ Key findings
30
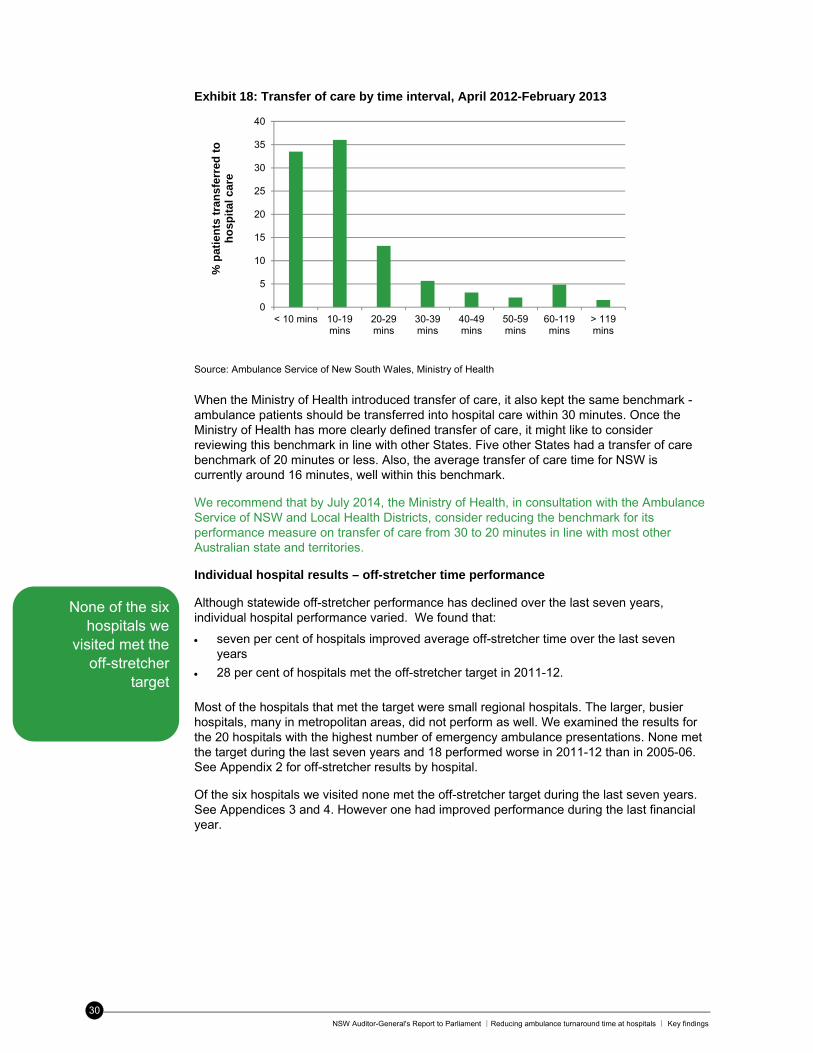
Exhibit 18: Transfer of care by time interval, April 2012-February 2013
Source: Ambulance Service of New South Wales, Ministry of Health
When the Ministry of Health introduced transfer of care, it also kept the same benchmark - ambulance patients should be transferred into hospital care within 30 minutes. Once the Ministry of Health has more clearly defined transfer of care, it might like to consider reviewing this benchmark in line with other States. Five other States had a transfer of care benchmark of 20 minutes or less. Also, the average transfer of care time for NSW is currently around 16 minutes, well within this benchmark.
We recommend that by July 2014, the Ministry of Health, in consultation with the Ambulance Service of NSW and Local Health Districts, consider reducing the benchmark for its performance measure on transfer of care from 30 to 20 minutes in line with most other Australian state and territories.
Individual hospital results – off-stretcher time performance
Although statewide off-stretcher performance has declined over the last seven years, individual hospital performance varied. We found that:
seven per cent of hospitals improved average off-stretcher time over the last seven years
28 per cent of hospitals met the off-stretcher target in 2011-12.
Most of the hospitals that met the target were small regional hospitals. The larger, busier hospitals, many in metropolitan areas, did not perform as well. We examined the results for the 20 hospitals with the highest number of emergency ambulance presentations. None met the target during the last seven years and 18 performed worse in 2011-12 than in 2005-06. See Appendix 2 for off-stretcher results by hospital.
Of the six hospitals we visited none met the off-stretcher target during the last seven years. See Appendices 3 and 4. However one had improved performance during the last financial year.
0
5
10
15
20
25
30
35
40
< 10 mins 10-19mins
20-29mins
30-39mins
40-49mins
50-59mins
60-119mins
> 119mins
% p
atie
nts
tra
nsf
erre
d t
o
ho
spit
al c
are
None of the six hospitals we
visited met the off-stretcher
target
NSW Auditor-General's Report to Parliament ∣Reducing ambulance turnaround time at hospitals ∣Key findings
31
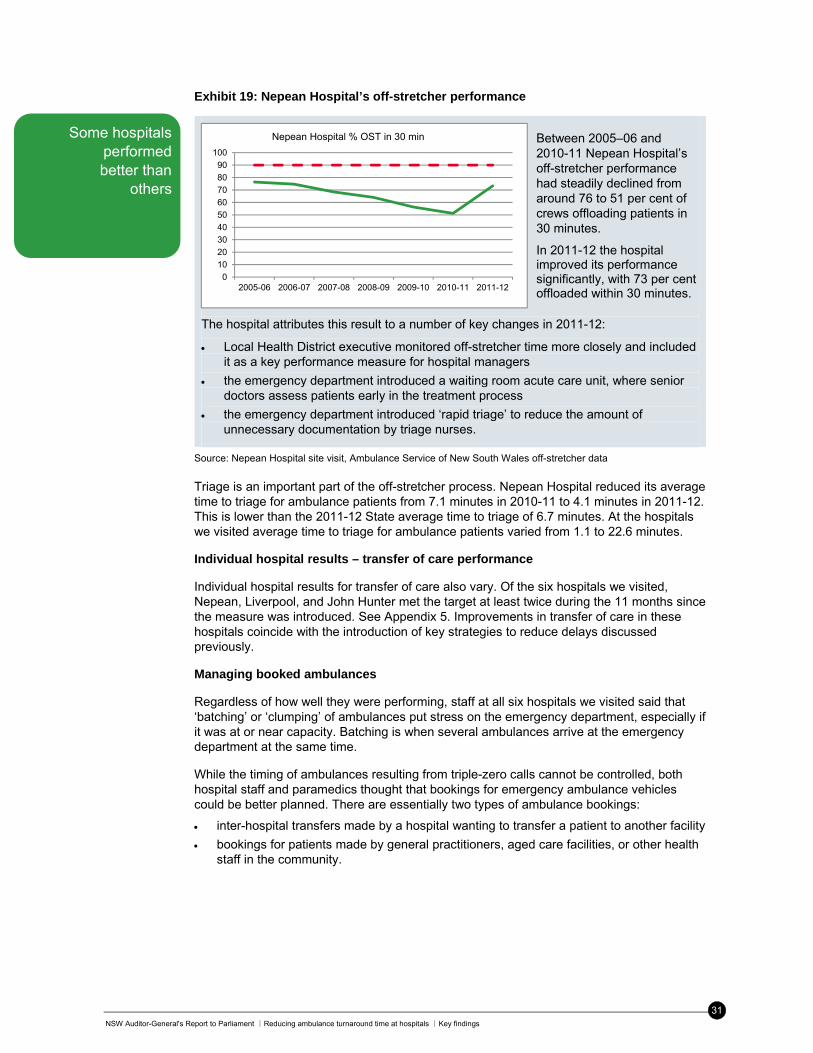
Exhibit 19: Nepean Hospital’s off-stretcher performance
The hospital attributes this result to a number of key changes in 2011-12:
Local Health District executive monitored off-stretcher time more closely and included it as a key performance measure for hospital managers
the emergency department introduced a waiting room acute care unit, where senior doctors assess patients early in the treatment process
the emergency department introduced ‘rapid triage’ to reduce the amount of unnecessary documentation by triage nurses.
Source: Nepean Hospital site visit, Ambulance Service of New South Wales off-stretcher data
Triage is an important part of the off-stretcher process. Nepean Hospital reduced its average time to triage for ambulance patients from 7.1 minutes in 2010-11 to 4.1 minutes in 2011-12. This is lower than the 2011-12 State average time to triage of 6.7 minutes. At the hospitals we visited average time to triage for ambulance patients varied from 1.1 to 22.6 minutes.
Individual hospital results – transfer of care performance
Individual hospital results for transfer of care also vary. Of the six hospitals we visited, Nepean, Liverpool, and John Hunter met the target at least twice during the 11 months since the measure was introduced. See Appendix 5. Improvements in transfer of care in these hospitals coincide with the introduction of key strategies to reduce delays discussed previously.
Managing booked ambulances
Regardless of how well they were performing, staff at all six hospitals we visited said that ‘batching’ or ‘clumping’ of ambulances put stress on the emergency department, especially if it was at or near capacity. Batching is when several ambulances arrive at the emergency department at the same time.
While the timing of ambulances resulting from triple-zero calls cannot be controlled, both hospital staff and paramedics thought that bookings for emergency ambulance vehicles could be better planned. There are essentially two types of ambulance bookings:
inter-hospital transfers made by a hospital wanting to transfer a patient to another facility
bookings for patients made by general practitioners, aged care facilities, or other health staff in the community.
0
10
20
30
40
50
60
70
80
90
100
2005-06 2006-07 2007-08 2008-09 2009-10 2010-11 2011-12
Nepean Hospital % OST in 30 min Between 2005–06 and 2010-11 Nepean Hospital’s off-stretcher performance had steadily declined from around 76 to 51 per cent of crews offloading patients in 30 minutes.
In 2011-12 the hospital improved its performance significantly, with 73 per cent offloaded within 30 minutes.
Some hospitals performed better than
others
NSW Auditor-General's Report to Parliament ∣Reducing ambulance turnaround time at hospitals ∣ Key findings
32
Common complaints raised by staff were that:
stable patients were unnecessarily transferred between hospitals after hours
inter-hospital transfers went through the emergency department rather than direct to wards
ambulances accepted bookings even though they may be unable to transport at the requested time
hospitals booked ambulances to transfer patients to other facilities despite limited bed capacity at the receiving hospital
emergency department staff did not know booked patients were coming until they were en route and showed on the ambulance status board.
Hospital staff said that booked ambulance arrivals could be scheduled at more appropriate times. Staff at two hospitals we visited monitored the Ambulance Service’s electronic booking system to reschedule non-urgent patients at more appropriate times. The Victorian Ambulance Service is piloting a dedicated dispatch position responsible for monitoring ambulance arrivals at hospitals. An evaluation of the position found that average case times had decreased and hospitals gave positive feedback on its impact on patient flow.
We believe that more needs to be done to improve the booking system for emergency ambulances. Better communication is needed between hospitals, and between hospitals and health staff in the community, about these patients and the best time to take them to hospital. The Ambulance Service, Ministry of Health, and Local Health Districts must work together to improve the patient flow of booked ambulances at the front end of the emergency care system.
Note that this issue refers to booked emergency ambulances only, not the Ambulance Service’s Non-Emergency Patient Transport (NEPT) service which the Ministry plans to separate from its emergency retrieval role.
We recommend that by December 2013, the Ministry of Health should re-enforce compliance with its policy on inter-facility transfers for patients requiring special care, to ensure Local Health Districts admit patients direct to inpatient beds and not through the emergency department.
We recommend that by December 2014, the NSW Health improve the patient flow of booked emergency ambulances, especially inter-hospital transfers and bookings made by health staff in the community, by:
- reviewing the volume, type, and distribution of booked ambulance patients presenting to NSW hospitals
- reviewing the process for booking ambulance patients by hospitals or health staff in the community to identify any problems which may need to be addressed
- introduce strategies to address any gaps and improve patient flow of booked ambulance patients.
Hospitals said ‘batching’
where several ambulances
arrive at once puts stress on
the emergency department
NSW Auditor-General's Report to Parliament ∣Reducing ambulance turnaround time at hospitals ∣Key findings
33
3. Do the Ambulance Service’s demand management strategies limit the number of patients it takes to emergency departments?
Demand management strategies such as referring suitable triple-zero calls to advice lines, and developing protocols allowing paramedics to treat patients, limit the number of patients taken to emergency departments. However they are not being used to their full potential. For example:
only two in five eligible calls are transferred to the telephone advice line
two-thirds of the workload of Extended Care Paramedics is high priority response work, rather than patients who may be treated and referred to alternate care
paramedics take patients to emergency departments if they insist on transport, even if their clinical assessment suggests that hospital treatment is unnecessary.
Unrealistic public expectations about the role of the Ambulance Service also results in inappropriate calls and transports. In particular, some patients think that calling an ambulance will fast-track them into a hospital bed. Other key findings:
demand for emergency transport has increased by an average of 22,000 transports for each of the last seven years
currently one in five ambulance responses does not result in a hospital transport
in 2011 one in four incidents where patients were treated under new low acuity protocols, did not result in hospital transport
in 2010 two in five incidents attended by Extended Care Paramedics did not result in hospital transport
there is no routine monitoring of non-transport rates or unnecessary hospital transports.
3.1 Is demand for emergency services monitored and analysed?
Finding: The Ambulance Service monitors and analyses information on demand including future projections and its impact on service provision.
The Ambulance Service monitors and analyses demand for emergency services at a statewide and local level. Each sector office monitors monthly activity data on the number of incidents, responses and transports to hospitals, and reviews trends over time.
Demand for ambulances has continued to increase steadily. Over the last seven years:
incidents requiring an emergency ambulance increased 18 per cent from around 661,000 to 778,000 which is an average of 2.8 per cent a year or almost 20,000 incidents
emergency hospital transports increased by 28 per cent from around 483,000 to 616,000 which is an average of 4.1 per cent a year or 22,000 transports.
The number of emergency
transports has risen by an average of
22,000 for each of the last
seven years
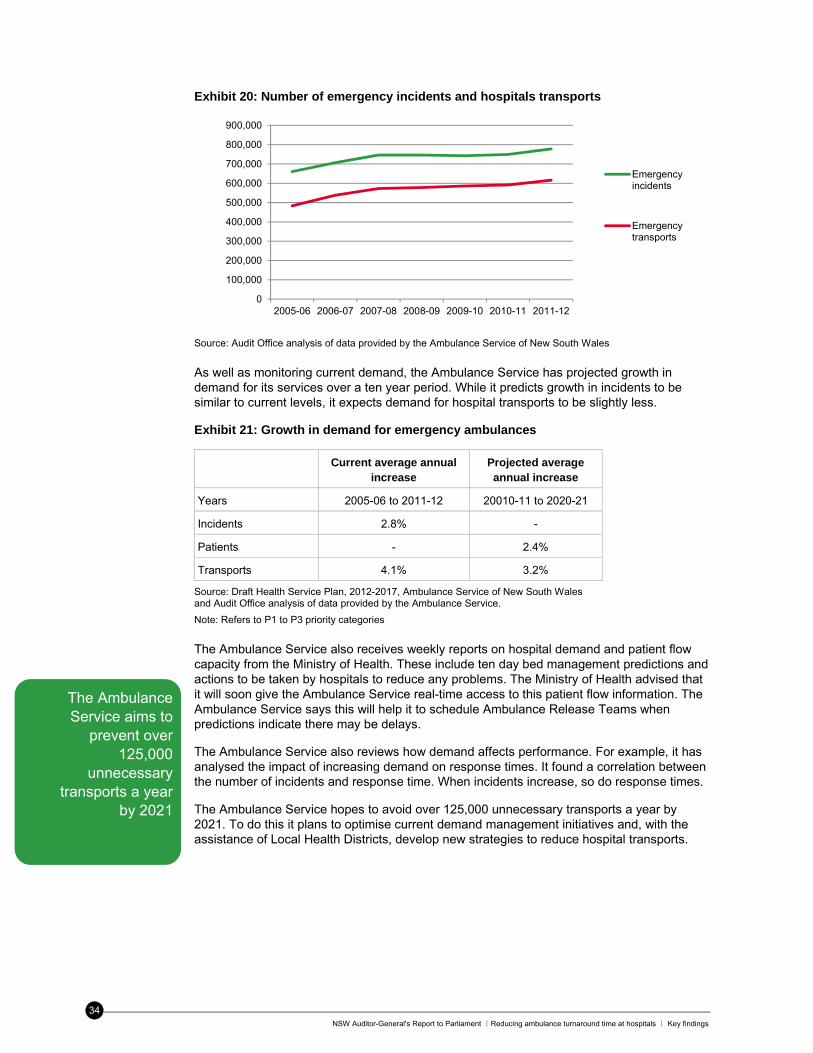
NSW Auditor-General's Report to Parliament ∣Reducing ambulance turnaround time at hospitals ∣ Key findings
34
Exhibit 20: Number of emergency incidents and hospitals transports
Source: Audit Office analysis of data provided by the Ambulance Service of New South Wales
As well as monitoring current demand, the Ambulance Service has projected growth in demand for its services over a ten year period. While it predicts growth in incidents to be similar to current levels, it expects demand for hospital transports to be slightly less.
Exhibit 21: Growth in demand for emergency ambulances
Current average annual increase
Projected average annual increase
Years 2005-06 to 2011-12 20010-11 to 2020-21
Incidents 2.8% -
Patients - 2.4%
Transports 4.1% 3.2%
Source: Draft Health Service Plan, 2012-2017, Ambulance Service of New South Wales and Audit Office analysis of data provided by the Ambulance Service.
Note: Refers to P1 to P3 priority categories
The Ambulance Service also receives weekly reports on hospital demand and patient flow capacity from the Ministry of Health. These include ten day bed management predictions and actions to be taken by hospitals to reduce any problems. The Ministry of Health advised that it will soon give the Ambulance Service real-time access to this patient flow information. The Ambulance Service says this will help it to schedule Ambulance Release Teams when predictions indicate there may be delays.
The Ambulance Service also reviews how demand affects performance. For example, it has analysed the impact of increasing demand on response times. It found a correlation between the number of incidents and response time. When incidents increase, so do response times.
The Ambulance Service hopes to avoid over 125,000 unnecessary transports a year by 2021. To do this it plans to optimise current demand management initiatives and, with the assistance of Local Health Districts, develop new strategies to reduce hospital transports.
0
100,000
200,000
300,000
400,000
500,000
600,000
700,000
800,000
900,000
2005-06 2006-07 2007-08 2008-09 2009-10 2010-11 2011-12
Emergencyincidents
Emergencytransports
The Ambulance Service aims to
prevent over 125,000
unnecessary transports a year
by 2021
NSW Auditor-General's Report to Parliament ∣Reducing ambulance turnaround time at hospitals ∣Key findings
35
3.2 Are there strategies to limit the number of patients taken to emergency departments?
Finding: The Ambulance Service has a range of demand management strategies in place to limit the number of patients taken to emergency departments. However, they are not used to their full potential.
The Ambulance Service has two key strategies in place to limit the number of patients taken to emergency departments. They are:
diverting less serious triple-zero calls to a telephone advice line
allowing paramedics to treat less serious conditions and refer patients to health services in the community (“treat and refer” initiatives).
Telephone advice service
In 2003 the Ambulance Service introduced a telephone advice service, Health Access Coordination which operated from 7 am to 10 pm. Triple-zero call takers redirected less urgent and non-serious calls to the advice service to free up ambulance crews for more urgent cases. Calls referred to the advice line related to minor ailments such as coughs, colds, muscle and limb pain.
In 2011, the Ambulance Service engaged healthdirect, a national telephone advice service, to receive calls when Health Access Coordination (HAC) was not operating. In April 2013, HAC was disbanded and all calls are now referred to healthdirect.
In 2011-12, the Ambulance Service referred almost 27,000 triple-zero calls to the telephone advice lines. This was a third of all calls eligible for telephone advice. This is less than previous years where up to 73 per cent of eligible calls were transferred.
Exhibit 22: Calls to telephone advice lines
2008-09 2009-10 2010-11 2011-12 2012-13 YTD (7 mths)
Operating environment Sydney Sydney Statewide Statewide Statewide
HAC HAC HAC HAC/ healthdirect
HAC/ healthdirect
7am-10pm 7am-10 pm 7am-10pm 24 hours 24 hours
Number of eligible calls 40,629 65,763 90,149 81,340 68,654
Number of calls transferred 25,336 47,684 50,600 26,720 28,027
Eligible calls referral rate 62% 73% 56% 33% 41%
Source: Ambulance Service of New South Wales
Notes: Eligible calls meet an approved list of telephone triage criteria. The Ambulance Service agrees that there is more scope to improve the referral rate. It says that the referral rate in previous years was affected by:
the advice line hours of operation
geographical coverage ie Sydney or statewide
changes in the telephone advice line criteria.
In 2011-12 almost 27,000
calls were transferred to a
telephone advice line or about
3 per cent of total incidents
NSW Auditor-General's Report to Parliament ∣Reducing ambulance turnaround time at hospitals ∣ Key findings
36
In addition, the Ambulance Service says that calls that meet the criteria but are made by a third party, such as police officers, will never be transferred. If this is the case, perhaps these calls should be removed from the referral process altogether. A 2012 review of the Ambulance Service’s use of healthdirect found that it needs better systems to check that call takers refer all possible eligible calls.
Another potential issue relates to ambulances being assigned to healthdirect calls. When a call was transferred to Health Access Coordination, an ambulance was also dispatched to the caller’s location. It was only cancelled when the call was complete and staff knew the patient no longer required one. This meant an ambulance could arrive at the scene even though the advice line was satisfactorily managing the call. The Ambulance Service says it no longer routinely dispatches an ambulance, but we found that in 2012 an ambulance was assigned to 51 per cent of calls eligible for healthdirect. Given the aim of referrals is to reduce ambulance responses, the Ambulance Service should review this practice so that it optimises its use of healthdirect.
The Ambulance Service wants advice line referrals to play a larger role in demand management. To do this it needs to reduce unnecessary dispatches of ambulances and look for new ways to increase the referral rate of eligible calls. It should also consider setting a benchmark for an appropriate referral rate.
Ambulance Victoria runs its own telephone advice service. It advised that the service currently manages around ten per cent of all triple-zero calls. In 2011-12, the NSW Ambulance Service referred around three per cent of total incidents to telephone advice lines.
We recommend that by December 2014, the Ambulance Service reduce unnecessary ambulance responses by:
- increasing the proportion of eligible calls referred to the telephone advice line healthdirect
- stop assigning ambulances to calls transferred to healthdirect
- in conjunction with NSW Health, review the impact of telephone advice referrals on ambulance and emergency department activity.
Treat and refer initiatives Not all patients need to be taken to an emergency department. Treat and refer initiatives allow paramedics to treat less serious conditions at the scene of the incident and recommend non-transport alternatives. This might include advice about self-care or referral to their local doctor or community health provider. The Ambulance Service has two treat and refer schemes in place:
Extended Care Paramedics (ECPs) who treat a broad range of health conditions at the scene of the emergency and refer to alternate health care where appropriate
Low Acuity Pathways (LAP protocols) for treating currently around 13 low acuity conditions.
ECP and LAP share common goals which are to provide appropriate care at the scene of the emergency and reduce the number and frequency of hospital transports. However they differ in terms of paramedic training and education requirements, and the nature and complexity conditions which may be treated.
Paramedics can treat
patients and refer them to
their local doctor
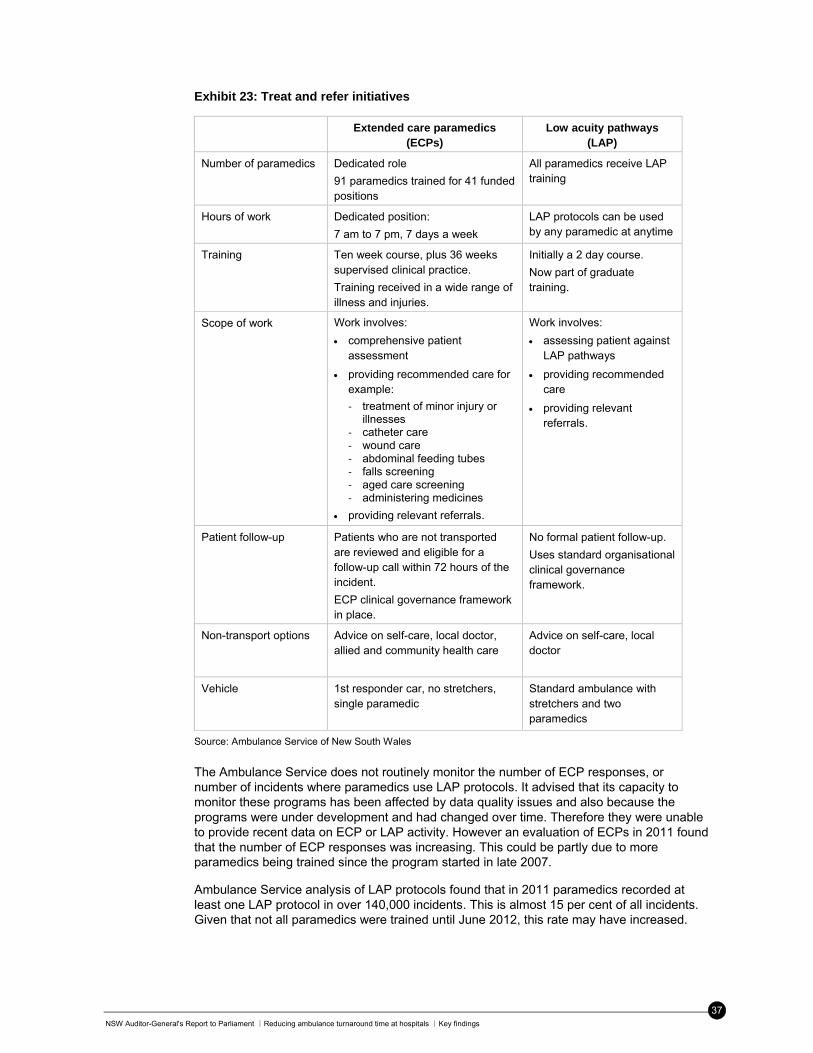
NSW Auditor-General's Report to Parliament ∣Reducing ambulance turnaround time at hospitals ∣Key findings
37
Exhibit 23: Treat and refer initiatives
Extended care paramedics (ECPs)
Low acuity pathways (LAP)
Number of paramedics Dedicated role
91 paramedics trained for 41 funded positions
All paramedics receive LAP training
Hours of work Dedicated position:
7 am to 7 pm, 7 days a week
LAP protocols can be used by any paramedic at anytime
Training Ten week course, plus 36 weeks supervised clinical practice.
Training received in a wide range of illness and injuries.
Initially a 2 day course.
Now part of graduate training.
Scope of work Work involves:
comprehensive patient assessment
providing recommended care for example:
‐ treatment of minor injury or illnesses
‐ catheter care ‐ wound care ‐ abdominal feeding tubes ‐ falls screening ‐ aged care screening ‐ administering medicines
providing relevant referrals.
Work involves:
assessing patient against LAP pathways
providing recommended care
providing relevant referrals.
Patient follow-up Patients who are not transported are reviewed and eligible for a follow-up call within 72 hours of the incident.
ECP clinical governance framework in place.
No formal patient follow-up.
Uses standard organisational clinical governance framework.
Non-transport options Advice on self-care, local doctor, allied and community health care
Advice on self-care, local doctor
Vehicle 1st responder car, no stretchers, single paramedic
Standard ambulance with stretchers and two paramedics
Source: Ambulance Service of New South Wales
The Ambulance Service does not routinely monitor the number of ECP responses, or number of incidents where paramedics use LAP protocols. It advised that its capacity to monitor these programs has been affected by data quality issues and also because the programs were under development and had changed over time. Therefore they were unable to provide recent data on ECP or LAP activity. However an evaluation of ECPs in 2011 found that the number of ECP responses was increasing. This could be partly due to more paramedics being trained since the program started in late 2007.
Ambulance Service analysis of LAP protocols found that in 2011 paramedics recorded at least one LAP protocol in over 140,000 incidents. This is almost 15 per cent of all incidents. Given that not all paramedics were trained until June 2012, this rate may have increased.
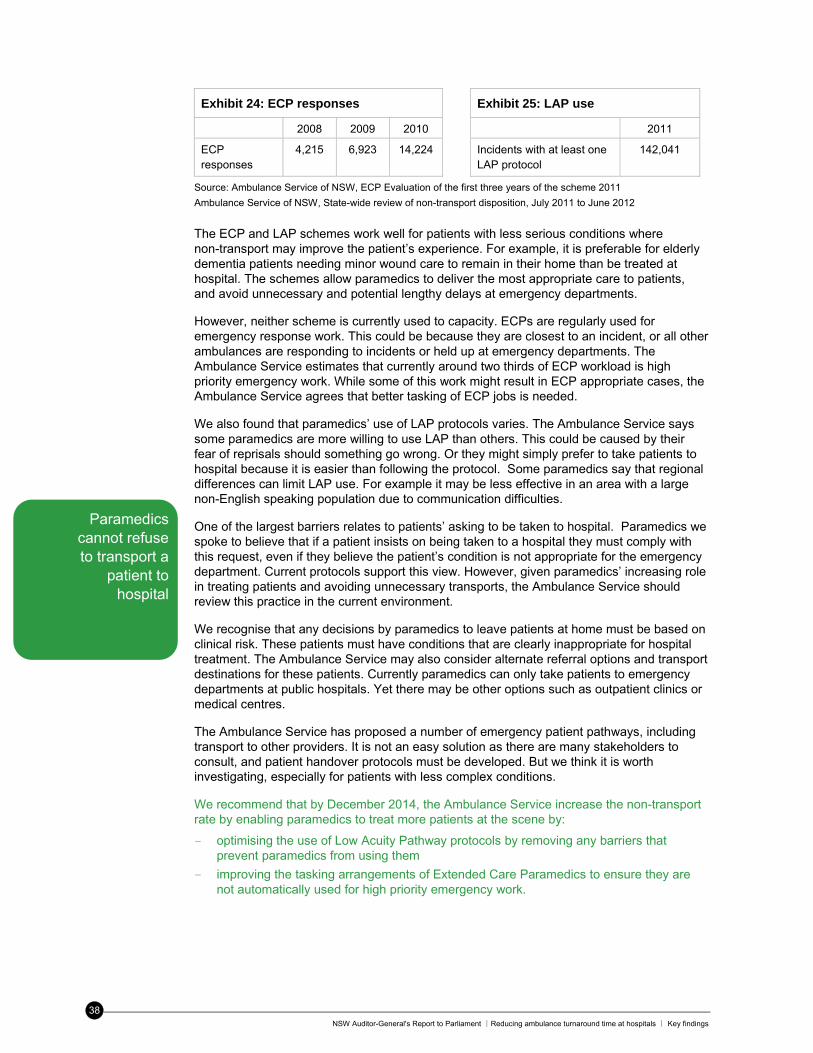
NSW Auditor-General's Report to Parliament ∣Reducing ambulance turnaround time at hospitals ∣ Key findings
38
Exhibit 24: ECP responses Exhibit 25: LAP use
2008 2009 2010 2011
ECP responses
4,215
6,923 14,224 Incidents with at least one LAP protocol
142,041
Source: Ambulance Service of NSW, ECP Evaluation of the first three years of the scheme 2011
Ambulance Service of NSW, State-wide review of non-transport disposition, July 2011 to June 2012
The ECP and LAP schemes work well for patients with less serious conditions where non-transport may improve the patient’s experience. For example, it is preferable for elderly dementia patients needing minor wound care to remain in their home than be treated at hospital. The schemes allow paramedics to deliver the most appropriate care to patients, and avoid unnecessary and potential lengthy delays at emergency departments.
However, neither scheme is currently used to capacity. ECPs are regularly used for emergency response work. This could be because they are closest to an incident, or all other ambulances are responding to incidents or held up at emergency departments. The Ambulance Service estimates that currently around two thirds of ECP workload is high priority emergency work. While some of this work might result in ECP appropriate cases, the Ambulance Service agrees that better tasking of ECP jobs is needed.
We also found that paramedics’ use of LAP protocols varies. The Ambulance Service says some paramedics are more willing to use LAP than others. This could be caused by their fear of reprisals should something go wrong. Or they might simply prefer to take patients to hospital because it is easier than following the protocol. Some paramedics say that regional differences can limit LAP use. For example it may be less effective in an area with a large non-English speaking population due to communication difficulties.
One of the largest barriers relates to patients’ asking to be taken to hospital. Paramedics we spoke to believe that if a patient insists on being taken to a hospital they must comply with this request, even if they believe the patient’s condition is not appropriate for the emergency department. Current protocols support this view. However, given paramedics’ increasing role in treating patients and avoiding unnecessary transports, the Ambulance Service should review this practice in the current environment.
We recognise that any decisions by paramedics to leave patients at home must be based on clinical risk. These patients must have conditions that are clearly inappropriate for hospital treatment. The Ambulance Service may also consider alternate referral options and transport destinations for these patients. Currently paramedics can only take patients to emergency departments at public hospitals. Yet there may be other options such as outpatient clinics or medical centres.
The Ambulance Service has proposed a number of emergency patient pathways, including transport to other providers. It is not an easy solution as there are many stakeholders to consult, and patient handover protocols must be developed. But we think it is worth investigating, especially for patients with less complex conditions.
We recommend that by December 2014, the Ambulance Service increase the non-transport rate by enabling paramedics to treat more patients at the scene by:
- optimising the use of Low Acuity Pathway protocols by removing any barriers that prevent paramedics from using them
- improving the tasking arrangements of Extended Care Paramedics to ensure they are not automatically used for high priority emergency work.
Paramedics cannot refuse to transport a
patient to hospital
NSW Auditor-General's Report to Parliament ∣Reducing ambulance turnaround time at hospitals ∣Key findings
39
We recommend that the Ambulance Service enable paramedics to determine based on their clinical assessment, that hospital transport is not required. This may include:
- by December 2014, introducing a process where paramedics can refuse to transport a patient to a hospital emergency department where it is clear that transport is not warranted
- July 2015, in consultation with relevant stakeholders, investigating alternate referral options or transport destinations, such as outpatient clinics and medical centres.
Other demand management initiatives
The Ambulance Service is also developing initiatives to manage two high demand client groups, specifically:
palliative care patients in aged care facilities
patients calling the ambulance service more than ten times a year (frequent callers).
Paramedics are sometimes called out to aged care facilities to attend palliative care patients. Transporting these patients to hospital may not be the most appropriate care nor meet the wishes or goals of the patient and their family.
To help address this issue, the Ambulance Service recently piloted Authorised Palliative Care Plans for residents at an aged care facility on the Central Coast. Each plan is developed by the patient, their relatives and treating clinicians. The plans allow paramedics to provide care, administer medicine, and perform procedures which may not be in standard ambulance protocols. Each plan also outlines the circumstances under which the patient should not be taken to an emergency department. The Ambulance Service is now rolling out this initiative statewide.
The Ambulance Service advised that other patients in aged care facilities may be treated by ECPs, and it is developing programs to facilitate this with Local Health Districts.
The Ambulance Service also advised that it is working on a project to manage its frequent callers more efficiently. In 2011-12, the 500 most frequent callers made around 10,000 calls. Each caller used an average of 20 ambulances, resulting in 15 trips to the emergency department. The Ambulance Service has been targeting the top 18 most frequent callers who make an average of 86 calls each a year. It reports that in the initial three month period, intervention targeting these callers resulted in an average call reduction of 45 per cent. The project initially focused on mental health patients but now includes all frequent callers irrespective of diagnosis.
In addition to these statewide projects, managers in some regional offices said they had developed or proposed local demand management initiatives. This included working with a local aged care facility or general practitioners to improve patient care.
3.3 Has the number of unnecessary transports to emergency departments reduced?
Finding: The Ambulance Service analyses its demand management strategies to see whether it transports less patients to hospitals. The results are encouraging, with the ECP non-transport rate gradually increasing, and less ambulances are now dispatched when calls are referred to telephone advice lines. However there is no overall trend data to determine whether unnecessary transportations have reduced.
In 2011-12, four in five emergency calls result in a patient being taken to hospital. This is more than in previous years, which means patients are more likely to be transported to hospital today. This trend is similar for both total incidents and emergency incidents.
Programs are in place to care
for palliative care patients and frequent
callers
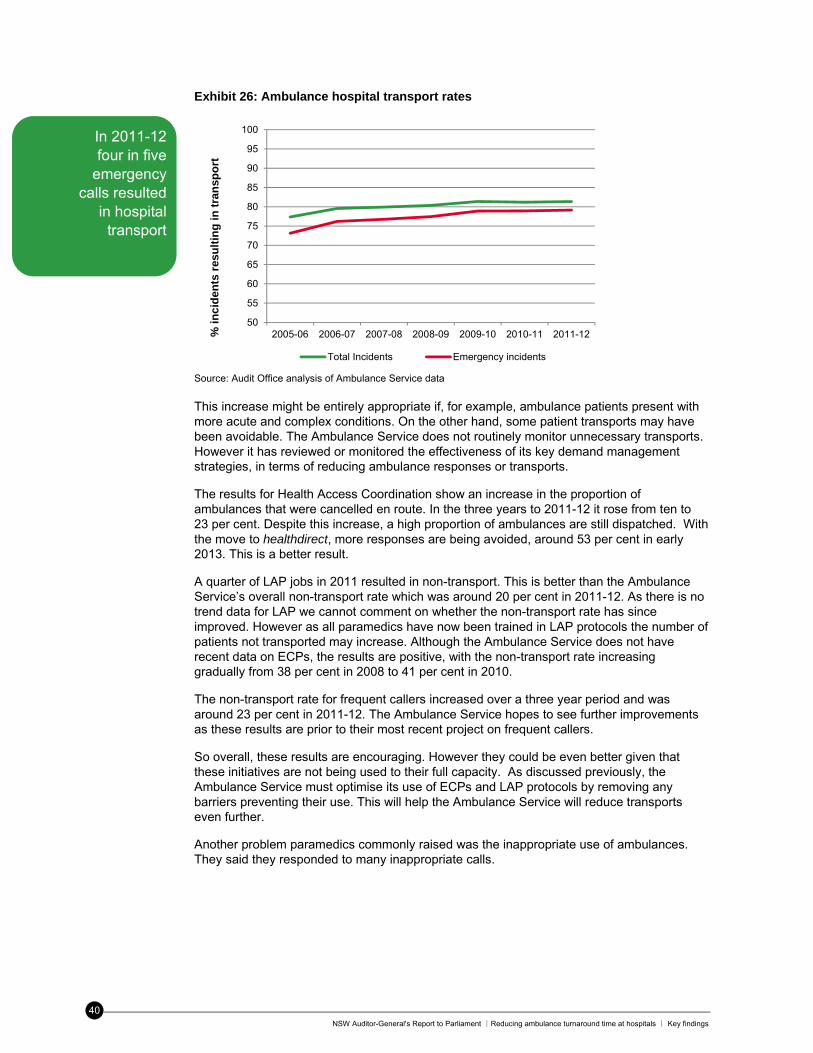
NSW Auditor-General's Report to Parliament ∣Reducing ambulance turnaround time at hospitals ∣ Key findings
40
Exhibit 26: Ambulance hospital transport rates
Source: Audit Office analysis of Ambulance Service data This increase might be entirely appropriate if, for example, ambulance patients present with more acute and complex conditions. On the other hand, some patient transports may have been avoidable. The Ambulance Service does not routinely monitor unnecessary transports. However it has reviewed or monitored the effectiveness of its key demand management strategies, in terms of reducing ambulance responses or transports.
The results for Health Access Coordination show an increase in the proportion of ambulances that were cancelled en route. In the three years to 2011-12 it rose from ten to 23 per cent. Despite this increase, a high proportion of ambulances are still dispatched. With the move to healthdirect, more responses are being avoided, around 53 per cent in early 2013. This is a better result.
A quarter of LAP jobs in 2011 resulted in non-transport. This is better than the Ambulance Service’s overall non-transport rate which was around 20 per cent in 2011-12. As there is no trend data for LAP we cannot comment on whether the non-transport rate has since improved. However as all paramedics have now been trained in LAP protocols the number of patients not transported may increase. Although the Ambulance Service does not have recent data on ECPs, the results are positive, with the non-transport rate increasing gradually from 38 per cent in 2008 to 41 per cent in 2010.
The non-transport rate for frequent callers increased over a three year period and was around 23 per cent in 2011-12. The Ambulance Service hopes to see further improvements as these results are prior to their most recent project on frequent callers.
So overall, these results are encouraging. However they could be even better given that these initiatives are not being used to their full capacity. As discussed previously, the Ambulance Service must optimise its use of ECPs and LAP protocols by removing any barriers preventing their use. This will help the Ambulance Service will reduce transports even further.
Another problem paramedics commonly raised was the inappropriate use of ambulances. They said they responded to many inappropriate calls.
50
55
60
65
70
75
80
85
90
95
100
2005-06 2006-07 2007-08 2008-09 2009-10 2010-11 2011-12% i
nc
iden
ts r
esu
ltin
g i
n t
ran
spo
rt
Total Incidents Emergency incidents
In 2011-12 four in five
emergency calls resulted
in hospital transport
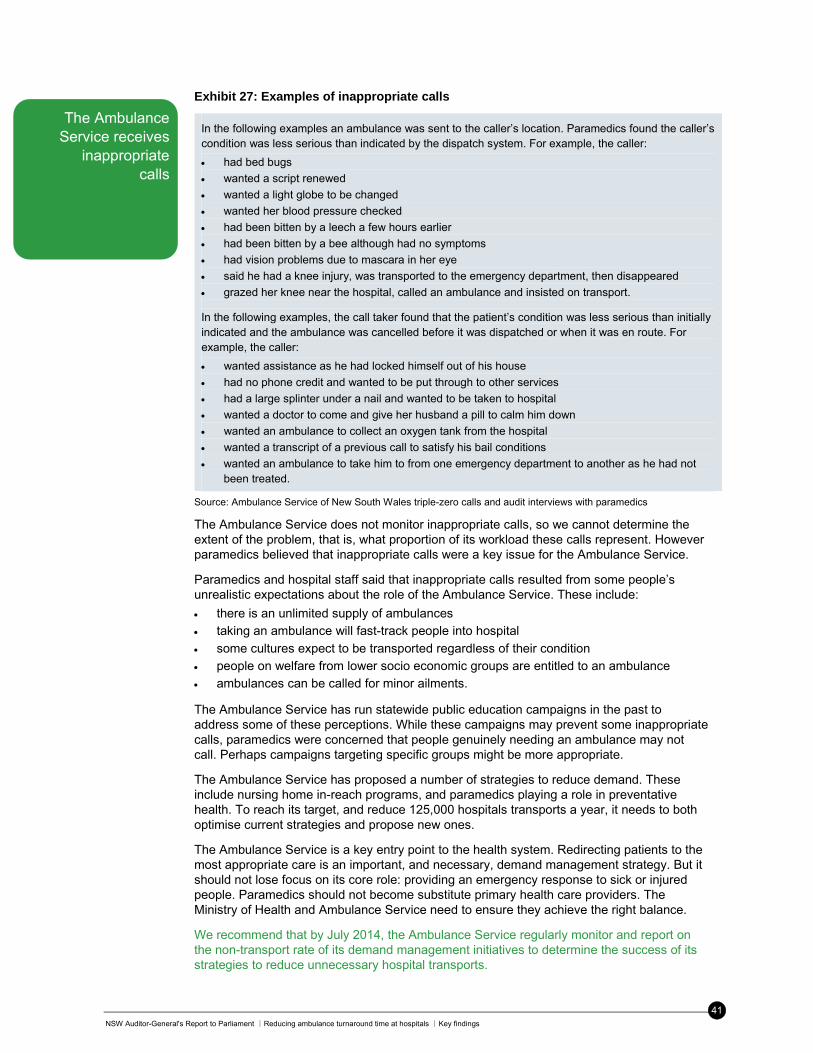
NSW Auditor-General's Report to Parliament ∣Reducing ambulance turnaround time at hospitals ∣Key findings
41
Exhibit 27: Examples of inappropriate calls
In the following examples an ambulance was sent to the caller’s location. Paramedics found the caller’s condition was less serious than indicated by the dispatch system. For example, the caller:
had bed bugs
wanted a script renewed
wanted a light globe to be changed
wanted her blood pressure checked
had been bitten by a leech a few hours earlier
had been bitten by a bee although had no symptoms
had vision problems due to mascara in her eye
said he had a knee injury, was transported to the emergency department, then disappeared
grazed her knee near the hospital, called an ambulance and insisted on transport.
In the following examples, the call taker found that the patient’s condition was less serious than initially indicated and the ambulance was cancelled before it was dispatched or when it was en route. For example, the caller:
wanted assistance as he had locked himself out of his house
had no phone credit and wanted to be put through to other services
had a large splinter under a nail and wanted to be taken to hospital
wanted a doctor to come and give her husband a pill to calm him down
wanted an ambulance to collect an oxygen tank from the hospital
wanted a transcript of a previous call to satisfy his bail conditions
wanted an ambulance to take him to from one emergency department to another as he had not been treated.
Source: Ambulance Service of New South Wales triple-zero calls and audit interviews with paramedics
The Ambulance Service does not monitor inappropriate calls, so we cannot determine the extent of the problem, that is, what proportion of its workload these calls represent. However paramedics believed that inappropriate calls were a key issue for the Ambulance Service.
Paramedics and hospital staff said that inappropriate calls resulted from some people’s unrealistic expectations about the role of the Ambulance Service. These include:
there is an unlimited supply of ambulances taking an ambulance will fast-track people into hospital
some cultures expect to be transported regardless of their condition people on welfare from lower socio economic groups are entitled to an ambulance ambulances can be called for minor ailments.
The Ambulance Service has run statewide public education campaigns in the past to address some of these perceptions. While these campaigns may prevent some inappropriate calls, paramedics were concerned that people genuinely needing an ambulance may not call. Perhaps campaigns targeting specific groups might be more appropriate.
The Ambulance Service has proposed a number of strategies to reduce demand. These include nursing home in-reach programs, and paramedics playing a role in preventative health. To reach its target, and reduce 125,000 hospitals transports a year, it needs to both optimise current strategies and propose new ones.
The Ambulance Service is a key entry point to the health system. Redirecting patients to the most appropriate care is an important, and necessary, demand management strategy. But it should not lose focus on its core role: providing an emergency response to sick or injured people. Paramedics should not become substitute primary health care providers. The Ministry of Health and Ambulance Service need to ensure they achieve the right balance.
We recommend that by July 2014, the Ambulance Service regularly monitor and report on the non-transport rate of its demand management initiatives to determine the success of its strategies to reduce unnecessary hospital transports.
The Ambulance Service receives
inappropriate calls
NSW Auditor-General's Report to Parliament ∣Reducing ambulance turnaround time at hospitals ∣ Appendices
42
Appendices
Appendix 1: About the audit
Audit objective
This audit assessed whether there are effective strategies in place to reduce the time spent by ambulance crews at emergency departments. Audit lines of inquiry and criteria
Question 1: Do NSW Health’s strategies to reduce ambulance delays at emergency departments free up ambulances to respond to other incidents?
Criteria 1.1: The Ambulance Service and Ministry of Health monitor and report the extent of ambulance delays at emergency departments and their impact on service delivery.
Criteria 1.2: The Ambulance Service and Ministry of Health have strategies in place to reduce ambulance delays at emergency departments.
Criteria 1.3: The Ambulance Service and Ministry of Health review these strategies to check whether time spent by ambulance crews at emergency departments has reduced and enabled them to respond to other emergency incidents
Question 2: Do the Ambulance Service’s demand management strategies limit the number of ambulance patients it takes to emergency departments?
Criteria 2.1: The Ambulance Service monitors and analyses information on demand for emergency services and its impact on off-stretcher time.
Criteria 2.2: The Ambulance Service has demand management strategies in place to limit the number of patients taken to emergency departments.
Criteria 2.3: The Ambulance Service reviews its demand management strategies to check whether the number of inappropriate or unnecessary transportations to emergency departments has reduced.
Audit scope
For the purpose of this audit ‘delays at emergency departments’ is any time spent beyond the 30 minute target. By ‘reducing time spent’ we mean:
a reduction in average time spent at the emergency department, and
performance targets for transfer of care/off-stretcher time have been met and/or performance is improving.
By ‘demand management’ we mean initiatives which reduce both: the need for an ambulance crew to be dispatched to an incident, and
the need for an ambulance crew to take a patient to an emergency department.
By ‘limiting the number of patients taken to emergency departments’ we mean:
reduced number of inappropriate or unnecessary transports to emergency departments
treat at scene initiatives are used to full capacity
increased proportion of patients referred to the helpline or treated at the scene, where appropriate.
Audit exclusions
We did not assess:
ambulance responses by helicopter
the overall effectiveness of patient flow strategies in hospitals
the appropriateness of clinical decisions made by health staff
the adequacy of ambulance/hospital resources and rostering practices.
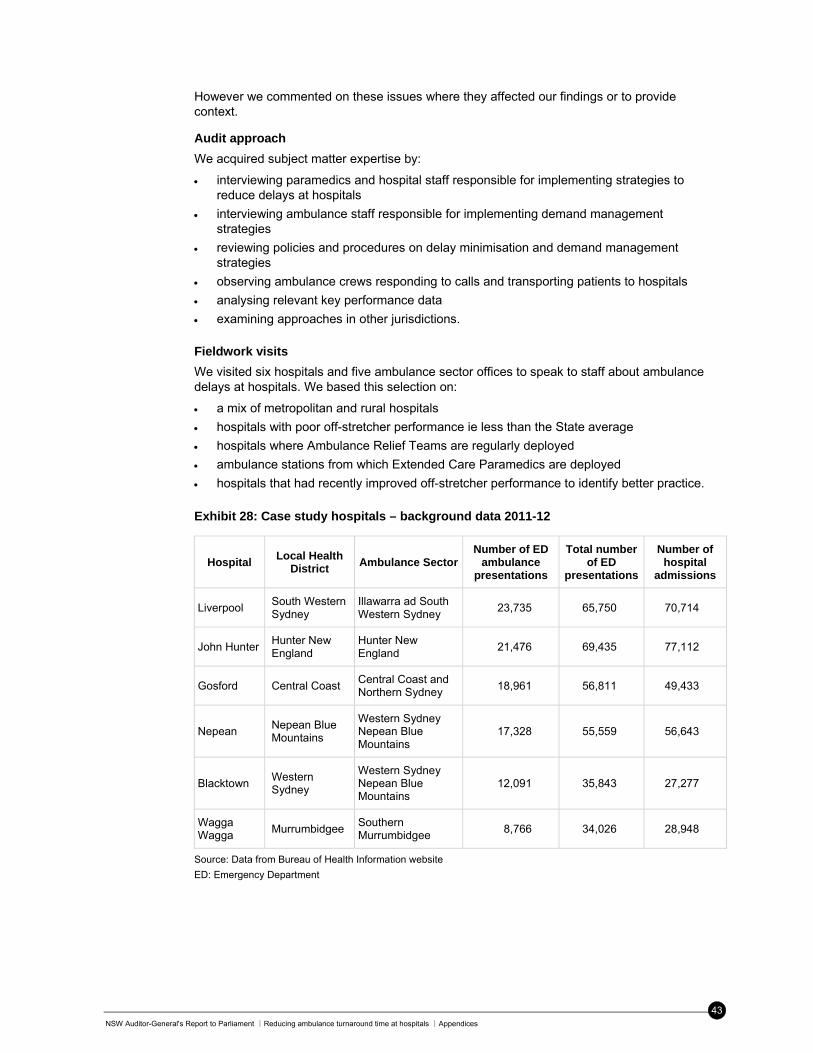
NSW Auditor-General's Report to Parliament ∣Reducing ambulance turnaround time at hospitals ∣Appendices
43
However we commented on these issues where they affected our findings or to provide context.
Audit approach
We acquired subject matter expertise by:
interviewing paramedics and hospital staff responsible for implementing strategies to reduce delays at hospitals
interviewing ambulance staff responsible for implementing demand management strategies
reviewing policies and procedures on delay minimisation and demand management strategies
observing ambulance crews responding to calls and transporting patients to hospitals
analysing relevant key performance data
examining approaches in other jurisdictions.
Fieldwork visits
We visited six hospitals and five ambulance sector offices to speak to staff about ambulance delays at hospitals. We based this selection on:
a mix of metropolitan and rural hospitals
hospitals with poor off-stretcher performance ie less than the State average
hospitals where Ambulance Relief Teams are regularly deployed
ambulance stations from which Extended Care Paramedics are deployed
hospitals that had recently improved off-stretcher performance to identify better practice.
Exhibit 28: Case study hospitals – background data 2011-12
Hospital Local Health
District Ambulance Sector
Number of ED ambulance
presentations
Total number of ED
presentations
Number of hospital
admissions
Liverpool South Western Sydney
Illawarra ad South Western Sydney
23,735 65,750 70,714
John Hunter Hunter New England
Hunter New England
21,476 69,435 77,112
Gosford Central Coast Central Coast and Northern Sydney
18,961 56,811 49,433
Nepean Nepean Blue Mountains
Western Sydney Nepean Blue Mountains
17,328 55,559 56,643
Blacktown Western Sydney
Western Sydney Nepean Blue Mountains
12,091 35,843 27,277
Wagga Wagga
Murrumbidgee Southern Murrumbidgee
8,766 34,026 28,948
Source: Data from Bureau of Health Information website
ED: Emergency Department
NSW Auditor-General's Report to Parliament ∣Reducing ambulance turnaround time at hospitals ∣ Appendices
44
We interviewed over 100 people at our site visits. Exhibit 29: Site visit interviews
Hospital visits Ambulance sector visits
At most hospitals we spoke to the:
General Manager
Director of Nursing
Medical Director
Patient Flow Manager
ED Director / staff specialist
ED Nurse Unit Manager (NUM) / Clinical NUM
ED triage nurse / clerk. At some hospitals we spoke to:
ward nurses
allied health staff
the hospital bookings clerk
data manager
NEAT project manager
patient transport unit.
We spoke to:
Zone Managers
Duty Officer Managers
Ambulance Liaison Officers
Extended Care Paramedics
Intensive Care Paramedics
Paramedics.
Members of the audit team also went on two ambulance ride-alongs in metropolitan Sydney.
Many hospital and ambulance staff we spoke to had worked in other Local Health Districts or NSW Ambulance Sector Offices. Therefore they were able to speak of their experiences in the health system in general.
Note that references to Local Health Districts in this report also include NSW Health’s Specialist Health Networks – Sydney Children’s Hospitals Network and St Vincent’s Health Network.
Audit selection
We use a strategic approach to selecting performance audits which balances our performance audit program to reflect issues of interest to Parliament and the community. Details of our approach to selecting topics and our forward program are available on our website.
Audit methodology
Our performance audit methodology is designed to satisfy Australian Audit Standards ASAE 3500 on performance auditing, and to reflect current thinking on performance auditing practices. Our processes have also been designed to comply with the auditing requirements specified in the Public Finance and Audit Act 1983.
Acknowledgements
We gratefully acknowledge the co-operation and assistance provided by the NSW Ministry of Health and Ambulance Service of New South Wales. In particular we wish to thank our liaison officers and staff who participated in interviews and provided material relevant to the audit.
Audit team
Tiffany Blackett and Lucy Stedman conducted the performance audit. Jane Tebbatt provided direction and quality assurance.
Audit cost
Including staff costs, printing costs and overheads, the estimated cost of the audit is $280,760.
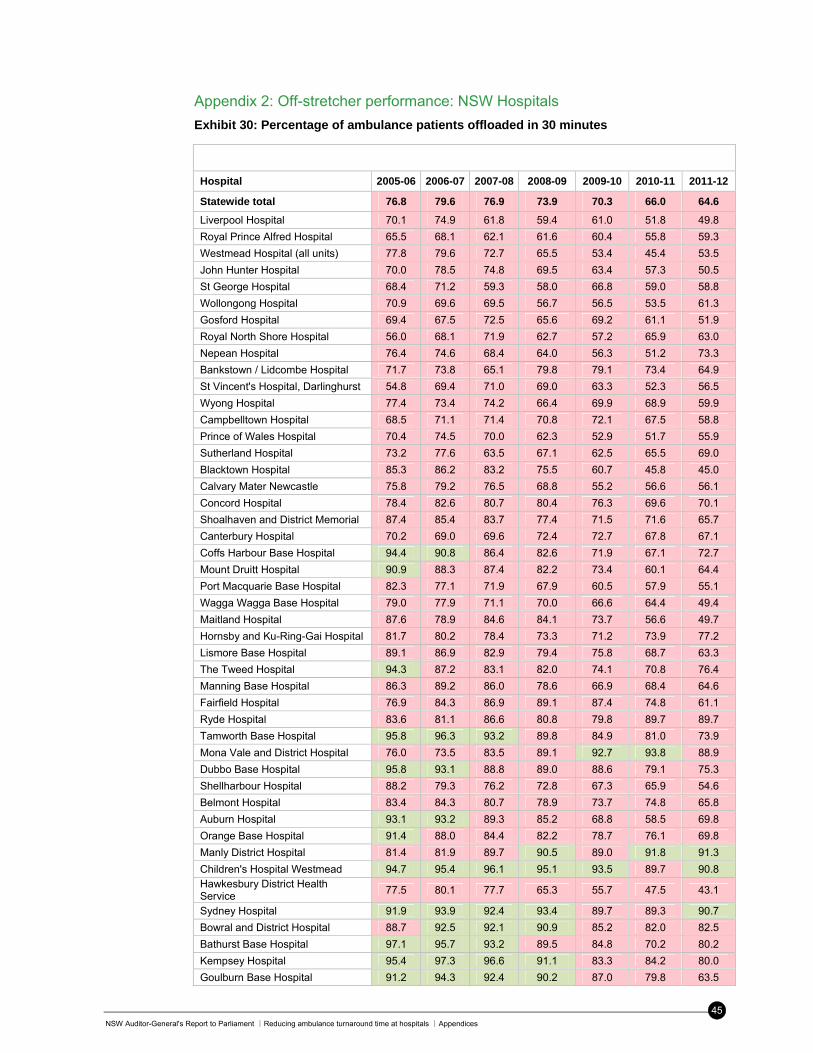
NSW Auditor-General's Report to Parliament ∣Reducing ambulance turnaround time at hospitals ∣Appendices
45
Appendix 2: Off-stretcher performance: NSW Hospitals
Exhibit 30: Percentage of ambulance patients offloaded in 30 minutes
Hospital 2005-06 2006-07 2007-08 2008-09 2009-10 2010-11 2011-12
Statewide total 76.8 79.6 76.9 73.9 70.3 66.0 64.6
Liverpool Hospital 70.1 74.9 61.8 59.4 61.0 51.8 49.8
Royal Prince Alfred Hospital 65.5 68.1 62.1 61.6 60.4 55.8 59.3
Westmead Hospital (all units) 77.8 79.6 72.7 65.5 53.4 45.4 53.5
John Hunter Hospital 70.0 78.5 74.8 69.5 63.4 57.3 50.5
St George Hospital 68.4 71.2 59.3 58.0 66.8 59.0 58.8
Wollongong Hospital 70.9 69.6 69.5 56.7 56.5 53.5 61.3
Gosford Hospital 69.4 67.5 72.5 65.6 69.2 61.1 51.9
Royal North Shore Hospital 56.0 68.1 71.9 62.7 57.2 65.9 63.0
Nepean Hospital 76.4 74.6 68.4 64.0 56.3 51.2 73.3
Bankstown / Lidcombe Hospital 71.7 73.8 65.1 79.8 79.1 73.4 64.9
St Vincent's Hospital, Darlinghurst 54.8 69.4 71.0 69.0 63.3 52.3 56.5
Wyong Hospital 77.4 73.4 74.2 66.4 69.9 68.9 59.9
Campbelltown Hospital 68.5 71.1 71.4 70.8 72.1 67.5 58.8
Prince of Wales Hospital 70.4 74.5 70.0 62.3 52.9 51.7 55.9
Sutherland Hospital 73.2 77.6 63.5 67.1 62.5 65.5 69.0
Blacktown Hospital 85.3 86.2 83.2 75.5 60.7 45.8 45.0
Calvary Mater Newcastle 75.8 79.2 76.5 68.8 55.2 56.6 56.1
Concord Hospital 78.4 82.6 80.7 80.4 76.3 69.6 70.1
Shoalhaven and District Memorial 87.4 85.4 83.7 77.4 71.5 71.6 65.7
Canterbury Hospital 70.2 69.0 69.6 72.4 72.7 67.8 67.1
Coffs Harbour Base Hospital 94.4 90.8 86.4 82.6 71.9 67.1 72.7
Mount Druitt Hospital 90.9 88.3 87.4 82.2 73.4 60.1 64.4
Port Macquarie Base Hospital 82.3 77.1 71.9 67.9 60.5 57.9 55.1
Wagga Wagga Base Hospital 79.0 77.9 71.1 70.0 66.6 64.4 49.4
Maitland Hospital 87.6 78.9 84.6 84.1 73.7 56.6 49.7
Hornsby and Ku-Ring-Gai Hospital 81.7 80.2 78.4 73.3 71.2 73.9 77.2
Lismore Base Hospital 89.1 86.9 82.9 79.4 75.8 68.7 63.3
The Tweed Hospital 94.3 87.2 83.1 82.0 74.1 70.8 76.4
Manning Base Hospital 86.3 89.2 86.0 78.6 66.9 68.4 64.6
Fairfield Hospital 76.9 84.3 86.9 89.1 87.4 74.8 61.1
Ryde Hospital 83.6 81.1 86.6 80.8 79.8 89.7 89.7
Tamworth Base Hospital 95.8 96.3 93.2 89.8 84.9 81.0 73.9
Mona Vale and District Hospital 76.0 73.5 83.5 89.1 92.7 93.8 88.9
Dubbo Base Hospital 95.8 93.1 88.8 89.0 88.6 79.1 75.3
Shellharbour Hospital 88.2 79.3 76.2 72.8 67.3 65.9 54.6
Belmont Hospital 83.4 84.3 80.7 78.9 73.7 74.8 65.8
Auburn Hospital 93.1 93.2 89.3 85.2 68.8 58.5 69.8
Orange Base Hospital 91.4 88.0 84.4 82.2 78.7 76.1 69.8
Manly District Hospital 81.4 81.9 89.7 90.5 89.0 91.8 91.3
Children's Hospital Westmead 94.7 95.4 96.1 95.1 93.5 89.7 90.8 Hawkesbury District Health Service
77.5 80.1 77.7 65.3 55.7 47.5 43.1
Sydney Hospital 91.9 93.9 92.4 93.4 89.7 89.3 90.7
Bowral and District Hospital 88.7 92.5 92.1 90.9 85.2 82.0 82.5
Bathurst Base Hospital 97.1 95.7 93.2 89.5 84.8 70.2 80.2
Kempsey Hospital 95.4 97.3 96.6 91.1 83.3 84.2 80.0
Goulburn Base Hospital 91.2 94.3 92.4 90.2 87.0 79.8 63.5
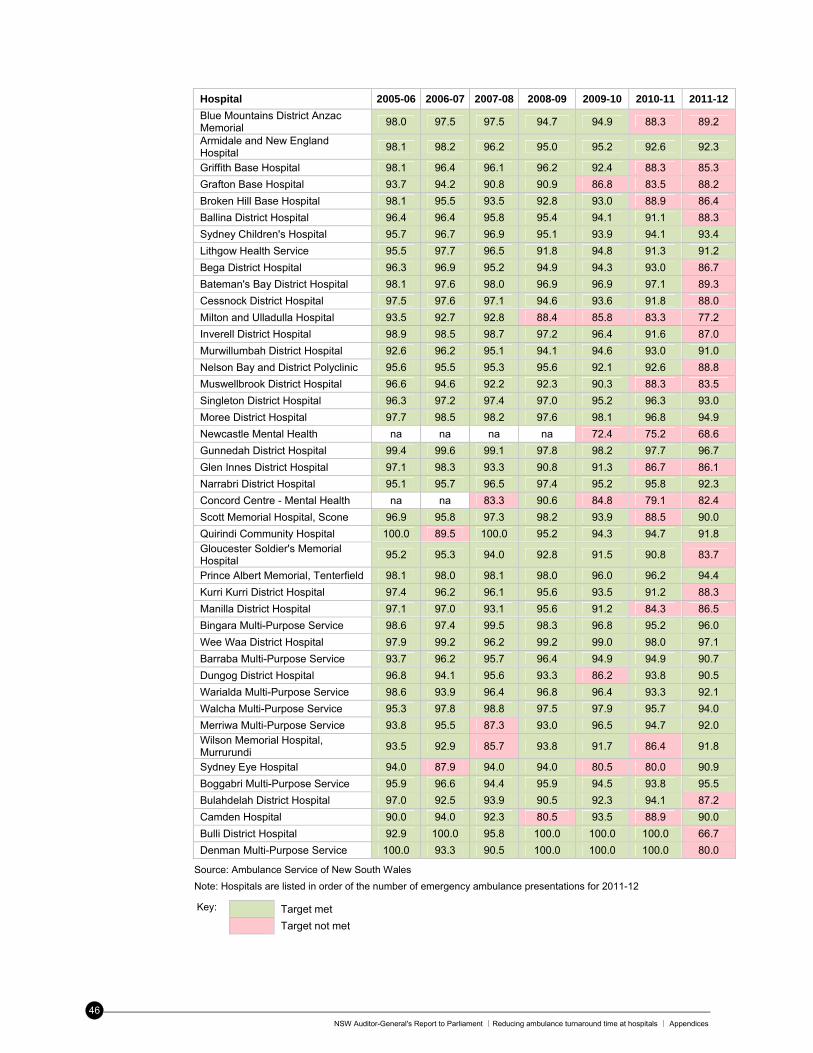
NSW Auditor-General's Report to Parliament ∣Reducing ambulance turnaround time at hospitals ∣ Appendices
46
Hospital 2005-06 2006-07 2007-08 2008-09 2009-10 2010-11 2011-12
Blue Mountains District Anzac Memorial
98.0 97.5 97.5 94.7 94.9 88.3 89.2
Armidale and New England Hospital
98.1 98.2 96.2 95.0 95.2 92.6 92.3
Griffith Base Hospital 98.1 96.4 96.1 96.2 92.4 88.3 85.3
Grafton Base Hospital 93.7 94.2 90.8 90.9 86.8 83.5 88.2
Broken Hill Base Hospital 98.1 95.5 93.5 92.8 93.0 88.9 86.4
Ballina District Hospital 96.4 96.4 95.8 95.4 94.1 91.1 88.3
Sydney Children's Hospital 95.7 96.7 96.9 95.1 93.9 94.1 93.4
Lithgow Health Service 95.5 97.7 96.5 91.8 94.8 91.3 91.2
Bega District Hospital 96.3 96.9 95.2 94.9 94.3 93.0 86.7
Bateman's Bay District Hospital 98.1 97.6 98.0 96.9 96.9 97.1 89.3
Cessnock District Hospital 97.5 97.6 97.1 94.6 93.6 91.8 88.0
Milton and Ulladulla Hospital 93.5 92.7 92.8 88.4 85.8 83.3 77.2
Inverell District Hospital 98.9 98.5 98.7 97.2 96.4 91.6 87.0
Murwillumbah District Hospital 92.6 96.2 95.1 94.1 94.6 93.0 91.0
Nelson Bay and District Polyclinic 95.6 95.5 95.3 95.6 92.1 92.6 88.8
Muswellbrook District Hospital 96.6 94.6 92.2 92.3 90.3 88.3 83.5
Singleton District Hospital 96.3 97.2 97.4 97.0 95.2 96.3 93.0
Moree District Hospital 97.7 98.5 98.2 97.6 98.1 96.8 94.9
Newcastle Mental Health na na na na 72.4 75.2 68.6
Gunnedah District Hospital 99.4 99.6 99.1 97.8 98.2 97.7 96.7
Glen Innes District Hospital 97.1 98.3 93.3 90.8 91.3 86.7 86.1
Narrabri District Hospital 95.1 95.7 96.5 97.4 95.2 95.8 92.3
Concord Centre - Mental Health na na 83.3 90.6 84.8 79.1 82.4
Scott Memorial Hospital, Scone 96.9 95.8 97.3 98.2 93.9 88.5 90.0
Quirindi Community Hospital 100.0 89.5 100.0 95.2 94.3 94.7 91.8 Gloucester Soldier's Memorial Hospital
95.2 95.3 94.0 92.8 91.5 90.8 83.7
Prince Albert Memorial, Tenterfield 98.1 98.0 98.1 98.0 96.0 96.2 94.4
Kurri Kurri District Hospital 97.4 96.2 96.1 95.6 93.5 91.2 88.3
Manilla District Hospital 97.1 97.0 93.1 95.6 91.2 84.3 86.5
Bingara Multi-Purpose Service 98.6 97.4 99.5 98.3 96.8 95.2 96.0
Wee Waa District Hospital 97.9 99.2 96.2 99.2 99.0 98.0 97.1
Barraba Multi-Purpose Service 93.7 96.2 95.7 96.4 94.9 94.9 90.7
Dungog District Hospital 96.8 94.1 95.6 93.3 86.2 93.8 90.5
Warialda Multi-Purpose Service 98.6 93.9 96.4 96.8 96.4 93.3 92.1
Walcha Multi-Purpose Service 95.3 97.8 98.8 97.5 97.9 95.7 94.0
Merriwa Multi-Purpose Service 93.8 95.5 87.3 93.0 96.5 94.7 92.0 Wilson Memorial Hospital, Murrurundi
93.5 92.9 85.7 93.8 91.7 86.4 91.8
Sydney Eye Hospital 94.0 87.9 94.0 94.0 80.5 80.0 90.9
Boggabri Multi-Purpose Service 95.9 96.6 94.4 95.9 94.5 93.8 95.5
Bulahdelah District Hospital 97.0 92.5 93.9 90.5 92.3 94.1 87.2
Camden Hospital 90.0 94.0 92.3 80.5 93.5 88.9 90.0
Bulli District Hospital 92.9 100.0 95.8 100.0 100.0 100.0 66.7
Denman Multi-Purpose Service 100.0 93.3 90.5 100.0 100.0 100.0 80.0
Source: Ambulance Service of New South Wales
Note: Hospitals are listed in order of the number of emergency ambulance presentations for 2011-12
Key: Target met Target not met
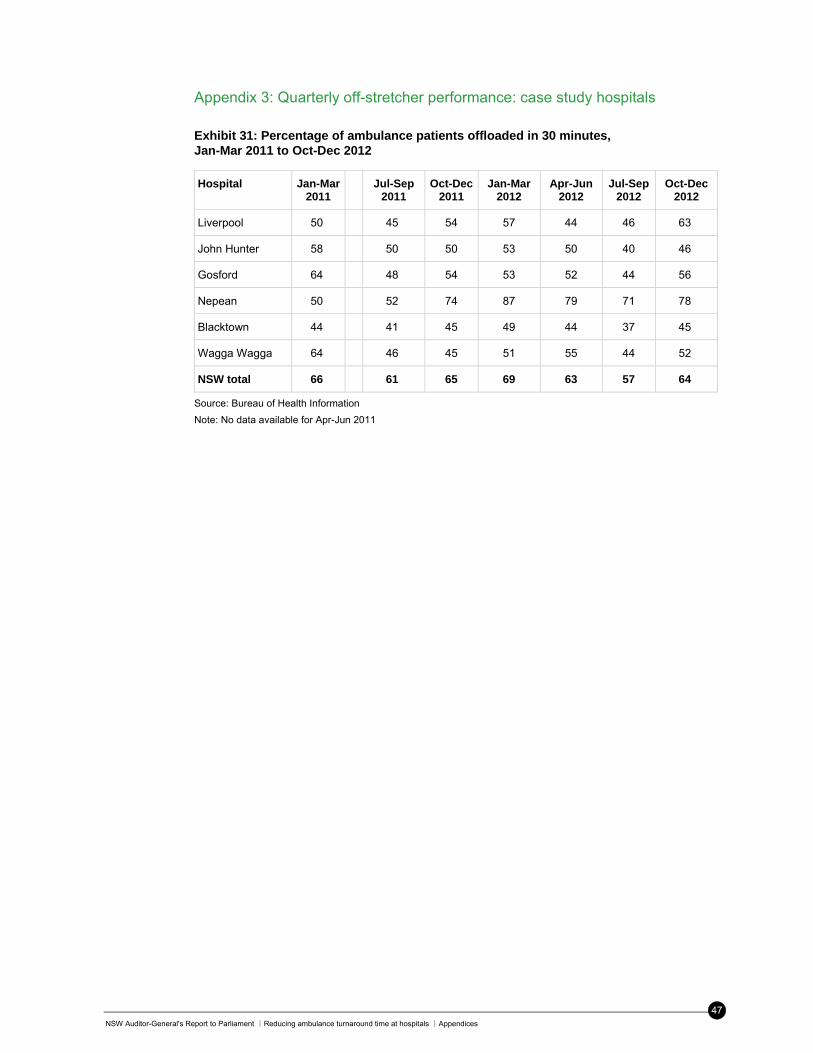
NSW Auditor-General's Report to Parliament ∣Reducing ambulance turnaround time at hospitals ∣Appendices
47
Appendix 3: Quarterly off-stretcher performance: case study hospitals
Exhibit 31: Percentage of ambulance patients offloaded in 30 minutes, Jan-Mar 2011 to Oct-Dec 2012
Hospital Jan-Mar 2011
Jul-Sep
2011 Oct-Dec
2011 Jan-Mar
2012 Apr-Jun
2012 Jul-Sep
2012 Oct-Dec
2012
Liverpool 50 45 54 57 44 46 63
John Hunter 58 50 50 53 50 40 46
Gosford 64 48 54 53 52 44 56
Nepean 50 52 74 87 79 71 78
Blacktown 44 41 45 49 44 37 45
Wagga Wagga 64 46 45 51 55 44 52
NSW total 66 61 65 69 63 57 64
Source: Bureau of Health Information
Note: No data available for Apr-Jun 2011
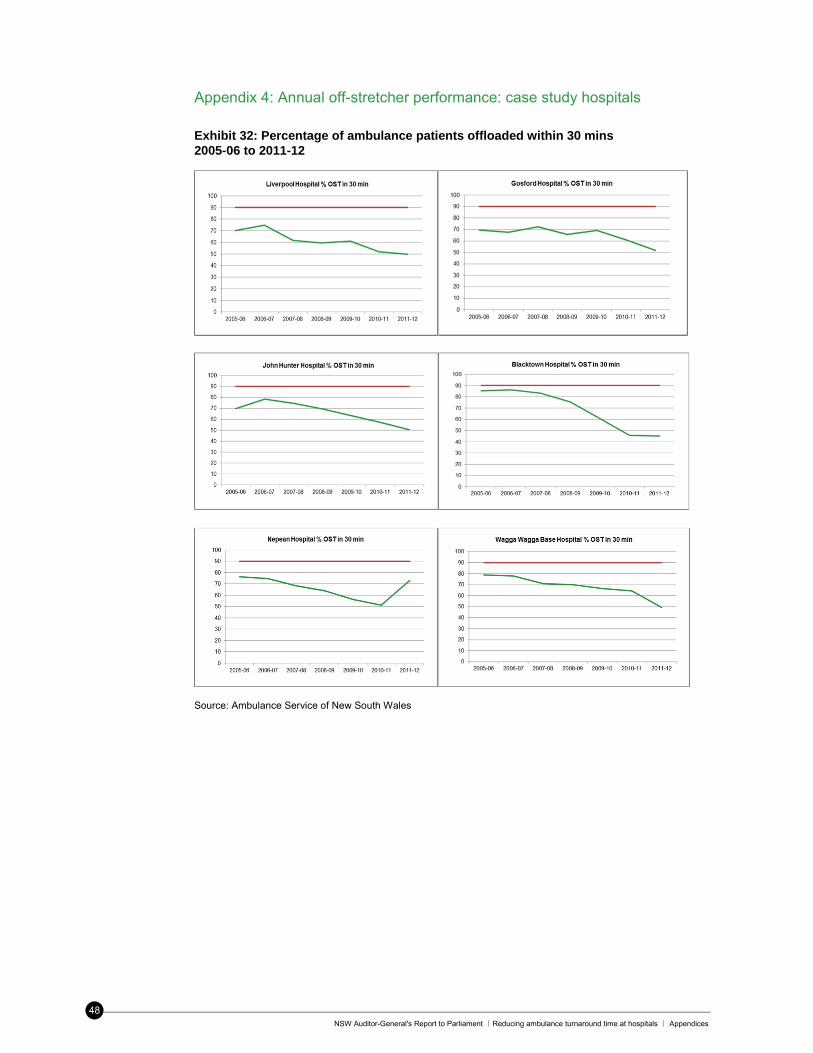
NSW Auditor-General's Report to Parliament ∣Reducing ambulance turnaround time at hospitals ∣ Appendices
48
Appendix 4: Annual off-stretcher performance: case study hospitals
Exhibit 32: Percentage of ambulance patients offloaded within 30 mins 2005-06 to 2011-12
Source: Ambulance Service of New South Wales
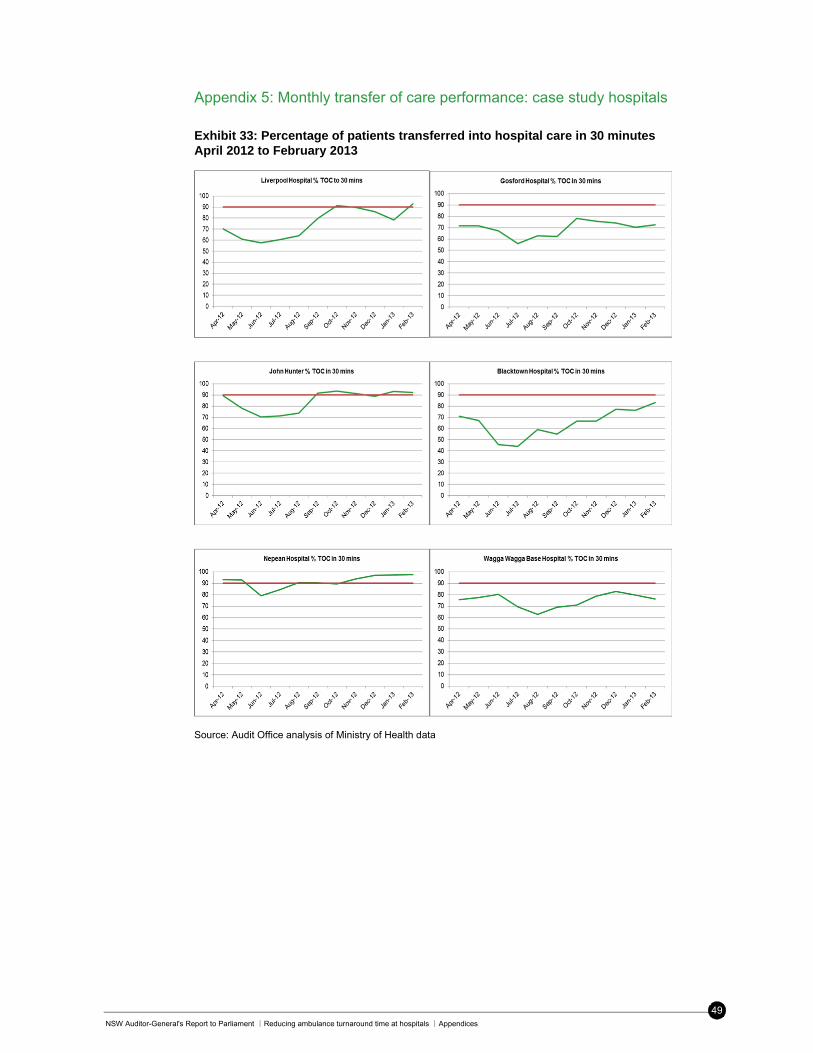
NSW Auditor-General's Report to Parliament ∣Reducing ambulance turnaround time at hospitals ∣Appendices
49
Appendix 5: Monthly transfer of care performance: case study hospitals
Exhibit 33: Percentage of patients transferred into hospital care in 30 minutes April 2012 to February 2013
Source: Audit Office analysis of Ministry of Health data
NSW Auditor-General’s Report to Parliament ∣Building energy use in NSW public hospitals ∣Performance auditing
50
Performance auditing
What are performance audits?
Performance audits determine whether an agency is carrying out its activities effectively, and doing so economically and efficiently and in compliance with all relevant laws.
The activities examined by a performance audit may include a government program, all or part of a government agency or consider particular issues which affect the whole public sector. They cannot question the merits of government policy objectives.
The Auditor-General’s mandate to undertake performance audits is set out in the Public Finance and Audit Act 1983.
Why do we conduct performance audits?
Performance audits provide independent assurance to parliament and the public.
Through their recommendations, performance audits seek to improve the efficiency and effectiveness of government agencies so that the community receives value for money from government services.
Performance audits also focus on assisting accountability processes by holding managers to account for agency performance.
Performance audits are selected at the discretion of the Auditor-General who seeks input from parliamentarians, the public, agencies and Audit Office research.
What happens during the phases of a performance
audit?
Performance audits have three key phases: planning, fieldwork and report writing. They can take up to nine months to complete, depending on the audit’s scope.
During the planning phase the audit team develops an understanding of agency activities and defines the objective and scope of the audit.
The planning phase also identifies the audit criteria. These are standards of performance against which the agency or program activities are assessed. Criteria may be based on best practice, government targets, benchmarks or published guidelines.
At the completion of fieldwork the audit team meets with agency management to discuss all significant matters arising out of the audit. Following this, a draft performance audit report is prepared.
The audit team then meets with agency management to check that facts presented in the draft report are accurate and that recommendations are practical and appropriate.
A final report is then provided to the CEO for comment. The relevant minister and the Treasurer are also provided with a copy of the final report. The report tabled in Parliament includes a response from the CEO on the report’s conclusion and recommendations. In multiple agency performance audits there may be responses from more than one agency or from a nominated coordinating agency.
Do we check to see if recommendations have been
implemented?
Following the tabling of the report in parliament, agencies are requested to advise the Audit Office on action taken, or proposed, against each of the report’s recommendations. It is usual for agency audit committees to monitor progress with the implementation of recommendations.
In addition, it is the practice of Parliament’s Public Accounts Committee (PAC) to conduct reviews or hold inquiries into matters raised in performance audit reports. The reviews and inquiries are usually held 12 months after the report is tabled. These reports are available on the parliamentary website.
Who audits the auditors?
Our performance audits are subject to internal and external quality reviews against relevant Australian and international standards.
Internal quality control review of each audit ensures compliance with Australian assurance standards. Periodic review by other Audit Offices tests our activities against best practice.
The PAC is also responsible for overseeing the performance of the Audit Office and conducts a review of our operations every four years. The review’s report is tabled in parliament and available on its website.
Who pays for performance audits?
No fee is charged for performance audits. Our performance audit services are funded by the NSW Parliament.
Further information and copies of reports
For further information, including copies of performance audit reports and a list of audits currently in-progress, please see our website www.audit.nsw.gov.au or contact us on 9275 7100.
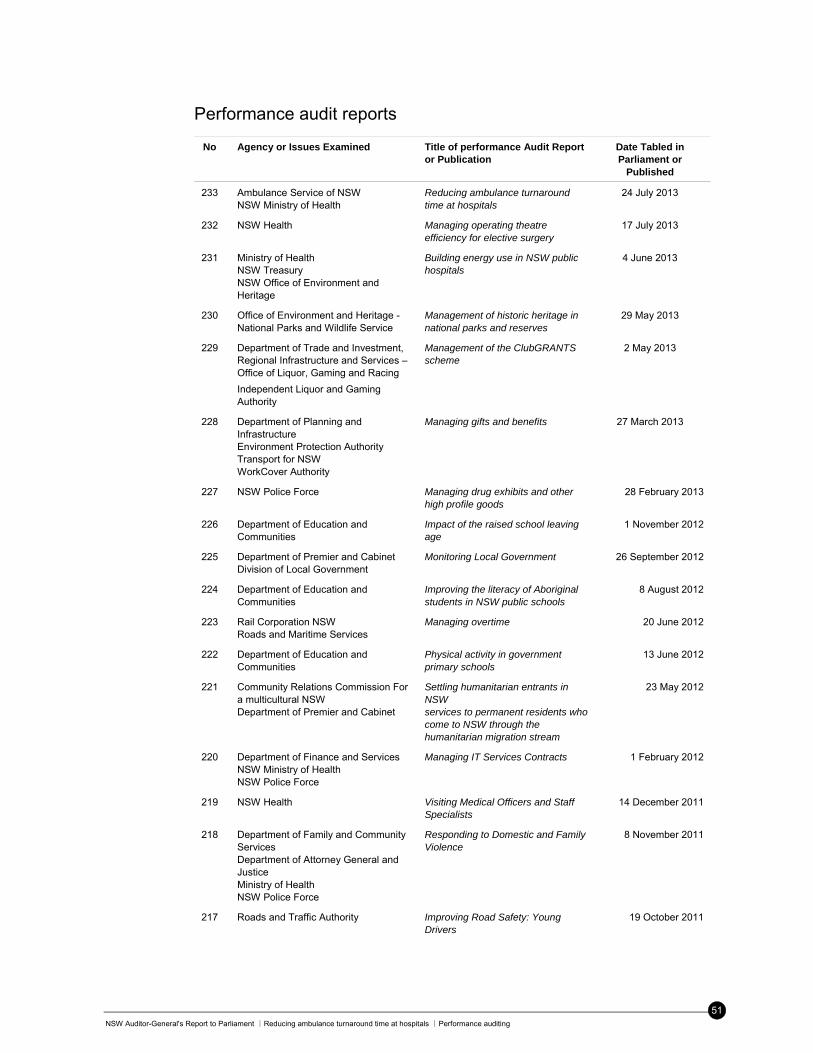
NSW Auditor-General's Report to Parliament ∣Reducing ambulance turnaround time at hospitals ∣Performance auditing
51
Performance audit reports
No Agency or Issues Examined Title of performance Audit Report or Publication
Date Tabled in Parliament or
Published
233 Ambulance Service of NSW NSW Ministry of Health
Reducing ambulance turnaround time at hospitals
24 July 2013
232 NSW Health Managing operating theatre efficiency for elective surgery
17 July 2013
231 Ministry of Health NSW Treasury NSW Office of Environment and Heritage
Building energy use in NSW public hospitals
4 June 2013
230 Office of Environment and Heritage - National Parks and Wildlife Service
Management of historic heritage in national parks and reserves
29 May 2013
229 Department of Trade and Investment, Regional Infrastructure and Services – Office of Liquor, Gaming and Racing
Independent Liquor and Gaming Authority
Management of the ClubGRANTS scheme
2 May 2013
228 Department of Planning and Infrastructure Environment Protection Authority Transport for NSW WorkCover Authority
Managing gifts and benefits 27 March 2013
227 NSW Police Force Managing drug exhibits and other high profile goods
28 February 2013
226 Department of Education and Communities
Impact of the raised school leaving age
1 November 2012
225 Department of Premier and Cabinet Division of Local Government
Monitoring Local Government 26 September 2012
224 Department of Education and Communities
Improving the literacy of Aboriginal students in NSW public schools
8 August 2012
223 Rail Corporation NSW Roads and Maritime Services
Managing overtime 20 June 2012
222 Department of Education and Communities
Physical activity in government primary schools
13 June 2012
221 Community Relations Commission For a multicultural NSW Department of Premier and Cabinet
Settling humanitarian entrants in NSW services to permanent residents who come to NSW through the humanitarian migration stream
23 May 2012
220 Department of Finance and Services NSW Ministry of Health NSW Police Force
Managing IT Services Contracts 1 February 2012
219 NSW Health Visiting Medical Officers and Staff Specialists
14 December 2011
218 Department of Family and Community Services Department of Attorney General and Justice Ministry of Health NSW Police Force
Responding to Domestic and Family Violence
8 November 2011
217 Roads and Traffic Authority Improving Road Safety: Young Drivers
19 October 2011
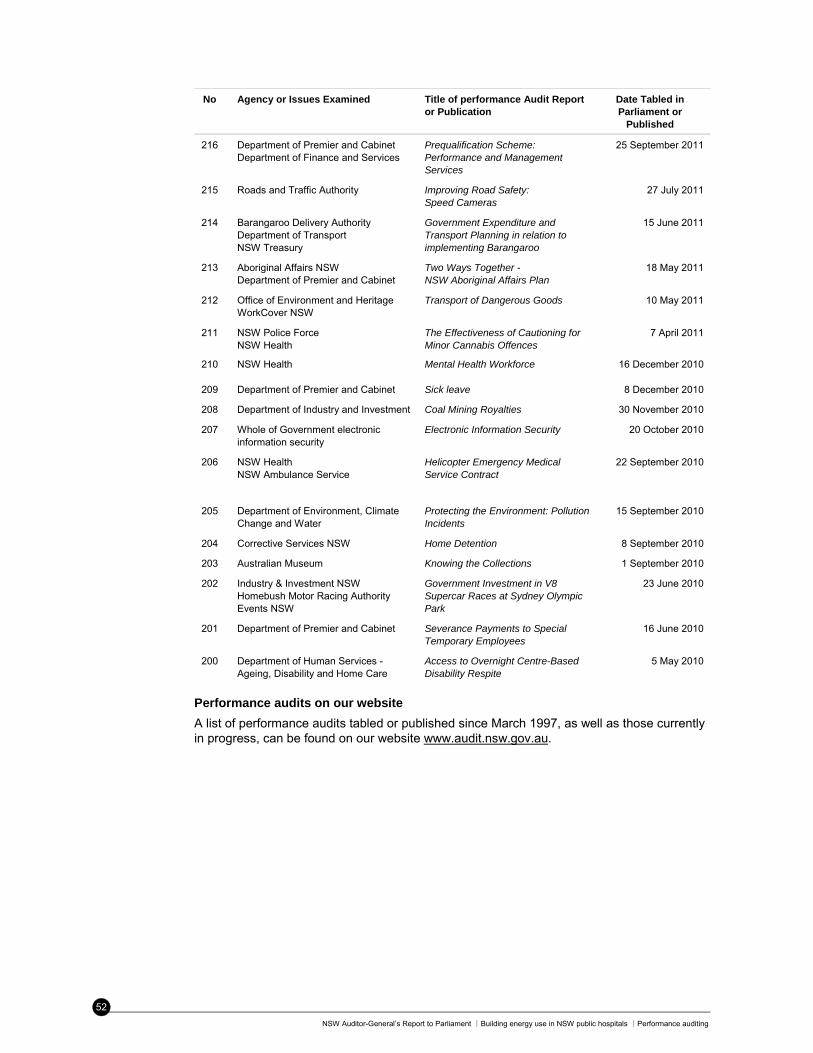
NSW Auditor-General’s Report to Parliament ∣Building energy use in NSW public hospitals ∣Performance auditing
52
No Agency or Issues Examined Title of performance Audit Report or Publication
Date Tabled in Parliament or
Published
216 Department of Premier and Cabinet Department of Finance and Services
Prequalification Scheme: Performance and Management Services
25 September 2011
215 Roads and Traffic Authority Improving Road Safety: Speed Cameras
27 July 2011
214 Barangaroo Delivery Authority Department of Transport NSW Treasury
Government Expenditure and Transport Planning in relation to implementing Barangaroo
15 June 2011
213 Aboriginal Affairs NSW Department of Premier and Cabinet
Two Ways Together - NSW Aboriginal Affairs Plan
18 May 2011
212 Office of Environment and Heritage WorkCover NSW
Transport of Dangerous Goods 10 May 2011
211 NSW Police Force NSW Health
The Effectiveness of Cautioning for Minor Cannabis Offences
7 April 2011
210 NSW Health Mental Health Workforce 16 December 2010
209 Department of Premier and Cabinet Sick leave 8 December 2010
208 Department of Industry and Investment Coal Mining Royalties 30 November 2010
207 Whole of Government electronic information security
Electronic Information Security 20 October 2010
206 NSW Health NSW Ambulance Service
Helicopter Emergency Medical Service Contract
22 September 2010
205 Department of Environment, Climate Change and Water
Protecting the Environment: Pollution Incidents
15 September 2010
204 Corrective Services NSW Home Detention 8 September 2010
203 Australian Museum Knowing the Collections 1 September 2010
202 Industry & Investment NSW Homebush Motor Racing Authority Events NSW
Government Investment in V8 Supercar Races at Sydney Olympic Park
23 June 2010
201 Department of Premier and Cabinet Severance Payments to Special Temporary Employees
16 June 2010
200 Department of Human Services - Ageing, Disability and Home Care
Access to Overnight Centre-Based Disability Respite
5 May 2010
Performance audits on our website
A list of performance audits tabled or published since March 1997, as well as those currently in progress, can be found on our website www.audit.nsw.gov.au.

Professional people with purpose
audit.nsw.gov.au
The role of the Auditor-GeneralThe roles and responsibilities of the Auditor- General, and hence the Audit Office, are set out in the Public Finance and Audit Act 1983.
Our major responsibility is to conduct financial or ‘attest’ audits of State public sector agencies’ financial statements. We also audit the Total State Sector Accounts, a consolidation of all agencies’ accounts.
Financial audits are designed to add credibility to financial statements, enhancing their value to end-users. Also, the existence of such audits provides a constant stimulus to agencies to ensure sound financial management.
Following a financial audit the Audit Office issues a variety of reports to agencies and reports periodically to parliament. In combination these reports give opinions on the truth and fairness of financial statements, and comment on agency compliance with certain laws, regulations and government directives. They may comment on financial prudence, probity and waste, and recommend operational improvements.
We also conduct performance audits. These examine whether an agency is carrying out its activities effectively and doing so economically and efficiently and in compliance with relevant laws. Audits may cover all or parts of an agency’s operations, or consider particular issues across a number of agencies.
Performance audits are reported separately, with all other audits included in one of the regular volumes of the Auditor-General’s Reports to Parliament – Financial Audits.
audit.nsw.gov.au
GPO Box 12Sydney NSW 2001
The Legislative AssemblyParliament HouseSydney NSW 2000
In accordance with section 38E of the Public Finance andAudit Act 1983, I present a report titled Reducing ambulance turnaround time at hospitals: Ambulance Service of NSW, NSW Ministry of Health.
Peter Achterstraat Auditor-General
24 July 2013
© Copyright reserved by the Audit Office of New South Wales. All rights reserved. No part of this publication may be reproduced without prior consent of the Audit Office of New South Wales.
The Audit Office does not accept responsibility for loss or damage suffered by any person acting on or refraining from action as a result of any of this material.
ISBN 978 1921252 730
Our visionTo make the people of New South Wales
proud of the work we do.
Our mission To perform high quality independent audits
of government in New South Wales.
Our values Purpose – we have an impact, are accountable, and work as a team.
People – we trust and respect others and have a balanced approach to work.
Professionalism – we are recognised for our independence and integrity
and the value we deliver.
The Legislative CouncilParliament HouseSydney NSW 2000

Professional people with purpose
Making the people of New South Wales proud of the work we do.
Level 15, 1 Margaret Street Sydney NSW 2000 Australia
t +61 2 9275 7100 f +61 2 9275 7200e [email protected] office hours 8.30 am–5.00 pm
audit.nsw.gov.au
New South Wales Auditor-General’s ReportPerformance Audit
Reducing ambulance turnaround time at hospitals Ambulance Service of NSWNSW Ministry of Health
New
South W
ales Aud
itor-G
eneral’s Rep
ort | P
erform
ance Aud
it | Red
ucing amb
ulance turnaround tim
e at hosp
itals233

![Food security and nutrition: building a global narrative ... · EXECUTIVE SUMMARY EXECUTIVE SUMMARY EXECUTIVE SUMMARY EXECUTIVE SUMMAR Y [ 2 ] This document contains the Summary and](https://img.pdfslide.us/doc/110x75/5ff5433612d22125fb06e6b5/food-security-and-nutrition-building-a-global-narrative-executive-summary-executive.jpg)