Embed Size (px)
Citation preview

SCHOOL DATA ANALYSIS
St. Tammany Parish Public Schools
Abney Early Childhood Center
1

School: Abney Early Childhood Center Student Information
List the number of students in each area Total at School
# of Grade 4 and above
Students with Disabilities
Gifted and Talented
504 Option III LEP Homeless Migrant
261 0 36 G 0 T 0 2 N/A 5 22 0
Student Enrollment IDEA (disabilities) 10.1.16 and MFP (gifted/talented) 2.1.17
Students with Disabilities, ages 3-5, By setting
List the number of students in each area A-1: In the regular early
childhood program at least 10 hrs/wk and major
services in regular class
A-2: In the regular early childhood program at least
10 hrs/wk and major services in other location
B-1: In the regular early childhood program less
than 10 hrs/wk and major services in regular class
B-2: In the regular early childhood program at least
10 hrs/wk and major services in other location
C-1: In early childhood special education-separate class (no reg. e.c. program)
20 14 0 0 0 C-2: In early childhood
special education-separate school (no reg. e.c.
program)
C-3: In early childhood special education-
residential facility (no reg. e.c. program)
D-1: No reg or special early childhood program-majority
of services in the home
D-2: No reg or special early childhood program and
receives majority of services at other location
Total: 35 0 0 0 1
SER (Special Education Reporting) New FAPE Counts 10.1.16
Students with Disabilities, ages 6-21, By setting
List the number of students in each area Inside the regular class 80%
or more of the day Inside the regular class no more than 79% of the day
and no less than 40% of the day
In the regular class less than 40% of the day
Separate School Residential Facility
1 Hospital/Homebound Correctional Facility
Parentally Placed Private
School
Total: 1
SER (Special Education Reporting) New FAPE Counts 10.1.16

SUBGROUPS BY ETHNICITY American Indian Asian Black Hispanic Hawaiian / Pacific
Islander White Multiple Races
(Non‐Hispanic)
ECONOMICALLY DISADVANTAGED PROFILE # of Free/Reduced Lunch Students:
Percent of Free/Reduced Lunch Students:
Abney Early Childhood Center
3

DIBELS TREND DATA
ABNEY EARLY CHILDHOOD
INTENSIVE STRATEGIC BENCHMARK INTENSIVE STRATEGIC BENCHMARK INTENSIVE STRATEGIC BENCHMARK INTENSIVE STRATEGIC BENCHMARK
Fall 2012 32% 16% 51% 49% 21% 31% 25% 11% 63% 27% 17% 56%
Spring 2013 4% 9% 87% 23% 19% 58% 30% 28% 42% 28% 18% 54%
-28% -7% 36% -26% -2% 27% 5% 17% -21% 1% 1% -2%
Fall 2013 27% 19% 54% 37% 18% 45% 28% 13% 59% 32% 10% 58%
Spring 2014 6% 13% 81% 28% 16% 56% 14% 14% 72% 24% 14% 61%
-21% -6% 27% -9% -2% 11% -14% 1% 13% -8% 4% 3%
Fall 2014 34% 23% 43% 21% 7% 72% 27% 12% 60% 21% 12% 67%
Spring 2015 10% 11% 80% 22% 14% 64% 16% 15% 69% 14% 22% 64%
-24% -12% 37% 1% 7% -8% -11% 3% 9% -7% 10% -3%
Fall 2015 20% 16% 64% 28% 8% 64% 15% 12% 73% 24% 9% 67%
Spring 2016 6% 11% 83% 26% 14% 59% 14% 19% 67% 18% 14% 68%
-14% -5% 19% -2% 6% -5% -1% 7% -6% -6% 5% 1%
Fall 2016 18% 14% 68% 18% 14% 68% 22% 10% 67% 16% 11% 73%
Spring 2017 7% 8% 85% 22% 17% 60% 19% 16% 65% 15% 12% 72%
-11% -6% 17% 4% 3% -8% -3% 6% -2% -1% 1% -1%
Fall 2017
Spring 2018
0% 0% 0% 0% 0% 0% 0% 0% 0% 0% 0% 0%
Fall 2018
Spring 2019
0% 0% 0% 0% 0% 0% 0% 0% 0% 0% 0% 0%
Fall 2019
Spring 2020
0% 0% 0% 0% 0% 0% 0% 0% 0% 0% 0% 0%
KINDERGARTEN FIRST GRADE SECOND GRADE THIRD GRADE

WHOLE SCHOOL SPS: CRT Index ( iLEAP/LEAP/EOC) Trend Data
Index Category
Index Year 1 2013
Index Year 2 2014
Index Year 3 2015
Index Year 4 2016
Index Year 5 2017
Index Year 6 2018
Index Year 7 2019
Index Year 8 2020
# of Students
Index Objective for Year One
ENGLISH / LANGUAGE ARTS 3rd Grade CRT Index: ELA 4th Grade CRT Index: ELA 5th Grade CRT Index: ELA 6th Grade CRT Index: ELA 7th Grade CRT Index: ELA 8th Grade CRT Index: ELA English II ‐ EOC English III ‐ EOC SCHOOL CRT INDEX: ELA
MATH 3rd Grade CRT Index: Math 4th Grade CRT Index: Math 5th Grade CRT Index: Math 6th Grade CRT Index: Math 7th Grade CRT Index: Math 8th Grade CRT Index: Math Algebra I ‐ EOC Geometry ‐ EOC SCHOOL CRT INDEX: MATH
Abney Early Childhood Center
8

WHOLE SCHOOL SPS: CRT Index ( iLEAP/LEAP/EOC) Trend Data (continued)
Index Category
Index Year 1 2013
Index Year 2 2014
Index Year 3 2015
Index Year 42016
Index Year 5 2017
Index Year 6 2018
Index Year 7 2019
Index Year 8 2020
# of Students
Index Objective for Year One
SCIENCE 3rd Grade CRT Index: Science 4th Grade CRT Index: Science 5th Grade CRT Index: Science 6th Grade CRT Index: Science 7th Grade CRT Index: Science 8th Grade CRT Index: Science Biology ‐ EOC SCHOOL CRT INDEX: SCIENCE
SOCIAL STUDIES 3rd Grade CRT Index: Social Studies 4th Grade CRT Index: Social Studies 5th Grade CRT Index: Social Studies 6th Grade CRT Index: Social Studies 7th Grade CRT Index: Social Studies 8th Grade CRT Index: Social Studies American History ‐ EOC SCHOOL CRT INDEX: SOCIAL STUDIES
Abney Early Childhood Center
9

WHOLE SCHOOL SPS: CRT Index ( iLEAP/LEAP/EOC) Trend Data (continued)
Index Category
Index Year 1 2013
Index Year 2 2014
Index Year 3 2015
Index Year 4 2016
Index Year 5 2017
Index Year 6 2018
Index Year 7 2019
Index Year 8 2020
# of Students
Index Objective for Year One
ALL SUBJECTS 3rd Grade CRT Index: All Subjects 4th Grade CRT Index: All Subjects 5th Grade CRT Index: All Subjects 6th Grade CRT Index: All Subjects 7th Grade CRT Index: All Subjects 8th Grade CRT Index: All Subjects HS Grade CRT Index: All Subjects School CRT Index: All Subjects
WHOLE SCHOOL SPS: CRT Index ( iLEAP/LEAP/EOC) Trend Data
Index Category
Index Year 1 2013
Index Year 2 2014
Index Year 3 2015
Index Year 4 2016
Index Year 5 2017
Index Year 6 2018
Index Year 7 2019
Index Year 8 2020
# of Students
Index Objective for Year One
ALL SUBJECTS School CRT Index: ELA School CRT Index: Math School CRT Index: Science School CRT Index: Social Studies
Abney Early Childhood Center
10
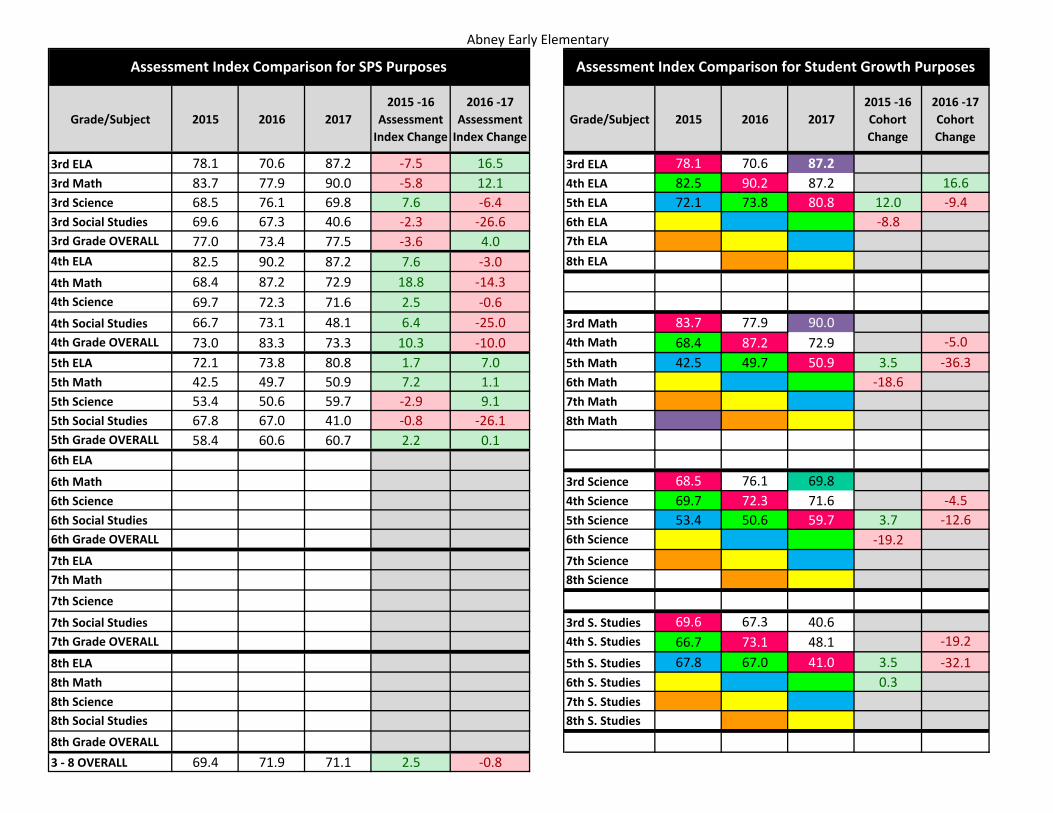
Abney Early Elementary
Grade/Subject 2015 2016 20172015 ‐16
Assessment Index Change
2016 ‐17 Assessment Index Change
Grade/Subject 2015 2016 20172015 ‐16 Cohort Change
2016 ‐17 Cohort Change
3rd ELA 78.1 70.6 87.2 ‐7.5 16.5 3rd ELA 78.1 70.6 87.23rd Math 83.7 77.9 90.0 ‐5.8 12.1 4th ELA 82.5 90.2 87.2 16.63rd Science 68.5 76.1 69.8 7.6 ‐6.4 5th ELA 72.1 73.8 80.8 12.0 ‐9.43rd Social Studies 69.6 67.3 40.6 ‐2.3 ‐26.6 6th ELA ‐8.83rd Grade OVERALL 77.0 73.4 77.5 ‐3.6 4.0 7th ELA4th ELA 82.5 90.2 87.2 7.6 ‐3.0 8th ELA
4th Math 68.4 87.2 72.9 18.8 ‐14.34th Science 69.7 72.3 71.6 2.5 ‐0.64th Social Studies 66.7 73.1 48.1 6.4 ‐25.0 3rd Math 83.7 77.9 90.04th Grade OVERALL 73.0 83.3 73.3 10.3 ‐10.0 4th Math 68.4 87.2 72.9 ‐5.05th ELA 72.1 73.8 80.8 1.7 7.0 5th Math 42.5 49.7 50.9 3.5 ‐36.35th Math 42.5 49.7 50.9 7.2 1.1 6th Math ‐18.65th Science 53.4 50.6 59.7 ‐2.9 9.1 7th Math5th Social Studies 67.8 67.0 41.0 ‐0.8 ‐26.1 8th Math5th Grade OVERALL 58.4 60.6 60.7 2.2 0.16th ELA
6th Math 3rd Science 68.5 76.1 69.86th Science 4th Science 69.7 72.3 71.6 ‐4.56th Social Studies 5th Science 53.4 50.6 59.7 3.7 ‐12.66th Grade OVERALL 6th Science ‐19.27th ELA 7th Science7th Math 8th Science
7th Science
7th Social Studies 3rd S. Studies 69.6 67.3 40.67th Grade OVERALL 4th S. Studies 66.7 73.1 48.1 ‐19.28th ELA 5th S. Studies 67.8 67.0 41.0 3.5 ‐32.18th Math 6th S. Studies 0.38th Science 7th S. Studies8th Social Studies 8th S. Studies
8th Grade OVERALL3 ‐ 8 OVERALL 69.4 71.9 71.1 2.5 ‐0.8
Assessment Index Comparison for Student Growth PurposesAssessment Index Comparison for SPS Purposes

ACHIEVEMENT LEVEL SCALE SCORE RANGES
Unsatisfactory Approaching Basic Basic Mastery Advanced
English Language Arts 650-699 700-724 725-749 750-809 810-850Mathematics 650-699 700-724 725-749 750-789 790-850
Scaled Score Averages
English Language Arts Mathematics
Advanced
Mastery
Basic
Approaching Basic
Unsatisfactory
Advanced
Mastery
Basic
Approaching Basic
Unsatisfactory
Strong (S)
Moderate (M)
Weak (W)
Strong (S)
Moderate (M)
Weak (W)
Ach
iev
em
en
t L
ev
el
% a
t E
ach
Ach
iev
em
en
t L
ev
el
Rati
ng
Ach
iev
em
en
t L
ev
el
% a
t E
ach
Ach
iev
em
en
t L
ev
el
Rati
ng
Read
ing
Perf
orm
an
ce
Litera
ry T
ext
Info
rmational T
ext
Vocabula
ry
Wri
tin
g P
erf
orm
an
ce
Written E
xpre
ssio
n
Know
ledge &
Use o
f Language
Conventions
ReadingSubclaims
WritingSubclaims
Majo
r C
onte
nt
Additio
nal &
Support
ing C
onte
nt
Expre
ssin
gM
ath
em
atical
Reasonin
g
Modelin
g &
Applic
ation
Mathematics Subclaims
6
35
34
18
8
8
40
27
16
9
43
32
25
41
33
27
39
18
43
47
19
34
47
22
32
24
26
50
32
39
29
48
25
27
45
20
35
48
23
30
49
23
29
SchoolRoster
LEAP 2025English Language Arts and Mathematics
Spring 2017
Grade: 03 School: 003 W.L. Abney Elementary School
School System: 052 St. Tammany Parish
Percent of Students at Each Achievement Level and Rating by Claim/Subclaim
English Language Arts Mathematics
School Average (All Students): 745 745
* Tests that are voided due to test irregularities are not reported.They are included in the total participation count but not includedin the school, school system, or state averages.
Page 1

ACHIEVEMENT LEVEL SCALE SCORE RANGES
Unsatisfactory Approaching Basic Basic Mastery Advanced
English Language Arts 650-699 700-724 725-749 750-789 790-850Mathematics 650-699 700-724 725-749 750-795 796-850
Scaled Score Averages
English Language Arts Mathematics
Advanced
Mastery
Basic
Approaching Basic
Unsatisfactory
Advanced
Mastery
Basic
Approaching Basic
Unsatisfactory
Strong (S)
Moderate (M)
Weak (W)
Strong (S)
Moderate (M)
Weak (W)
Ach
iev
em
en
t L
ev
el
% a
t E
ach
Ach
iev
em
en
t L
ev
el
Rati
ng
Ach
iev
em
en
t L
ev
el
% a
t E
ach
Ach
iev
em
en
t L
ev
el
Rati
ng
Read
ing
Perf
orm
an
ce
Litera
ry T
ext
Info
rmational T
ext
Vocabula
ry
Wri
tin
g P
erf
orm
an
ce
Written E
xpre
ssio
n
Know
ledge &
Use o
f Language
Conventions
ReadingSubclaims
WritingSubclaims
Majo
r C
onte
nt
Additio
nal &
Support
ing C
onte
nt
Expre
ssin
gM
ath
em
atical
Reasonin
g
Modelin
g &
Applic
ation
Mathematics Subclaims
3
37
35
18
6
1
25
41
26
8
39
39
21
48
27
25
41
26
34
39
32
28
35
33
32
32
36
32
34
36
31
24
34
42
34
14
53
31
32
38
36
22
42
SchoolRoster
LEAP 2025English Language Arts and Mathematics
Spring 2017
Grade: 04 School: 003 W.L. Abney Elementary School
School System: 052 St. Tammany Parish
Percent of Students at Each Achievement Level and Rating by Claim/Subclaim
English Language Arts Mathematics
School Average (All Students): 743 734
* Tests that are voided due to test irregularities are not reported.They are included in the total participation count but not includedin the school, school system, or state averages.
Page 1

ACHIEVEMENT LEVEL SCALE SCORE RANGES
Unsatisfactory Approaching Basic Basic Mastery Advanced
English Language Arts 650-699 700-724 725-749 750-798 799-850Mathematics 650-699 700-724 725-749 750-789 790-850
Scaled Score Averages
English Language Arts Mathematics
Advanced
Mastery
Basic
Approaching Basic
Unsatisfactory
Advanced
Mastery
Basic
Approaching Basic
Unsatisfactory
Strong (S)
Moderate (M)
Weak (W)
Strong (S)
Moderate (M)
Weak (W)
Ach
iev
em
en
t L
ev
el
% a
t E
ach
Ach
iev
em
en
t L
ev
el
Rati
ng
Ach
iev
em
en
t L
ev
el
% a
t E
ach
Ach
iev
em
en
t L
ev
el
Rati
ng
Read
ing
Perf
orm
an
ce
Litera
ry T
ext
Info
rmational T
ext
Vocabula
ry
Wri
tin
g P
erf
orm
an
ce
Written E
xpre
ssio
n
Know
ledge &
Use o
f Language
Conventions
ReadingSubclaims
WritingSubclaims
Majo
r C
onte
nt
Additio
nal &
Support
ing C
onte
nt
Expre
ssin
gM
ath
em
atical
Reasonin
g
Modelin
g &
Applic
ation
Mathematics Subclaims
1
36
34
20
8
0
18
28
35
19
38
35
27
39
26
35
34
32
34
38
32
30
35
35
30
31
26
43
38
31
31
19
28
52
16
14
70
25
21
55
25
19
57
SchoolRoster
LEAP 2025English Language Arts and Mathematics
Spring 2017
Grade: 05 School: 003 W.L. Abney Elementary School
School System: 052 St. Tammany Parish
Percent of Students at Each Achievement Level and Rating by Claim/Subclaim
English Language Arts Mathematics
School Average (All Students): 740 723
* Tests that are voided due to test irregularities are not reported.They are included in the total participation count but not includedin the school, school system, or state averages.
Page 1

SUBGROUP: Percent Proficient Trend Data (Whole School)
Category Year 1 2013
Year 2 2014
Year 3 2015
Year 4 2016
Year 5 2017
Year 6 2018
Year 7 2019
Year 8 2020
# of Students
Proficiency Goal for Year One
ENGLISH / LANGUAGE ARTS – Whole School
SchoolTwo or More RacesAsian/Pacific IslanderBlackHispanicWhiteLimited English ProficientEconomically DisadvantagedStudents with DisabilitiesMATH – Whole School
School Two or More Races Asian/Pacific Islander Black Hispanic White Limited English Proficient Economically Disadvantaged Students with Disabilities
Abney Early Childhood Center
11

SUBGROUP: Percent Proficient Trend Data (Grade 3)
Category Year 1 2013
Year 2 2014
Year 3 2015
Year 4 2016
Year 5 2017
Year 6 2018
Year 7 2019
Year 8 2020
# of Students
Proficiency Goal for Year One
ENGLISH / LANGUAGE ARTS – Grade 3
SchoolTwo or More RacesAsian/Pacific IslanderBlackHispanicWhiteLimited English ProficientEconomically DisadvantagedStudents with DisabilitiesMATH – Grade 3
School Two or More Races Asian/Pacific Islander Black Hispanic White Limited English Proficient Economically Disadvantaged Students with Disabilities
Abney Early Childhood Center
12

SUBGROUP: Percent Proficient Trend Data (Grade 4)
Category Year 1 2013
Year 2 2014
Year 3 2015
Year 4 2016
Year 5 2017
Year 6 2018
Year 7 2019
Year 8 2020
# of Students
Proficiency Goal for Year One
ENGLISH / LANGUAGE ARTS – Grade 4
SchoolTwo or More RacesAsian/Pacific IslanderBlackHispanicWhiteLimited English ProficientEconomically DisadvantagedStudents with DisabilitiesMATH – Grade 4
School Two or More Races Asian/Pacific Islander Black Hispanic White Limited English Proficient Economically Disadvantaged Students with Disabilities
Abney Early Childhood Center
13

SUBGROUP: Percent Proficient Trend Data (Grade 5)
Category Year 1 2013
Year 2 2014
Year 3 2015
Year 4 2016
Year 5 2017
Year 6 2018
Year 7 2019
Year 8 2020
# of Students
Proficiency Goal for Year One
ENGLISH / LANGUAGE ARTS – Grade 5
SchoolTwo or More RacesAsian/Pacific IslanderBlackHispanicWhiteLimited English ProficientEconomically DisadvantagedStudents with DisabilitiesMATH – Grade 5
School Two or More Races Asian/Pacific Islander Black Hispanic White Limited English Proficient Economically Disadvantaged Students with Disabilities
Abney Early Childhood Center
14

SCHOOL PERFORMANCE SCORES
School Performance Scores represents student performance including important indicators of assessment and readiness, graduation, diploma strength, and progress.
ELEMENTARY and MIDDLE SCHOOLS ‐ SCHOOL PERFORMANCE SCORE
K‐ 8 ASSESSMENTS
• Elementary and middle schools earn points for student achievement on annual assessments in English Language Arts, Math, Science, and Social Studies. (In order toensure a steady formula during the 15‐16 Social Studies Field Test year, either the 13‐14 or 14‐15 Social Studies assessment index, whichever results in the higher scorewill be carried forward).
• In schools with grades K‐7, 100% of the school grade is based on student achievement on annual assessments in English Language Arts, Math, Science, and SocialStudies, plus Progress Points.
• In schools with grade 8, 95% of the school grade is based on student achievement on annual assessments in English Language Arts, Math, Science, and Social Studies,plus 5% based on the number of students who accumulate enough credits for high school by the end of 9th grade, plus Progress Points.
• Total points are divided by the total number of tests to calculate the School Performance Score.
LEAP Achievement Level LAA 1 Achievement Level Points Per StudentAdvanced Exceeds Standard 150Mastery ‐‐‐‐ 125Basic Meets Standard 100Approaching Basic/ Unsatisfactory
Working Towards Standard 0
Abney Early Childhood Center
15

8th GRADE ‐ DROPOUT/CREDIT ACCUMULATION INDEX (DCAI)
• Schools with 8th grade also earn points for the number of Carnegie Credits each student accumulates by the end of 9th grade. Total points are divided by the number ofstudents to calculate a school average. These points comprise 5 % of the school grade.
• The Dropout/Credit Accumulation Index (DCAI) encourages successful transition to high school, as well as access to Carnegie credits in middle school.• To count toward DCAI, students must be full academic year in 8th and 9th grade (or transitional 9th, if applicable), if earning Carnegie credits.• Students transferring public school districts between 8th and 9th grade are still eligible to earn points for DCAI.
Course Credits Points Per Student6 150 5.5 125 5 100 4.5 75 4 50 3.5 25 3 or less 0 3rd year 8th grade student 0 Dropout 0
K‐8 PROGRESS POINTS
Schools may earn up to 10 progress points for prior year non‐proficient students who exceed their expected score.
Consideration Policy Eligible Students School must have 10+ students with school‐level VAM scores who were non‐proficient in prior year in
Math, ELA or both. Required Success Rate Schools must have 50.01% or more of the eligible students exceed their expected score in Math, ELA,
or both Reward Schools will receive .1 for students scoring Unsatisfactory in prior year and .05 for students scoring
Approaching Basic in prior year who exceed expectations in current year.
Abney Early Childhood Center
16

HIGH SCHOOL ‐ SCHOOL PERFORMANCE SCORE
For schools with grades 9‐12, the accountability system includes two indices based on student assessment performance (EOC and ACT), two indices based on graduation (Cohort Graduation Rate and Strength of Diploma), as well as the ability to earn progress points.
• ACT 25% Schools earn points for the highest ACT composite score earned by a student through the April testing date of their senior year.Beginning in 2015‐2016, either the ACT or WorkKeys score, whichever results in more points, will be included in the ACT index for accountability.An excerpt of the table for ACT and WorkKeys is included here. The complete table is available in Bulletin 111.
ACT Score WorkKeys Certificate Points Per Student36 150.4 (maximum)31 Platinum 136.427 125.224 Gold 116.823 114.020 105.618 Silver 100.017 or below 0
• END‐OF‐COURSE (EOC) TESTS 25% All high school students enrolled in courses with an EOC test must take the test to earn credit for the course. EOC tests are administered for Algebra I,Geometry, English II, English III, Biology, and American History.Schools earn points for students who score Good or Excellent on each EOC test.All high school students except those participating in LAA 1 are required to take an ELA and Math EOC exam by their 3rd cohort year.
End‐Of‐Course Exam Score Points Per Student
Excellent 150Good (Proficient) 100Fair or Needs Improvement (Non‐Proficient) 0
Abney Early Childhood Center
17

• GRADUATION INDEX – STRENGTH OF DIPLOMA 25% The graduation index measures the quality of the diploma earned by each 12th grader.
Quality of Diploma (Graduation Index): Student Results Points Awarded Per Student HS Diploma plus
(a) AP score of 3 or higher, IB score of 4 or higher, or CLEP score of 50 or higher; OR(b) Advanced statewide Jump Start credential
*Students achieving both (a) and (b) will generate 160 points.
150
HS Diploma plus (a) At least one passing course grade for TOPS core curriculum credit of the following type: AP** (with exam score of 1 or 2), college credit,
dual enrollment, or IB (with score of 1, 2, or3); OR(b) Basic statewide Jump Start credential
*Students achieving both (a) and (b) will generate 115 points, if the passing course grade for (a) is earned in a TOPS core curriculum course.**Students must take the AP exam and pass the course.
110
Diploma – Four‐Year Graduate (Includes Career Diploma student with regional Jump Start credential)
100
Five‐ Year Graduate with any diploma *Five‐year graduates who earn an AP score of 3 or higher, an IB score of 4 or higher, or a CLEP of 50 or higher will generate 140 points.
75
Six‐Year Graduate with any diploma 50HiSET / GED 25Drop‐Out – Non‐graduate without HiSET 0
• COHORT GRADUATION RATE (CGR) 25%The Cohort Graduation Rate reflects the percentage of students who enter 9th grade and graduate four years later.Schools earn points for the percent of students who graduate from high school within four years. This rate is calculated by dividing the number ofstudents who graduate by the number of students who entered 9th grade four years earlier.All 9th graders who enter a graduation cohort are included in calculations of the cohort graduation rate.Transitional 9th: Students will enter into the first‐time ninth grade cohort in the year that follows the transitional 9th grade. If students in transitional9th dropout of school, they will be included as dropouts in cohort graduation rate calculations.
Cohort Graduation Rate (CGR) Formula 0 to 60 percent graduation rate CGR x 1.16666761 to 100 percent graduation rate (CGR x 2.0) ‐ 50
• HS PROGRESS POINTS ‐ Schools may earn up to 10 progress points for prior year non‐proficient students who exceed their expected score.Consideration Policy
Multiple Opportunities Schools can earn points on either EXPLORE to PLAN and/or PLAN to ACT.Eligible Students School must have 10+ students in the grade that were nonproficient on either their most recent Math or ELA state assessment. Required Success Rate Schools must have 50.01% or more of the eligible students score above the median of the expected range.Reward Schools will receive .1 for students scoring Unsatisfactory/Needs Improvement in prior year and .05 for students scoring
Approaching Basic/Fair in prior year who score above the median of the expected range.
Abney Early Childhood Center
18

SPS Trend Data
The standard SPS range (without the adjustment for distribution) is included below:
2012‐13 2013‐14 2014‐15 2015‐16 2016‐17 2017‐18 2018‐19 2019‐20
A 100.0 – 150.0
B 85.0 – 99.9
C 70.0 – 84.9
D 50.0 – 69.9
F Below 50.0
Abney Early Childhood Center
19

DIBELS TREND DATA ANALYSIS
• Look for the percent of students performing at the lowest levels / highest levels in the spring DIBELS testing across years (DIBELS – At Risk / Benchmark).
Grade Levels with the highest At Risk percentages in spring testing across years:
Grade Levels with the highest Benchmark percentages in spring testing across years:
• Compare fall to spring results and note any persistent declines / improvements. Persistent Declines from fall to spring:
Persistent Improvements from fall to spring:
• Is there is a consistent grade level that has had the highest / lowest percentages of At Risk or Benchmark? This should be noted as a potential strength / weakness.
Grade Level with the lowest percentage of At Risk or highest percentage of Benchmark? (Potential Strength)
Grade Level with the highest percentage of At Risk or lowest percentage of Benchmark? (Potential Weakness)
Step 1: Identify Weakest / Strongest Grade Levels in DIBELS
Abney Early Childhood Center
20

WHOLE SCHOOL TREND DATA ANALYSIS This document provides suggested steps for evaluating school data across several years. The steps do not cover all possible data analyses, but they are intended to help uncover potential target areas for school improvement.
• Examine your school’s current year indexes in the chart below. • Highlight the lowest index scores in pink and your highest index scores in green. • Schools that do not have 8th Grade or High School Grades will only have a CRT index, so they will be unable to compare indexes except to
compare their CRT index from one year to the next. School Index 2012‐13 2013‐14 2014‐15 2015‐16 2016‐17 2017‐18 2018‐19 2019‐20 CRT Accumulated 9th Grade Credits (8th Grade Only) ACT EOC Graduation Index Cohort Graduation Rate
• Indicate your school’s lowest index score and highest index score across all areas for the current year. Highest Index Score:
Lowest Index Score:
• Was this “current index weakness / strength” caused by a variety of factors (For example: “good class/bad class” syndrome, excessive absences from a flu epidemic, etc.)? It is possible that this weakness does not necessarily reflect an immediate school improvement concern for the school.
• If the current year lowest / highest index score has been low or high for the past few years (For example: 2012‐2015), then it should be noted as a potential weakness / potential strength regardless of noted factors identified above:
Highest Index Scores for past few years? (Potential Strength)
Lowest Index Scores for past few years? (Potential Weakness)
Step 2: Identify Weakest / Strongest School Index Areas for Current Year
Abney Early Childhood Center
21

• Examine your School Performance Score (SPS) trends for the past few years. Place an up arrow ( ) when the data indicates an increasefrom one year to the next and place a down arrow ( ) when the data decreased from one year to the next.
• Has your SPS declined / improved over the past year or two? Highlight declining trends in pink, and highlight improving trends in green.Identify SPS declines / improvements and the amount of decrease/increase.
Improvements in SPS (Potential Strength):
Declines in SPS (Potential Weakness):
• Examine your school’s SPS Indexes in the chart below.• Place an up arrow ( ) when the data increased from one year to the next and place a down arrow ( ) when the data decreased from one
year to the next.School SPS Index 2012‐13 2013‐14 2014‐15 2015‐16 2016‐17 2017‐18 2018‐19 2019‐20 CRTAccumulated 9th Grade Credits (8th Grade Only)ACTEOCGraduation IndexCohort Graduation Rate
• Has your SPS Index declined / improved over the past few years? Highlight declining trends in pink, and highlight improving trends in green.Identify SPS Index declines / improvements and the amount of decrease/increase.
Improvements in SPS Index Scores? (Potential Strength)
Declines in SPS Index Scores? (Potential Weakness)
2012‐13 2013‐14 2014‐15 2015‐16 2016‐17 2017‐18 2018‐19 2019‐20 SPS
Step 3: Identify Any Declining / Improving Trends for Whole SchoolAbney Early Childhood Center
22

• Examine your WHOLE SCHOOL SPS: CRT Index (iLEAP/LEAP/EOC) Trend Data for the last few years.• Place an up arrow ( ) when the data increased from one year to the next and place a down arrow ( ) when the data decreased from one
year to the next.
CRT Index Trends 2012‐13 2013‐14 2014‐15 2015‐16 2016‐17 2017‐18 2018‐19 2019‐20 Grade 3 ELA Grade 3 Math Grade 3 Science Grade 3 Social Studies
CRT Index Trends 2012‐13 2013‐14 2014‐15 2015‐16 2016‐17 2017‐18 2018‐19 2019‐20 Grade 4 ELA Grade 4 Math Grade 4 Science Grade 4 Social Studies
CRT Index Trends 2012‐13 2013‐14 2014‐15 2015‐16 2016‐17 2017‐18 2018‐19 2019‐20 Grade 5 ELA Grade 5 Math Grade 5 Science Grade 5 Social Studies
CRT Index Trends 2012‐13 2013‐14 2014‐15 2015‐16 2016‐17 2017‐18 2018‐19 2019‐20 Grade 6 ELA Grade 6 Math Grade 6 Science Grade 6 Social Studies
Abney Early Childhood Center
23

CRT Index Trends 2012‐13 2013‐14 2014‐15 2015‐16 2016‐17 2017‐18 2018‐19 2019‐20 Grade 7 ELA Grade 7 Math Grade 7 Science Grade 7 Social Studies
CRT Index Trends 2012‐13 2013‐14 2014‐15 2015‐16 2016‐17 2017‐18 2018‐19 2019‐20 Grade 8 ELA Grade 8 Math Grade 8 Science Grade 8 Social Studies
CRT Index Trends 2012‐13 2013‐14 2014‐15 2015‐16 2016‐17 2017‐18 2018‐19 2019‐20 HS English II HS English III HS Algebra I HS Geometry HS Biology HS American History
• Has a particular grade level or subject area on the CRT declined/improved over the past few years? Highlight declining CRT areas in pink,and highlight improving CRT areas in green. Indicate the grade / subject area and the amount of decline and/or improvement across years.
CRT Index Areas of Improvement (Potential Strength):
CRT Index Areas of Decline (Potential Weakness):
Abney Early Childhood Center
24

• Examine your school’s Discipline Data. Place an up arrow ( ) when the suspension / expulsion level increased from one year to the next,and place a down arrow ( ) when the level decreased from one year to the next.
Suspensions 2012‐13 2013‐14 2014‐15 2015‐16 2016‐17 2017‐18 2018‐19 2019‐20 Grade GradeGradeGradeGradeGradeGradeTotal Suspension Rate
Expulsions 2012‐13 2013‐14 2014‐15 2015‐16 2016‐17 2017‐18 2018‐19 2019‐20 Grade GradeGradeGradeGradeGradeGradeTotal Expulsion Rate
• Has a particular grade had an increase in suspensions and/or expulsions over the past year or two? Highlight declining discipline areas ingreen, and highlight increasing discipline areas in pink. Indicate the grade and the amount of increase or decrease below.
Abney Early Childhood Center
25

• Follow this same procedure to analyze trends in ACT Data, if applicable to your school. Place an up arrow ( ) when the ACT improved fromone year to the next, and place a down arrow ( ) when the ACT declined from one year to the next.
2012‐13 2013‐14 2014‐15 2015‐16 2016‐17 2017‐18 2018‐19 2019‐20 ACT
• Highlight any improving trends from ACT data over the past year or two in green. Highlight any declining trends in ACT data over the pastyear or two in pink. Indicate the amount of improvement or decline or the past few years.
• NOTE: Some declining / improving trends may be the result of population shifts and may not necessarily reflect problematic areas.
• Look at the highlighted areas in this Step 3 section on Declining / Improving Trends. Summarize the specific areas that have steadilyimproved over recent years (highlighted in green), these should be identified as potential strengths below. Summarize the specific areasthat have steadily declined over recent years (highlighted in pink), these should be identified as potential weaknesses below.
Areas Showing Improvement Over Recent Years (Potential Strength):
Areas Showing Declines Over Recent Years (Potential Weakness):
Abney Early Childhood Center
26

• Examine the CRT indexes for each grade level and subject area for each year listed.• In each row, highlight the lowest score in green and the highest score in orange, for each year listed.• In each column, highlight the lowest score in pink and the highest score in yellow, for each year listed.
2012‐13Grade Level Subject Area
3rd 4th 5th 6th 7th 8th HS
ELA Math Science Social Studies English II English III Algebra I Geometry Biology American History
2013‐14Grade Level Subject Area
3rd 4th 5th 6th 7th 8th HS
ELA Math Science Social Studies English II English III Algebra I Geometry Biology American History
CHARTS for:Step 4: Identify Any SPS Grade Level Index Weaknesses / Strengths
& Step 5: Identify Any SPS Subject Area Index Weaknesses / Strengths
Abney Early Childhood Center
27

2014‐15Grade Level Subject Area
3rd 4th 5th 6th 7th 8th HS
ELA Math Science Social Studies English II English III Algebra I Geometry Biology American History
2015‐16Grade Level Subject Area
3rd 4th 5th 6th 7th 8th HS
ELA Math Science Social Studies English II English III Algebra I Geometry Biology American History
2016‐17Grade Level Subject Area
3rd 4th 5th 6th 7th 8th HS
ELA Math Science Social Studies English II English III Algebra I Geometry Biology American History
Abney Early Childhood Center
28

2017‐18Grade Level Subject Area
3rd 4th 5th 6th 7th 8th HS
ELA Math Science Social Studies English II English III Algebra I Geometry Biology American History
2018‐19Grade Level Subject Area
3rd 4th 5th 6th 7th 8th HS
ELA Math Science Social Studies English II English III Algebra I Geometry Biology American History
2019‐20Grade Level Subject Area
3rd 4th 5th 6th 7th 8th HS
ELA Math Science Social Studies English II English III Algebra I Geometry Biology American History
Abney Early Childhood Center
29

• Look at the green highlighted areas and the orange highlighted areas in each column going down. Compare grade level academic indexes and evaluate grade level performance.
• Identify grade levels where there is a concentration of higher index scores highlighted in orange. • Identify grade levels where there is a concentration of lower index scores highlighted in green and the subclaims that are lowest in those grade levels.
Higher Grade Level Index Scores (highlighted in orange):
Lower Grade Level Index Scores (highlighted in green):
• Does one grade have substantially lower/higher indexes than all other grades? Identify which grade(s) and how much lower or higher they were compared to the other grades in a particular subject. Also identify the lowest subclaims in that grade.
• Is there a pattern diagonally across years indicating a student population weakness or strength? (“good class – bad class syndrome”) If this type of diagonal pattern exists, please explain below. This type of pattern has implications with regards to school improvement planning because there would need to be a plan for how this group of students’ needs can best be met.
NOTE: Be sure to look at data across all years before concluding that a grade level weakness/strength exists.
• If any grade level index is consistently lower / higher than other grade indexes in the school, then it should be noted as a potential weakness / strength below. For the grade level weakness, identify the lowest subclaims for that grade level.
Grade Level Potential Strength:
Grade Level Potential Weakness and Lowest Subclaim for the Grade Level in ELA and Math:
Step 4: Identify Any SPS Grade Level Index Weaknesses / Strengths
28

• Look at the pink highlighted areas and the yellow highlighted areas in each row going across. Compare CRT indexes by subject area. • Identify subject areas and year(s) where there is a concentration of higher index scores. (yellow highlighted areas) • Identify subject areas and year(s) where there is a concentration of lower index scores. (pink highlighted areas)
Subject Areas with a Concentration of Higher Scores (highlighted in yellow):
Subject Areas with a Concentration of Lower Scores (highlighted in pink) and the lowest subclaim in that subject area:
• Is this subject area weakness trend evident across grades and years? If the data indicates the same subject area weakness across the grades and across the years, this would indicate a school wide problem in this subject area. Please indicate below by stating the specific subject area weakness and year(s). Is there a subclaim that has been low for several years?
• Low scores in some grades and high scores in other grades in the same subject may also indicate grade level weaknesses / strengths within a particular subject (which should be noted along with grade level findings in Step 4). Is there a particular subclaim that is lower?
• Low / High index scores across grades within a particular subject should be noted below with justification why this is a potential subject level weakness / strength. Also, identify the lowest subclaims in the identified subject area weakness.
Potential Subject Area Strength:
Potential Subject Area Weakness and Lowest Subclaims in ELA and Math:
Step 5: Identify Any SPS Subject Area Index Weaknesses / Strengths
29

% PROFICIENT ‐ SUBGROUP TREND DATA ANALYSIS
• Examine your Whole School Subgroup % Proficiency for each subgroup and your Subgroup % Proficiency for each grade level at your school for ELA andMath for each year indicated.
• In the ELA column, highlight the highest % Proficient score in orange, and highlight the lowest % Proficient score in green.• In the Math column, highlight the highest % Proficient score in yellow, and highlight the lowest % Proficient score in pink.
WHOLE SCHOOL 2012‐13 2013‐14 2014‐15 2015‐16 2016‐17 2017‐18 2018‐19 2019‐20 ELA Math ELA Math ELA Math ELA Math ELA Math ELA Math ELA Math ELA Math
Whole School Two or More Races Asian/Pacific Islander Black Hispanic White Limited English Proficient Economically Disadvantaged Students with Disabilities
GRADE 3 2012‐13 2013‐14 2014‐15 2015‐16 2016‐17 2017‐18 2018‐19 2019‐20 ELA Math ELA Math ELA Math ELA Math ELA Math ELA Math ELA Math ELA Math
Whole School Two or More Races Asian/Pacific Islander Black Hispanic White Limited English Proficient Economically Disadvantaged Students with Disabilities
Step 6: Identify Weakest / Strongest % Proficiency Area for Current Year by Subgroup
Abney Early Childhood Center
32

GRADE 4 2012‐13 2013‐14 2014‐15 2015‐16 2016‐17 2017‐18 2018‐19 2019‐20 ELA Math ELA Math ELA Math ELA Math ELA Math ELA Math ELA Math ELA Math
Whole School Two or More Races Asian/Pacific Islander Black Hispanic White Limited English Proficient Economically Disadvantaged Students with Disabilities
GRADE 5 2012‐13 2013‐14 2014‐15 2015‐16 2016‐17 2017‐18 2018‐19 2019‐20 ELA Math ELA Math ELA Math ELA Math ELA Math ELA Math ELA Math ELA Math
Whole School Two or More Races Asian/Pacific Islander Black Hispanic White Limited English Proficient Economically Disadvantaged Students with Disabilities
GRADE 6 2012‐13 2013‐14 2014‐15 2015‐16 2016‐17 2017‐18 2018‐19 2019‐20 ELA Math ELA Math ELA Math ELA Math ELA Math ELA Math ELA Math ELA Math
Whole School Two or More Races Asian/Pacific Islander Black Hispanic White Limited English Proficient Economically Disadvantaged Students with Disabilities
Abney Early Childhood Center
33

• Identify the current year subgroup with the lowest / highest % Proficient scores in ELA and Math across all subgroups. For high schools, youwill be identifying the current year subgroup with the lowest / highest % Proficient scores in English, Math, and Science/Social Studiesacross all subgroups.
• K‐8 Schools:Current Year ELA Lowest % Proficient (green highlight):Current Year ELA Highest % Proficient (orange highlight):Current Year Math Lowest % Proficient (pink highlight):Current Year Math Highest % Proficient (yellow highlight):
• High Schools:Current Year English II Lowest % Proficient (green highlight):Current Year English II Highest % Proficient (orange highlight):Current Year English III Lowest % Proficient (pink highlight):Current Year English III Highest % Proficient (yellow highlight):Current Year Algebra I Lowest % Proficient (green highlight):Current Year Algebra I Highest % Proficient (orange highlight):Current Year Geometry Lowest % Proficient (pink highlight):Current Year Geometry Highest % Proficient (yellow highlight):Current Year Biology Lowest % Proficient (green highlight):Current Year Biology Highest % Proficient (orange highlight):Current Year American History Lowest % Proficient (pink highlight):Current Year American History Highest % Proficient (yellow highlight):
• Has this subgroup been low / high for the past two or more years in this subject? If so, indicate below the potential subgroup weakness /strength by identifying the specific subgroup (including grade level and subject area).
Potential Subgroup Strength:
Potential Subgroup Weakness:
Abney Early Childhood Center
34

• On the chart in Step 6, place an up arrow ( ) when the level increased from one year to the next, and place a down arrow ( ) when thelevel decreased from one year to the next.
• Indicate subgroups in which the % Proficient scores in a particular subject have decline / improved for two years or more. State thesubgroup(s), subject area, and the amount of decline / improvement for each identified trend.
Subgroup(s) Areas of Improvement:
Subgroup(s) Areas of Decline:
• If any subgroup % Proficient scores have steadily or substantially declined / improved over the past few years, then it should be notedbelow as a potential strength / weakness.
Potential Subgroup Strength:
Potential Subgroup Weakness:
Step 7: Identify Any Declining / Improving % Proficiency Trends for Subgroups
Abney Early Childhood Center
35

• Examine Subgroup % Proficient Trend Data (Whole School) for all subgroups for each year indicated.• For each testing year, highlight in green the highest % Proficient score in each of the columns for each subject area.• Subtract the % Proficient score for each subgroup from the highlighted score and enter the difference in the achievement gap column for that subgroup.
There should be 0.0 in the achievement gap column next to the highlighted number. This process must be repeated for each year for each subject.• On the chart below, place an up arrow ( ) in the achievement gap column if the gap increased from one year to the next, and place a down arrow ( )
in the achievement gap column if the gap decreased from one year to the next. There should be no arrows in the 12‐13 achievement gap column.WHOLE SCHOOL 2012‐13 2013‐14 2014‐15 2015‐16 2016‐17 2017‐18 2018‐19 2019‐20
ELA % Proficient
Achievem
ent
Gap
% Proficient
Achievem
ent
Gap
% Proficient
Achievem
ent
Gap
% Proficient
Achievem
ent
Gap
% Proficient
Achievem
ent
Gap
% Proficient
Achievem
ent
Gap
% Proficient
Achievem
ent
Gap
% Proficient
Achievem
ent
Gap
Whole SchoolTwo or More RacesAsian/Pacific IslanderBlackHispanicWhiteLimited English ProficientEconomically DisadvantagedStudents with Disabilities
WHOLE SCHOOL 2012‐13 2013‐14 2014‐15 2015‐16 2016‐17 2017‐18 2018‐19 2019‐20
MATH
% Proficient
Achievem
ent
Gap
% Proficient
Achievem
ent
Gap
% Proficient
Achievem
ent
Gap
% Proficient
Achievem
ent
Gap
% Proficient
Achievem
ent
Gap
% Proficient
Achievem
ent
Gap
% Proficient
Achievem
ent
Gap
% Proficient
Achievem
ent
Gap
Whole SchoolTwo or More RacesAsian/Pacific IslanderBlackHispanicWhiteLimited English ProficientEconomically DisadvantagedStudents with Disabilities
Step 8: Identify Achievement Gap IssuesAbney Early Childhood Center
36

• Identify subgroups that are consistently below / above the Whole School proficiency scores in ELA and/or Math.
• Highlight in pink each up arrow ( ) in the chart above. The up arrow indicates the achievement gap has increased and that a potentialproblem exists.
• Indicate below subgroups and subject areas where the achievement gap shows an increasing trend (two up arrows in consecutive years)and the amount of increase across the years in comparison to the highest performing subgroup.
• Indicate which subgroups and subject areas where the achievement gap shows a declining trend (two down arrows in consecutive years)and the amount of decrease across the years in comparison to the highest performing subgroup. This indicates the achievement gap isclosing.
• Look for subgroups with down arrows ( ) for two or more consecutive years. While decreasing the achievement gap is desirable, it must beaccomplished by raising the achievement of lower scoring subgroups. Examine your data to determine if there has been a decrease inachievement gap caused by an overall decrease in the highlighted (higher performing subgroup) proficiency score. If the above situation hastaken place, explain below by indicating the subgroup, subject area, number of years, amount of gap decrease, and why this occurred. Alsoindicate if this is a potential subgroup weakness. NOTE: Be sure to look at data across all years before concluding that a subgroupweakness exists.
Abney Early Childhood Center
37

• Examine the % Proficient data for all subgroups in ELA and Math for each year indicated. Multiple charts have been provided showingWhole School performance, as well as each grade level.
• Highlight the lowest % Proficient in either ELA or Math for each subgroup for each testing year.
WHOLE SCHOOL 2012‐13 2013‐14 2014‐15 2015‐16 2016‐17 2017‐18 2018‐19 2019‐20 ELA Math ELA Math ELA Math ELA Math ELA Math ELA Math ELA Math ELA Math
Whole School Two or More Races Asian/Pacific Islander Black Hispanic White Limited English Proficient Economically Disadvantaged Students with Disabilities
GRADE 3 2012‐13 2013‐14 2014‐15 2015‐16 2016‐17 2017‐18 2018‐19 2019‐20 ELA Math ELA Math ELA Math ELA Math ELA Math ELA Math ELA Math ELA Math
Whole School Two or More Races Asian/Pacific Islander Black Hispanic White Limited English Proficient Economically Disadvantaged Students with Disabilities
Step 9: Identify Any Subject Level % Proficiency Weaknesses / Strengths By SubgroupAbney Early Childhood Center
38

GRADE 4 2012‐13 2013‐14 2014‐15 2015‐16 2016‐17 2017‐18 2018‐19 2019‐20 ELA Math ELA Math ELA Math ELA Math ELA Math ELA Math ELA Math ELA Math
Whole School Two or More Races Asian/Pacific Islander Black Hispanic White Limited English Proficient Economically Disadvantaged Students with Disabilities
GRADE 5 2012‐13 2013‐14 2014‐15 2015‐16 2016‐17 2017‐18 2018‐19 2019‐20 ELA Math ELA Math ELA Math ELA Math ELA Math ELA Math ELA Math ELA Math
Whole School Two or More Races Asian/Pacific Islander Black Hispanic White Limited English Proficient Economically Disadvantaged Students with Disabilities
GRADE 6 2012‐13 2013‐14 2014‐15 2015‐16 2016‐17 2017‐18 2018‐19 2019‐20 ELA Math ELA Math ELA Math ELA Math ELA Math ELA Math ELA Math ELA Math
Whole School Two or More Races Asian/Pacific Islander Black Hispanic White Limited English Proficient Economically Disadvantaged Students with Disabilities
Abney Early Childhood Center
39

• Compare subject area % Proficient scores. Is one subject area typically lower / higher than the other subject area for the subgroups?
• Low / High % Proficient scores ACROSS subgroups within a particular subject area should be noted below as a potential school‐wideweakness / strength in that subject.
• Low / High % Proficient scores in specific subject areas for any subgroup across 2‐3 years should be noted as a potential subject areaweakness / strength for that subgroup. Indicate the subject area weakness / strength and the subgroup(s) affected by this trend below.
Potential Subgroup Subject Area Strength:
Potential Subgroup Subject Area Weakness:
Abney Early Childhood Center
40

• Analyze and discuss all potential strengths / weaknesses from Steps 1 through 9, and determine 2 or 3 major strengths / weaknesses.• If the last bullets of each of the Steps on the previous Trend Analysis pages are completed, then this section will automatically fill.
POTENTIAL STRENGTHS:
1.
2.
3.
4.
5.
6.
7.
8.
9.
POTENTIAL WEAKNESSES:
1.
2.
3.
4.
5.
6.
7.
8.
9.
Step 10: Determine Major Strengths / Weaknesses for SchoolAbney Early Childhood Center
41
TREND DATA ANALYSIS WORKSHEET
STRENGTHS WEAKNESSES
Step 1: Identify Weakest / Strongest Grade Levels in DIBELS
Step 2: Identify Weakest / Strongest School Index Areas for Current Year
Step 3: Identify Any Declining / Improving Trends for Whole School
Step 4: Identify Any SPS Grade Level Index Weaknesses / Strengths and Lowest Subclaims in ELA and Math
Step 5: Identify Any SPS Subject Area Index Weaknesses / Strengths and Lowest Subclaims in ELA and Math
38
STRENGTHS WEAKNESSES
Step 6: Identify Weakest / Strongest % Proficiency Area for Current Year by Subgroup
Step 7: Identify Any Declining / Improving % Proficiency Trends for Subgroups
Step 8: Identify Achievement Gap Issues
Step 9: Identify Any Subject Level % Proficiency Weaknesses / Strengths By Subgroup
Step 10: Major Strengths / Major Weaknesses
Abney Early Childhood Center
43