Embed Size (px)
Citation preview
New Results on Muon Neutrino to Electron Neutrino Oscillations in MINOS
Lisa WhiteheadBrookhaven National Laboratory
On behalf of the MINOS Collaboration
BNL Particle Physics Seminar, August 11, 2011
2L. Whitehead, BNL August 11, 2011
Outline
● Formalism● Description of MINOS● Electron neutrino identification in MINOS● Background prediction● FD data distributions● Results
3L. Whitehead, BNL August 11, 2011
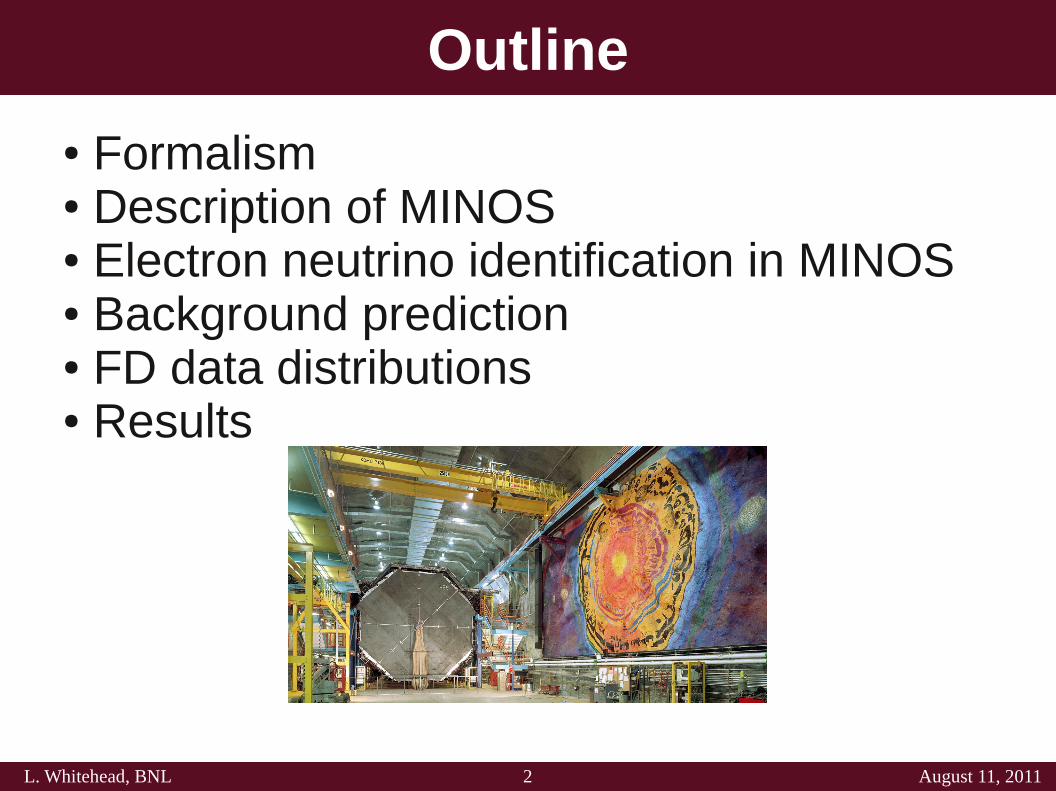
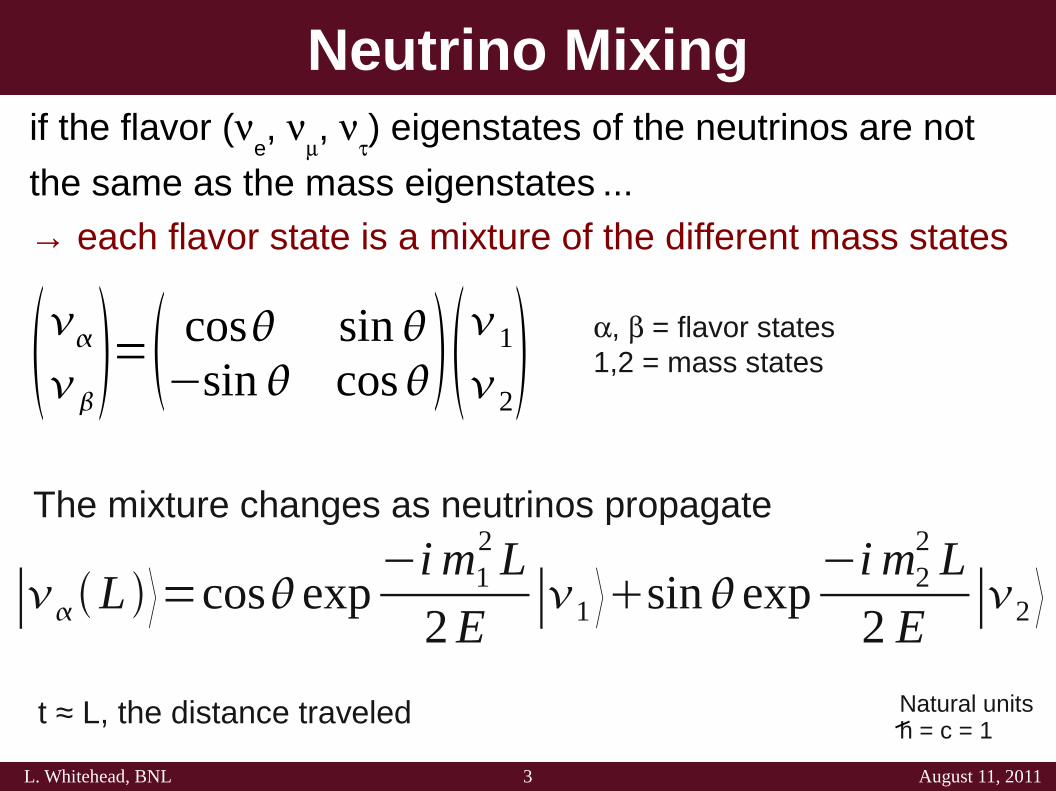
Neutrino Mixing
= cos sin
−sin cos1
2
∣ L ⟩=cosexp−i m1
2 L
2 E∣1 ⟩sinexp
−i m22 L
2 E∣2 ⟩
The mixture changes as neutrinos propagate
, = flavor states1,2 = mass states
Natural unitsh = c = 1
if the flavor (e,
,
) eigenstates of the neutrinos are not
the same as the mass eigenstates ...
→ each flavor state is a mixture of the different mass states
t ≈ L, the distance traveled
4L. Whitehead, BNL August 11, 2011
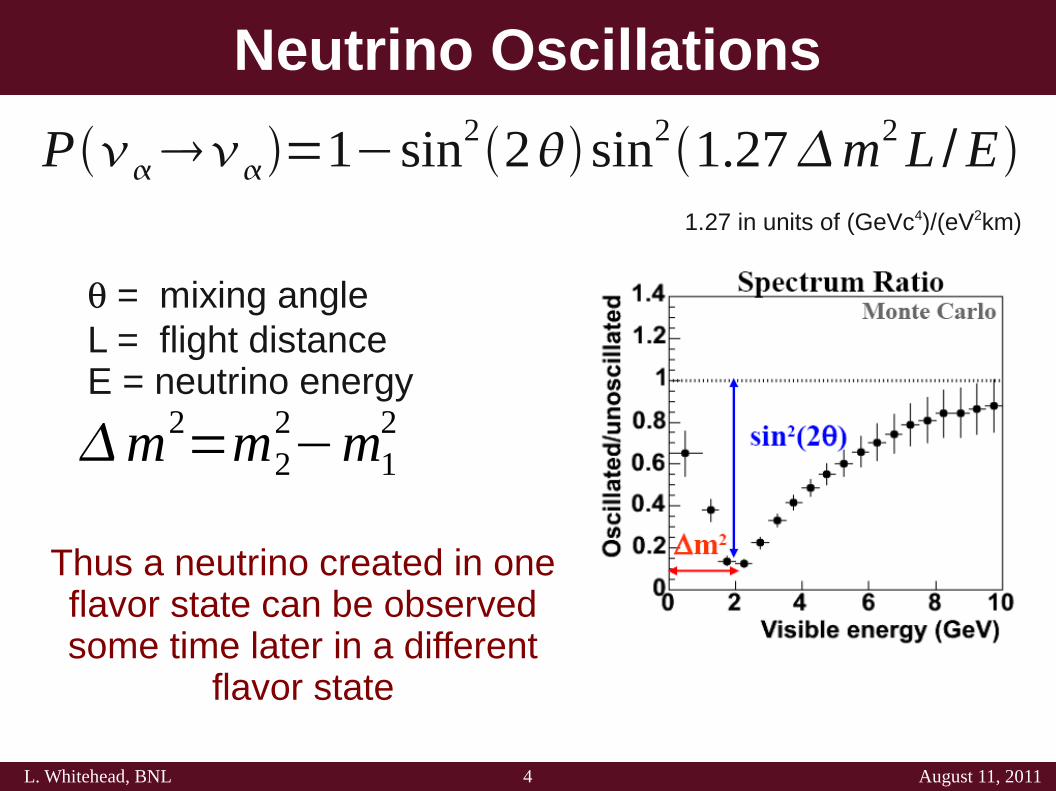
Neutrino Oscillations
Thus a neutrino created in one flavor state can be observed some time later in a different
flavor state
P=1−sin22 sin21.27m2 L /E
m2=m2
2−m1
2
= mixing angleL = flight distanceE = neutrino energy
1.27 in units of (GeVc4)/(eV2km)
5L. Whitehead, BNL August 11, 2011
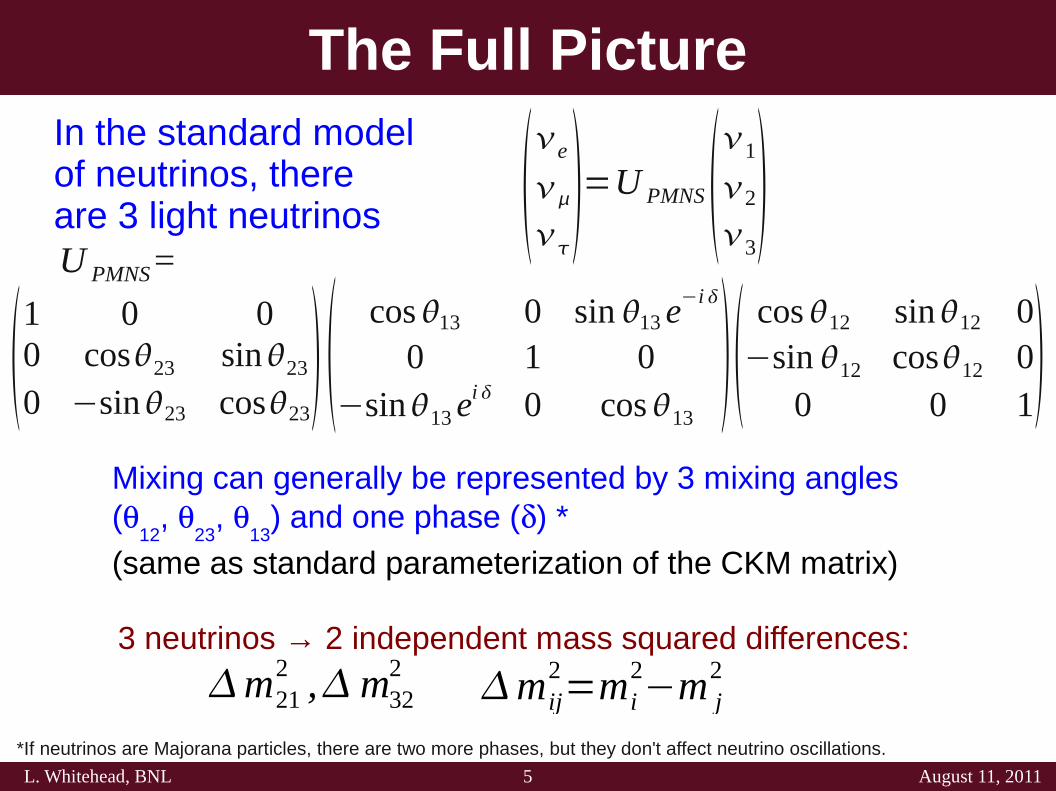
The Full Picture
1 0 00 cos23 sin23
0 −sin23 cos23 cos13 0 sin 13 e
−i
0 1 0−sin13 e
i 0 cos13 cos12 sin12 0−sin 12 cos12 0
0 0 1e
=U PMNS
1
2
3
In the standard model of neutrinos, there are 3 light neutrinos
3 neutrinos → 2 independent mass squared differences:
m212 ,m32
2mij
2=mi
2−m j
2
Mixing can generally be represented by 3 mixing angles (
12,
23,
13) and one phase () *
(same as standard parameterization of the CKM matrix)
U PMNS=
*If neutrinos are Majorana particles, there are two more phases, but they don't affect neutrino oscillations.
6L. Whitehead, BNL August 11, 2011
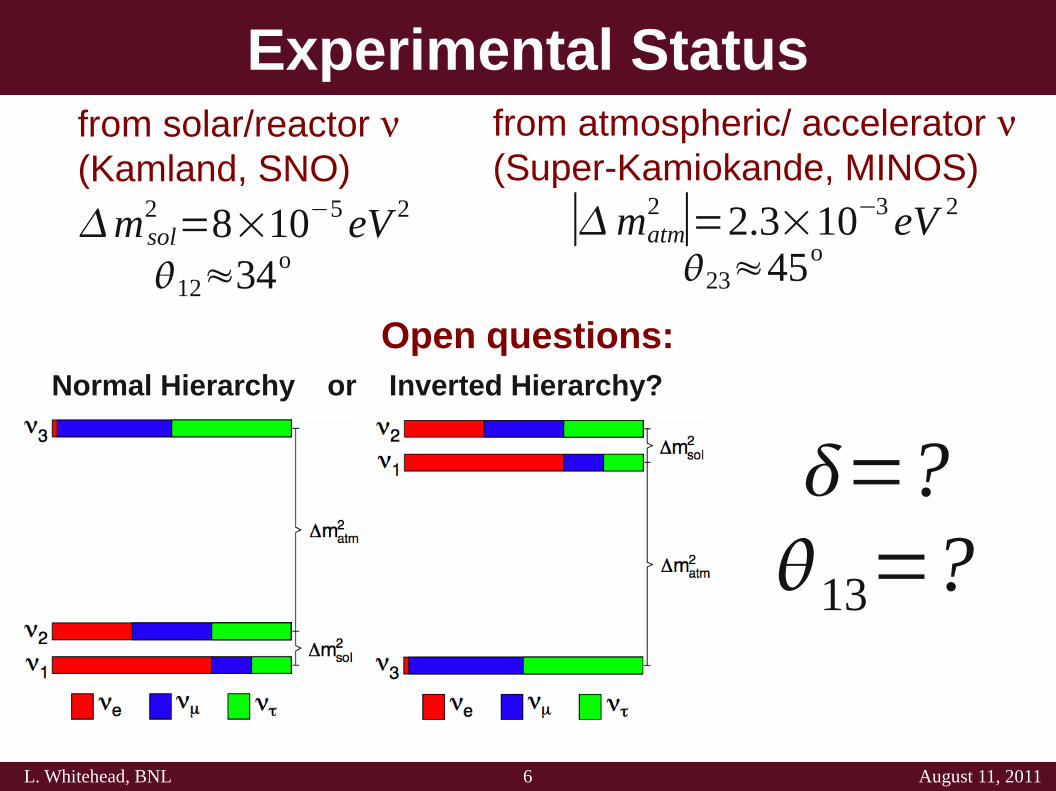
Experimental Status
∣matm2 ∣=2.3×10⁻³ eV 2
from atmospheric/ accelerator (Super-Kamiokande, MINOS)
23≈45om sol
2 =8×10⁻⁵ eV 2
from solar/reactor (Kamland, SNO)
12≈34o
Normal Hierarchy or Inverted Hierarchy?
Open questions:
=?13=?
7L. Whitehead, BNL August 11, 2011
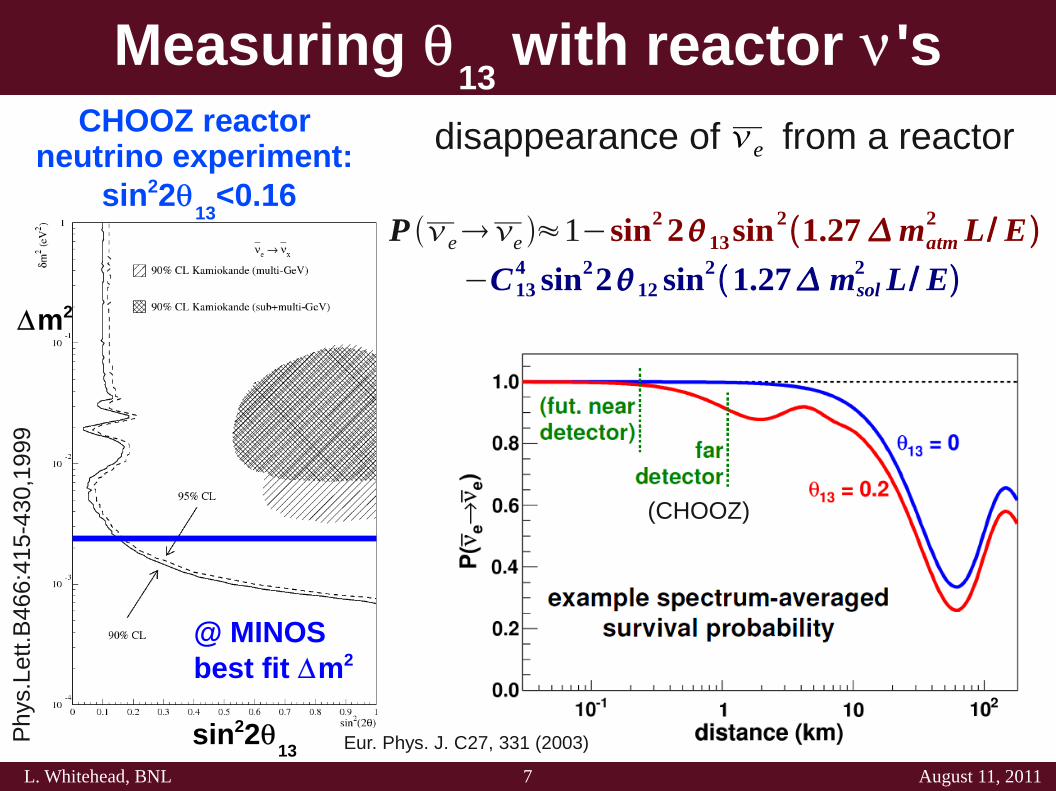
Measuring 13
with reactor 'sCHOOZ reactor
neutrino experiment: sin22
13<0.16
disappearance of from a reactor e
Phy
s.Le
tt.B
466 :
415-
4 30,
1999
P ee ≈1−sin22 13sin21.27matm
2 L/ E
−C134 sin2212 sin
21.27 msol2 L/ E
(CHOOZ)
@ MINOS best fit m2
m2
sin2213 Eur. Phys. J. C27, 331 (2003)
8L. Whitehead, BNL August 11, 2011
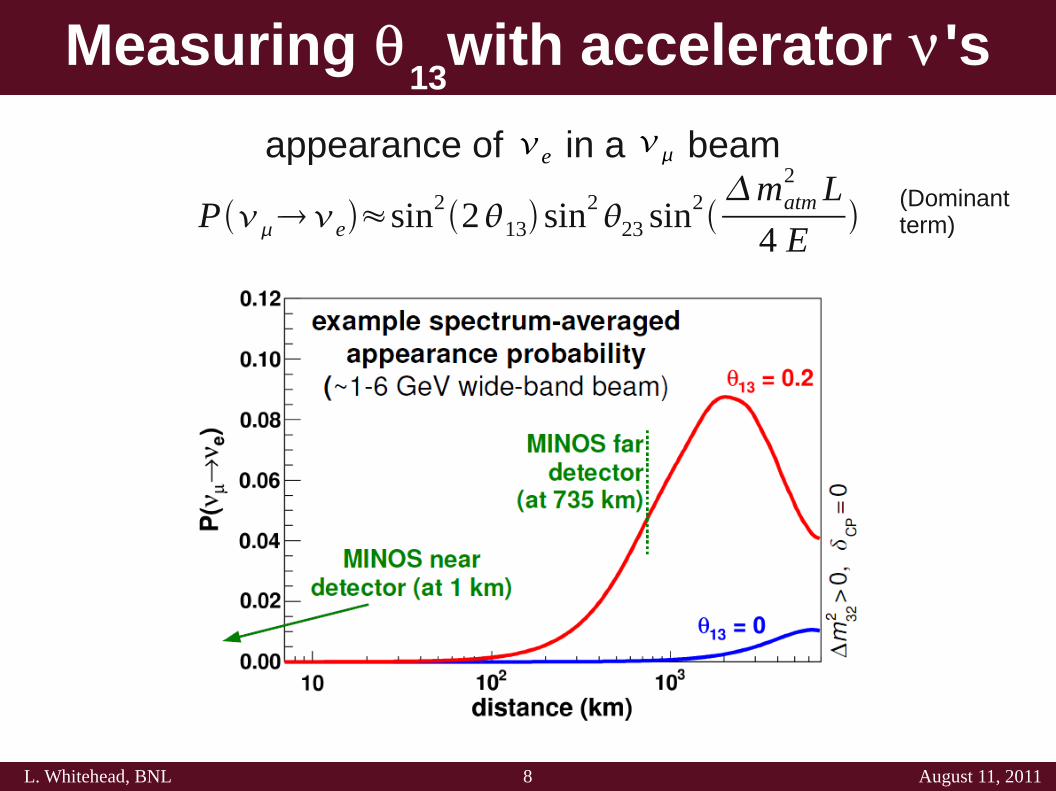
Measuring 13
with accelerator 's
Pe≈sin2213 sin2
23 sin2matm
2 L
4 E
appearance of in a beame
(Dominant term)
9L. Whitehead, BNL August 11, 2011
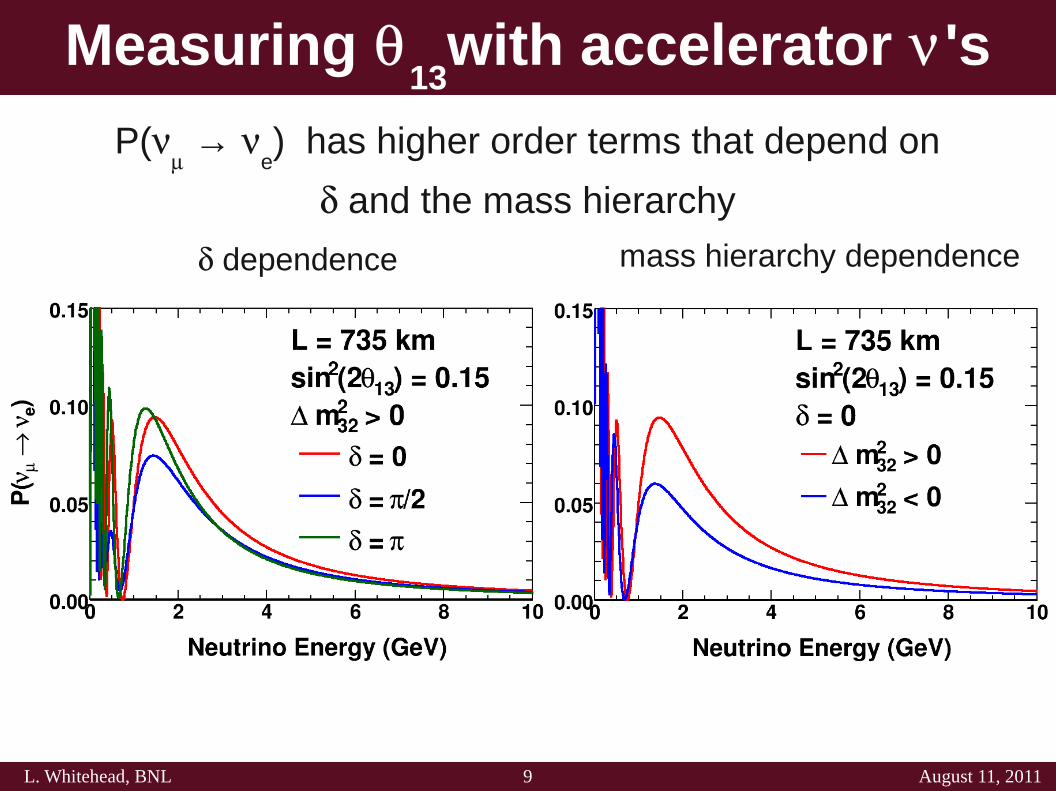
mass hierarchy dependence
Measuring 13
with accelerator 's
dependence
P( →
e) has higher order terms that depend on
and the mass hierarchy
10L. Whitehead, BNL August 11, 2011
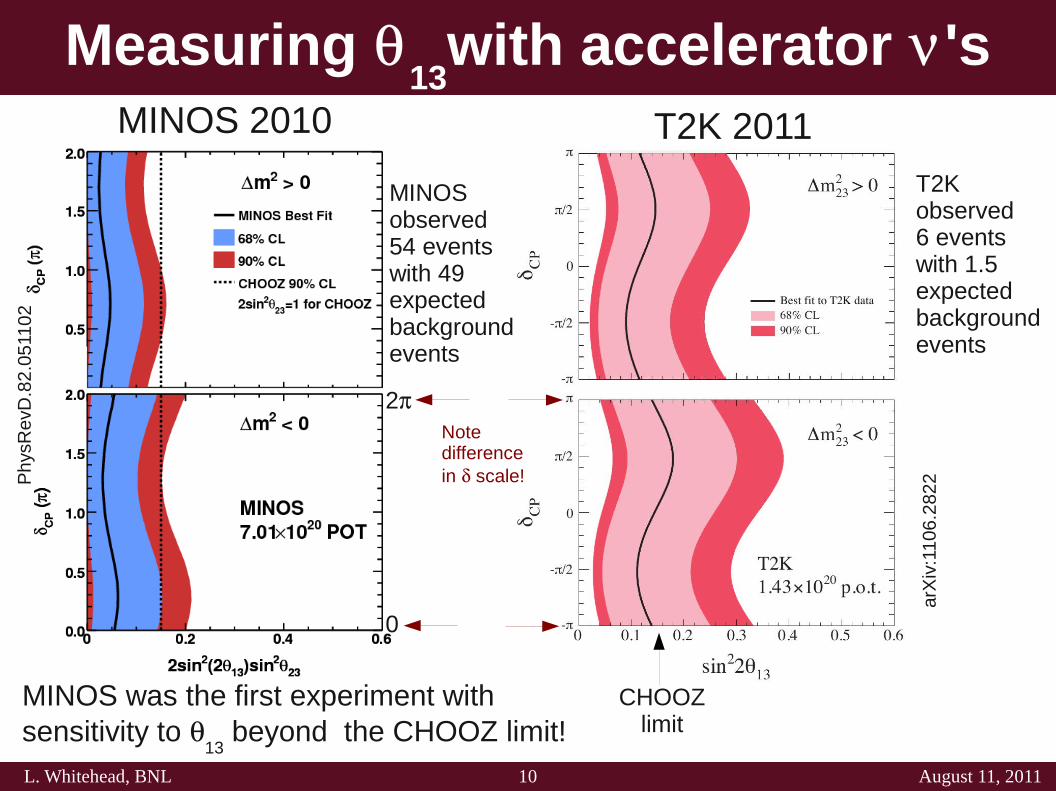
Measuring 13
with accelerator 'sMINOS 2010
MINOS was the first experiment with sensitivity to
13 beyond the CHOOZ limit!
T2K 2011
arX
iv:1
106.
2822P
hysR
evD
.82
.051
1 02
MINOS observed 54 events with 49 expected background events
T2K observed 6 events with 1.5 expected background events
Note difference in scale!
2
0
CHOOZ limit
11L. Whitehead, BNL August 11, 2011
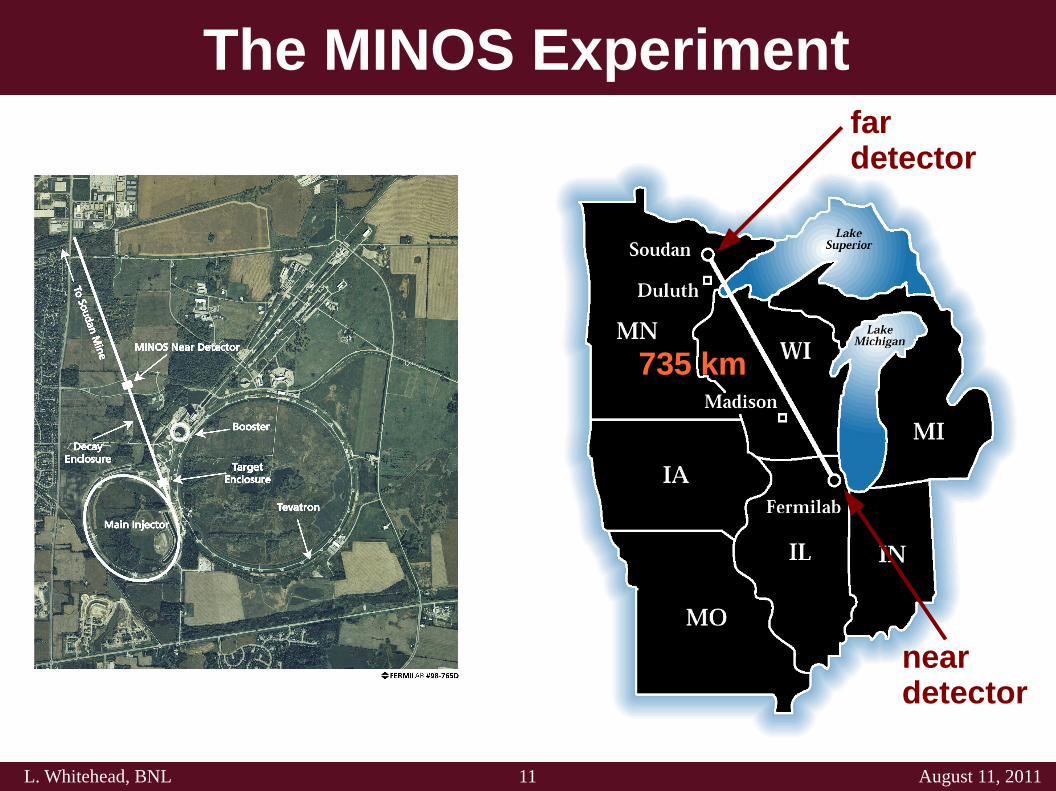
The MINOS Experiment
near detector
far detector
735 km
12L. Whitehead, BNL August 11, 2011
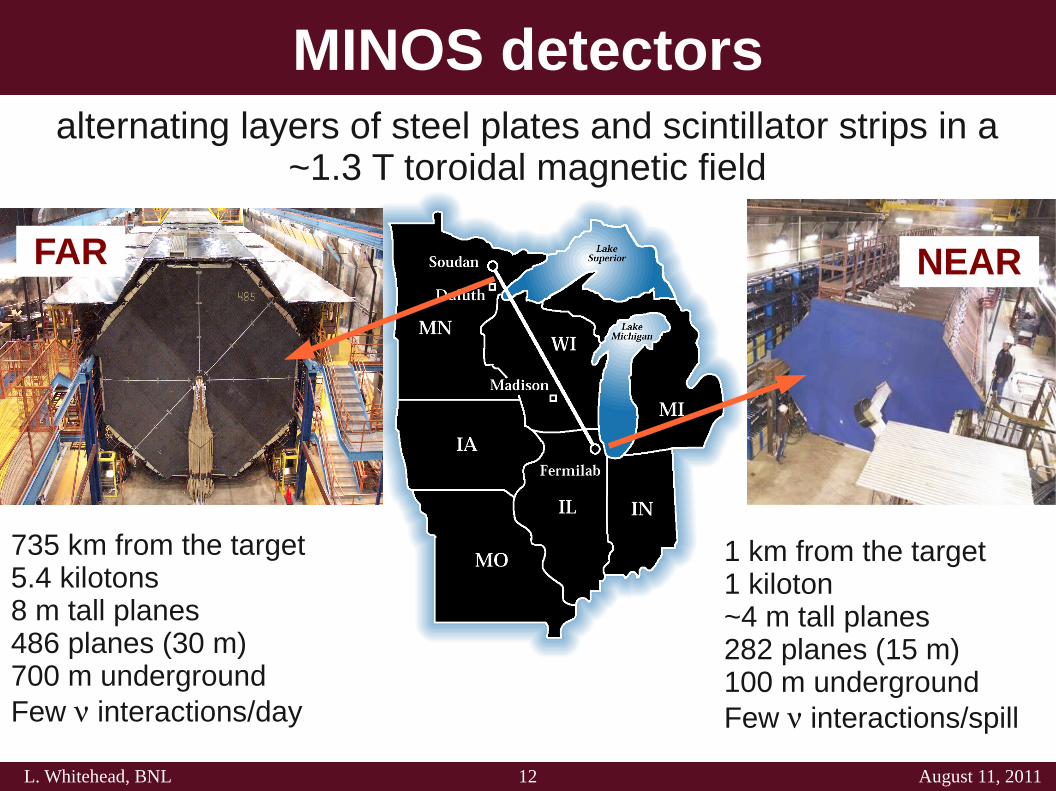
MINOS detectorsalternating layers of steel plates and scintillator strips in a
~1.3 T toroidal magnetic field
NEARFAR
735 km from the target5.4 kilotons8 m tall planes486 planes (30 m)700 m undergroundFew interactions/day
1 km from the target1 kiloton~4 m tall planes282 planes (15 m)100 m undergroundFew interactions/spill
13L. Whitehead, BNL August 11, 2011
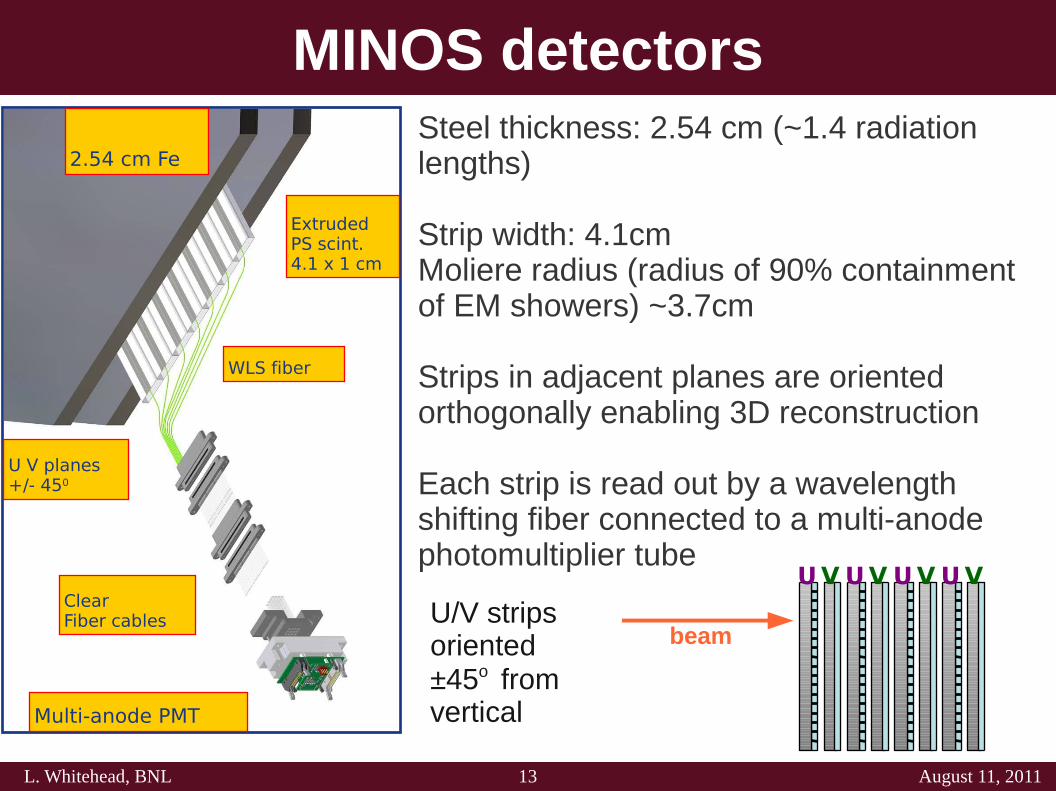
MINOS detectors
Multi-anode PMT
ExtrudedPS scint.4.1 x 1 cm
WLS fiber
ClearFiber cables
2.54 cm Fe
U V planes+/- 450
UVUV UVUV
Steel thickness: 2.54 cm (~1.4 radiation lengths)
Strip width: 4.1cm Moliere radius (radius of 90% containment of EM showers) ~3.7cm
Strips in adjacent planes are oriented orthogonally enabling 3D reconstruction
Each strip is read out by a wavelength shifting fiber connected to a multi-anode photomultiplier tube
U/V strips oriented ±45o from vertical
beam
14L. Whitehead, BNL August 11, 2011
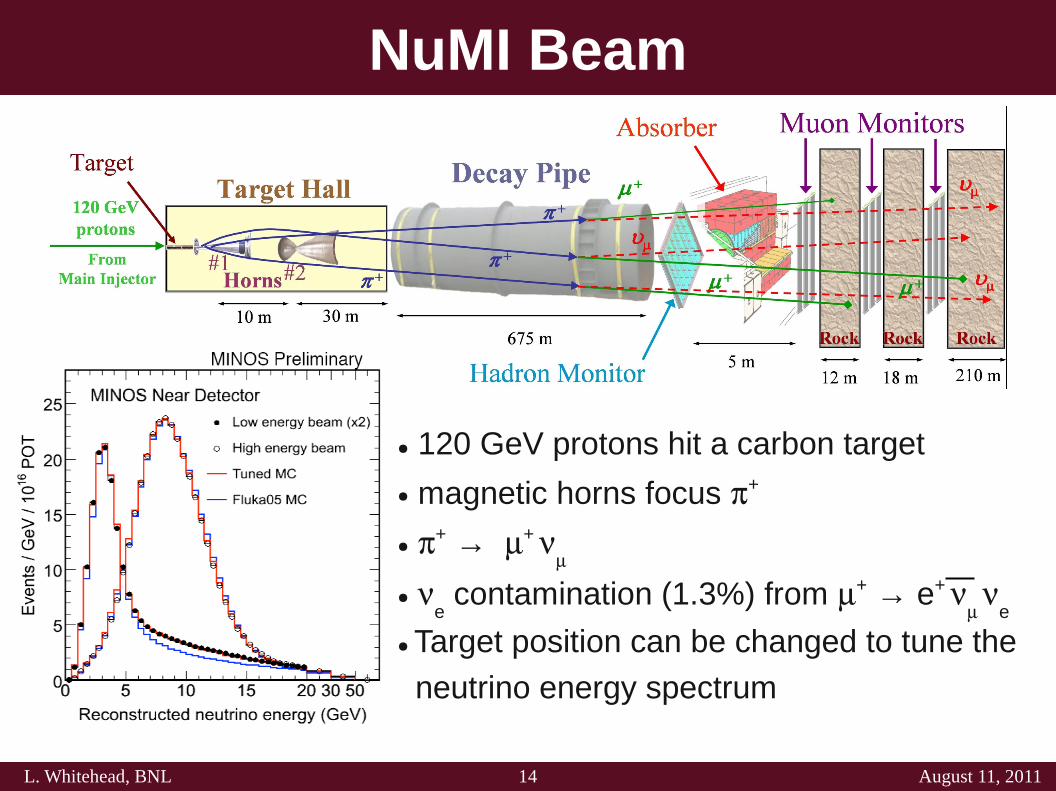
NuMI Beam
● 120 GeV protons hit a carbon target
● magnetic horns focus +
● + → +
● e contamination (1.3%) from + → e+
e
● Target position can be changed to tune the
neutrino energy spectrum
15L. Whitehead, BNL August 11, 2011
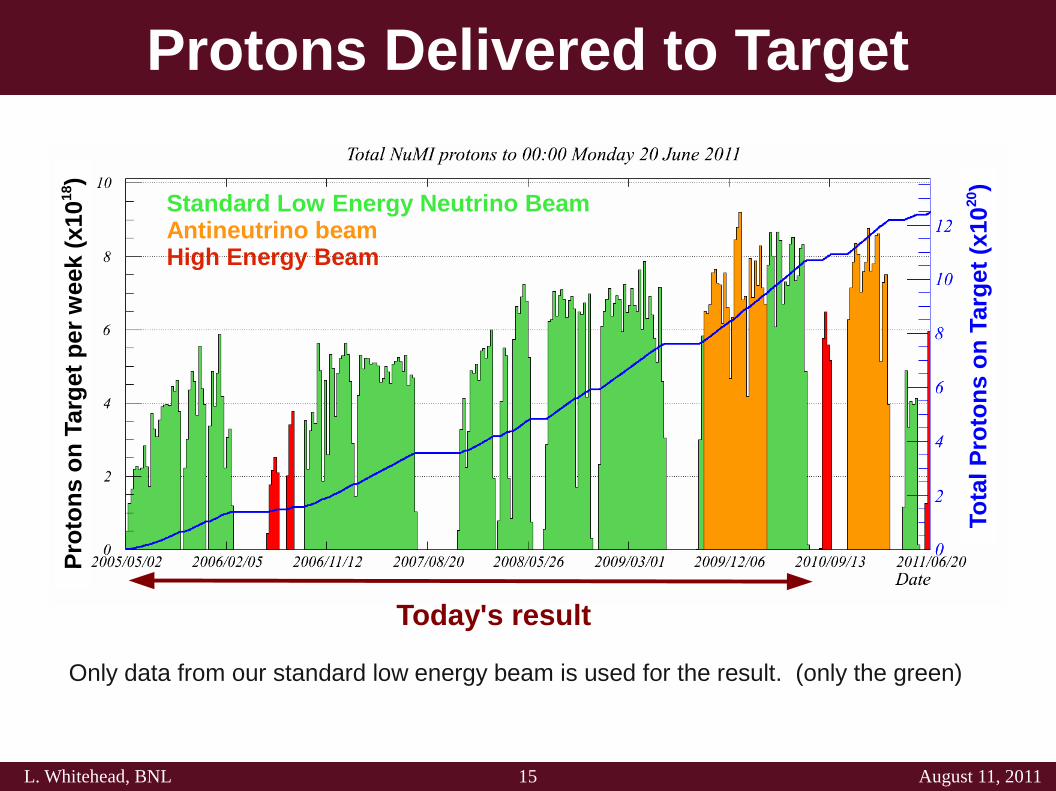
Protons Delivered to Target
Tota
l P
roto
ns
on
Tar
get
(x1
020
)
Pro
ton
s o
n T
a rg
et p
e r w
eek
(x10
18)
Standard Low Energy Neutrino BeamAntineutrino beamHigh Energy Beam
Only data from our standard low energy beam is used for the result. (only the green)
Today's result
16L. Whitehead, BNL August 11, 2011
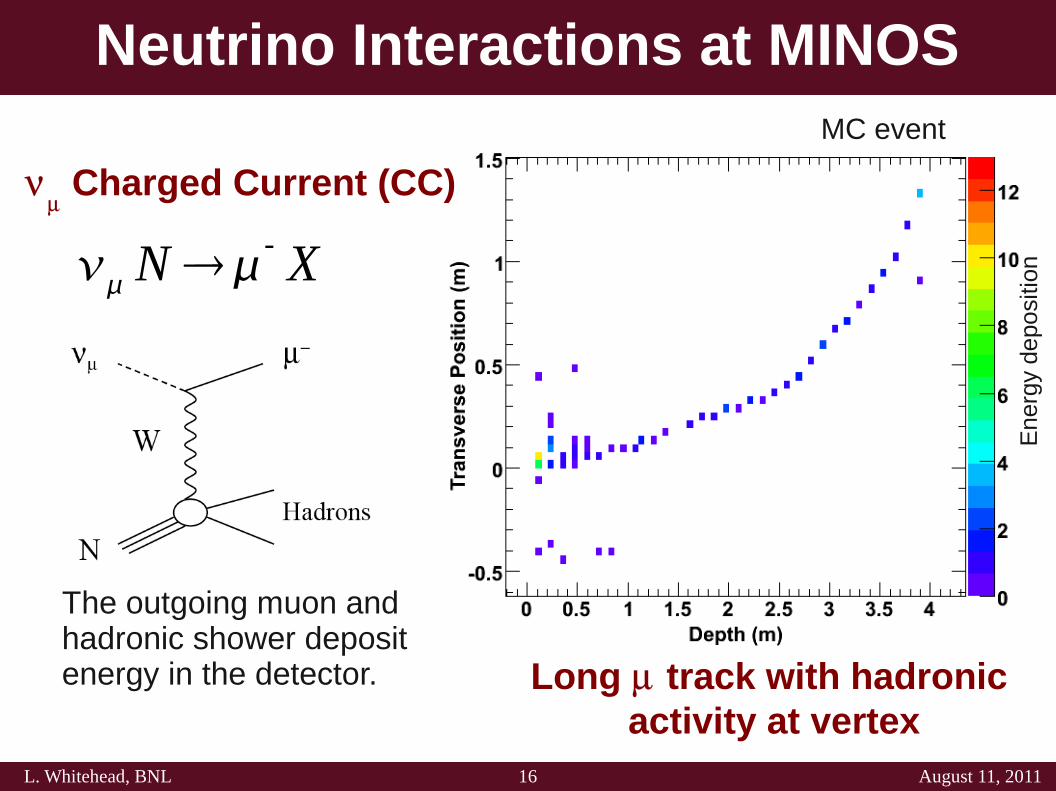
Neutrino Interactions at MINOS
Long track with hadronic activity at vertex
N - X
Charged Current (CC)
The outgoing muon and hadronic shower deposit energy in the detector.
MC event
Ene
rgy
depo
sit io
n
17L. Whitehead, BNL August 11, 2011
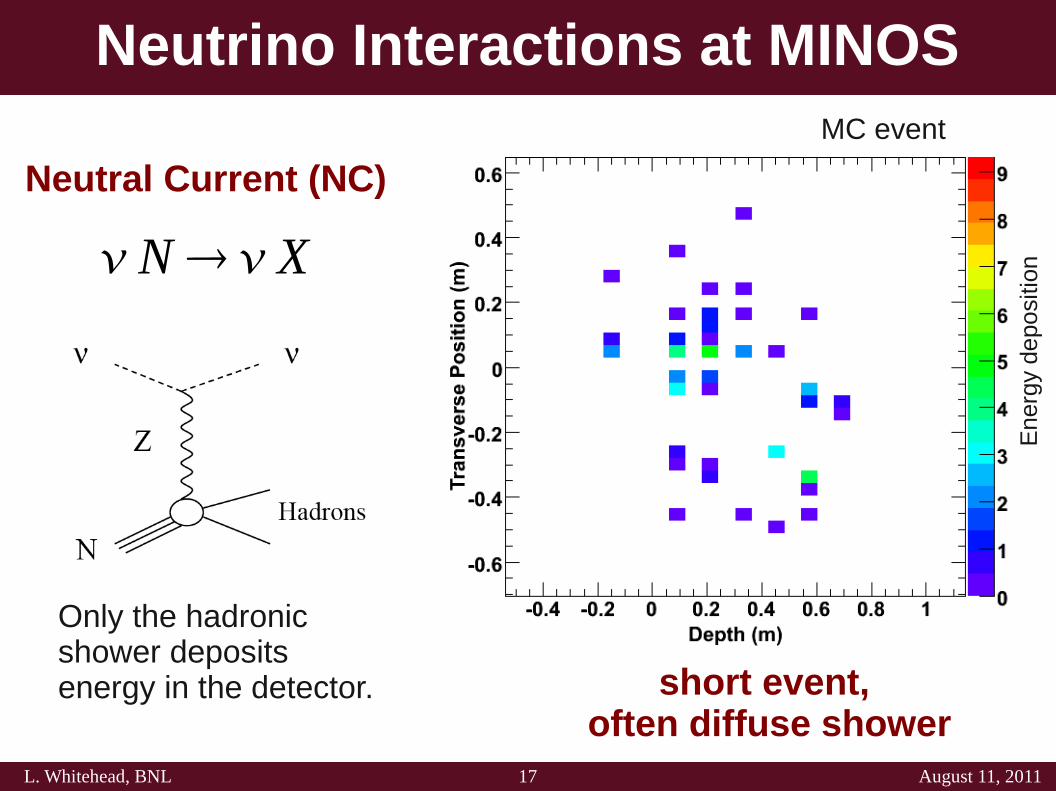
Neutral Current (NC)
N X
Only the hadronic shower deposits energy in the detector. short event,
often diffuse shower
MC event
Neutrino Interactions at MINOS
Ene
rgy
depo
sit io
n
18L. Whitehead, BNL August 11, 2011
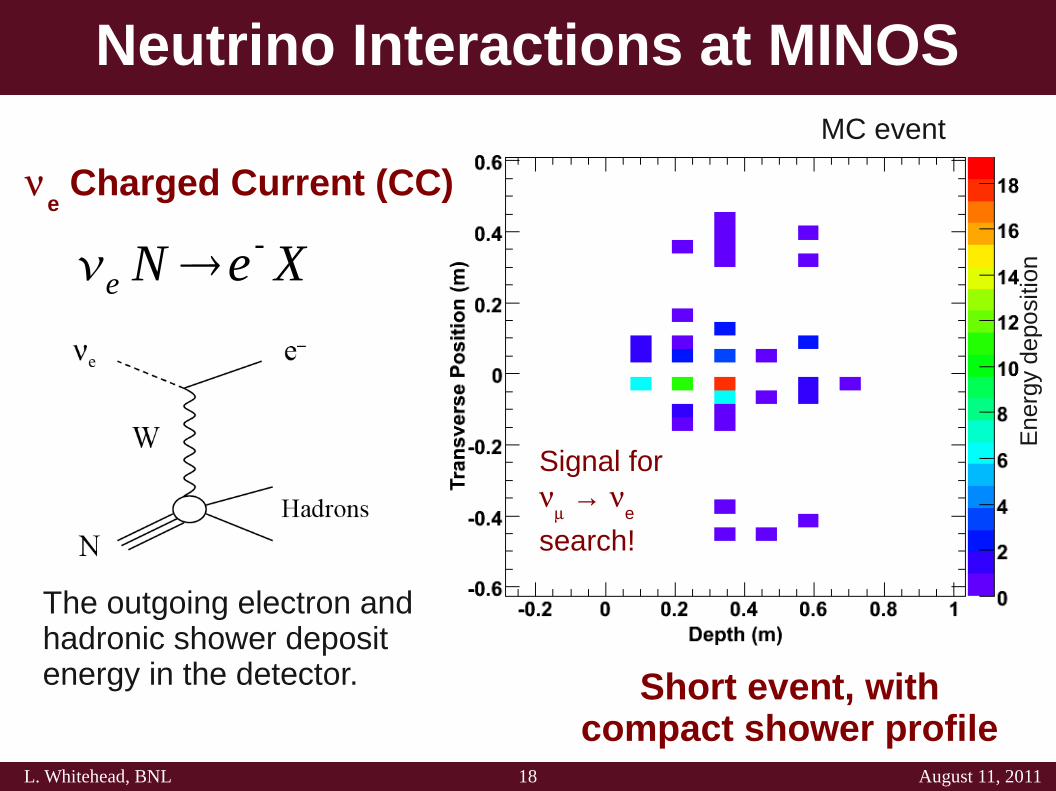
Short event, with compact shower profile
e N e - X
e Charged Current (CC)
The outgoing electron and hadronic shower deposit energy in the detector.
Signal for
→
e
search!
MC event
Neutrino Interactions at MINOS
Ene
rgy
depo
sit io
n
19L. Whitehead, BNL August 11, 2011
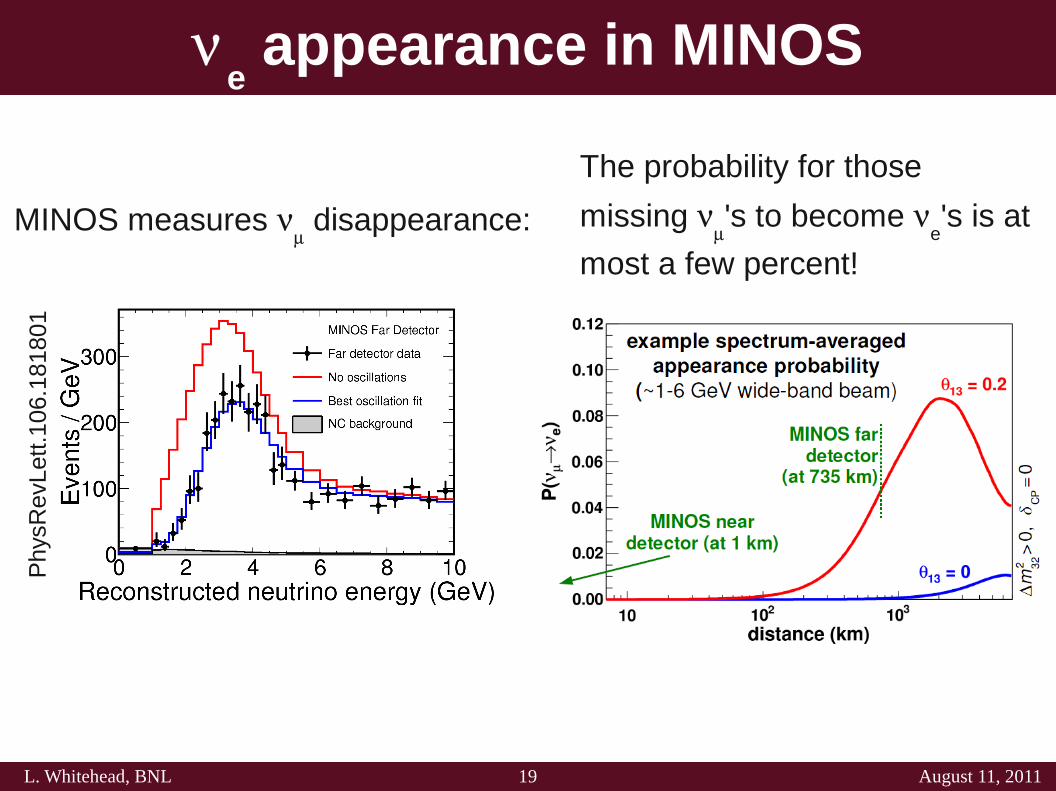
e appearance in MINOS
Phy
sRe v
Lett
.106
.181
8 01
MINOS measures disappearance:
The probability for those
missing 's to become
e's is at
most a few percent!
20L. Whitehead, BNL August 11, 2011
Searching for e appearance
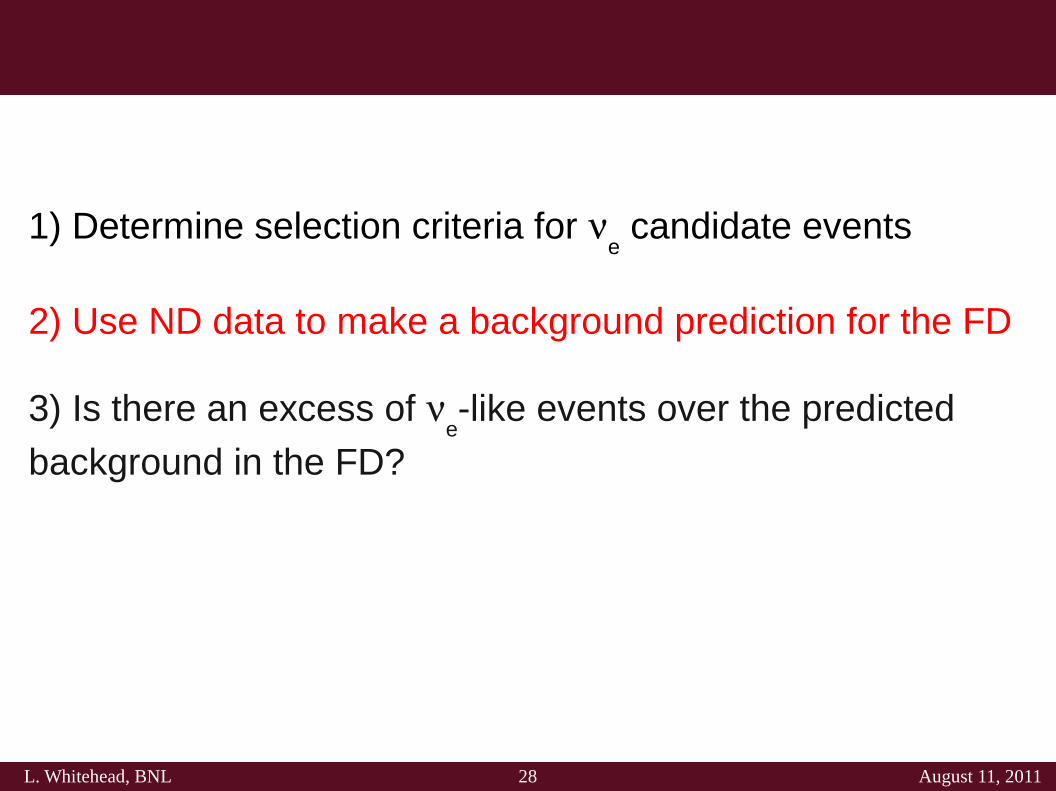
1) Determine selection criteria for e candidate events
2) Use ND data to make a background prediction for the FD
3) Is there an excess of e-like events over the predicted
background in the FD?
21L. Whitehead, BNL August 11, 2011
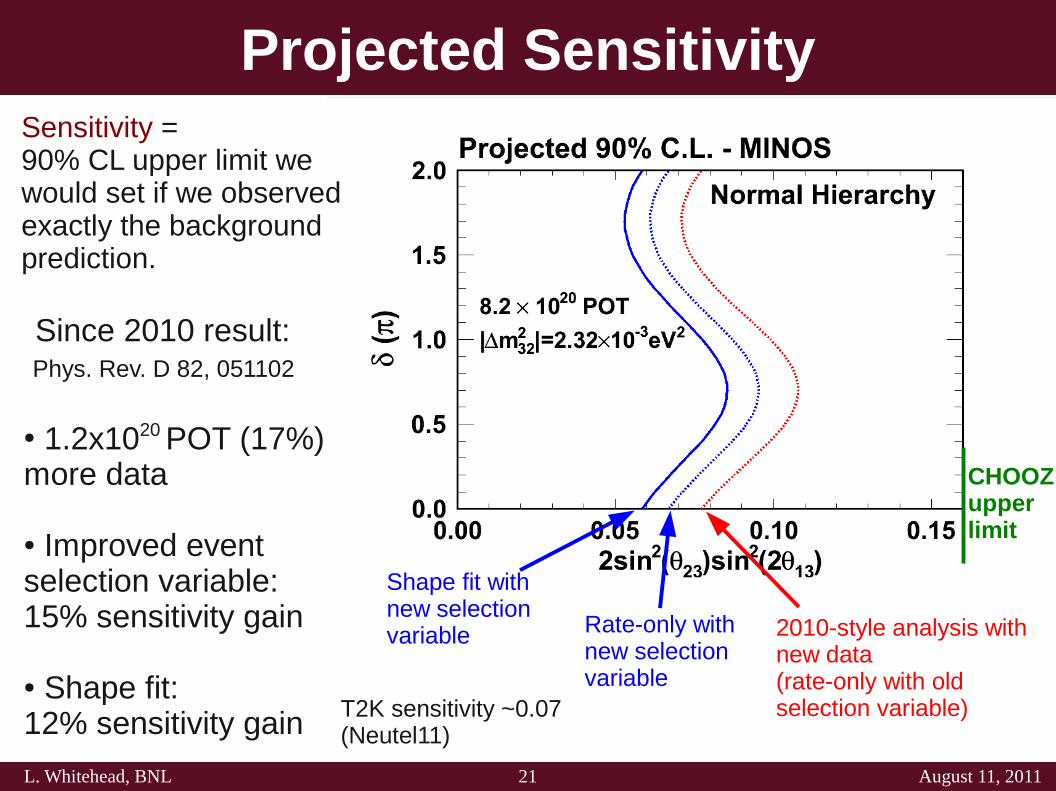
Projected Sensitivity
CHOOZ upper limit
2010-style analysis with new data(rate-only with old selection variable)
Rate-only with new selection variable
Shape fit with new selection variable
Sensitivity = 90% CL upper limit we would set if we observed exactly the background prediction.
T2K sensitivity ~0.07 (Neutel11)
Since 2010 result: Phys. Rev. D 82, 051102 ● 1.2x10²⁰ POT (17%) more data ● Improved event selection variable: 15% sensitivity gain ● Shape fit: 12% sensitivity gain
22L. Whitehead, BNL August 11, 2011
1) Determine selection criteria for e candidate events
2) Use ND data to make a background prediction for the FD
3) Is there an excess of e-like events over the predicted
background in the FD?
23L. Whitehead, BNL August 11, 2011
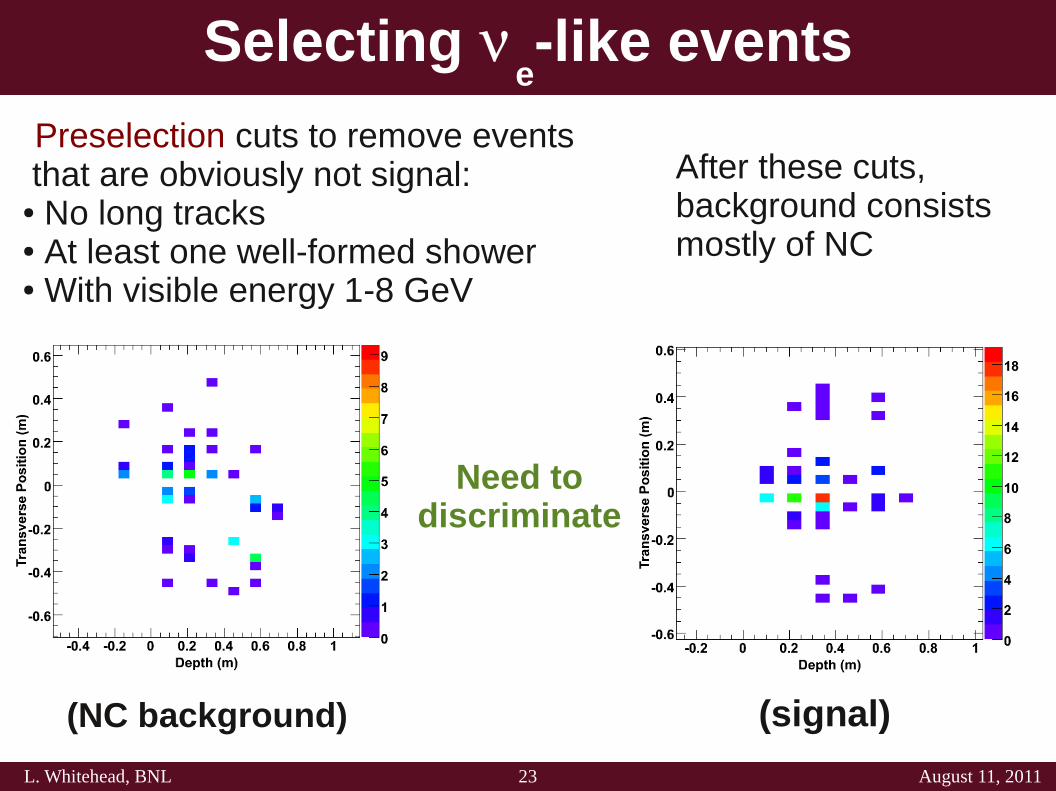
Selecting e-like events
Need to discriminate
(NC background) (signal)
Preselection cuts to remove events that are obviously not signal:● No long tracks● At least one well-formed shower● With visible energy 1-8 GeV
After these cuts, background consists mostly of NC
24L. Whitehead, BNL August 11, 2011
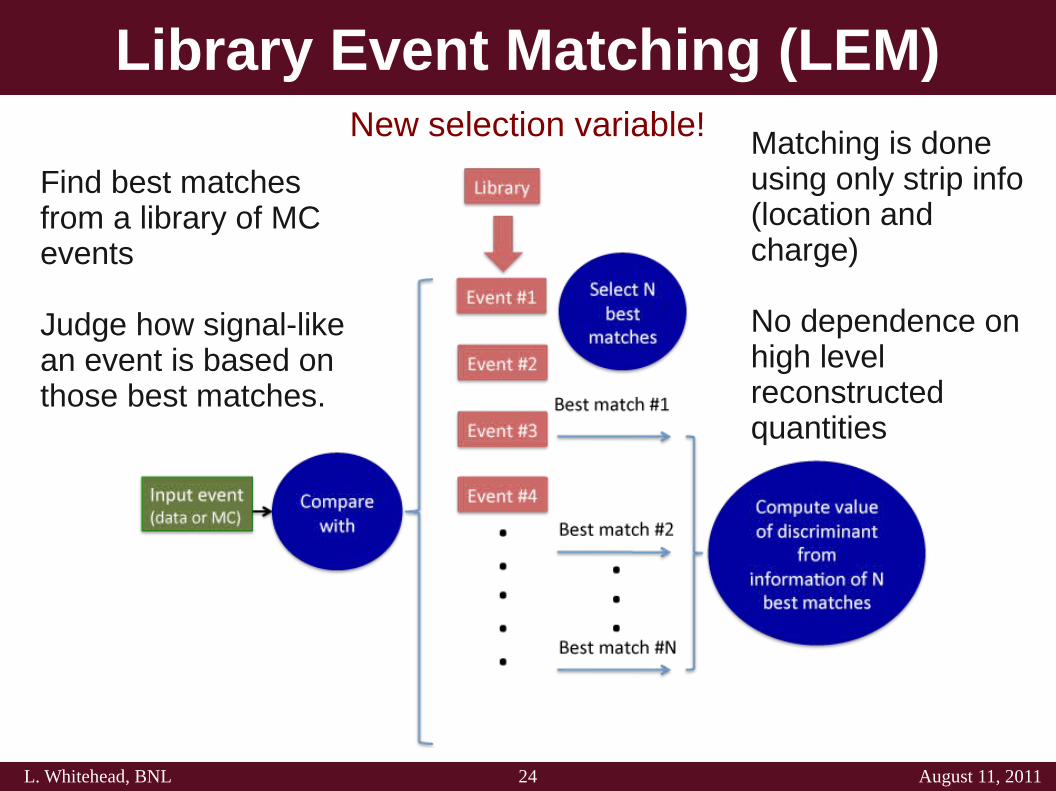
Library Event Matching (LEM)
Find best matches from a library of MC events
Judge how signal-like an event is based on those best matches.
Matching is done using only strip info (location and charge)
No dependence on high level reconstructed quantities
New selection variable!
25L. Whitehead, BNL August 11, 2011
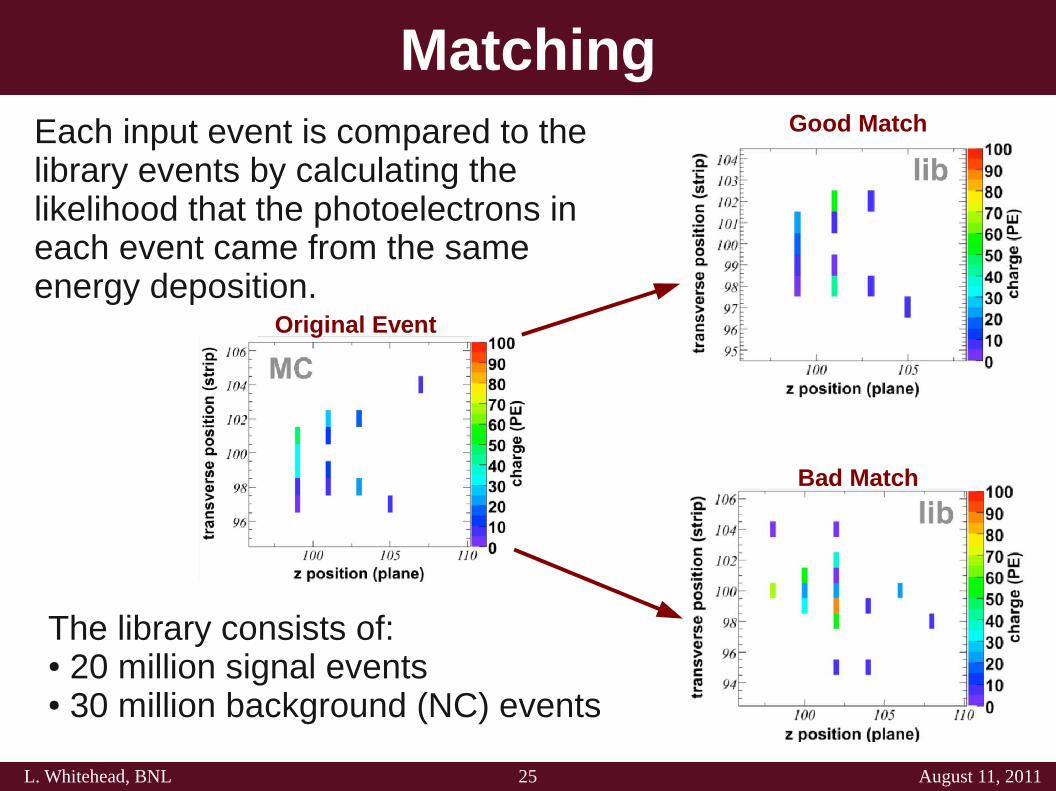
MatchingEach input event is compared to the library events by calculating the likelihood that the photoelectrons in each event came from the same energy deposition.
The library consists of:● 20 million signal events● 30 million background (NC) events
Original Event
Good Match
Bad Match
26L. Whitehead, BNL August 11, 2011
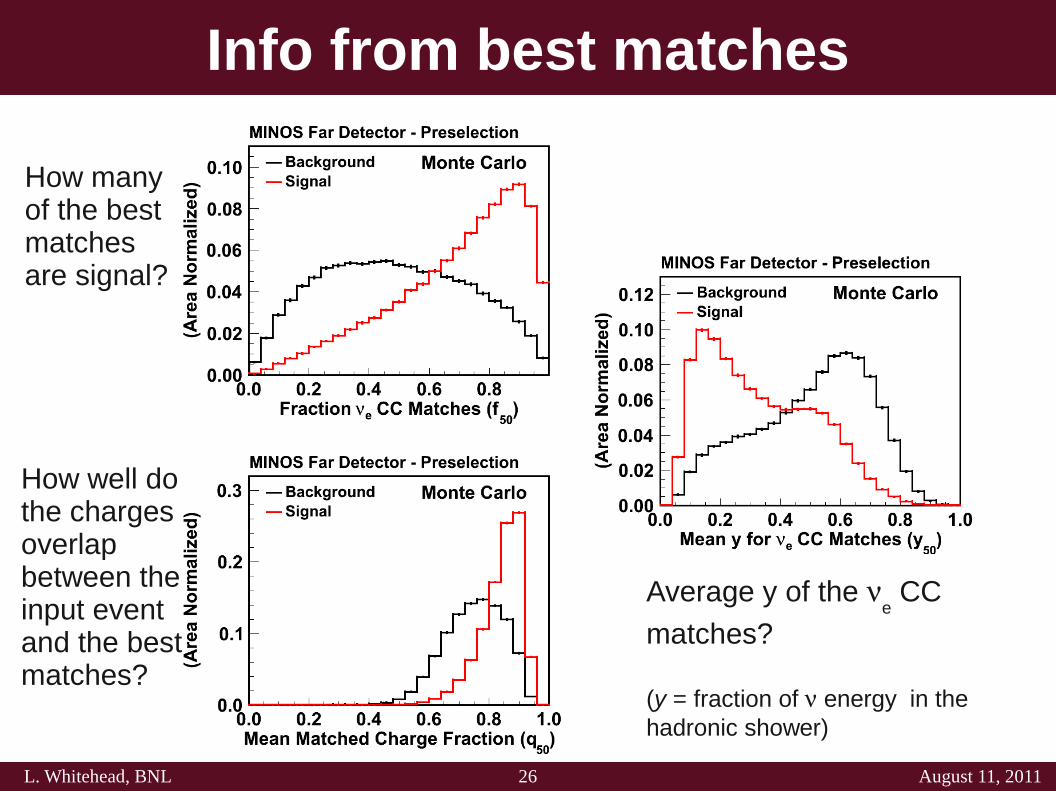
Info from best matches
How many of the best matches are signal?
How well do the charges overlap between the input event and the best matches?
Average y of the e CC
matches?
(y = fraction of energy in the hadronic shower)
27L. Whitehead, BNL August 11, 2011
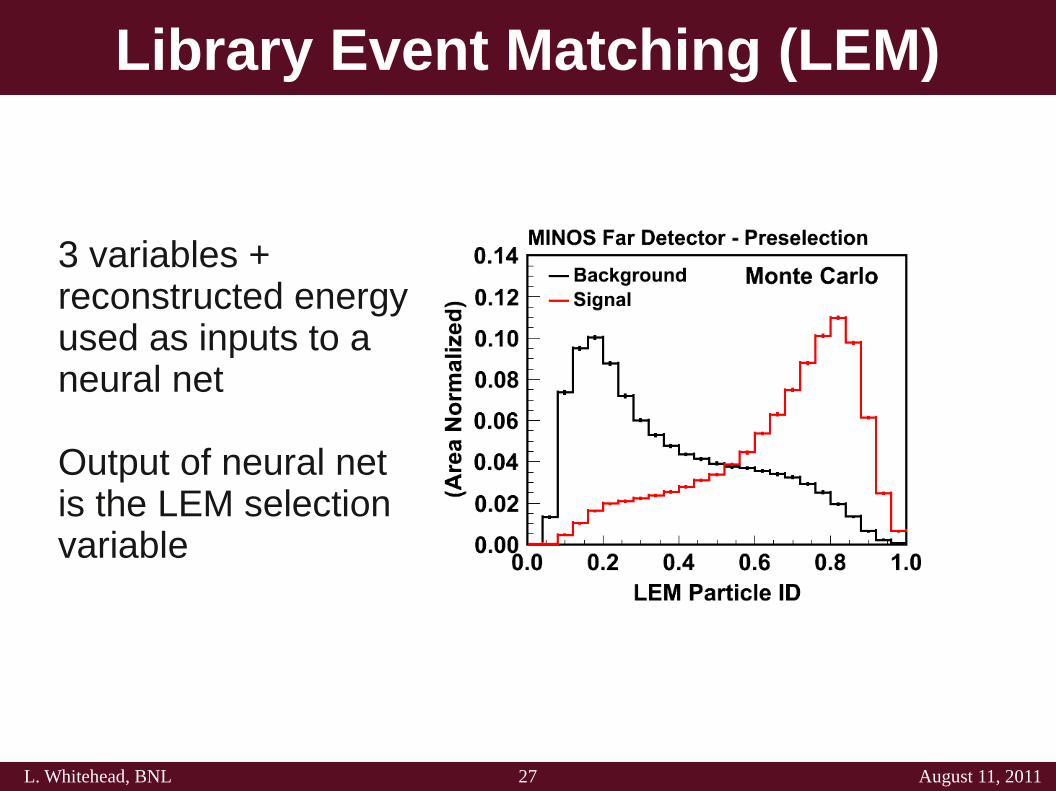
Library Event Matching (LEM)
3 variables + reconstructed energy used as inputs to a neural net
Output of neural net is the LEM selection variable
28L. Whitehead, BNL August 11, 2011
1) Determine selection criteria for e candidate events
2) Use ND data to make a background prediction for the FD
3) Is there an excess of e-like events over the predicted
background in the FD?
29L. Whitehead, BNL August 11, 2011
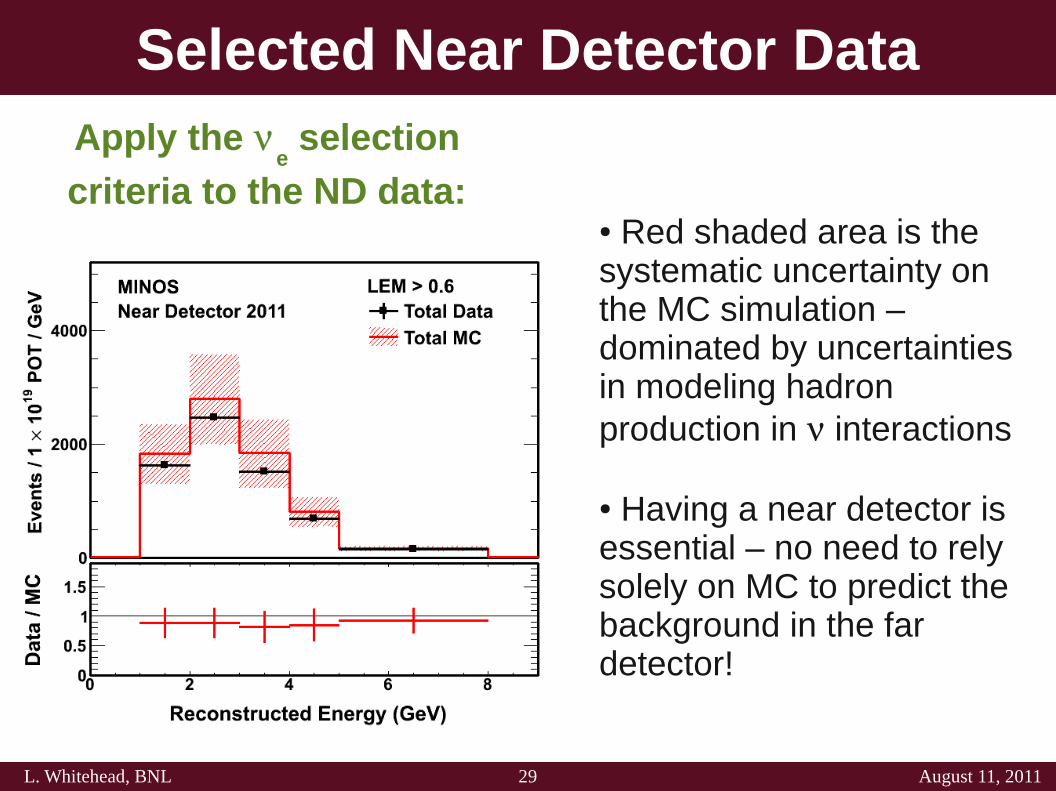
Selected Near Detector DataApply the
e selection
criteria to the ND data:● Red shaded area is the systematic uncertainty on the MC simulation – dominated by uncertainties in modeling hadron production in interactions ● Having a near detector is essential – no need to rely solely on MC to predict the background in the far detector!
30L. Whitehead, BNL August 11, 2011
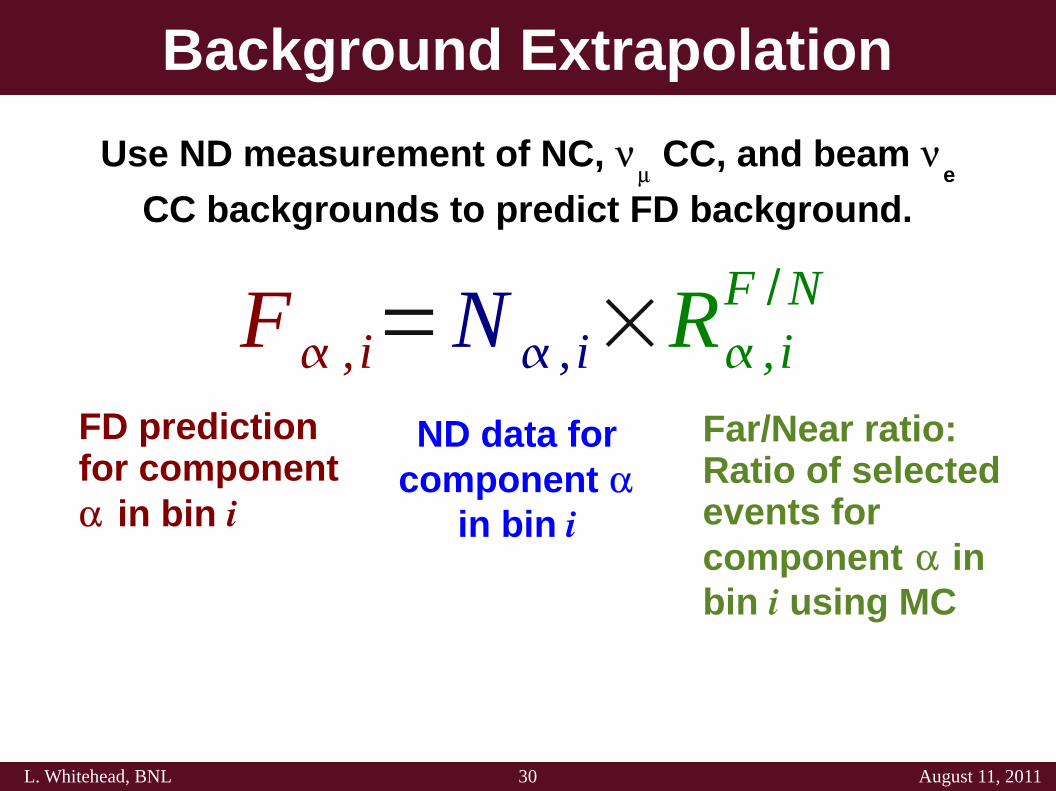
Background Extrapolation
Use ND measurement of NC, CC, and beam
e
CC backgrounds to predict FD background.
ND data for component
in bin i
FD prediction for component in bin i
Far/Near ratio:Ratio of selected events for component in bin i using MC
F , i=N , i×R , iF /N
31L. Whitehead, BNL August 11, 2011
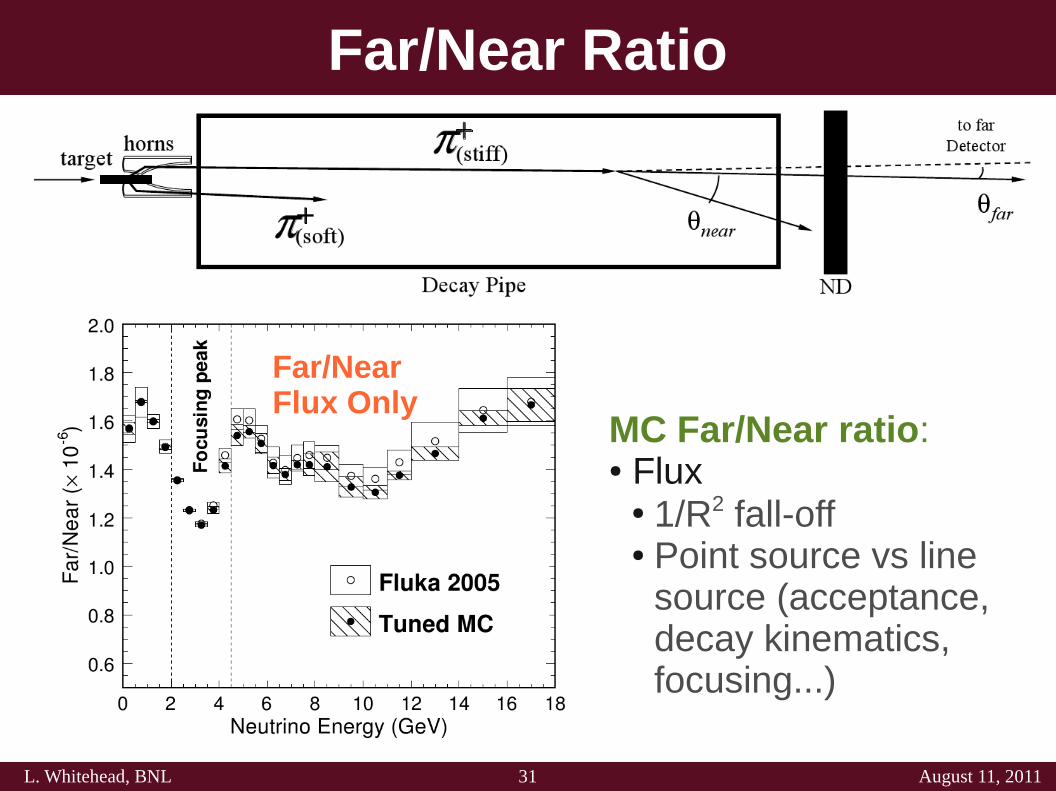
Far/Near Ratio
Far/NearFlux Only
MC Far/Near ratio:● Flux
● 1/R2 fall-off● Point source vs line
source (acceptance, decay kinematics, focusing...)
32L. Whitehead, BNL August 11, 2011
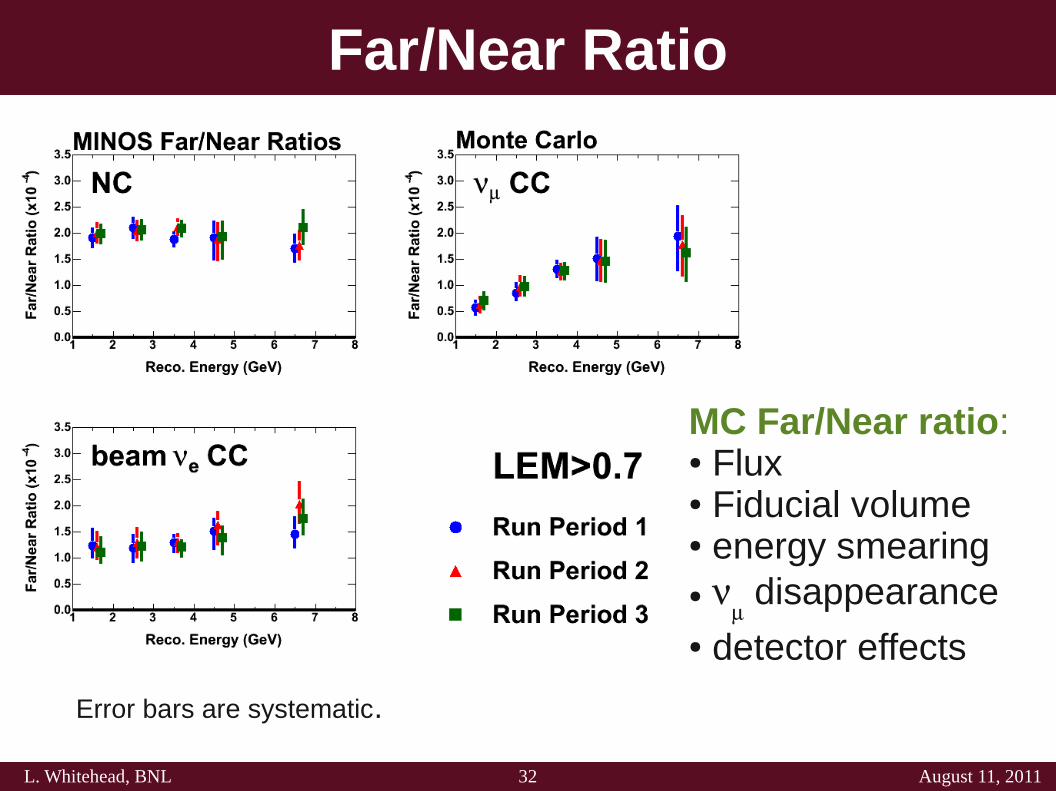
Far/Near Ratio
Error bars are systematic.
MC Far/Near ratio:● Flux● Fiducial volume● energy smearing●
disappearance
● detector effects
33L. Whitehead, BNL August 11, 2011
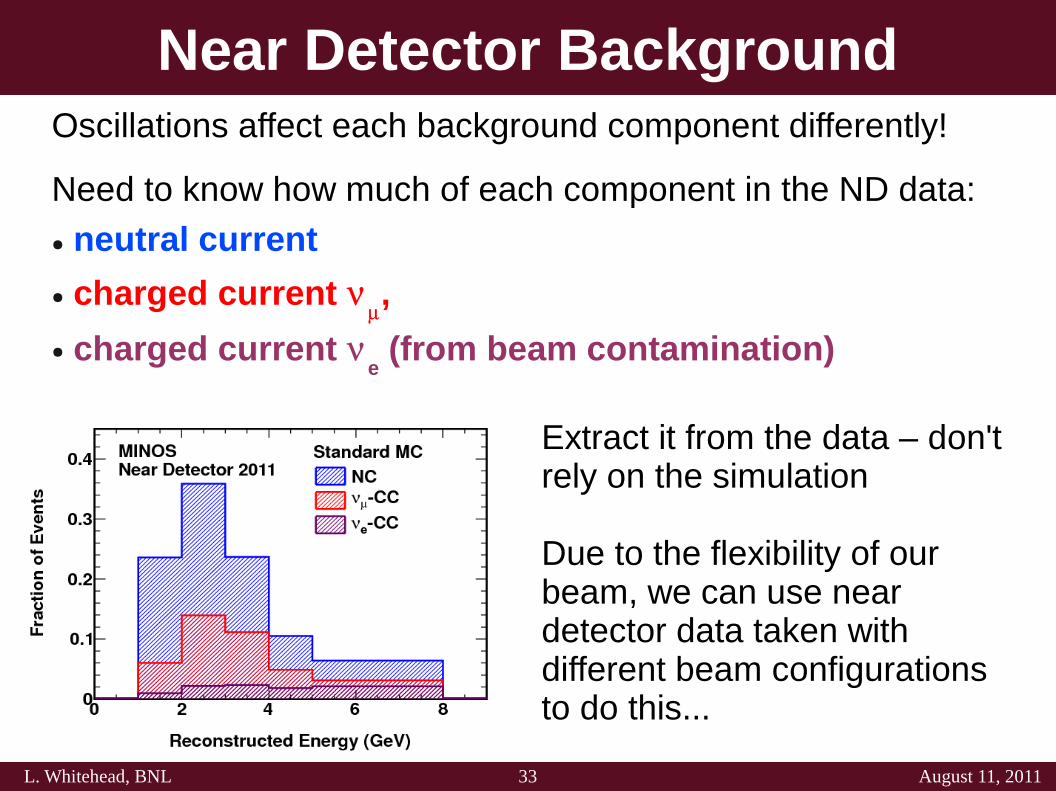
Oscillations affect each background component differently!
Need to know how much of each component in the ND data:
● neutral current
● charged current ,
● charged current e (from beam contamination)
Near Detector Background
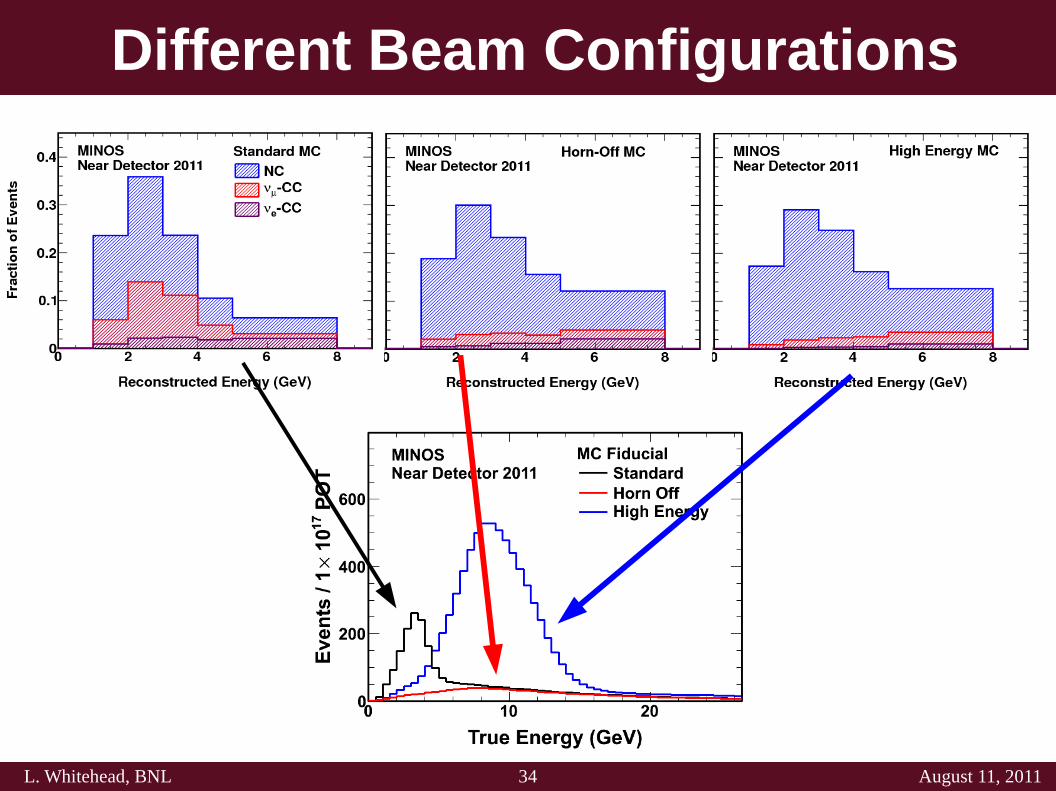
Extract it from the data – don't rely on the simulation
Due to the flexibility of our beam, we can use near detector data taken with different beam configurations to do this...
34L. Whitehead, BNL August 11, 2011
Different Beam Configurations
35L. Whitehead, BNL August 11, 2011
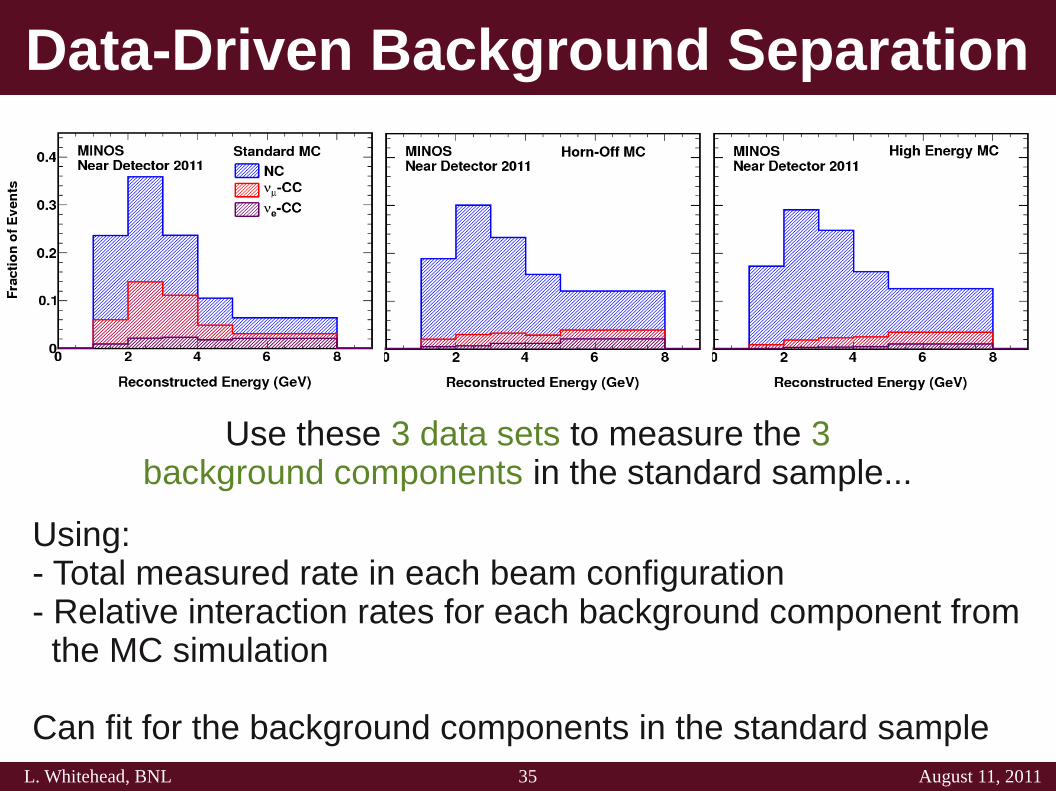
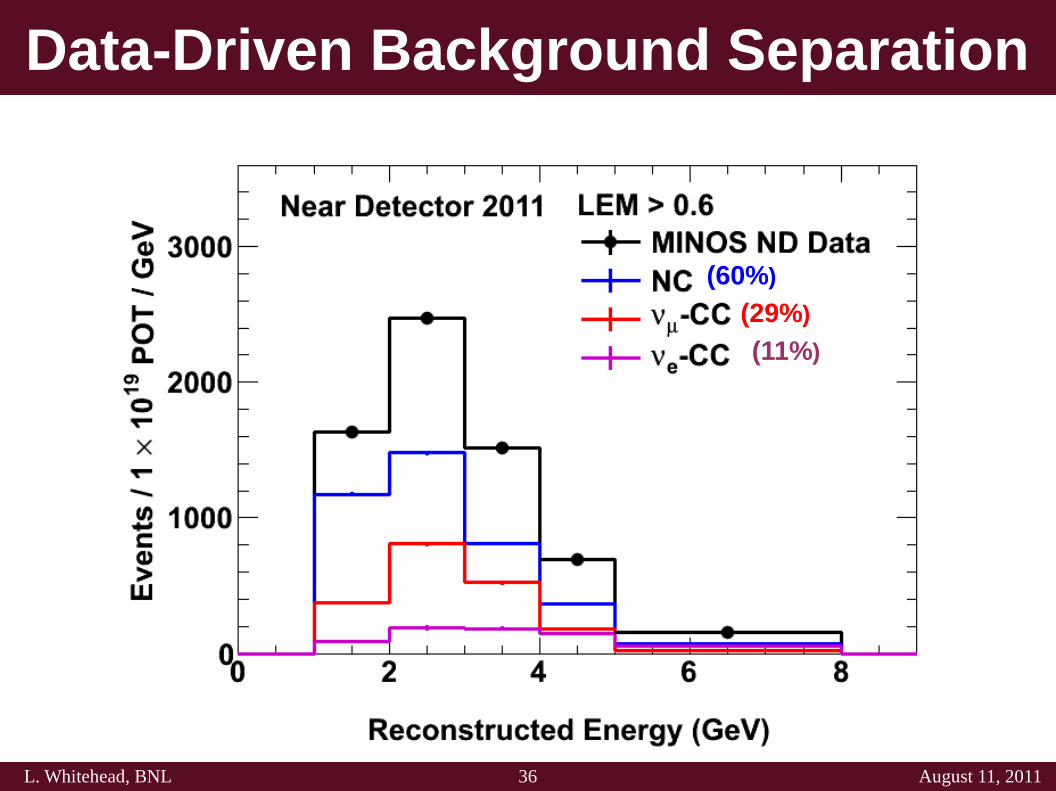
Data-Driven Background Separation
Use these 3 data sets to measure the 3 background components in the standard sample...
Using:- Total measured rate in each beam configuration- Relative interaction rates for each background component from the MC simulation
Can fit for the background components in the standard sample
36L. Whitehead, BNL August 11, 2011
Data-Driven Background Separation
(60%)
(29%)
(11%)
37L. Whitehead, BNL August 11, 2011
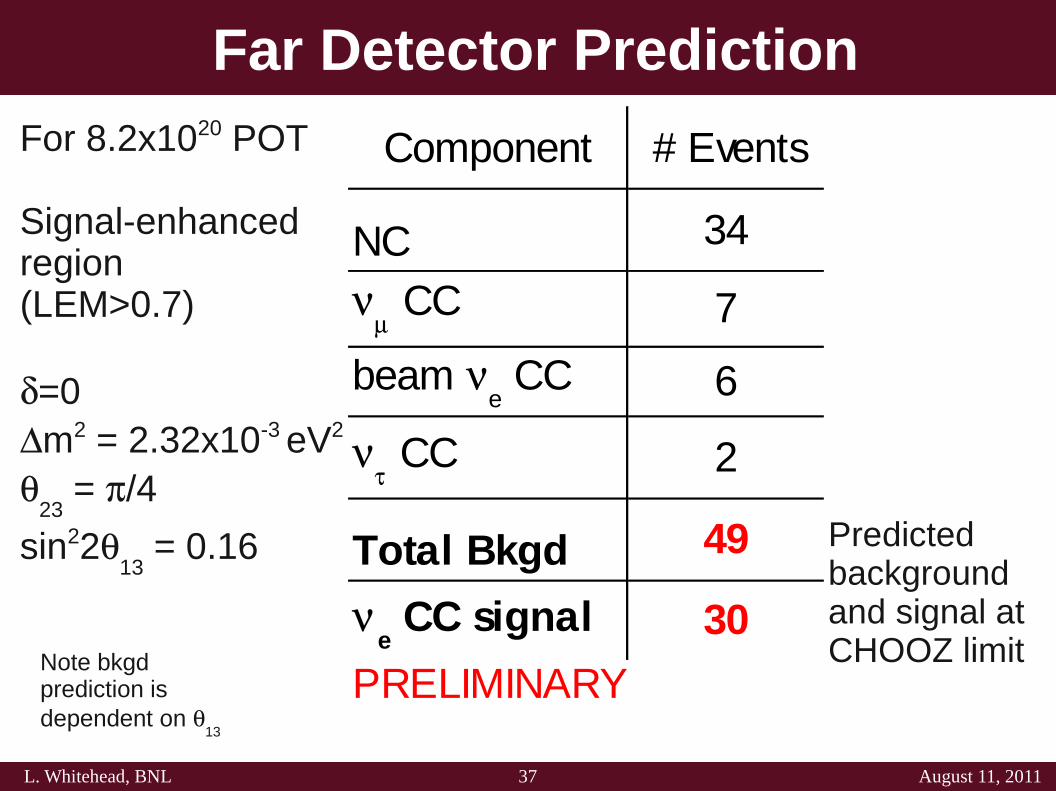
Far Detector PredictionFor 8.2x10²⁰ POT
Signal-enhanced region(LEM>0.7)
=0m2 = 2.32x10⁻³ eV2
23
= /4
sin2213
= 0.16
Component # Events
NC 34
7
6
2
49
30
PRELIMINARY
CC
beam e CC
CC
Total Bkgd
e CC signal
Predicted background and signal at CHOOZ limitNote bkgd
prediction is dependent on
13
38L. Whitehead, BNL August 11, 2011
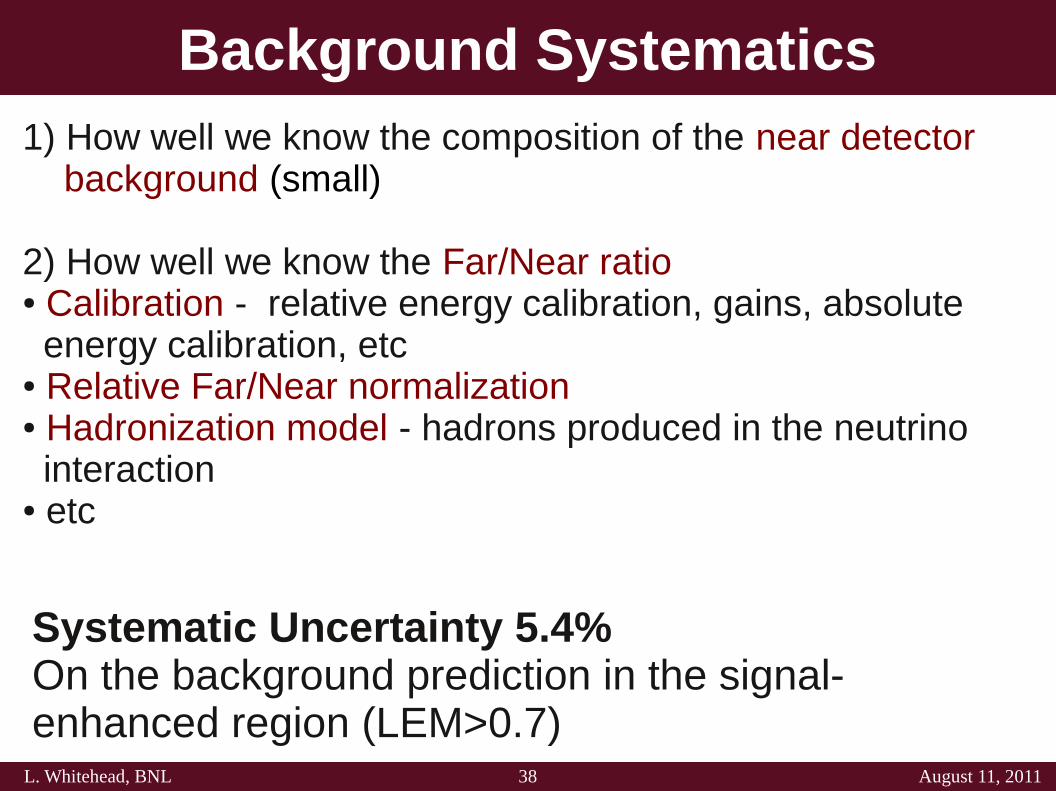
1) How well we know the composition of the near detector background (small)
2) How well we know the Far/Near ratio● Calibration - relative energy calibration, gains, absolute energy calibration, etc● Relative Far/Near normalization● Hadronization model - hadrons produced in the neutrino interaction● etc
Systematic Uncertainty 5.4%On the background prediction in the signal-enhanced region (LEM>0.7)
Background Systematics
39L. Whitehead, BNL August 11, 2011
1) Determine selection criteria for e candidate events
2) Use ND data to make a background prediction for the FD
3) Is there an excess of e-like events over the predicted
background in the FD?
40L. Whitehead, BNL August 11, 2011
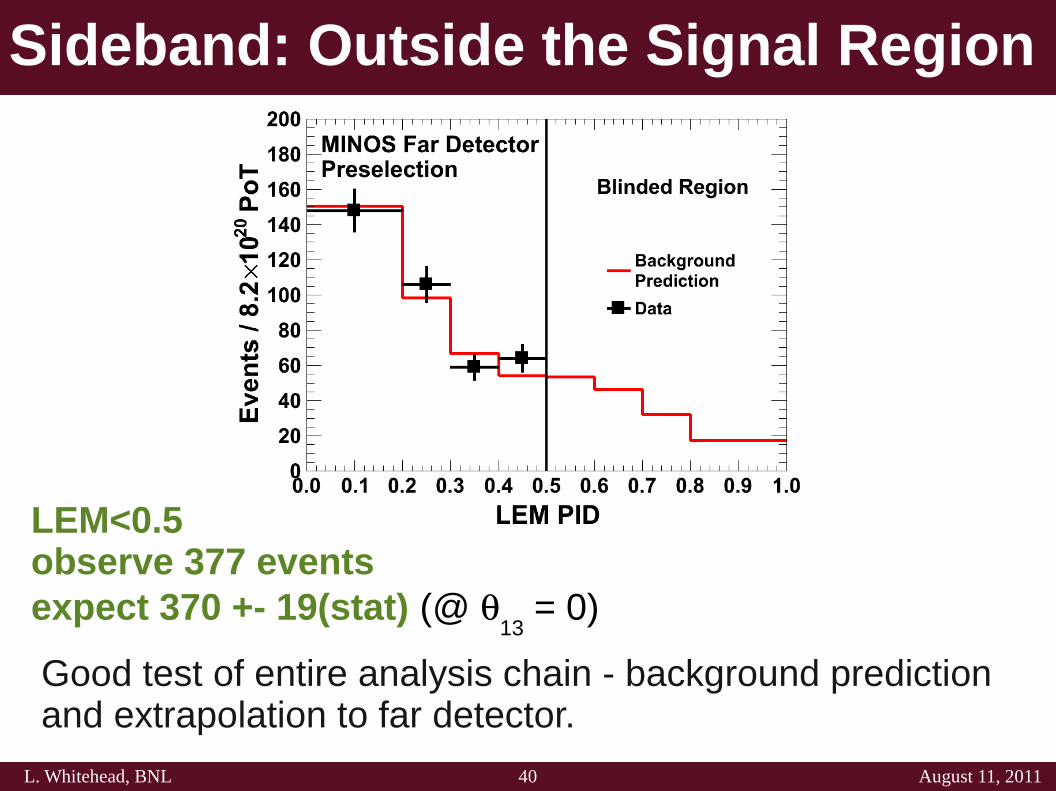
Sideband: Outside the Signal Region
LEM<0.5observe 377 eventsexpect 370 +- 19(stat) (@
13 = 0)
Good test of entire analysis chain - background prediction and extrapolation to far detector.
41L. Whitehead, BNL August 11, 2011
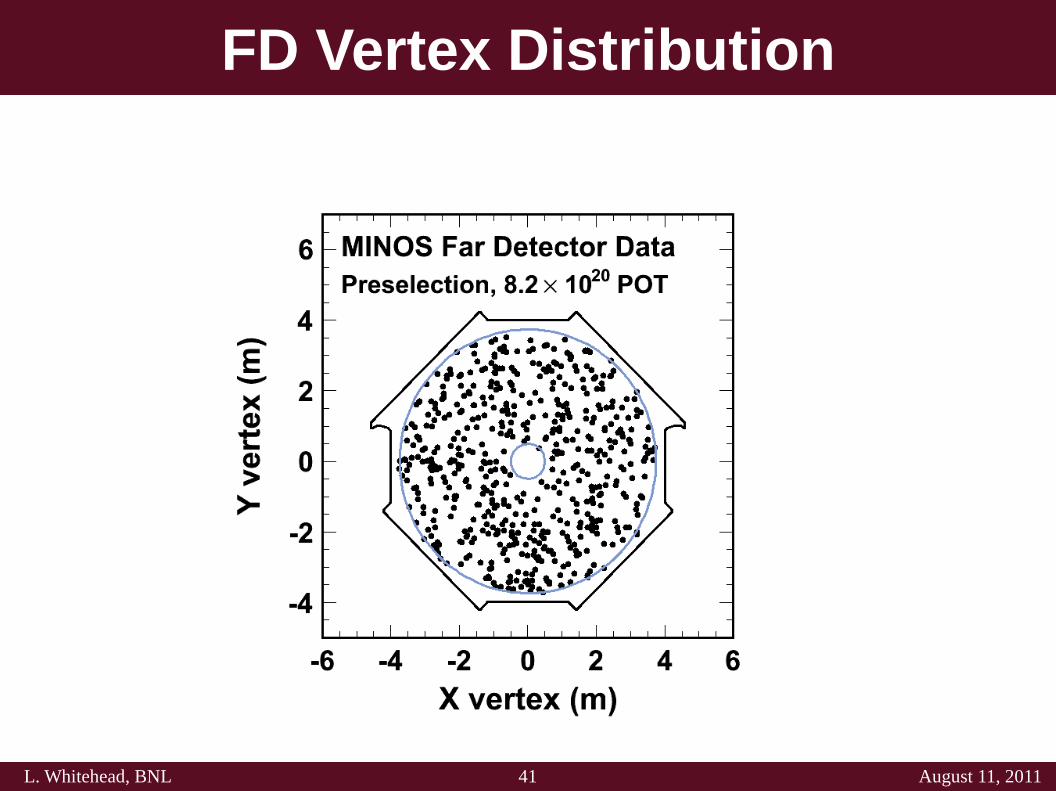
FD Vertex Distribution
42L. Whitehead, BNL August 11, 2011
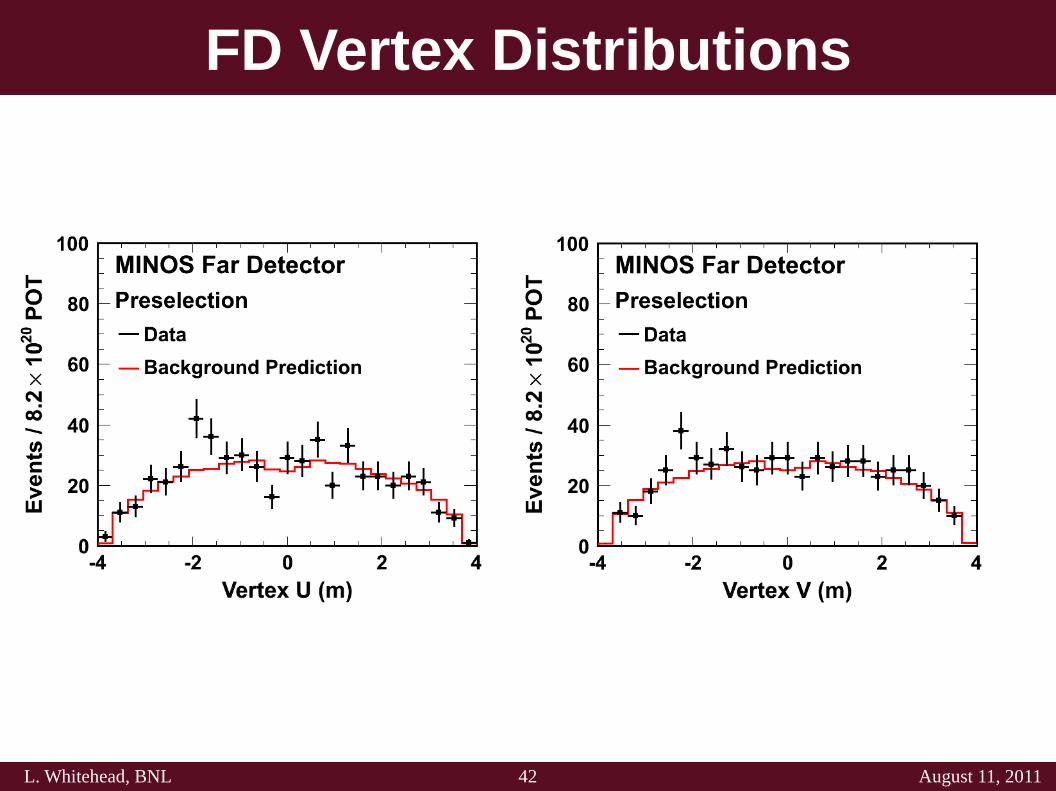
FD Vertex Distributions
43L. Whitehead, BNL August 11, 2011
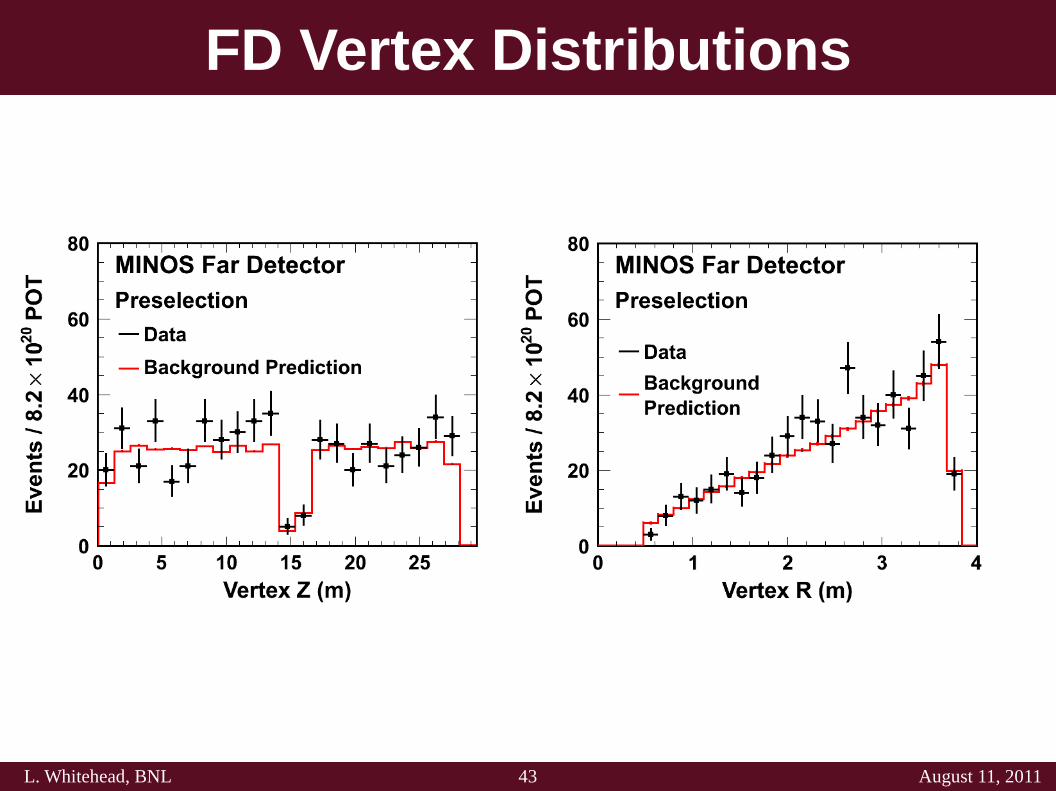
FD Vertex Distributions
44L. Whitehead, BNL August 11, 2011
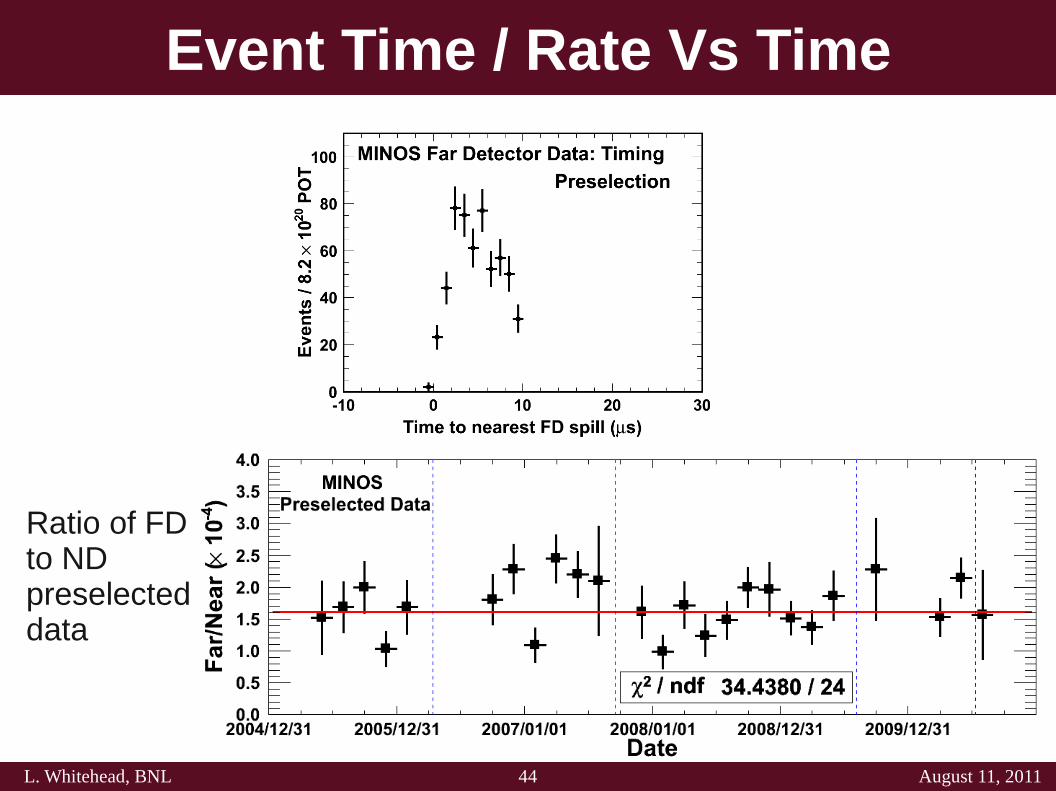
Event Time / Rate Vs Time
Ratio of FD to ND preselected data
45L. Whitehead, BNL August 11, 2011
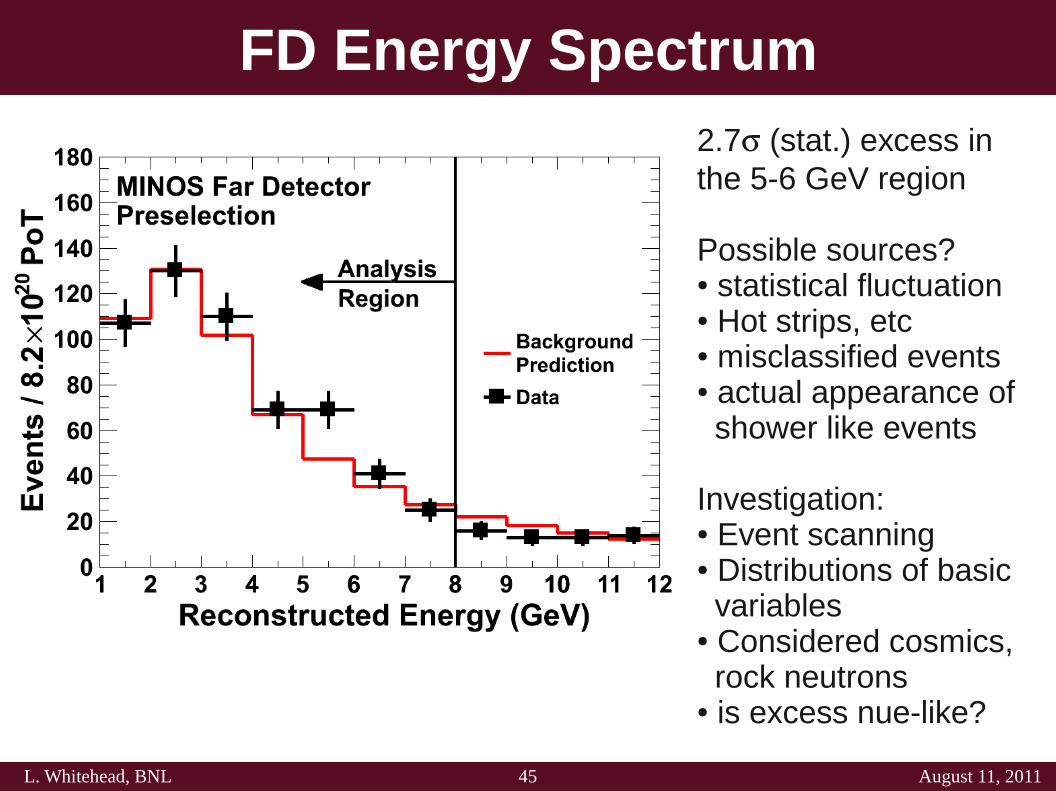
FD Energy Spectrum2.7 (stat.) excess in the 5-6 GeV region
Possible sources?● statistical fluctuation● Hot strips, etc● misclassified events ● actual appearance of shower like events Investigation:● Event scanning● Distributions of basic variables● Considered cosmics, rock neutrons● is excess nue-like?
46L. Whitehead, BNL August 11, 2011
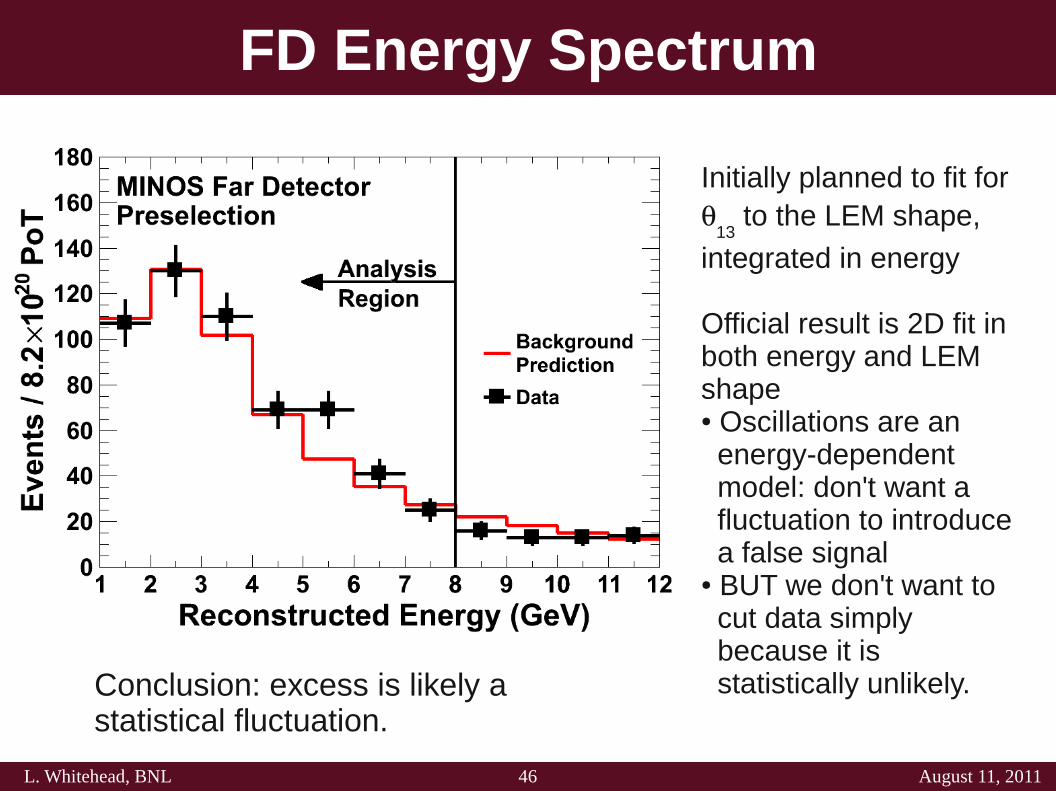
FD Energy Spectrum
Initially planned to fit for
13 to the LEM shape,
integrated in energy
Official result is 2D fit in both energy and LEM shape● Oscillations are an energy-dependent model: don't want a fluctuation to introduce a false signal● BUT we don't want to cut data simply because it is statistically unlikely.Conclusion: excess is likely a
statistical fluctuation.
47L. Whitehead, BNL August 11, 2011
Data in the signal region....
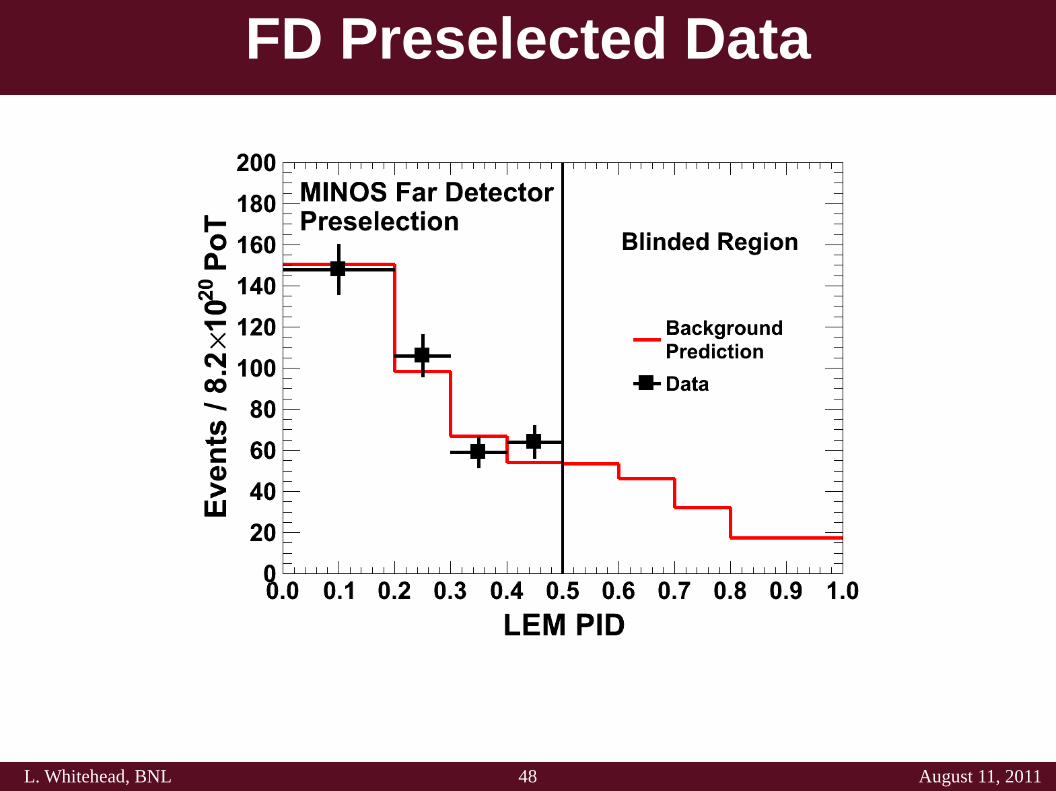
48L. Whitehead, BNL August 11, 2011
FD Preselected Data
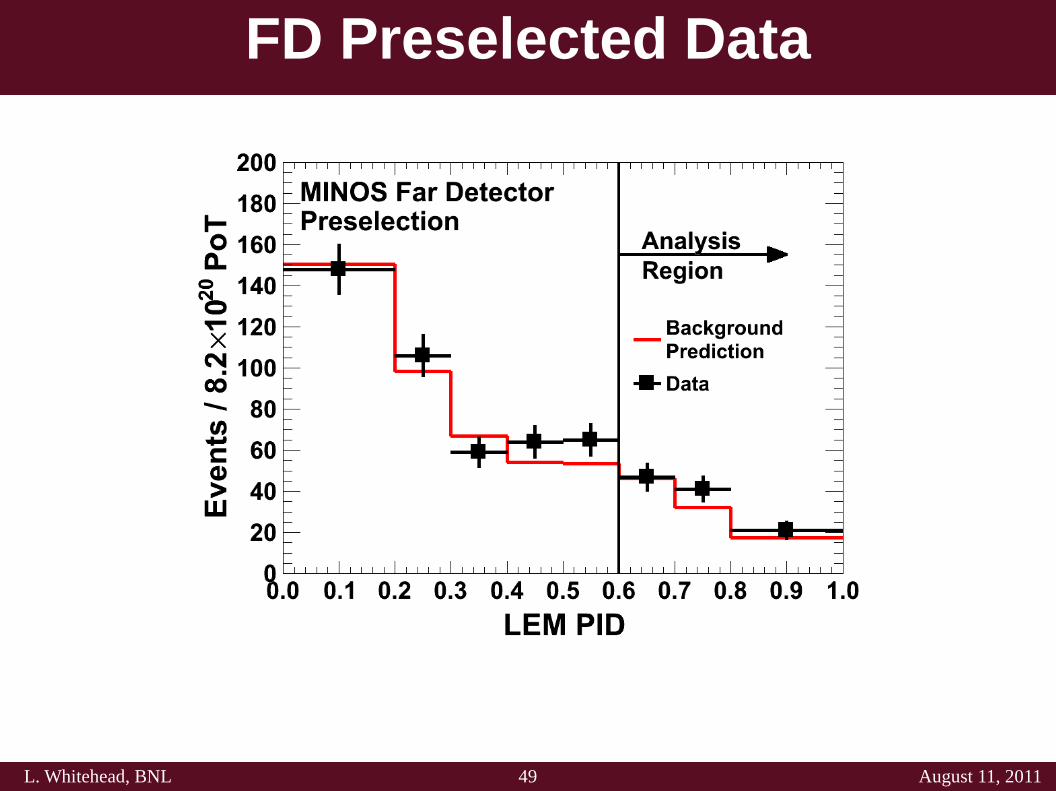
49L. Whitehead, BNL August 11, 2011
FD Preselected Data
50L. Whitehead, BNL August 11, 2011
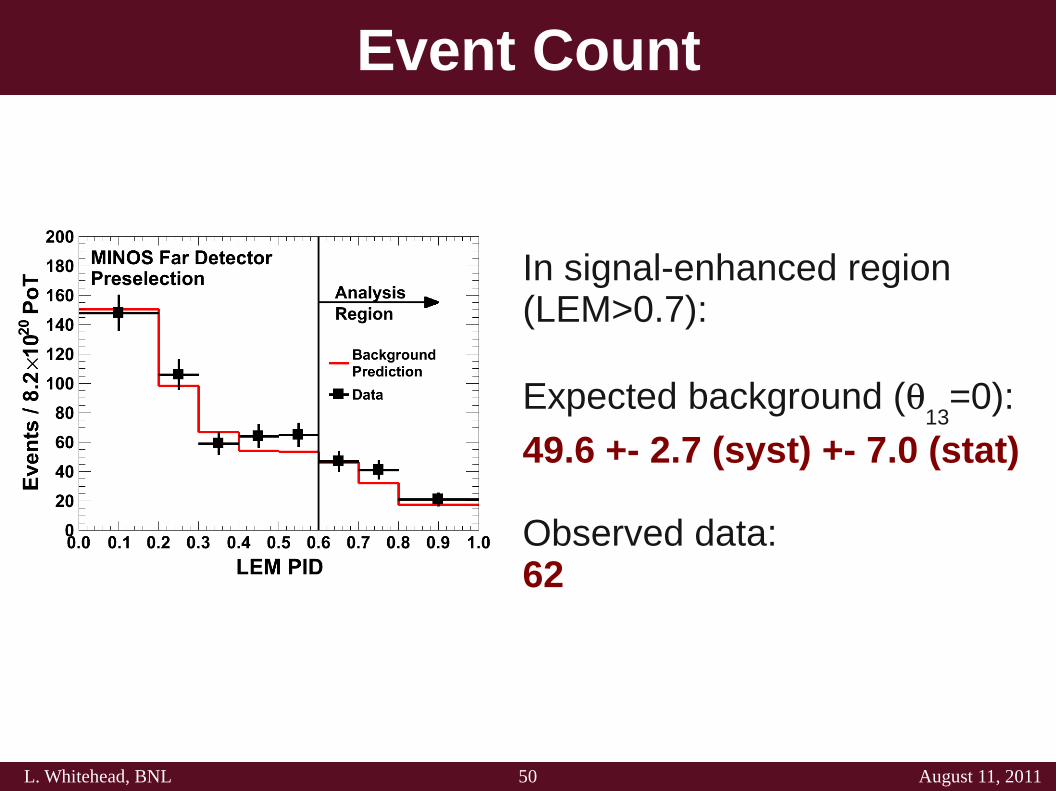
Event Count
In signal-enhanced region(LEM>0.7):
Expected background (13
=0):
49.6 +- 2.7 (syst) +- 7.0 (stat)
Observed data:62
51L. Whitehead, BNL August 11, 2011
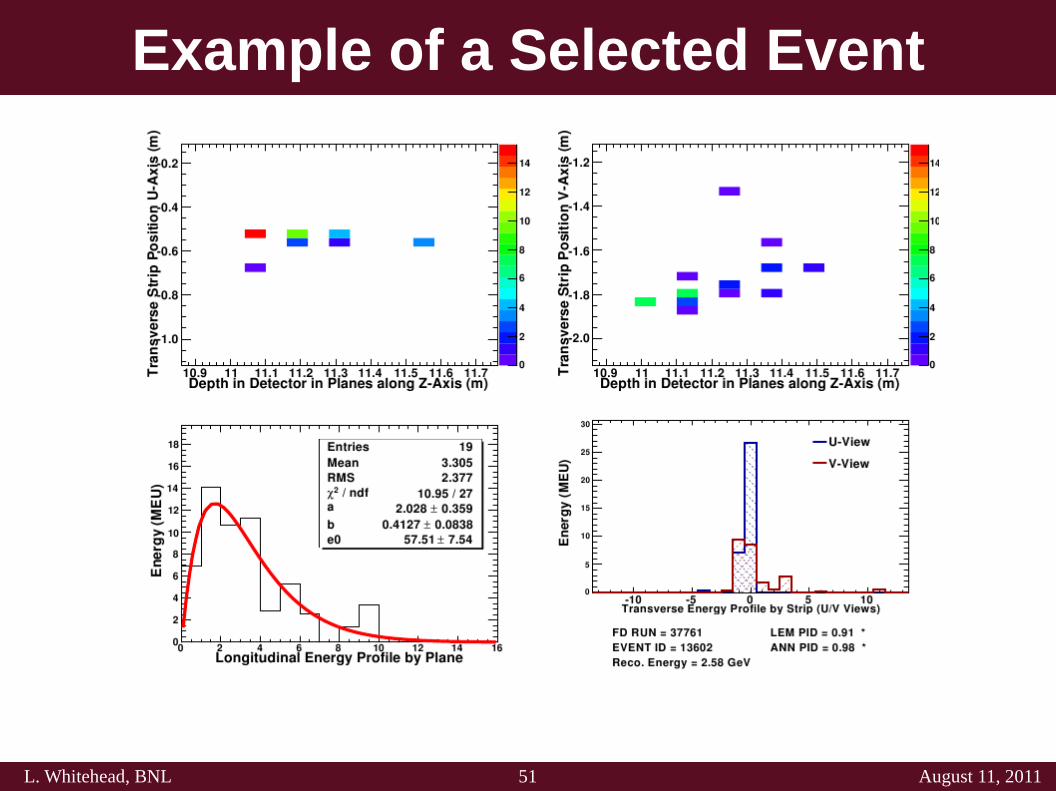
Example of a Selected Event
52L. Whitehead, BNL August 11, 2011
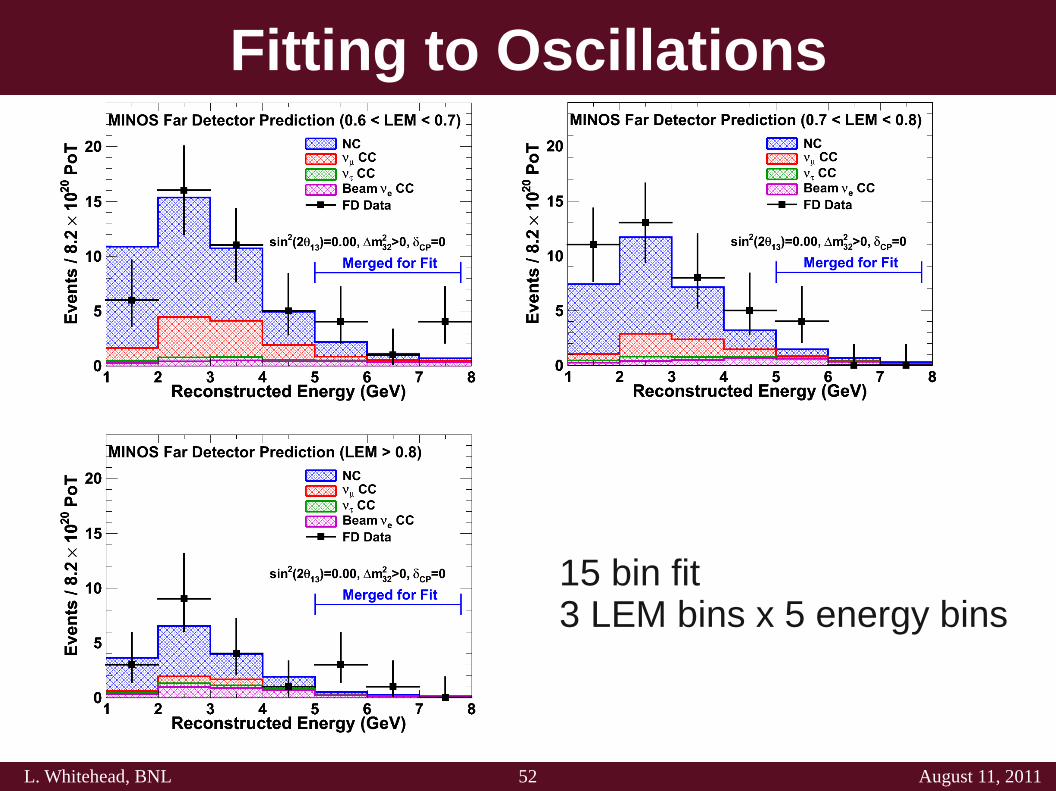
Fitting to Oscillations
15 bin fit3 LEM bins x 5 energy bins
53L. Whitehead, BNL August 11, 2011
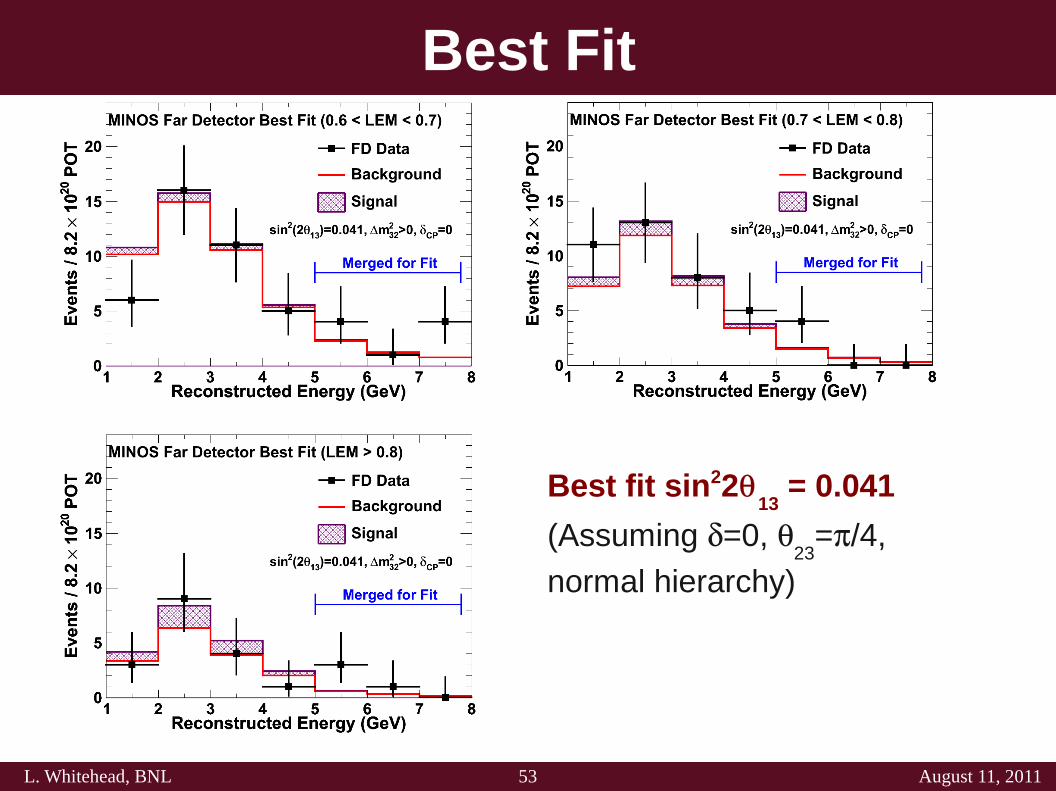
Best Fit
Best fit sin2213
= 0.041
(Assuming =0, 23
=/4,
normal hierarchy)
54L. Whitehead, BNL August 11, 2011
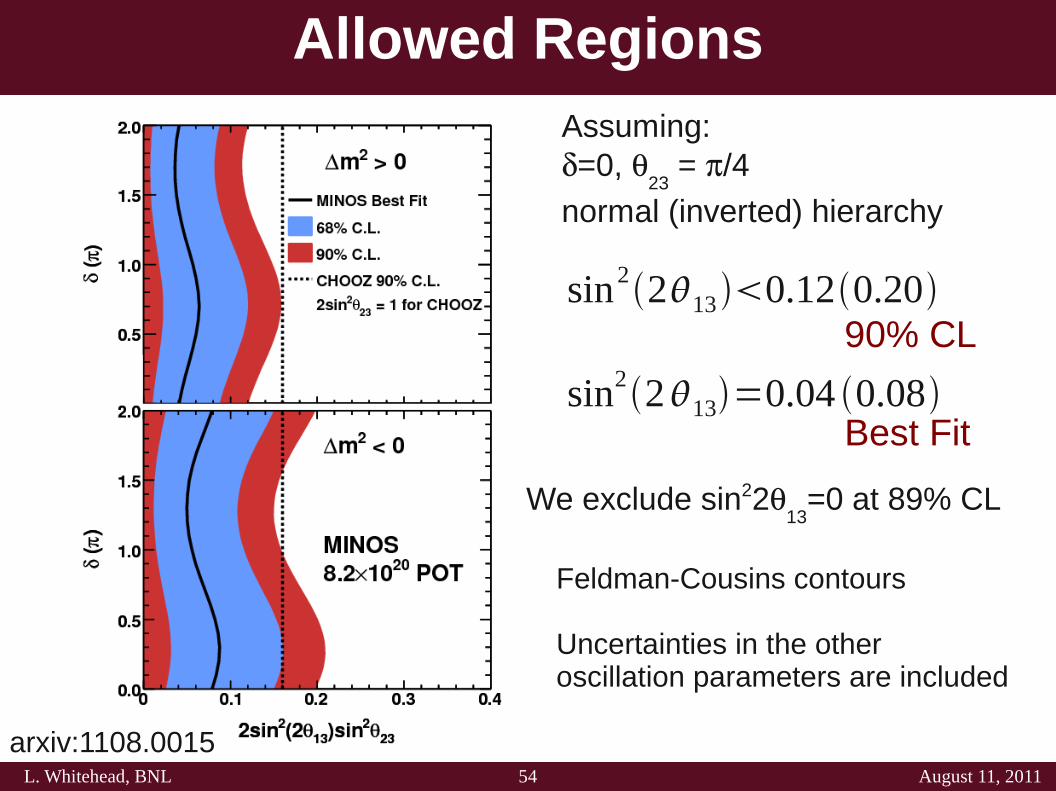
Allowed Regions
Feldman-Cousins contours
Uncertainties in the other oscillation parameters are included
Assuming:=0,
23 = /4
normal (inverted) hierarchy
sin22130.120.20
sin2213=0.04 0.08
90% CL
Best Fit
We exclude sin2213
=0 at 89% CL
arxiv:1108.0015
55L. Whitehead, BNL August 11, 2011
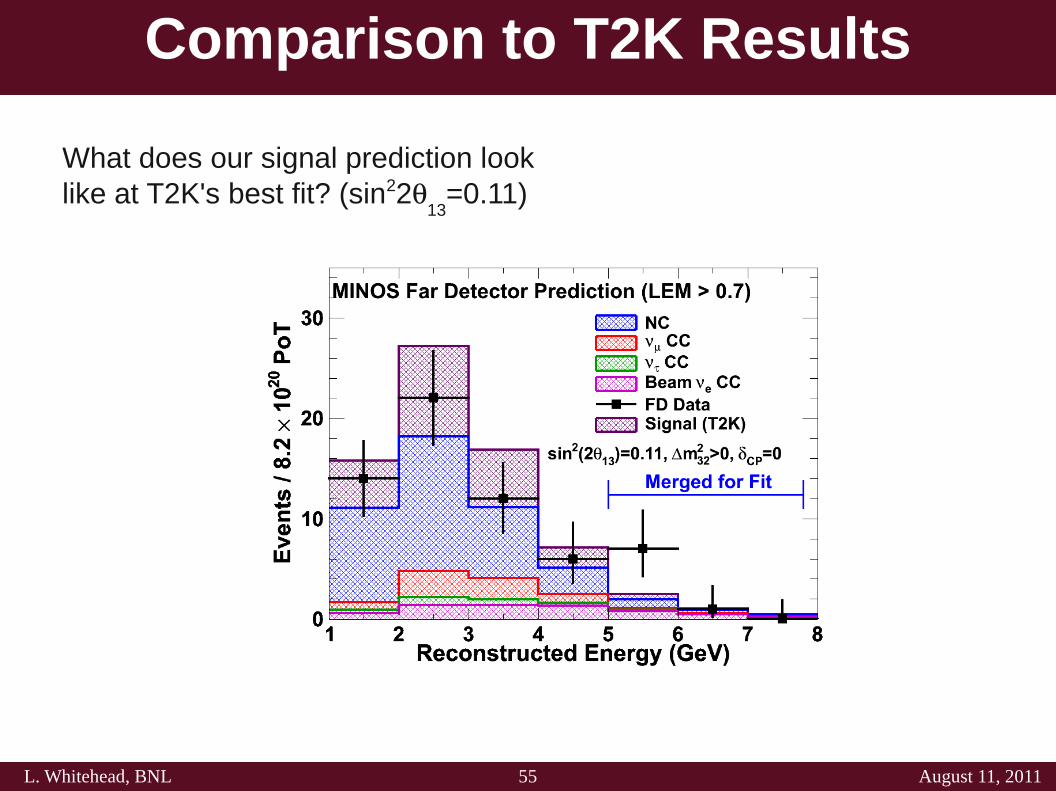
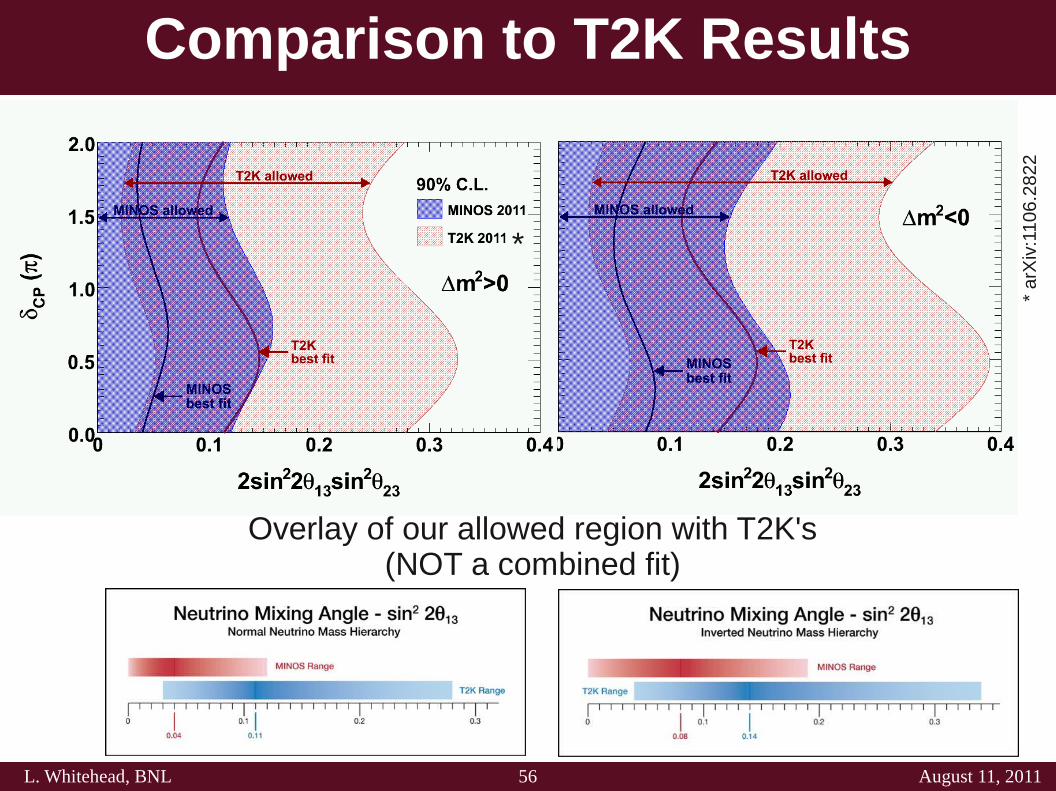
Comparison to T2K Results
What does our signal prediction look like at T2K's best fit? (sin22
13=0.11)
56L. Whitehead, BNL August 11, 2011
Comparison to T2K Results
Overlay of our allowed region with T2K's(NOT a combined fit)
* ar
Xiv
:11 0
6.28
22
*
57L. Whitehead, BNL August 11, 2011
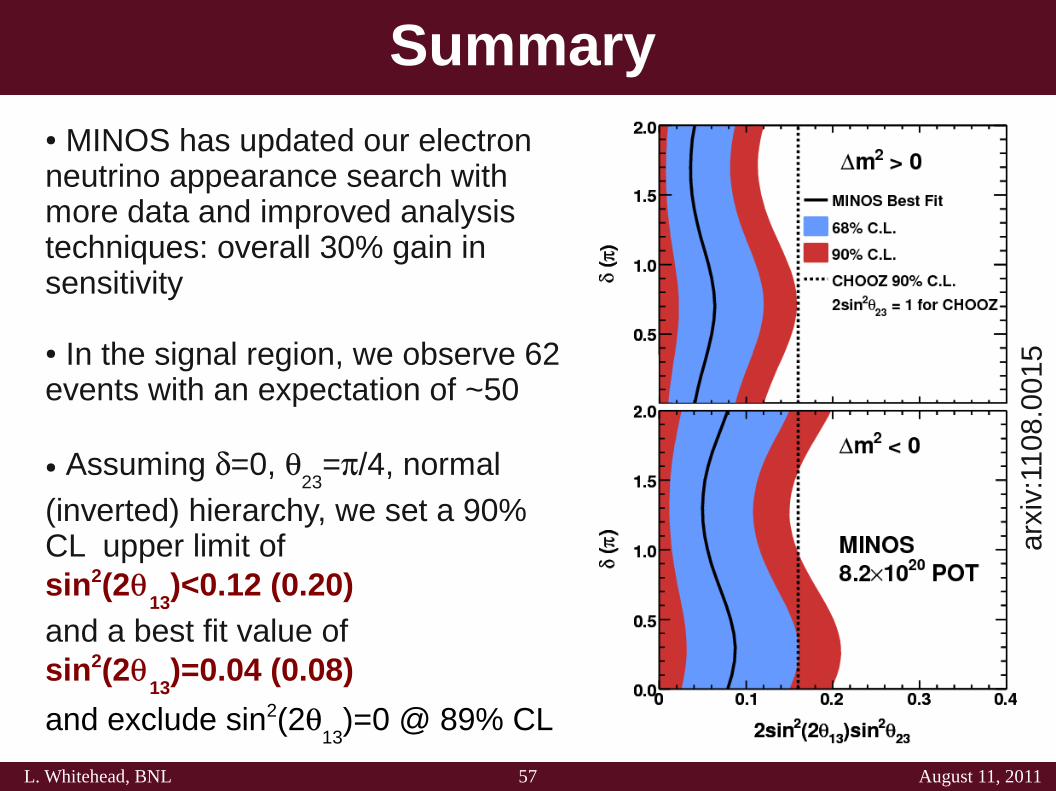
Summary● MINOS has updated our electron neutrino appearance search with more data and improved analysis techniques: overall 30% gain in sensitivity ● In the signal region, we observe 62 events with an expectation of ~50 ● Assuming =0,
23=/4, normal
(inverted) hierarchy, we set a 90% CL upper limit of sin2(2
13)<0.12 (0.20)
and a best fit value of sin2(2
13)=0.04 (0.08)
and exclude sin2(213
)=0 @ 89% CL
arxi
v:1 1
08.
001
5