Embed Size (px)
Citation preview
Noise Monitoring During Ganesh Festival 2009
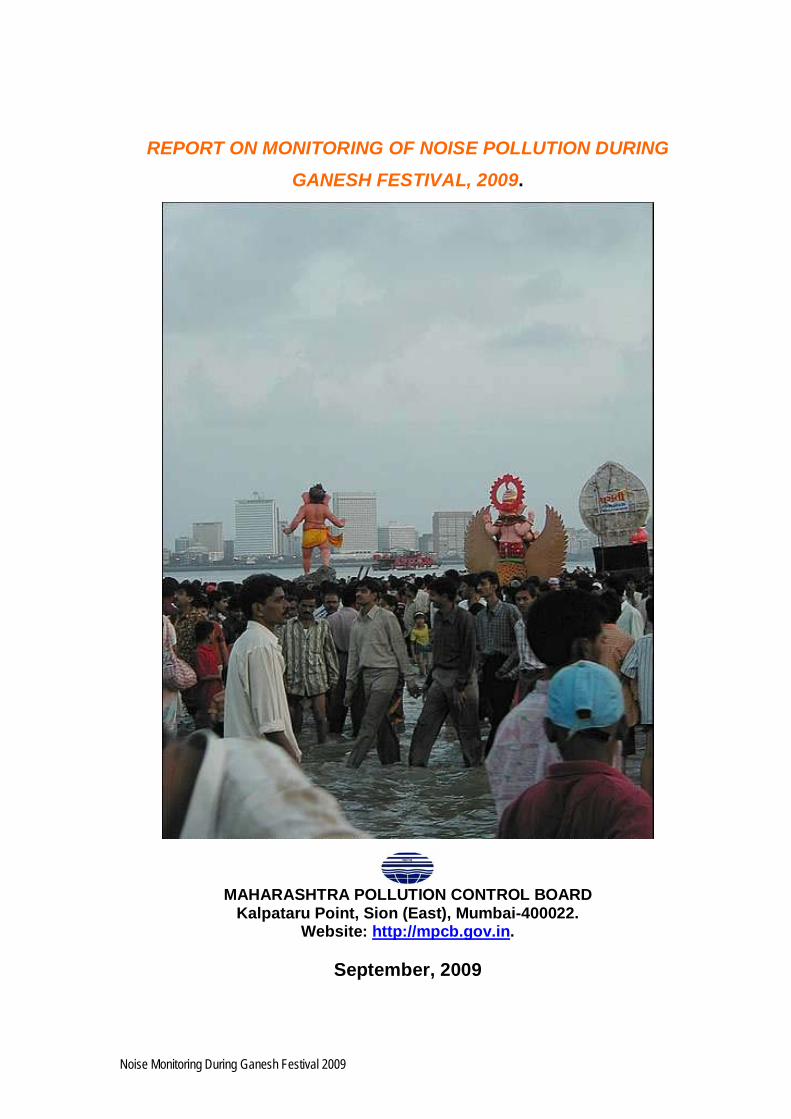
REPORT ON MONITORING OF NOISE POLLUTION DURING
GANESH FESTIVAL, 2009.
MAHARASHTRA POLLUTION CONTROL BOARD
Kalpataru Point, Sion (East), Mumbai-400022. Website: http://mpcb.gov.in.
September, 2009
Maharashtra Pollution Control Board
Noise Monitoring During Ganesh Festival 2009 2
Maharashtra Pollution Control Board
Noise Monitoring During Ganesh Festival 2009 3
CONTENTS
Sr. No. Title Page
No.
1. Introduction 4
2. Objective 4
3. Noise Pollution and its effect on Environment
4
4. Noise Level Measurement and Noise Pollution Standards
4
5. Methodology of the survey 5
6. Noise Levels at Various Locations in the City
8
7. Detailed Result of all the cities 17
8. Conclusion 35
9. Photographs of the event 37
Maharashtra Pollution Control Board
Noise Monitoring During Ganesh Festival 2009 4
1. Introduction Ganesha Chaturthi, the Ganesha festival, also known as 'Vinayak Chaturthi' or 'Vinayaka Chavithi' is celebrated by Hindus around the world as the birthday of Lord Ganesha. It is observed during mid-August to mid-September and the grandest and most elaborate of them, especially in the western Indian state of Maharashtra, lasts for 10 days, ending on the day of 'Ananta Chaturdashi'. After 10 days, Ganesh idols are immersed in the water bodies. Large number of people participate in the festival and the immersion procession on the last day. Vocal music and musical instruments during the festival causes high levels of noise. In general, ambient levels of noise increase considerably. In order to access the situation of noise levels in various cities across the state, Maharashtra Pollution Control Board has carried out the survey for 5 days during Ganesh festival from August 30th to September 03rd.
2. Objective The objective of this exercise is to assess the problem faced by the residents when the noise levels of their surroundings exceed the permissible limit. Young generation (students) are to be involved who will act as messengers on environmental awareness and explain the passerby, who show interest in noise measurement.
3. Noise Pollution and its effect on Environment Noise is defined as the undesirable sound. Sound which pleases the listeners is music and that which causes pain and annoyance is noise. At times what is music for some can be noise for others. To some people the roar of an engine is satisfying or thrilling and to others it may be annoying. Noise is transient; once the pollution stops, the environment is free of it. We can measure individual sounds that may damage human hearing, but it is difficult to monitor cumulative exposure to noise. The effect of noise pollution is multifaceted and inter related. The effect of noise pollution can lead to decrease in efficiency, lack of concentration, fatigue, increase in blood pressure, temporary deafness, could lead to abortion etc.
4. Noise Level Measurement and Noise Pollution Standards A decibel is the standard for the measurement of noise. The zero on a decibel scale is at the threshold of hearing, the lowest sound pressure that can be heard. According to D.B. Smith, 20 dB is whisper, 40 dB is quiet office, 60 dB is normal conversation and 80 dB is the level at which sound becomes physically painful. Noise is measured in decibels (dBA). ‘A’ symbol indicates a measurement of a logarithmic scale. In each case, the actual measurement ‘a’ is compared to a fixed reference level ‘r’ and the “decibel” value is defined to be 10 log 10 (a/r). ‘A’ weighing filters out lower frequencies very severely. Fast responses closely match to the simulations of Human ear sensitivity. Fast response (125 to 200 milli-seconds) was selected to measure noise levels. The human response to Noise depends upon the frequency of the sound, the type of noise (continuous, intermittent or impulsive) and the time (day or night) it occurs.
Noise has been recognised as ambient air pollutant. Standards in this regard are laid down under The Environment (Protection) Act, 1986 (and rules made there under) and under the Model Rules of the Factories Act, 1948 for occupational health and safety purposes.
Maharashtra Pollution Control Board
Noise Monitoring During Ganesh Festival 2009 5
The Central Pollution Control Board constituted a National Committee of Experts on Noise Pollution Control. The Committee recommended noise standards for ambient air and for automobiles, domestic appliances and construction equipment, which were later notified under The Environment (Protection) Act, 1986 as given below:
Limits in dB(A) , Leq Area Code Category of Area Day time Night time A Industrial area 75 70 B Commercial area 65 55 C Residential Area 55 45 D Silence Zone 50 40
Note: (i) Day time is reckoned from 6 A.M. To 10 PM. (ii) Night time is reckoned in from 10 P.M. and 6 A.M.
(iii) Silence zone is referred as areas within 100 meters around premises such as hospitals, educational institutions and courts. The Silence zones are to be declared by the Competent Authority.
(iv) Use of vehicular horns, loudspeakers and bursting of crackers shall be banned in these zones.
(v) Mixed categories of areas should be declared as one of the four above mentioned categories by the Competent Authority and the corresponding standards shall apply.
5. Methodology of the survey
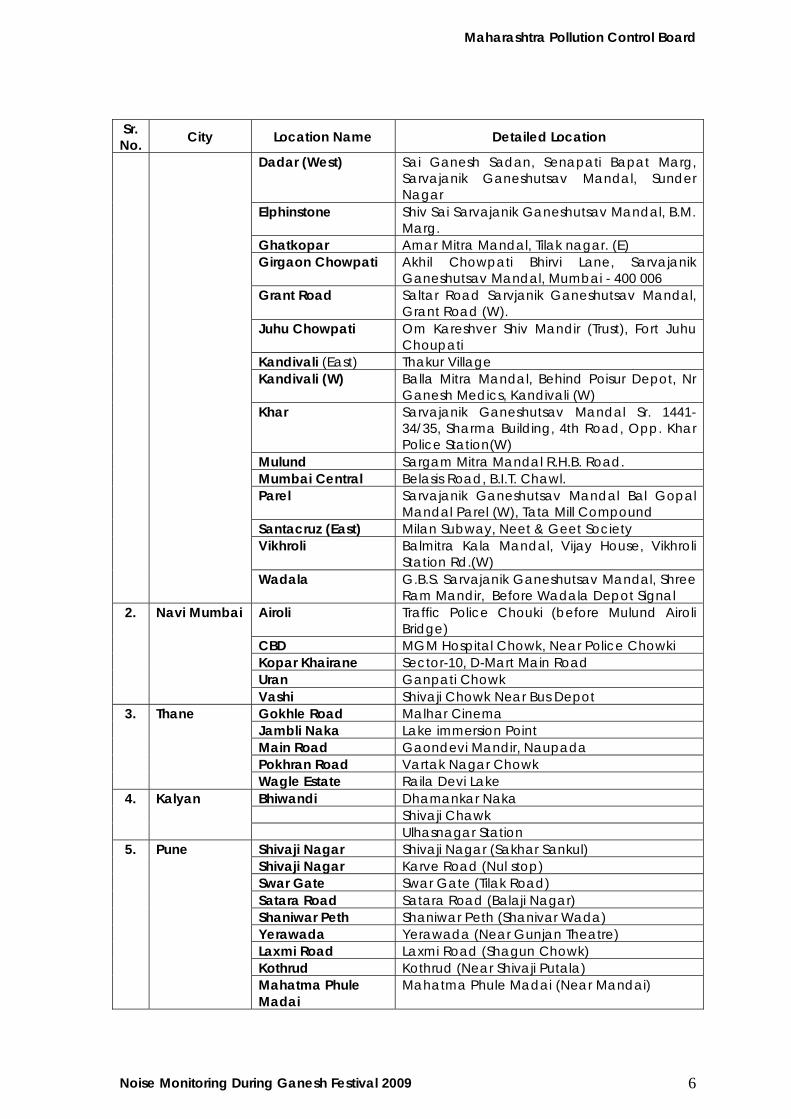
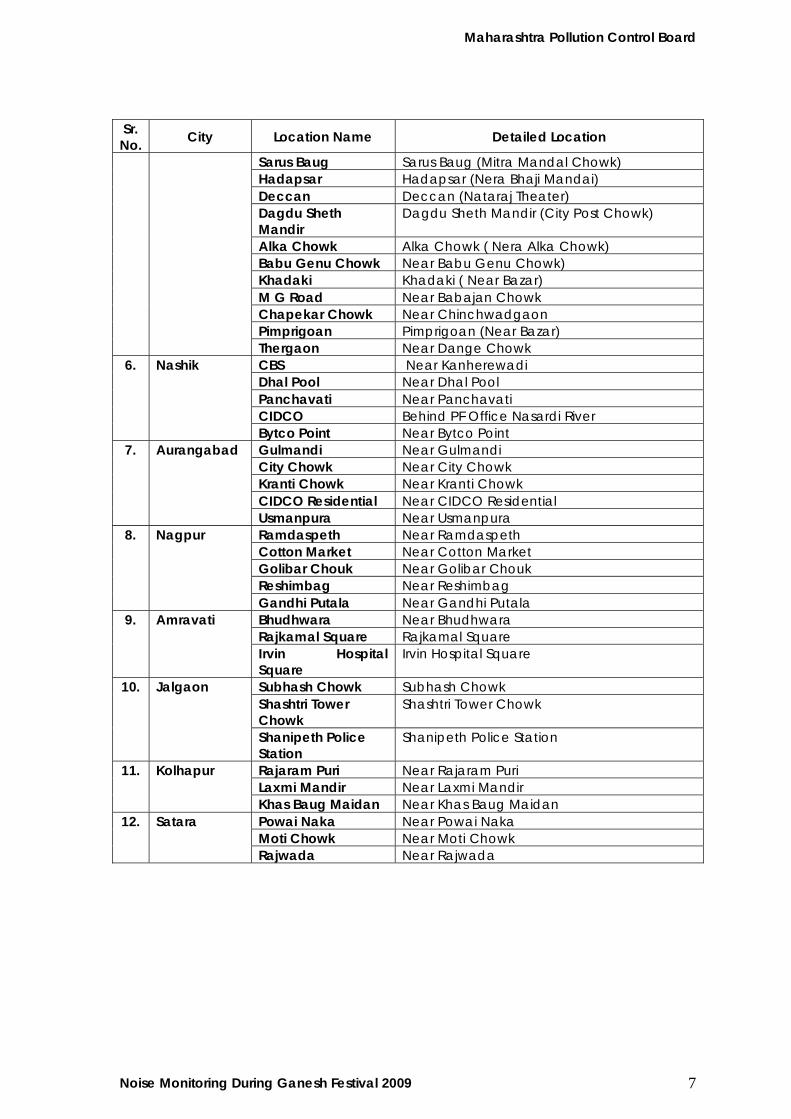
The noise pollution monitoring was carried out from August 30th to September 03rd 2009. Noise level measurement was done from 1800 hrs upto midnight (2400 hrs). The monitoring was carried out at a distance from Ganesh Pandals, closer to the residential buildings. The main purpose of this exercise was to determine how the environment is disturbed and what effect it has on a normal human being residing in that area or closer to the area. There were a total of 85 locations covered during Ganesh festival in Maharashtra. The detailed list of location is as follows:-
Sr. No. City Location Name Detailed Location
Andheri Azad Nagar, Sarvajanik Utsav Samiti, Vir Desai Marg, Andheri (W)
Bandra Sarvajanik Ganeshutsav Mandal-Sr.A2329, S.V. Road, Bandra (W)
Bhandup Jay Bajrang Mitra Mandal (Bhandup Samrat), Bhandup Station Rd (W)
Borivali Manav Mitra Mandal, L.T. Road(W) Byculla Sarvajanik Ganeshutsav mandal, Dr.
Ambedkar Marg, (E) Chembur (East) Near Ashish Talao / Ashish Theatre Chembur (West) Sahyadri Krida Mandal Tilak Nagar. Chinchpokali (E) Lalbaug Raja Sarvajanik Ganeshutsav
Mandal Chinchpokali (W) Parsiwadi Mitra Mandal, Auther Road Naka,
Sarvajanik Ganeshutsav Mandal
1. Mumbai
Dadar (East) Khodadad Circle, Dadar TT
Maharashtra Pollution Control Board
Noise Monitoring During Ganesh Festival 2009 6
Sr. No. City Location Name Detailed Location
Dadar (West) Sai Ganesh Sadan, Senapati Bapat Marg, Sarvajanik Ganeshutsav Mandal, Sunder Nagar
Elphinstone Shiv Sai Sarvajanik Ganeshutsav Mandal, B.M. Marg.
Ghatkopar Amar Mitra Mandal, Tilak nagar. (E) Girgaon Chowpati Akhil Chowpati Bhirvi Lane, Sarvajanik
Ganeshutsav Mandal, Mumbai - 400 006 Grant Road Saltar Road Sarvjanik Ganeshutsav Mandal,
Grant Road (W). Juhu Chowpati Om Kareshver Shiv Mandir (Trust), Fort Juhu
Choupati Kandivali (East) Thakur Village Kandivali (W) Balla Mitra Mandal, Behind Poisur Depot, Nr
Ganesh Medics, Kandivali (W) Khar Sarvajanik Ganeshutsav Mandal Sr. 1441-
34/35, Sharma Building, 4th Road, Opp. Khar Police Station(W)
Mulund Sargam Mitra Mandal R.H.B. Road. Mumbai Central Belasis Road, B.I.T. Chawl. Parel Sarvajanik Ganeshutsav Mandal Bal Gopal
Mandal Parel (W), Tata Mill Compound Santacruz (East) Milan Subway, Neet & Geet Society Vikhroli Balmitra Kala Mandal, Vijay House, Vikhroli
Station Rd.(W) Wadala G.B.S. Sarvajanik Ganeshutsav Mandal, Shree
Ram Mandir, Before Wadala Depot Signal Airoli Traffic Police Chouki (before Mulund Airoli
Bridge) CBD MGM Hospital Chowk, Near Police Chowki Kopar Khairane Sector-10, D-Mart Main Road Uran Ganpati Chowk
2. Navi Mumbai
Vashi Shivaji Chowk Near Bus Depot Gokhle Road Malhar Cinema Jambli Naka Lake immersion Point Main Road Gaondevi Mandir, Naupada Pokhran Road Vartak Nagar Chowk
3. Thane
Wagle Estate Raila Devi Lake Bhiwandi Dhamankar Naka Shivaji Chawk
4. Kalyan
Ulhasnagar Station Shivaji Nagar Shivaji Nagar (Sakhar Sankul) Shivaji Nagar Karve Road (Nul stop) Swar Gate Swar Gate (Tilak Road) Satara Road Satara Road (Balaji Nagar) Shaniwar Peth Shaniwar Peth (Shanivar Wada) Yerawada Yerawada (Near Gunjan Theatre) Laxmi Road Laxmi Road (Shagun Chowk) Kothrud Kothrud (Near Shivaji Putala)
5. Pune
Mahatma Phule Madai
Mahatma Phule Madai (Near Mandai)
Maharashtra Pollution Control Board
Noise Monitoring During Ganesh Festival 2009 7
Sr. No. City Location Name Detailed Location
Sarus Baug Sarus Baug (Mitra Mandal Chowk) Hadapsar Hadapsar (Nera Bhaji Mandai) Deccan Deccan (Nataraj Theater) Dagdu Sheth Mandir
Dagdu Sheth Mandir (City Post Chowk)
Alka Chowk Alka Chowk ( Nera Alka Chowk) Babu Genu Chowk Near Babu Genu Chowk) Khadaki Khadaki ( Near Bazar) M G Road Near Babajan Chowk Chapekar Chowk Near Chinchwadgaon Pimprigoan Pimprigoan (Near Bazar)
Thergaon Near Dange Chowk CBS Near Kanherewadi Dhal Pool Near Dhal Pool Panchavati Near Panchavati CIDCO Behind PF Office Nasardi River
6. Nashik
Bytco Point Near Bytco Point Gulmandi Near Gulmandi City Chowk Near City Chowk Kranti Chowk Near Kranti Chowk CIDCO Residential Near CIDCO Residential
7. Aurangabad
Usmanpura Near Usmanpura Ramdaspeth Near Ramdaspeth Cotton Market Near Cotton Market Golibar Chouk Near Golibar Chouk Reshimbag Near Reshimbag
8. Nagpur
Gandhi Putala Near Gandhi Putala Bhudhwara Near Bhudhwara Rajkamal Square Rajkamal Square
9. Amravati
Irvin Hospital Square
Irvin Hospital Square
Subhash Chowk Subhash Chowk Shashtri Tower Chowk
Shashtri Tower Chowk 10. Jalgaon
Shanipeth Police Station
Shanipeth Police Station
Rajaram Puri Near Rajaram Puri Laxmi Mandir Near Laxmi Mandir
11. Kolhapur
Khas Baug Maidan Near Khas Baug Maidan Powai Naka Near Powai Naka Moti Chowk Near Moti Chowk
12. Satara
Rajwada Near Rajwada
Maharashtra Pollution Control Board
Noise Monitoring During Ganesh Festival 2009 8
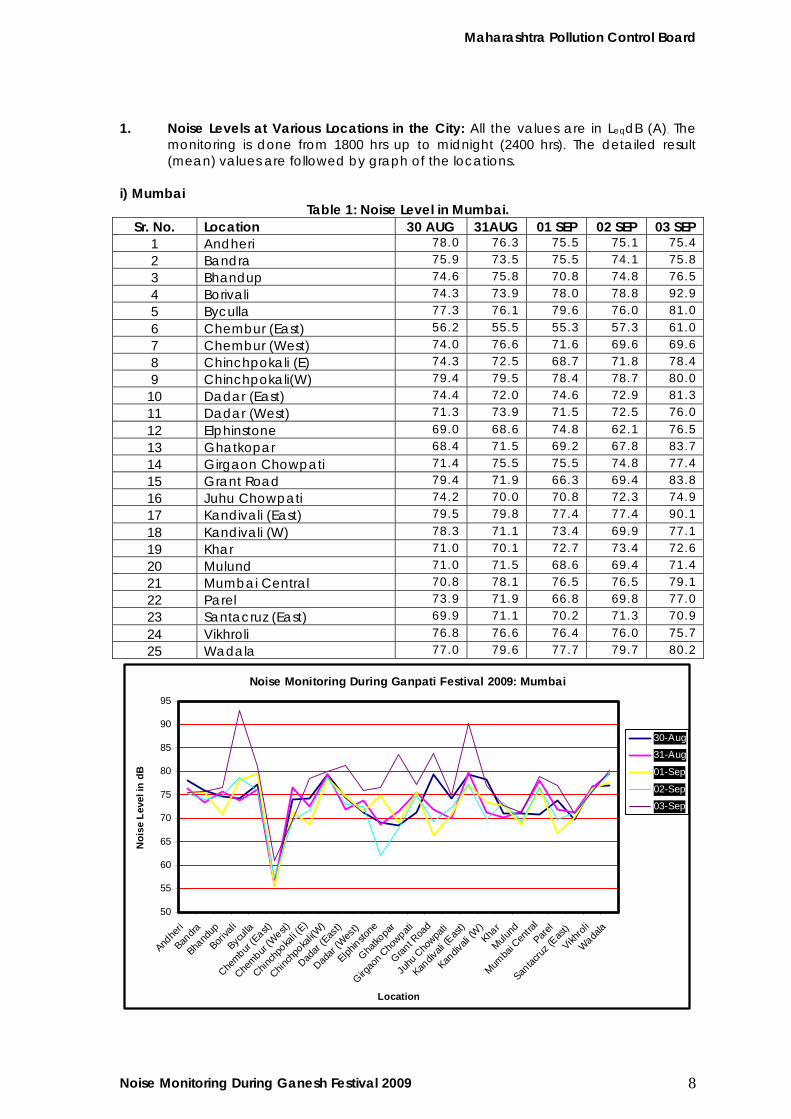
1. Noise Levels at Various Locations in the City: All the values are in LeqdB (A). The monitoring is done from 1800 hrs up to midnight (2400 hrs). The detailed result (mean) values are followed by graph of the locations.
i) Mumbai
Table 1: Noise Level in Mumbai. Sr. No. Location 30 AUG 31AUG 01 SEP 02 SEP 03 SEP
1 Andheri 78.0 76.3 75.5 75.1 75.4
2 Bandra 75.9 73.5 75.5 74.1 75.8
3 Bhandup 74.6 75.8 70.8 74.8 76.5
4 Borivali 74.3 73.9 78.0 78.8 92.9
5 Byculla 77.3 76.1 79.6 76.0 81.0
6 Chembur (East) 56.2 55.5 55.3 57.3 61.0
7 Chembur (West) 74.0 76.6 71.6 69.6 69.6
8 Chinchpokali (E) 74.3 72.5 68.7 71.8 78.4
9 Chinchpokali(W) 79.4 79.5 78.4 78.7 80.0
10 Dadar (East) 74.4 72.0 74.6 72.9 81.3
11 Dadar (West) 71.3 73.9 71.5 72.5 76.0
12 Elphinstone 69.0 68.6 74.8 62.1 76.5
13 Ghatkopar 68.4 71.5 69.2 67.8 83.7
14 Girgaon Chowpati 71.4 75.5 75.5 74.8 77.4
15 Grant Road 79.4 71.9 66.3 69.4 83.8
16 Juhu Chowpati 74.2 70.0 70.8 72.3 74.9
17 Kandivali (East) 79.5 79.8 77.4 77.4 90.1
18 Kandivali (W) 78.3 71.1 73.4 69.9 77.1
19 Khar 71.0 70.1 72.7 73.4 72.6
20 Mulund 71.0 71.5 68.6 69.4 71.4
21 Mumbai Central 70.8 78.1 76.5 76.5 79.1
22 Parel 73.9 71.9 66.8 69.8 77.0
23 Santacruz (East) 69.9 71.1 70.2 71.3 70.9
24 Vikhroli 76.8 76.6 76.4 76.0 75.7
25 Wadala 77.0 79.6 77.7 79.7 80.2
Noise Monitoring During Ganpati Festival 2009: Mumbai
50
55
60
65
70
75
80
85
90
95
Andhe
ri
Bandra
Bhand
up
Boriva
li
Bycull
a
Chembur
(East)
Chembur
(West)
Chinch
poka
li (E)
Chinch
poka
li(W)
Dadar
(Eas
t)
Dadar
(Wes
t)
Elphinsto
ne
Ghatko
par
Girgao
n Cho
wpati
Grant R
oad
Juhu
Cho
wpati
Kandiv
ali (E
ast)
Kandiv
ali (W
) Kha
r
Mulund
Mumba
i Cen
tral
Parel
Santac
ruz (E
ast)
Vikhrol
i
Wadala
Location
Noi
se L
evel
in d
B
30-Aug
31-Aug
01-Sep
02-Sep
03-Sep
Maharashtra Pollution Control Board
Noise Monitoring During Ganesh Festival 2009 9
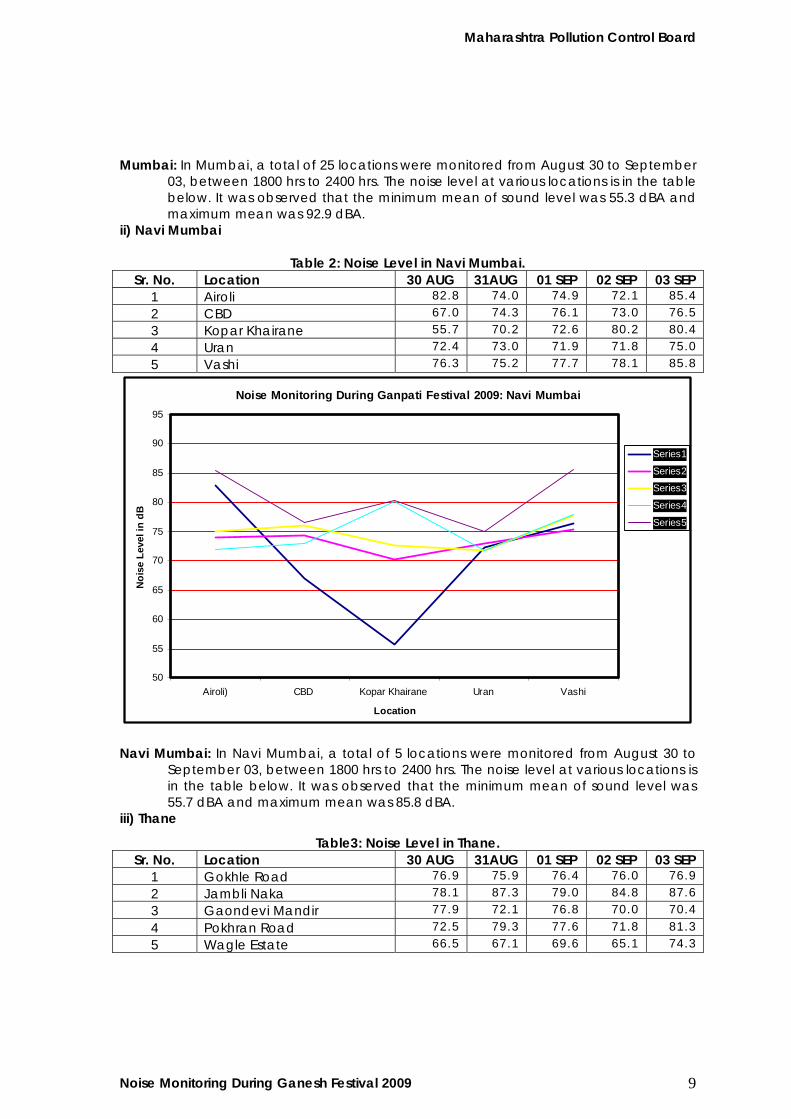
Mumbai: In Mumbai, a total of 25 locations were monitored from August 30 to September
03, between 1800 hrs to 2400 hrs. The noise level at various locations is in the table below. It was observed that the minimum mean of sound level was 55.3 dBA and maximum mean was 92.9 dBA.
ii) Navi Mumbai
Table 2: Noise Level in Navi Mumbai. Sr. No. Location 30 AUG 31AUG 01 SEP 02 SEP 03 SEP
1 Airoli 82.8 74.0 74.9 72.1 85.4
2 CBD 67.0 74.3 76.1 73.0 76.5
3 Kopar Khairane 55.7 70.2 72.6 80.2 80.4
4 Uran 72.4 73.0 71.9 71.8 75.0
5 Vashi 76.3 75.2 77.7 78.1 85.8
Noise Monitoring During Ganpati Festival 2009: Navi Mumbai
50
55
60
65
70
75
80
85
90
95
Airoli) CBD Kopar Khairane Uran Vashi
Location
Noi
se L
evel
in d
B
Series1
Series2
Series3
Series4
Series5
Navi Mumbai: In Navi Mumbai, a total of 5 locations were monitored from August 30 to
September 03, between 1800 hrs to 2400 hrs. The noise level at various locations is in the table below. It was observed that the minimum mean of sound level was 55.7 dBA and maximum mean was 85.8 dBA.
iii) Thane
Table3: Noise Level in Thane. Sr. No. Location 30 AUG 31AUG 01 SEP 02 SEP 03 SEP
1 Gokhle Road 76.9 75.9 76.4 76.0 76.9
2 Jambli Naka 78.1 87.3 79.0 84.8 87.6
3 Gaondevi Mandir 77.9 72.1 76.8 70.0 70.4
4 Pokhran Road 72.5 79.3 77.6 71.8 81.3
5 Wagle Estate 66.5 67.1 69.6 65.1 74.3
Maharashtra Pollution Control Board
Noise Monitoring During Ganesh Festival 2009 10
Noise Monitoring During Ganpati Festival 2009: Thane
50
60
70
80
90
Gokhle Road Jambli Naka Gaondevi Mandir Pokhran Road Wagle Estate
Location
Noi
se L
evel
in d
B 30-Aug
31-Aug
01-Sep
02-Sep
03-Sep
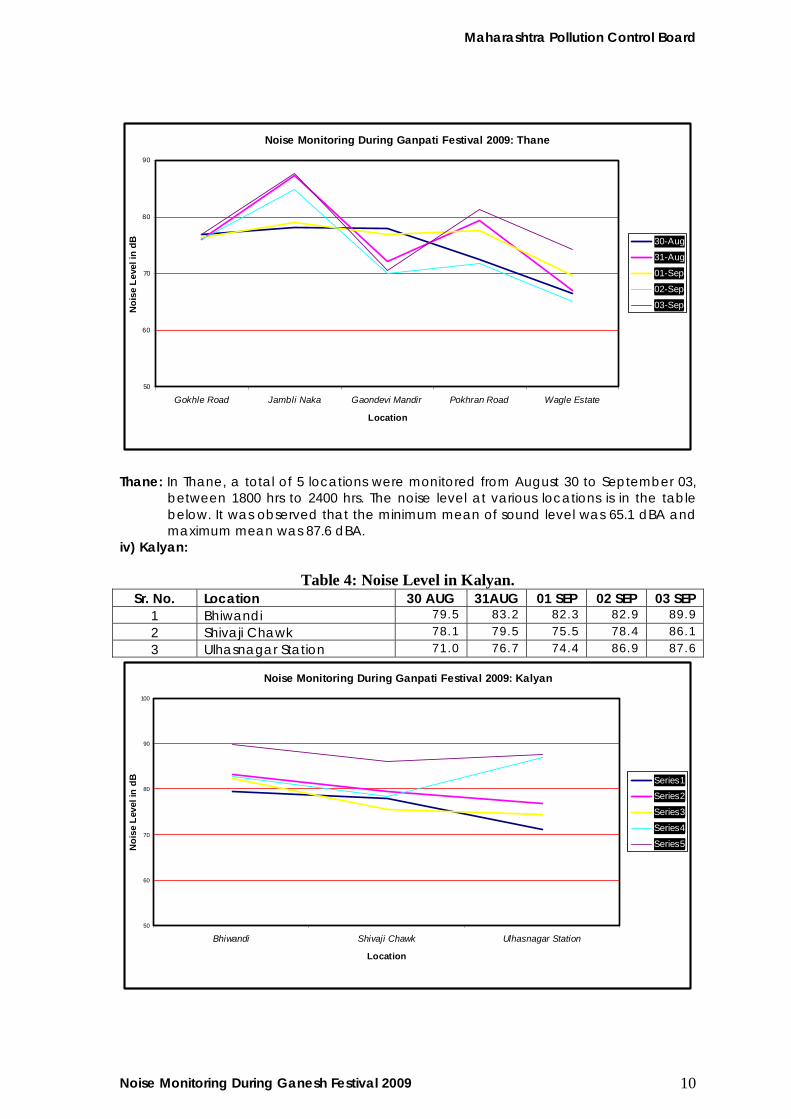
Thane: In Thane, a total of 5 locations were monitored from August 30 to September 03,
between 1800 hrs to 2400 hrs. The noise level at various locations is in the table below. It was observed that the minimum mean of sound level was 65.1 dBA and maximum mean was 87.6 dBA.
iv) Kalyan:
Table 4: Noise Level in Kalyan. Sr. No. Location 30 AUG 31AUG 01 SEP 02 SEP 03 SEP
1 Bhiwandi 79.5 83.2 82.3 82.9 89.9
2 Shivaji Chawk 78.1 79.5 75.5 78.4 86.1
3 Ulhasnagar Station 71.0 76.7 74.4 86.9 87.6
Noise Monitoring During Ganpati Festival 2009: Kalyan
50
60
70
80
90
100
Bhiwandi Shivaji Chawk Ulhasnagar Station
Location
Noi
se L
evel
in d
B Series1
Series2
Series3
Series4
Series5
Maharashtra Pollution Control Board
Noise Monitoring During Ganesh Festival 2009 11
Kalyan: In Kalyan, 3 locations were monitored from August 30 to September 03, between 1800 hrs to 2400 hrs. The noise level at various locations is in the table below. It was observed that the minimum mean of sound level was 71.0 dBA and maximum mean was 89.9 dBA.
v) Pune:
Table 5: Noise Level in Pune. Sr. No. Location 30AUG 31AUG 01 SEP 02 SEP 03 SEP
1 Shivaji Nagar 77.9 76.9 77.8 79.6 82.5
2 Karve Road 75.8 77.4 76.9 77.5 83.6
3 Swar Gate 74.9 75.4 73.9 67.4 83.6
4 Satara Road 69.1 71.7 72.9 71.8 81.5
5 Shaniwar Peth 70.6 83.9 79.8 78.8 75.5
6 Yerawada 76.9 77.7 77.1 78.4 76.8
7 Laxmi Road 69.8 69.0 73.5 75.5 87.6
8 Kothrud 67.5 70.3 73.0 72.5 84.1
9 Mahatma Phule Madai 72.0 72.7 75.5 74.0 75.4
10 Sarus Baug 73.6 72.0 75.1 70.9 79.4
11 Hadapsar 82.5 83.4 78.4 75.5 75.6
12 Deccan 71.8 77.1 73.3 71.4 85.9
13 Dagdu Sheth Mandir 78.1 75.0 72.3 75.7 95.9
14 Alka Chowk 74.4 75.9 74.1 70.3 92.5
15 Babu Genu Chowk 76.1 63.6 73.6 70.6 81.4
16 Khadaki 67.4 65.5 68.0 68.0 69.9
17 M G Road 68.9 79.4 76.1 71.2 79.2
18 Chapekar Chowk 70.6 71.9 71.0 69.1 87.9
19 Pimprigoan 70.5 72.0 71.6 74.2 81.9
20 Thergaon 75.7 76.9 81.1 74.0 77.9
Noise Monitoring During Ganpati Festival 2009: Pune.
50
60
70
80
90
100
110
Shivaji
Nag
ar
Karve
Road
Swar G
ate
Satara
Road
Shaniwar P
eth
Yerawad
a
Laxm
i Roa
d
Kothrud
Mahatm
a Phu
le Mada
i
Sarus B
aug
Hadaps
ar
Deccan
Dagdu She
th Man
dir
Alka C
howk
Babu G
enu C
howk
Khada
ki
M G R
oad
Chapek
ar Chow
k
Pimpr
igoan
Therga
on
Location
Noi
se L
evel
in d
B 30-Aug
31-Aug
01-Sep
02-Sep
03-Sep
Maharashtra Pollution Control Board
Noise Monitoring During Ganesh Festival 2009 12
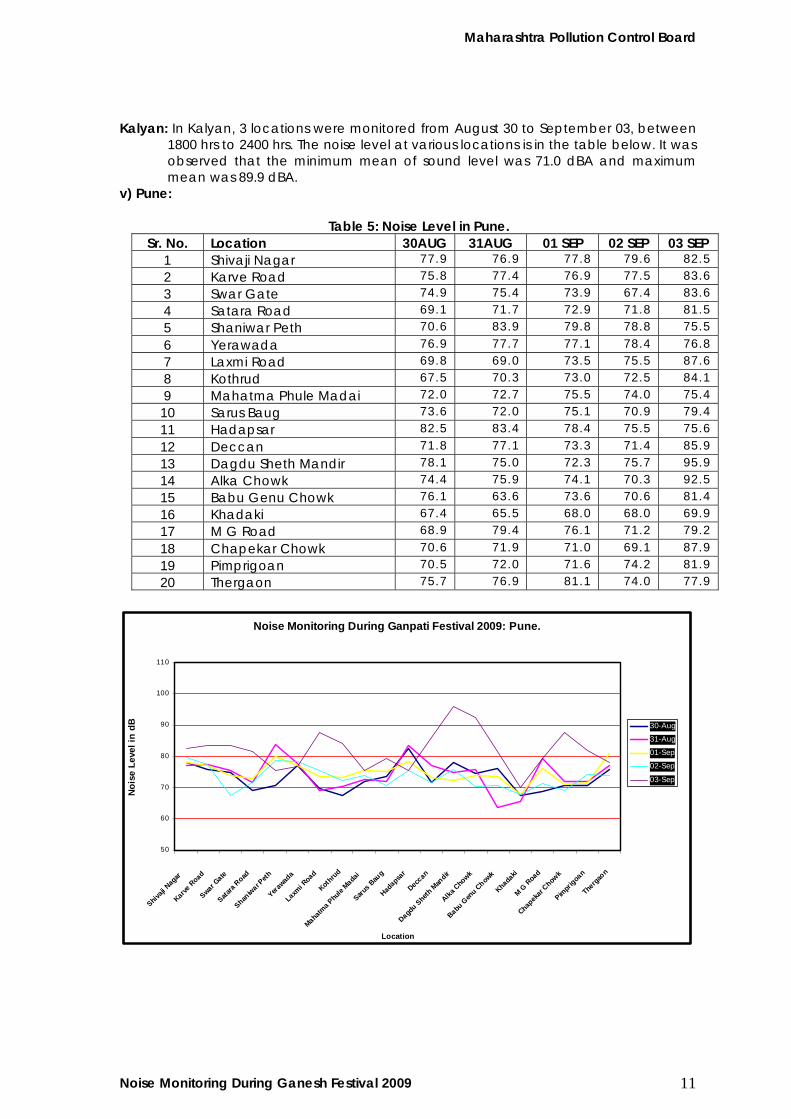
Pune: In Pune, a total of 20 locations were monitored from August 30 to September 03, between 1800 hrs to 2400 hrs. The noise level at various locations is in the table below. It was observed that the minimum mean of sound level was 63.6 dBA and maximum mean was 95.9 dBA.
vi) Kolhapur :
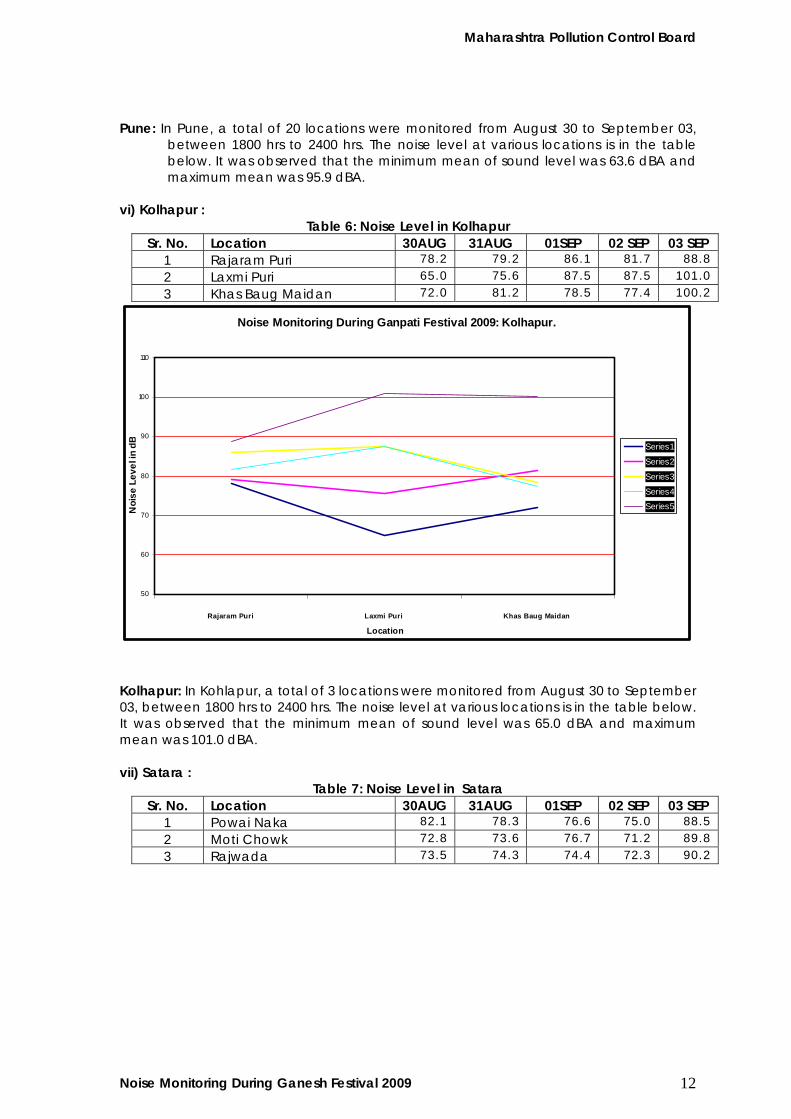
Table 6: Noise Level in Kolhapur Sr. No. Location 30AUG 31AUG 01SEP 02 SEP 03 SEP
1 Rajaram Puri 78.2 79.2 86.1 81.7 88.8
2 Laxmi Puri 65.0 75.6 87.5 87.5 101.0
3 Khas Baug Maidan 72.0 81.2 78.5 77.4 100.2
Noise Monitoring During Ganpati Festival 2009: Kolhapur.
50
60
70
80
90
100
110
Rajaram Puri Laxmi Puri Khas Baug Maidan
Location
Noi
se L
evel
in d
B
Series1
Series2
Series3
Series4
Series5
Kolhapur: In Kohlapur, a total of 3 locations were monitored from August 30 to September 03, between 1800 hrs to 2400 hrs. The noise level at various locations is in the table below. It was observed that the minimum mean of sound level was 65.0 dBA and maximum mean was 101.0 dBA. vii) Satara :
Table 7: Noise Level in Satara Sr. No. Location 30AUG 31AUG 01SEP 02 SEP 03 SEP
1 Powai Naka 82.1 78.3 76.6 75.0 88.5
2 Moti Chowk 72.8 73.6 76.7 71.2 89.8
3 Rajwada 73.5 74.3 74.4 72.3 90.2
Maharashtra Pollution Control Board
Noise Monitoring During Ganesh Festival 2009 13
Noise Monitoring During Ganpati Festival 2009: Satara.
50
60
70
80
90
100
110
Powai Naka Moti Chowk Rajwada
Location
Noi
se L
evel
in d
B
Series1
Series2
Series3
Series4
Series5
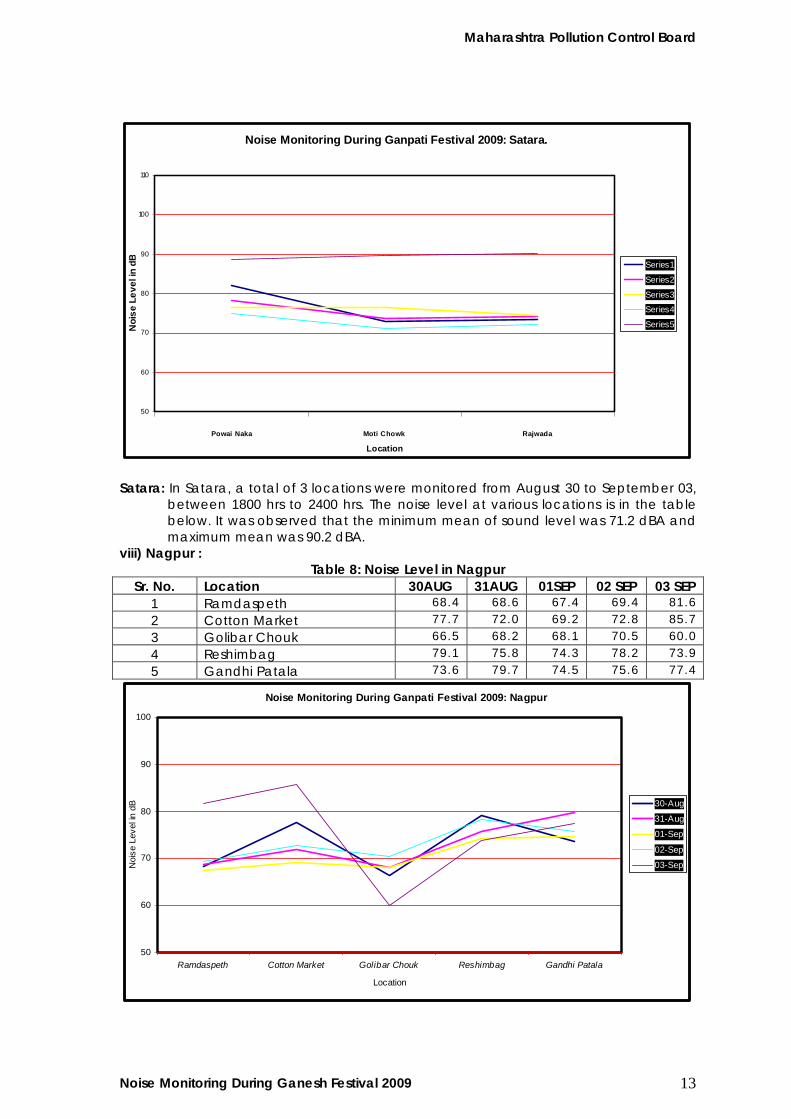
Satara: In Satara, a total of 3 locations were monitored from August 30 to September 03,
between 1800 hrs to 2400 hrs. The noise level at various locations is in the table below. It was observed that the minimum mean of sound level was 71.2 dBA and maximum mean was 90.2 dBA.
viii) Nagpur : Table 8: Noise Level in Nagpur
Sr. No. Location 30AUG 31AUG 01SEP 02 SEP 03 SEP 1 Ramdaspeth 68.4 68.6 67.4 69.4 81.6
2 Cotton Market 77.7 72.0 69.2 72.8 85.7
3 Golibar Chouk 66.5 68.2 68.1 70.5 60.0
4 Reshimbag 79.1 75.8 74.3 78.2 73.9
5 Gandhi Patala 73.6 79.7 74.5 75.6 77.4
Noise Monitoring During Ganpati Festival 2009: Nagpur
50
60
70
80
90
100
Ramdaspeth Cotton Market Golibar Chouk Reshimbag Gandhi Patala
Location
Noi
se L
evel
in d
B 30-Aug
31-Aug
01-Sep
02-Sep
03-Sep
Maharashtra Pollution Control Board
Noise Monitoring During Ganesh Festival 2009 14
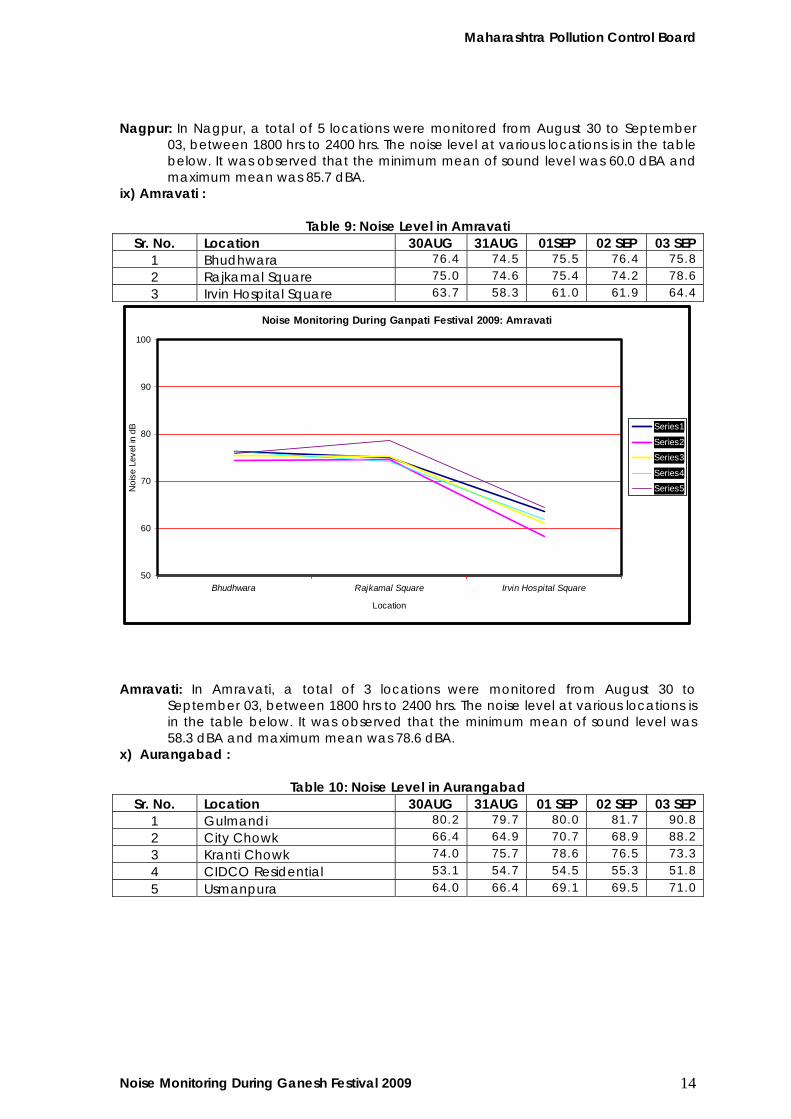
Nagpur: In Nagpur, a total of 5 locations were monitored from August 30 to September 03, between 1800 hrs to 2400 hrs. The noise level at various locations is in the table below. It was observed that the minimum mean of sound level was 60.0 dBA and maximum mean was 85.7 dBA.
ix) Amravati :
Table 9: Noise Level in Amravati Sr. No. Location 30AUG 31AUG 01SEP 02 SEP 03 SEP
1 Bhudhwara 76.4 74.5 75.5 76.4 75.8
2 Rajkamal Square 75.0 74.6 75.4 74.2 78.6
3 Irvin Hospital Square 63.7 58.3 61.0 61.9 64.4
Noise Monitoring During Ganpati Festival 2009: Amravati
50
60
70
80
90
100
Bhudhwara Rajkamal Square Irvin Hospital Square
Location
Noi
se L
evel
in d
B Series1
Series2
Series3
Series4
Series5
Amravati: In Amravati, a total of 3 locations were monitored from August 30 to
September 03, between 1800 hrs to 2400 hrs. The noise level at various locations is in the table below. It was observed that the minimum mean of sound level was 58.3 dBA and maximum mean was 78.6 dBA.
x) Aurangabad :
Table 10: Noise Level in Aurangabad Sr. No. Location 30AUG 31AUG 01 SEP 02 SEP 03 SEP
1 Gulmandi 80.2 79.7 80.0 81.7 90.8
2 City Chowk 66.4 64.9 70.7 68.9 88.2
3 Kranti Chowk 74.0 75.7 78.6 76.5 73.3
4 CIDCO Residential 53.1 54.7 54.5 55.3 51.8
5 Usmanpura 64.0 66.4 69.1 69.5 71.0
Maharashtra Pollution Control Board
Noise Monitoring During Ganesh Festival 2009 15
Noise Monitoring During Ganpati Festival 2009 : Aurangabad
50
60
70
80
90
100
Gulmandi City Chowk Kranti Chowk CIDCO Residential Usmanpura
Location
Noi
se L
evel
in d
B
30-Aug
31-Aug
01-Sep
02-Sep
03-Sep
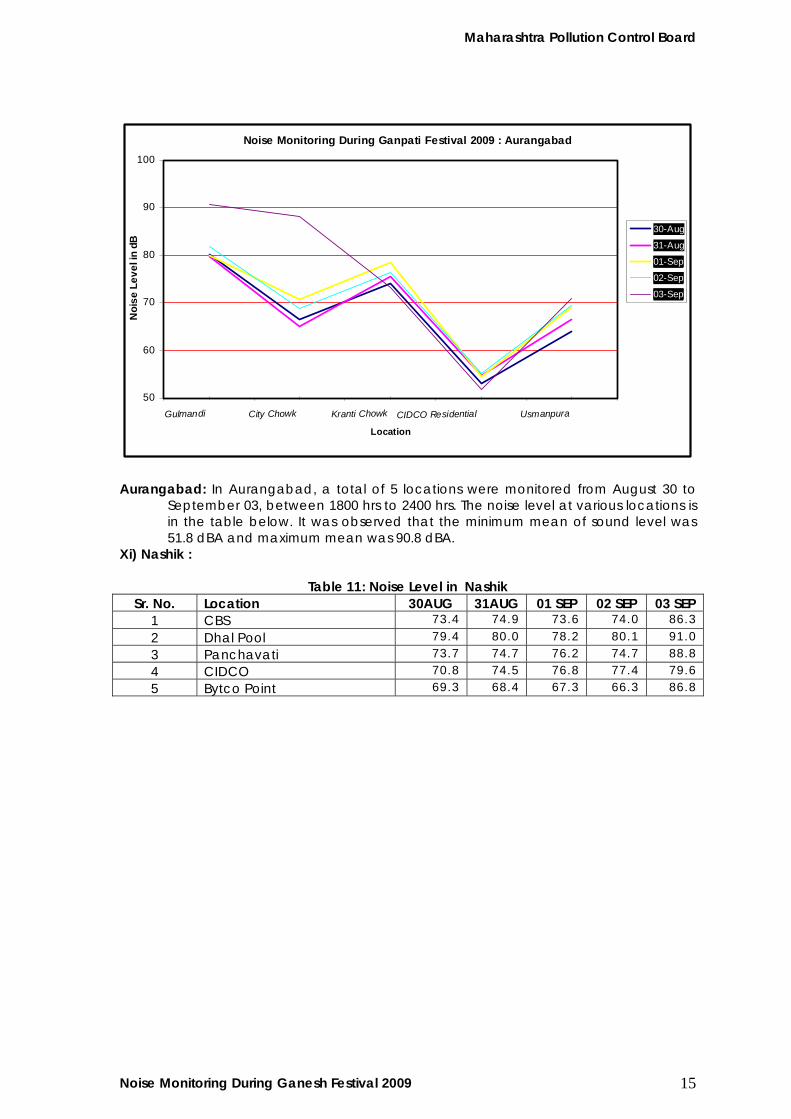
Aurangabad: In Aurangabad, a total of 5 locations were monitored from August 30 to
September 03, between 1800 hrs to 2400 hrs. The noise level at various locations is in the table below. It was observed that the minimum mean of sound level was 51.8 dBA and maximum mean was 90.8 dBA.
Xi) Nashik :
Table 11: Noise Level in Nashik Sr. No. Location 30AUG 31AUG 01 SEP 02 SEP 03 SEP
1 CBS 73.4 74.9 73.6 74.0 86.3
2 Dhal Pool 79.4 80.0 78.2 80.1 91.0
3 Panchavati 73.7 74.7 76.2 74.7 88.8
4 CIDCO 70.8 74.5 76.8 77.4 79.6
5 Bytco Point 69.3 68.4 67.3 66.3 86.8
Maharashtra Pollution Control Board
Noise Monitoring During Ganesh Festival 2009 16
Noise Monitoring During Ganpati Festival 2009 : Nasik
50
60
70
80
90
100
CBS Dhal Pool Panchavati CIDCO Bytco Point
Location
Noi
se L
evel
in d
B
Series1
Series2
Series3
Series4
Series5
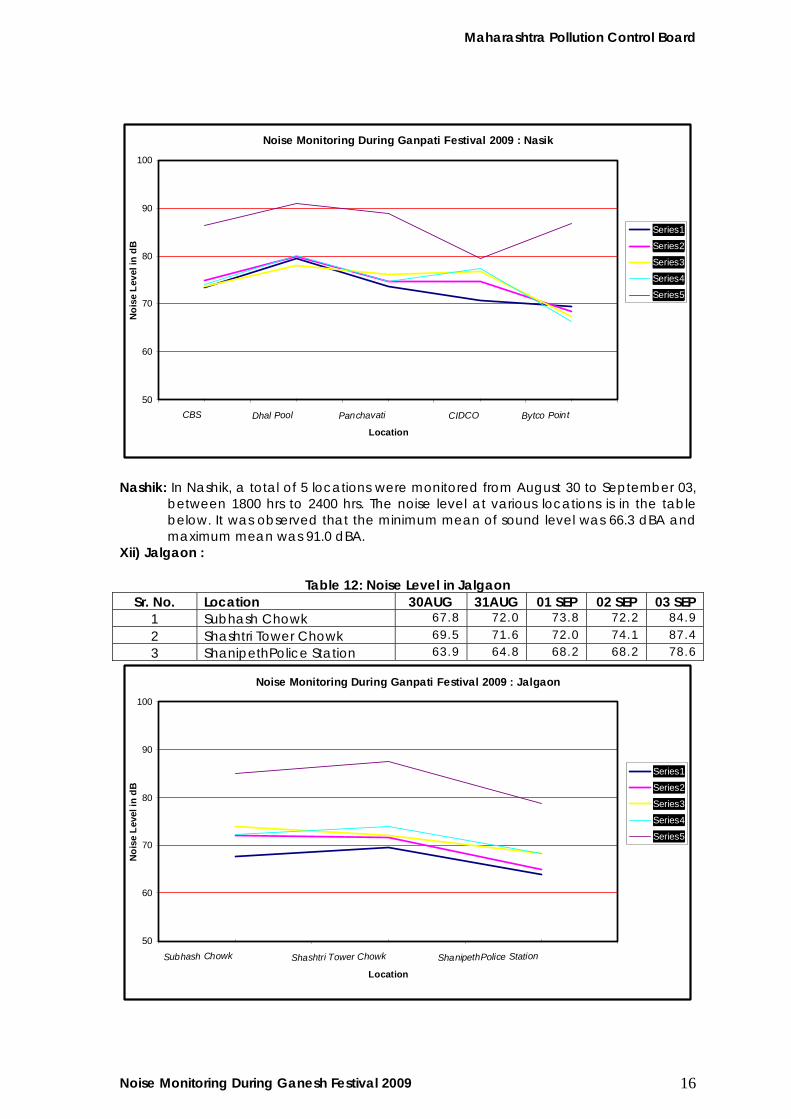
Nashik: In Nashik, a total of 5 locations were monitored from August 30 to September 03,
between 1800 hrs to 2400 hrs. The noise level at various locations is in the table below. It was observed that the minimum mean of sound level was 66.3 dBA and maximum mean was 91.0 dBA.
Xii) Jalgaon :
Table 12: Noise Level in Jalgaon Sr. No. Location 30AUG 31AUG 01 SEP 02 SEP 03 SEP
1 Subhash Chowk 67.8 72.0 73.8 72.2 84.9
2 Shashtri Tower Chowk 69.5 71.6 72.0 74.1 87.4
3 ShanipethPolice Station 63.9 64.8 68.2 68.2 78.6
Noise Monitoring During Ganpati Festival 2009 : Jalgaon
50
60
70
80
90
100
Subhash Chowk Shashtri Tower Chowk ShanipethPolice Station
Location
Noi
se L
evel
in d
B
Series1
Series2
Series3
Series4
Series5
Maharashtra Pollution Control Board
Noise Monitoring During Ganesh Festival 2009 17
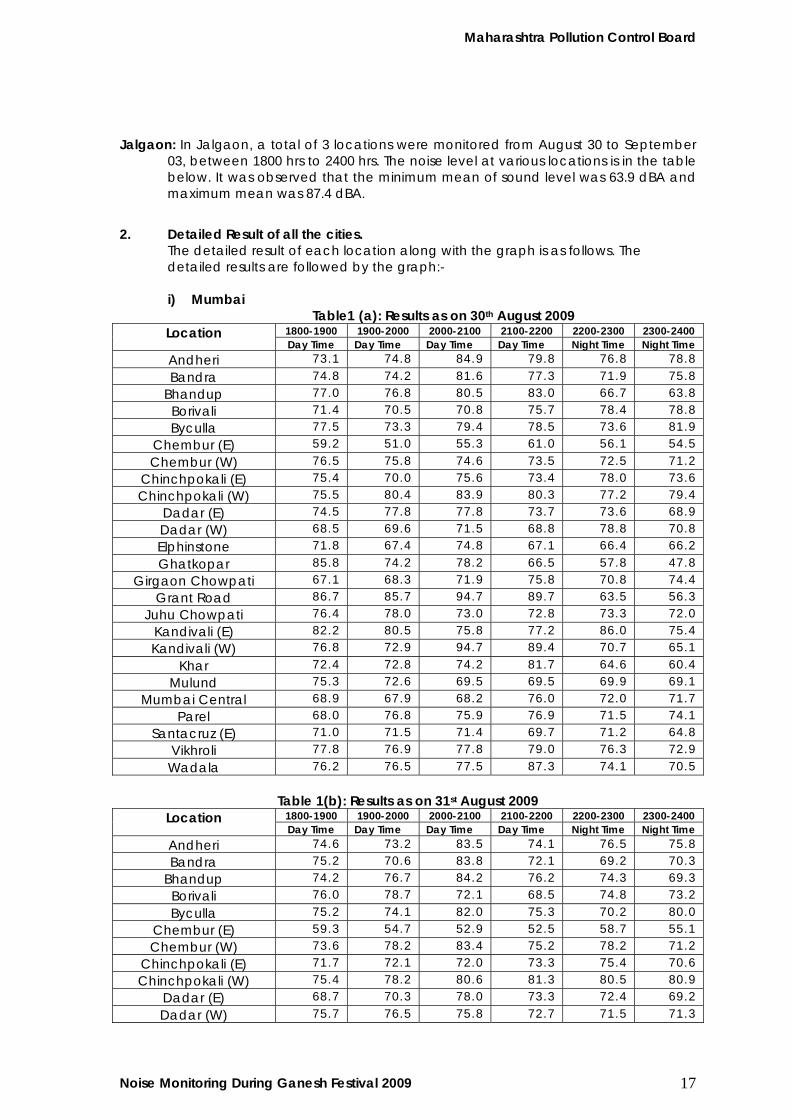
Jalgaon: In Jalgaon, a total of 3 locations were monitored from August 30 to September
03, between 1800 hrs to 2400 hrs. The noise level at various locations is in the table below. It was observed that the minimum mean of sound level was 63.9 dBA and maximum mean was 87.4 dBA.
2. Detailed Result of all the cities. The detailed result of each location along with the graph is as follows. The detailed results are followed by the graph:-
i) Mumbai
Table1 (a): Results as on 30th August 2009 1800-1900 1900-2000 2000-2100 2100-2200 2200-2300 2300-2400 Location Day Time Day Time Day Time Day Time Night Time Night Time
Andheri 73.1 74.8 84.9 79.8 76.8 78.8
Bandra 74.8 74.2 81.6 77.3 71.9 75.8
Bhandup 77.0 76.8 80.5 83.0 66.7 63.8
Borivali 71.4 70.5 70.8 75.7 78.4 78.8
Byculla 77.5 73.3 79.4 78.5 73.6 81.9
Chembur (E) 59.2 51.0 55.3 61.0 56.1 54.5
Chembur (W) 76.5 75.8 74.6 73.5 72.5 71.2
Chinchpokali (E) 75.4 70.0 75.6 73.4 78.0 73.6
Chinchpokali (W) 75.5 80.4 83.9 80.3 77.2 79.4
Dadar (E) 74.5 77.8 77.8 73.7 73.6 68.9
Dadar (W) 68.5 69.6 71.5 68.8 78.8 70.8
Elphinstone 71.8 67.4 74.8 67.1 66.4 66.2
Ghatkopar 85.8 74.2 78.2 66.5 57.8 47.8
Girgaon Chowpati 67.1 68.3 71.9 75.8 70.8 74.4
Grant Road 86.7 85.7 94.7 89.7 63.5 56.3
Juhu Chowpati 76.4 78.0 73.0 72.8 73.3 72.0
Kandivali (E) 82.2 80.5 75.8 77.2 86.0 75.4
Kandivali (W) 76.8 72.9 94.7 89.4 70.7 65.1
Khar 72.4 72.8 74.2 81.7 64.6 60.4
Mulund 75.3 72.6 69.5 69.5 69.9 69.1
Mumbai Central 68.9 67.9 68.2 76.0 72.0 71.7
Parel 68.0 76.8 75.9 76.9 71.5 74.1
Santacruz (E) 71.0 71.5 71.4 69.7 71.2 64.8
Vikhroli 77.8 76.9 77.8 79.0 76.3 72.9
Wadala 76.2 76.5 77.5 87.3 74.1 70.5
Table 1(b): Results as on 31st August 2009
1800-1900 1900-2000 2000-2100 2100-2200 2200-2300 2300-2400 Location Day Time Day Time Day Time Day Time Night Time Night Time
Andheri 74.6 73.2 83.5 74.1 76.5 75.8
Bandra 75.2 70.6 83.8 72.1 69.2 70.3
Bhandup 74.2 76.7 84.2 76.2 74.3 69.3
Borivali 76.0 78.7 72.1 68.5 74.8 73.2
Byculla 75.2 74.1 82.0 75.3 70.2 80.0
Chembur (E) 59.3 54.7 52.9 52.5 58.7 55.1
Chembur (W) 73.6 78.2 83.4 75.2 78.2 71.2
Chinchpokali (E) 71.7 72.1 72.0 73.3 75.4 70.6
Chinchpokali (W) 75.4 78.2 80.6 81.3 80.5 80.9
Dadar (E) 68.7 70.3 78.0 73.3 72.4 69.2
Dadar (W) 75.7 76.5 75.8 72.7 71.5 71.3
Maharashtra Pollution Control Board
Noise Monitoring During Ganesh Festival 2009 18
1800-1900 1900-2000 2000-2100 2100-2200 2200-2300 2300-2400 Location Day Time Day Time Day Time Day Time Night Time Night Time
Elphinstone 71.2 71.5 67.3 67.6 64.7 69.2
Ghatkopar 71.8 70.3 75.7 76.1 66.2 69.2
Girgaon Chowpati 75.0 74.7 78.9 75.5 79.9 68.8
Grant Road 81.4 80.8 78.3 74.7 62.4 53.8
Juhu Chowpati 72.0 66.4 66.6 66.2 77.2 71.8
Kandivali (E) 75.6 83.1 86.0 78.9 80.0 75.2
Kandivali (W) 72.1 67.9 73.3 72.1 69.9 71.1
Khar 71.1 70.1 75.6 71.2 67.9 64.9
Mulund 72.0 73.1 70.4 69.5 75.3 68.8
Mumbai Central 75.3 85.5 84.3 78.0 74.8 70.8
Parel 71.6 72.4 68.1 74.1 74.1 71.4
Santacruz (E) 71.5 73.0 72.3 72.5 70.5 66.7
Vikhroli 79.3 77.3 77.1 75.7 74.7 75.3
Wadala 76.1 81.0 77.0 81.2 82.8 79.6
Table 1(c): Results as on 01st September 2009
1800-1900 1900-2000 2000-2100 2100-2200 2200-2300 2300-2400 Location Day Time Day Time Day Time Day Time Night Time Night Time
Andheri 75.1 76.8 74.1 76.7 74.4 76.1
Bandra 72.5 75.2 75.2 77.6 76.6 76.0
Bhandup 69.5 69.3 73.9 78.7 67.0 66.4
Borivali 76.1 75.6 81.9 81.7 78.0 74.4
Byculla 78.3 80.4 77.6 82.7 79.8 78.9
Chembur (E) 54.9 52.7 52.9 53.9 59.8 57.7
Chembur (W) 69.5 71.2 81.4 67.3 77.5 62.4
Chinchpokali (E) 65.3 68.1 66.0 70.2 71.9 71.0
Chinchpokali (W) 77.3 76.4 76.9 79.6 80.5 79.4
Dadar (E) 73.2 73.4 78.1 77.4 74.2 71.1
Dadar (W) 74.1 73.4 67.1 75.3 70.8 68.6
Elphinstone 82.1 79.3 69.5 70.4 77.7 69.9
Ghatkopar 73.0 71.9 74.7 67.0 64.0 64.5
Girgaon Chowpati 72.5 78.0 77.2 75.6 77.8 72.0
Grant Road 82.9 77.3 61.9 62.1 58.2 55.7
Juhu Chowpati 75.3 65.9 72.7 65.5 69.9 75.6
Kandivali (E) 78.9 78.5 76.3 78.4 77.6 74.5
Kandivali (W) 73.6 76.7 75.3 73.5 71.4 70.1
Khar 71.2 73.3 71.3 70.6 75.7 74.1
Mulund 67.0 69.1 69.7 67.3 71.7 66.9
Mumbai Central 82.8 81.2 81.4 75.7 68.5 69.3
Parel 70.5 70.3 67.8 64.3 65.5 62.1
Santacruz (E) 72.5 72.3 71.3 71.0 69.2 65.1
Vikhroli 76.8 78.7 76.6 76.6 74.8 75.2
Wadala 73.4 77.4 74.5 82.3 80.1 78.4
Table 1(d): Results as on 02nd September 2009
1800-1900 1900-2000 2000-2100 2100-2200 2200-2300 2300-2400 Location Day Time Day Time Day Time Day Time Night Time Night Time
Andheri 73.9 73.3 75.3 75.1 74.4 78.7
Bandra 76.8 76.0 74.8 73.9 72.0 70.9
Bhandup 77.0 76.8 78.7 79.4 68.8 67.9
Borivali 77.6 81.6 80.7 76.4 78.4 77.9
Byculla 79.0 78.3 78.2 74.3 75.1 71.4
Maharashtra Pollution Control Board
Noise Monitoring During Ganesh Festival 2009 19
Chembur (E) 59.2 58.3 53.2 56.7 63.0 53.5
Chembur (W) 71.8 72.2 60.3 69.4 73.3 70.7
Chinchpokali (E) 70.9 73.1 72.5 69.9 72.5 71.7
Chinchpokali (W) 78.0 74.3 79.1 81.8 79.9 79.1
Dadar (E) 69.7 79.2 78.9 74.2 72.7 62.8
Dadar (W) 73.8 73.9 74.6 72.7 70.8 68.9
Elphinstone 51.1 65.0 70.6 61.3 58.8 66.1
Ghatkopar 78.4 81.8 80.0 65.4 55.4 46.0
Girgaon Chowpati 75.3 76.0 74.3 71.3 81.6 70.4
Grant Road 82.4 81.1 75.4 65.8 57.9 54.1
Juhu Chowpati 77.5 65.8 72.3 71.1 74.8 72.5
Kandivali (E) 78.2 78.1 77.7 78.3 77.7 74.6
Kandivali (W) 72.3 67.6 73.5 66.9 70.2 69.1
Khar 73.2 74.4 72.4 75.2 73.5 71.8
Mulund 69.0 70.6 72.1 68.2 67.4 69.0
Mumbai Central 77.2 81.7 77.2 79.2 72.5 71.3
Parel 80.0 65.7 67.3 77.3 64.8 63.8
Santacruz (E) 70.3 71.5 71.2 72.4 72.7 69.9
Vikhroli 75.4 77.1 76.9 77.5 75.3 73.9
Wadala 74.1 82.1 79.0 83.9 81.7 77.1
Table 1(e): Results as on 03 rd September 2009
1800-1900 1900-2000 2000-2100 2100-2200 2200-2300 2300-2400 Location Day Time Day Time Day Time Day Time Night Time Night Time
Andheri 74.6 75.8 79.0 80.5 75.9 66.5
Bandra 74.5 72.3 76.4 78.3 75.9 77.5
Bhandup 73.3 78.8 83.4 80.2 72.7 70.4
Borivali 94.5 91.6 93.3 92.8 91.3 93.7
Byculla 87.4 84.5 88.1 79.0 74.3 73.1
Chembur (E) 61.2 59.4 61.5 62.8 61.4 59.4
Chembur (W) 71.8 72.2 60.3 69.4 73.3 70.7
Chinchpokali (E) 79.4 82.4 85.8 82.0 65.8 75.1
Chinchpokali (W) 76.5 77.5 86.4 80.3 81.6 77.9
Dadar (E) 81.8 86.7 83.4 79.4 80.6 75.6
Dadar (W) 70.0 70.3 76.7 78.4 81.1 79.9
Elphinstone 86.6 72.5 79.0 75.0 65.8 80.4
Ghatkopar 82.9 84.7 81.5 80.5 82.3 90.6
Girgaon Chowpati 77.5 76.0 79.8 78.4 77.5 75.1
Grant Road 99.5 96.8 86.4 79.9 77.2 62.9
Juhu Chowpati 74.9 72.3 72.8 76.0 75.6 77.7
Kandivali (E) 76.8 85.3 90.2 91.8 105.8 90.4
Kandivali (W) 74.6 73.5 84.5 82.8 75.0 72.4
Khar 78.6 71.5 79.6 70.8 62.6 72.7
Mulund 71.5 74.6 73.8 70.4 69.5 68.4
Mumbai Central 73.3 92.2 79.7 83.2 74.5 71.5
Parel 74.9 73.2 79.8 73.1 79.5 81.3
Santacruz (E) 77.9 69.2 70.1 70.1 73.5 64.9
Vikhroli 78.7 70.2 73.0 78.6 81.5 72.3
Wadala 75.8 81.8 80.5 82.5 83.5 77.1
Maharashtra Pollution Control Board
Noise Monitoring During Ganesh Festival 2009 20
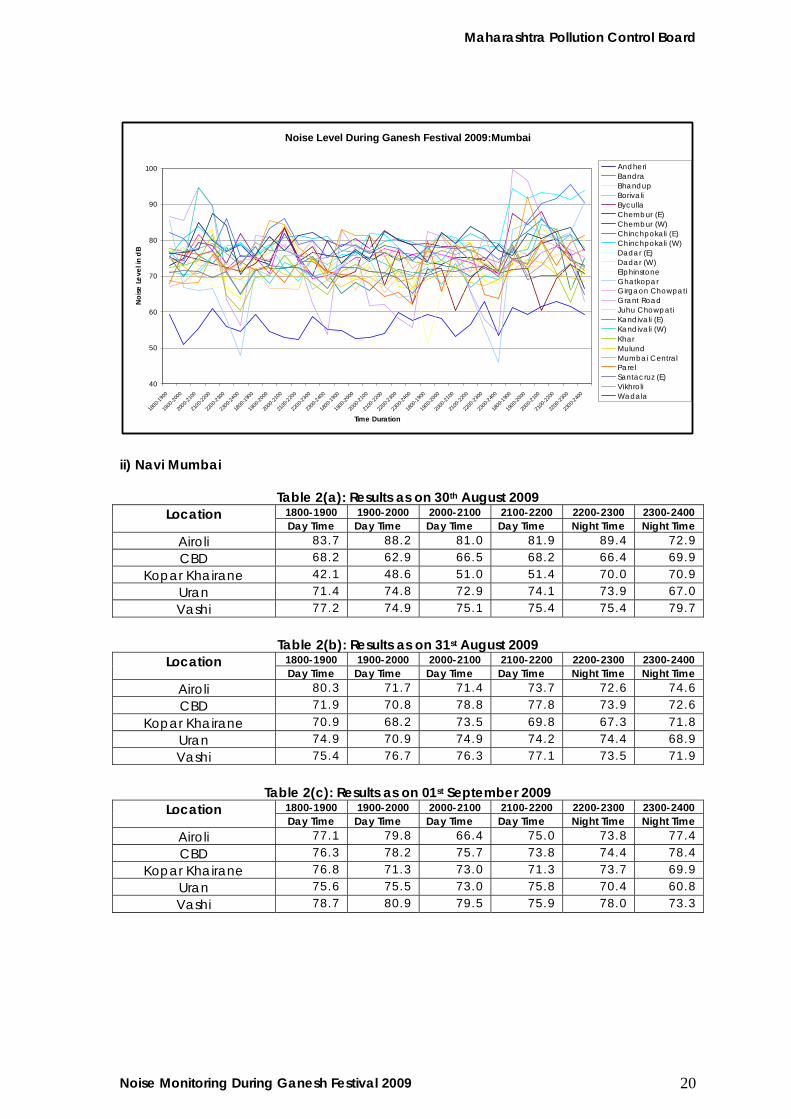
Noise Level During Ganesh Festival 2009:Mumbai
40
50
60
70
80
90
100
1800-1
900
1900
-2000
2000-2
100
2100-2
200
2200-2
300
2300-2
400
1800
-1900
1900-2
000
2000
-2100
2100
-2200
2200-2
300
2300
-2400
1800-1
900
1900-20
00
2000
-2100
2100-22
00
2200
-2300
2300-2
400
1800-19
00
1900-2
000
2000-21
00
2100
-2200
2200-23
00
2300
-2400
1800-1
900
1900-2
000
2000-2
100
2100-22
00
2200
-2300
2300-2
400
Time Duration
Noi
se Le
vel i
n dB
AndheriBandra Bhandup BorivaliByculla Chembur (E) Chembur (W) Chinchpokali (E) Chinchpokali (W)Dadar (E)Dadar (W) Elphinstone Ghatkopar Girgaon Chowpati Grant Road Juhu Chowpati Kandivali (E) Kandivali (W)KharMulundMumbai Central Parel Santacruz (E) Vikhroli Wadala
ii) Navi Mumbai
Table 2(a): Results as on 30th August 2009 1800-1900 1900-2000 2000-2100 2100-2200 2200-2300 2300-2400 Location Day Time Day Time Day Time Day Time Night Time Night Time
Airoli 83.7 88.2 81.0 81.9 89.4 72.9
CBD 68.2 62.9 66.5 68.2 66.4 69.9
Kopar Khairane 42.1 48.6 51.0 51.4 70.0 70.9
Uran 71.4 74.8 72.9 74.1 73.9 67.0
Vashi 77.2 74.9 75.1 75.4 75.4 79.7
Table 2(b): Results as on 31st August 2009
1800-1900 1900-2000 2000-2100 2100-2200 2200-2300 2300-2400 Location Day Time Day Time Day Time Day Time Night Time Night Time
Airoli 80.3 71.7 71.4 73.7 72.6 74.6
CBD 71.9 70.8 78.8 77.8 73.9 72.6
Kopar Khairane 70.9 68.2 73.5 69.8 67.3 71.8
Uran 74.9 70.9 74.9 74.2 74.4 68.9
Vashi 75.4 76.7 76.3 77.1 73.5 71.9
Table 2(c): Results as on 01st September 2009
1800-1900 1900-2000 2000-2100 2100-2200 2200-2300 2300-2400 Location Day Time Day Time Day Time Day Time Night Time Night Time
Airoli 77.1 79.8 66.4 75.0 73.8 77.4
CBD 76.3 78.2 75.7 73.8 74.4 78.4
Kopar Khairane 76.8 71.3 73.0 71.3 73.7 69.9
Uran 75.6 75.5 73.0 75.8 70.4 60.8
Vashi 78.7 80.9 79.5 75.9 78.0 73.3
Maharashtra Pollution Control Board
Noise Monitoring During Ganesh Festival 2009 21
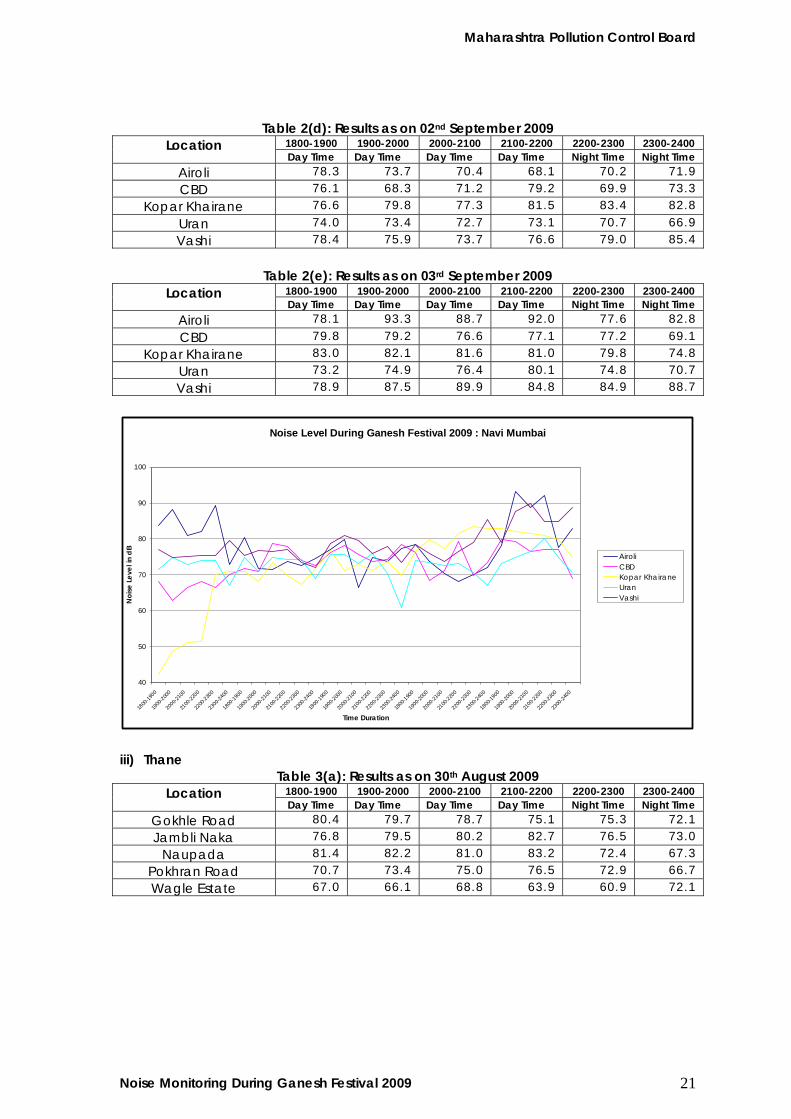
Table 2(d): Results as on 02nd September 2009 1800-1900 1900-2000 2000-2100 2100-2200 2200-2300 2300-2400 Location Day Time Day Time Day Time Day Time Night Time Night Time
Airoli 78.3 73.7 70.4 68.1 70.2 71.9
CBD 76.1 68.3 71.2 79.2 69.9 73.3
Kopar Khairane 76.6 79.8 77.3 81.5 83.4 82.8
Uran 74.0 73.4 72.7 73.1 70.7 66.9
Vashi 78.4 75.9 73.7 76.6 79.0 85.4
Table 2(e): Results as on 03rd September 2009
1800-1900 1900-2000 2000-2100 2100-2200 2200-2300 2300-2400 Location Day Time Day Time Day Time Day Time Night Time Night Time
Airoli 78.1 93.3 88.7 92.0 77.6 82.8
CBD 79.8 79.2 76.6 77.1 77.2 69.1
Kopar Khairane 83.0 82.1 81.6 81.0 79.8 74.8
Uran 73.2 74.9 76.4 80.1 74.8 70.7
Vashi 78.9 87.5 89.9 84.8 84.9 88.7
Noise Level During Ganesh Festival 2009 : Navi Mumbai
40
50
60
70
80
90
100
1800
-1900
1900-2
000
2000-2
100
2100
-2200
2200
-2300
2300-2
400
1800-19
00
1900-2
000
2000-21
00
2100
-2200
2200-2
300
2300-24
00
1800
-1900
1900-2
000
2000-2
100
2100-2
200
2200-2
300
2300
-2400
1800-1
900
1900-2
000
2000-21
00
2100
-2200
2200-23
00
2300
-2400
1800-1
900
1900-20
00
2000
-2100
2100-2
200
2200-2
300
2300
-2400
Time Duration
Noi
se L
evel
in d
B
Airoli CBDKopar Khairane Uran Vashi
iii) Thane Table 3(a): Results as on 30th August 2009
1800-1900 1900-2000 2000-2100 2100-2200 2200-2300 2300-2400 Location Day Time Day Time Day Time Day Time Night Time Night Time
Gokhle Road 80.4 79.7 78.7 75.1 75.3 72.1
Jambli Naka 76.8 79.5 80.2 82.7 76.5 73.0
Naupada 81.4 82.2 81.0 83.2 72.4 67.3
Pokhran Road 70.7 73.4 75.0 76.5 72.9 66.7
Wagle Estate 67.0 66.1 68.8 63.9 60.9 72.1
Maharashtra Pollution Control Board
Noise Monitoring During Ganesh Festival 2009 22
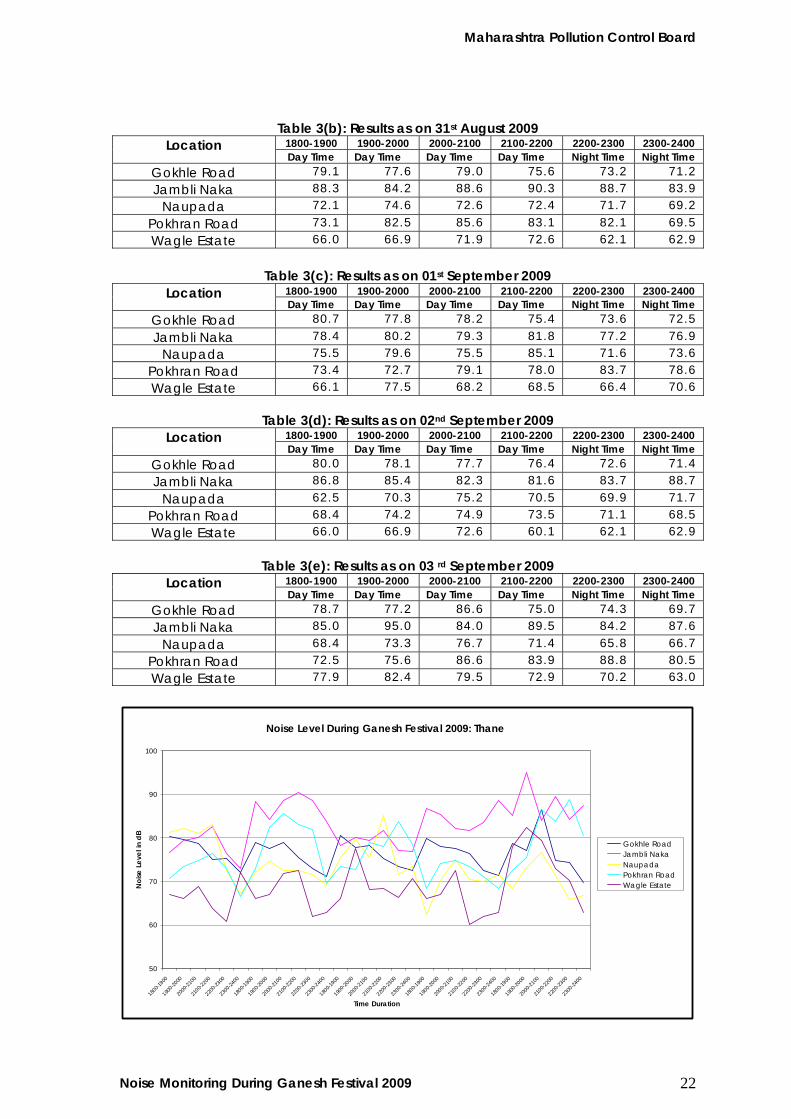
Table 3(b): Results as on 31st August 2009 1800-1900 1900-2000 2000-2100 2100-2200 2200-2300 2300-2400 Location Day Time Day Time Day Time Day Time Night Time Night Time
Gokhle Road 79.1 77.6 79.0 75.6 73.2 71.2
Jambli Naka 88.3 84.2 88.6 90.3 88.7 83.9
Naupada 72.1 74.6 72.6 72.4 71.7 69.2
Pokhran Road 73.1 82.5 85.6 83.1 82.1 69.5
Wagle Estate 66.0 66.9 71.9 72.6 62.1 62.9
Table 3(c): Results as on 01st September 2009
1800-1900 1900-2000 2000-2100 2100-2200 2200-2300 2300-2400 Location Day Time Day Time Day Time Day Time Night Time Night Time
Gokhle Road 80.7 77.8 78.2 75.4 73.6 72.5
Jambli Naka 78.4 80.2 79.3 81.8 77.2 76.9
Naupada 75.5 79.6 75.5 85.1 71.6 73.6
Pokhran Road 73.4 72.7 79.1 78.0 83.7 78.6
Wagle Estate 66.1 77.5 68.2 68.5 66.4 70.6
Table 3(d): Results as on 02nd September 2009 1800-1900 1900-2000 2000-2100 2100-2200 2200-2300 2300-2400 Location Day Time Day Time Day Time Day Time Night Time Night Time
Gokhle Road 80.0 78.1 77.7 76.4 72.6 71.4
Jambli Naka 86.8 85.4 82.3 81.6 83.7 88.7
Naupada 62.5 70.3 75.2 70.5 69.9 71.7
Pokhran Road 68.4 74.2 74.9 73.5 71.1 68.5
Wagle Estate 66.0 66.9 72.6 60.1 62.1 62.9
Table 3(e): Results as on 03 rd September 2009
1800-1900 1900-2000 2000-2100 2100-2200 2200-2300 2300-2400 Location Day Time Day Time Day Time Day Time Night Time Night Time
Gokhle Road 78.7 77.2 86.6 75.0 74.3 69.7
Jambli Naka 85.0 95.0 84.0 89.5 84.2 87.6
Naupada 68.4 73.3 76.7 71.4 65.8 66.7
Pokhran Road 72.5 75.6 86.6 83.9 88.8 80.5
Wagle Estate 77.9 82.4 79.5 72.9 70.2 63.0
Noise Level During Ganesh Festival 2009: Thane
50
60
70
80
90
100
1800-1
900
1900-20
00
2000
-2100
2100-2
200
2200-23
00
2300
-2400
1800-1
900
1900-2
000
2000
-2100
2100
-2200
2200
-2300
2300
-2400
1800-1
900
1900-20
00
2000
-2100
2100-2
200
2200-23
00
2300
-2400
1800-1
900
1900-2
000
2000-2
100
2100-2
200
2200
-2300
2300
-2400
1800-1
900
1900-20
00
2000
-2100
2100-2
200
2200-23
00
2300
-2400
Time Duration
Noi
se L
evel
in d
B
Gokhle RoadJambli NakaNaupadaPokhran RoadWagle Estate
Maharashtra Pollution Control Board
Noise Monitoring During Ganesh Festival 2009 23
iv) Pune
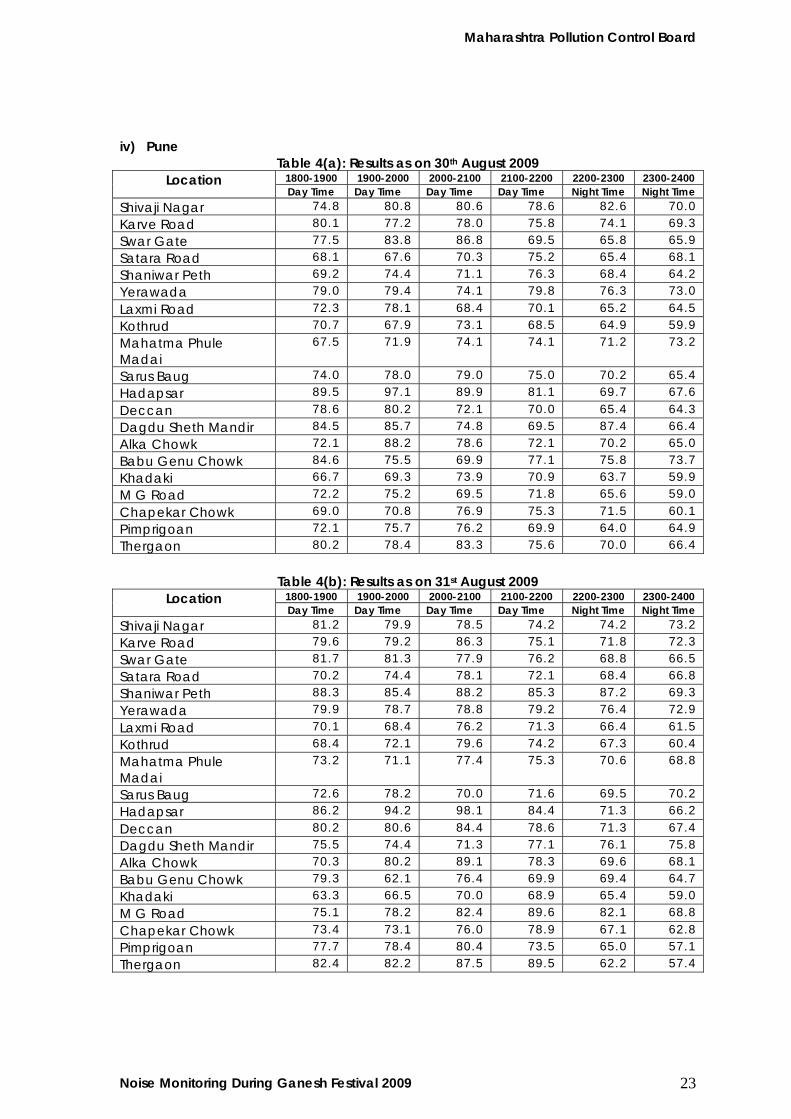
Table 4(a): Results as on 30th August 2009 1800-1900 1900-2000 2000-2100 2100-2200 2200-2300 2300-2400 Location Day Time Day Time Day Time Day Time Night Time Night Time
Shivaji Nagar 74.8 80.8 80.6 78.6 82.6 70.0
Karve Road 80.1 77.2 78.0 75.8 74.1 69.3
Swar Gate 77.5 83.8 86.8 69.5 65.8 65.9
Satara Road 68.1 67.6 70.3 75.2 65.4 68.1
Shaniwar Peth 69.2 74.4 71.1 76.3 68.4 64.2
Yerawada 79.0 79.4 74.1 79.8 76.3 73.0
Laxmi Road 72.3 78.1 68.4 70.1 65.2 64.5
Kothrud 70.7 67.9 73.1 68.5 64.9 59.9
Mahatma Phule Madai
67.5 71.9 74.1 74.1 71.2 73.2
Sarus Baug 74.0 78.0 79.0 75.0 70.2 65.4
Hadapsar 89.5 97.1 89.9 81.1 69.7 67.6
Deccan 78.6 80.2 72.1 70.0 65.4 64.3
Dagdu Sheth Mandir 84.5 85.7 74.8 69.5 87.4 66.4
Alka Chowk 72.1 88.2 78.6 72.1 70.2 65.0
Babu Genu Chowk 84.6 75.5 69.9 77.1 75.8 73.7
Khadaki 66.7 69.3 73.9 70.9 63.7 59.9
M G Road 72.2 75.2 69.5 71.8 65.6 59.0
Chapekar Chowk 69.0 70.8 76.9 75.3 71.5 60.1
Pimprigoan 72.1 75.7 76.2 69.9 64.0 64.9
Thergaon 80.2 78.4 83.3 75.6 70.0 66.4
Table 4(b): Results as on 31st August 2009
1800-1900 1900-2000 2000-2100 2100-2200 2200-2300 2300-2400 Location Day Time Day Time Day Time Day Time Night Time Night Time
Shivaji Nagar 81.2 79.9 78.5 74.2 74.2 73.2
Karve Road 79.6 79.2 86.3 75.1 71.8 72.3
Swar Gate 81.7 81.3 77.9 76.2 68.8 66.5
Satara Road 70.2 74.4 78.1 72.1 68.4 66.8
Shaniwar Peth 88.3 85.4 88.2 85.3 87.2 69.3
Yerawada 79.9 78.7 78.8 79.2 76.4 72.9
Laxmi Road 70.1 68.4 76.2 71.3 66.4 61.5
Kothrud 68.4 72.1 79.6 74.2 67.3 60.4
Mahatma Phule Madai
73.2 71.1 77.4 75.3 70.6 68.8
Sarus Baug 72.6 78.2 70.0 71.6 69.5 70.2
Hadapsar 86.2 94.2 98.1 84.4 71.3 66.2
Deccan 80.2 80.6 84.4 78.6 71.3 67.4
Dagdu Sheth Mandir 75.5 74.4 71.3 77.1 76.1 75.8
Alka Chowk 70.3 80.2 89.1 78.3 69.6 68.1
Babu Genu Chowk 79.3 62.1 76.4 69.9 69.4 64.7
Khadaki 63.3 66.5 70.0 68.9 65.4 59.0
M G Road 75.1 78.2 82.4 89.6 82.1 68.8
Chapekar Chowk 73.4 73.1 76.0 78.9 67.1 62.8
Pimprigoan 77.7 78.4 80.4 73.5 65.0 57.1
Thergaon 82.4 82.2 87.5 89.5 62.2 57.4
Maharashtra Pollution Control Board
Noise Monitoring During Ganesh Festival 2009 24
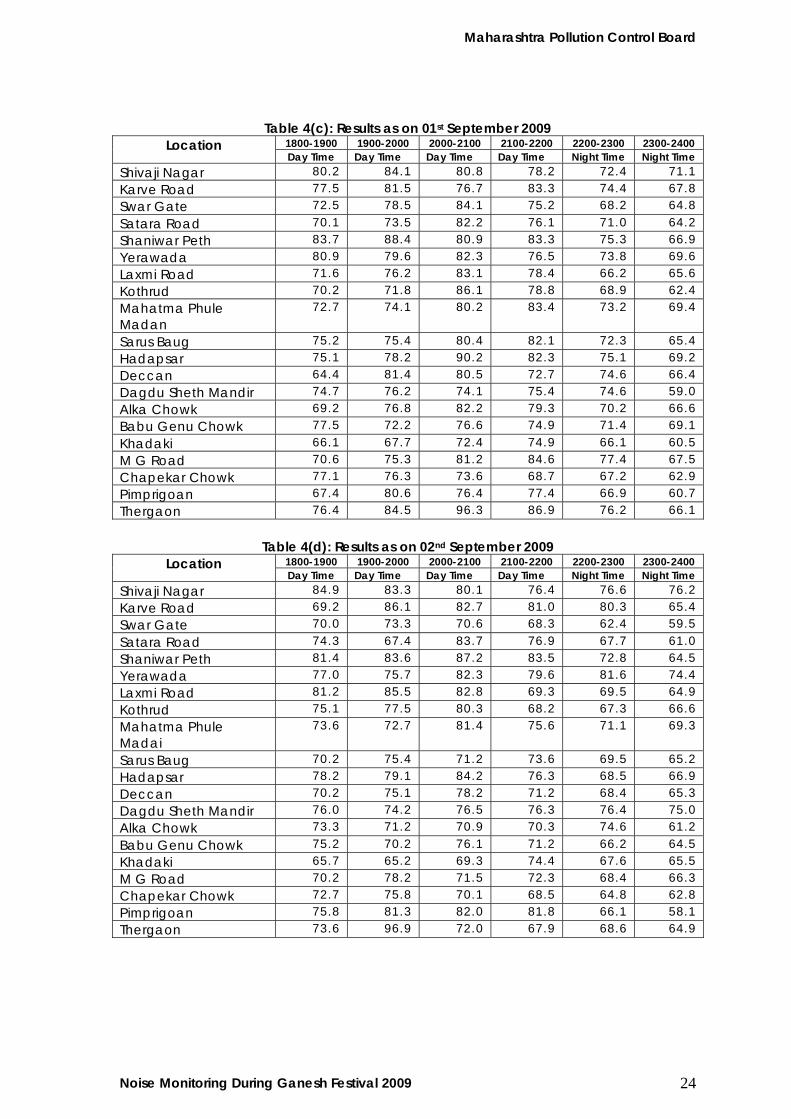
Table 4(c): Results as on 01st September 2009 1800-1900 1900-2000 2000-2100 2100-2200 2200-2300 2300-2400 Location Day Time Day Time Day Time Day Time Night Time Night Time
Shivaji Nagar 80.2 84.1 80.8 78.2 72.4 71.1
Karve Road 77.5 81.5 76.7 83.3 74.4 67.8
Swar Gate 72.5 78.5 84.1 75.2 68.2 64.8
Satara Road 70.1 73.5 82.2 76.1 71.0 64.2
Shaniwar Peth 83.7 88.4 80.9 83.3 75.3 66.9
Yerawada 80.9 79.6 82.3 76.5 73.8 69.6
Laxmi Road 71.6 76.2 83.1 78.4 66.2 65.6
Kothrud 70.2 71.8 86.1 78.8 68.9 62.4
Mahatma Phule Madan
72.7 74.1 80.2 83.4 73.2 69.4
Sarus Baug 75.2 75.4 80.4 82.1 72.3 65.4
Hadapsar 75.1 78.2 90.2 82.3 75.1 69.2
Deccan 64.4 81.4 80.5 72.7 74.6 66.4
Dagdu Sheth Mandir 74.7 76.2 74.1 75.4 74.6 59.0
Alka Chowk 69.2 76.8 82.2 79.3 70.2 66.6
Babu Genu Chowk 77.5 72.2 76.6 74.9 71.4 69.1
Khadaki 66.1 67.7 72.4 74.9 66.1 60.5
M G Road 70.6 75.3 81.2 84.6 77.4 67.5
Chapekar Chowk 77.1 76.3 73.6 68.7 67.2 62.9
Pimprigoan 67.4 80.6 76.4 77.4 66.9 60.7
Thergaon 76.4 84.5 96.3 86.9 76.2 66.1
Table 4(d): Results as on 02nd September 2009
1800-1900 1900-2000 2000-2100 2100-2200 2200-2300 2300-2400 Location Day Time Day Time Day Time Day Time Night Time Night Time
Shivaji Nagar 84.9 83.3 80.1 76.4 76.6 76.2
Karve Road 69.2 86.1 82.7 81.0 80.3 65.4
Swar Gate 70.0 73.3 70.6 68.3 62.4 59.5
Satara Road 74.3 67.4 83.7 76.9 67.7 61.0
Shaniwar Peth 81.4 83.6 87.2 83.5 72.8 64.5
Yerawada 77.0 75.7 82.3 79.6 81.6 74.4
Laxmi Road 81.2 85.5 82.8 69.3 69.5 64.9
Kothrud 75.1 77.5 80.3 68.2 67.3 66.6
Mahatma Phule Madai
73.6 72.7 81.4 75.6 71.1 69.3
Sarus Baug 70.2 75.4 71.2 73.6 69.5 65.2
Hadapsar 78.2 79.1 84.2 76.3 68.5 66.9
Deccan 70.2 75.1 78.2 71.2 68.4 65.3
Dagdu Sheth Mandir 76.0 74.2 76.5 76.3 76.4 75.0
Alka Chowk 73.3 71.2 70.9 70.3 74.6 61.2
Babu Genu Chowk 75.2 70.2 76.1 71.2 66.2 64.5
Khadaki 65.7 65.2 69.3 74.4 67.6 65.5
M G Road 70.2 78.2 71.5 72.3 68.4 66.3
Chapekar Chowk 72.7 75.8 70.1 68.5 64.8 62.8
Pimprigoan 75.8 81.3 82.0 81.8 66.1 58.1
Thergaon 73.6 96.9 72.0 67.9 68.6 64.9
Maharashtra Pollution Control Board
Noise Monitoring During Ganesh Festival 2009 25
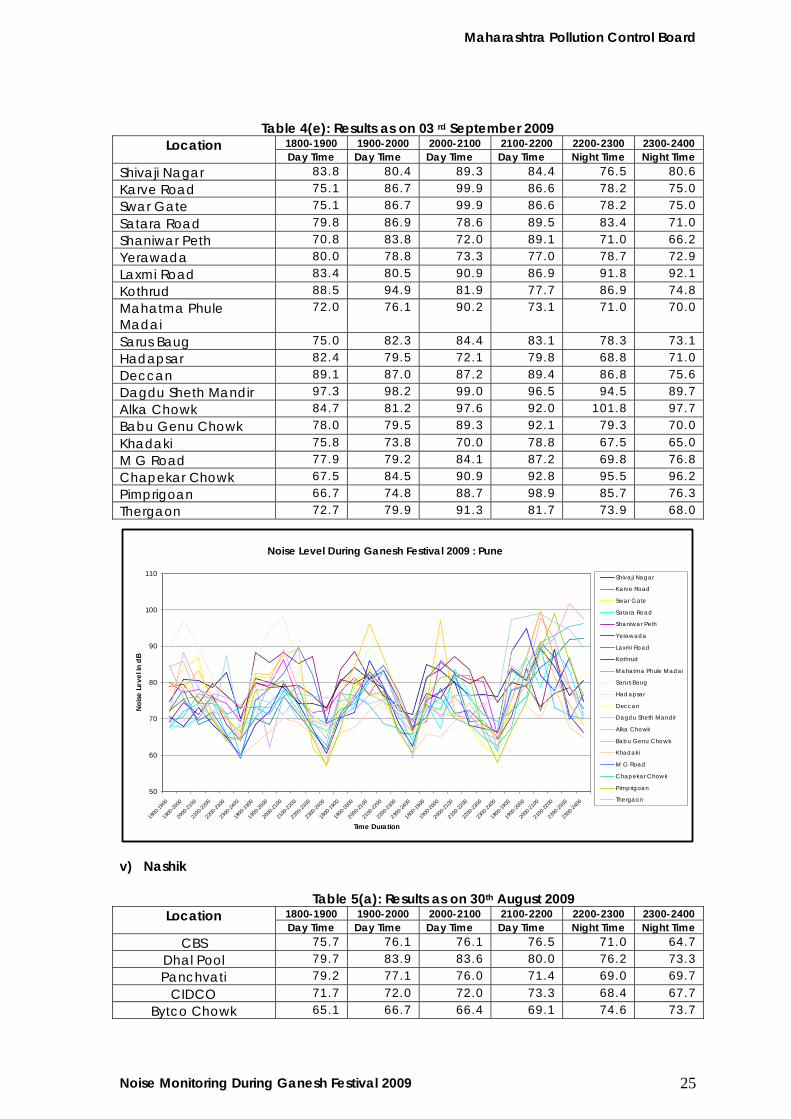
Table 4(e): Results as on 03 rd September 2009 1800-1900 1900-2000 2000-2100 2100-2200 2200-2300 2300-2400 Location Day Time Day Time Day Time Day Time Night Time Night Time
Shivaji Nagar 83.8 80.4 89.3 84.4 76.5 80.6
Karve Road 75.1 86.7 99.9 86.6 78.2 75.0
Swar Gate 75.1 86.7 99.9 86.6 78.2 75.0
Satara Road 79.8 86.9 78.6 89.5 83.4 71.0
Shaniwar Peth 70.8 83.8 72.0 89.1 71.0 66.2
Yerawada 80.0 78.8 73.3 77.0 78.7 72.9
Laxmi Road 83.4 80.5 90.9 86.9 91.8 92.1
Kothrud 88.5 94.9 81.9 77.7 86.9 74.8
Mahatma Phule Madai
72.0 76.1 90.2 73.1 71.0 70.0
Sarus Baug 75.0 82.3 84.4 83.1 78.3 73.1
Hadapsar 82.4 79.5 72.1 79.8 68.8 71.0
Deccan 89.1 87.0 87.2 89.4 86.8 75.6
Dagdu Sheth Mandir 97.3 98.2 99.0 96.5 94.5 89.7
Alka Chowk 84.7 81.2 97.6 92.0 101.8 97.7
Babu Genu Chowk 78.0 79.5 89.3 92.1 79.3 70.0
Khadaki 75.8 73.8 70.0 78.8 67.5 65.0
M G Road 77.9 79.2 84.1 87.2 69.8 76.8
Chapekar Chowk 67.5 84.5 90.9 92.8 95.5 96.2
Pimprigoan 66.7 74.8 88.7 98.9 85.7 76.3
Thergaon 72.7 79.9 91.3 81.7 73.9 68.0
Noise Level During Ganesh Festival 2009 : Pune
50
60
70
80
90
100
110
1800-1
900
1900-20
00
2000
-2100
2100-2
200
2200-23
00
2300
-2400
1800-1
900
1900-2
000
2000
-2100
2100
-2200
2200-2
300
2300-24
00
1800
-1900
1900-2
000
2000-2
100
2100
-2200
2200-2
300
2300-2
400
1800-19
00
1900
-2000
2000-2
100
2100-22
00
2200
-2300
2300-2
400
1800-1
900
1900
-2000
2000
-2100
2100-2
200
2200-23
00
2300
-2400
Time Duration
Noi
se L
evel
in d
B
Shivaji Nagar
Karve Road
Swar Gate
Satara Road
Shaniwar Peth
Yerawada
Laxmi Road
Kothrud
Mahatma Phule Madai
Sarus Baug
Hadapsar
Deccan
Dagdu Sheth Mandir
Alka Chowk
Babu Genu Chowk
Khadaki
M G Road
Chapekar Chowk
Pimprigoan
Thergaon
v) Nashik
Table 5(a): Results as on 30th August 2009 1800-1900 1900-2000 2000-2100 2100-2200 2200-2300 2300-2400 Location Day Time Day Time Day Time Day Time Night Time Night Time
CBS 75.7 76.1 76.1 76.5 71.0 64.7
Dhal Pool 79.7 83.9 83.6 80.0 76.2 73.3
Panchvati 79.2 77.1 76.0 71.4 69.0 69.7
CIDCO 71.7 72.0 72.0 73.3 68.4 67.7
Bytco Chowk 65.1 66.7 66.4 69.1 74.6 73.7
Maharashtra Pollution Control Board
Noise Monitoring During Ganesh Festival 2009 26
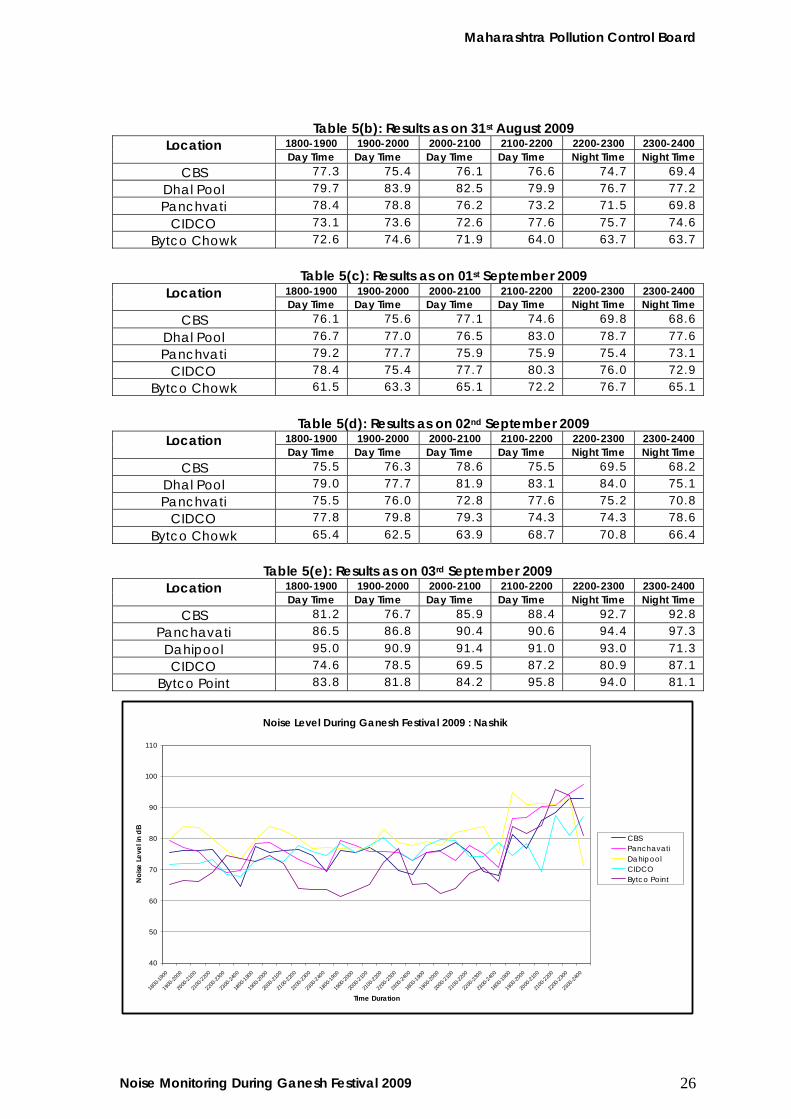
Table 5(b): Results as on 31st August 2009 1800-1900 1900-2000 2000-2100 2100-2200 2200-2300 2300-2400 Location Day Time Day Time Day Time Day Time Night Time Night Time
CBS 77.3 75.4 76.1 76.6 74.7 69.4
Dhal Pool 79.7 83.9 82.5 79.9 76.7 77.2
Panchvati 78.4 78.8 76.2 73.2 71.5 69.8
CIDCO 73.1 73.6 72.6 77.6 75.7 74.6
Bytco Chowk 72.6 74.6 71.9 64.0 63.7 63.7
Table 5(c): Results as on 01st September 2009
1800-1900 1900-2000 2000-2100 2100-2200 2200-2300 2300-2400 Location Day Time Day Time Day Time Day Time Night Time Night Time
CBS 76.1 75.6 77.1 74.6 69.8 68.6
Dhal Pool 76.7 77.0 76.5 83.0 78.7 77.6
Panchvati 79.2 77.7 75.9 75.9 75.4 73.1
CIDCO 78.4 75.4 77.7 80.3 76.0 72.9
Bytco Chowk 61.5 63.3 65.1 72.2 76.7 65.1
Table 5(d): Results as on 02nd September 2009
1800-1900 1900-2000 2000-2100 2100-2200 2200-2300 2300-2400 Location Day Time Day Time Day Time Day Time Night Time Night Time
CBS 75.5 76.3 78.6 75.5 69.5 68.2
Dhal Pool 79.0 77.7 81.9 83.1 84.0 75.1
Panchvati 75.5 76.0 72.8 77.6 75.2 70.8
CIDCO 77.8 79.8 79.3 74.3 74.3 78.6
Bytco Chowk 65.4 62.5 63.9 68.7 70.8 66.4
Table 5(e): Results as on 03rd September 2009
1800-1900 1900-2000 2000-2100 2100-2200 2200-2300 2300-2400 Location Day Time Day Time Day Time Day Time Night Time Night Time
CBS 81.2 76.7 85.9 88.4 92.7 92.8
Panchavati 86.5 86.8 90.4 90.6 94.4 97.3
Dahipool 95.0 90.9 91.4 91.0 93.0 71.3
CIDCO 74.6 78.5 69.5 87.2 80.9 87.1
Bytco Point 83.8 81.8 84.2 95.8 94.0 81.1
Noise Level During Ganesh Festival 2009 : Nashik
40
50
60
70
80
90
100
110
1800-1
900
1900-20
00
2000
-2100
2100-2
200
2200-23
00
2300
-2400
1800-1
900
1900-2
000
2000
-2100
2100
-2200
2200
-2300
2300
-2400
1800-1
900
1900-20
00
2000
-2100
2100-2
200
2200-23
00
2300
-2400
1800-1
900
1900-2
000
2000-2
100
2100-2
200
2200
-2300
2300
-2400
1800-1
900
1900-20
00
2000
-2100
2100-2
200
2200-23
00
2300
-2400
Time Duration
Noi
se L
evel
in d
B
CBSPanchavatiDahipool CIDCOBytco Point
Maharashtra Pollution Control Board
Noise Monitoring During Ganesh Festival 2009 27
vi) Aurangabad
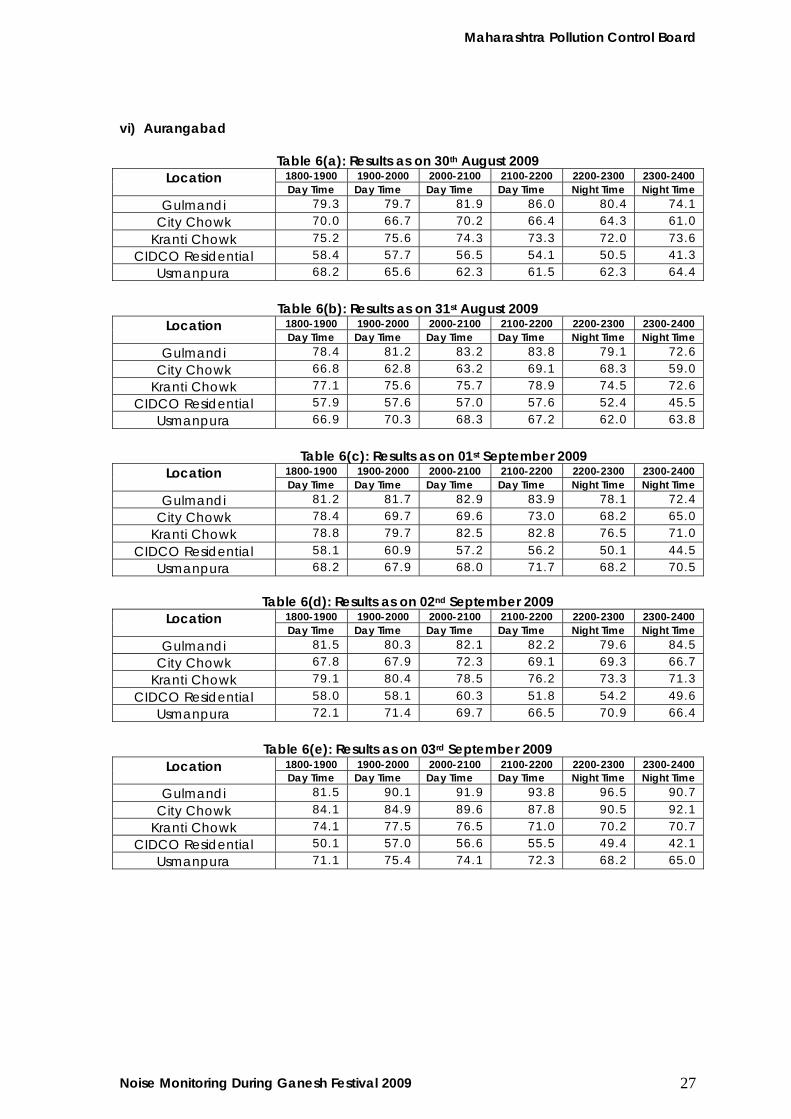
Table 6(a): Results as on 30th August 2009 1800-1900 1900-2000 2000-2100 2100-2200 2200-2300 2300-2400 Location Day Time Day Time Day Time Day Time Night Time Night Time
Gulmandi 79.3 79.7 81.9 86.0 80.4 74.1
City Chowk 70.0 66.7 70.2 66.4 64.3 61.0
Kranti Chowk 75.2 75.6 74.3 73.3 72.0 73.6
CIDCO Residential 58.4 57.7 56.5 54.1 50.5 41.3
Usmanpura 68.2 65.6 62.3 61.5 62.3 64.4
Table 6(b): Results as on 31st August 2009
1800-1900 1900-2000 2000-2100 2100-2200 2200-2300 2300-2400 Location Day Time Day Time Day Time Day Time Night Time Night Time
Gulmandi 78.4 81.2 83.2 83.8 79.1 72.6
City Chowk 66.8 62.8 63.2 69.1 68.3 59.0
Kranti Chowk 77.1 75.6 75.7 78.9 74.5 72.6
CIDCO Residential 57.9 57.6 57.0 57.6 52.4 45.5
Usmanpura 66.9 70.3 68.3 67.2 62.0 63.8
Table 6(c): Results as on 01st September 2009
1800-1900 1900-2000 2000-2100 2100-2200 2200-2300 2300-2400 Location Day Time Day Time Day Time Day Time Night Time Night Time
Gulmandi 81.2 81.7 82.9 83.9 78.1 72.4
City Chowk 78.4 69.7 69.6 73.0 68.2 65.0
Kranti Chowk 78.8 79.7 82.5 82.8 76.5 71.0
CIDCO Residential 58.1 60.9 57.2 56.2 50.1 44.5
Usmanpura 68.2 67.9 68.0 71.7 68.2 70.5
Table 6(d): Results as on 02nd September 2009
1800-1900 1900-2000 2000-2100 2100-2200 2200-2300 2300-2400 Location Day Time Day Time Day Time Day Time Night Time Night Time
Gulmandi 81.5 80.3 82.1 82.2 79.6 84.5
City Chowk 67.8 67.9 72.3 69.1 69.3 66.7
Kranti Chowk 79.1 80.4 78.5 76.2 73.3 71.3
CIDCO Residential 58.0 58.1 60.3 51.8 54.2 49.6
Usmanpura 72.1 71.4 69.7 66.5 70.9 66.4
Table 6(e): Results as on 03rd September 2009
1800-1900 1900-2000 2000-2100 2100-2200 2200-2300 2300-2400 Location Day Time Day Time Day Time Day Time Night Time Night Time
Gulmandi 81.5 90.1 91.9 93.8 96.5 90.7
City Chowk 84.1 84.9 89.6 87.8 90.5 92.1
Kranti Chowk 74.1 77.5 76.5 71.0 70.2 70.7
CIDCO Residential 50.1 57.0 56.6 55.5 49.4 42.1
Usmanpura 71.1 75.4 74.1 72.3 68.2 65.0
Maharashtra Pollution Control Board
Noise Monitoring During Ganesh Festival 2009 28
Noise Level During Ganesh Festival 2009 :Aurangabad
40
50
60
70
80
90
100
1800-1
900
1900-20
00
2000
-2100
2100-2
200
2200-23
00
2300
-2400
1800-1
900
1900
-2000
2000-2
100
2100-2
200
2200
-2300
2300
-2400
1800-1
900
1900-20
00
2000
-2100
2100-22
00
2200
-2300
2300-2
400
1800-19
00
1900
-2000
2000-2
100
2100-2
200
2200-2
300
2300-2
400
1800
-1900
1900
-2000
2000-2
100
2100-22
00
2200
-2300
2300-2
400
Time Duration
Noi
se L
evel
in d
B GulmandiCity ChowkKranti ChowkCIDCO ResidentialUsmanpura
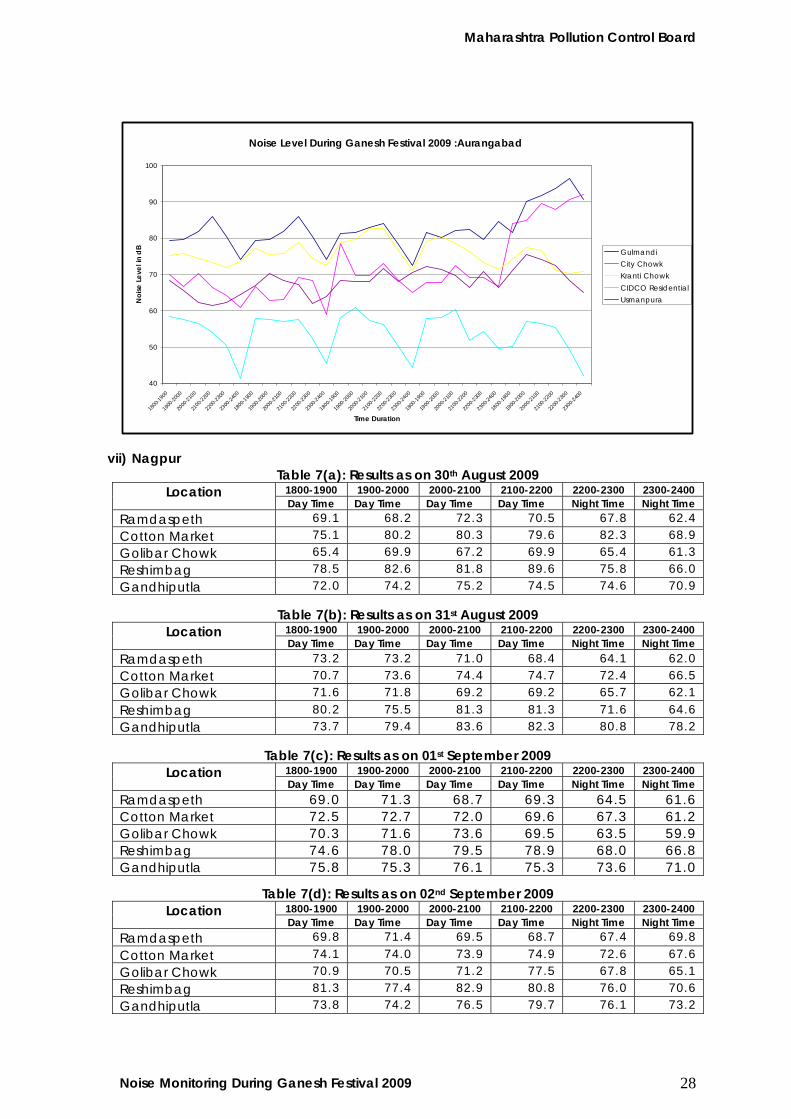
vii) Nagpur Table 7(a): Results as on 30th August 2009
1800-1900 1900-2000 2000-2100 2100-2200 2200-2300 2300-2400 Location Day Time Day Time Day Time Day Time Night Time Night Time
Ramdaspeth 69.1 68.2 72.3 70.5 67.8 62.4
Cotton Market 75.1 80.2 80.3 79.6 82.3 68.9
Golibar Chowk 65.4 69.9 67.2 69.9 65.4 61.3
Reshimbag 78.5 82.6 81.8 89.6 75.8 66.0
Gandhiputla 72.0 74.2 75.2 74.5 74.6 70.9
Table 7(b): Results as on 31st August 2009 1800-1900 1900-2000 2000-2100 2100-2200 2200-2300 2300-2400 Location Day Time Day Time Day Time Day Time Night Time Night Time
Ramdaspeth 73.2 73.2 71.0 68.4 64.1 62.0 Cotton Market 70.7 73.6 74.4 74.7 72.4 66.5 Golibar Chowk 71.6 71.8 69.2 69.2 65.7 62.1
Reshimbag 80.2 75.5 81.3 81.3 71.6 64.6 Gandhiputla 73.7 79.4 83.6 82.3 80.8 78.2
Table 7(c): Results as on 01st September 2009
1800-1900 1900-2000 2000-2100 2100-2200 2200-2300 2300-2400 Location Day Time Day Time Day Time Day Time Night Time Night Time
Ramdaspeth 69.0 71.3 68.7 69.3 64.5 61.6 Cotton Market 72.5 72.7 72.0 69.6 67.3 61.2 Golibar Chowk 70.3 71.6 73.6 69.5 63.5 59.9 Reshimbag 74.6 78.0 79.5 78.9 68.0 66.8 Gandhiputla 75.8 75.3 76.1 75.3 73.6 71.0
Table 7(d): Results as on 02nd September 2009 1800-1900 1900-2000 2000-2100 2100-2200 2200-2300 2300-2400 Location Day Time Day Time Day Time Day Time Night Time Night Time
Ramdaspeth 69.8 71.4 69.5 68.7 67.4 69.8
Cotton Market 74.1 74.0 73.9 74.9 72.6 67.6
Golibar Chowk 70.9 70.5 71.2 77.5 67.8 65.1
Reshimbag 81.3 77.4 82.9 80.8 76.0 70.6
Gandhiputla 73.8 74.2 76.5 79.7 76.1 73.2
Maharashtra Pollution Control Board
Noise Monitoring During Ganesh Festival 2009 29
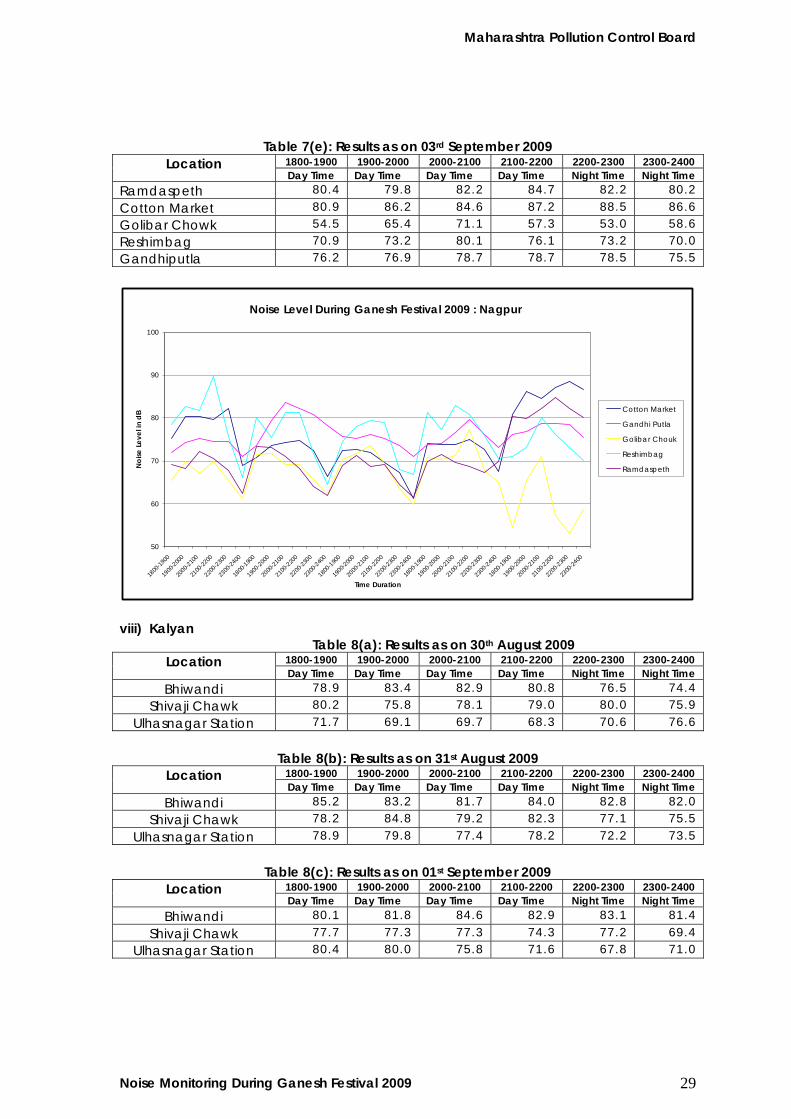
Table 7(e): Results as on 03rd September 2009
1800-1900 1900-2000 2000-2100 2100-2200 2200-2300 2300-2400 Location Day Time Day Time Day Time Day Time Night Time Night Time
Ramdaspeth 80.4 79.8 82.2 84.7 82.2 80.2
Cotton Market 80.9 86.2 84.6 87.2 88.5 86.6
Golibar Chowk 54.5 65.4 71.1 57.3 53.0 58.6
Reshimbag 70.9 73.2 80.1 76.1 73.2 70.0
Gandhiputla 76.2 76.9 78.7 78.7 78.5 75.5
Noise Level During Ganesh Festival 2009 : Nagpur
50
60
70
80
90
100
1800
-1900
1900
-2000
2000-2
100
2100
-2200
2200-230
0
2300
-2400
1800
-1900
1900-200
0
2000
-2100
2100-220
0
2200
-2300
2300
-2400
1800-190
0
1900-2
000
2000
-2100
2100
-2200
2200
-2300
2300
-2400
1800-1
900
1900
-2000
2000
-2100
2100
-2200
2200
-2300
2300-240
0
1800
-1900
1900
-2000
2000
-2100
2100
-2200
2200-230
0
2300
-2400
Time Duration
Noi
se L
evel
in d
B Cotton Market
Gandhi Putla
Golibar Chouk
Reshimbag
Ramdaspeth
viii) Kalyan
Table 8(a): Results as on 30th August 2009 1800-1900 1900-2000 2000-2100 2100-2200 2200-2300 2300-2400 Location Day Time Day Time Day Time Day Time Night Time Night Time
Bhiwandi 78.9 83.4 82.9 80.8 76.5 74.4
Shivaji Chawk 80.2 75.8 78.1 79.0 80.0 75.9
Ulhasnagar Station 71.7 69.1 69.7 68.3 70.6 76.6
Table 8(b): Results as on 31st August 2009
1800-1900 1900-2000 2000-2100 2100-2200 2200-2300 2300-2400 Location Day Time Day Time Day Time Day Time Night Time Night Time
Bhiwandi 85.2 83.2 81.7 84.0 82.8 82.0
Shivaji Chawk 78.2 84.8 79.2 82.3 77.1 75.5
Ulhasnagar Station 78.9 79.8 77.4 78.2 72.2 73.5
Table 8(c): Results as on 01st September 2009
1800-1900 1900-2000 2000-2100 2100-2200 2200-2300 2300-2400 Location Day Time Day Time Day Time Day Time Night Time Night Time
Bhiwandi 80.1 81.8 84.6 82.9 83.1 81.4
Shivaji Chawk 77.7 77.3 77.3 74.3 77.2 69.4
Ulhasnagar Station 80.4 80.0 75.8 71.6 67.8 71.0
Maharashtra Pollution Control Board
Noise Monitoring During Ganesh Festival 2009 30
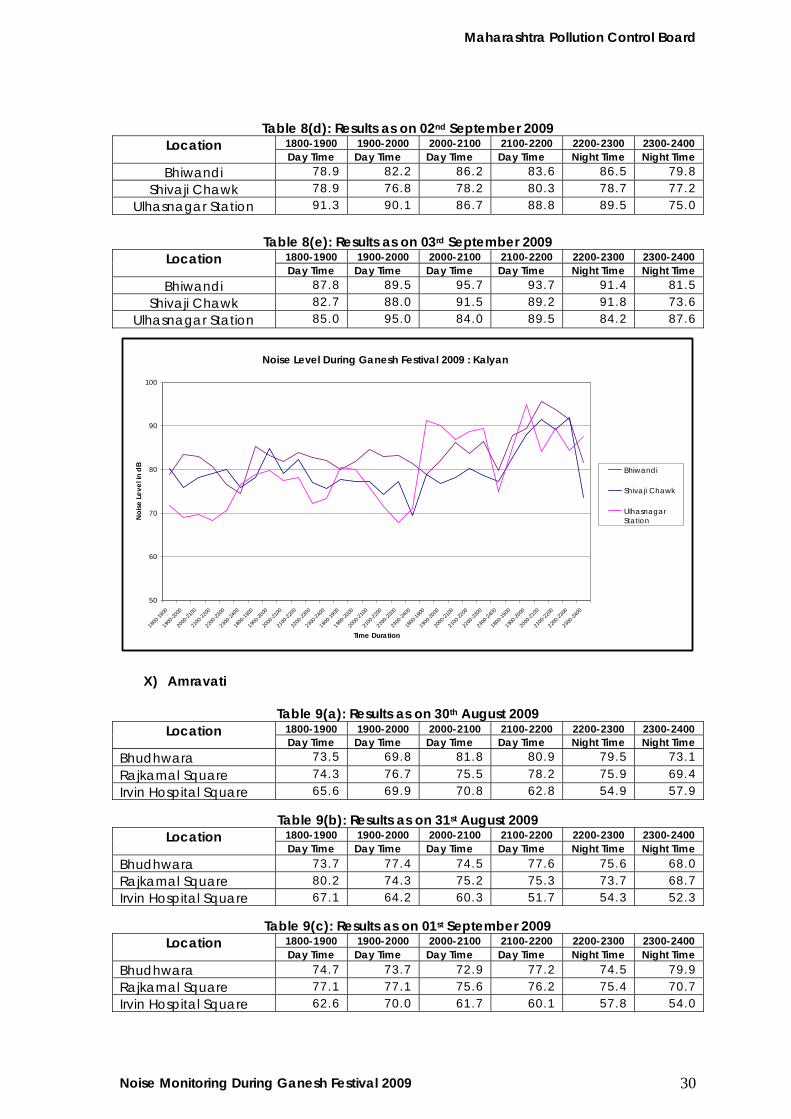
Table 8(d): Results as on 02nd September 2009 1800-1900 1900-2000 2000-2100 2100-2200 2200-2300 2300-2400 Location Day Time Day Time Day Time Day Time Night Time Night Time
Bhiwandi 78.9 82.2 86.2 83.6 86.5 79.8
Shivaji Chawk 78.9 76.8 78.2 80.3 78.7 77.2
Ulhasnagar Station 91.3 90.1 86.7 88.8 89.5 75.0
Table 8(e): Results as on 03rd September 2009
1800-1900 1900-2000 2000-2100 2100-2200 2200-2300 2300-2400 Location Day Time Day Time Day Time Day Time Night Time Night Time
Bhiwandi 87.8 89.5 95.7 93.7 91.4 81.5
Shivaji Chawk 82.7 88.0 91.5 89.2 91.8 73.6
Ulhasnagar Station 85.0 95.0 84.0 89.5 84.2 87.6
Noise Level During Ganesh Festival 2009 : Kalyan
50
60
70
80
90
100
1800-1
900
1900-20
00
2000
-2100
2100-2
200
2200-23
00
2300
-2400
1800-1
900
1900-2
000
2000
-2100
2100
-2200
2200
-2300
2300
-2400
1800-1
900
1900-20
00
2000
-2100
2100-2
200
2200-23
00
2300
-2400
1800-1
900
1900-2
000
2000-2
100
2100-2
200
2200
-2300
2300
-2400
1800-1
900
1900-20
00
2000
-2100
2100-2
200
2200-23
00
2300
-2400
Time Duration
Noi
se L
evel
in d
B
Bhiwandi
Shivaji Chawk
UlhasnagarStation
X) Amravati
Table 9(a): Results as on 30th August 2009 1800-1900 1900-2000 2000-2100 2100-2200 2200-2300 2300-2400 Location Day Time Day Time Day Time Day Time Night Time Night Time
Bhudhwara 73.5 69.8 81.8 80.9 79.5 73.1
Rajkamal Square 74.3 76.7 75.5 78.2 75.9 69.4
Irvin Hospital Square 65.6 69.9 70.8 62.8 54.9 57.9
Table 9(b): Results as on 31st August 2009 1800-1900 1900-2000 2000-2100 2100-2200 2200-2300 2300-2400 Location Day Time Day Time Day Time Day Time Night Time Night Time
Bhudhwara 73.7 77.4 74.5 77.6 75.6 68.0 Rajkamal Square 80.2 74.3 75.2 75.3 73.7 68.7 Irvin Hospital Square 67.1 64.2 60.3 51.7 54.3 52.3
Table 9(c): Results as on 01st September 2009 1800-1900 1900-2000 2000-2100 2100-2200 2200-2300 2300-2400 Location Day Time Day Time Day Time Day Time Night Time Night Time
Bhudhwara 74.7 73.7 72.9 77.2 74.5 79.9 Rajkamal Square 77.1 77.1 75.6 76.2 75.4 70.7 Irvin Hospital Square 62.6 70.0 61.7 60.1 57.8 54.0
Maharashtra Pollution Control Board
Noise Monitoring During Ganesh Festival 2009 31
Table 9(d): Results as on 02nd September 2009 1800-1900 1900-2000 2000-2100 2100-2200 2200-2300 2300-2400 Location Day Time Day Time Day Time Day Time Night Time Night Time
Bhudhwara 74.7 76.7 77.6 78.4 78.1 73.0
Rajkamal Square 77.6 78.6 82.5 73.4 68.0 64.8
Irvin Hospital Square 61.6 64.3 64.2 62.3 60.9 57.9
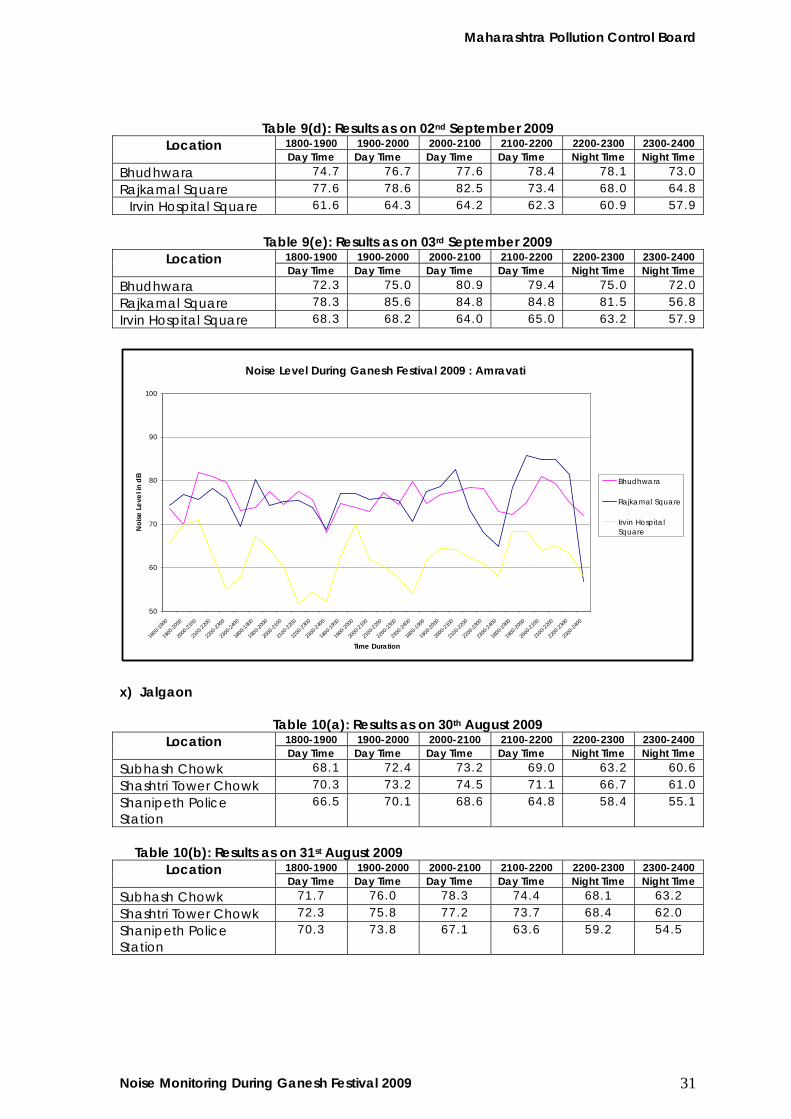
Table 9(e): Results as on 03rd September 2009
1800-1900 1900-2000 2000-2100 2100-2200 2200-2300 2300-2400 Location Day Time Day Time Day Time Day Time Night Time Night Time
Bhudhwara 72.3 75.0 80.9 79.4 75.0 72.0
Rajkamal Square 78.3 85.6 84.8 84.8 81.5 56.8
Irvin Hospital Square 68.3 68.2 64.0 65.0 63.2 57.9
Noise Level During Ganesh Festival 2009 : Amravati
50
60
70
80
90
100
1800-1
900
1900-20
00
2000
-2100
2100-2
200
2200-23
00
2300
-2400
1800-1
900
1900-2
000
2000
-2100
2100
-2200
2200
-2300
2300
-2400
1800-1
900
1900-20
00
2000
-2100
2100-2
200
2200-23
00
2300
-2400
1800-1
900
1900-2
000
2000-2
100
2100-2
200
2200
-2300
2300
-2400
1800-1
900
1900-20
00
2000
-2100
2100-2
200
2200-23
00
2300
-2400
Time Duration
Noi
se L
evel
in d
B
Bhudhwara
Rajkamal Square
Irvin HospitalSquare
x) Jalgaon
Table 10(a): Results as on 30th August 2009 1800-1900 1900-2000 2000-2100 2100-2200 2200-2300 2300-2400 Location Day Time Day Time Day Time Day Time Night Time Night Time
Subhash Chowk 68.1 72.4 73.2 69.0 63.2 60.6
Shashtri Tower Chowk 70.3 73.2 74.5 71.1 66.7 61.0
Shanipeth Police Station
66.5 70.1 68.6 64.8 58.4 55.1
Table 10(b): Results as on 31st August 2009
1800-1900 1900-2000 2000-2100 2100-2200 2200-2300 2300-2400 Location Day Time Day Time Day Time Day Time Night Time Night Time
Subhash Chowk 71.7 76.0 78.3 74.4 68.1 63.2
Shashtri Tower Chowk 72.3 75.8 77.2 73.7 68.4 62.0
Shanipeth Police Station
70.3 73.8 67.1 63.6 59.2 54.5
Maharashtra Pollution Control Board
Noise Monitoring During Ganesh Festival 2009 32
Table 10(c): Results as on 01st September 2009 1800-1900 1900-2000 2000-2100 2100-2200 2200-2300 2300-2400 Location Day Time Day Time Day Time Day Time Night Time Night Time
Subhash Chowk 71.5 83.9 76.7 78.5 69.0 63.4 Shashtri Tower Chowk 70.2 77.6 75.1 76.9 68.3 64.0 Shanipeth Police Station
68.4 73.0 71.3 69.4 65.6 61.2
Table 10(d): Results as on 02nd September 2009
1800-1900 1900-2000 2000-2100 2100-2200 2200-2300 2300-2400 Location Day Time Day Time Day Time Day Time Night Time Night Time
Subhash Chowk 72.5 73.3 74.2 77.4 71.0 64.6
Shashtri Tower Chowk 77.6 76.8 78.0 74.3 73.6 64.5
Shanipeth Police Station
69.1 72.7 70.3 68.6 66.2 62.4
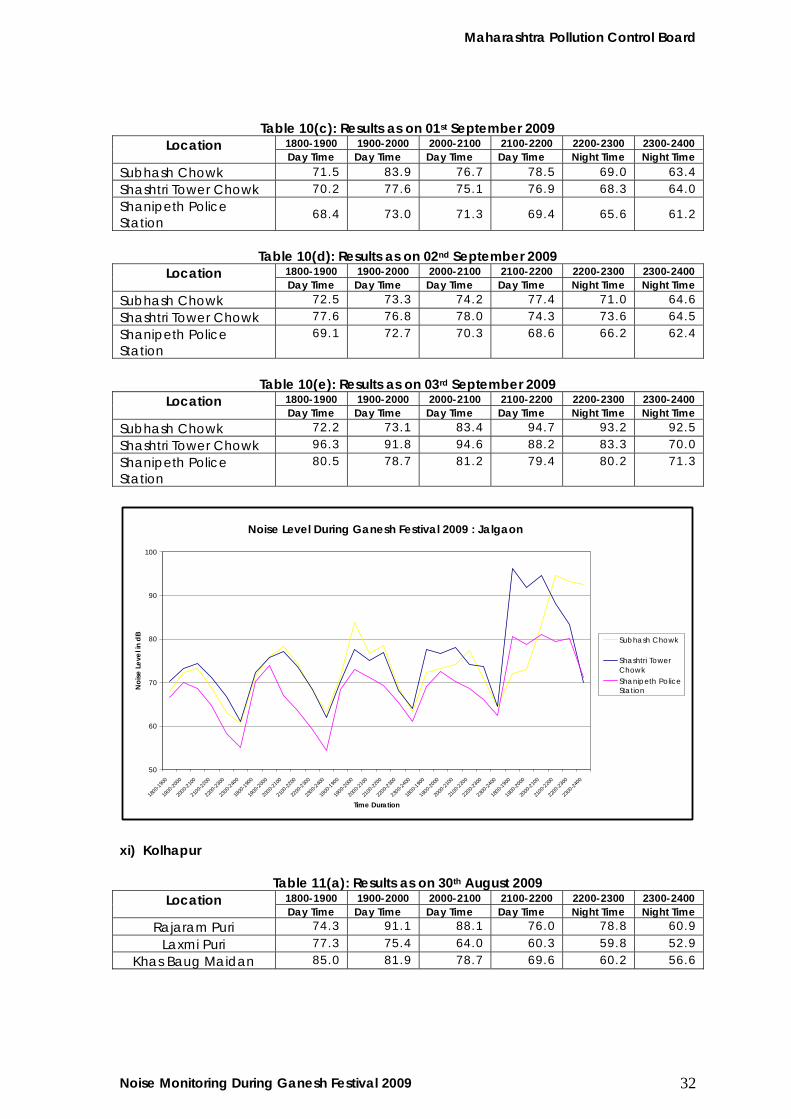
Table 10(e): Results as on 03rd September 2009
1800-1900 1900-2000 2000-2100 2100-2200 2200-2300 2300-2400 Location Day Time Day Time Day Time Day Time Night Time Night Time
Subhash Chowk 72.2 73.1 83.4 94.7 93.2 92.5
Shashtri Tower Chowk 96.3 91.8 94.6 88.2 83.3 70.0
Shanipeth Police Station
80.5 78.7 81.2 79.4 80.2 71.3
Noise Level During Ganesh Festival 2009 : Jalgaon
50
60
70
80
90
100
1800-1
900
1900
-2000
2000-2
100
2100-2
200
2200-23
00
2300
-2400
1800
-1900
1900
-2000
2000-2
100
2100-22
00
2200
-2300
2300-2
400
1800
-1900
1900-2
000
2000-2
100
2100
-2200
2200-2
300
2300-2
400
1800-1
900
1900-2
000
2000
-2100
2100
-2200
2200-2
300
2300-24
00
1800-1
900
1900-20
00
2000
-2100
2100-2
200
2200-23
00
2300
-2400
Time Duration
Noi
se L
evel
in d
B
Subhash Chowk
Shashtri TowerChowkShanipeth PoliceStation
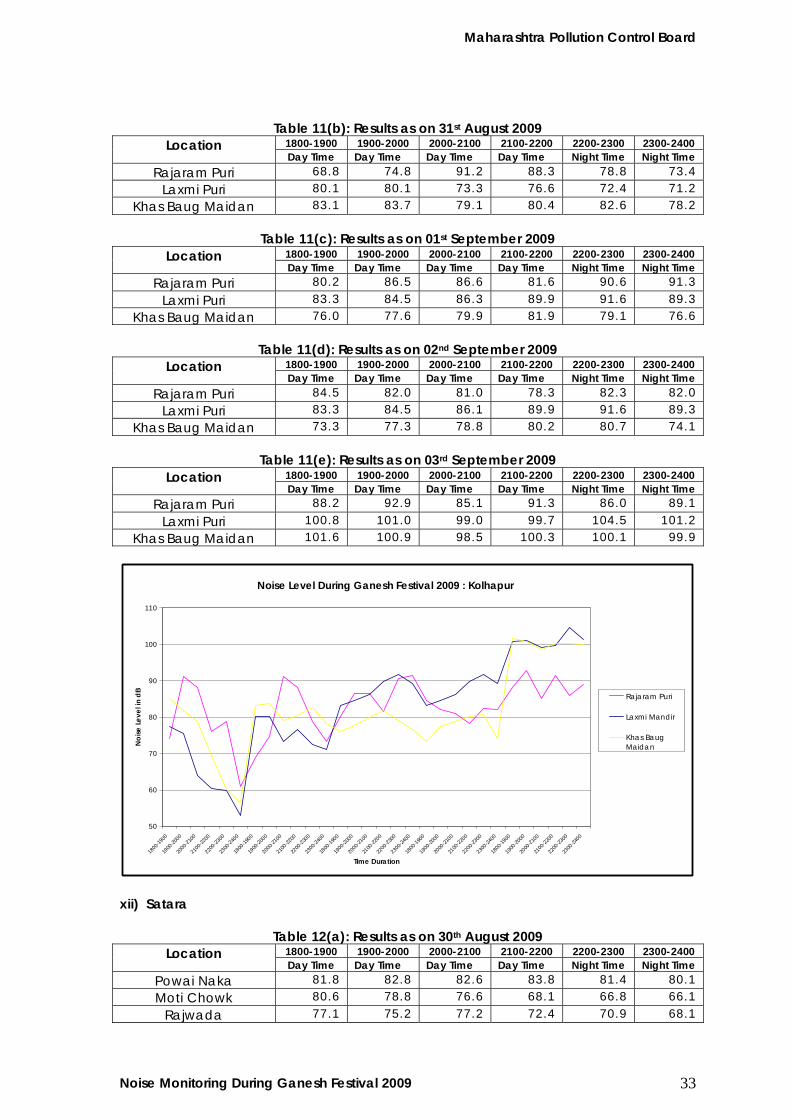
xi) Kolhapur
Table 11(a): Results as on 30th August 2009 1800-1900 1900-2000 2000-2100 2100-2200 2200-2300 2300-2400 Location Day Time Day Time Day Time Day Time Night Time Night Time
Rajaram Puri 74.3 91.1 88.1 76.0 78.8 60.9
Laxmi Puri 77.3 75.4 64.0 60.3 59.8 52.9
Khas Baug Maidan 85.0 81.9 78.7 69.6 60.2 56.6
Maharashtra Pollution Control Board
Noise Monitoring During Ganesh Festival 2009 33
Table 11(b): Results as on 31st August 2009 1800-1900 1900-2000 2000-2100 2100-2200 2200-2300 2300-2400 Location Day Time Day Time Day Time Day Time Night Time Night Time
Rajaram Puri 68.8 74.8 91.2 88.3 78.8 73.4
Laxmi Puri 80.1 80.1 73.3 76.6 72.4 71.2
Khas Baug Maidan 83.1 83.7 79.1 80.4 82.6 78.2
Table 11(c): Results as on 01st September 2009 1800-1900 1900-2000 2000-2100 2100-2200 2200-2300 2300-2400 Location Day Time Day Time Day Time Day Time Night Time Night Time
Rajaram Puri 80.2 86.5 86.6 81.6 90.6 91.3
Laxmi Puri 83.3 84.5 86.3 89.9 91.6 89.3
Khas Baug Maidan 76.0 77.6 79.9 81.9 79.1 76.6
Table 11(d): Results as on 02nd September 2009 1800-1900 1900-2000 2000-2100 2100-2200 2200-2300 2300-2400 Location Day Time Day Time Day Time Day Time Night Time Night Time
Rajaram Puri 84.5 82.0 81.0 78.3 82.3 82.0
Laxmi Puri 83.3 84.5 86.1 89.9 91.6 89.3
Khas Baug Maidan 73.3 77.3 78.8 80.2 80.7 74.1
Table 11(e): Results as on 03rd September 2009 1800-1900 1900-2000 2000-2100 2100-2200 2200-2300 2300-2400 Location Day Time Day Time Day Time Day Time Night Time Night Time
Rajaram Puri 88.2 92.9 85.1 91.3 86.0 89.1
Laxmi Puri 100.8 101.0 99.0 99.7 104.5 101.2
Khas Baug Maidan 101.6 100.9 98.5 100.3 100.1 99.9
Noise Level During Ganesh Festival 2009 : Kolhapur
50
60
70
80
90
100
110
1800-1
900
1900
-2000
2000-2
100
2100-2
200
2200-23
00
2300
-2400
1800
-1900
1900
-2000
2000-2
100
2100-22
00
2200
-2300
2300-2
400
1800
-1900
1900-2
000
2000-2
100
2100
-2200
2200-2
300
2300-2
400
1800-1
900
1900-2
000
2000
-2100
2100
-2200
2200-2
300
2300-24
00
1800-1
900
1900-20
00
2000
-2100
2100-2
200
2200-23
00
2300
-2400
Time Duration
Noi
se L
evel
in d
B
Rajaram Puri
Laxmi Mandir
Khas BaugMaidan
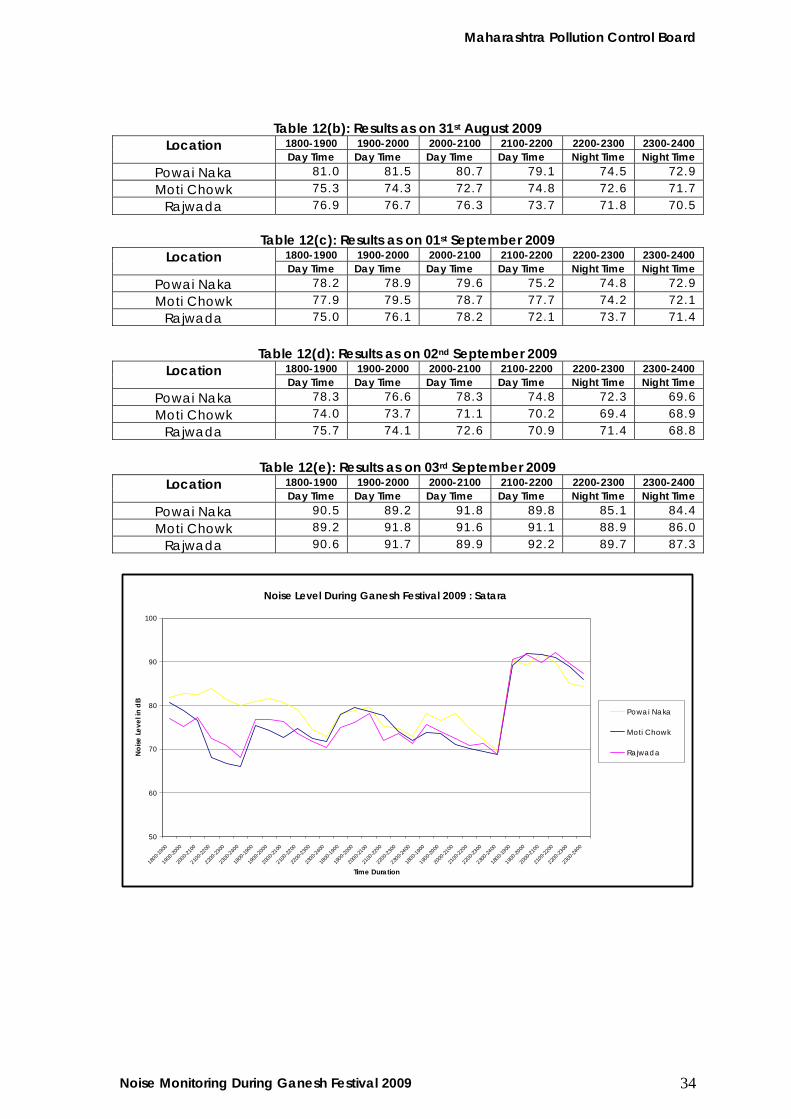
xii) Satara
Table 12(a): Results as on 30th August 2009 1800-1900 1900-2000 2000-2100 2100-2200 2200-2300 2300-2400 Location Day Time Day Time Day Time Day Time Night Time Night Time
Powai Naka 81.8 82.8 82.6 83.8 81.4 80.1
Moti Chowk 80.6 78.8 76.6 68.1 66.8 66.1
Rajwada 77.1 75.2 77.2 72.4 70.9 68.1
Maharashtra Pollution Control Board
Noise Monitoring During Ganesh Festival 2009 34
Table 12(b): Results as on 31st August 2009 1800-1900 1900-2000 2000-2100 2100-2200 2200-2300 2300-2400 Location Day Time Day Time Day Time Day Time Night Time Night Time
Powai Naka 81.0 81.5 80.7 79.1 74.5 72.9
Moti Chowk 75.3 74.3 72.7 74.8 72.6 71.7
Rajwada 76.9 76.7 76.3 73.7 71.8 70.5
Table 12(c): Results as on 01st September 2009
1800-1900 1900-2000 2000-2100 2100-2200 2200-2300 2300-2400 Location Day Time Day Time Day Time Day Time Night Time Night Time
Powai Naka 78.2 78.9 79.6 75.2 74.8 72.9
Moti Chowk 77.9 79.5 78.7 77.7 74.2 72.1
Rajwada 75.0 76.1 78.2 72.1 73.7 71.4
Table 12(d): Results as on 02nd September 2009
1800-1900 1900-2000 2000-2100 2100-2200 2200-2300 2300-2400 Location Day Time Day Time Day Time Day Time Night Time Night Time
Powai Naka 78.3 76.6 78.3 74.8 72.3 69.6
Moti Chowk 74.0 73.7 71.1 70.2 69.4 68.9
Rajwada 75.7 74.1 72.6 70.9 71.4 68.8
Table 12(e): Results as on 03rd September 2009
1800-1900 1900-2000 2000-2100 2100-2200 2200-2300 2300-2400 Location Day Time Day Time Day Time Day Time Night Time Night Time
Powai Naka 90.5 89.2 91.8 89.8 85.1 84.4
Moti Chowk 89.2 91.8 91.6 91.1 88.9 86.0
Rajwada 90.6 91.7 89.9 92.2 89.7 87.3
Noise Level During Ganesh Festival 2009 : Satara
50
60
70
80
90
100
1800-1
900
1900
-2000
2000-2
100
2100-2
200
2200-23
00
2300
-2400
1800
-1900
1900
-2000
2000-2
100
2100-22
00
2200
-2300
2300-2
400
1800
-1900
1900-2
000
2000-2
100
2100
-2200
2200-2
300
2300-2
400
1800-1
900
1900-2
000
2000
-2100
2100
-2200
2200-2
300
2300-24
00
1800-1
900
1900-20
00
2000
-2100
2100-2
200
2200-23
00
2300
-2400
Time Duration
Noi
se L
evel
in d
B
Powai Naka
Moti Chowk
Rajwada
Maharashtra Pollution Control Board
Noise Monitoring During Ganesh Festival 2009 35
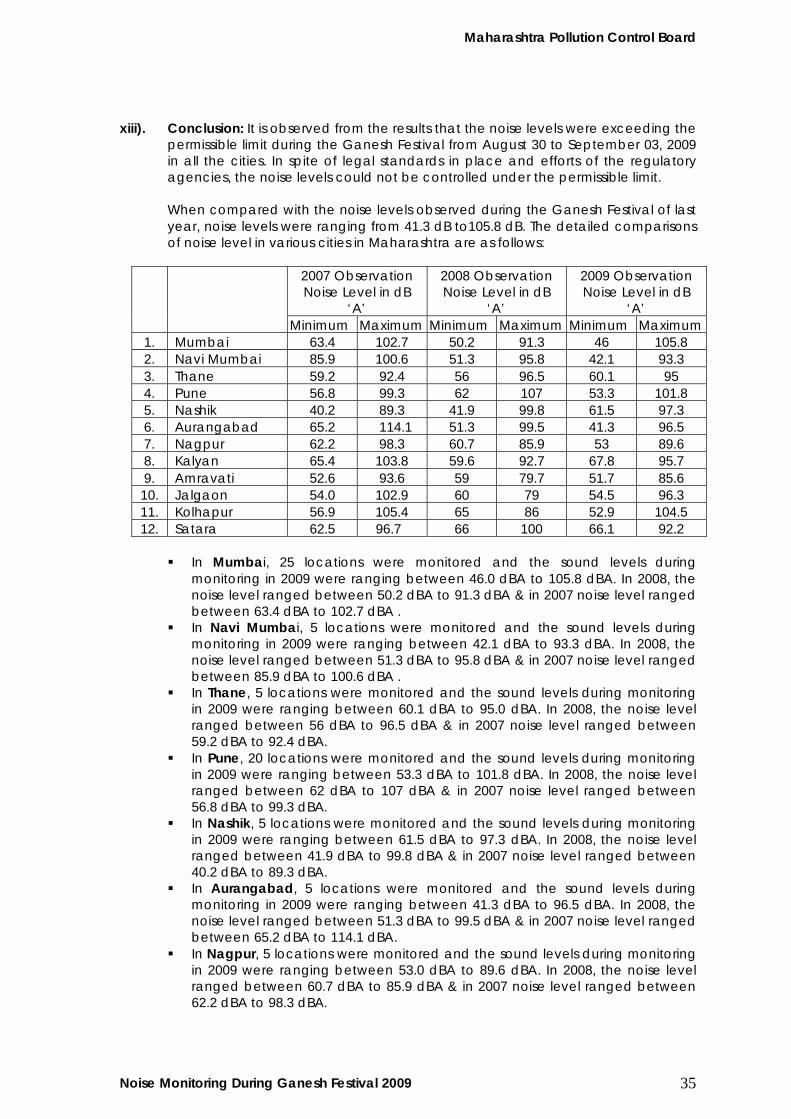
xiii). Conclusion: It is observed from the results that the noise levels were exceeding the permissible limit during the Ganesh Festival from August 30 to September 03, 2009 in all the cities. In spite of legal standards in place and efforts of the regulatory agencies, the noise levels could not be controlled under the permissible limit. When compared with the noise levels observed during the Ganesh Festival of last year, noise levels were ranging from 41.3 dB to105.8 dB. The detailed comparisons of noise level in various cities in Maharashtra are as follows:
2007 Observation Noise Level in dB
‘A’
2008 Observation Noise Level in dB
‘A’
2009 Observation Noise Level in dB
‘A’
Minimum Maximum Minimum Maximum Minimum Maximum 1. Mumbai 63.4 102.7 50.2 91.3 46 105.8 2. Navi Mumbai 85.9 100.6 51.3 95.8 42.1 93.3 3. Thane 59.2 92.4 56 96.5 60.1 95 4. Pune 56.8 99.3 62 107 53.3 101.8 5. Nashik 40.2 89.3 41.9 99.8 61.5 97.3 6. Aurangabad 65.2 114.1 51.3 99.5 41.3 96.5 7. Nagpur 62.2 98.3 60.7 85.9 53 89.6 8. Kalyan 65.4 103.8 59.6 92.7 67.8 95.7 9. Amravati 52.6 93.6 59 79.7 51.7 85.6 10. Jalgaon 54.0 102.9 60 79 54.5 96.3 11. Kolhapur 56.9 105.4 65 86 52.9 104.5 12. Satara 62.5 96.7 66 100 66.1 92.2
In Mumbai, 25 locations were monitored and the sound levels during
monitoring in 2009 were ranging between 46.0 dBA to 105.8 dBA. In 2008, the noise level ranged between 50.2 dBA to 91.3 dBA & in 2007 noise level ranged between 63.4 dBA to 102.7 dBA .
In Navi Mumbai, 5 locations were monitored and the sound levels during monitoring in 2009 were ranging between 42.1 dBA to 93.3 dBA. In 2008, the noise level ranged between 51.3 dBA to 95.8 dBA & in 2007 noise level ranged between 85.9 dBA to 100.6 dBA .
In Thane, 5 locations were monitored and the sound levels during monitoring in 2009 were ranging between 60.1 dBA to 95.0 dBA. In 2008, the noise level ranged between 56 dBA to 96.5 dBA & in 2007 noise level ranged between 59.2 dBA to 92.4 dBA.
In Pune, 20 locations were monitored and the sound levels during monitoring in 2009 were ranging between 53.3 dBA to 101.8 dBA. In 2008, the noise level ranged between 62 dBA to 107 dBA & in 2007 noise level ranged between 56.8 dBA to 99.3 dBA.
In Nashik, 5 locations were monitored and the sound levels during monitoring in 2009 were ranging between 61.5 dBA to 97.3 dBA. In 2008, the noise level ranged between 41.9 dBA to 99.8 dBA & in 2007 noise level ranged between 40.2 dBA to 89.3 dBA.
In Aurangabad, 5 locations were monitored and the sound levels during monitoring in 2009 were ranging between 41.3 dBA to 96.5 dBA. In 2008, the noise level ranged between 51.3 dBA to 99.5 dBA & in 2007 noise level ranged between 65.2 dBA to 114.1 dBA.
In Nagpur, 5 locations were monitored and the sound levels during monitoring in 2009 were ranging between 53.0 dBA to 89.6 dBA. In 2008, the noise level ranged between 60.7 dBA to 85.9 dBA & in 2007 noise level ranged between 62.2 dBA to 98.3 dBA.
Maharashtra Pollution Control Board
Noise Monitoring During Ganesh Festival 2009 36
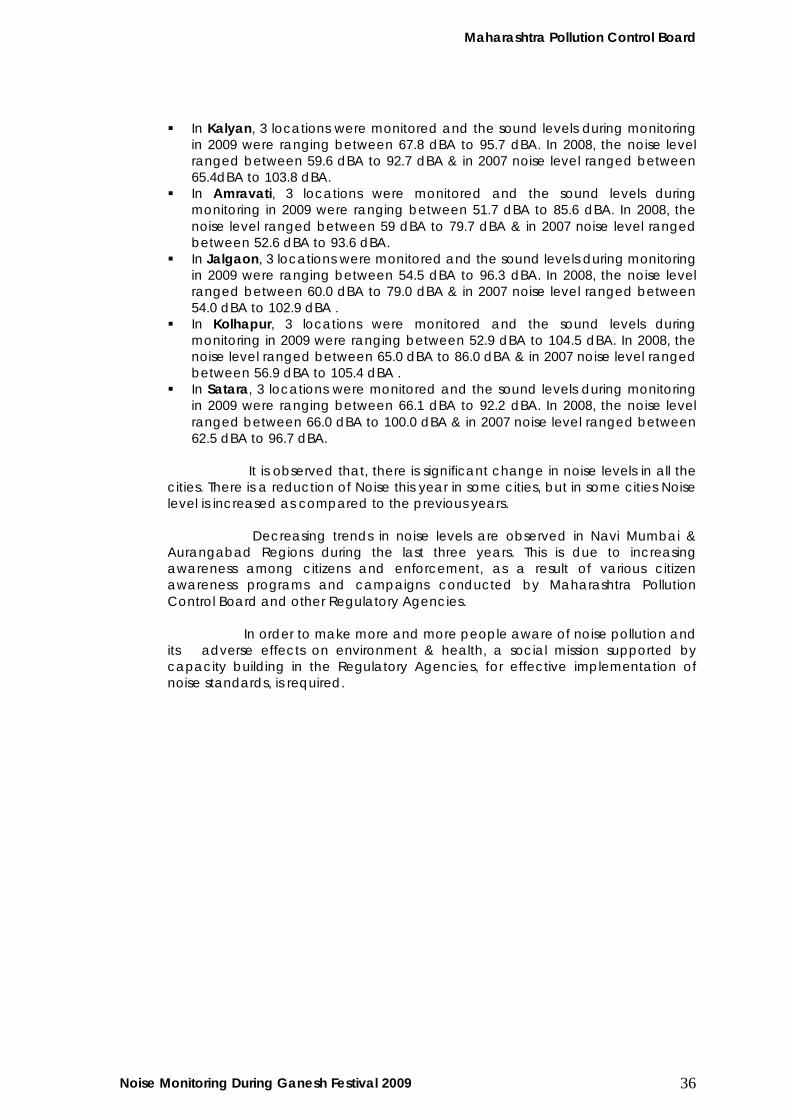
In Kalyan, 3 locations were monitored and the sound levels during monitoring in 2009 were ranging between 67.8 dBA to 95.7 dBA. In 2008, the noise level ranged between 59.6 dBA to 92.7 dBA & in 2007 noise level ranged between 65.4dBA to 103.8 dBA.
In Amravati, 3 locations were monitored and the sound levels during monitoring in 2009 were ranging between 51.7 dBA to 85.6 dBA. In 2008, the noise level ranged between 59 dBA to 79.7 dBA & in 2007 noise level ranged between 52.6 dBA to 93.6 dBA.
In Jalgaon, 3 locations were monitored and the sound levels during monitoring in 2009 were ranging between 54.5 dBA to 96.3 dBA. In 2008, the noise level ranged between 60.0 dBA to 79.0 dBA & in 2007 noise level ranged between 54.0 dBA to 102.9 dBA .
In Kolhapur, 3 locations were monitored and the sound levels during monitoring in 2009 were ranging between 52.9 dBA to 104.5 dBA. In 2008, the noise level ranged between 65.0 dBA to 86.0 dBA & in 2007 noise level ranged between 56.9 dBA to 105.4 dBA .
In Satara, 3 locations were monitored and the sound levels during monitoring in 2009 were ranging between 66.1 dBA to 92.2 dBA. In 2008, the noise level ranged between 66.0 dBA to 100.0 dBA & in 2007 noise level ranged between 62.5 dBA to 96.7 dBA.
It is observed that, there is significant change in noise levels in all the cities. There is a reduction of Noise this year in some cities, but in some cities Noise level is increased as compared to the previous years. Decreasing trends in noise levels are observed in Navi Mumbai & Aurangabad Regions during the last three years. This is due to increasing awareness among citizens and enforcement, as a result of various citizen awareness programs and campaigns conducted by Maharashtra Pollution Control Board and other Regulatory Agencies. In order to make more and more people aware of noise pollution and its adverse effects on environment & health, a social mission supported by capacity building in the Regulatory Agencies, for effective implementation of noise standards, is required.
Maharashtra Pollution Control Board
Noise Monitoring During Ganesh Festival 2009 37
ix). Photographs of the event:
Amit Kadam and Vinod Masker at Bhandup
Rupesh Kadam and vinayak Sanota at Dadar (East)
Adhiraj Bandekar and Sunil Pimpalkhare At Ghatkopar (Amar Mitra Mandal)
Vishal Chaudankar and Deepak Patil At Gokhale Road , Thane(Malhar Cinema)
Somas Ramugade and Vishal Tiwarekar At Jambli Naka(Thane)
Mayur A Doke and Pradnyesh Agre At Mulund(Sargam Mitra Mandal)
Maharashtra Pollution Control Board
Noise Monitoring During Ganesh Festival 2009 38
Dinesh Warang At Kopar Khairane (Sector -10,D-Mart Main Road)
Santosh Shinde and Vaibhav Malusare At Vashi(Shivaji Chowk Near Bus Depot)
Ashwin Ghag and keshav Band At Chinchpokali(East)
Manoj Salvi and Pravin Chambhar At Pokharan Road, Thane
Anthony D’souza and Namita Khare At Vikhroli(Balitra Kala Mandal)
Rakesh Gharat and Duryodhan Jadhav At Wagle Estate (Raila Devi Lake)
Maharashtra Pollution Control Board
Noise Monitoring During Ganesh Festival 2009 39
Aditya Tambe and Siddhesh Desai At Ulhasnagar Station, Kalyan
Shekhar Ghadge and Jignesh Patil At Bhiwandi-Dhamankar Naka, Kalyan
Beshir Shaikh and Dinesh Manerkar At Shivaji Chawk , Kalyan
Santosh Nikam at CBD-MGM Hospital Chowk, Near Police Chowki
Mr.Gorakhnad Suttar at Khasbag Maidan, Kolhapur
Mr.Raviraj Thorat at Powai Naka, Satara
Maharashtra Pollution Control Board
Noise Monitoring During Ganesh Festival 2009 40
City Chowk, Aurangabad
Mr. Girish Patil at Subhash Chowk, Jalgaon
Mr. Girish Patil at Shashtri Tower Chowk, Jalgaon
Mr. Vasudev Patil CIDCO , Nashik
Cotton Market, Nagpur
Mr. Nikesh Banwade at Reshimbag, Nagpur