Embed Size (px)
Citation preview
New Mexico Substance Use Epidemiology Profile
Substance Abuse Epidemiology Section Injury and Behavioral Epidemiology Bureau
Epidemiology and Response Division
New Mexico Department of Health
December 2018
This document was made possible by the New Mexico Human Services Department (NMHSD), Behavioral Health Services Division (BHSD), Office of Substance Abuse Prevention (OSAP), through funding from the Partnerships For Success 2015 (PFS 2015) grant from the
Substance Abuse and Mental Health Services Administration Center for Substance Abuse Prevention (SAMHSA-CSAP) and by funding from the Centers for Disease Control and Prevention (CDC) Alcohol Program.

New Mexico Substance Use Epidemiology Profile

Epidemiology and Response Division
Injury and Behavioral Epidemiology Bureau
Substance Abuse Epidemiology Section
Survey Section
New Mexico Substance Use Epidemiology Profile
NEW MEXICO DEPARTMENT OF HEALTH
K. Lynn Gallagher, JD, Cabinet SecretaryDawn Hunter, MPH, JD, Deputy Cabinet SecretaryJ. Gabrielle Sanchez-Sandoval, BSW, JD, Deputy Cabinet Secretary
Michael Landen, MD, MPH, State Epidemiologist
Jim Davis, MA, Prescription Drug Overdose Prevention EpidemiologistLuigi Garcia Saavedra, MPH, Substance Use Epidemiology SupervisorAnnaliese Mayette, PhD, Drug EpidemiologistIhsan Mahdi, MPH, Non-Fatal Drug Overdose EpidemiologistKaren Edge, MPH, Dissemination and Response EpidemiologistHayley Peterson, MPH, Substance Abuse Epidemiologist
Toby Rosenblatt, MPA, Bureau Chief
Dan Green, MPH, YRRS Coordinator and Survey EpidemiologistCarol Moss, MS, Mental Health EpidemiologistChristopher Whiteside, MPH, BRFSS Epidemiologist

Statewide Epidemiological and Outcomes Workgroup (SEOW)
New Mexico Substance Use Epidemiology Profile
Acknowledgements
The Statewide Epidemiological and Outcomes Workgroup (SEOW) currently functions as a guidingbody for all OSAP grant recipient prevention strategies in the state of New Mexico and as a platform forrich discussion, collaboration, and epidemiological data and information sharing at the state level and isa core component of the Partnerships for Success 2015 grant. Under the Strategic PreventionFramework State Incentive Grant from SAMHSA over a decade ago, the SEOW guided thedevelopment of the first New Mexico Substance Use Epidemiology Profile as part of its mission tocreate a focus on community-based and data-driven planning and accountability. The ongoing focus ofthe SEOW is the development and informed use of assessment data and indicators for use incommunity planning, prioritization, and evaluation and the support of evidence-based strategies,policies, and practices in all community prevention activity. The current membership of New MexicoSEOW includes representatives from BHSD: Dr. Wayne Lindstrom and Mika Tari. CommunityMembers: Sharon Aguilar, Pamela Drake, Tanya Henderson, Athena Huckaby, and John Steiner.CYFD Children’s Behavioral Health: Michael Hock. DFA DWI Program: Julie Krupcale. Evaluators: AnnDel Vecchio, Natalie Skogerboe, and Sindy Sacoman. NMDOH-ERD Injury and BehavioralEpidemiology Bureau: Jim Davis, Karen Edge, Ihsan Mahdi, Annaliese Mayette, Carol Moss, HayleyPeterson, Luigi Garcia Saavedra, and Chris Trujillo. NMHSD-BHSD Office of Substance AbusePrevention: Karen Cheman, Anwar Walker, Antonette Silva-Jose, Heather Burnham, and Jay Quintana.NM Prevention Workforce Training System, Kamama Consulting: Paula Feathers. Pacific Institute forResearch & Evaluation (PIRE): Liz Lilliott, Martha Waller, Kim Zamarin, Marissa Elias, and Lei Zhang;and, is coordinated and staffed by Michael Coop, Andrea Niehaus, Tina Ruiz, McKenzie Wannigman,and Tim Werwath of Coop Consulting, Inc.
The New Mexico Substance Use Epidemiology Profile was prepared by the New Mexico Department ofHealth (NMDOH) Epidemiology and Response Division (ERD) Injury and Behavioral EpidemiologyBureau (IBEB) Substance Abuse Epidemiology Section (SAES), with data provision and analyticsupport from the NMDOH IBEB Survey Section and was made possible by the generous support of theNew Mexico Human Services Department (NMHSD) Behavioral Health Services Division (BHSD) Officeof Substance Abuse Prevention (OSAP), based on an allocation from the Partnerships for Success2015 (PFS2015) grant received from the Substance Abuse and Mental Health Services AdministrationCenter for Substance Abuse Prevention (SAMHSA-CSAP), and by funding from the Centers forDisease Control and Prevention (CDC) Alcohol Program.
Suggested Citation:New Mexico Department of Health. New Mexico Substance Use Epidemiology Profile, 2018
This report and other reports by the Substance Abuse Epidemiology Section are availableelectronically at: http://nmhealth.org/about/erd/ibeb/sap/

Page
Introduction iii
- Technical Note: Methodological Changes since Previous Reports vi
Executive Summary vii
- Data Sources x
I. Consequences 1
A. Alcohol-Related Death 3
1. Alcohol-Related Chronic Disease Death 7
(a) Alcohol-Related Chronic Liver Disease Death 11
(b) Chronic Liver Disease Hospital Discharges (HIDD) 15
2. Alcohol-Related Injury Death 19
(a) Alcohol-Related Motor Vehicle Crash Death 23
B. Smoking-Related Death 27
C. Drug Overdose Death 31
(a) Opioid Overdose Related Emergency Department Visits (EDD) 37
D. Suicide 41
II. Mental Health 45
A. Adult Mental Health 47
1. Frequent Mental Distress (BRFSS) 47
2. Current Depression (BRFSS) 51
B. Youth Mental Health
1. Persistent Sadness or Hopelessness (YRRS) 55
2. Seriously Considered Suicide (YRRS) 59
3. Attempted Suicide (YRRS) 63
4. Risk and Resiliency (YRRS) 67
III. Consumption 71
A. Alcohol
1. Binge Drinking
(a) Adult Binge Drinking (BRFSS) 73
(b) Youth Current Drinking (YRRS) 77
(c) Youth Binge Drinking (YRRS) 81
(d) Youth Having 10 or More Drinks (YRRS) 85
2. Heavy Drinking
(a) Adult Heavy Drinking (BRFSS) 89
3. Drinking and Driving
(a) Adult Drinking and Driving (BRFSS) 93
(b) Youth Drinking and Driving (YRRS) 97
New Mexico Substance Use Epidemiology Profile Page i
TABLE OF CONTENTS
Sections

III. Consumption (continued) 101
B. Illicit Drugs
1. Youth Marijuana Use (YRRS) 101
2. Youth Cocaine Use (YRRS) 105
3. Youth Painkiller Use to Get High (YRRS) 109
5. Youth Heroin Use (YRRS) 113
6. Youth Methamphetamine Use (YRRS) 117
7. Youth Inhalant Use (YRRS) 121
C. Tobacco
1. Adult Cigarette Smoking (BRFSS) 125
2. Youth Cigarette Smoking (YRRS) 129
3. Youth Frequent Cigarette Smoking (YRRS) 133
Appendices 137
1. State Population by Age, Sex, Race/Ethnicity, and County, 2015 139
2. Substance Use and Mental Health in New Mexico, by Age Group, 2015-2016 145
A. Substance Use and Mental Health by Age Group, Counts, 2015-2016 147
B. Substance Use and Mental Health by Age Group , Percentages, 2015-2016 149
3. Substance Use and Mental Health by National Regions, Age 12+, 2015-2016 151
153
155
4. International Classification of Diseases, Clinical Modification, 9th and 10th Edition 163
New Mexico Substance Use Epidemiology Profile Page ii
A. Substance Use and Mental Health, U.S. Regions & New Mexico, Percentages, Annual
Averages Based on 2015 and 2016 NSDUHs
B. Substance Use and Mental Health, U.S. Regions & New Mexico, by Age Group, Percentages,
Annual Averages Based on 2015 and 2016 NSDUHs
TABLE OF CONTENTS (continued)

New Mexico Substance Use Epidemiology Profile
Important Notes about Comparability to Previous Reports
New Additions this Report
How to Use this Report
New Mexico Substance Use Epidemiology Profile Page iii
INTRODUCTION
The New Mexico Substance Use Epidemiology Profile is a tool for substance use prevention planners at the state,county, and community level. Its primary purpose is to support efforts related to the Statewide Epidemiological andOutcomes Workgroup (SEOW). The SEOW is intended to: develop resources to help communities conduct needsassessments regarding substance use and its consequences; build capacity to address those needs; and plan,implement, and evaluate evidence-based programs, policies, and practices designed to address the interveningvariables related to identified substance-related problems. This document will be useful to those preparingproposals for funding and to program planners designing substance use prevention interventions. SEOW is fundedby the New Mexico Human Services Department (NMHSD) Behavioral Health Services Division (BHSD) Office ofSubstance Abuse Prevention (OSAP) and the Substance Abuse and Mental Health Services Administration Centerfor Substance Abuse Prevention (SAMHSA-CSAP).
This report presents commonly used indicators of substance use in New Mexico. These indicators include outcomemeasures (e.g., alcohol-related death) reported in the Consequences section, mental health indicators associatedwith substance use (e.g., depression) in the Mental Health section, and consumption measures (e.g., self-reportedsubstance use behavior from statewide surveys) reported in the Consumption section. The presentation of eachmajor indicator includes: a text description of the major data findings; a detailed table with results by gender, age-group, and race/ethnicity; a table detailing county results by race/ethnicity; a bar chart and a map with rates for eachNew Mexico county; and additional charts illustrating other pertinent findings. There are also appendices thatprovide population denominators used in the calculation of death rates, substance use and mental health indicatorsfrom the National Survey on Drug Use and Health (NSDUH), and the International Classification of Diseases,Clinical Modification, 9th (ICD-9-CM) and 10th (ICD-10-CM) diagnosis codes used to produce indicators based onhospital data.
A combined five-year period is used when presenting deaths, emergency department visits, and hospitaldischarges. Combining counts over multiple years is necessary because in many New Mexico counties, there maybe very few events (deaths, emergency department visits, or hospital discharges) due to a given cause in any givenyear. Combining counts over multiple years allows the calculation of rates that are more stable and, therefore, moremeaningful than those calculated based on very few cases. In this report, death, emergency department visits, andhospitalization rates were calculated and reported for 2013-2017, the most current available five-year period.
This report is the ninth in a series that began with the New Mexico State Epidemiology Profile published in 2005, andcontinued with the publication of updates in 2010, 2011, 2013, 2014, 2016, February 2017, and November 2017. Thesereports are available at: https://nmhealth.org/data/substance/.
Important methodological changes have occurred over time. As a result, these reports may not be comparable with allothers in the series, in several important ways. These changes and their impact on the comparability of reports in thisseries are described in more detail in a technical note at the end of this section. The following categories cannot becompared between the reports in this series:
-Death counts and/or rates for any Alcohol-Related Death indicators cannot be compared between the 2005 report andany later reports.-Race/ethnicity reporting for indicators can be compared between the 2013 and subsequent reports but not to reportsprior to 2013.-Beginning with 2011 estimates, the Behavioral Risk Factor Surveillance System (BRFSS) updated its surveillancemethods. Any shift in prevalence between 2010 and 2011 must be interpreted with caution, as it may be partially due tochange in methods necessary to keep up with changes in cell phone use in the US and take advantage of improvedstatistical procedures.-Data for risk behaviors (BRFSS-based) indicators have been aggregated for years 2015-2017, except for AdultDepression and Adult Drinking and Driving, which are not asked every year. These two indicators are reported on asingle-year basis.-Reports from 2005, 2010, and 2011 reflected a special small numbers rule specific to them. This rule, devised by SEOWduring the design of the original 2005 report, suppressed the reporting of death rates for table cells based on fewer thantwo deaths per year. This rule was replaced by the standard NMDOH small numbers rule used in other NMDOHpublications. This rule establishes suppression of reporting only for table cells based on three or fewer events comingfrom a population of fewer than 20 people.-Opioid Overdose Related ED visits data cannot be compared to previous editions of the Substance Use EpidemiologyProfile as the data source changed for the 2018 report. The 2018 report uses ED Syndromic Surveillance. Previousreports used the Annual ED data file.

Use of this Report: The Problem Statements
Use of this Report: Tables and Charts
Use of this Report: Rates and Numbers
New Mexico Substance Use Epidemiology Profile Page iv
INTRODUCTION (continued)
Both rates and the numbers of events are presented in the tables and charts of this report. While the rates are veryimportant for indicating the degree of an issue in a given county or population group, they only provide part of thepicture needed for comparing the burden of a problem from one county or group to another. The number of eventsalso needs to be considered when making planning decisions. For example, Rio Arriba County has an alcohol-related death rate (139.4 per 100,000 population) more than twice that of Bernalillo County (59.0 per 100,000population). However, the number of alcohol-related deaths in Bernalillo County (2,139) is over seven times thenumber in Rio Arriba County (278). While the problem is more severe in Rio Arriba County (reflected in higherrate), Bernalillo County bears a larger proportion of the statewide burden (31.5% of all alcohol-related deaths inthe state compared to 4.1% for Rio Arriba County). When prioritizing the distribution of resources and selectinginterventions, it is important to look at both the total number of deaths and the death rate. Because of its extremelyhigh rate of alcohol-related deaths, interventions that address this problem are very important in Rio Arriba County.At the same time, Bernalillo County is also very important when considering interventions because it bears muchof the statewide burden of alcohol-related deaths.
Each of the outcome indicators is presented with at least two tables. Table 1 for each indicator presents the numberof events (deaths, emergency department visits, hospital discharges, or number of persons engaging in orexperiencing a risk behavior) and their respective rates (or the weighted behavior prevalence rates) by sex, age-group (or grade in the case of Youth Risk and Resiliency Survey [YRRS] data), and race/ethnicity. In sections thatreport on causes of death, these tables include the number of deaths on the left side of the table and age-adjusteddeath rates per 100,000 population on the right side of the table. In sections that report on emergency departmentvisits or hospital discharges, these tables include the number of emergency department visits or hospital dischargeson the left side and age-adjusted rates per 100,000 population on the right side. For BRFSS-based indicators, thesetables include an estimate of the number of persons engaging in or experiencing the risk behavior on the left sideand the prevalence rate of the behavior in the population on the right side. For the aggregated indicators, thenumber of people was estimated by multiplying the percentage of persons engaging in or experiencing the riskbehavior by the population estimate for the corresponding group. In sections that report specifically on youth riskbehaviors, Table 1 includes only prevalence rates. These tables are very useful in determining the most importantrisk groups at the statewide level. Table 2 for each indicator presents results for each NM county by race/ethnicity.Again, the number of events are presented on the left side of the table and the age-adjusted rates on the right sideof the table. These tables are useful in determining which counties have the most severe substance use issues andwhich racial/ethnic groups are at the highest risk within each county. Youth data are presented by county only.
Discussion of each indicator also includes a county bar chart that graphically presents age-adjusted death rates (orweighted behavior prevalence rates) for each NM county in descending order. Adjacent to each county name on theleft side of the chart, the number of events occurring (or the estimated number of persons engaging in orexperiencing the behavior) in the county and the percent of NM events occurring (or the weighted percent of NewMexicans engaging in or experiencing the behavior) in each county are presented. Counties with the highest ratesare easily identified at the top of the chart, while counties with low rates are at the bottom. The state rate is depictedwith a darker colored bar, and for most indicators, the most recent available US rate is also included, depicted witha cross-hatched bar, making it easy to compare the county rate to the state and national rate in each instance.
Finally, maps showing rates by county have been included for each indicator. The counties have been categorizedand shaded according to the county rates. Map shading categories have been chosen to identify counties that haverates lower than the state rate, counties that have rates somewhat higher than the state rate, and counties thathave rates substantially higher than the state rate. The latter category (corresponding to the darkest-shadedcounties) represent rates that are higher than the state rate by a selected amount. For maps based either on deathor hospital-related event rates, this amount corresponds to rates that are 50% or higher than the state rate; forthose based on behavioral data (BRFSS or YRRS), this amount corresponds to rates that are 25% higher than thestate rate.
This report presents considerable detail in the form of numbers, proportions, rates, and other statistical summaries;many of these can be found in tables and charts. This information is synthesized in Problem Statements, whichprovide a brief narrative overview of the data and detailed statistics. These Problem Statements are designed tohelp explain and frame the epidemiological data presented in each section of the report.

Use of this Report: Why are some rates missing from the tables?
Other Data Resources
New Mexico Substance Use Epidemiology Profile Page v
INTRODUCTION (continued)
For survey-based measures of risk behaviors (i.e., BRFSS and YRRS), rates based on fewer than 50respondents for a given table cell have been removed from this report. While prevalence estimates can becalculated based on very small numbers of respondents, estimates based on fewer than 50 respondents can beunstable and are often misleading. Such estimates are of questionable value for planning purposes and havebeen excluded from this report.
Morbidity and mortality numbers and rates are not reported when the number of events are three or less with adenominator (population) of less than twenty, in accordance with the NMDOH small numbers rule(https://ibis.health.state.nm.us/view/docs/Standards/NMSmallNumbersRule2006.pdf).
Although not suppressed, mortality and morbidity rates calculated with less than ten events (numerator) shouldbe considered unstable. When rates are calculated using small numbers of events, rates can vary widely fromone reporting to the next for reasons different from actual changes in the frequency of occurrence of the eventsmeasured.
Specifically, for indicators using Emergency Department Data (EDD) or Hospital Inpatient Discharge Data(HIDD), missing rates correspond to events for which data on race-ethnicity, sex, or county of residence weremissing. Although these events are included in the total count of events for NM, rates cannot be calculated andare, therefore, not reported. Footnotes on the corresponding tables for these indicators will refer to the number ofevents missing. EDD and HIDD indicators have been produced by searching for specific diagnostic codes onthese datasets. For EDD, all diagnosis fields have been used (thus, the inclusion of the word 'Related' in thename of the indicator). For HIDD, only the main diagnosis was used. The International Classification of Diseases,Ninth Revision, Clinical Modification (ICD-9-CM) and ICD-10-CM codes used are listed in Appendix 4.
- Other reports produced by the Substance Abuse Epidemiology Section (SAES), Injury and Behavioral Epidemiology Bureau (IBEB), Epidemiology and Response Division (ERD),New Mexico Department of Health (NMDOH).Available online at: http://nmhealth.org/about/erd/ibeb/sap/
- New Mexico Behavioral Risk Factor Surveillance System (BRFSS) reports,produced by the Survey Section, IBEB-ERD-NMDOH. Available online at:https://nmhealth.org/about/erd/ibeb/brfss/
- New Mexico Youth Risk and Resiliency Survey (YRRS) reports, produced byNMDOH, NM Public Education Department, and the UNM Prevention Research Center. Available online at:https://nmhealth.org/about/erd/ibeb/yrrs/
- Emergency Department Data (EDD) Syndromic Surveillance, produced by the Health SystemsEpidemiology program, ERD-NMDOHAvailable online at:http://nmhealth.org/about/erd/hsep/edd/
- Hospital Inpatient Discharge Data (HIDD) Annual Reports, produced by the Health SystemsEpidemiology program, ERD-NMDOHAvailable online at:http://nmhealth.org/about/erd/hsep/hidd/
The data presented here come from various sources. Other valuable publications have been written utilizingthese data sources. The New Mexico Substance Use Epidemiology Profile should be seen as complementaryto these other publications, and program planners will want to refer to these other documents for additionalinformation. These publications include:
Technical Note: Methodological Changes since Previous Reports
New Mexico Substance Use Epidemiology Profile Page vi
INTRODUCTION (continued)
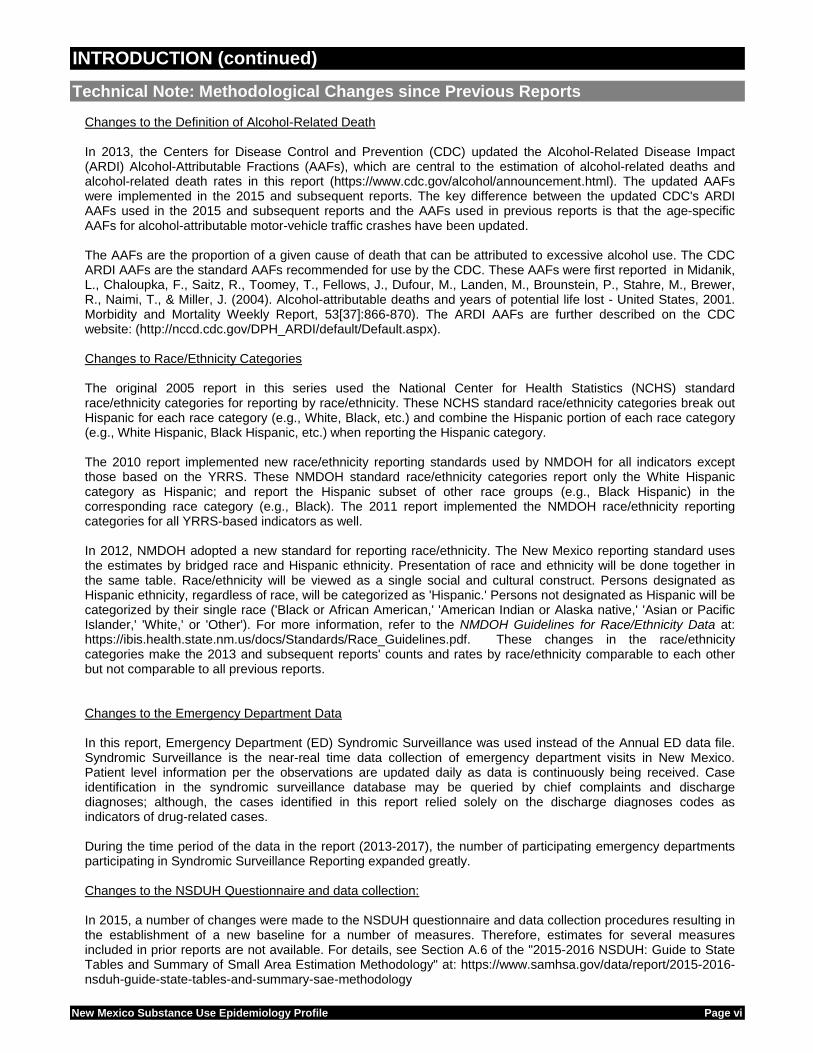
Changes to the Definition of Alcohol-Related Death
In 2013, the Centers for Disease Control and Prevention (CDC) updated the Alcohol-Related Disease Impact(ARDI) Alcohol-Attributable Fractions (AAFs), which are central to the estimation of alcohol-related deaths andalcohol-related death rates in this report (https://www.cdc.gov/alcohol/announcement.html). The updated AAFswere implemented in the 2015 and subsequent reports. The key difference between the updated CDC's ARDIAAFs used in the 2015 and subsequent reports and the AAFs used in previous reports is that the age-specificAAFs for alcohol-attributable motor-vehicle traffic crashes have been updated.
The AAFs are the proportion of a given cause of death that can be attributed to excessive alcohol use. The CDCARDI AAFs are the standard AAFs recommended for use by the CDC. These AAFs were first reported in Midanik,L., Chaloupka, F., Saitz, R., Toomey, T., Fellows, J., Dufour, M., Landen, M., Brounstein, P., Stahre, M., Brewer,R., Naimi, T., & Miller, J. (2004). Alcohol-attributable deaths and years of potential life lost - United States, 2001.Morbidity and Mortality Weekly Report, 53[37]:866-870). The ARDI AAFs are further described on the CDCwebsite: (http://nccd.cdc.gov/DPH_ARDI/default/Default.aspx).
Changes to Race/Ethnicity Categories
The original 2005 report in this series used the National Center for Health Statistics (NCHS) standardrace/ethnicity categories for reporting by race/ethnicity. These NCHS standard race/ethnicity categories break outHispanic for each race category (e.g., White, Black, etc.) and combine the Hispanic portion of each race category(e.g., White Hispanic, Black Hispanic, etc.) when reporting the Hispanic category.
The 2010 report implemented new race/ethnicity reporting standards used by NMDOH for all indicators exceptthose based on the YRRS. These NMDOH standard race/ethnicity categories report only the White Hispaniccategory as Hispanic; and report the Hispanic subset of other race groups (e.g., Black Hispanic) in thecorresponding race category (e.g., Black). The 2011 report implemented the NMDOH race/ethnicity reportingcategories for all YRRS-based indicators as well.
In 2012, NMDOH adopted a new standard for reporting race/ethnicity. The New Mexico reporting standard usesthe estimates by bridged race and Hispanic ethnicity. Presentation of race and ethnicity will be done together inthe same table. Race/ethnicity will be viewed as a single social and cultural construct. Persons designated asHispanic ethnicity, regardless of race, will be categorized as 'Hispanic.' Persons not designated as Hispanic will becategorized by their single race ('Black or African American,' 'American Indian or Alaska native,' 'Asian or PacificIslander,' 'White,' or 'Other'). For more information, refer to the NMDOH Guidelines for Race/Ethnicity Data at:https://ibis.health.state.nm.us/docs/Standards/Race_Guidelines.pdf. These changes in the race/ethnicitycategories make the 2013 and subsequent reports' counts and rates by race/ethnicity comparable to each otherbut not comparable to all previous reports.
Changes to the Emergency Department Data
In this report, Emergency Department (ED) Syndromic Surveillance was used instead of the Annual ED data file.Syndromic Surveillance is the near-real time data collection of emergency department visits in New Mexico.Patient level information per the observations are updated daily as data is continuously being received. Caseidentification in the syndromic surveillance database may be queried by chief complaints and dischargediagnoses; although, the cases identified in this report relied solely on the discharge diagnoses codes asindicators of drug-related cases.
During the time period of the data in the report (2013-2017), the number of participating emergency departmentsparticipating in Syndromic Surveillance Reporting expanded greatly.
Changes to the NSDUH Questionnaire and data collection:
In 2015, a number of changes were made to the NSDUH questionnaire and data collection procedures resulting inthe establishment of a new baseline for a number of measures. Therefore, estimates for several measuresincluded in prior reports are not available. For details, see Section A.6 of the "2015-2016 NSDUH: Guide to StateTables and Summary of Small Area Estimation Methodology" at: https://www.samhsa.gov/data/report/2015-2016-nsduh-guide-state-tables-and-summary-sae-methodology
Consequences of Substance Use
New Mexico Substance Use Epidemiology Profile Page vii
EXECUTIVE SUMMARY
Introduction
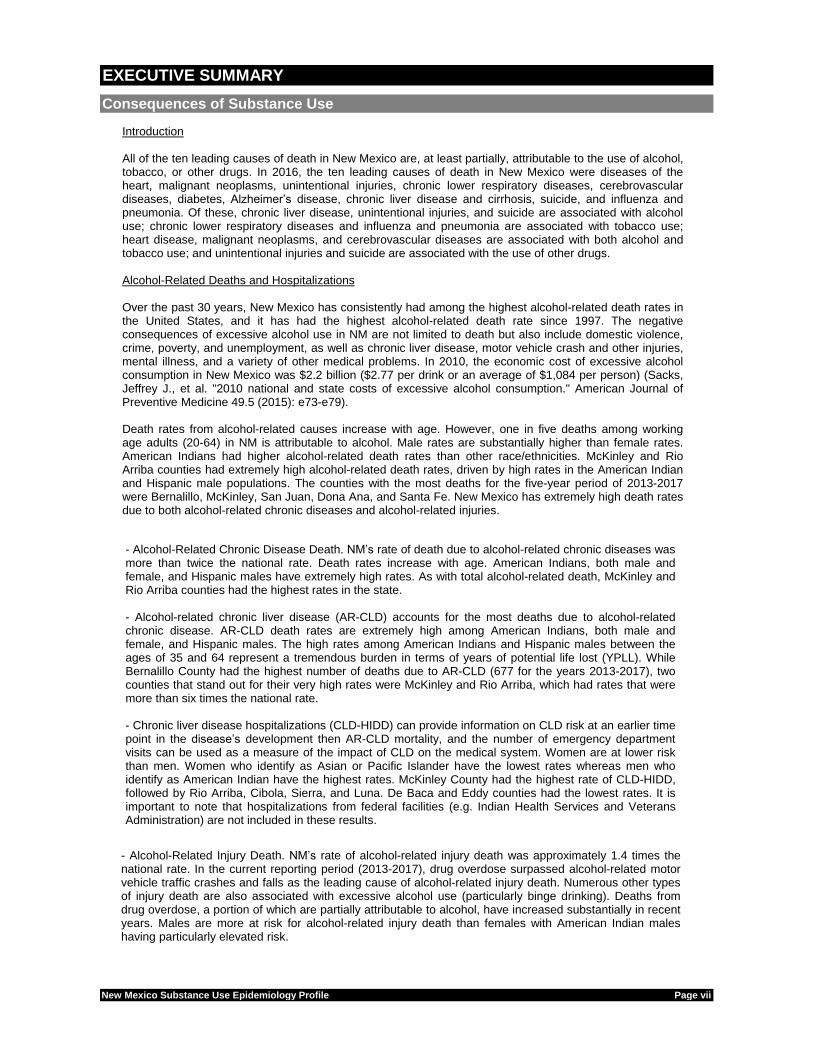
All of the ten leading causes of death in New Mexico are, at least partially, attributable to the use of alcohol,tobacco, or other drugs. In 2016, the ten leading causes of death in New Mexico were diseases of theheart, malignant neoplasms, unintentional injuries, chronic lower respiratory diseases, cerebrovasculardiseases, diabetes, Alzheimer’s disease, chronic liver disease and cirrhosis, suicide, and influenza andpneumonia. Of these, chronic liver disease, unintentional injuries, and suicide are associated with alcoholuse; chronic lower respiratory diseases and influenza and pneumonia are associated with tobacco use;heart disease, malignant neoplasms, and cerebrovascular diseases are associated with both alcohol andtobacco use; and unintentional injuries and suicide are associated with the use of other drugs.
Alcohol-Related Deaths and Hospitalizations
Over the past 30 years, New Mexico has consistently had among the highest alcohol-related death rates inthe United States, and it has had the highest alcohol-related death rate since 1997. The negativeconsequences of excessive alcohol use in NM are not limited to death but also include domestic violence,crime, poverty, and unemployment, as well as chronic liver disease, motor vehicle crash and other injuries,mental illness, and a variety of other medical problems. In 2010, the economic cost of excessive alcoholconsumption in New Mexico was $2.2 billion ($2.77 per drink or an average of $1,084 per person) (Sacks,Jeffrey J., et al. "2010 national and state costs of excessive alcohol consumption." American Journal ofPreventive Medicine 49.5 (2015): e73-e79).
Death rates from alcohol-related causes increase with age. However, one in five deaths among workingage adults (20-64) in NM is attributable to alcohol. Male rates are substantially higher than female rates.American Indians had higher alcohol-related death rates than other race/ethnicities. McKinley and RioArriba counties had extremely high alcohol-related death rates, driven by high rates in the American Indianand Hispanic male populations. The counties with the most deaths for the five-year period of 2013-2017were Bernalillo, McKinley, San Juan, Dona Ana, and Santa Fe. New Mexico has extremely high death ratesdue to both alcohol-related chronic diseases and alcohol-related injuries.
- Alcohol-Related Chronic Disease Death. NM’s rate of death due to alcohol-related chronic diseases wasmore than twice the national rate. Death rates increase with age. American Indians, both male andfemale, and Hispanic males have extremely high rates. As with total alcohol-related death, McKinley andRio Arriba counties had the highest rates in the state.
- Alcohol-related chronic liver disease (AR-CLD) accounts for the most deaths due to alcohol-relatedchronic disease. AR-CLD death rates are extremely high among American Indians, both male andfemale, and Hispanic males. The high rates among American Indians and Hispanic males between theages of 35 and 64 represent a tremendous burden in terms of years of potential life lost (YPLL). WhileBernalillo County had the highest number of deaths due to AR-CLD (677 for the years 2013-2017), twocounties that stand out for their very high rates were McKinley and Rio Arriba, which had rates that weremore than six times the national rate.
- Chronic liver disease hospitalizations (CLD-HIDD) can provide information on CLD risk at an earlier timepoint in the disease’s development then AR-CLD mortality, and the number of emergency departmentvisits can be used as a measure of the impact of CLD on the medical system. Women are at lower riskthan men. Women who identify as Asian or Pacific Islander have the lowest rates whereas men whoidentify as American Indian have the highest rates. McKinley County had the highest rate of CLD-HIDD,followed by Rio Arriba, Cibola, Sierra, and Luna. De Baca and Eddy counties had the lowest rates. It isimportant to note that hospitalizations from federal facilities (e.g. Indian Health Services and VeteransAdministration) are not included in these results.
- Alcohol-Related Injury Death. NM’s rate of alcohol-related injury death was approximately 1.4 times thenational rate. In the current reporting period (2013-2017), drug overdose surpassed alcohol-related motorvehicle traffic crashes and falls as the leading cause of alcohol-related injury death. Numerous other typesof injury death are also associated with excessive alcohol use (particularly binge drinking). Deaths fromdrug overdose, a portion of which are partially attributable to alcohol, have increased substantially in recentyears. Males are more at risk for alcohol-related injury death than females with American Indian maleshaving particularly elevated risk.

Consequences of Substance Use (continued)
Suicide and Mental Health
New Mexico Substance Use Epidemiology Profile Page viii
EXECUTIVE SUMMARY (continued)
New Mexico’s alcohol-related motor vehicle traffic crash (AR-MVTC) death rate has decreasedsubstantially over the past 30 years. After substantial declines during the 1980s and 1990s, NM’s ratestagnated for almost ten years. However, a comprehensive program to prevent driving whileintoxicated (DWI) initiated in 2004, resulted in substantial rate declines, particularly during the period2005-2008. Nonetheless, rate disparities remain; both male and female American Indians haveelevated rates, especially among middle age males (age 25-64). Mora, McKinley, Catron, Guadalupe,and Cibola were the counties with the highest alcohol-impaired motor vehicle traffic crash (AI-MVTC)death rates. However, Mora, Catron, and Guadalupe counties had low numbers of deaths, whereasMcKinley County had the third highest number of deaths behind Bernalillo and San Juan counties.
Smoking-Related Death
Historically, New Mexico has had one of the lowest smoking-related death rates in the nation.Nonetheless, New Mexico’s burden of death associated with smoking is considerably greater than theburden associated with alcohol and other drugs. Among all racial/ethnic groups, males have highersmoking-related death rates than females. Among both males and females, Whites have the highestrates, followed by Blacks. The counties with the highest rates and relatively heavy burdens of smoking-related death (i.e., 20 or more deaths a year) were Sierra, De Baca, Luna, Quay, Torrance, Eddy, andLea. The high rates in most of these counties, and in the state overall, were driven by high rates amongWhites.
Drug Overdose Death
In 2017, New Mexico had the seventeenth highest drug overdose death rate in the nation. Theconsequences of drug use continue to burden New Mexico communities. Drug overdose death ratesremained higher for males than for females. The highest drug overdose death rate was amongHispanic males. Rio Arriba County had the highest drug overdose death rate in the state. BernalilloCounty continued to bear the highest burden of drug overdose death in terms of total numbers ofdeaths. Unintentional drug overdoses account for 88% of drug overdose deaths. The most commondrugs causing unintentional overdose death for the period covered in this report were prescriptionopioids (i.e., methadone, oxycodone, morphine; 57%), heroin (40%), benzodiazepines (24%), cocaine(13%), and methamphetamine (26%) (not mutually exclusive). In New Mexico and nationally, overdosedeath from opioids has become an issue of enormous concern as these potent drugs are widelyavailable.
Opioid overdose related emergency department (OOR-ED) visits increased 98.4% in the US between2004 and 2009. In NM, between 2013 and 2017, ED visits increased by 51%. Male rates of OOR-EDvisits were higher compared to female rates. For both groups, Blacks and Hispanics had higher ratescompared to other racial/ethnic groups. Rio Arriba County had the highest rate of OOR-ED visits during2013-2017 with 155.3 OOR-ED visits per 100,000 population.
Suicide and Mental Health
Suicide is a serious and persistent public health problem in New Mexico. Over the period 1981 through2010, New Mexico’s suicide rate was consistently among the highest in the nation, at 1.5 to 1.9 timesthe US rate. Male suicide rates were around three times higher than those of females across allracial/ethnic groups, except Asian/Pacific Islanders and Blacks. For the five-year period 2013-2017, allbut eleven counties had suicide rates that were at least one and a half times higher than the mostrecent available US rate.
Indicators in this report also document: the prevalence of frequent mental distress and currentdepression among New Mexico adults; persistent sadness or hopelessness, suicidal ideation, andsuicide attempt among New Mexico youth; and the association between risk and resiliency factors andsubstance abuse and mental health indicators among New Mexico youth.

Alcohol, Tobacco, and Other Drug Consumption Behavior
New Mexico Substance Use Epidemiology Profile Page ix
EXECUTIVE SUMMARY (continued)
Substance use behaviors are important to examine not only because substance use can lead to very negativeconsequences in the short-term, but also because substance use can have long-term negative consequences.For example, while drinking by youth is a behavior that can lead directly to alcohol-related injury or death, it canalso lead to very serious consequences in adulthood, ranging from alcohol abuse or dependence to a variety ofdiseases associated with chronic heavy drinking.
Substance Use Indicators included in this Report
- Adult Binge Drinking. Binge drinking (defined as drinking five or more drinks on a single occasion for men,or four or more drinks on a single occasion for women) is associated with numerous types of injury death,including motor vehicle traffic crash fatalities, drug overdose, falls, suicide, and homicide. Among adults (age18 or over) of all ethnicities, binge drinking was more commonly reported by males than females, mirroringhigher rates of alcohol-related injury death among males. Among males, Hispanics were more likely toreport binge drinking than other race/ethnicities. Young adults (age 18-24) were more likely than other agegroups to report binge drinking.
- Youth Current Drinking. Any alcohol consumption by a person under the age of 21 is considered to beexcessive drinking. Alcohol is the most commonly used drug among youth in New Mexico, more thantobacco or other drugs. However, contrary to common perception, most high school students do not drink. In2017, 26.2% of high school students reported that they were current drinkers. This is a significant decreasefrom 43.3% in 2005.
- Youth Binge Drinking. Youth binge drinking has significantly decreased over the last decade. In 2017, NewMexico public high school students were less likely to report binge drinking than US high school students.Among New Mexico high school students, binge drinking was more commonly reported by upper gradestudents than lower grade students. There was no significant difference in the binge drinking rate betweenmale and female high school students. Binge drinking rates were lower among American Indian youth thanother racial/ethnic groups.
- Youth Having Ten or More Drinks. On average, underage drinkers consume more drinks per drinkingoccasion than adult drinkers and risk of harm increases as the number of drinks consumed on an occasionincreases. Students in the 12th grade are more likely to drink ten or more drinks on an occasion than 9thgrade students. In 2017, boys and girls did not have significantly different rates of drinking ten or moredrinks on an occasion.
- Adult Heavy Drinking. In NM, between 2015-2017, adult heavy drinking (defined as drinking, on average,more than two drinks per day for men or more than one drink per day for women) was less commonlyreported (5.2%) than in the rest of the nation in 2016 (6.5%). Heavy drinking was more prevalent amongmiddle-aged (age 25-64) adults, with 5.7% reporting past-month heavy drinking. New Mexico men werealmost 1.4 times more likely to report chronic drinking than women (5.9% v. 4.4%).
- Adult Drinking and Driving. In 2016, adult past-30-day drinking and driving was reported in New Mexico by1.0% of adults aged 18 and over. Past-30-day drinking and driving was more prevalent among young (age18-24) and middle-age (age 25-64) adults than among older adults (age 65+). New Mexico men were twiceas likely to report drinking and driving than women (1.9% v. 0.8%). Hispanic males (2.7%) were more likelyto report drinking and driving than American Indian (1.8%) and White (1.2%) males.
- Youth Drinking and Driving. In 2017, New Mexico high school students were more likely to report drivingafter drinking alcohol than other US students (6.5% v. 5.5%). Driving after drinking was more commonamong boys than girls and was less common among White and American Indian youth than among otherracial/ethnic groups. Twelfth grade students were more likely to report drinking and driving than ninth andtenth grade students.

Alcohol, Tobacco, and Other Drug Consumption Behavior (continued)
Data Sources
New Mexico Substance Use Epidemiology Profile Page x
EXECUTIVE SUMMARY (continued)
- Youth Drug Use. In 2017, past-30-day marijuana and methamphetamine use were more prevalentamong New Mexico students than among US students. The use of marijuana was more commonlyreported by American Indian students than by students in other racial/ethnic groups. Asian or PacificIslander students were more likely to report past-30-day use of cocaine, painkillers, heroin,methamphetamine, and inhalants than students of other racial/ethnic groups.
- Adult Tobacco Use. Between 2015-2017, the prevalence of adult smoking was slightly higher for NewMexico compared to the 2016 US estimates (17.2% vs. 17.0% respectively). Smoking was most prevalentamong middle-aged groups and was more common among men than women for all age categories.
-Youth Tobacco Use. In 2017, smoking was more prevalent among New Mexico high school students(10.6%) than in the nation overall (8.8%). New Mexico boys were more likely than girls to report currentsmoking (11.9% vs. 9.0%). Black (8.8%), White (9.7%) and Hispanic (10.7%) students had lower rates ofcurrent cigarette smoking than American Indian (12.6%) and Asian or Pacific Islander (12.0%) students.
National/New Mexico population data, 1981-1989: U.S. Census Bureau. Estimates of the Population ofStates by Age, Sex, Race, and Hispanic Origin: 1981 to 1989. Available from:http://www.census.gov/programs-surveys/popest/data/data-sets.1980.html as of October 12, 2018.
National/New Mexico population data, 1990-1999: U.S. Census Bureau. Estimates of the Population ofStates by Age, Sex, Race, and Hispanic Origin: 1990 to 1999, Internet Release Date August 30, 2000.Available from:http://www.census.gov/programs-surveys/popest/data/data-sets.1990.html as of October 12, 2018.
National population data, 2000-2010: National Center for Health Statistics (NCHS). Intercensal estimates ofthe resident population of the United States for July 1, 2000-July 1, 2010, by year, county, age, bridged race,Hispanic origin, and sex. Available from:http://www.census.gov/programs-surveys/popest/data/data-sets.2000.html as of October 12, 2018.
New Mexico population data, 2000-2017: University of New Mexico (UNM), Geospatial and PopulationStudies (GPS). Annual Estimates of the Population of New Mexico by County, Age, Sex, Race, and HispanicOrigin, 2000 to 2017 (8/24/2018 update).
National death data: National Center for Health Statistics (NCHS). Multiple Cause-of-Death files, 1981-2017,machine readable data files and documentation. National Center for Health Statistics, Hyattsville, Maryland.Available from:http://www.cdc.gov/nchs/data_access/VitalStatsOnline.htm#Mortality_Multiple. Death rates were calculated
by the New Mexico Department of Health (NMDOH), Epidemiology and Response Division (ERD), Injury andBehavioral Epidemiology Bureau (IBEB), Substance Abuse Epidemiology Section (SAES).
New Mexico death data: New Mexico Department of Health, Epidemiology and Response Division, Bureau ofVital Records and Health Statistics (BVRHS). Death rates were calculated by the New Mexico Department ofHealth, Epidemiology and Response Division, Injury and Behavioral Epidemiology Bureau, Substance AbuseEpidemiology Section.
National/New Mexico motor vehicle traffic crash fatality data: National Highway Traffic Safety Administration(NHTSA), Fatality Analysis Reporting System (FARS).
(1) VMT reporting: Fatalities, Fatalities in Crashes by Driver Alcohol Involvement, Vehicle Miles Traveled(VMT), and Fatality Rate per 100 Million VMT, by State, 1982-2016. Report provided by NHTSA NationalCenter for Statistics and Analysis, Information Services Team. 2008-2016 death rates per 100 Million VMTcalculated by the New Mexico Department of Health, Epidemiology and Response Division, Injury andBehavioral Epidemiology Bureau, Substance Abuse Epidemiology Section.

EXECUTIVE SUMMARY (continued)
Data Sources (continued)
New Mexico Substance Use Epidemiology Profile Page xi
(2) Per 100,000 population reporting: Persons killed, by state and Highest Driver Blood Alcohol Concentration(BAC) in Crash - State: USA, Year. Available from:https://www-fars.nhtsa.dot.gov/States/StatesAlcohol.aspx. Death rates were calculated by the New MexicoDepartment of Health, Epidemiology and Response Division, Injury and Behavioral Epidemiology Bureau,Substance Abuse Epidemiology Section.
New Mexico Emergency Department Visits: New Mexico Department of Health, Epidemiology and ResponseDivision, Health Systems Epidemiology Unit. Visit rates were calculated by the New Mexico Department ofHealth, Epidemiology and Response Division, Injury and Behavioral Epidemiology Bureau, Substance AbuseEpidemiology Section
New Mexico Hospital Inpatient Discharges: New Mexico Department of Health, Epidemiology and ResponseDivision, Health Systems Epidemiology Unit. Discharge rates were calculated by the New MexicoDepartment of Health, Epidemiology and Response Division, Injury and Behavioral Epidemiology Bureau,Substance Abuse Epidemiology Section
National adult behavioral data: Centers for Disease Control and Prevention, National Center for ChronicDisease Prevention and Health Promotion, Division of Adult and Community Health. Behavioral Risk FactorSurveillance System Online Prevalence Data, 1995-2016. Available from:http://www.cdc.gov/brfss/data_tools.htm as of October 12, 2018.
New Mexico adult behavioral data: New Mexico Department of Health, Epidemiology and Response Division,Injury and Behavioral Epidemiology Bureau, Survey Unit. New Mexico Behavioral Risk Factor SurveillanceSystem (BRFSS). More reporting available from:https://nmhealth.org/about/erd/ibeb/brfss/ as of October 12, 2018.
National youth behavioral data: Centers for Disease Control and Prevention (CDC). Surveillance Summaries,June 8, 2012. MMWR. 201:61(SS-4). More reporting available from:http://www.cdc.gov/HealthyYouth/yrbs/index.htm as of October 12, 2018.
New Mexico youth behavioral data: New Mexico Department of Health, Epidemiology and ResponseDivision, Injury and Behavioral Epidemiology Bureau, Survey Unit; and the New Mexico Public EducationDepartment, School and Family Support Bureau. New Mexico Youth Risk and Resiliency Survey (YRRS).More reporting available from: www.youthrisk.org as of October 12, 2018.
New Mexico substance use disorder and mental health data: Substance Abuse and Mental Health ServicesAdministration, Office of Applied Studies. Sub-state Estimates from the 2014-2016 National Surveys on DrugUse and Health and Statewide Estimates from 2015-2016. Available from:https://www.samhsa.gov/data/nsduh/2014-2016-substate-reports, https://www.samhsa.gov/data/nsduh/state-reports-NSDUH-2016More reporting available from: https://www.samhsa.gov/data/data-we-collect/nsduh-national-survey-drug-use-and-health as of September 26, 2018

New Mexico Substance Use Epidemiology Profile Page xii

Consequences
New Mexico Substance Use Epidemiology Profile Page 1
Section 1

New Mexico Substance Use Epidemiology Profile Page 2

ALCOHOL-RELATED DEATH
*US data are available up to 2016
* Rate per 100,000, age-adjusted to the 2000 US standard population
Sources: NMDOH BVRHS death files and UNM-GPS population files (NM); NCHS death and population files (US); CDC ARDI; SAES
Ages Ages Ages All Ages Ages Ages All
Sex Race/Ethnicity 0-24 25-64 65+ Ages 0-24 25-64 65+ Ages*
Male American Indian 50 767 87 904 26.0 335.8 238.9 218.9
Asian/Pacific Islander 2 12 4 18 6.2 27.6 55.7 24.1
Black 7 61 17 84 15.1 91.3 142.4 70.3
Hispanic 174 1,476 367 2,016 16.5 121.3 152.2 88.4
White 65 1,018 514 1,598 13.2 94.7 111.9 64.0
Total 298 3,356 999 4,653 16.4 127.5 132.1 87.8
Female American Indian 21 375 75 470 11.0 149.8 140.2 102.0
Asian/Pacific Islander 1 7 2 10 2.4 12.7 14.4 10.0
Black 2 20 4 26 5.1 42.2 32.5 26.1
Hispanic 52 509 222 783 5.1 41.3 75.2 32.7
White 22 456 361 839 4.9 41.8 68.4 30.0
Total 98 1,372 665 2,135 5.7 51.3 73.8 37.6
Total American Indian 70 1,142 162 1,374 18.5 238.6 180.3 156.9
Asian/Pacific Islander 2 20 6 28 4.4 19.2 30.3 15.7
Black 9 81 20 110 10.5 70.9 87.5 50.9
Hispanic 226 1,984 589 2,799 10.9 81.1 109.8 59.7
White 87 1,474 876 2,437 9.2 68.1 88.6 46.8
Total 396 4,728 1,665 6,789 11.2 89.1 100.4 62.2* Age-specific rates (e.g., Ages 0-24) are per 100,000; all-ages rate is per 100,000, age-adjusted to the 2000 US standard population
Sources: NMDOH BVRHS death files and UNM-GPS population files; CDC ARDI; SAES
New Mexico Substance Use Epidemiology Profile Page 3
Deaths Rates*
Chart 1: Alcohol-Related Death Rates*, New Mexico and United States, 1990-2017
Table 1: Alcohol-Related Deaths and Rates* by Age, Sex, and Race/Ethnicity, New Mexico, 2013-2017
Problem Statement
0
10
20
30
40
50
60
70
80
Rate
*
Year
NM - Total Alcohol-Related (A-R)
NM - A-R Injury
NM - A-R Chronic Disease
US - Total Alcohol-Related
The consequences of excessive alcohol use are severe in New Mexico. New Mexico’s total alcohol-related death rate hasranked first, second, or third in the US since 1981; and 1st for the period 2006 through 2010 (Stahre M, etal. Contribution ofExcessive Alcohol Consumption to Deaths and Years of Potential Life Lost in the United States. Preventing Chronic Disease.2014;11:E109. doi:10.5888/pcd11.130293). The negative consequences of excessive alcohol use in New Mexico are notlimited to death but also include domestic violence, crime, poverty, and unemployment, as well as chronic liver disease, motorvehicle crash and other injuries, mental illness, and a variety of other medical problems. Nationally, one in ten deaths amongworking age adults (age 20-64) is attributable to alcohol. In New Mexico this ratio is one in five deaths.
Chart 1 shows the two principal components of alcohol-related death: deaths due to chronic diseases (such as chronic liverdisease), which are strongly associated with chronic heavy drinking; and deaths due to alcohol-related injuries, which arestrongly associated with binge drinking. Each category will be considered in more detail later in this report. New Mexico's totalalcohol-related death rate increased 16% from 1990 through 2012, driven by a 19% increase in alcohol-related injury deathrates from 2001 through 2012. By contrast, the US alcohol-related death rate decreased 8% from 1990 through 2011.Although the alcohol-related chronic disease death rate has remained fairly stable from 1990 to 2009 in NM, from 2010 to2017 there has been a 56% increase in the alcohol-related chronic disease death rate.

CountyAmerican
Indian
Asian/
Pacific
Islander
Black Hispanic White All RacesAmerican
Indian
Asian/
Pacific
Islander
Black Hispanic White All Races
Bernalillo 199 11 58 990 866 2,139 149.6 11.6 58.8 63.7 49.0 59.0
Catron 1 0 0 3 8 12 152.9 0.0 0.0 81.2 44.2 57.4
Chaves 1 0 3 90 96 192 20.3 0.0 60.9 56.1 56.5 55.8
Cibola 78 0 0 32 22 132 147.9 0.0 0.0 61.0 70.9 93.3
Colfax 0 0 0 31 18 49 0.0 0.0 0.0 94.4 44.4 67.1
Curry 1 1 8 35 62 107 71.0 21.0 58.7 43.5 44.7 45.0
De Baca 0 0 0 2 2 4 0.0 0.0 0.0 59.6 35.3 41.9
Dona Ana 4 4 7 265 175 458 60.1 34.4 36.7 41.5 42.1 42.5
Eddy 3 0 3 73 98 177 97.3 0.0 74.7 59.5 62.7 60.7
Grant 2 0 1 40 48 91 191.9 0.0 90.3 53.9 60.1 57.0
Guadalupe 0 0 0 16 0 16 0.0 0.0 0.0 83.7 0.0 65.8
Harding 0 0 0 0 0 0 0.0 0.0 0.0 0.0 0.0 0.0
Hidalgo 0 0 0 9 7 17 0.0 0.0 0.0 66.3 59.6 63.9
Lea 0 0 8 61 77 147 0.0 0.0 64.0 42.2 52.2 45.6
Lincoln 4 0 0 18 53 76 178.8 0.0 0.0 56.0 70.5 68.2
Los Alamos 0 0 0 4 26 30 0.0 0.0 0.0 26.4 32.3 28.5
Luna 0 0 1 24 38 64 0.0 0.0 58.9 32.9 60.2 45.0
McKinley 447 0 1 29 16 493 181.5 0.0 57.7 66.6 42.7 148.5
Mora 0 0 0 17 2 19 0.0 0.0 0.0 83.9 50.5 77.7
Otero 43 0 5 45 96 190 239.2 0.0 41.5 41.8 44.8 54.0
Quay 1 1 0 16 13 32 381.5 186.0 0.0 84.4 50.2 68.1
Rio Arriba 61 0 2 194 21 278 225.8 0.0 244.7 135.9 64.3 139.4
Roosevelt 1 0 1 12 19 33 77.5 0.0 71.5 39.6 34.7 36.3
Sandoval 122 0 8 109 144 386 157.9 0.0 46.8 44.5 35.8 53.3
San Juan 326 0 1 45 118 491 140.0 0.0 22.1 42.7 38.9 78.8
San Miguel 1 1 0 95 17 116 130.7 113.2 0.0 83.2 45.8 76.8
Santa Fe 25 5 1 258 159 454 137.3 42.0 11.1 68.5 38.5 56.4
Sierra 0 0 0 13 51 65 0.0 0.0 0.0 75.4 79.7 80.9
Socorro 17 0 0 31 20 68 183.0 0.0 0.0 71.0 44.3 72.4
Taos 22 0 0 80 41 143 203.7 0.0 0.0 81.2 52.6 76.9
Torrance 1 0 1 16 29 47 41.6 0.0 61.8 49.1 54.9 52.0
Union 0 0 0 8 3 11 0.0 0.0 0.0 89.7 16.5 41.6
Valencia 12 2 2 138 87 244 86.5 92.8 37.9 63.4 54.1 60.8
New Mexico 1,374 28 110 2,799 2,437 6,789 156.9 15.7 50.9 59.7 46.8 62.2* All rates are per 100,000, age-adjusted to the 2000 US standard population
Sources: NMDOH BVRHS death files and UNM-GPS population files; CDC ARDI; SAES
New Mexico Substance Use Epidemiology Profile Page 4
Rates*
ALCOHOL-RELATED DEATH (continued)
Problem Statement (continued)
Table 2: Alcohol-Related Deaths and Rates* by Race/Ethnicity and County, New Mexico, 2013-2017
Deaths
Table 1 shows that death rates from alcohol-related causes increase with age. However, there were substantial numbers ofalcohol-related deaths in the 0-24 year age category (these are mostly injury-related), and large numbers and high rates ofalcohol-related death in the 25-64 year age category (due to both chronic disease and injury). Table 1 also shows extremelyhigh alcohol-related death rates among American Indians (more than twice the state rate for both males and females) and arelatively high rate among Hispanic males relative to White non-Hispanic males. As will be shown in later sections, the ratedisparities for American Indian males are driven by this group's relatively high rates of both alcohol-related injury and alcohol-related chronic disease death; whereas the rate disparities for Hispanic males and American Indian females are driven largelyby their relatively high alcohol-related chronic disease death rates.
Table 2 shows that McKinley and Rio Arriba counties had the highest rates of alcohol-related death, with rates more thantwice the state rate and more than four times the national rate. Several other counties (Cibola, San Miguel, San Juan, andTaos) had a substantial burden (20 or more alcohol-related deaths per year) and rates more than twice the US rate.Furthermore, only two New Mexico counties had rates lower than the national rate. High rates among American Indian malesand females drive the rates in McKinley, Cibola, and San Juan counties. Rio Arriba and Taos counties have high rates amongAmerican Indian males and females and Hispanic males; deaths among Hispanic males drive the high rates in San MiguelCounty (data by gender not shown).

* All rates are per 100,000, age-adjusted to the 2000 US standard population
Sources: NMDOH BVRHS death files and UNM-GPS population files (NM); NCHS death and population files (US); CDC ARDI; SAES
New Mexico Substance Use Epidemiology Profile Page 5
ALCOHOL-RELATED DEATH (continued)
Chart 2: Alcohol-Related Death Rates* by County, New Mexico, 2013-2017
34.0
28.5
36.3
41.6
41.9
42.5
45.0
45.0
45.6
52.0
53.3
54.0
55.8
56.4
57.0
57.4
59.0
60.7
60.8
62.2
63.9
65.8
67.1
68.1
68.2
72.4
76.8
76.9
77.7
78.8
80.9
93.3
139.4
148.5
0 20 40 60 80 100 120 140 160
United States, 2016
Harding (0; 0.0%)
Los Alamos (30; 0.4%)
Roosevelt (33; 0.5%)
Union (11; 0.2%)
De Baca (4; 0.1%)
Dona Ana (458; 6.8%)
Curry (107; 1.6%)
Luna (64; 0.9%)
Lea (147; 2.2%)
Torrance (47; 0.7%)
Sandoval (386; 5.7%)
Otero (190; 2.8%)
Chaves (192; 2.8%)
Santa Fe (454; 6.7%)
Grant (91; 1.3%)
Catron (12; 0.2%)
Bernalillo (2139; 31.5%)
Eddy (177; 2.6%)
Valencia (244; 3.6%)
New Mexico (6789; 100.0%)
Hidalgo (17; 0.2%)
Guadalupe (16; 0.2%)
Colfax (49; 0.7%)
Quay (32; 0.5%)
Lincoln (76; 1.1%)
Socorro (68; 1.0%)
San Miguel (116; 1.7%)
Taos (143; 2.1%)
Mora (19; 0.3%)
San Juan (491; 7.2%)
Sierra (65; 1.0%)
Cibola (132; 1.9%)
Rio Arriba (278; 4.1%)
McKinley (493; 7.3%)
Rate*
County (# of deaths; % of statewide deaths)

* All rates are per 100,000, age-adjusted to the 2000 US standard population
Sources: NMDOH BVRHS death files and UNM-GPS population files; CDC ARDI; SAES
New Mexico Substance Use Epidemiology Profile Page 6
ALCOHOL-RELATED DEATH (continued)
Chart 3: Alcohol-Related Death Rates* by County, New Mexico, 2013-2017
Alcohol-Related Deaths (Rate per 100,000 population)
ALCOHOL-RELATED CHRONIC DISEASE DEATH
Chart 1: Leading Causes of Alcohol-Related Chronic Disease Death, New Mexico, 2013-2017
Sources: NMDOH BVRHS death files and UNM-GPS population files; CDC ARDI; SAES
Ages Ages Ages All Ages Ages Ages All
Sex Race/Ethnicity 0-24 25-64 65+ Ages 0-24 25-64 65+ Ages*
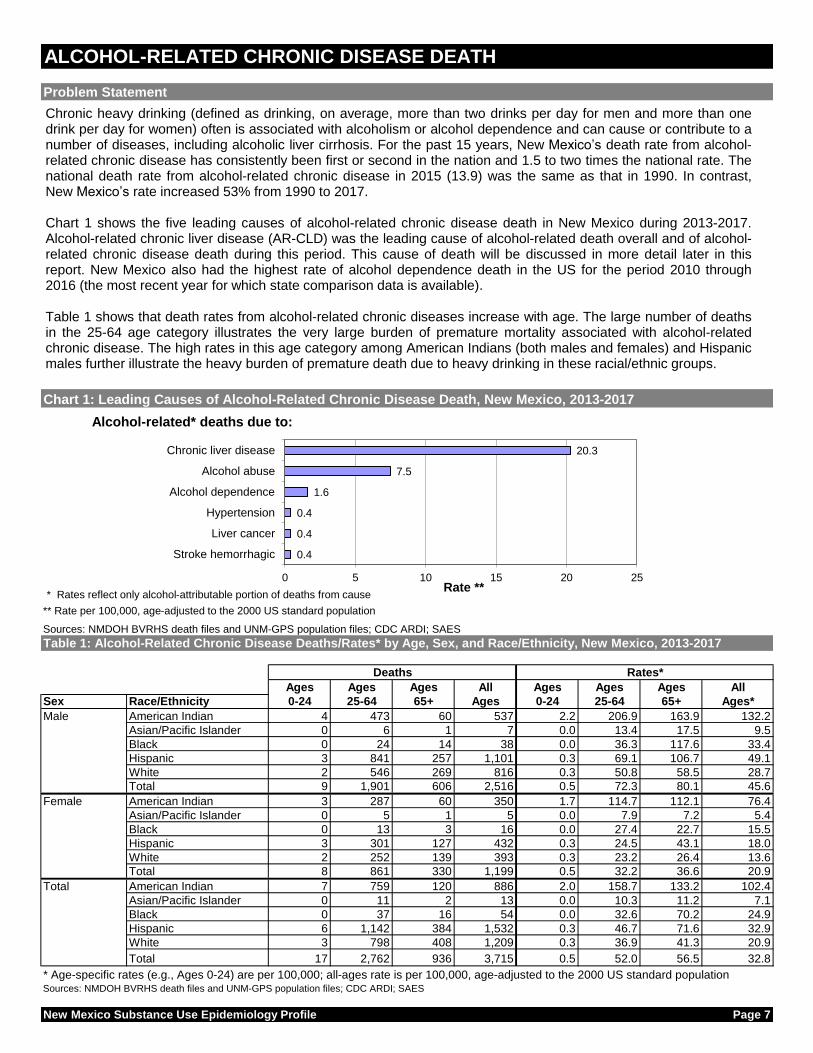
Male American Indian 4 473 60 537 2.2 206.9 163.9 132.2
Asian/Pacific Islander 0 6 1 7 0.0 13.4 17.5 9.5
Black 0 24 14 38 0.0 36.3 117.6 33.4
Hispanic 3 841 257 1,101 0.3 69.1 106.7 49.1
White 2 546 269 816 0.3 50.8 58.5 28.7
Total 9 1,901 606 2,516 0.5 72.3 80.1 45.6
Female American Indian 3 287 60 350 1.7 114.7 112.1 76.4
Asian/Pacific Islander 0 5 1 5 0.0 7.9 7.2 5.4
Black 0 13 3 16 0.0 27.4 22.7 15.5
Hispanic 3 301 127 432 0.3 24.5 43.1 18.0
White 2 252 139 393 0.3 23.2 26.4 13.6
Total 8 861 330 1,199 0.5 32.2 36.6 20.9
Total American Indian 7 759 120 886 2.0 158.7 133.2 102.4
Asian/Pacific Islander 0 11 2 13 0.0 10.3 11.2 7.1
Black 0 37 16 54 0.0 32.6 70.2 24.9
Hispanic 6 1,142 384 1,532 0.3 46.7 71.6 32.9
White 3 798 408 1,209 0.3 36.9 41.3 20.9
Total 17 2,762 936 3,715 0.5 52.0 56.5 32.8
* Age-specific rates (e.g., Ages 0-24) are per 100,000; all-ages rate is per 100,000, age-adjusted to the 2000 US standard populationSources: NMDOH BVRHS death files and UNM-GPS population files; CDC ARDI; SAES
New Mexico Substance Use Epidemiology Profile Page 7
Rates*
Problem Statement
Table 1: Alcohol-Related Chronic Disease Deaths/Rates* by Age, Sex, and Race/Ethnicity, New Mexico, 2013-2017
Deaths
20.3
7.5
1.6
0.4
0.4
0.4
0 5 10 15 20 25
Chronic liver disease
Alcohol abuse
Alcohol dependence
Hypertension
Liver cancer
Stroke hemorrhagic
Rate **
Alcohol-related* deaths due to:
** Rate per 100,000, age-adjusted to the 2000 US standard population
* Rates reflect only alcohol-attributable portion of deaths from cause
Chronic heavy drinking (defined as drinking, on average, more than two drinks per day for men and more than onedrink per day for women) often is associated with alcoholism or alcohol dependence and can cause or contribute to anumber of diseases, including alcoholic liver cirrhosis. For the past 15 years, New Mexico’s death rate from alcohol-related chronic disease has consistently been first or second in the nation and 1.5 to two times the national rate. Thenational death rate from alcohol-related chronic disease in 2015 (13.9) was the same as that in 1990. In contrast,New Mexico’s rate increased 53% from 1990 to 2017.
Chart 1 shows the five leading causes of alcohol-related chronic disease death in New Mexico during 2013-2017.Alcohol-related chronic liver disease (AR-CLD) was the leading cause of alcohol-related death overall and of alcohol-related chronic disease death during this period. This cause of death will be discussed in more detail later in thisreport. New Mexico also had the highest rate of alcohol dependence death in the US for the period 2010 through2016 (the most recent year for which state comparison data is available).
Table 1 shows that death rates from alcohol-related chronic diseases increase with age. The large number of deathsin the 25-64 age category illustrates the very large burden of premature mortality associated with alcohol-relatedchronic disease. The high rates in this age category among American Indians (both males and females) and Hispanicmales further illustrate the heavy burden of premature death due to heavy drinking in these racial/ethnic groups.

CountyAmerican
Indian
Asian/
Pacific
Islander
Black Hispanic White All RacesAmerican
Indian
Asian/
Pacific
Islander
Black Hispanic White All Races
Bernalillo 146 3 29 542 457 1,184 111.7 3.5 28.8 35.4 24.1 31.7
Catron 0 0 0 2 2 5 0.0 0.0 0.0 52.9 6.0 15.5
Chaves 0 0 2 45 49 98 0.0 0.0 31.2 29.9 25.8 27.2
Cibola 56 0 0 21 11 88 104.8 0.0 0.0 38.9 36.9 60.3
Colfax 0 0 0 18 9 27 0.0 0.0 0.0 52.8 16.7 32.4
Curry 1 0 4 14 31 50 58.8 0.0 29.1 21.1 21.9 21.4
De Baca 0 0 0 1 1 2 0.0 0.0 0.0 29.2 7.9 15.7
Dona Ana 4 3 4 146 89 247 55.4 25.2 21.4 23.3 20.2 22.4
Eddy 1 0 2 38 49 89 47.7 0.0 44.3 32.0 27.9 28.8
Grant 1 0 1 20 22 45 132.9 0.0 90.3 25.1 23.0 24.5
Guadalupe 0 0 0 9 0 9 0.0 0.0 0.0 40.5 0.0 30.9
Harding 0 0 0 0 0 0 0.0 0.0 0.0 0.0 0.0 0.0
Hidalgo 0 0 0 4 2 7 0.0 0.0 0.0 33.6 12.8 25.6
Lea 0 0 2 25 29 57 0.0 0.0 18.9 20.5 17.4 17.6
Lincoln 3 0 0 10 28 41 143.1 0.0 0.0 27.5 30.5 32.9
Los Alamos 0 0 0 2 10 11 0.0 0.0 0.0 12.3 9.0 9.0
Luna 0 0 1 14 17 32 0.0 0.0 51.6 18.8 23.9 21.7
McKinley 279 0 1 15 7 302 114.5 0.0 43.7 32.9 14.9 90.9
Mora 0 0 0 7 1 9 0.0 0.0 0.0 30.6 9.5 26.5
Otero 32 0 3 23 46 105 182.2 0.0 23.5 22.0 19.3 29.0
Quay 1 1 0 11 6 20 381.5 186.0 0.0 55.4 22.2 39.4
Rio Arriba 49 0 0 113 15 177 180.1 0.0 0.0 76.0 40.1 85.0
Roosevelt 0 0 0 5 8 13 0.0 0.0 0.0 19.9 14.7 14.8
Sandoval 86 0 6 66 69 228 111.6 0.0 33.8 26.7 14.9 30.1
San Juan 174 0 0 17 50 242 75.4 0.0 0.0 16.6 15.0 38.2
San Miguel 0 1 0 56 9 67 0.0 113.2 0.0 47.4 24.2 43.0
Santa Fe 19 3 0 147 76 249 104.8 22.7 0.0 38.1 16.1 28.6
Sierra 0 0 0 8 29 38 0.0 0.0 0.0 50.2 34.8 42.0
Socorro 10 0 0 14 10 35 115.9 0.0 0.0 31.4 22.0 35.6
Taos 15 0 0 46 21 82 126.0 0.0 0.0 45.2 19.5 39.8
Torrance 0 0 0 9 10 19 0.0 0.0 0.0 22.9 14.3 16.1
Union 0 0 0 7 1 8 0.0 0.0 0.0 73.4 3.2 26.1
Valencia 7 2 0 75 44 129 56.7 53.0 0.0 34.3 22.0 30.3
New Mexico 886 13 54 1,532 1,209 3,715 102.4 7.1 24.9 32.9 20.9 32.8
* All rates are per 100,000, age-adjusted to the 2000 US standard populationSources: NMDOH BVRHS death files and UNM-GPS population files; CDC ARDI; SAES
New Mexico Substance Use Epidemiology Profile Page 8
Deaths Rates*
ALCOHOL-RELATED CHRONIC DISEASE DEATH (continued)
Table 2: Alcohol-Related Chronic Disease Deaths and Rates* by Race/Ethnicity and County, New Mexico, 2013-2017
Problem Statement (continued)
Table 1 also shows that, in general, males are more at risk than females for alcohol-related chronic disease death. Malerates are almost two to three times higher than female rates across all racial/ethnic groups except Asian/Pacific Islanders.American Indians are most at risk among the racial/ethnic groups with total, male, and female rates more than twice thecorresponding state rates. As mentioned earlier, Hispanic males are also at an elevated risk, with rates more than one anda half times the state rate (49.1 vs. 32.8).
Table 2 shows that McKinley, Rio Arriba, and Cibola counties have the highest death rates for diseases associated withalcohol-related chronic disease. In these counties, the rates are more than 4 times the national rate (13.9). The high ratesin McKinley and Cibola counties are driven by unusually high rates in the American Indian population. In Rio Arriba County,the rate is driven by high rates in both the Hispanic and American Indian populations. It is worth noting the considerablevariation exists across counties in American Indian alcohol-related chronic disease death rates, with substantially lowerrates seen in San Juan County than in Cibola, McKinley, and Rio Arriba counties. It is also important to remember thatthese chronic disease deaths represent only the tip of the iceberg of health and social problems associated with chronicheavy alcohol use in New Mexico. For every alcohol-related death, there are many living persons (and their families)impaired by serious morbidity and reduced quality of life due to chronic alcohol abuse.

* All rates are per 100,000, age-adjusted to the 2000 US standard populationSources: NMDOH BVRHS death files and UNM-GPS population files (NM); NCHS death and population files (US); CDC ARDI; SAES
New Mexico Substance Use Epidemiology Profile Page 9
ALCOHOL-RELATED CHRONIC DISEASE DEATH (continued)
Chart 2: Alcohol-Related Chronic Disease Death Rates* by County, New Mexico, 2013-2017
13.9
9.0
14.8
15.5
15.7
16.1
17.6
21.4
21.7
22.4
24.5
25.6
26.1
26.5
27.2
28.6
28.8
29.0
30.1
30.3
30.9
31.7
32.4
32.8
32.9
35.6
38.2
39.4
39.8
42.0
43.0
60.3
85.0
90.9
0 20 40 60 80 100
United States, 2016
Harding (0; 0.0%)
Los Alamos (11; 0.3%)
Roosevelt (13; 0.4%)
Catron (5; 0.1%)
De Baca (2; 0.1%)
Torrance (19; 0.5%)
Lea (57; 1.5%)
Curry (50; 1.4%)
Luna (32; 0.9%)
Dona Ana (247; 6.7%)
Grant (45; 1.2%)
Hidalgo (7; 0.2%)
Union (8; 0.2%)
Mora (9; 0.2%)
Chaves (98; 2.6%)
Santa Fe (249; 6.7%)
Eddy (89; 2.4%)
Otero (105; 2.8%)
Sandoval (228; 6.1%)
Valencia (129; 3.5%)
Guadalupe (9; 0.2%)
Bernalillo (1184; 31.9%)
Colfax (27; 0.7%)
New Mexico (3715; 100.0%)
Lincoln (41; 1.1%)
Socorro (35; 0.9%)
San Juan (242; 6.5%)
Quay (20; 0.5%)
Taos (82; 2.2%)
Sierra (38; 1.0%)
San Miguel (67; 1.8%)
Cibola (88; 2.4%)
Rio Arriba (177; 4.8%)
McKinley (302; 8.1%)
Rate*
County (# of deaths; % of statewide deaths)

* All rates are per 100,000, age-adjusted to the 2000 US standard populationSources: NMDOH BVRHS death files and UNM-GPS population files; CDC ARDI; SAES
New Mexico Substance Use Epidemiology Profile Page 10
ALCOHOL-RELATED CHRONIC DISEASE DEATH (continued)
Chart 3: Alcohol-Related Chronic Disease Death Rates* by County, New Mexico, 2013-2017
Alcohol-Related Chronic Disease Deaths(Rate per 100,000 population)

ALCOHOL-RELATED CHRONIC LIVER DISEASE (CLD) DEATH
* Age-specific rates per 100,000
Sources: NMDOH BVRHS death files and UNM-GPS population files; CDC ARDI; SAES
Ages Ages Ages All Ages Ages Ages All
Sex Race/Ethnicity 0-24 25-64 65+ Ages 0-24 25-64 65+ Ages*
Male American Indian 2 302 36 340 1.0 132.2 98.1 83.2
Asian/Pacific Islander 0 3 0 3 0.0 6.3 0.0 3.7
Black 0 7 7 14 0.0 10.2 58.7 11.7
Hispanic 1 541 165 707 0.1 44.4 68.7 31.3
White 0 275 122 397 0.0 25.6 26.6 13.7
Total 3 1,131 331 1,465 0.2 43.0 43.7 26.4
Female American Indian 1 215 49 265 0.5 86.1 91.4 58.1
Asian/Pacific Islander 0 2 0 3 0.0 4.2 0.0 2.8
Black 0 7 2 9 0.0 14.8 15.5 8.0
Hispanic 2 230 95 327 0.2 18.7 32.1 13.6
White 0 162 71 233 0.0 14.9 13.4 8.0
Total 3 618 217 838 0.2 23.1 24.1 14.6
Total American Indian 3 517 85 605 0.8 108.1 94.1 70.0
Asian/Pacific Islander 0 5 1 6 0.0 5.1 4.1 3.2
Black 0 14 9 22 0.0 12.1 37.1 9.7
Hispanic 3 770 260 1,034 0.1 31.5 48.5 22.1
White 0 437 193 631 0.0 20.2 19.6 10.8
Total 6 1,749 548 2,303 0.2 33.0 33.0 20.3
* Age-specific rates (e.g., Ages 0-24) are per 100,000; all-ages rate is per 100,000, age-adjusted to the 2000 US standard population
Sources: NMDOH BVRHS death files and UNM-GPS population files; CDC ARDI; SAES
New Mexico Substance Use Epidemiology Profile Page 11
Table 1: Alcohol-Related CLD Deaths and Rates* by Age, Sex, and Race/Ethnicity, New Mexico, 2013-2017
Deaths Rates*
Problem Statement
Chart 1: Alcohol-Related CLD Death Rates* by Age, Sex, and Race/Ethnicity, New Mexico, 2013-2017
0
20
40
60
80
100
120
140
160
180
200
220
240
260
15-2
4
25-3
4
35-4
4
45-5
4
55-6
4
65-7
4
75-8
4
85+
15-2
4
25-3
4
35-4
4
45-5
4
55-6
4
65-7
4
75-8
4
85+
Male Female
Rate
*
White
Hispanic
American Indian
Alcohol-related chronic liver disease (AR-CLD) is a progressive disease caused by alcohol abuse. It imposes a heavyburden of morbidity and mortality in New Mexico, and it is the principal driver of New Mexico's consistently high alcohol-related chronic disease death rate. Over the past 30 years, New Mexico's AR-CLD rate has trended upward while thenational rate has decreased 20%. In 1993, AR-CLD surpassed alcohol-related motor vehicle crash death as the leadingcause of alcohol-related death in New Mexico. Since 1997, New Mexico's death rate from AR-CLD has consistently beensubstantially higher than the death rate from alcohol-related motor vehicle crashes.

CountyAmerican
Indian
Asian/
Pacific
Islander
Black Hispanic White All RacesAmerican
Indian
Asian/
Pacific
Islander
Black Hispanic White All Races
Bernalillo 86 1 14 350 226 677 66.8 1.4 12.3 22.8 11.8 18.0
Catron 0 0 0 1 1 2 0.0 0.0 0.0 37.3 1.5 9.6
Chaves 0 0 1 32 27 61 0.0 0.0 28.3 21.0 14.2 17.2
Cibola 37 0 0 18 8 63 69.2 0.0 0.0 34.7 24.8 43.0
Colfax 0 0 0 15 6 20 0.0 0.0 0.0 41.6 11.8 24.5
Curry 1 0 2 11 19 33 58.7 0.0 16.9 16.3 13.9 14.6
De Baca 0 0 0 1 0 1 0.0 0.0 0.0 25.2 0.0 11.7
Dona Ana 4 1 1 96 43 146 53.8 6.1 5.0 15.3 9.2 13.0
Eddy 1 0 0 24 30 55 45.0 0.0 0.0 20.8 17.5 18.2
Grant 0 0 0 14 10 24 0.0 0.0 0.0 17.1 9.3 12.3
Guadalupe 0 0 0 8 0 8 0.0 0.0 0.0 35.7 0.0 27.0
Harding 0 0 0 0 0 0 0.0 0.0 0.0 0.0 0.0 0.0
Hidalgo 0 0 0 4 1 5 0.0 0.0 0.0 32.7 5.6 21.3
Lea 0 0 0 15 14 29 0.0 0.0 0.0 12.2 8.4 9.1
Lincoln 2 0 0 7 18 28 103.9 0.0 0.0 17.7 18.6 19.8
Los Alamos 0 0 0 1 4 6 0.0 0.0 0.0 10.3 3.9 4.6
Luna 0 0 0 8 10 18 0.0 0.0 0.0 10.3 13.1 11.3
McKinley 200 0 1 13 2 216 82.4 0.0 42.9 27.7 3.2 65.0
Mora 0 0 0 5 1 6 0.0 0.0 0.0 21.8 8.3 19.8
Otero 26 0 1 14 24 66 150.7 0.0 10.3 13.4 10.0 18.8
Quay 1 0 0 8 2 12 381.5 0.0 0.0 39.4 7.4 23.3
Rio Arriba 31 0 0 83 8 123 112.2 0.0 0.0 55.3 17.9 57.8
Roosevelt 0 0 0 5 6 12 0.0 0.0 0.0 17.9 13.2 13.1
Sandoval 58 0 1 44 33 138 76.1 0.0 6.4 17.4 7.5 18.1
San Juan 122 0 0 13 35 171 52.5 0.0 0.0 12.9 10.5 26.8
San Miguel 0 1 0 40 5 46 0.0 112.9 0.0 33.4 10.6 29.3
Santa Fe 13 2 0 100 37 152 67.4 20.4 0.0 25.5 7.9 17.5
Sierra 0 0 0 6 16 23 0.0 0.0 0.0 32.2 20.0 24.6
Socorro 5 0 0 9 6 20 53.6 0.0 0.0 18.2 13.6 19.8
Taos 11 0 0 26 9 46 94.4 0.0 0.0 26.0 7.1 22.7
Torrance 0 0 0 5 5 10 0.0 0.0 0.0 12.3 7.5 8.5
Union 0 0 0 5 0 5 0.0 0.0 0.0 52.9 0.0 18.6
Valencia 5 0 0 53 20 80 39.2 0.0 0.0 24.4 9.6 18.4
New Mexico 605 6 22 1,034 631 2,303 70.0 3.2 9.7 22.1 10.8 20.3
* All rates are per 100,000, age-adjusted to the 2000 US standard population
Sources: NMDOH BVRHS death files and UNM-GPS population files; CDC ARDI; SAES
New Mexico Substance Use Epidemiology Profile Page 12
Problem Statement (continued)
Table 2: Alcohol-Related CLD Deaths and Rates* by Race/Ethnicity and County, New Mexico, 2013-2017
Deaths Rates*
ALCOHOL-RELATED CHRONIC LIVER DISEASE (CLD) DEATH (continued)
As Table 1 shows, more than 75% of AR-CLD deaths occur before age 65. Chart 1 shows the demographic distributionof AR-CLD death rates and graphically illustrates the extremely high burden of premature mortality this disease placeson the American Indian population (both male and female), as well as on the Hispanic male population. The high deathrates among American Indians and Hispanic males in the 35-64 age range represent a tremendous burden in terms ofyears of potential life lost (YPLLs), which estimates the average years a person would have lived if he or she had notdied prematurely.
Chart 2 shows that AR-CLD death rates in McKinley and Rio Arriba counties are more than six times the national rate.Two-thirds of New Mexico's counties have rates more than twice the US rate. A number of counties with rates less thantwice the US rate (e.g., Curry, Dona Ana, Grant) still have high rates compared to the US, and substantial numbers ofdeaths. The American Indian and/or Hispanic male rates tend to drive the county rates in all counties (data not shown).It is worth noting the relatively lower rates for American Indians in Valencia and San Juan counties and for Hispanics inDona Ana County (Table 2).

* All rates are per 100,000, age-adjusted to the 2000 US standard population
Sources: NMDOH BVRHS death files and UNM-GPS population files (NM); NCHS death and population files (US); CDC ARDI; SAES
New Mexico Substance Use Epidemiology Profile Page 13
ALCOHOL-RELATED CHRONIC LIVER DISEASE (CLD) DEATH (continued)
Chart 2: Alcohol-Related CLD Death Rates* by County, New Mexico, 2013-2017
8.5
4.6
8.5
9.1
9.6
11.3
11.7
12.3
13.0
13.1
14.6
17.2
17.5
18.0
18.1
18.2
18.4
18.6
18.8
19.8
19.8
19.8
20.3
21.3
22.7
23.3
24.5
24.6
26.8
27.0
29.3
43.0
57.8
65.0
0 10 20 30 40 50 60 70
United States, 2016
Harding (0; 0.0%)
Los Alamos (6; 0.2%)
Torrance (10; 0.4%)
Lea (29; 1.3%)
Catron (2; 0.1%)
Luna (18; 0.8%)
De Baca (1; 0.1%)
Grant (24; 1.0%)
Dona Ana (146; 6.3%)
Roosevelt (12; 0.5%)
Curry (33; 1.4%)
Chaves (61; 2.6%)
Santa Fe (152; 6.6%)
Bernalillo (677; 29.4%)
Sandoval (138; 6.0%)
Eddy (55; 2.4%)
Valencia (80; 3.5%)
Union (5; 0.2%)
Otero (66; 2.8%)
Mora (6; 0.2%)
Lincoln (28; 1.2%)
Socorro (20; 0.9%)
New Mexico (2303; 100.0%)
Hidalgo (5; 0.2%)
Taos (46; 2.0%)
Quay (12; 0.5%)
Colfax (20; 0.9%)
Sierra (23; 1.0%)
San Juan (171; 7.4%)
Guadalupe (8; 0.3%)
San Miguel (46; 2.0%)
Cibola (63; 2.7%)
Rio Arriba (123; 5.3%)
McKinley (216; 9.4%)
Rate*
County (# of deaths; % of statewide deaths)

* All rates are per 100,000, age-adjusted to the 2000 US standard population
Sources: NMDOH BVRHS death files and UNM-GPS population files; CDC ARDI; SAES
New Mexico Substance Use Epidemiology Profile Page 14
ALCOHOL-RELATED CHRONIC LIVER DISEASE (CLD) DEATH (continued)
Chart 3: Alcohol-Related CLD Death Rates* by County, New Mexico, 2013-2017
Alcohol-Related Chronic Liver Disease Deaths(Rate per 100,000 population)
CHRONIC LIVER DISEASE (CLD) HOSPITAL DISCHARGES
* Rates per 100,000 population
Sources: NMDOH HIDD files and UNM-GPS population files; SAES
Ages Ages Ages All Ages Ages Ages All
Sex Race/Ethnicity 0-24 25-64 65+ Ages 0-24 25-64 65+ Ages*
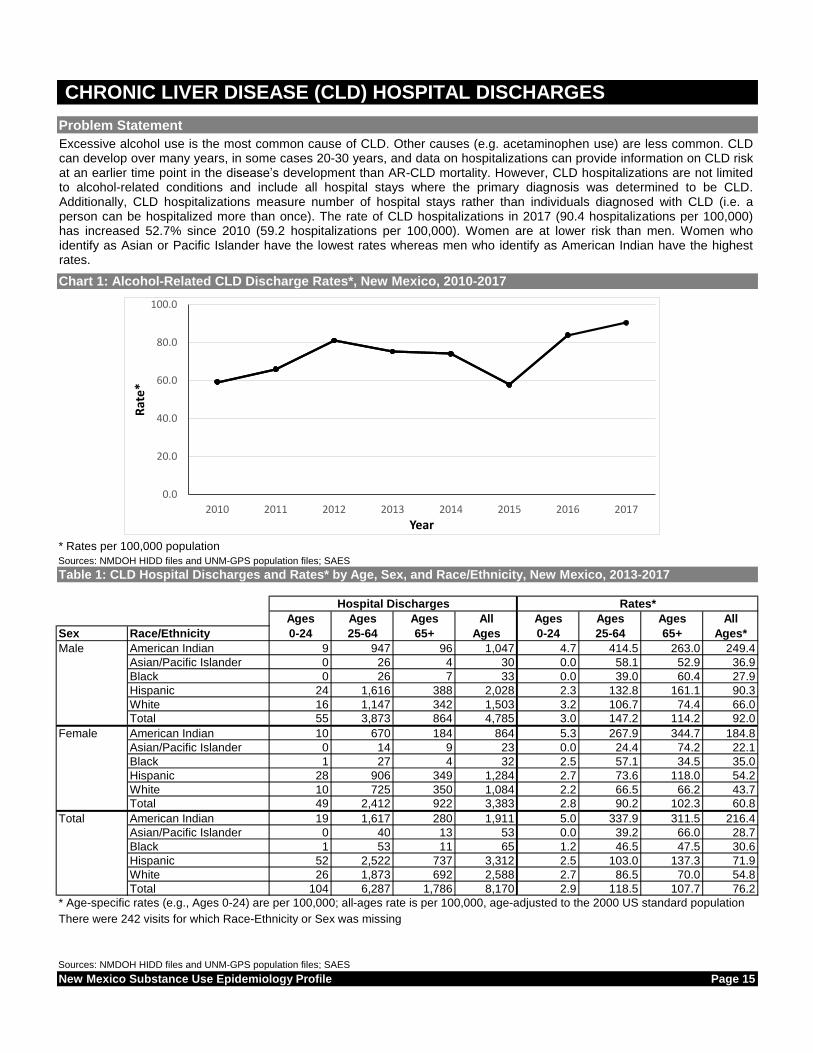
Male American Indian 9 947 96 1,047 4.7 414.5 263.0 249.4
Asian/Pacific Islander 0 26 4 30 0.0 58.1 52.9 36.9
Black 0 26 7 33 0.0 39.0 60.4 27.9
Hispanic 24 1,616 388 2,028 2.3 132.8 161.1 90.3
White 16 1,147 342 1,503 3.2 106.7 74.4 66.0
Total 55 3,873 864 4,785 3.0 147.2 114.2 92.0
Female American Indian 10 670 184 864 5.3 267.9 344.7 184.8
Asian/Pacific Islander 0 14 9 23 0.0 24.4 74.2 22.1
Black 1 27 4 32 2.5 57.1 34.5 35.0
Hispanic 28 906 349 1,284 2.7 73.6 118.0 54.2
White 10 725 350 1,084 2.2 66.5 66.2 43.7
Total 49 2,412 922 3,383 2.8 90.2 102.3 60.8
Total American Indian 19 1,617 280 1,911 5.0 337.9 311.5 216.4
Asian/Pacific Islander 0 40 13 53 0.0 39.2 66.0 28.7
Black 1 53 11 65 1.2 46.5 47.5 30.6
Hispanic 52 2,522 737 3,312 2.5 103.0 137.3 71.9
White 26 1,873 692 2,588 2.7 86.5 70.0 54.8
Total 104 6,287 1,786 8,170 2.9 118.5 107.7 76.2
* Age-specific rates (e.g., Ages 0-24) are per 100,000; all-ages rate is per 100,000, age-adjusted to the 2000 US standard population
There were 242 visits for which Race-Ethnicity or Sex was missing
Sources: NMDOH HIDD files and UNM-GPS population files; SAES
New Mexico Substance Use Epidemiology Profile Page 15
Hospital Discharges Rates*
Table 1: CLD Hospital Discharges and Rates* by Age, Sex, and Race/Ethnicity, New Mexico, 2013-2017
Problem Statement
Chart 1: Alcohol-Related CLD Discharge Rates*, New Mexico, 2010-2017
Excessive alcohol use is the most common cause of CLD. Other causes (e.g. acetaminophen use) are less common. CLDcan develop over many years, in some cases 20-30 years, and data on hospitalizations can provide information on CLD riskat an earlier time point in the disease’s development than AR-CLD mortality. However, CLD hospitalizations are not limitedto alcohol-related conditions and include all hospital stays where the primary diagnosis was determined to be CLD.Additionally, CLD hospitalizations measure number of hospital stays rather than individuals diagnosed with CLD (i.e. aperson can be hospitalized more than once). The rate of CLD hospitalizations in 2017 (90.4 hospitalizations per 100,000)has increased 52.7% since 2010 (59.2 hospitalizations per 100,000). Women are at lower risk than men. Women whoidentify as Asian or Pacific Islander have the lowest rates whereas men who identify as American Indian have the highestrates.
0.0
20.0
40.0
60.0
80.0
100.0
2010 2011 2012 2013 2014 2015 2016 2017
Rat
e*
Year

CountyAmerican
Indian
Asian/
Pacific
Islander
Black Hispanic White All RacesAmerican
Indian
Asian/
Pacific
Islander
Black Hispanic White All Races
Bernalillo 446 26 23 1,218 1,093 2,885 312.9 26.0 23.7 78.7 67.3 81.3
Catron 0 0 0 4 6 10 0.0 0.0 0.0 111.7 52.0 59.5
Chaves 2 0 1 18 107 130 73.4 0.0 19.1 11.2 69.8 39.9
Cibola 99 5 1 25 29 172 192.9 729.4 59.2 48.4 85.6 121.3
Colfax 0 0 0 36 23 60 0.0 0.0 0.0 108.9 65.2 83.3
Curry 0 0 12 45 34 91 0.0 0.0 88.6 56.1 24.9 38.4
De Baca 0 0 0 0 0 0 0.0 0.0 0.0 0.0 0.0 0.0
Dona Ana 9 0 5 456 253 744 116.0 0.0 27.3 74.1 77.9 73.7
Eddy 1 0 0 7 11 19 32.0 0.0 0.0 5.9 6.6 6.6
Grant 0 0 0 13 14 28 0.0 0.0 0.0 16.6 20.4 17.9
Guadalupe 0 0 0 10 5 15 0.0 0.0 0.0 52.4 100.7 59.2
Harding 0 0 0 3 0 3 0.0 0.0 0.0 82.8 0.0 33.6
Hidalgo 0 0 0 6 6 12 0.0 0.0 0.0 47.9 44.0 47.4
Lea 0 0 2 64 48 116 0.0 0.0 16.5 43.6 34.5 35.9
Lincoln 4 1 2 25 47 80 158.5 187.7 269.0 81.2 62.6 72.4
Los Alamos 0 0 0 7 19 26 0.0 0.0 0.0 51.0 25.2 26.3
Luna 0 0 2 79 41 124 0.0 0.0 135.1 111.3 107.6 103.5
McKinley 427 11 3 41 26 536 170.3 283.1 128.6 94.9 65.4 157.2
Mora 0 0 0 18 2 20 0.0 0.0 0.0 72.8 49.7 64.4
Otero 40 2 1 41 32 125 212.6 36.2 8.6 38.3 18.1 38.9
Quay 0 0 0 10 4 14 0.0 0.0 0.0 49.1 16.5 27.7
Rio Arriba 84 0 0 145 24 256 310.6 0.0 0.0 103.5 77.3 126.3
Roosevelt 0 0 0 7 8 15 0.0 0.0 0.0 20.9 15.0 17.1
Sandoval 211 2 3 144 146 536 269.2 15.5 18.8 59.1 38.4 73.5
San Juan 377 0 1 60 152 601 164.9 0.0 39.3 60.0 53.6 94.7
San Miguel 4 0 0 117 21 145 280.2 0.0 0.0 104.9 61.6 99.6
Santa Fe 65 4 3 402 202 685 333.3 32.1 38.2 107.7 51.8 84.5
Sierra 1 0 0 22 44 68 119.2 0.0 0.0 137.8 88.3 105.9
Socorro 34 0 1 36 17 89 365.1 0.0 92.6 83.7 45.0 101.4
Taos 34 0 0 75 34 154 337.7 0.0 0.0 76.4 46.8 84.2
Torrance 0 0 2 12 31 47 0.0 0.0 178.4 38.2 62.1 54.4
Union 0 0 0 13 4 17 0.0 0.0 0.0 137.2 25.6 65.2
Valencia 73 2 3 153 105 346 513.5 76.2 59.2 71.2 65.7 88.2
New Mexico 1,911 53 65 3,312 2,588 8,170 216.4 28.7 30.6 71.9 54.8 76.2
Sources: NMDOH HIDD files and UNM-GPS population files; SAES
New Mexico Substance Use Epidemiology Profile Page 16
* All rates are per 100,000, age-adjusted to the 2000 US standard population. There were 242 visits for which Race-Ethnicity or Sex was missing
CHRONIC LIVER DISEASE (CLD) HOSPITAL DISCHARGES (continued)
Problem Statement (continued)
Table 2: CLD Hospital Discharges and Rates* by Race/Ethnicity and County, New Mexico, 2013-2017
Hospital Discharges Rates*
The number of hospitalizations for CLD can be used as a measure of the impact of CLD on the medical system and the need for care.Between 2013 to 2017, there were 8,170 hospitalizations reported by non-federal facilities. This equates to approximately 22.4hospitalizations for CLD every day in New Mexico.
For 2013-2017, McKinley County had the highest rate of CLD hospitalizations (157.2 hospitalizations per 100,000 population),followed by Rio Arriba (126.3 hospitalizations per 100,000 population), Cibola (121.3 hospitalizations per 100,000 population), andSierra (105.9 hospitalizations per 100,000 population). De Baca (0.0 hospitalizations per 100,000 population) and Eddy County (6.6hospitalizations per 100,000 population) had the lowest rates.
It is important to note that federal facilities (e.g. Indian Health Services and Veterans Administration) are not included in these results.

* All rates are per 100,000, age-adjusted to the 2000 US standard population
** Unstable rate due to small number of cases (<10)
Sources: NMDOH HIDD files and UNM-GPS population files (NM); SAES
New Mexico Substance Use Epidemiology Profile Page 17
CHRONIC LIVER DISEASE (CLD) HOSPITAL DISCHARGES (continued)
Chart 2: CLD Discharges Rates* by County, New Mexico, 2013-2017
157.2
126.3
121.3
105.9
103.5
101.4
99.6
94.7
88.2
84.5
84.2
83.3
81.3
76.2
73.7
73.5
72.4
65.2
64.4
59.5
59.2
54.4
47.4
39.9
38.9
38.4
35.9
33.6
27.7
26.3
17.9
17.1
6.6
0.0 20.0 40.0 60.0 80.0 100.0 120.0 140.0 160.0 180.0
McKinley (536; 6.6%)
Rio Arriba (256; 3.1%)
Cibola (172; 2.1%)
Sierra (68; 0.8%)
Luna (124; 1.5%)
Socorro (89; 1.1%)
San Miguel (145; 1.8%)
San Juan (601; 7.4%)
Valencia (346; 4.2%)
Santa Fe (685; 8.4%)
Taos (154; 1.9%)
Colfax (60; 0.7%)
Bernalillo (2,885; 35.3%)
New Mexico (8,170; 100.0%)
Dona Ana (744; 9.1%)
Sandoval (536; 6.6%)
Lincoln (80; 1.0%)
Union (17; 0.2%)
Mora (20; 0.2%)
Catron** (10; 0.1%)
Guadalupe (15; 0.2%)
Torrance (47; 0.6%)
Hidalgo (12; 0.1%)
Chaves (130; 1.6%)
Otero (125; 1.5%)
Curry (91; 1.1%)
Lea (116; 1.4%)
Harding** (3; 0.0%)
Quay (14; 0.2%)
Los Alamos (26; 0.3%)
Grant (28; 0.3%)
Roosevelt (15; 0.2%)
Eddy (19; 0.2%)
De Baca** (0; 0.0%)
Rate*
County (# hospital discharges; % State discharges)

* All rates are per 100,000, age-adjusted to the 2000 US standard population
Sources: NMDOH HIDD files and UNM-GPS population files; SAES
New Mexico Substance Use Epidemiology Profile Page 18
CHRONIC LIVER DISEASE (CLD) HOSPITAL DISCHARGES (continued)
Chart 3: Alcohol-Related CLD Discharges Rates* by County, New Mexico, 2013-2017
Chronic Liver Disease Hospitalizations(Rate per 100,000 population)

Problem Statement
Chart 1: Top 6 Leading Causes of Alcohol-Related Injury Death, New Mexico, 2013-2017
Sources: NMDOH BVRHS death files and UNM-GPS population files; CDC ARDI; SAES
Table 1: Alcohol-Related Injury Deaths and Rates* by Age, Sex, and Race/Ethnicity, New Mexico, 2013-2017
Ages Ages Ages All Ages Ages Ages All
Sex Race/Ethnicity 0-24 25-64 65+ Ages 0-24 25-64 65+ Ages*
Male American Indian 45 295 27 367 23.7 128.9 75.0 86.7
Asian/Pacific Islander 2 6 3 11 6.0 14.1 38.2 14.5
Black 7 37 3 47 14.9 55.0 24.8 36.9
Hispanic 171 635 110 915 16.2 52.2 45.5 39.2
White 64 472 246 781 12.9 43.9 53.4 35.3
Total 289 1,455 393 2,137 15.9 55.3 52.0 42.2
Female American Indian 18 88 15 120 9.3 35.1 28.1 25.6
Asian/Pacific Islander 1 3 1 4 2.4 4.8 7.2 4.5
Black 2 7 1 10 5.1 14.8 9.8 10.7
Hispanic 49 208 95 352 4.8 16.9 32.1 14.7
White 20 204 222 446 4.5 18.7 42.0 16.4
Total 90 511 335 936 5.2 19.1 37.2 16.7
Total American Indian 63 382 42 488 16.5 79.9 47.1 54.5
Asian/Pacific Islander 2 9 4 15 4.3 8.9 19.1 8.7
Black 9 44 4 57 10.4 38.3 17.3 25.9
Hispanic 220 842 204 1,267 10.6 34.4 38.1 26.9
White 84 676 468 1,228 8.9 31.2 47.3 25.9
Total 379 1,966 728 3,073 10.7 37.0 43.9 29.3
* Age-specific rates (e.g., Ages 0-24) are per 100,000; all-ages rate is per 100,000, age-adjusted to the 2000 US standard population
Sources: NMDOH BVRHS death files and UNM-GPS population files; CDC ARDI; SAES
New Mexico Substance Use Epidemiology Profile Page 19
ALCOHOL-RELATED INJURY DEATH
Deaths Rates*
** Rates are rolling 5-year average per 100,000, age-adjusted to the 2000 US standard population
* Rates reflect only alcohol-attributable portion of deaths from cause
Binge drinking (defined as having five drinks or more on an occasion for men and four drinks or more on an occasion forwomen) is a high-risk behavior associated with numerous injury outcomes, including motor vehicle fatalities, homicide, andsuicide. Since 1990, New Mexico’s death rate for alcohol-related (AR) injury has consistently been among the highest in thenation, ranging from 1.4 to 1.8 times the national rate. While NM’s alcohol-impaired motor vehicle crash fatality rates havedeclined almost 60% during this period, death rates from other AR injuries have increased. Chart 1 shows the top sixleading causes of alcohol-related injury death between 2013 and 2017 with AR poisoning (i.e. drug overdose) death rankingat number one. Since the early 1990s, the AR fall death rate peaked in 2007-09 and has declined since while AR poisoninghas continued to rise. During the period 2008-2017, AR poisoning deaths replaced AR motor vehicle crash deaths as theleading cause of alcohol-related injury death in New Mexico.
Table 1 shows that total death rates from AR injuries increase with age. However, there were substantially high numbersand rates of AR injury death in the lowest age category (ages 0-24) with especially high rates among American Indian andHispanic males. Deaths in this age category represent a very large burden of premature mortality (YPLL: Years of PotentialLife Lost).
6.3
5.9
5.0
4.6
3.5
2.4
0 5 10 15
Poisoning (not alcohol)
Motor-vehicle traffic crashes
Suicide
Fall injuries
Homicide
Alcohol poisoning
Rate**
Alcohol-related* deaths due to:
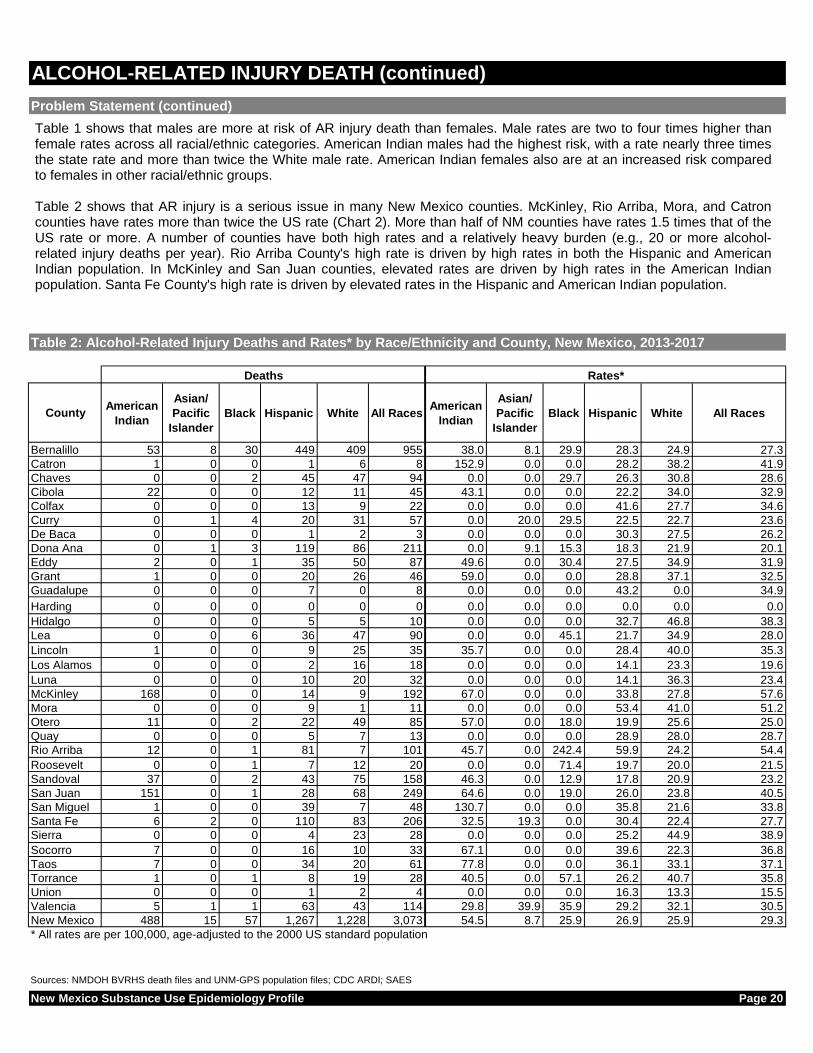
CountyAmerican
Indian
Asian/
Pacific
Islander
Black Hispanic White All RacesAmerican
Indian
Asian/
Pacific
Islander
Black Hispanic White All Races
Bernalillo 53 8 30 449 409 955 38.0 8.1 29.9 28.3 24.9 27.3
Catron 1 0 0 1 6 8 152.9 0.0 0.0 28.2 38.2 41.9
Chaves 0 0 2 45 47 94 0.0 0.0 29.7 26.3 30.8 28.6
Cibola 22 0 0 12 11 45 43.1 0.0 0.0 22.2 34.0 32.9
Colfax 0 0 0 13 9 22 0.0 0.0 0.0 41.6 27.7 34.6
Curry 0 1 4 20 31 57 0.0 20.0 29.5 22.5 22.7 23.6
De Baca 0 0 0 1 2 3 0.0 0.0 0.0 30.3 27.5 26.2
Dona Ana 0 1 3 119 86 211 0.0 9.1 15.3 18.3 21.9 20.1
Eddy 2 0 1 35 50 87 49.6 0.0 30.4 27.5 34.9 31.9
Grant 1 0 0 20 26 46 59.0 0.0 0.0 28.8 37.1 32.5
Guadalupe 0 0 0 7 0 8 0.0 0.0 0.0 43.2 0.0 34.9
Harding 0 0 0 0 0 0 0.0 0.0 0.0 0.0 0.0 0.0
Hidalgo 0 0 0 5 5 10 0.0 0.0 0.0 32.7 46.8 38.3
Lea 0 0 6 36 47 90 0.0 0.0 45.1 21.7 34.9 28.0
Lincoln 1 0 0 9 25 35 35.7 0.0 0.0 28.4 40.0 35.3
Los Alamos 0 0 0 2 16 18 0.0 0.0 0.0 14.1 23.3 19.6
Luna 0 0 0 10 20 32 0.0 0.0 0.0 14.1 36.3 23.4
McKinley 168 0 0 14 9 192 67.0 0.0 0.0 33.8 27.8 57.6
Mora 0 0 0 9 1 11 0.0 0.0 0.0 53.4 41.0 51.2
Otero 11 0 2 22 49 85 57.0 0.0 18.0 19.9 25.6 25.0
Quay 0 0 0 5 7 13 0.0 0.0 0.0 28.9 28.0 28.7
Rio Arriba 12 0 1 81 7 101 45.7 0.0 242.4 59.9 24.2 54.4
Roosevelt 0 0 1 7 12 20 0.0 0.0 71.4 19.7 20.0 21.5
Sandoval 37 0 2 43 75 158 46.3 0.0 12.9 17.8 20.9 23.2
San Juan 151 0 1 28 68 249 64.6 0.0 19.0 26.0 23.8 40.5
San Miguel 1 0 0 39 7 48 130.7 0.0 0.0 35.8 21.6 33.8
Santa Fe 6 2 0 110 83 206 32.5 19.3 0.0 30.4 22.4 27.7
Sierra 0 0 0 4 23 28 0.0 0.0 0.0 25.2 44.9 38.9
Socorro 7 0 0 16 10 33 67.1 0.0 0.0 39.6 22.3 36.8
Taos 7 0 0 34 20 61 77.8 0.0 0.0 36.1 33.1 37.1
Torrance 1 0 1 8 19 28 40.5 0.0 57.1 26.2 40.7 35.8
Union 0 0 0 1 2 4 0.0 0.0 0.0 16.3 13.3 15.5
Valencia 5 1 1 63 43 114 29.8 39.9 35.9 29.2 32.1 30.5
New Mexico 488 15 57 1,267 1,228 3,073 54.5 8.7 25.9 26.9 25.9 29.3
* All rates are per 100,000, age-adjusted to the 2000 US standard population
Sources: NMDOH BVRHS death files and UNM-GPS population files; CDC ARDI; SAES
New Mexico Substance Use Epidemiology Profile Page 20
Rates*
ALCOHOL-RELATED INJURY DEATH (continued)
Deaths
Problem Statement (continued)
Table 2: Alcohol-Related Injury Deaths and Rates* by Race/Ethnicity and County, New Mexico, 2013-2017
Table 1 shows that males are more at risk of AR injury death than females. Male rates are two to four times higher thanfemale rates across all racial/ethnic categories. American Indian males had the highest risk, with a rate nearly three timesthe state rate and more than twice the White male rate. American Indian females also are at an increased risk comparedto females in other racial/ethnic groups.
Table 2 shows that AR injury is a serious issue in many New Mexico counties. McKinley, Rio Arriba, Mora, and Catroncounties have rates more than twice the US rate (Chart 2). More than half of NM counties have rates 1.5 times that of theUS rate or more. A number of counties have both high rates and a relatively heavy burden (e.g., 20 or more alcohol-related injury deaths per year). Rio Arriba County's high rate is driven by high rates in both the Hispanic and AmericanIndian population. In McKinley and San Juan counties, elevated rates are driven by high rates in the American Indianpopulation. Santa Fe County's high rate is driven by elevated rates in the Hispanic and American Indian population.

* All rates are per 100,000, age-adjusted to the 2000 US standard population
Sources: NMDOH BVRHS death files and UNM-GPS population files (NM); NCHS death and population files (US); CDC ARDI; SAES
New Mexico Substance Use Epidemiology Profile Page 21
ALCOHOL-RELATED INJURY DEATH (continued)
Chart 2: Alcohol-Related Injury Death Rates* by County, New Mexico, 2013-2017
20.1
15.5
19.6
20.1
21.5
23.2
23.4
23.6
25.0
26.2
27.3
27.7
28.0
28.6
28.7
29.3
30.5
31.9
32.5
32.9
33.8
34.6
34.9
35.3
35.8
36.8
37.1
38.3
38.9
40.5
41.9
51.2
54.4
57.6
0 10 20 30 40 50 60 70
United States, 2016
Harding (0; 0.0%)
Union (4; 0.1%)
Los Alamos (18; 0.6%)
Dona Ana (211; 6.9%)
Roosevelt (20; 0.7%)
Sandoval (158; 5.2%)
Luna (32; 1.0%)
Curry (57; 1.8%)
Otero (85; 2.8%)
De Baca (3; 0.1%)
Bernalillo (955; 31.1%)
Santa Fe (206; 6.7%)
Lea (90; 2.9%)
Chaves (94; 3.1%)
Quay (13; 0.4%)
New Mexico (3073; 100.0%)
Valencia (114; 3.7%)
Eddy (87; 2.8%)
Grant (46; 1.5%)
Cibola (45; 1.5%)
San Miguel (48; 1.6%)
Colfax (22; 0.7%)
Guadalupe (8; 0.2%)
Lincoln (35; 1.1%)
Torrance (28; 0.9%)
Socorro (33; 1.1%)
Taos (61; 2.0%)
Hidalgo (10; 0.3%)
Sierra (28; 0.9%)
San Juan (249; 8.1%)
Catron (8; 0.2%)
Mora (11; 0.3%)
Rio Arriba (101; 3.3%)
McKinley (192; 6.2%)
Rate*
County (# of deaths; % of statewide deaths)

* All rates are per 100,000, age-adjusted to the 2000 US standard population
Sources: NMDOH BVRHS death files and UNM-GPS population files; CDC ARDI; SAES
New Mexico Substance Use Epidemiology Profile Page 22
ALCOHOL-RELATED INJURY DEATH (continued)
Chart 3: Alcohol-Related Injury Death Rates* by County, New Mexico, 2013-2017
Alcohol-Related Injury Deaths(Rate per 100,000 population)

ALCOHOL-RELATED MOTOR VEHICLE TRAFFIC CRASH (MVTC) DEATH
Source: National Highway Traffic Safety Administration (NHTSA) Fatality Analysis Reporting System (FARS); NCHS (population)
Ages Ages Ages All Ages Ages Ages AllSex Race/Ethnicity 0-24 25-64 65+ Ages 0-24 25-64 65+ Ages*
Male American Indian 22 87 2 112 11.6 38.2 5.9 24.4Asian/Pacific Islander 1 0 0 1 2.3 0.0 0.0 1.9Black 2 6 1 9 3.6 9.6 5.2 7.0Hispanic 56 140 6 201 5.3 11.5 2.5 8.1White 21 97 11 129 4.3 9.0 2.3 6.6Total 101 332 20 453 5.6 12.6 2.6 9.0
Female American Indian 9 32 1 42 4.6 13.0 1.5 8.5Asian/Pacific Islander 0 0 0 0 0.0 0.0 0.0 0.0Black 1 1 0 3 2.5 3.0 0.0 2.7Hispanic 21 39 2 62 2.1 3.2 0.6 2.5White 7 21 4 32 1.5 2.0 0.7 1.7Total 38 95 6 139 2.2 3.5 0.7 2.8
Total American Indian 31 120 3 154 8.1 25.0 3.3 16.2Asian/Pacific Islander 1 1 0 2 1.2 0.7 0.0 1.0Black 3 8 1 11 3.1 6.9 2.9 5.2Hispanic 77 179 8 263 3.7 7.3 1.5 5.3White 28 118 14 161 3.0 5.4 1.5 4.2Total 139 427 26 592 3.9 8.0 1.6 5.9
* Age-specific rates (e.g., Ages 0-24) per 100,000 population; all-ages rate per 100,000 population, age-adjusted to 2000 US standard population1 Alcohol-related motor vehicle traffic crash (AR-MVTC) deaths estimated based on CDC ARDI alcohol-attributable fractions (BAC>=0.10)
Sources: NMDOH BVRHS death files and UNM-GPS population files; CDC ARDI; SAES
New Mexico Substance Use Epidemiology Profile Page 23
Deaths Rates*
Problem Statement
Chart 1: Alcohol-Impaired MVTC Fatality Rates*, New Mexico and United States, 1982-2017
Table 1: Alcohol-Related MVTC Deaths/Rates1,2
by Age, Sex, and Race/Ethnicity, New Mexico, 2013-2017
0
5
10
15
20
25
0.0
0.5
1.0
1.5
2.0
2.5
1982
1983
1984
1985
1986
1987
1988
1989
1990
1991
1992
1993
1994
1995
1996
1997
1998
1999
2000
2001
2002
2003
2004
2005
2006
2007
2008
2009
2010
2011
2012
2013
2014
2015
2016
2017
Rate
per
100,0
00 p
ers
on
s
Ra
te p
er
100
mil
lio
n v
eh
icle
mil
es
tr
av
ele
d (
VM
T)
Year
New Mexico(per 100M VMT)
United States(per 100M VMT)
New Mexico(per 100K population)
* Deaths in motor vehicle traffic crashes with highest driver blood alcohol content (BAC) >= 0.08; rates are crude rates per 100 million vehicle miles traveled (VMT) (NM and US through 2016); and per 100,000 population (NM through 2017)
Alcohol-related motor vehicle traffic crash (AR-MVTC) death has historically been the leading cause of alcohol-related injury deathuntil being surpassed by poisoning (i.e. AR drug overdose). AR-MVTC deaths provide a hopeful example of a substance-relatedhealth outcome that has been successfully reduced by using a public health approach, both nationally and in New Mexico. From1982 through 2010, in response to a wide range of policy and preventive interventions, New Mexico's alcohol-impaired motorvehicle traffic crash (AI-MVTC) fatality rate declined more dramatically than the US rate, decreasing 83% and dropping NewMexico from first to tenth among states in AI-MVTC fatalities per 100,000 population. In terms of deaths per 100 million vehiclemiles traveled (VMT), New Mexico's AI-MVTC fatality rate in 2016 (0.43) was about one-sixth what it was in 1982 (2.4).Furthermore, a comprehensive AR-MVTC prevention campaign in place from 2005-2009 was successful in reinitiating ratedecreases that had been stalled since the late 1990s. From 2004 to 2012, New Mexico's AI-MVTC fatality rate per 100 millionVMT dropped 42%. Rates increased slightly in 2014 and dropped back in 2015.
2 These death counts/rates are estimates. They do not equal the actual deaths/rates reported in Charts 1-3 based on FARS. ARDI-based deaths/rates are
included here to describe the demographic distribution of AR-MVTC deaths, which is not available from FARS.
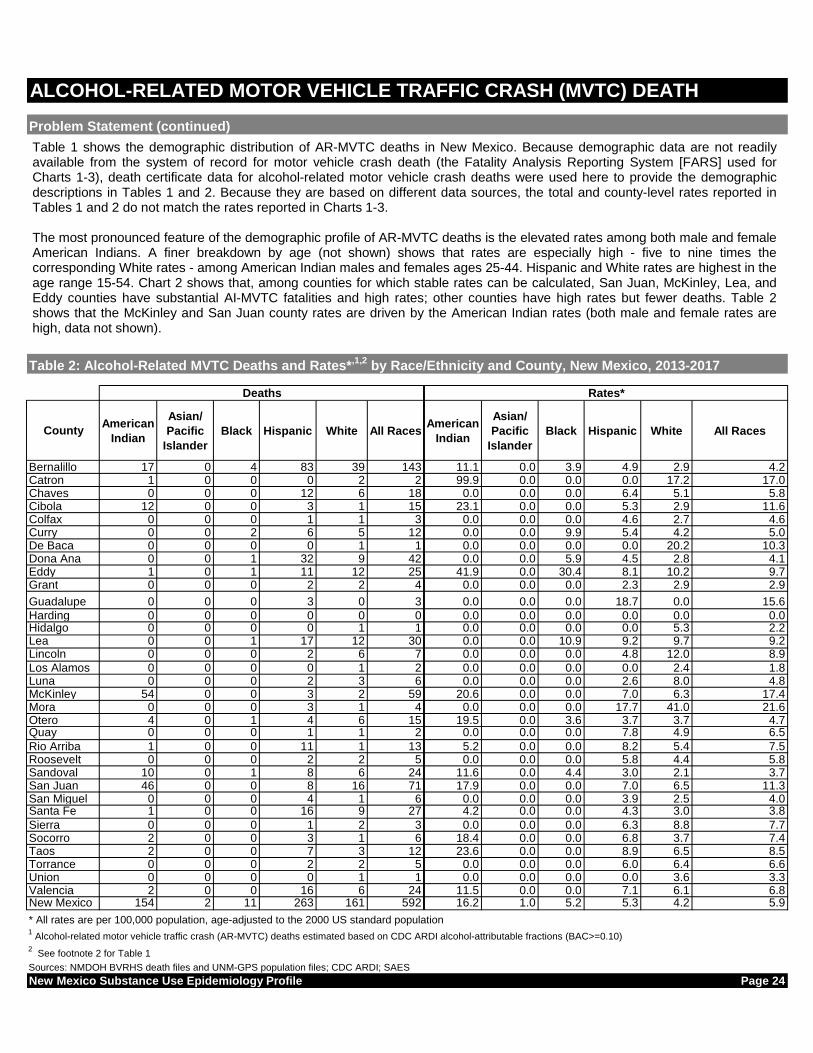
CountyAmerican
Indian
Asian/
Pacific
Islander
Black Hispanic White All RacesAmerican
Indian
Asian/
Pacific
Islander
Black Hispanic White All Races
Bernalillo 17 0 4 83 39 143 11.1 0.0 3.9 4.9 2.9 4.2Catron 1 0 0 0 2 2 99.9 0.0 0.0 0.0 17.2 17.0Chaves 0 0 0 12 6 18 0.0 0.0 0.0 6.4 5.1 5.8Cibola 12 0 0 3 1 15 23.1 0.0 0.0 5.3 2.9 11.6Colfax 0 0 0 1 1 3 0.0 0.0 0.0 4.6 2.7 4.6Curry 0 0 2 6 5 12 0.0 0.0 9.9 5.4 4.2 5.0De Baca 0 0 0 0 1 1 0.0 0.0 0.0 0.0 20.2 10.3Dona Ana 0 0 1 32 9 42 0.0 0.0 5.9 4.5 2.8 4.1Eddy 1 0 1 11 12 25 41.9 0.0 30.4 8.1 10.2 9.7Grant 0 0 0 2 2 4 0.0 0.0 0.0 2.3 2.9 2.9
Guadalupe 0 0 0 3 0 3 0.0 0.0 0.0 18.7 0.0 15.6
Harding 0 0 0 0 0 0 0.0 0.0 0.0 0.0 0.0 0.0Hidalgo 0 0 0 0 1 1 0.0 0.0 0.0 0.0 5.3 2.2Lea 0 0 1 17 12 30 0.0 0.0 10.9 9.2 9.7 9.2Lincoln 0 0 0 2 6 7 0.0 0.0 0.0 4.8 12.0 8.9
Los Alamos 0 0 0 0 1 2 0.0 0.0 0.0 0.0 2.4 1.8Luna 0 0 0 2 3 6 0.0 0.0 0.0 2.6 8.0 4.8McKinley 54 0 0 3 2 59 20.6 0.0 0.0 7.0 6.3 17.4Mora 0 0 0 3 1 4 0.0 0.0 0.0 17.7 41.0 21.6Otero 4 0 1 4 6 15 19.5 0.0 3.6 3.7 3.7 4.7Quay 0 0 0 1 1 2 0.0 0.0 0.0 7.8 4.9 6.5
Rio Arriba 1 0 0 11 1 13 5.2 0.0 0.0 8.2 5.4 7.5Roosevelt 0 0 0 2 2 5 0.0 0.0 0.0 5.8 4.4 5.8Sandoval 10 0 1 8 6 24 11.6 0.0 4.4 3.0 2.1 3.7San Juan 46 0 0 8 16 71 17.9 0.0 0.0 7.0 6.5 11.3San Miguel 0 0 0 4 1 6 0.0 0.0 0.0 3.9 2.5 4.0Santa Fe 1 0 0 16 9 27 4.2 0.0 0.0 4.3 3.0 3.8
Sierra 0 0 0 1 2 3 0.0 0.0 0.0 6.3 8.8 7.7Socorro 2 0 0 3 1 6 18.4 0.0 0.0 6.8 3.7 7.4Taos 2 0 0 7 3 12 23.6 0.0 0.0 8.9 6.5 8.5Torrance 0 0 0 2 2 5 0.0 0.0 0.0 6.0 6.4 6.6Union 0 0 0 0 1 1 0.0 0.0 0.0 0.0 3.6 3.3Valencia 2 0 0 16 6 24 11.5 0.0 0.0 7.1 6.1 6.8New Mexico 154 2 11 263 161 592 16.2 1.0 5.2 5.3 4.2 5.9
* All rates are per 100,000 population, age-adjusted to the 2000 US standard population1 Alcohol-related motor vehicle traffic crash (AR-MVTC) deaths estimated based on CDC ARDI alcohol-attributable fractions (BAC>=0.10)
2 See footnote 2 for Table 1
Sources: NMDOH BVRHS death files and UNM-GPS population files; CDC ARDI; SAES
New Mexico Substance Use Epidemiology Profile Page 24
ALCOHOL-RELATED MOTOR VEHICLE TRAFFIC CRASH (MVTC) DEATH
Problem Statement (continued)
Deaths Rates*
Table 2: Alcohol-Related MVTC Deaths and Rates*,1,2
by Race/Ethnicity and County, New Mexico, 2013-2017
Table 1 shows the demographic distribution of AR-MVTC deaths in New Mexico. Because demographic data are not readilyavailable from the system of record for motor vehicle crash death (the Fatality Analysis Reporting System [FARS] used forCharts 1-3), death certificate data for alcohol-related motor vehicle crash deaths were used here to provide the demographicdescriptions in Tables 1 and 2. Because they are based on different data sources, the total and county-level rates reported inTables 1 and 2 do not match the rates reported in Charts 1-3.
The most pronounced feature of the demographic profile of AR-MVTC deaths is the elevated rates among both male and femaleAmerican Indians. A finer breakdown by age (not shown) shows that rates are especially high - five to nine times thecorresponding White rates - among American Indian males and females ages 25-44. Hispanic and White rates are highest in theage range 15-54. Chart 2 shows that, among counties for which stable rates can be calculated, San Juan, McKinley, Lea, andEddy counties have substantial AI-MVTC fatalities and high rates; other counties have high rates but fewer deaths. Table 2shows that the McKinley and San Juan county rates are driven by the American Indian rates (both male and female rates arehigh, data not shown).

* All rates are crude per 100,000 population1
Alcohol-impaired MVTC deaths are from FARS (highest driver BAC >=0.08); NM population from GPS, US population from NCHS
2 Numerator (deaths) based on county of occurence; denominator (population) based on county of residence
Source: National Highway Traffic Safety Administration (NHTSA) Fatality Analysis Reporting System (FARS); NCHS (US population); GPS (NM population)
New Mexico Substance Use Epidemiology Profile Page 25
ALCOHOL-RELATED MOTOR VEHICLE TRAFFIC CRASH (MVTC) DEATH
Chart 2: Alcohol-Impaired MVTC Fatality Rates*,1,2
by County, New Mexico, 2013-2017
3.9
1.8
2.2
2.9
3.3
3.7
3.8
4.0
4.1
4.2
4.6
4.7
4.8
5.0
5.8
5.8
5.9
6.5
6.6
6.8
7.4
7.5
7.7
8.5
8.9
9.2
9.7
10.3
11.3
11.6
15.6
17.0
17.4
21.6
0 5 10 15 20 25
United States, 2016
Harding (0; 0%)
Los Alamos (2; 0.3%)
Hidalgo (1; 0.1%)
Grant (4; 0.6%)
Union (1; 0.1%)
Sandoval (24; 4.1%)
Santa Fe (27; 4.5%)
San Miguel (6; 1%)
Dona Ana (42; 7.2%)
Bernalillo (143; 24.2%)
Colfax (3; 0.5%)
Otero (15; 2.6%)
Luna (6; 1%)
Curry (12; 2.1%)
Chaves (18; 3.1%)
Roosevelt (5; 0.9%)
New Mexico (592; 100%)
Quay (2; 0.4%)
Torrance (5; 0.8%)
Valencia (24; 4.1%)
Socorro (6; 1%)
Rio Arriba (13; 2.2%)
Sierra (3; 0.6%)
Taos (12; 2%)
Lincoln (7; 1.2%)
Lea (30; 5%)
Eddy (25; 4.3%)
De Baca (1; 0.2%)
San Juan (71; 11.9%)
Cibola (15; 2.6%)
Guadalupe (3; 0.5%)
Catron (2; 0.4%)
McKinley (59; 10%)
Mora (4; 0.7%)
Rate*
County (# of deaths; % of statewide deaths)

New Mexico Substance Use Epidemiology Profile Page 26
ALCOHOL-RELATED MOTOR VEHICLE TRAFFIC CRASH (MVTC) DEATH
Chart 3: Alcohol-Impaired MVTC Fatality Rates1,2
by County, New Mexico, 2013-2017
* All rates are crude per 100,000 population1 Alcohol-impaired MVTC deaths are from FARS (highest driver BAC >=0.08); NM population from GPS, US population from NCHS2 Numerator (deaths) based on county of occurence; denominator (population) based on county of residenceSource: National Highway Traffic Safety Administration (NHTSA) Fatality Analysis Reporting System (FARS); NCHS (US population); GPS (NM population)
Alcohol-Impaired Motor Vehicle Traffic Crash Fatality(Rate per 100,000 population)
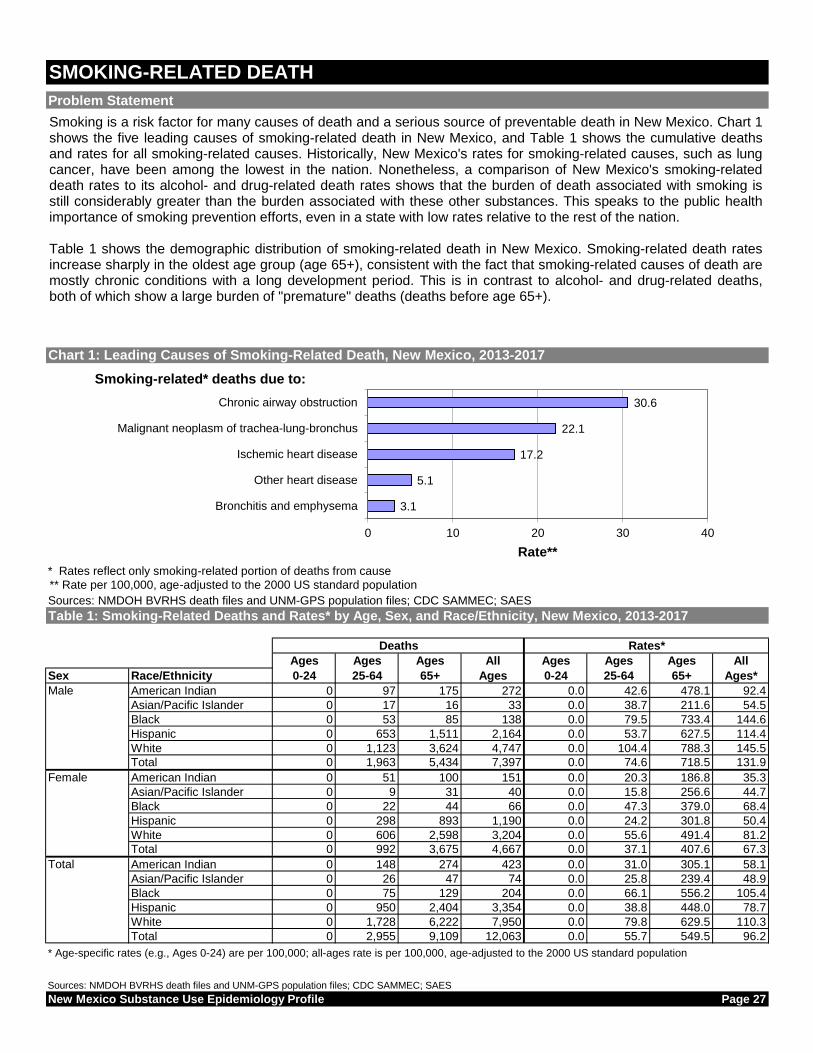
SMOKING-RELATED DEATH
Sources: NMDOH BVRHS death files and UNM-GPS population files; CDC SAMMEC; SAES
Ages Ages Ages All Ages Ages Ages All
Sex Race/Ethnicity 0-24 25-64 65+ Ages 0-24 25-64 65+ Ages*
Male American Indian 0 97 175 272 0.0 42.6 478.1 92.4
Asian/Pacific Islander 0 17 16 33 0.0 38.7 211.6 54.5
Black 0 53 85 138 0.0 79.5 733.4 144.6
Hispanic 0 653 1,511 2,164 0.0 53.7 627.5 114.4
White 0 1,123 3,624 4,747 0.0 104.4 788.3 145.5
Total 0 1,963 5,434 7,397 0.0 74.6 718.5 131.9
Female American Indian 0 51 100 151 0.0 20.3 186.8 35.3
Asian/Pacific Islander 0 9 31 40 0.0 15.8 256.6 44.7
Black 0 22 44 66 0.0 47.3 379.0 68.4
Hispanic 0 298 893 1,190 0.0 24.2 301.8 50.4
White 0 606 2,598 3,204 0.0 55.6 491.4 81.2
Total 0 992 3,675 4,667 0.0 37.1 407.6 67.3
Total American Indian 0 148 274 423 0.0 31.0 305.1 58.1
Asian/Pacific Islander 0 26 47 74 0.0 25.8 239.4 48.9
Black 0 75 129 204 0.0 66.1 556.2 105.4
Hispanic 0 950 2,404 3,354 0.0 38.8 448.0 78.7
White 0 1,728 6,222 7,950 0.0 79.8 629.5 110.3
Total 0 2,955 9,109 12,063 0.0 55.7 549.5 96.2
* Age-specific rates (e.g., Ages 0-24) are per 100,000; all-ages rate is per 100,000, age-adjusted to the 2000 US standard population
Sources: NMDOH BVRHS death files and UNM-GPS population files; CDC SAMMEC; SAES
New Mexico Substance Use Epidemiology Profile Page 27
Problem Statement
Chart 1: Leading Causes of Smoking-Related Death, New Mexico, 2013-2017
Table 1: Smoking-Related Deaths and Rates* by Age, Sex, and Race/Ethnicity, New Mexico, 2013-2017
Deaths Rates*
30.6
22.1
17.2
5.1
3.1
0 10 20 30 40
Chronic airway obstruction
Malignant neoplasm of trachea-lung-bronchus
Ischemic heart disease
Other heart disease
Bronchitis and emphysema
Rate**
** Rate per 100,000, age-adjusted to the 2000 US standard population
* Rates reflect only smoking-related portion of deaths from cause
Smoking-related* deaths due to:
Smoking is a risk factor for many causes of death and a serious source of preventable death in New Mexico. Chart 1shows the five leading causes of smoking-related death in New Mexico, and Table 1 shows the cumulative deathsand rates for all smoking-related causes. Historically, New Mexico's rates for smoking-related causes, such as lungcancer, have been among the lowest in the nation. Nonetheless, a comparison of New Mexico's smoking-relateddeath rates to its alcohol- and drug-related death rates shows that the burden of death associated with smoking isstill considerably greater than the burden associated with these other substances. This speaks to the public healthimportance of smoking prevention efforts, even in a state with low rates relative to the rest of the nation.
Table 1 shows the demographic distribution of smoking-related death in New Mexico. Smoking-related death ratesincrease sharply in the oldest age group (age 65+), consistent with the fact that smoking-related causes of death aremostly chronic conditions with a long development period. This is in contrast to alcohol- and drug-related deaths,both of which show a large burden of "premature" deaths (deaths before age 65+).

CountyAmerican
Indian
Asian/
Pacific
Islander
Black Hispanic White All RacesAmerican
Indian
Asian/
Pacific
Islander
Black Hispanic White All Races
Bernalillo 60 44 96 1,084 2,295 3,607 74.2 54.2 114.3 82.3 99.6 93.4
Catron 1 0 0 5 31 37 76.1 0.0 0.0 70.9 86.6 81.4
Chaves 3 1 7 112 387 510 106.1 46.7 101.1 85.0 155.6 129.5
Cibola 26 0 1 43 75 145 46.4 0.0 40.6 88.8 145.1 93.0
Colfax 1 0 0 40 70 112 61.7 0.0 0.0 98.1 98.6 101.2
Curry 2 1 17 59 237 315 109.4 18.7 155.0 102.5 145.1 132.6
De Baca 0 0 0 4 24 28 0.0 0.0 0.0 65.4 193.3 152.3
Dona Ana 5 4 14 373 600 1,000 69.2 46.0 95.6 64.8 108.6 85.3
Eddy 1 2 5 83 361 454 41.1 101.1 108.3 82.0 169.0 139.0
Grant 1 0 2 72 160 236 108.3 0.0 110.0 75.0 104.3 92.6
Guadalupe 0 0 0 24 10 35 0.0 0.0 0.0 101.4 178.7 115.3
Harding 0 0 0 3 2 5 0.0 0.0 0.0 101.1 99.9 99.8
Hidalgo 0 0 0 10 28 38 0.0 0.0 0.0 57.9 151.4 104.6
Lea 2 0 17 70 328 420 86.5 0.0 129.9 73.9 170.5 136.0
Lincoln 4 0 0 22 149 175 277.6 0.0 0.0 72.3 103.5 97.4
Los Alamos 0 1 1 5 63 69 0.0 36.8 47.2 35.3 58.9 54.7
Luna 2 1 1 61 197 262 110.1 45.3 80.2 84.2 207.4 146.1
McKinley 131 1 0 32 58 221 60.4 27.8 0.0 71.8 99.0 68.2
Mora 0 0 0 21 5 26 0.0 0.0 0.0 67.7 41.6 62.0
Otero 13 4 12 63 385 479 98.2 88.4 110.0 66.1 138.8 118.2
Quay 1 1 0 26 77 105 98.8 119.6 0.0 129.1 152.1 142.0
Rio Arriba 14 0 1 140 56 211 54.2 0.0 73.0 81.2 104.2 82.8
Roosevelt 2 0 0 20 104 127 243.1 0.0 0.0 83.5 136.8 126.2
Sandoval 37 4 11 123 488 666 56.3 36.9 62.5 66.5 93.1 83.4
San Juan 85 2 5 61 443 597 45.4 51.4 125.8 74.2 111.2 88.5
San Miguel 1 3 1 140 66 211 561.8 174.3 48.9 100.6 116.8 105.1
Santa Fe 7 3 3 281 437 735 47.8 28.9 66.0 77.0 66.4 69.9
Sierra 2 0 1 22 219 245 129.6 0.0 128.7 104.9 198.1 179.7
Socorro 6 0 0 40 67 114 82.1 0.0 0.0 84.0 120.2 102.7
Taos 5 0 1 91 74 172 39.4 0.0 54.3 70.7 57.6 64.0
Torrance 3 0 2 38 106 150 135.8 0.0 194.8 118.3 148.5 139.1
Union 0 0 0 11 21 32 0.0 0.0 0.0 127.1 88.7 96.9
Valencia 10 1 8 175 324 522 85.8 47.1 166.6 82.6 141.2 113.3
New Mexico 423 74 204 3,354 7,950 12,063 58.1 48.9 105.4 78.7 110.3 96.2
* All rates are per 100,000, age-adjusted to the 2000 US standard population
Sources: NMDOH BVRHS death files and UNM-GPS population files; CDC SAMMEC; SAES
New Mexico Substance Use Epidemiology Profile Page 28
SMOKING-RELATED DEATH (continued)
Problem Statement (continued)
Table 2: Smoking-Related Deaths and Rates* by Race/Ethnicity and County, New Mexico, 2013-2017
Deaths Rates*
Table 1 also shows that male rates are roughly 2-3 times higher than female rates across all racial/ethnic groups except forAsian/Pacific Islanders. Among males and females, Whites have the highest rates followed by Blacks.
Table 2 and Chart 2 show that the counties with the highest rates are Sierra, De Baca, Luna, Quay, and Torrance. The highrates in most of these counties (and in the state overall) are driven by high rates among Whites. However, there are notablyelevated rates among Hispanics in Quay, Sierra, Union, and Curry counties and a substantial burden of smoking-relateddeath among Hispanics in several other counties (e.g., Bernalillo, Dona Ana, and Santa Fe). The high rates of smoking-related death among Blacks in Bernalillo, Curry, Dona Ana, Lea, and Otero counties are also notable. The smoking-relateddeath rates among the American Indian and Asian/Pacific Islander populations are relatively low.
NOTE: These tables are based on the Centers for Disease Control and Prevention Smoking Attributable Mortality, Morbidity,and Economic Costs (SAMMEC) methodology. However, CDC's SAMMEC site reports age-adjusted rates based on the age35+ population; whereas this report calculates age-adjusted rates for the entire population. As a result, the smoking-attributable mortality rates reported here are lower than those reported by the CDC's SAMMEC site.
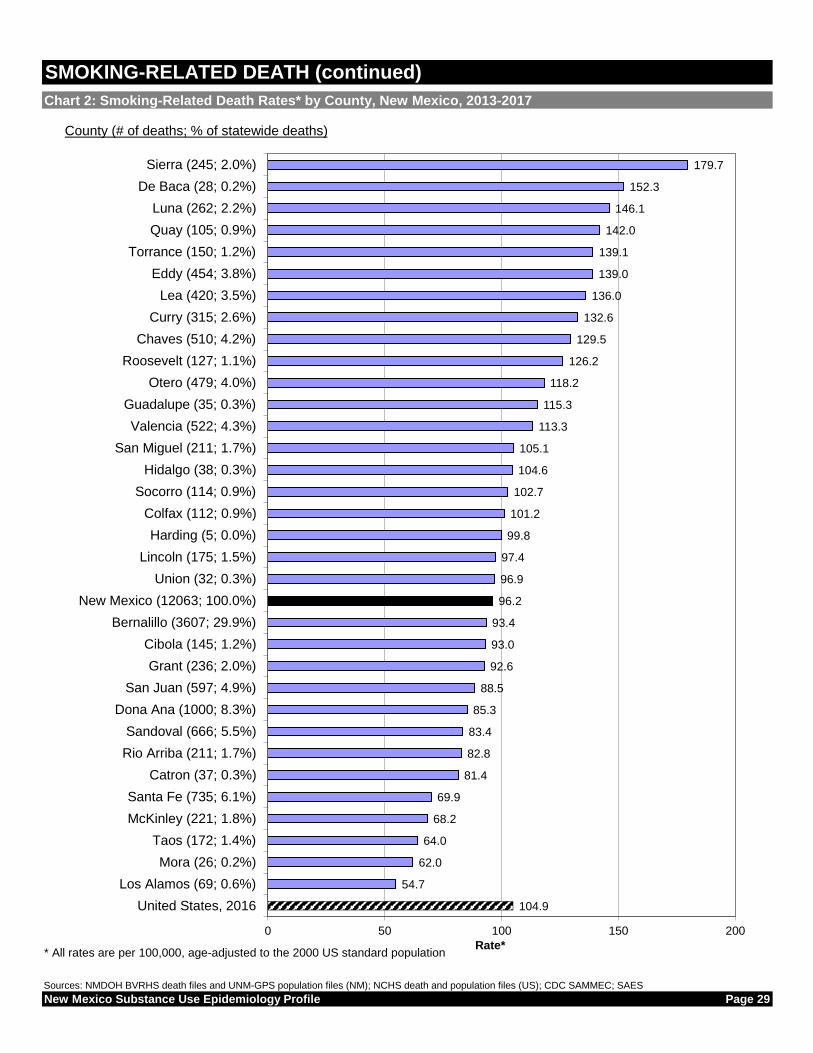
* All rates are per 100,000, age-adjusted to the 2000 US standard population
Sources: NMDOH BVRHS death files and UNM-GPS population files (NM); NCHS death and population files (US); CDC SAMMEC; SAES
New Mexico Substance Use Epidemiology Profile Page 29
SMOKING-RELATED DEATH (continued)
Chart 2: Smoking-Related Death Rates* by County, New Mexico, 2013-2017
104.9
54.7
62.0
64.0
68.2
69.9
81.4
82.8
83.4
85.3
88.5
92.6
93.0
93.4
96.2
96.9
97.4
99.8
101.2
102.7
104.6
105.1
113.3
115.3
118.2
126.2
129.5
132.6
136.0
139.0
139.1
142.0
146.1
152.3
179.7
0 50 100 150 200
United States, 2016
Los Alamos (69; 0.6%)
Mora (26; 0.2%)
Taos (172; 1.4%)
McKinley (221; 1.8%)
Santa Fe (735; 6.1%)
Catron (37; 0.3%)
Rio Arriba (211; 1.7%)
Sandoval (666; 5.5%)
Dona Ana (1000; 8.3%)
San Juan (597; 4.9%)
Grant (236; 2.0%)
Cibola (145; 1.2%)
Bernalillo (3607; 29.9%)
New Mexico (12063; 100.0%)
Union (32; 0.3%)
Lincoln (175; 1.5%)
Harding (5; 0.0%)
Colfax (112; 0.9%)
Socorro (114; 0.9%)
Hidalgo (38; 0.3%)
San Miguel (211; 1.7%)
Valencia (522; 4.3%)
Guadalupe (35; 0.3%)
Otero (479; 4.0%)
Roosevelt (127; 1.1%)
Chaves (510; 4.2%)
Curry (315; 2.6%)
Lea (420; 3.5%)
Eddy (454; 3.8%)
Torrance (150; 1.2%)
Quay (105; 0.9%)
Luna (262; 2.2%)
De Baca (28; 0.2%)
Sierra (245; 2.0%)
Rate*
County (# of deaths; % of statewide deaths)

* All rates are per 100,000, age-adjusted to the 2000 US standard population
Sources: NMDOH BVRHS death files and UNM-GPS population files; CDC SAMMEC; SAES
New Mexico Substance Use Epidemiology Profile Page 30
SMOKING-RELATED DEATH (continued)
Chart 3: Smoking-Related Death Rates* by County, New Mexico, 2013-2017
Smoking-Related Deaths(Rate per 100,000 population)

DRUG OVERDOSE DEATH
* Cause categories based on ICD-10 codes for drug overdose deaths.
Ages Ages Ages All Ages Ages Ages All
Sex Race/Ethnicity 0-24 25-64 65+ Ages 0-24 25-64 65+ Ages*
Male American Indian 5 77 0 82 2.6 33.7 0.0 19.3
Asian/Pacific Islander 1 5 0 6 3.8 11.2 0.0 6.9
Black 3 34 1 38 6.4 50.9 8.6 29.9
Hispanic 89 750 24 863 8.4 61.6 10.0 36.6
White 41 459 33 533 8.3 42.7 7.2 27.1
Total 139 1,338 61 1,538 7.7 50.8 8.1 31.1
Female American Indian 3 41 2 46 1.6 16.4 3.7 9.9
Asian/Pacific Islander 1 2 0 3 3.9 3.5 0.0 3.1
Black 3 13 0 16 7.5 27.5 0.0 16.8
Hispanic 37 351 12 400 3.6 28.5 4.1 16.8
White 17 391 51 459 3.8 35.9 9.6 21.2Total 61 805 66 932 3.5 30.1 7.3 18.0
Total American Indian 8 118 2 128 2.1 24.7 2.2 14.5
Asian/Pacific Islander 2 7 0 9 3.9 6.9 0.0 4.8
Black 6 47 1 54 6.9 41.2 4.3 24.5
Hispanic 126 1,101 36 1,263 6.1 45.0 6.7 26.7
White 58 850 84 992 6.1 39.3 8.5 24.3
Total 200 2,143 127 2,470 5.6 40.4 7.7 24.6
Sources: NMDOH BVRHS death files and UNM-GPS population files; SAES
New Mexico Substance Use Epidemiology Profile Page 31
* Age-specific rates (e.g., Ages 0-24) are per 100,000; all-ages rate is per 100,000, age-adjusted to the 2000 US standard population
Table 1: Drug Overdose Deaths and Rates* by Age, Sex, and Race/Ethnicity, New Mexico, 2013-2017
Deaths Rates*
Chart 1: Drug Related Death Rates* by Cause Category, New Mexico, 2001-2017
Problem Statement
In 2017, New Mexico had the seventeenth highest total drug overdose death rate in the nation. Drug use can result in overdosedeath and is also associated with other societal problems including crime, violence, homelessness, loss of productivity, and spreadof blood-borne diseases such as HIV and hepatitis. Unintentional drug overdose is the largest subset of total drug overdose death,accounting for 88% of drug overdose deaths in New Mexico in 2017 (Chart 1). The other substantial cause of drug overdose deathis suicide, or intentional self-poisoning, which accounts for 11%. Poisoning has been the leading cause of unintentional injury inNew Mexico since 2007, surpassing motor vehicle crash deaths, largely as a result of increased unintentional drug overdose deathsassociated with prescription drug use.
Unintentional drug overdoses account for almost 88% of drug overdose deaths during 2013-2017. 36% of unintentional drugoverdose deaths were caused by prescription drugs, while 40% were caused by illicit drugs, and 22% involved both. Vital recordsdeath data indicate that the most common drugs causing unintentional overdose death for the period covered in this report wereprescription opioids (i.e., methadone, oxycodone, morphine; 57%), heroin (40%), benzodiazepines (24%), cocaine (13%), andmethamphetamine (26%) (not mutually exclusive). In New Mexico and nationally, overdose death from prescription opioids hasbecome an issue of enormous concern. Interventions are currently being formulated, implemented, and assessed in New Mexicoand in communities across the country, and may be contributing to decreases in death in the most recent data available.
0.0
5.0
10.0
15.0
20.0
25.0
30.0
Rate
*
Year
Unintentional
Intent undetermined
Suicide
* Rate per 100,000, age-adjusted to the 2000 US standard population

CountyAmerican
Indian
Asian/
Pacific
Islander
Black Hispanic White All RacesAmerican
Indian
Asian/
Pacific
Islander
Black Hispanic White All Races
Bernalillo 34 4 30 475 352 902 21.6 4.0 30.3 29.1 24.2 26.3
Catron 0 0 0 0 3 3 0.0 0.0 0.0 0.0 40.9 29.5Chaves 1 1 2 26 39 69 39.3 40.1 39.8 16.4 29.5 22.9
Cibola 4 0 0 10 9 23 8.4 0.0 0.0 19.7 26.5 16.8
Colfax 0 0 0 14 8 22 0.0 0.0 0.0 51.4 24.1 38.5
Curry 1 0 1 11 23 36 42.2 0.0 9.2 12.2 18.8 15.4De Baca 0 0 0 2 0 2 0.0 0.0 0.0 84.8 0.0 34.4
Dona Ana 0 1 5 92 63 164 0.0 5.5 24.1 14.0 22.9 17.0
Eddy 1 0 0 16 45 62 26.6 0.0 0.0 12.0 34.5 23.0
Grant 0 0 0 23 25 48 0.0 0.0 0.0 39.0 46.7 41.5
Guadalupe 0 0 0 9 1 10 0.0 0.0 0.0 56.1 14.6 44.9
Harding 0 0 0 0 0 0 0.0 0.0 0.0 0.0 0.0 0.0
Hidalgo 0 0 0 3 5 9 0.0 0.0 0.0 26.6 55.1 41.0
Lea 0 0 6 15 40 61 0.0 0.0 41.8 8.1 32.9 18.8
Lincoln 0 0 0 13 22 35 0.0 0.0 0.0 43.2 45.5 42.7
Los Alamos 0 0 0 5 11 16 0.0 0.0 0.0 37.7 19.9 20.5
Luna 0 0 0 7 12 19 0.0 0.0 0.0 10.8 41.0 19.2
McKinley 22 0 1 11 6 40 9.5 0.0 48.5 25.2 21.9 12.6
Mora 0 0 0 2 0 2 0.0 0.0 0.0 15.8 0.0 13.5
Otero 3 0 3 16 42 64 13.8 0.0 29.0 14.5 24.5 20.0
Quay 0 0 0 5 4 9 0.0 0.0 0.0 25.2 23.2 21.2
Rio Arriba 10 0 0 143 4 158 37.2 0.0 0.0 111.8 22.7 89.9
Roosevelt 0 0 1 3 7 11 0.0 0.0 103.8 8.4 14.0 12.1
Sandoval 13 1 2 48 62 129 17.3 10.6 13.3 18.7 20.7 19.6
San Juan 26 0 2 17 57 103 11.4 0.0 47.6 16.7 20.0 16.7
San Miguel 0 0 0 50 3 53 0.0 0.0 0.0 53.4 7.4 44.9
Santa Fe 6 2 0 139 67 219 33.1 17.0 0.0 37.9 23.0 32.5Sierra 1 0 0 2 14 17 130.3 0.0 0.0 11.0 37.2 29.5
Socorro 1 0 0 12 2 15 9.7 0.0 0.0 32.3 4.6 19.6
Taos 3 0 0 23 15 42 37.3 0.0 0.0 28.8 26.9 29.2
Torrance 1 0 0 11 11 23 44.6 0.0 0.0 36.0 25.9 29.6
Union 0 0 0 1 0 1 0.0 0.0 0.0 12.8 0.0 4.8
Valencia 1 0 1 59 38 101 5.9 0.0 23.7 27.3 29.2 27.1
New Mexico 128 9 54 1,263 992 2,470 14.5 4.8 24.5 26.7 24.3 24.6
* All rates are per 100,000, age-adjusted to the 2000 US standard population
Sources: NMDOH BVRHS death files and UNM-GPS population files; SAES
New Mexico Substance Use Epidemiology Profile Page 32
Table 2: Drug Overdose Deaths and Rates* by Race/Ethnicity and County, New Mexico, 2013-2017
Deaths Rates*
DRUG OVERDOSE DEATH (continued)
Problem Statement (continued)
Table 1 shows that Hispanic men had the highest total drug overdose death rate. Hispanic men had higher unintentional drug overdosedeath rates than White men across the age range (Chart 4). The rates of total drug overdose death (Table 1) and unintentional drugoverdose death (Table 3) among men were more than 1.5 times that of women. Among women, drug overdose death from prescriptiondrugs was more common than from illicit drugs across the age range. Illicit drugs were the predominant drug type causing death amongmales across the age range, and the rates were highest among males aged 25-54 years.
Rio Arriba County had the highest total drug overdose death rate (89.9 deaths per 100,000) and unintentional drug overdose death rate(86.2 deaths per 100,000; Table 3) among all New Mexico counties during 2013-2017. However, the problem of drug overdose is by nomeans limited to Rio Arriba County. As expected, Bernalillo County had the largest number of unintentional drug overdose deaths(Table 3). According to Chart 2, close to one-third of New Mexico counties had total drug overdose death rates one and a half timeshigher than the US rate (21.7 deaths per 100,000 population).
The death rate from prescription drugs exceeded the statewide death rate from illicit drugs in almost half (14 of 33) of the counties(Table 3).

* All rates are per 100,000, age-adjusted to the 2000 US standard population
Sources: NMDOH BVRHS death files and UNM-GPS population files (NM); NCHS death and population files (US); SAES
New Mexico Substance Use Epidemiology Profile Page 33
DRUG OVERDOSE DEATH (continued)
Chart 2: Drug Overdose Death Rates* by County, New Mexico, 2013-2017
21.7
4.8
12.1
12.6
13.5
15.4
16.7
16.8
17.0
18.8
19.2
19.6
19.6
20.0
20.5
21.2
22.9
23.0
24.6
26.3
27.1
29.2
29.5
29.5
29.6
32.5
34.4
38.5
41.0
41.5
42.7
44.9
44.9
89.9
0 10 20 30 40 50 60 70 80 90 100
United States, 2017
Harding (0; 0.0%)
Union (1; 0.0%)
Roosevelt (11; 0.4%)
McKinley (40; 1.6%)
Mora (2; 0.1%)
Curry (36; 1.5%)
San Juan (103; 4.2%)
Cibola (23; 0.9%)
Dona Ana (164; 6.6%)
Lea (61; 2.5%)
Luna (19; 0.8%)
Sandoval (129; 5.2%)
Socorro (15; 0.6%)
Otero (64; 2.6%)
Los Alamos (16; 0.6%)
Quay (9; 0.4%)
Chaves (69; 2.8%)
Eddy (62; 2.5%)
New Mexico (2470; 100.0%)
Bernalillo (902; 36.5%)
Valencia (101; 4.1%)
Taos (42; 1.7%)
Sierra (17; 0.7%)
Catron (3; 0.1%)
Torrance (23; 0.9%)
Santa Fe (219; 8.9%)
De Baca (2; 0.1%)
Colfax (22; 0.9%)
Hidalgo (9; 0.4%)
Grant (48; 1.9%)
Lincoln (35; 1.4%)
Guadalupe (10; 0.4%)
San Miguel (53; 2.1%)
Rio Arriba (158; 6.4%)
Rate*
County (# of deaths; % of statewide deaths)

* All rates are per 100,000, age-adjusted to the 2000 US standard population
Sources: NMDOH BVRHS death files and UNM-GPS population files; SAES
New Mexico Substance Use Epidemiology Profile Page 34
DRUG OVERDOSE DEATH (continued)
Chart 3: Drug Overdose Death Rates* by County, New Mexico, 2013-2017
Drug Overdose Deaths(Rate per 100,000 population)

County
Male Female Illicit Rx Both Male Female Illicit Rx Both
Bernalillo 531 260 318 267 189 791 31.7 14.8 9.3 7.8 5.6 23.2
Catron 0 2 0 1 0 2 0.0 32 0.0 12.6 0.0 14.8Chaves 38 23 26 22 11 61 25.2 14.9 8.2 7.4 3.6 20.0
Cibola 13 7 8 9 2 20 18.7 9.6 6.2 6.0 1.6 14.6
Colfax 16 5 10 4 6 21 55.5 18.1 19.0 6.8 11.2 37.8
Curry 22 12 8 16 6 34 17.8 11.1 3.8 7.0 2.3 14.6De Baca 2 0 1 1 0 2 68.8 0.0 15.9 18.4 0.0 34.3
Dona Ana 99 43 52 51 32 142 21.5 8.7 5.4 5.3 3.4 14.9
Eddy 39 17 24 18 13 56 28.2 13.1 8.9 6.5 4.9 20.9
Grant 22 17 20 16 2 39 41.8 27.5 18.0 13.3 2.1 34.6
Guadalupe 6 4 6 3 1 10 46.2 45.4 28.5 13.5 2.9 44.9
Harding 0 0 0 0 0 0 0.0 0.0 0.0 0.0 0.0 0.0
Hidalgo 4 4 2 6 0 8 28.6 35 6.9 25.9 0.0 32.8
Lea 33 22 24 26 3 55 18.6 14.9 7.5 7.9 0.8 16.9
Lincoln 18 16 13 17 4 34 44.0 38.9 18.9 18.0 4.6 41.6
Los Alamos 9 5 4 10 0 14 24.4 11.3 5.8 12.2 0.0 18.0
Luna 8 8 5 8 3 16 16.2 16.4 6.3 6.9 2.9 16.2
McKinley 21 11 15 9 3 32 14.7 6.5 4.8 3.3 0.8 10.5
Mora 1 1 0 1 1 2 11.9 15.1 0.0 7.4 6.1 13.5
Otero 26 23 17 24 8 49 16.7 14.6 5.9 7.2 2.6 15.7
Quay 4 3 2 1 4 7 16.4 15.2 2.6 3.2 9.7 15.6
Rio Arriba 113 38 62 35 50 151 130.8 41.7 35.7 18.0 30.0 86.2
Roosevelt 8 3 2 8 1 11 16.5 7.5 2.4 8.7 1.0 12.1
Sandoval 71 45 41 51 23 116 22.6 12.6 6.5 7.3 3.7 17.6
San Juan 53 33 30 45 8 86 17.5 11.0 4.9 7.4 1.5 14.3
San Miguel 26 16 18 14 9 42 46.7 26.0 15.0 12.3 8.2 36.2
Santa Fe 120 63 74 63 45 183 36.7 19.9 11.8 9.0 7.3 28.3Sierra 8 9 5 10 2 17 29.7 29.7 9.4 15.3 4.7 29.5
Socorro 10 3 8 3 2 13 26.8 8.7 11.4 3.8 2.7 17.9
Taos 22 11 12 14 5 33 31.5 13.3 8.8 8.8 4.0 22.5
Torrance 12 9 10 9 1 21 29.2 24.9 13.4 10.2 1.8 27.0
Union 1 0 0 1 0 1 8.0 0.0 0.0 4.8 0.0 4.8
Valencia 58 24 34 26 20 82 32.1 13.4 9.2 7.4 5.8 22.9
Total 1,415 738 851 791 454 2,153 28.7 14.6 8.6 7.8 4.7 21.7
* All rates are per 100,000, age-adjusted to the 2000 US standard population;
Drug overdose type categories are mutually exclusive.
Source: NMDOH Bureau of Vital Records and Health Statistics; UNM-GPS population files; SAES
New Mexico Substance Use Epidemiology Profile Page 35
Deaths Rates*
Total
Sex Overdose Type
Total
* Age-specific rates per 100,000 population; drug overdose primary type categories are not mutually exclusive
Source: Bureau of Vital Records and Health Statistics; UNM-GPS population files; SAES
Table 3: Unintentional Drug Overdose Deaths and Rates*, New Mexico, 2013-2017
DRUG OVERDOSE DEATH (continued)
Sex Overdose Type
Chart 4: Unintentional Drug Overdose Death Rates* by Selected Characteristics, New Mexico, 2013-2017
0
20
40
0-4
5-1
4
15-2
4
25-3
4
35-4
4
45-5
4
55-6
4
65-7
4
75-8
4
85+
0-4
5-1
4
15-2
4
25-3
4
35-4
4
45-5
4
55-6
4
65-7
4
75-8
4
85+
Male Female
Ra
te*
By Age, Sex, and Race/Ethnicity
Hispanic
White
0
10
20
30
0-4
5-1
4
15-2
4
25-3
4
35-4
4
45-5
4
55-6
4
65-7
4
75-8
4
85+
0-4
5-1
4
15-2
4
25-3
4
35-4
4
45-5
4
55-6
4
65-7
4
75-8
4
85+
Male Female
Ra
te*
By Age, Sex, andPrimary Type of Overdose
Illicit
Rx

* All rates are per 100,000, age-adjusted to the 2000 US standard population
Source: NMDOH Bureau of Vital Records and Health Statistics; UNM-GPS population files; SAES
New Mexico Substance Use Epidemiology Profile Page 36
Chart 5: Unintentional Drug Overdose Death Rates* by County and Drug Type, New Mexico, 2013-2017
DRUG OVERDOSE DEATH (continued)
0 10 20 30 40 50 60 70 80 90
Harding (0; 0%)
Union (1; 0%)
McKinley (32; 1.5%)
Roosevelt (11; 0.5%)
Mora (2; 0.1%)
San Juan (86; 4%)
Curry (34; 1.6%)
Cibola (20; 0.9%)
Catron (2; 0.1%)
Dona Ana (142; 6.6%)
Quay (7; 0.3%)
Otero (49; 2.3%)
Luna (16; 0.7%)
Lea (55; 2.6%)
Sandoval (116; 5.4%)
Socorro (13; 0.6%)
Los Alamos (14; 0.7%)
Chaves (61; 2.8%)
Eddy (56; 2.6%)
New Mexico (2153; 100%)
Taos (33; 1.5%)
Valencia (82; 3.8%)
Bernalillo (791; 36.8%)
Torrance (21; 1%)
Santa Fe (183; 8.5%)
Sierra (17; 0.8%)
Hidalgo (8; 0.4%)
De Baca (2; 0.1%)
Grant (39; 1.8%)
San Miguel (42; 2%)
Colfax (21; 1%)
Lincoln (34; 1.6%)
Guadalupe (10; 0.5%)
Rio Arriba (151; 7%)
Rate*
County (# of deaths; % of statewide deaths)
Illicit
Both
Prescription

OPIOID OVERDOSE RELATED EMERGENCY DEPARTMENT VISITS
* Rates per 100,000 population
Sources: NMDOH Syndromic Surveillance ED files and UNM-GPS population files; SAES
Ages Ages Ages All Ages Ages Ages All
Sex Race/Ethnicity 0-24 25-64 65+ Ages 0-24 25-64 65+ Ages*
Male American Indian 11 109 6 127 1.7 24.8 2.1 28.6
Asian/Pacific Islander 5 16 2 23 5.4 18.6 3.3 27.3
Black 30 95 15 140 18.4 74.1 16.4 108.9
Hispanic 332 1,246 72 1,650 9.0 53.3 3.8 66.1
White 152 495 99 747 8.8 24.0 2.7 35.5
Total 580 2,139 202 2,927 9.2 42.3 3.4 54.8
Female American Indian 17 83 9 109 2.6 17.3 2.1 22.0
Asian/Pacific Islander 5 6 1 12 5.7 5.4 1.0 12.1
Black 20 104 24 148 14.4 114.5 26.2 155.1
Hispanic 243 735 83 1,061 6.8 31.1 3.5 41.4
White 124 464 146 734 7.9 22.2 3.5 33.5
Total 445 1,498 279 2,222 7.4 29.1 3.9 40.4
Total American Indian 29 194 15 239 2.2 21.1 2.1 25.4
Asian/Pacific Islander 10 22 3 35 5.5 11.2 1.9 18.7
Black 50 199 39 288 16.6 90.8 21.3 128.7
Hispanic 600 2,068 156 2,824 8.3 44.0 3.7 55.9
White 287 990 258 1,536 8.7 23.8 3.3 35.8
Total 1,099 3,859 502 5,469 8.9 37.8 3.8 50.6
* Age-specific rates (e.g., Ages 0-24) are per 100,000; all-ages rate is per 100,000, age-adjusted to the 2000 US standard population
**There were 876 visits for which race-ethnicity was missing.
Sources: NMDOH Syndromic Surveillance ED files and UNM-GPS population files; SAES
New Mexico Substance Use Epidemiology Profile Page 37
Emergency Department Visits Rates*
Table 1: Opioid Overdose Related Emergency Department Visits and Rates* by Age, Sex, and
Race/Ethnicity, New Mexico, 2013-2017
Chart 1: Opioid Overdose Related Emergency Department Visit Rates*, New Mexico, 2013-2017
Problem Statement
In addition to the observed increase in drug overdose deaths, there has been an increase in opioid overdose relatedemergency department (ED) visits. In the US between 2004 and 2009, there has been a 98.4% increase in ED visitsrelated to misuse or abuse of prescription drugs, particularly opioids (Paulozzi, L. J., Jones, C. M., Mack, K. A., & Rudd, R.A. [2011]. Vital Signs: Overdoses of prescription opioid pain relievers-United States, 1999–2008. Morbidity and MortalityWeekly Report, 60[43], 6). In New Mexico the emergency department dataset (EDD) is collected in accordance with theNM Public Health Act and New Mexico Administrative Code 7.4.3.10.
Chart 1 shows that between 2013 and 2015, the rate of opioid overdose related emergency department visits increased by82% in New Mexico.
0.0
20.0
40.0
60.0
80.0
2013 2014 2015 2016 2017
Rat
e*
Year
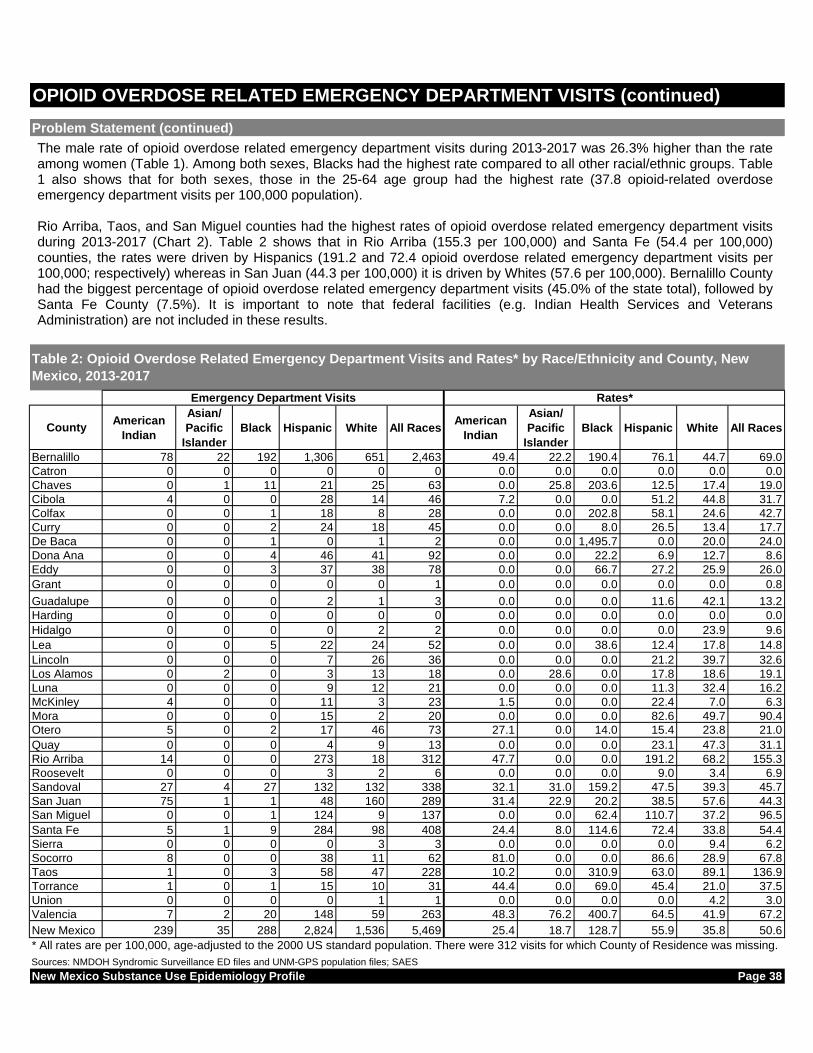
CountyAmerican
Indian
Asian/
Pacific
Islander
Black Hispanic White All RacesAmerican
Indian
Asian/
Pacific
Islander
Black Hispanic White All Races
Bernalillo 78 22 192 1,306 651 2,463 49.4 22.2 190.4 76.1 44.7 69.0
Catron 0 0 0 0 0 0 0.0 0.0 0.0 0.0 0.0 0.0
Chaves 0 1 11 21 25 63 0.0 25.8 203.6 12.5 17.4 19.0
Cibola 4 0 0 28 14 46 7.2 0.0 0.0 51.2 44.8 31.7
Colfax 0 0 1 18 8 28 0.0 0.0 202.8 58.1 24.6 42.7
Curry 0 0 2 24 18 45 0.0 0.0 8.0 26.5 13.4 17.7
De Baca 0 0 1 0 1 2 0.0 0.0 1,495.7 0.0 20.0 24.0
Dona Ana 0 0 4 46 41 92 0.0 0.0 22.2 6.9 12.7 8.6
Eddy 0 0 3 37 38 78 0.0 0.0 66.7 27.2 25.9 26.0
Grant 0 0 0 0 0 1 0.0 0.0 0.0 0.0 0.0 0.8
Guadalupe 0 0 0 2 1 3 0.0 0.0 0.0 11.6 42.1 13.2
Harding 0 0 0 0 0 0 0.0 0.0 0.0 0.0 0.0 0.0
Hidalgo 0 0 0 0 2 2 0.0 0.0 0.0 0.0 23.9 9.6
Lea 0 0 5 22 24 52 0.0 0.0 38.6 12.4 17.8 14.8
Lincoln 0 0 0 7 26 36 0.0 0.0 0.0 21.2 39.7 32.6
Los Alamos 0 2 0 3 13 18 0.0 28.6 0.0 17.8 18.6 19.1
Luna 0 0 0 9 12 21 0.0 0.0 0.0 11.3 32.4 16.2
McKinley 4 0 0 11 3 23 1.5 0.0 0.0 22.4 7.0 6.3
Mora 0 0 0 15 2 20 0.0 0.0 0.0 82.6 49.7 90.4
Otero 5 0 2 17 46 73 27.1 0.0 14.0 15.4 23.8 21.0
Quay 0 0 0 4 9 13 0.0 0.0 0.0 23.1 47.3 31.1
Rio Arriba 14 0 0 273 18 312 47.7 0.0 0.0 191.2 68.2 155.3
Roosevelt 0 0 0 3 2 6 0.0 0.0 0.0 9.0 3.4 6.9
Sandoval 27 4 27 132 132 338 32.1 31.0 159.2 47.5 39.3 45.7
San Juan 75 1 1 48 160 289 31.4 22.9 20.2 38.5 57.6 44.3
San Miguel 0 0 1 124 9 137 0.0 0.0 62.4 110.7 37.2 96.5
Santa Fe 5 1 9 284 98 408 24.4 8.0 114.6 72.4 33.8 54.4
Sierra 0 0 0 0 3 3 0.0 0.0 0.0 0.0 9.4 6.2
Socorro 8 0 0 38 11 62 81.0 0.0 0.0 86.6 28.9 67.8
Taos 1 0 3 58 47 228 10.2 0.0 310.9 63.0 89.1 136.9
Torrance 1 0 1 15 10 31 44.4 0.0 69.0 45.4 21.0 37.5
Union 0 0 0 0 1 1 0.0 0.0 0.0 0.0 4.2 3.0
Valencia 7 2 20 148 59 263 48.3 76.2 400.7 64.5 41.9 67.2
New Mexico 239 35 288 2,824 1,536 5,469 25.4 18.7 128.7 55.9 35.8 50.6
* All rates are per 100,000, age-adjusted to the 2000 US standard population. There were 312 visits for which County of Residence was missing.
Sources: NMDOH Syndromic Surveillance ED files and UNM-GPS population files; SAES
New Mexico Substance Use Epidemiology Profile Page 38
Emergency Department Visits Rates*
Table 2: Opioid Overdose Related Emergency Department Visits and Rates* by Race/Ethnicity and County, New
Mexico, 2013-2017
Problem Statement (continued)
OPIOID OVERDOSE RELATED EMERGENCY DEPARTMENT VISITS (continued)
The male rate of opioid overdose related emergency department visits during 2013-2017 was 26.3% higher than the rateamong women (Table 1). Among both sexes, Blacks had the highest rate compared to all other racial/ethnic groups. Table1 also shows that for both sexes, those in the 25-64 age group had the highest rate (37.8 opioid-related overdoseemergency department visits per 100,000 population).
Rio Arriba, Taos, and San Miguel counties had the highest rates of opioid overdose related emergency department visitsduring 2013-2017 (Chart 2). Table 2 shows that in Rio Arriba (155.3 per 100,000) and Santa Fe (54.4 per 100,000)counties, the rates were driven by Hispanics (191.2 and 72.4 opioid overdose related emergency department visits per100,000; respectively) whereas in San Juan (44.3 per 100,000) it is driven by Whites (57.6 per 100,000). Bernalillo Countyhad the biggest percentage of opioid overdose related emergency department visits (45.0% of the state total), followed bySanta Fe County (7.5%). It is important to note that federal facilities (e.g. Indian Health Services and VeteransAdministration) are not included in these results.

* All rates are per 100,000, age-adjusted to the 2000 US standard population
** Unstable rate due to small number of cases (<10)
Sources: NMDOH Syndromic Surveillance ED files and UNM-GPS population files (NM); SAES
New Mexico Substance Use Epidemiology Profile Page 39
Chart 2: Opioid Overdose Related Emergency Department Visit Rates* by County, New Mexico, 2013-2017
OPIOID OVERDOSE RELATED EMERGENCY DEPARTMENT VISITS (continued)
155.3
136.9
96.5
90.4
69.0
67.8
67.2
54.4
50.6
45.7
44.3
42.7
37.5
32.6
31.7
31.1
26.0
24.0
21.0
19.1
19.0
17.7
16.2
14.8
13.2
9.6
8.6
6.9
6.3
6.2
3.0
0.8
0.0
0.0
0.0 20.0 40.0 60.0 80.0 100.0 120.0 140.0 160.0 180.0
Rio Arriba (312; 5.7%)
Taos (228; 4.2%)
San Miguel (137; 2.5%)
Mora (20; 0.4%)
Bernalillo (2,463; 45.0%)
Socorro (62; 1.1%)
Valencia (263; 4.8%)
Santa Fe (408; 7.5%)
New Mexico (5,469; 100.0%)
Sandoval (338; 6.2%)
San Juan (289; 5.3%)
Colfax (28; 0.5%)
Torrance (31; 0.6%)
Lincoln (36; 0.7%)
Cibola (46; 0.8%)
Quay (13; 0.2%)
Eddy (78; 1.4%)
De Baca** (2; 0.0%)
Otero (73; 1.3%)
Los Alamos (18; 0.3%)
Chaves (63; 1.2%)
Curry (45; 0.8%)
Luna (21; 0.4%)
Lea (52; 1.0%)
Guadalupe** (3; 0.1%)
Hidalgo** (2; 0.0%)
Dona Ana (92; 1.7%)
Roosevelt** (6; 0.1%)
McKinley (23; 0.4%)
Sierra** (3; 0.1%)
Union** (1; 0.0%)
Grant** (1; 0.0%)
Catron** (0; 0.0%)
Harding** (0; 0.0%)
Rate*
County (# emergency department visits; % State visits)

* All rates are per 100,000, age-adjusted to the 2000 US standard population
Sources: NMDOH EDD files and UNM-GPS population files; SAES
New Mexico Substance Use Epidemiology Profile Page 40
Chart 2: Opioid Overdose Related Emergency Department Visit Rates* by County, New Mexico, 2013-2017
OPIOID OVERDOSE RELATED EMERGENCY DEPARTMENT VISITS (continued)
Opioid Overdose-Related Emergency Department Visits(Rate per 100,000 population)
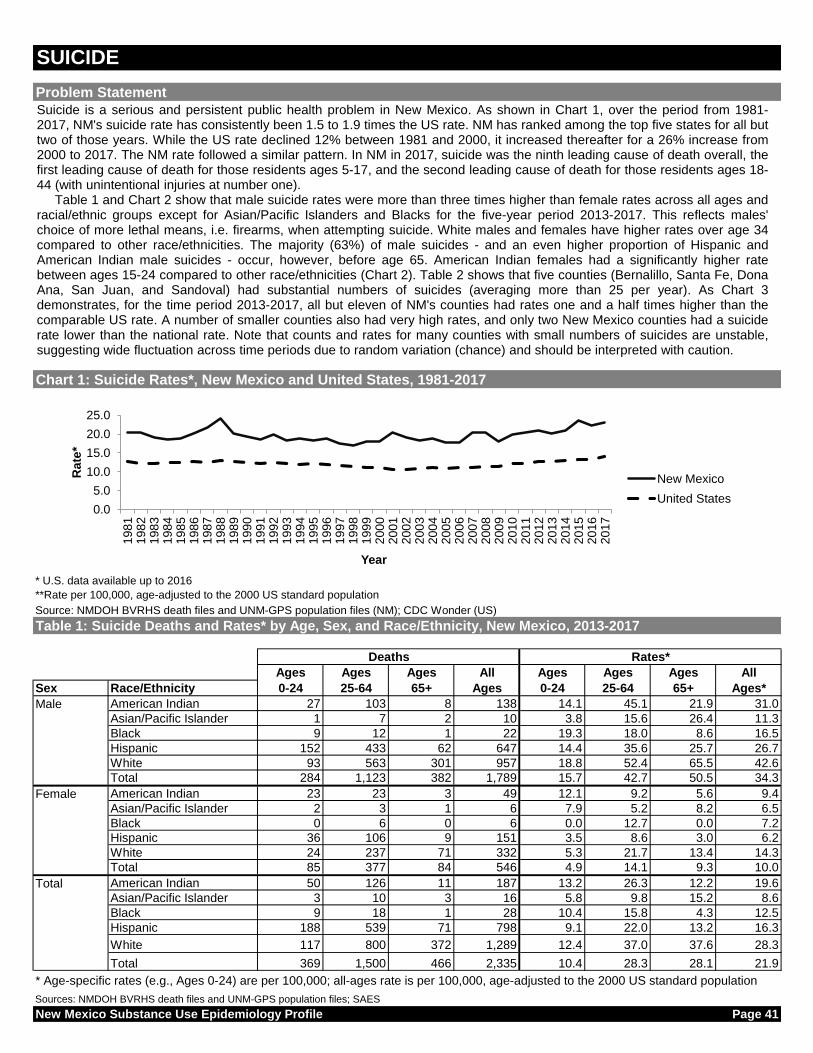
SUICIDE
* U.S. data available up to 2016
**Rate per 100,000, age-adjusted to the 2000 US standard population
Source: NMDOH BVRHS death files and UNM-GPS population files (NM); CDC Wonder (US)
Ages Ages Ages All Ages Ages Ages All
Sex Race/Ethnicity 0-24 25-64 65+ Ages 0-24 25-64 65+ Ages*
Male American Indian 27 103 8 138 14.1 45.1 21.9 31.0
Asian/Pacific Islander 1 7 2 10 3.8 15.6 26.4 11.3
Black 9 12 1 22 19.3 18.0 8.6 16.5
Hispanic 152 433 62 647 14.4 35.6 25.7 26.7
White 93 563 301 957 18.8 52.4 65.5 42.6
Total 284 1,123 382 1,789 15.7 42.7 50.5 34.3
Female American Indian 23 23 3 49 12.1 9.2 5.6 9.4
Asian/Pacific Islander 2 3 1 6 7.9 5.2 8.2 6.5
Black 0 6 0 6 0.0 12.7 0.0 7.2
Hispanic 36 106 9 151 3.5 8.6 3.0 6.2
White 24 237 71 332 5.3 21.7 13.4 14.3
Total 85 377 84 546 4.9 14.1 9.3 10.0
Total American Indian 50 126 11 187 13.2 26.3 12.2 19.6
Asian/Pacific Islander 3 10 3 16 5.8 9.8 15.2 8.6
Black 9 18 1 28 10.4 15.8 4.3 12.5
Hispanic 188 539 71 798 9.1 22.0 13.2 16.3
White 117 800 372 1,289 12.4 37.0 37.6 28.3
Total 369 1,500 466 2,335 10.4 28.3 28.1 21.9
* Age-specific rates (e.g., Ages 0-24) are per 100,000; all-ages rate is per 100,000, age-adjusted to the 2000 US standard population
Sources: NMDOH BVRHS death files and UNM-GPS population files; SAES
New Mexico Substance Use Epidemiology Profile Page 41
Table 1: Suicide Deaths and Rates* by Age, Sex, and Race/Ethnicity, New Mexico, 2013-2017
Deaths Rates*
Chart 1: Suicide Rates*, New Mexico and United States, 1981-2017
Problem Statement
Suicide is a serious and persistent public health problem in New Mexico. As shown in Chart 1, over the period from 1981-2017, NM's suicide rate has consistently been 1.5 to 1.9 times the US rate. NM has ranked among the top five states for all buttwo of those years. While the US rate declined 12% between 1981 and 2000, it increased thereafter for a 26% increase from2000 to 2017. The NM rate followed a similar pattern. In NM in 2017, suicide was the ninth leading cause of death overall, thefirst leading cause of death for those residents ages 5-17, and the second leading cause of death for those residents ages 18-44 (with unintentional injuries at number one).
Table 1 and Chart 2 show that male suicide rates were more than three times higher than female rates across all ages andracial/ethnic groups except for Asian/Pacific Islanders and Blacks for the five-year period 2013-2017. This reflects males'choice of more lethal means, i.e. firearms, when attempting suicide. White males and females have higher rates over age 34compared to other race/ethnicities. The majority (63%) of male suicides - and an even higher proportion of Hispanic andAmerican Indian male suicides - occur, however, before age 65. American Indian females had a significantly higher ratebetween ages 15-24 compared to other race/ethnicities (Chart 2). Table 2 shows that five counties (Bernalillo, Santa Fe, DonaAna, San Juan, and Sandoval) had substantial numbers of suicides (averaging more than 25 per year). As Chart 3demonstrates, for the time period 2013-2017, all but eleven of NM's counties had rates one and a half times higher than thecomparable US rate. A number of smaller counties also had very high rates, and only two New Mexico counties had a suiciderate lower than the national rate. Note that counts and rates for many counties with small numbers of suicides are unstable,suggesting wide fluctuation across time periods due to random variation (chance) and should be interpreted with caution.
0.0
5.0
10.0
15.0
20.0
25.0
198
11
98
21
98
31
98
41
98
51
98
61987
198
81
98
91
99
01
99
11
99
21
99
31
99
41
99
51
99
61
99
71998
199
92
00
02
00
12
00
22
00
32
00
42
00
52
00
62
00
72
00
82009
201
02
01
12
01
22
01
32
01
42
01
52
01
62
01
7
Ra
te*
Year
New Mexico
United States

* Age-specific rates per 100,000
Sources: NMDOH BVRHS death files and UNM-GPS population files; SAES
CountyAmerican
Indian
Asian/
Pacific
Islander
Black Hispanic White All RacesAmerican
Indian
Asian/
Pacific
Islander
Black Hispanic White All Races
Bernalillo 22 6 10 262 418 725 15.9 6.0 10.0 16.0 27.1 20.8
Catron 1 0 0 3 3 7 142.3 0.0 0.0 122.8 23.5 56.2
Chaves 1 0 1 16 47 66 39.3 0.0 29.2 8.8 35.0 20.4
Cibola 11 0 0 6 12 29 20.6 0.0 0.0 12.3 40.6 21.0
Colfax 0 0 0 8 7 15 0.0 0.0 0.0 24.1 26.8 22.8
Curry 0 1 5 10 28 44 0.0 13.2 33.0 10.5 20.4 18.2
De Baca 0 0 0 0 2 2 0.0 0.0 0.0 0.0 31.4 17.6
Dona Ana 2 0 4 72 90 170 20.7 0.0 21.3 10.5 25.2 16.0
Eddy 0 0 0 27 43 70 0.0 0.0 0.0 21.7 32.8 26.8
Grant 2 0 0 14 29 45 147.6 0.0 0.0 21.8 41.7 32.4
Guadalupe 0 0 0 2 0 2 0.0 0.0 0.0 12.0 0.0 9.1
Harding 0 0 0 0 0 0 0.0 0.0 0.0 0.0 0.0 0.0
Hidalgo 0 0 0 7 5 12 0.0 0.0 0.0 66.0 67.2 64.8
Lea 1 1 1 16 39 58 36.1 30.5 6.4 8.7 28.8 17.7
Lincoln 0 0 0 4 27 31 0.0 0.0 0.0 11.6 36.6 26.5
Los Alamos 0 0 0 1 12 13 0.0 0.0 0.0 5.5 19.1 15.0
Luna 0 0 0 8 23 32 0.0 0.0 0.0 11.2 40.7 22.7
McKinley 63 0 0 16 8 87 23.5 0.0 0.0 35.0 22.4 24.8
Mora 0 0 0 6 0 6 0.0 0.0 0.0 35.3 0.0 29.7
Otero 4 1 1 17 63 88 19.3 21.8 5.6 15.6 32.7 25.9
Quay 0 0 1 4 10 15 0.0 0.0 146.8 19.0 42.9 33.2
Rio Arriba 5 0 0 36 10 51 16.3 0.0 0.0 26.8 39.3 26.9
Roosevelt 0 1 1 6 10 18 0.0 18.8 16.4 12.9 19.2 17.8
Sandoval 15 1 0 43 70 129 17.7 10.6 0.0 16.1 20.7 18.7
San Juan 51 1 1 19 86 158 20.0 62.6 22.8 16.9 30.2 24.5
San Miguel 1 0 0 30 11 43 372.3 0.0 0.0 28.9 38.0 31.2
Santa Fe 3 2 2 72 105 186 11.9 14.8 32.1 19.1 27.7 23.7
Sierra 0 0 0 4 21 25 0.0 0.0 0.0 25.3 38.1 36.1
Socorro 1 0 0 10 15 26 9.7 0.0 0.0 23.6 40.5 28.6
Taos 2 0 0 25 29 56 23.3 0.0 0.0 29.4 52.0 36.0
Torrance 0 0 0 4 21 25 0.0 0.0 0.0 15.0 43.8 30.1
Union 0 0 0 4 1 5 0.0 0.0 0.0 45.3 12.6 27.0
Valencia 2 2 1 46 41 93 11.9 80.3 26.1 20.4 29.8 24.7
New Mexico 187 16 28 798 1,289 2,335 19.6 8.6 12.5 16.3 28.3 21.9
* All rates are per 100,000, age-adjusted to the 2000 US standard population
Sources: NMDOH BVRHS death files and UNM-GPS population files; SAES
New Mexico Substance Use Epidemiology Profile Page 42
Table 2: Suicide Deaths and Rates* by Race/Ethnicity and County, New Mexico, 2013-2017
Chart 2: Suicide Rates* by Age, Sex, and Race/Ethnicity, New Mexico, 2013-2017
SUICIDE (continued)
Deaths Rates*
0
20
40
60
80
100
5-1
4
15
-24
25
-34
35
-44
45
-54
55
-64
65
-74
75
-84
85
+
5-1
4
15
-24
25
-34
35
-44
45
-54
55
-64
65
-74
75
-84
85+
Male Female
Rate
*
American Indian
Hispanic
White

* All rates are per 100,000, age-adjusted to the 2000 US standard population
Sources: NMDOH BVRHS death files and UNM-GPS population files (NM); NCHS death and population files (US); CDC ARDI; SAES
New Mexico Substance Use Epidemiology Profile Page 43
Chart 3: Suicide Rates* by County, New Mexico, 2013-2017
SUICIDE (continued)
14.0
9.1
15.0
16.0
17.6
17.7
17.8
18.2
18.7
20.4
20.8
21.0
21.9
22.7
22.8
23.7
24.5
24.7
24.8
25.9
26.5
26.8
26.9
27.0
28.6
29.7
30.1
31.2
32.4
33.2
36.0
36.1
56.2
64.8
0 10 20 30 40 50 60 70
United States, 2017
Harding (0; 0.0%)
Guadalupe (2; 0.1%)
Los Alamos (13; 0.6%)
Dona Ana (170; 7.3%)
De Baca (2; 0.1%)
Lea (58; 2.5%)
Roosevelt (18; 0.8%)
Curry (44; 1.9%)
Sandoval (129; 5.5%)
Chaves (66; 2.8%)
Bernalillo (725; 31.0%)
Cibola (29; 1.2%)
New Mexico (2335; 100.0%)
Luna (32; 1.4%)
Colfax (15; 0.6%)
Santa Fe (186; 8.0%)
San Juan (158; 6.8%)
Valencia (93; 4.0%)
McKinley (87; 3.7%)
Otero (88; 3.8%)
Lincoln (31; 1.3%)
Eddy (70; 3.0%)
Rio Arriba (51; 2.2%)
Union (5; 0.2%)
Socorro (26; 1.1%)
Mora (6; 0.3%)
Torrance (25; 1.1%)
San Miguel (43; 1.8%)
Grant (45; 1.9%)
Quay (15; 0.6%)
Taos (56; 2.4%)
Sierra (25; 1.1%)
Catron (7; 0.3%)
Hidalgo (12; 0.5%)
Rate*
County (# of deaths; % of statewide deaths)

* All rates are per 100,000, age-adjusted to the 2000 US standard population
Sources: NMDOH BVRHS death files and UNM-GPS population files; SAES
New Mexico Substance Use Epidemiology Profile Page 44
Chart 4: Suicide Rates* by County, New Mexico, 2013-2017
SUICIDE (continued)
Suicide (Rate per 100,000 population)

Mental Health
New Mexico Substance Use Epidemiology Profile Page 45
Section 2

New Mexico Substance Use Epidemiology Profile Page 46

Ages Ages Ages All Ages Ages Ages All
Sex Race/Ethnicity 18-24 25-64 65+ Ages 18-24 25-64 65+ Ages*
Male American Indian 2,730 4,749 1,904 9,340 25.8 10.3 25.1 14.5
Asian/Pacific Islander - 807 - 1,171 - 8.9 - 9.3
Black - 1,553 - 3,726 - 11.5 - 19.2
Hispanic 5,353 27,793 5,851 38,894 9.1 11.3 11.6 10.9
White 4,787 24,310 5,594 34,596 15.4 11.5 5.9 10.3
Total 13,974 59,828 14,015 88,158 13.2 11.4 8.9 11.2
Female American Indian 1,462 6,100 1,895 9,305 13.8 12.0 17.0 12.9
Asian/Pacific Islander - 748 - 1,616 - 6.4 - 10.2
Black - 1,349 - 1,556 - 14.1 - 10.8
Hispanic 8,323 40,509 5,666 54,712 14.7 16.3 9.2 14.9
White 3,615 35,376 8,351 46,760 13.7 16.6 7.7 13.4
Total 13,498 83,921 16,407 113,384 13.8 15.7 8.8 13.9
Total American Indian 4,152 10,861 3,837 18,642 19.6 11.2 20.5 13.6
Asian/Pacific Islander - 1,592 - 2,765 - 7.7 - 9.7
Black - 2,948 681 5,041 - 12.8 14.0 14.9
Hispanic 13,559 68,370 11,496 93,603 11.7 13.8 10.3 13.0
White 8,383 59,594 13,977 81,409 14.6 14.1 6.9 11.9
Total 27,467 143,685 30,422 201,495 13.5 13.6 8.9 12.5
* Estimate of percent of people in population group who reported Frequent Mental Distress in past 30 days
- Excluded due to small number of respondents (< 50) in cell
Source: BRFSS; SAES
New Mexico Substance Use Epidemiology Profile Page 47
Table 1: Frequent Mental Distress (past 30 days) by Age, Sex, and Race, Adults Aged 18+, New Mexico, 2015-2017
Number Percent*
ADULT MENTAL HEALTH
Problem Statement
Adult mental health issues range in a spectrum: from day-to-day challenges with stress, anxiety, and "the blues"; topersistent mental health challenges arising from chronic physical conditions such as diabetes, asthma, and obesity; tochronic clinically diagnosable psychiatric morbidities such as anxiety disorders, schizophrenia, bipolar disorder, anddepression; and to serious life-threatening situations such as suicidal ideation and suicide attempt, which sometimes resultfrom a combination of the mental and physical health challenges mentioned above. A host of measures exist for assessingthe mental health status of individuals, but characterizing the mental health status of the population is a relatively new field.If such an assessment can be done using a simple and non-invasive approach with a reasonable level of sensitivity andspecificity, the resulting characterization of the population's mental health can help public health and mental healthprofessionals better understand the distribution of mental health issues in the population and design better systems to helpidentify, address, and mitigate these issues before they become more serious.
Among measures that have been suggested by the CDC as potential tools for assessing population well-being and mentalhealth is the frequency with which people experience poor mental health. This measure is based on the single question,"How many days during the past 30 days was your mental health not good?" Respondents who report that they experienced14 or more days when their mental health was "not good" are classified as experiencing Frequent Mental Distress (FMD).Although FMD is not a clinical diagnosis, evidence suggests that it is associated with a person's mental health status. Chart1 shows the proportion of people with selected characteristics who experienced FMD. The proportion of the total NewMexico population that experienced FMD was about 12%. As might be expected, people in good health with higher incomesand more education were significantly less likely than the general population to report FMD. People with less education, withchronic health conditions such as obesity, diabetes, or asthma, or with lower income were significantly more likely to reportFMD. Of particular relevance regarding FMD's potential usefulness as a measure of population mental health, FMD wasmany times more prevalent among respondents who reported more serious psychiatric morbidity, including screeningpositive for alcohol dependence or abuse (33% reported FMD), ever being diagnosed with an anxiety disorder (37%reported past-month FMD), or receiving a diagnosis of current depression based on the Patient Health Questionnaire (52%reported past-month FMD). Among the cohort that reported past-year suicidal ideation with no history of suicide attempt,48% reported past-month FMD; among the cohort at high risk for suicide that reported both past-year suicidal ideation and aprior suicide attempt, 62% reported past-month FMD. Meanwhile, more than half (52%) of FMD respondents werediagnosed with current depression (Chart 1). These results suggest that this simple question, which is asked annually on theBRFSS, is a useful indicator of population mental health.

* Frequent Mental Distress definition: respondent reported 14 or more days in past 30 days when mental health was "not good"
Source: BRFSS; SAES (NOTE: Brackets around reported rates are 95% confidence intervals)
CountyAmerican
Indian
Asian/
Pacific
Islander
Black Hispanic White All
Races
American
Indian
Asian/
Pacific
Islander
Black Hispanic White All
Races
Bernalillo 2,451 - - 22,114 28,485 53,585 11.1 - - 9.1 12.2 10.2
Catron - - - - - 443 - - - - - 13.9
Chaves - - - 4,204 2,132 6,652 - - - 16.9 9.8 13.8
Cibola 1,397 - - 792 625 2,741 17.8 - - 10.0 13.4 13.2
Colfax - - - - 347 1,387 - - - - 6.5 13.4
Curry - - - 1,828 2,887 6,361 - - - 13.4 14.5 17.2
De Baca - - - - - - - - - - - -
Dona Ana - - - 12,672 4,930 18,490 - - - 12.2 9.5 11.4
Eddy - - - 1,887 3,007 5,130 - - - 10.0 13.8 12.2
Grant - - - 1,479 1,144 2,639 - - - 13.9 9.8 11.5
Guadalupe - - - - - - - - - - - -
Harding - - - - - - - - - - - -
Hidalgo - - - - - - - - - - - -
Lea - - - 3,043 2,997 6,517 - - - 12.0 14.7 13.5
Lincoln - - - - 1,163 2,189 - - - - 10.5 13.5
Los Alamos - - - - 574 1,226 - - - - 5.4 8.7
Luna - - - 1,038 777 1,776 - - - 9.3 11.8 9.7
McKinley 4,130 - - 566 627 5,380 10.6 - - 8.8 11.2 10.4
Mora - - - - - - - - - - - -
Otero 315 - - 1,535 3,522 6,013 11.1 - - 9.0 12.8 12.0
Quay - - - - 403 1,247 - - - - 11.0 18.7
Rio Arriba - - - 4,010 651 5,171 - - - 18.9 14.0 17.0
Roosevelt - - - - 1,178 1,908 - - - - 13.8 12.8
Sandoval 3,345 - - 3,894 4,739 12,679 27.2 - - 10.2 9.0 11.8
San Juan 4,375 - - 1,850 5,253 11,957 12.4 - - 11.4 12.9 12.8
San Miguel - - - 3,967 110 4,036 - - - 23.0 2.4 17.8
Santa Fe - - - 8,224 5,243 14,833 - - - 14.6 9.0 12.3
Sierra - - - - 1,130 1,548 - - - - 16.7 16.2
Socorro - - - - - 1,662 - - - - - 12.5
Taos - - - 1,779 1,792 4,443 - - - 12.2 16.7 16.4
Torrance - - - - - 1,169 - - - - - 9.6
Union - - - - - - - - - - - -
Valencia - - - 2,371 982 3,346 - - - 7.2 4.5 5.8
New Mexico 18,642 2,765 5,041 93,603 81,409 201,495 13.6 9.7 14.9 13.0 11.9 12.5
* Estimate of percent of people in population group who reported Frequent Mental Distress in past 30 days
- Excluded due to small number of respondents (< 50) in cell
Source: BRFSS; SAES
New Mexico Substance Use Epidemiology Profile Page 48
Table 2: Frequent Mental Distress (past 30 days) by Race and County, Adults Aged 18+, New Mexico , 2015-2017
Number Percent*
ADULT MENTAL HEALTH (continued)
Chart 1: Frequent Mental Distress (past 30 days)* by Selected Characteristics, Adults Aged 18+, New Mexico,
2015-2017
6.37.5
9.512.6
14.916.317.217.7
20.924.0
28.832.6
36.337.1
48.462.0
51.8
0 20 40 60 80
Health excellent/very goodIncome $50,000+
College degreeAll New Mexico adults
Obese (BMI >= 30)< High school education
< 150% Federal Poverty LevelDiabetes (ever diagnosed)
Current asthmaIncome < $15,000
Health fair/poorAlcohol dependence or abuse (2007)
History of suicide attempt/no past-year suicidal ideation (2011)Anxiety (ever diagnosed)(2011)
Past-year suicidal ideation/no history of suicide attempt (2011)Past-year suicidal ideation/history of suicide attempt (2011)
Current depression (2011)Prevalence (%)

* Estimate of percent of people in population group who reported Frequent Mental Distress in past 30 days
The following counties were not included due to small number of respondents (<50) in cell:
De Baca, Guadalupe, Harding, Hidalgo, Mora, and Union
Source: NMBRFSS (NM); CDC BRFSS (US); SAES
New Mexico Substance Use Epidemiology Profile Page 49
ADULT MENTAL HEALTH (continued)
Chart 2: Frequent Mental Distress (past 30 days)* by County, Adults Aged 18+, New Mexico, 2015-2017
11.7
5.8
8.7
9.6
9.7
10.2
10.4
11.4
11.5
11.8
12.0
12.2
12.3
12.5
12.5
12.8
12.8
13.2
13.4
13.5
13.5
13.8
13.9
16.2
16.4
17.0
17.2
17.8
18.7
0 5 10 15 20 25 30 35 40 45 50
United States 2016
Valencia (3346; 1.7%)
Los Alamos (1226; 0.6%)
Torrance (1169; 0.6%)
Luna (1776; 0.9%)
Bernalillo (53585; 26.6%)
McKinley (5380; 2.7%)
Dona Ana (18490; 9.2%)
Grant (2639; 1.3%)
Sandoval (12679; 6.3%)
Otero (6013; 3.0%)
Eddy (5130; 2.5%)
Santa Fe (14833; 7.4%)
Socorro (1662; 0.8%)
New Mexico (201495; 100.0%)
Roosevelt (1908; 0.9%)
San Juan (11957; 5.9%)
Cibola (2741; 1.4%)
Colfax (1387; 0.7%)
Lea (6517; 3.2%)
Lincoln (2189; 1.1%)
Chaves (6652; 3.3%)
Catron (443; 0.2%)
Sierra (1548; 0.8%)
Taos (4443; 2.2%)
Rio Arriba (5171; 2.6%)
Curry (6361; 3.2%)
San Miguel (4036; 2.0%)
Quay (1247; 0.6%)
Percent (%)*
County (# of adults with FMD; % of statewide FMD adults)

Insufficient data: Rate not reported due to small number of respondents (< 50) in cell
Source: BRFSS; SAES
New Mexico Substance Use Epidemiology Profile Page 50
ADULT MENTAL HEALTH (continued)
Chart 3: Frequent Mental Distress (past 30 days)* by County, Adults Aged 18+, New Mexico, 2015-2017
Adult Frequent Mental Distress (%)

* Current Depression definition: scored 10 or more on Patient Health Questionnaire depression inventory (PHQ-8); this instrument can establish a provisional
depressive disorder diagnosis using Diagnostic and Statistical Manual of Mental Disorders, Fourth Edition (DSM-IV) criteria.
Source: BRFSS; SAES (NOTE: Brackets around reported rates are 95% confidence intervals)
Ages Ages Ages All Ages Ages Ages All
Sex Race/Ethnicity 18-24 25-64 65+ Ages 18-24 25-64 65+ Ages*
Male American Indian - 3,801 - 11,390 - 8.2 - 17.7
Asian/Pacific Islander - - - - - - - -
Black - - - - - - - -
Hispanic 4,201 20,716 2,472 27,336 7.1 8.4 4.9 7.7
White - 18,354 3,783 29,910 - 8.7 4.0 8.9
Total 16,945 43,807 8,460 70,551 16.0 8.3 5.4 8.9
Female American Indian - 3,538 727 4,903 - 7.0 6.5 6.8
Asian/Pacific Islander - - - - - - - -
Black - - - - - - - -
Hispanic 6,983 31,465 3,525 42,203 12.3 12.7 5.7 11.5
White - 24,573 6,450 33,489 - 11.5 5.9 9.6
Total 13,661 64,454 10,700 87,583 14.0 12.1 5.7 10.7
Total American Indian - 7,302 3,129 16,242 - 7.5 16.7 11.9
Asian/Pacific Islander - - - - - - - -
Black - - - 7,743 - - - 22.9
Hispanic 11,204 52,270 5,977 69,557 9.7 10.6 5.3 9.6
White - 42,992 10,366 63,464 - 10.1 5.1 9.3
Total 30,698 108,323 19,170 158,167 15.1 10.2 5.6 9.8
* Estimate of number of people in population group who reported current (past 2-week) depression based on DSM-IV criteria
** Estimate of percent of people in population group who reported current (past 2-week) depression based on DSM-IV criteria
- Excluded due to small number of respondents (< 50) in cell
Source: BRFSS; SAES
New Mexico Substance Use Epidemiology Profile Page 51
Chart 4: Unhealthy Behaviors by Depression Status and Sex, New Mexico, 2016
Table 3: Current Depression (past 2 weeks) by Age, Sex, and Race, Adults Aged 18+, New Mexico, 2016
Number* Percent**
ADULT MENTAL HEALTH - DEPRESSION
Problem Statement (continued)
Depression is one of the most prevalent and treatable mental disorders. Major depression is usually associated withcomorbid mental disorders, such as anxiety and substance use disorders, and impairment of a person’s ability to function inwork, home, relationships, and social roles. Depression is also a risk factor for suicide and attempted suicide. In addition,depressive disorders have been associated with an increased prevalence of chronic medical conditions, such as heartdisease, stroke, asthma, arthritis, cancer, diabetes, and obesity. In 2016, the BRFSS assessed current depression usingDiagnostic and Statistical Manual of Mental Disorders, 4th Edition (DSM-IV) criteria.
Table 3 shows the prevalence of current depression was highest among the youngest age-group 18-24 years (15.1%) andmuch higher among Black (22.9%) than Hispanic (9.6%) and White adults (9.3%). Depression was more common amongHispanic females (11.5%) and White females (9.6%) than American Indian females (6.8%) . Among males, AmericanIndians (17.7%) had the highest prevalence followed by Whites (8.9%). Chart 4 shows that current depression wasassociated, among both males and females, with significantly higher rates of some unhealthy behaviors including physicalinactivity and current smoking. Chart 5 shows that current depression was associated with higher rates of chronic healthconditions, such as asthma and heart disease among males, and asthma, obesity, diabetes, and heart disease amongfemales.
0
10
20
30
40
50
60
Depression None Depression None Depression None
Total Male Female
Pe
rce
nt
(%)
Physical inactivity (2011)
Current smoking
Binge drinking
Drinking and driving
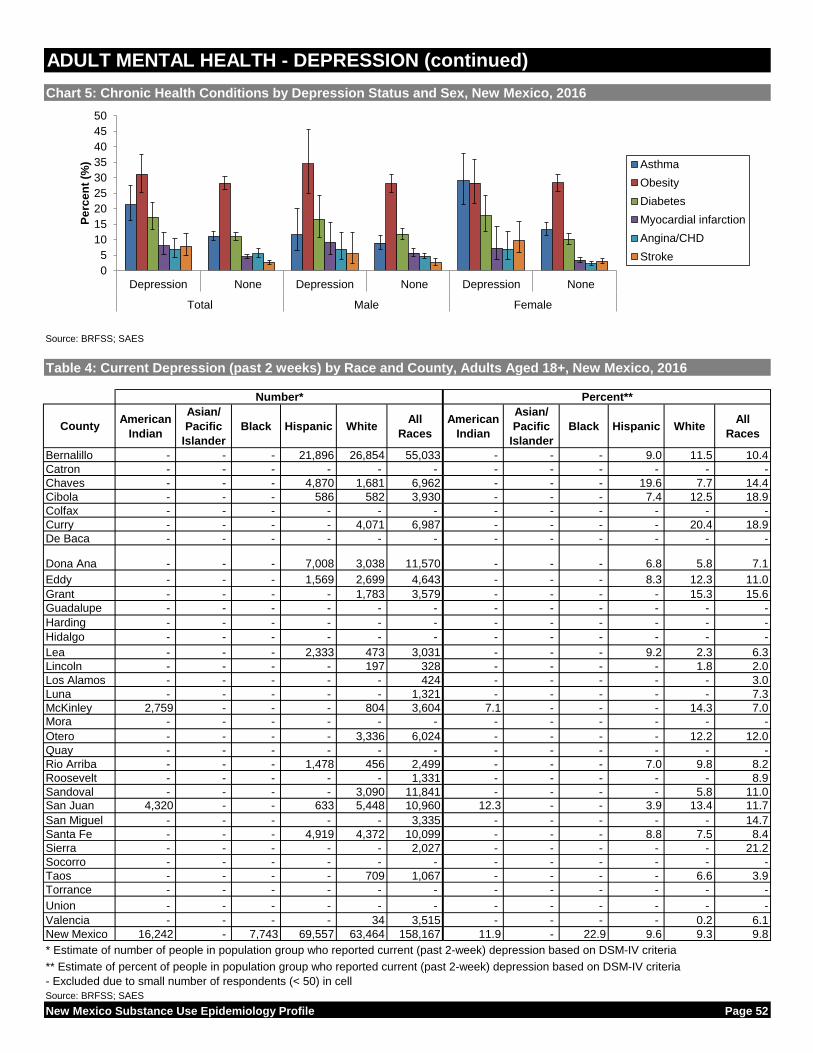
Source: BRFSS; SAES
CountyAmerican
Indian
Asian/
Pacific
Islander
Black Hispanic White All
Races
American
Indian
Asian/
Pacific
Islander
Black Hispanic White All
Races
Bernalillo - - - 21,896 26,854 55,033 - - - 9.0 11.5 10.4
Catron - - - - - - - - - - - -
Chaves - - - 4,870 1,681 6,962 - - - 19.6 7.7 14.4
Cibola - - - 586 582 3,930 - - - 7.4 12.5 18.9
Colfax - - - - - - - - - - - -
Curry - - - - 4,071 6,987 - - - - 20.4 18.9
De Baca - - - - - - - - - - - -
Dona Ana - - - 7,008 3,038 11,570 - - - 6.8 5.8 7.1
Eddy - - - 1,569 2,699 4,643 - - - 8.3 12.3 11.0
Grant - - - - 1,783 3,579 - - - - 15.3 15.6
Guadalupe - - - - - - - - - - - -
Harding - - - - - - - - - - - -
Hidalgo - - - - - - - - - - - -
Lea - - - 2,333 473 3,031 - - - 9.2 2.3 6.3
Lincoln - - - - 197 328 - - - - 1.8 2.0
Los Alamos - - - - - 424 - - - - - 3.0
Luna - - - - - 1,321 - - - - - 7.3
McKinley 2,759 - - - 804 3,604 7.1 - - - 14.3 7.0
Mora - - - - - - - - - - - -
Otero - - - - 3,336 6,024 - - - - 12.2 12.0
Quay - - - - - - - - - - - -
Rio Arriba - - - 1,478 456 2,499 - - - 7.0 9.8 8.2
Roosevelt - - - - - 1,331 - - - - - 8.9
Sandoval - - - - 3,090 11,841 - - - - 5.8 11.0
San Juan 4,320 - - 633 5,448 10,960 12.3 - - 3.9 13.4 11.7
San Miguel - - - - - 3,335 - - - - - 14.7
Santa Fe - - - 4,919 4,372 10,099 - - - 8.8 7.5 8.4
Sierra - - - - - 2,027 - - - - - 21.2
Socorro - - - - - - - - - - - -
Taos - - - - 709 1,067 - - - - 6.6 3.9
Torrance - - - - - - - - - - - -
Union - - - - - - - - - - - -
Valencia - - - - 34 3,515 - - - - 0.2 6.1
New Mexico 16,242 - 7,743 69,557 63,464 158,167 11.9 - 22.9 9.6 9.3 9.8
* Estimate of number of people in population group who reported current (past 2-week) depression based on DSM-IV criteria
** Estimate of percent of people in population group who reported current (past 2-week) depression based on DSM-IV criteria
- Excluded due to small number of respondents (< 50) in cell
Source: BRFSS; SAES
New Mexico Substance Use Epidemiology Profile Page 52
Table 4: Current Depression (past 2 weeks) by Race and County, Adults Aged 18+, New Mexico, 2016
Number* Percent**
ADULT MENTAL HEALTH - DEPRESSION (continued)
Chart 5: Chronic Health Conditions by Depression Status and Sex, New Mexico, 2016
0
5
10
15
20
25
30
35
40
45
50
Depression None Depression None Depression None
Total Male Female
Pe
rce
nt
(%) Asthma
Obesity
Diabetes
Myocardial infarction
Angina/CHD
Stroke

* Estimate of percent of people in population group who reported current (past 2-week) depression based on DSM-IV criteria
The following counties were not included due to small number of respondents (< 50) in cell:
Catron, Colfax, De Baca, Guadalupe, Harding, Hidalgo, Mora, Quay, Socorro, Torrance, and Union
Source: NMBRFSS (NM); CDC BRFSS (US); SAES
New Mexico Substance Use Epidemiology Profile Page 53
Chart 6: Current Depression (past 2 weeks)* by County, Adults Aged 18+, New Mexico, 2016
ADULT MENTAL HEALTH - DEPRESSION (continued)
17.3
2.0
3.0
3.9
6.1
6.3
7.0
7.1
7.3
8.2
8.4
8.9
9.8
10.4
11.0
11.0
11.7
12.0
14.4
14.7
15.6
18.9
18.9
21.2
0 10 20 30 40 50
United States
Lincoln (328; 0.2%)
Los Alamos (424; 0.3%)
Taos (1067; 0.7%)
Valencia (3515; 2.2%)
Lea (3031; 1.9%)
McKinley (3604; 2.3%)
Dona Ana (11570; 7.3%)
Luna (1321; 0.8%)
Rio Arriba (2499; 1.6%)
Santa Fe (10099; 6.4%)
Roosevelt (1331; 0.8%)
New Mexico (158167; 100.0%)
Bernalillo (55033; 34.8%)
Eddy (4643; 2.9%)
Sandoval (11841; 7.5%)
San Juan (10960; 6.9%)
Otero (6024; 3.8%)
Chaves (6962; 4.4%)
San Miguel (3335; 2.1%)
Grant (3579; 2.3%)
Cibola (3930; 2.5%)
Curry (6987; 4.4%)
Sierra (2027; 1.3%)
Percent (%)*
County (# of adults with current depression; % of statewide currently depressed adults)

* Estimate of percent of people in population group who reported current (past 2-week) depression based on DSM-IV criteria
Insufficient data: Rate not reported due to small number of respondents (< 50) in cell
Source: BRFSS; SAES
New Mexico Substance Use Epidemiology Profile Page 54
Chart 7: Current Depression (past 2 weeks)* by County, Adults Aged 18+, New Mexico, 2016
ADULT MENTAL HEALTH - DEPRESSION (continued)
Adult Depression (%)

* Felt so sad or hopeless nearly every day for a period of 2 weeks that they stopped some normal activities, within the past 12 months
Source: YRRS (NM); CDC YRBS (US); NMDOH Survey Section (NOTE: Brackets around reported rates are 95% confidence intervals)
9th Grade 10th Grade 11th Grade 12th Grade All Grades
Sex Race/Ethnicity Percent [95% CI] Percent [95% CI] Percent [95% CI] Percent [95% CI] Percent [95% CI]
Male American Indian 22.2 (13.6-34.2) 25.5 (18.9-33.4) 19.1 (14.3-25.2) 30.2 (23.6-37.8) 23.9 (20.4-27.9)
Asian/Pacific Islander -- -- -- -- 36.8 (25.2-50.3)
Black -- -- -- -- 20.4 (14.7-27.6)
Hispanic 22.2 (17.0-28.4) 27.9 (22.6-33.9) 31.7 (27.1-36.7) 32.0 (25.5-39.2) 28.0 (25.5-30.7)
White 20.7 (15.4-27.3) 30.0 (22.1-39.2) 29.3 (20.6-39.8) 24.8 (19.3-31.2) 26.1 (22.1-30.5)
Total 21.3 (17.4-25.8) 28.2 (24.6-32.2) 29.5 (25.4-33.9) 28.9 (25.3-32.7) 26.6 (24.7-28.6)
Female American Indian 42.9 (28.3-58.8) 41.2 (34.5-48.2) 43.7 (38.3-49.3) 42.6 (32.9-53.1) 42.6 (37.4-47.9)
Asian/Pacific Islander -- -- -- -- 46.4 (36.2-56.9)
Black -- -- -- -- 48.8 (39.5-58.3)
Hispanic 42.6 (35.4-50.1) 46.7 (39.6-53.9) 44.6 (37.3-52.1) 44.6 (40.3-48.9) 44.9 (41.6-48.3)
White 49.2 (39.9-58.6) 35.3 (28.8-42.4) 49.2 (40.2-58.2) 50.6 (43.6-57.4) 46.0 (41.5-50.7)
Total 44.6 (39.2-50.1) 42.4 (38.0-47.0) 46.7 (42.2-51.3) 46.4 (42.8-49.9) 45.1 (42.7-47.5)
Total American Indian 31.9 (23.9-41.0) 32.5 (27.3-38.2) 30.5 (25.8-35.7) 36.3 (28.8-44.5) 32.6 (29.1-36.3)
Asian/Pacific Islander -- 42.4 (30.8-55.0) 50.4 (31.3-69.4) -- 40.9 (32.9-49.4)
Black 20.8 (14.0-29.9) 35.8 (25.9-47.1) -- -- 32.8 (26.6-39.7)
Hispanic 32.5 (28.3-36.9) 37.7 (32.9-42.7) 38.6 (34.5-42.7) 38.7 (34.9-42.7) 36.8 (34.8-38.9)
White 34.8 (28.1-42.1) 32.8 (27.5-38.6) 38.8 (31.9-46.2) 36.6 (32.2-41.3) 35.7 (32.3-39.1)
Total 32.7 (29.6-36.0) 35.3 (32.6-38.2) 38.0 (34.4-41.8) 37.7 (35.1-40.4) 35.8 (33.9-37.8)
Source: YRRS (NM); NMDOH Survey Section (NOTE: "95% CI" is 95% confidence interval)
New Mexico Substance Use Epidemiology Profile Page 55
YOUTH FEELINGS OF SADNESS OR HOPELESSNESS
Problem Statement
Chart 1: Feelings of Sadness or Hopelessness* by Year, Grades 9 - 12, NM and US, 2003-2017
Table 1: Feelings of Sadness or Hopelessness, by Grade Level, Gender, and Race/Ethnicity, Grades 9 - 12, NM, 2017
31.928.7
30.8 29.7 29.1 30.5 32.535.8
28.6 28.5 28.526.1
28.5 29.9 29.9 31.5
0
10
20
30
40
50
2003 2005 2007 2009 2011 2013 2015 2017
Pe
rce
nt
(%)
Year
NM
US
Persistent feelings of sadness and hopelessness are criteria for, and predictors of, clinical depression for youth, and youth whoexperience depression are at a higher risk for being depressed as adults. Persistent sadness in youth has also been linked withsuicidal behavior, drug and alcohol use, unsafe sex, and academic and social deficits. Feelings of sadness or loneliness not onlyaffect teens, but those around them, often causing problems in relationships with peers and family members.
The prevalence of persistent feelings of sadness or hopelessness among NM high school students remained stable from 2003-2017 (Chart 1). In 2017, there was a statistically significant difference between the US rate (31.5%) and the NM rate (35.8%). In2017 in NM, girls (45.1%) were nearly twice as likely to report feelings of sadness or hopelessness than boys (26.6%), reflective ofa continuing disparity (Chart 2). There were no statistically significant variations by grade level or by race/ethnicity.
As Charts 3 and 4 demonstrate, in 2017, the counties with the highest prevalence of persistent feelings of sadness or hopelessnesswere Sierra (46.2%), McKinley (42.9%), Luna (42.4%), Roosevelt (40.8%), and Santa Fe (39.8%). The counties with the lowestprevalence were Mora (23.3%), Union (25.8%) and Hidalgo (28.0%).

Source: YRRS (NM); NMDOH Survey Section (NOTE: Brackets around reported rates are 95% confidence intervals)
* Estimate of percent of high school students who reported persistent feelings of sadness or hopelessness within the past 12 months
De Baca, Catron, and Harding County estimates not available because of small numbers and/or low response rates
Source: YRRS (NM); NMDOH Survey Section (NOTE: Brackets around reported rates are 95% confidence intervals)
New Mexico Substance Use Epidemiology Profile Page 56
Chart 2: Feelings of Sadness or Hopelessness, by Grade Level, Gender, and Race/Ethnicity, Grades 9 - 12, NM,
2017
YOUTH FEELINGS OF SADNESS OR HOPELESSNESS (continued)
Chart 3: Feelings of Sadness or Hopelessness* by County, Grades 9 - 12, NM, 2017
31.5
23.3
25.8
28.0
32.1
33.2
33.2
33.8
34.1
34.2
34.3
34.5
34.7
35.7
35.8
35.8
35.9
35.9
35.9
36.1
36.4
36.8
37.0
37.6
37.6
38.8
38.9
39.8
40.8
42.4
42.9
46.2
0 20 40 60 80 100
United States
Mora
Union
Hidalgo
Socorro
Los Alamos
San Miguel
Torrance
Taos
Chaves
Grant
Guadalupe
Valencia
Lincoln
Colfax
New Mexico
Bernalillo
Curry
San Juan
Dona Ana
Lea
Eddy
Sandoval
Cibola
Quay
Otero
Rio Arriba
Santa Fe
Roosevelt
Luna
McKinley
Sierra
Percent (%)*
35.8
26.6
45.1
32.7 35.3 38.0 37.732.6
40.932.8
36.8 35.7
0
25
50
75
100
Pe
rce
nt
(%)

Chart 4: Feelings of Sadness or Hopelessness* by County, Grades 9 - 12, NM, 2017
* Estimate of percent of high school students who reported persistent feelings of sadness or hopelessness within the past 12 months
Insufficient Data: County estimates not available because of small numbers and/or low response rates
Source: YRRS (NM); NMDOH Survey Section; SAES
New Mexico Substance Use Epidemiology Profile Page 57
YOUTH FEELINGS OF SADNESS OR HOPELESSNESS (continued)
Youth Persistent Sadness or Hopelessness (%)

New Mexico Substance Use Epidemiology Profile Page 58

* Estimate of percent of high school students seriously considered suicide at least once in past 12 months
Source: YRRS (NM); CDC YRBS (US); NMDOH Survey Section (NOTE: Brackets around reported rates are 95% confidence intervals)
9th Grade 10th Grade 11th Grade 12th Grade All Grades
Sex Race/Ethnicity Percent [95% CI] Percent [95% CI] Percent [95% CI] Percent [95% CI] Percent [95% CI]
Male American Indian 12.7 (8.5-18.6) 10.8 (5.9-18.9) 15.0 (8.0-26.3) 12.6 (6.2-23.9) 12.6 (9.7-16.3)
Asian/Pacific Islander -- -- -- -- 18.9 (12.4-27.6)
Black -- -- -- -- 15.9 (10.2-24.1)
Hispanic 11.3 (7.9-15.8) 12.3 (8.3-17.7) 10.9 (7.5-15.6) 15.7 (12.4-19.8) 12.5 (10.4-14.9)
White 10.8 (6.8-16.9) 15.3 (9.5-23.9) 13.4 (8.7-20.3) 14.0 (10.4-18.5) 13.3 (10.4-16.8)
Total 11.4 (8.9-14.5) 13.5 (10.4-17.3) 12.7 (10.2-15.6) 15.1 (13.0-17.4) 13.0 (11.7-14.5)
Female American Indian 24.5 (19.4-30.3) 18.0 (11.2-27.6) 22.0 (17.2-27.7) 23.7 (16.9-32.2) 22.3 (19.4-25.5)
Asian/Pacific Islander -- -- -- -- 27.4 (17.7-39.7)
Black -- -- -- -- 32.0 (21.7-44.5)
Hispanic 16.3 (13.5-19.5) 20.7 (16.5-25.7) 23.1 (16.9-30.7) 20.7 (16.6-25.5) 20.2 (17.6-23.0)
White 27.2 (20.4-35.3) 23.8 (17.5-31.6) 24.8 (18.3-32.8) 27.3 (21.2-34.5) 25.8 (22.5-29.4)
Total 21.6 (17.8-26.0) 21.7 (18.9-24.9) 23.8 (19.3-28.9) 23.7 (20.1-27.7) 22.7 (20.7-24.8)
Total American Indian 17.8 (14.6-21.6) 14.0 (9.9-19.4) 18.5 (13.3-25.2) 18.0 (12.4-25.3) 17.1 (15.0-19.4)
Asian/Pacific Islander -- 22.0 (12.9-35.0) 22.4 (12.4-37.2) -- 22.5 (16.9-29.3)
Black 19.8 (12.8-29.2) 25.2 (13.6-42.1) -- -- 23.2 (17.3-30.4)
Hispanic 14.0 (11.8-16.6) 16.7 (13.0-21.1) 17.4 (13.6-22.0) 18.4 (15.8-21.2) 16.5 (14.5-18.8)
White 18.9 (15.3-23.1) 19.3 (14.7-24.9) 18.9 (13.9-25.0) 20.1 (16.3-24.5) 19.2 (16.7-22.0)
Total 16.4 (14.5-18.6) 17.5 (15.2-20.2) 18.2 (15.4-21.4) 19.5 (17.2-22.0) 17.8 (16.3-19.5)
Source: YRRS (NM); NMDOH Survey Section (NOTE: "95% CI" is 95% confidence interval)
New Mexico Substance Use Epidemiology Profile Page 59
Table 1: Seriously Considered Suicide, by Grade Level, Gender, and Race/Ethnicity, Grades 9 - 12, NM, 2017
Problem Statement
Chart 1: Seriously Considered Suicide* by Year, Grades 9 - 12, NM and US, 2003-2017
YOUTH SERIOUSLY CONSIDERED SUICIDE
20.7 18.5 19.315.9 16.7
15.6 16.5
17.8
16.9 16.914.5 13.8 15.8
17.0 17.7
17.2
0
10
20
30
40
50
2003 2005 2007 2009 2011 2013 2015 2017
Pe
rce
nt
(%)
Year
NM
US
Suicide is a complex behavior with no single determining cause. Suicidal ideation refers to thoughts of suicide or wanting to take one'sown life. Suicidal ideation is a risk factor for suicide attempt/death.
Among NM high school students, the rate of "Seriously Considered Suicide" decreased significantly from 20.7% in 2003 to 16.5% in2015 (Chart 1) and then increased in 2017 to 17.8%. The difference between rates from 2009 to 2017 was not statistically significant.The US rate decreased from 2003 to 2009 but then increased from 2009 to 2017 (13.8% to 17.2%). There was no statistical differencebetween the NM and US rates for 2017.
In 2017 (Chart 2), New Mexico girls (22.7%) reported higher rates of having seriously considered suicide than boys (13.0%). Thisdifference between girls and boys was significant across all grades (Table 1).
As Charts 3 and 4 demonstrate, in 2017, the counties with the highest prevalence of youth seriously considering suicide were Roosevelt(29.7%), McKinley (24.8%), Eddy (23.9%), Sierra (23.4%), and Otero (23.4%). The counties with the lowest prevalence were Mora(8.0%) and Curry (11.8%). Only nine of the 33 NM counties had prevalence rates lower than the national rate in 2017.

Source: YRRS (NM); NMDOH Survey Section (NOTE: Brackets around reported rates are 95% confidence intervals)
* Estimate of percent of high school students seriously considered suicide at least once in past 12 months
De Baca, Catron, and Harding County estimates not available because of small numbers and/or low response rates
Source: YRRS (NM); NMDOH Survey Section (NOTE: Brackets around reported rates are 95% confidence intervals)
New Mexico Substance Use Epidemiology Profile Page 60
Chart 2: Seriously Considered Suicide, by Grade Level, Gender, and Race/Ethnicity, Grades 9 - 12, NM, 2017
YOUTH SERIOUSLY CONSIDERED SUICIDE (continued)
Chart 3. Seriously Considered Suicide* by County, Grades 9 - 12, NM, 2017
17.2
8.0
11.8
14.3
15.2
15.6
16.4
16.7
16.9
17.0
17.3
17.8
18.4
18.5
18.5
18.8
18.8
18.9
19.2
19.3
19.4
19.5
19.7
20.9
21.0
21.2
23.3
23.4
23.4
23.9
24.8
29.7
0 20 40 60 80 100
United States
Mora
Curry
Dona Ana
Chaves
Lea
Hidalgo
Luna
Guadalupe
Valencia
Santa Fe
New Mexico
San Juan
Bernalillo
Quay
Lincoln
Sandoval
San Miguel
Torrance
Grant
Union
Colfax
Socorro
Taos
Rio Arriba
Los Alamos
Cibola
Otero
Sierra
Eddy
McKinley
Roosevelt
Percent (%)*
17.813.0
22.716.4 17.5 18.2 19.5 17.1
22.5 23.216.5 19.2
0
25
50
75
100
Pe
rce
nt
(%)

Chart 4: Seriously Considered Suicide* by County, Grades 9 - 12, NM, 2017
* Estimate of percent of high school students seriously considered suicide at least once in past 12 months
Insufficient Data: County estimates not available because of small numbers and/or low response rates
Source: YRRS (NM); NMDOH Survey Section; SAES
New Mexico Substance Use Epidemiology Profile Page 61
YOUTH SERIOUSLY CONSIDERED SUICIDE (continued)
Youth Seriously Considered Suicide (%)

New Mexico Substance Use Epidemiology Profile Page 62

* Attempted suicide at least one time in the past 12 months
Source: YRRS (NM); CDC YRBS (US); NMDOH Survey Section (NOTE: Brackets around reported rates are 95% confidence intervals)
9th Grade 10th Grade 11th Grade 12th Grade All Grades
Sex Race/Ethnicity Percent [95% CI] Percent [95% CI] Percent [95% CI] Percent [95% CI] Percent [95% CI]
Male American Indian 7.6 (4.1-13.7) 11.5 (5.8-21.5) 7.6 (4.5-12.4) 13.8 (8.3-22.2) 9.9 (7.2-13.5)
Asian/Pacific Islander -- -- -- -- 13.1 (7.2-22.5)
Black -- -- -- -- 15.5 (7.2-30.2)
Hispanic 7.1 (4.1-11.9) 8.6 (5.8-12.6) 7.0 (4.1-11.5) 7.1 (3.8-12.9) 7.4 (5.9-9.4)
White 4.8 (2.2-10.1) 8.1 (4.0-15.8) 6.5 (3.6-11.5) 4.3 (1.9-9.4) 5.9 (4.3-8.2)
Total 6.9 (4.7-9.9) 9.3 (6.8-12.4) 6.9 (5.5-8.6) 7.8 (5.7-10.5) 7.7 (6.5-9.0)
Female American Indian 16.3 (10.1-25.2) 16.2 (6.4-35.2) 18.1 (11.6-27.1) 8.7 (4.0-17.7) 15.5 (12.4-19.1)
Asian/Pacific Islander -- -- -- -- 8.2 (3.3-19.0)
Black -- -- -- -- 20.3 (10.4-35.8)
Hispanic 9.7 (6.6-14.1) 12.0 (8.6-16.6) 14.0 (9.4-20.3) 9.8 (6.2-15.1) 11.8 (9.4-14.7)
White 10.8 (6.5-17.4) 8.8 (5.2-14.5) 11.2 (6.4-18.7) 9.4 (5.8-14.7) 10.1 (7.8-13.0)
Total 11.0 (8.1-14.7) 11.9 (9.1-15.5) 13.5 (10.3-17.6) 10.0 (7.3-13.6) 11.9 (10.0-14.1)
Total American Indian 11.6 (7.5-17.5) 13.6 (8.1-22.0) 12.9 (9.6-17.1) 11.2 (7.0-17.6) 12.7 (10.4-15.3)
Asian/Pacific Islander -- 9.4 (3.3-24.2) -- -- 10.9 (6.8-17.1)
Black 16.2 (7.7-30.9) 18.9 (7.6-39.9) -- -- 18.4 (11.5-28.1)
Hispanic 8.6 (6.5-11.4) 10.4 (7.8-13.8) 10.8 (7.8-14.7) 8.6 (5.8-12.6) 9.8 (8.1-11.9)
White 7.8 (5.4-11.0) 8.4 (4.9-14.1) 8.8 (5.9-12.8) 6.7 (4.4-10.0) 7.9 (6.2-10.1)
Total 9.0 (7.1-11.3) 10.6 (8.5-13.2) 10.3 (8.6-12.2) 8.9 (6.8-11.7) 9.9 (8.5-11.5)
Source: YRRS (NM); NMDOH Survey Section (NOTE: "95% CI" is 95% confidence interval)
New Mexico Substance Use Epidemiology Profile Page 63
Table 1: Attempted Suicide, by Grade Level, Gender, and Race/Ethnicity, Grades 9 - 12, NM, 2017
Problem Statement
Chart 1: Attempted Suicide* by Year, Grades 9 - 12, NM and US, 2003-2017
YOUTH ATTEMPTED SUICIDE
14.512.5 14.3
9.7 8.6 9.4 9.4 9.9
8.5 8.4 6.9 6.3 7.8 8.0 8.6 7.40
10
20
30
40
50
2003 2005 2007 2009 2011 2013 2015 2017
Pe
rce
nt
(%)
Year
NM
US
In NM in 2017, suicide was the leading cause of death for youth between the ages of 5-17. In the US in 2016 (the mostrecent year for which national data are available) according to the CDC, suicide was the second leading cause of death forthis same age group. While girls are more likely than boys to attempt suicide, boys are more likely than girls to die ofsuicide. A previous suicide attempt is among the strongest risk factors for completed suicide. As seen in Chart 1, theprevalence of past year suicide attempts among NM high school students decreased from 14.5% in 2003 to 9.4% in 2015with a slight increase to 9.9% in 2017. While the U.S. prevalence decreased from 2003 to 2009, it increased from 2009(6.3%) to 2015 (8.6%) before dropping slightly (7.4%) in 2017.
In NM in 2017, the prevalence of suicide attempts in the past year (Chart 2) was significantly higher for girls (11.9%)compared to boys (7.7%). Table 1 reveals that the percentage of attempts made by girls in the 11th (13.5%) grades wassignificantly higher than that for boys (6.9%). In 2017, the counties with the highest prevalence of suicide attempts wereMcKinley (18.3%), Rio Arriba (17.9%), Cibola (16.5%), Sierra (15.1%), and Eddy (13.5%). The counties with the lowestprevalence of suicide attempts were Curry (2.6%), Colfax (6.8%), Union (7.2%), Guadalupe (7.5%) and Los Alamos(7.6%). Only three NM counties were below the national prevalence rate of 7.4%.

Source: YRRS (NM); NMDOH Survey Section (NOTE: Brackets around reported rates are 95% confidence intervals)
* Estimate of percent of high school students who reported attempting suicide at least one time in the past 12 months
De Baca, Catron, and Harding County estimates not available because of small numbers and/or low response rates
Source: YRRS (NM); NMDOH Survey Section (NOTE: Brackets around reported rates are 95% confidence intervals)
New Mexico Substance Use Epidemiology Profile Page 64
Chart 2: Attempted Suicide, by Grade Level, Gender, and Race/Ethnicity, Grades 9 - 12, NM, 2017
Chart 3: Attempted Suicide* by County, Grades 9 - 12, NM, 2017
YOUTH ATTEMPTED SUICIDE (continued)
7.4
2.6
6.8
7.2
7.5
7.6
8.0
8.8
9.0
9.0
9.1
9.4
9.6
9.9
9.9
10.0
10.0
10.1
10.2
10.2
10.5
10.5
11.2
11.4
11.4
11.7
12.3
13.5
15.1
16.5
17.9
18.3
0 20 40 60 80 100
United States
Curry
Colfax
Union
Guadalupe
Los Alamos
Mora
Santa Fe
Dona Ana
Quay
Hidalgo
Sandoval
Bernalillo
Taos
New Mexico
Roosevelt
Valencia
San Juan
Chaves
Otero
Socorro
Torrance
Grant
Luna
San Miguel
Lincoln
Lea
Eddy
Sierra
Cibola
Rio Arriba
McKinley
Percent (%)*
9.9 7.711.9 9.0 10.6 10.3 8.9
12.7 10.918.4
9.8 7.9
0
25
50
75
100
Pe
rce
nt
(%)
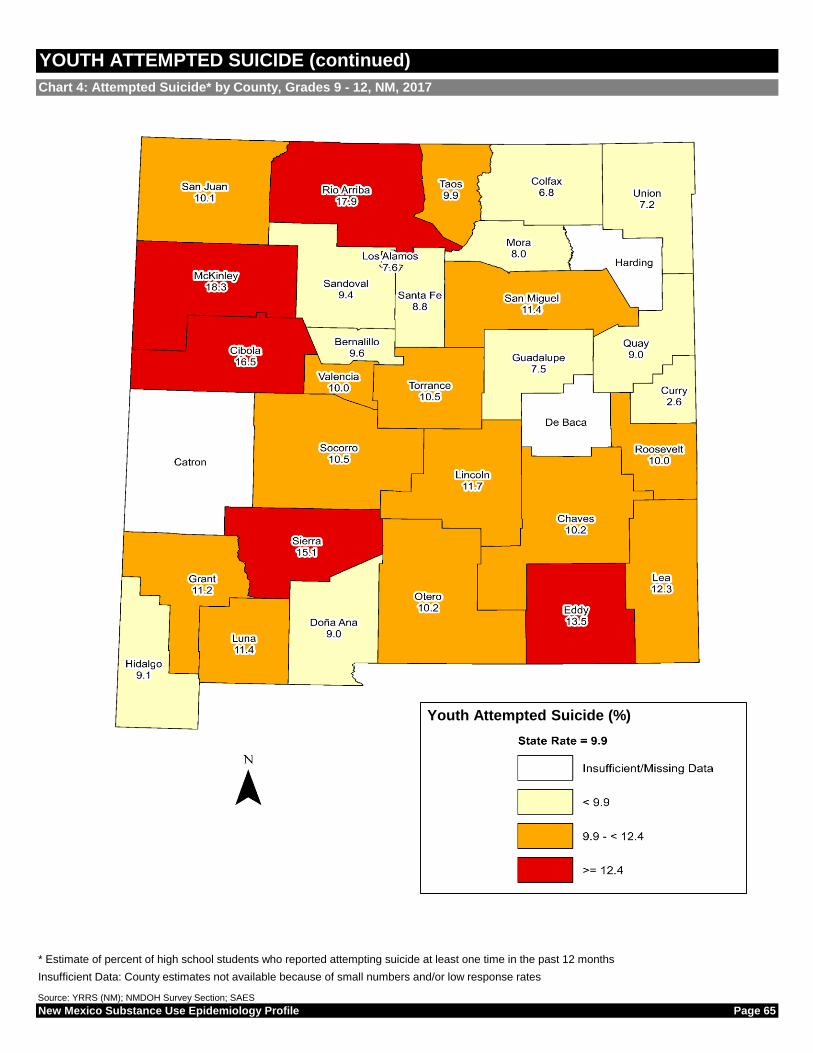
Chart 4: Attempted Suicide* by County, Grades 9 - 12, NM, 2017
* Estimate of percent of high school students who reported attempting suicide at least one time in the past 12 months
Insufficient Data: County estimates not available because of small numbers and/or low response rates
Source: YRRS (NM); NMDOH Survey Section; SAES
New Mexico Substance Use Epidemiology Profile Page 65
YOUTH ATTEMPTED SUICIDE (continued)
Youth Attempted Suicide (%)

New Mexico Substance Use Epidemiology Profile Page 66

Chart 1: Binge Drinking* by Selected Resiliency Factors, Grades 9-12, 2017
New Mexico Substance Use Epidemiology Profile Page 67
YOUTH RISK AND RESILIENCY
Association Between Risk and Resiliency
Strong relationships with parents, peers, schools, and adults in the community can be protective factors against risk behaviorsthat endanger the health and well-being of young people. These protective factors, or resiliency factors, are measured byseveral questions in the NM Youth Risk and Resiliency Survey (YRRS). Results from the 2017 YRRS demonstrate that youthwith high levels of these resiliency factors were less likely than other students to engage in binge drinking, drug use, tobaccouse, and suicidal ideation and attempts.
Resiliency factor results presented in the following charts are for:
- In my home, a parent or other adult is interested in my school work
- When I am not at home, one of my parents/guardians knows where I am and who I am with
- At my school, a teacher or other adult believes I will be a success
- In my school, there are clear rules about what students can and cannot do
- At school I am involved in sports, clubs, or other extra-curricular activities
- Outside my home and school, there is an adult who really cares about me
- Outside home and school, I am a part of group activities
- I plan to go to college or some other school after high school
- I have a friend about my own age who really cares about me
Students were asked how true each of these statements was for them. In each chart, results are organized by assigning oneof three colored bars to those who said the statement was "Very much true", another bar to those who said the statement was"A little true" or "Pretty much true" and another to those who said "Not true at all". The length of each bar represents thepercent of students who reported engaging in each risk behavior. In general, students who said "Very much true" to eachresiliency factor (dark colored bars) had a lower prevalence of risk behaviors than other students, and students who said "Nottrue at all" (light colored bars) had higher rates of risk behaviors.
Students were less likely to be binge drinkers if they said "Very much true" to any of the resiliency
questions:
* Had 5 or more drinks on a single occasion for boys or 4 or more drinks for girls (i.e., in a row or within a couple of hours) at least once in the past 30 days
16.6
24.8
13.4
15.7
14.6
16.3
13.9
20.5
14.8
12.9
15.7
12.6
13.2
12.3
14.0
10.5
16.4
11.3
8.5
7.1
9.2
8.7
8.4
9.1
8.3
8.2
10.4
0 20 40 60 80 100
In my home, a parent or other adult is interestedin my school work
When I am not at home, one of myparents/guardians knows where I am and who I
am with
At my school, a teacher or other adult believes Iwill be a success
In my school, there are clear rules about whatstudents can and cannot do
At school I am involved in sports, clubs, or otherextra-curricular activities
Outside my home and school, there is an adultwho really cares about me
Outside home and school, I am a part of groupactivities
I plan to go to college or some other school afterhigh school
I have a friend about my own age who reallycares about me
Not true at all
A Little or Pretty much true
Very much true
Percent (%) who were binge drinkers
Resiliency Factor Question

126
New Mexico Substance Use Epidemiology Profile Page 68
Chart 3: Used Pain Killers to Get High* by Selected Resiliency Factors, Grades 9-12, 2017
YOUTH RISK AND RESILIENCY (continued)
Chart 2: Current Marijuana Use* by Selected Resiliency Factors, Grades 9-12, 2017
Students were less likely to be current marijuana users if they said
"Very much true" to any of the resiliency questions:
* Used marijuana in the past 30 days
* Used a pain killer, like Vicodin, OxyContin, or Percocet, to get high in the past 30 days
13.4
19.7
17.3
15.8
7.9
17.3
8.1
19.5
17.1
8.2
10.1
7.2
7.7
10.6
8.8
8.4
10.9
7.8
4.3
3.5
4.7
5.0
4.5
4.6
4.2
3.9
5.0
0 20 40 60 80 100
In my home, a parent or other adult is interestedin my school work
When I am not at home, one of myparents/guardians knows where I am and who I
am with
At my school, a teacher or other adult believes Iwill be a success
In my school, there are clear rules about whatstudents can and cannot do
At school I am involved in sports, clubs, or otherextra-curricular activities
Outside my home and school, there is an adultwho really cares about me
Outside home and school, I am a part of groupactivities
I plan to go to college or some other schoolafter high school
I have a friend about my own age who reallycares about me
Not true at all
A Little or Pretty muchtrue
Very much true
Percent (%) who used painkillers to get high
Resiliency Factor Question
37.0
45.8
36.6
35.7
35.6
36.8
34.6
43.4
36.1
32.5
37.5
30.7
31.0
33.1
32.1
28.5
36.1
28.4
21.4
19.3
22.9
23.4
19.8
24.2
18.9
22.4
25.8
0 20 40 60 80 100
In my home, a parent or other adult isinterested in my school work
When I am not at home, one of myparents/guardians knows where I am and
who I am with
At my school, a teacher or other adultbelieves I will be a success
In my school, there are clear rules about whatstudents can and cannot do
At school I am involved in sports, clubs, orother extra-curricular activities
Outside my home and school, there is anadult who really cares about me
Outside home and school, I am a part ofgroup activities
I plan to go to college or some other schoolafter high school
I have a friend about my own age who reallycares about me
Not true at all
A Little or Prettymuch true
Very much true
Percent (%) who were current marijuana users
Resiliency Factor Question
Students were less likely to use pain killers to get high if they said "Very much true" to any of the resiliency
questions:

Chart 4: Current Cocaine Use* by Selected Resiliency Factors, Grades 9-12, 2017
Chart 5: Current Cigarette Smoking* by Selected Resiliency Factors, Grades 9-12, 2017
Page 1271
New Mexico Substance Use Epidemiology Profile Page 69
YOUTH RISK AND RESILIENCY (continued)
* Used any form of cocaine, including powder, crack, or freebase in the past 30 days
* Smoked cigarettes on at least one of the past 30 days
11.2
19.0
13.3
18.0
6.3
12.2
5.6
15.9
13.4
5.9
7.2
5.1
5.1
9.0
7.2
6.5
8.4
5.7
3.1
2.2
3.5
3.4
2.5
3.1
3.2
2.5
3.5
0 10 20 30 40 50
In my home, a parent or other adult is interested inmy school work
When I am not at home, one of myparents/guardians knows where I am and who I
am with
At my school, a teacher or other adult believes Iwill be a success
In my school, there are clear rules about whatstudents can and cannot do
At school I am involved in sports, clubs, or otherextra-curricular activities
Outside my home and school, there is an adultwho really cares about me
Outside home and school, I am a part of groupactivities
I plan to go to college or some other school afterhigh school
I have a friend about my own age who really caresabout me
Not true at all
A Little or Pretty muchtrue
Very much true
Percent (%) who were current cocaine users
Resiliency Factor Question
20.1
27.3
17.7
17.9
16.2
19.8
14.7
24.2
19.3
12.2
14.3
10.6
11.0
12.2
12.3
9.6
15.7
10.8
7.2
6.5
9.1
9.4
6.2
8.6
6.4
7.1
9.2
0 20 40 60 80 100
In my home, a parent or other adult isinterested in my school work
When I am not at home, one of myparents/guardians knows where I am and
who I am with
At my school, a teacher or other adultbelieves I will be a success
In my school, there are clear rules aboutwhat students can and cannot do
At school I am involved in sports, clubs, orother extra-curricular activities
Outside my home and school, there is anadult who really cares about me
Outside home and school, I am a part ofgroup activities
I plan to go to college or some other schoolafter high school
I have a friend about my own age who reallycares about me
Not true at all
A Little or Prettymuch true
Very much true
Percent (%) who were current cigarette smokers
Resiliency Factor Question
Students were less likely to be current cocaine users if they said "Very
much true" to any of the resiliency questions:
Students were less likely to be current cigarette smokers if they said
"Very much true" to any of the resiliency questions:

Chart 6: Feelings of Sadness or Hopelessness* by Selected Resiliency Factors, Grades 9-12, 2017
Chart 7: Suicide Attempts* by Selected Resiliency Factors, Grades 9-12, 2017
New Mexico Substance Use Epidemiology Profile Page 70
YOUTH RISK AND RESILIENCY (continued)
* Felt so sad or hopeless almost every day for at least two weeks that they stopped some normal activities, within the past 12 months
* Attempted suicide at least once in the past 12 months
49.9
50.4
49.6
46.6
42.3
52.0
43.4
37.6
49.7
41.7
42.1
38.2
39.1
38.2
40.5
35.7
41.7
35.5
28.8
31.1
32.0
32.7
31.7
32.2
29.1
33.9
35.0
0 20 40 60 80 100
In my home, a parent or other adult is interestedin my school work
When I am not at home, one of myparents/guardians knows where I am and who I
am with
At my school, a teacher or other adult believes Iwill be a success
In my school, there are clear rules about whatstudents can and cannot do
At school I am involved in sports, clubs, or otherextra-curricular activities
Outside my home and school, there is an adultwho really cares about me
Outside home and school, I am a part of groupactivities
I plan to go to college or some other school afterhigh school
I have a friend about my own age who reallycares about me
Not true at all
A Little or Pretty muchtrue
Very much true
Percent (%) who felt feelings of sadness or hopelessness
Resiliency Factor Question
20.7
24.5
20.9
17.2
12.0
24.8
12.0
20.0
22.3
11.4
12.0
10.8
9.8
12.7
13.5
11.4
13.4
10.3
6.5
7.3
7.0
9.1
7.3
6.4
6.4
7.5
8.1
0 20 40 60 80 100
In my home, a parent or other adult is interestedin my school work
When I am not at home, one of myparents/guardians knows where I am and who I
am with
At my school, a teacher or other adult believes Iwill be a success
In my school, there are clear rules about whatstudents can and cannot do
At school I am involved in sports, clubs, or otherextra-curricular activities
Outside my home and school, there is an adultwho really cares about me
Outside home and school, I am a part of groupactivities
I plan to go to college or some other school afterhigh school
I have a friend about my own age who reallycares about me
Not true at all
A Little or Pretty muchtrue
Very much true
Percent (%) who attempted suicide
Resiliency Factor Question
Students were less likely to have feelings of sadness and hopelessness if they said "Very much true" to any of the
resiliency questions:
Students were less likely to attempt suicide if they said "Very much true" to
any of the resiliency questions:

Consumption
New Mexico Substance Use Epidemiology Profile Page 71
Section 3

New Mexico Substance Use Epidemiology Profile Page 72

* Binge drinking definition: 1998-2005, drinking five or more drinks on an occasion at least once in the past 30 days; 2006-present,
drinking five or more drinks (for men) or four or more drinks (for women) on an occasion at least once in the past 30 days
**In 2011, BRFSS updated its surveillance methods. Any shift in prevalence between 2010 and 2011 must be interpreted with
caution, as it may be partially due to changes in methodology.
Source: BRFSS; SAES (NOTE: Brackets around reported rates are 95% confidence intervals)
Table 1: Binge Drinking (past 30 days) by Age, Sex, and Race, Adults Aged 18+, New Mexico,2015-2017
Ages Ages Ages All Ages Ages Ages All
Sex Race/Ethnicity 18-24 25-64 65+ Ages 18-24 25-64 65+ Ages*
Male American Indian 3,078 9,563 350 12,996 29.1 20.7 4.6 20.2
Asian/Pacific Islander - 520 - 1,501 - 5.7 - 11.9
Black - 2,372 - 3,389 - 17.5 - 17.4
Hispanic 13,390 63,534 3,502 80,568 22.7 25.8 6.9 22.7
White 9,575 39,319 5,272 53,632 30.9 18.7 5.6 15.9
Total 26,727 114,219 9,941 150,453 25.2 21.7 6.3 19.1
Female American Indian 1,312 5,963 8 7,494 12.4 11.8 0.1 10.4
Asian/Pacific Islander - 991 - 1,288 - 8.5 - 8.1
Black - 1,334 - 1,466 - 13.9 - 10.2
Hispanic 8,643 24,607 903 34,248 15.2 9.9 1.5 9.3
White 6,281 24,062 2,528 32,352 23.8 11.3 2.3 9.3
Total 16,001 58,093 3,610 77,421 16.4 10.9 1.9 9.5
Total American Indian 4,258 15,385 380 20,316 20.1 15.9 2.0 14.9
Asian/Pacific Islander - 1,455 - 2,913 - 7.0 - 10.2
Black - 3,607 817 4,582 - 15.6 16.8 13.5
Hispanic 22,074 87,601 4,360 114,294 19.1 17.7 3.9 15.8
White 15,752 63,365 7,704 85,638 27.4 15.0 3.8 12.5
Total 42,578 171,879 13,487 227,150 20.9 16.2 3.9 14.1
* Estimate of percent of people in population group who reported binge drinking at least once in past 30 days
- Excluded due to small number of respondents (< 50) in cell
Source: BRFSS; SAES
New Mexico Substance Use Epidemiology Profile Page 73
ADULT BINGE DRINKING
Problem Statement
Number Percent*
Chart 1: Binge Drinking (past 30 days)* by Age, Adults Aged 18+, New Mexico, 1998-2017
27.225.3 26.4 27.3 26.9
28.9
24.722.6 21.9
16.2 17.4
22.020.2
24.6 24.523.1
19.321.1 21 20.6
14.315.8 16.5 16.7
14.5 15.413.2 10.3
13.8 13.5 12.7 13.7 12.7
18.3 17.1 16 15.814.1
17.8 17.1
3.4 3.5 4.3 3.2 3.2 3.4 2.62.0
2.7 3.21.6 2.6 2.4 3.7 3.4 3.5 3.7 3.9 2.9
4.8
0
5
10
15
20
25
30
35
40
Pe
rce
nt
(%)
Year
Age 18-24
Age 25-64
Age 65+
Binge drinking is defined as a pattern of alcohol consumption that brings the blood alcohol concentration (BAC)level to 0.08% or above. This pattern of drinking usually corresponds to five or more drinks on a single occasionfor men, or four or more drinks on a single occasion for women, generally within about two hours. According tothe latest estimates from the Centers for Disease Control and Prevention, about 47% of homicides, 32% of fallinjury deaths, 29% of drug overdose deaths, and 23% of suicide deaths are alcohol attributable. Likewise,alcohol consumption is the primary causal factor in roughly 45% of motor vehicle crash deaths among malesaged 20-44, and in more than a third of motor vehicle crash deaths among females aged 20-44. Binge drinkingis also associated with a wide range of other social problems, including domestic and sexual violence, crime,and risky sexual behavior.
Table 1 shows that binge drinking rates decrease with age and are higher among males. Chart 1 shows thatbinge drinking prevalence among younger adults has remained relatively stable. Chart 2 shows that adults whodo binge drink continue to do so on average four to five times per month and drink well above the binge drinkingthreshold when they do. County-level results are shown in Table 2 and Charts 3-4.

* Binge frequency is the number of binge episodes in the past 30 days; binge intensity is the average number of drinks on the last binge occasion;
maximum drinks is the maximum number of drinks in the past month, among binge drinkers
Source: BRFSS; SAES
CountyAmerican
Indian
Asian/
Pacific
Islander
Black Hispanic White All
Races
American
Indian
Asian/
Pacific
Islander
Black Hispanic White All
Races
Bernalillo 3,005 - - 37,539 26,991 69,588 13.6 - - 15.5 11.6 13.2
Catron - - - - - 501 - - - - - 15.7
Chaves - - - 3,570 1,709 5,555 - - - 14.4 7.9 11.5
Cibola 897 - - 731 299 1,835 11.4 - - 9.2 6.4 8.8
Colfax - - - - 590 1,394 - - - - 11.1 13.4
Curry - - - 2,833 3,158 6,832 - - - 20.7 15.8 18.5
De Baca - - - - - - - - - - - -
Dona Ana - - - 16,791 5,240 22,787 - - - 16.2 10.1 14.1
Eddy - - - 4,439 2,943 7,503 - - - 23.5 13.5 17.8
Grant - - - 1,540 1,264 2,743 - - - 14.5 10.9 12.0
Guadalupe - - - - - - - - - - - -
Harding - - - - - - - - - - - -
Hidalgo - - - - - - - - - - - -
Lea - - - 4,785 3,663 8,783 - - - 18.9 18.0 18.1
Lincoln - - - - 1,774 2,640 - - - - 16.0 16.3
Los Alamos - - - - 999 1,144 - - - - 9.4 8.1
Luna - - - 2,212 349 2,881 - - - 19.9 5.3 15.8
McKinley 5,397 - - 980 250 6,709 13.9 - - 15.2 4.4 13.0
Mora - - - - - - - - - - - -
Otero 725 - - 1,393 3,569 5,893 25.5 - - 8.2 13.0 11.8
Quay - - - - 1,024 1,912 - - - - 27.9 28.6
Rio Arriba - - - 1,547 416 2,354 - - - 7.3 9.0 7.8
Roosevelt - - - - 1,131 2,048 - - - - 13.2 13.8
Sandoval - - - 10,982 5,451 20,381 - - - 28.7 10.3 18.9
San Juan 2,586 - - 2,543 4,835 9,916 7.3 - - 15.7 11.9 10.6
San Miguel - - - 2,367 446 3,318 - - - 13.7 9.8 14.6
Santa Fe - - - 7,221 7,118 15,197 - - - 12.8 12.2 12.6
Sierra - - - - 1,008 1,183 - - - - 14.9 12.4
Socorro - - - - - 2,844 - - - - - 21.3
Taos - - - 1,226 1,092 2,291 - - - 8.4 10.2 8.4
Torrance - - - - - - - - - - - -
Union - - - - - - - - - - - -
Valencia - - - 6,342 1,686 8,926 - - - 19.2 7.8 15.4
New Mexico 20,316 2,913 4,582 114,294 85,638 227,150 14.9 10.2 13.5 15.8 12.5 14.1
* Estimate of percent of people in population group who reported binge drinking at least once in past 30 days
- Excluded due to small number of respondents (< 50) in cell
Source: BRFSS; SAES
New Mexico Substance Use Epidemiology Profile Page 74
Chart 2: Binge Drinking Frequency and Intensity*, Adult Binge Drinkers Aged 18+, New Mexico, 1998-2017
ADULT BINGE DRINKING (continued)
Table 2: Binge Drinking (past 30 days) by Race and County, Adults Aged 18+, New Mexico, 2015-2017
Number Percent*
1998 1999 2000 2001 2002 2003 2004 2005 2006 2007 2008 2009 2010 2011 2012 2013 2014 2015 2016 2017
Intensity 7.9 8.2 0.0 7.4 7.5
Maximum Drinks 8.4 8.3 7.7 8.1 8.2 7.9 8.3 8.6 8.5 8.4 8.4 8.1 7.9
Frequency 5.0 4.2 3.9 4.0 4.4 4.7 3.9 4.3 3.8 3.9 4.5 3.7 3.9 4.0 4.3 4.4 4.8 4.0 4.1 4.7
0
1
2
3
4
5
6
0123456789
10
Bin
ge
Fre
qu
en
cy
Bin
ge I
nte
nsit
y/
Max
imu
m D
rin
ks
Year
Intensity
Maximum Drinks
Frequency

* Estimate of percent of people in population group who reported binge drinking at least once in past 30 days
Source: NMBRFSS (NM); CDC BRFSS (US); SAES
New Mexico Substance Use Epidemiology Profile Page 75
Chart 3: Binge Drinking (past 30 days)* by County, Adults Aged 18+, New Mexico, 2015-2017
ADULT BINGE DRINKING (continued)
16.9
7.8
8.1
8.4
8.8
10.6
11.5
11.8
12.0
12.4
12.6
13.0
13.2
13.4
13.8
14.1
14.1
14.6
15.4
15.7
15.8
16.3
17.8
18.1
18.5
18.9
21.3
28.6
0 10 20 30 40 50
United States 2016
Rio Arriba (2354; 1.0%)
Los Alamos (1144; 0.5%)
Taos (2291; 1.0%)
Cibola (1835; 0.8%)
San Juan (9916; 4.4%)
Chaves (5555; 2.4%)
Otero (5893; 2.6%)
Grant (2743; 1.2%)
Sierra (1183; 0.5%)
Santa Fe (15197; 6.7%)
McKinley (6709; 3.0%)
Bernalillo (69588; 30.6%)
Colfax (1394; 0.6%)
Roosevelt (2048; 0.9%)
Dona Ana (22787; 10.0%)
New Mexico (227150; 100.0%)
San Miguel (3318; 1.5%)
Valencia (8926; 3.9%)
Catron (501; 0.2%)
Luna (2881; 1.3%)
Lincoln (2640; 1.2%)
Eddy (7503; 3.3%)
Lea (8783; 3.9%)
Curry (6832; 3.0%)
Sandoval (20381; 9.0%)
Socorro (2844; 1.3%)
Quay (1912; 0.8%)
Percent (%)*
County (# of binge drinkers; % of statewide binge drinkers)

* Estimate of percent of people in population group who reported binge drinking at least once in past 30 days
Insufficient data: Rate not reported due to small number of respondents (< 50) in cell
Source: BRFSS; SAES
New Mexico Substance Use Epidemiology Profile Page 76
ADULT BINGE DRINKING (continued)
Chart 4: Binge Drinking (past 30 days)* by County, Adults Aged 18+, New Mexico, 2015-2017
Adult Binge Drinking (%)
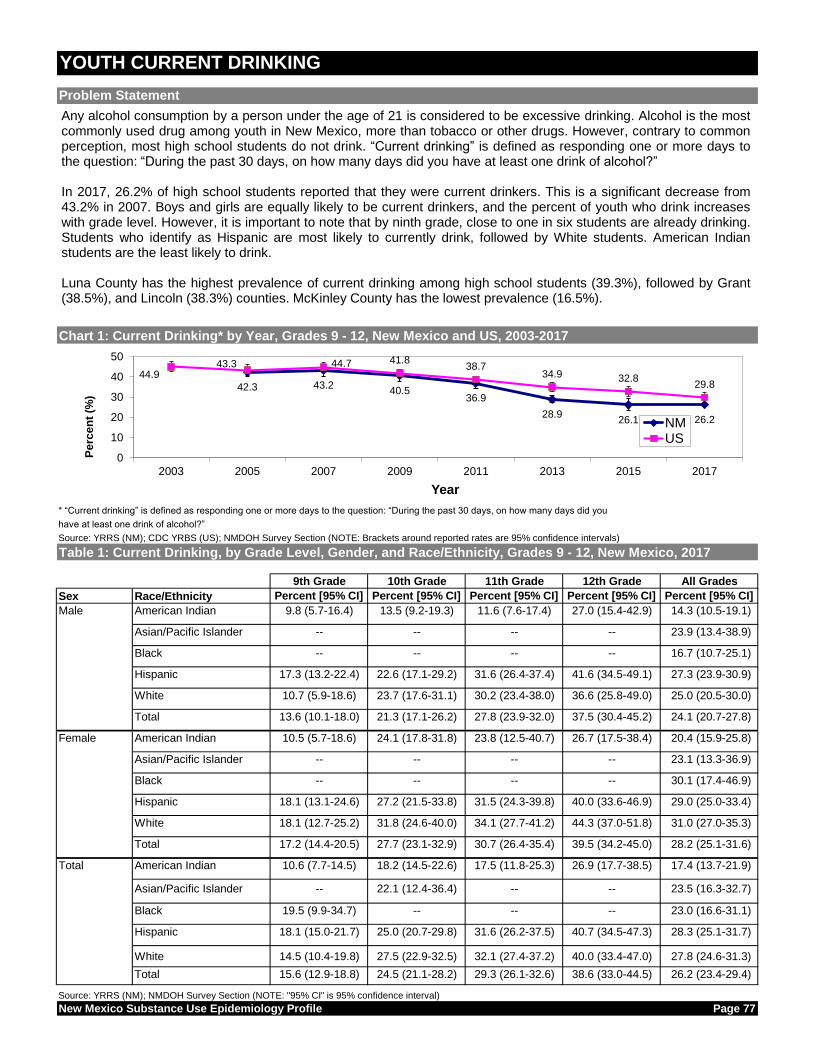
* “Current drinking” is defined as responding one or more days to the question: “During the past 30 days, on how many days did you
have at least one drink of alcohol?”
Source: YRRS (NM); CDC YRBS (US); NMDOH Survey Section (NOTE: Brackets around reported rates are 95% confidence intervals)
9th Grade 10th Grade 11th Grade 12th Grade All Grades
Sex Race/Ethnicity Percent [95% CI] Percent [95% CI] Percent [95% CI] Percent [95% CI] Percent [95% CI]
Male American Indian 9.8 (5.7-16.4) 13.5 (9.2-19.3) 11.6 (7.6-17.4) 27.0 (15.4-42.9) 14.3 (10.5-19.1)
Asian/Pacific Islander -- -- -- -- 23.9 (13.4-38.9)
Black -- -- -- -- 16.7 (10.7-25.1)
Hispanic 17.3 (13.2-22.4) 22.6 (17.1-29.2) 31.6 (26.4-37.4) 41.6 (34.5-49.1) 27.3 (23.9-30.9)
White 10.7 (5.9-18.6) 23.7 (17.6-31.1) 30.2 (23.4-38.0) 36.6 (25.8-49.0) 25.0 (20.5-30.0)
Total 13.6 (10.1-18.0) 21.3 (17.1-26.2) 27.8 (23.9-32.0) 37.5 (30.4-45.2) 24.1 (20.7-27.8)
Female American Indian 10.5 (5.7-18.6) 24.1 (17.8-31.8) 23.8 (12.5-40.7) 26.7 (17.5-38.4) 20.4 (15.9-25.8)
Asian/Pacific Islander -- -- -- -- 23.1 (13.3-36.9)
Black -- -- -- -- 30.1 (17.4-46.9)
Hispanic 18.1 (13.1-24.6) 27.2 (21.5-33.8) 31.5 (24.3-39.8) 40.0 (33.6-46.9) 29.0 (25.0-33.4)
White 18.1 (12.7-25.2) 31.8 (24.6-40.0) 34.1 (27.7-41.2) 44.3 (37.0-51.8) 31.0 (27.0-35.3)
Total 17.2 (14.4-20.5) 27.7 (23.1-32.9) 30.7 (26.4-35.4) 39.5 (34.2-45.0) 28.2 (25.1-31.6)
Total American Indian 10.6 (7.7-14.5) 18.2 (14.5-22.6) 17.5 (11.8-25.3) 26.9 (17.7-38.5) 17.4 (13.7-21.9)
Asian/Pacific Islander -- 22.1 (12.4-36.4) -- -- 23.5 (16.3-32.7)
Black 19.5 (9.9-34.7) -- -- -- 23.0 (16.6-31.1)
Hispanic 18.1 (15.0-21.7) 25.0 (20.7-29.8) 31.6 (26.2-37.5) 40.7 (34.5-47.3) 28.3 (25.1-31.7)
White 14.5 (10.4-19.8) 27.5 (22.9-32.5) 32.1 (27.4-37.2) 40.0 (33.4-47.0) 27.8 (24.6-31.3)
Total 15.6 (12.9-18.8) 24.5 (21.1-28.2) 29.3 (26.1-32.6) 38.6 (33.0-44.5) 26.2 (23.4-29.4)
Source: YRRS (NM); NMDOH Survey Section (NOTE: "95% CI" is 95% confidence interval)
New Mexico Substance Use Epidemiology Profile Page 77
Problem Statement
Chart 1: Current Drinking* by Year, Grades 9 - 12, New Mexico and US, 2003-2017
YOUTH CURRENT DRINKING
Table 1: Current Drinking, by Grade Level, Gender, and Race/Ethnicity, Grades 9 - 12, New Mexico, 2017
42.3 43.240.5
36.9
28.926.1 26.2
44.943.3 44.7 41.8
38.734.9 32.8
29.8
0
10
20
30
40
50
2003 2005 2007 2009 2011 2013 2015 2017
Pe
rce
nt
(%)
Year
NMUS
Any alcohol consumption by a person under the age of 21 is considered to be excessive drinking. Alcohol is the mostcommonly used drug among youth in New Mexico, more than tobacco or other drugs. However, contrary to commonperception, most high school students do not drink. “Current drinking” is defined as responding one or more days tothe question: “During the past 30 days, on how many days did you have at least one drink of alcohol?”
In 2017, 26.2% of high school students reported that they were current drinkers. This is a significant decrease from43.2% in 2007. Boys and girls are equally likely to be current drinkers, and the percent of youth who drink increaseswith grade level. However, it is important to note that by ninth grade, close to one in six students are already drinking.Students who identify as Hispanic are most likely to currently drink, followed by White students. American Indianstudents are the least likely to drink.
Luna County has the highest prevalence of current drinking among high school students (39.3%), followed by Grant(38.5%), and Lincoln (38.3%) counties. McKinley County has the lowest prevalence (16.5%).

Source: YRRS (NM); NMDOH Survey Section (NOTE: Brackets around reported rates are 95% confidence intervals)
* Estimate of percent of high school students who reported current drinking in past 30 days
De Baca, Catron, and Harding County estimates not available because of low numbers and/or low response rates
Source: YRRS (NM); NMDOH Survey Section (NOTE: Brackets around reported rates are 95% confidence intervals)
New Mexico Substance Use Epidemiology Profile Page 78
Chart 2: Current Drinking, by Grade Level, Gender, and Race/Ethnicity, Grades 9 - 12, New Mexico, 2017
YOUTH CURRENT DRINKING (continued)
Chart 3: Current Drinking* by County, Grades 9 - 12, New Mexico, 2017
29.8
16.5
20.0
21.3
21.5
22.0
25.4
25.8
26.2
26.4
26.7
26.8
27.2
27.3
27.5
28.2
28.4
29.1
29.7
29.9
30.3
31.3
31.8
31.9
32.0
32.6
34.2
36.6
36.8
38.3
38.5
39.3
0 20 40 60 80 100
United States
McKinley
Curry
San Juan
Hidalgo
Los Alamos
Valencia
Quay
New Mexico
Bernalillo
Colfax
Mora
Guadalupe
Torrance
Sandoval
San Miguel
Santa Fe
Eddy
Socorro
Chaves
Otero
Sierra
Dona Ana
Cibola
Roosevelt
Union
Rio Arriba
Lea
Taos
Lincoln
Grant
Luna
Percent (%)*
26.2 24.128.2
15.624.5
29.3
38.6
17.423.5 23.0
28.3 27.8
0
25
50
75
100
Pe
rce
nt
(%)
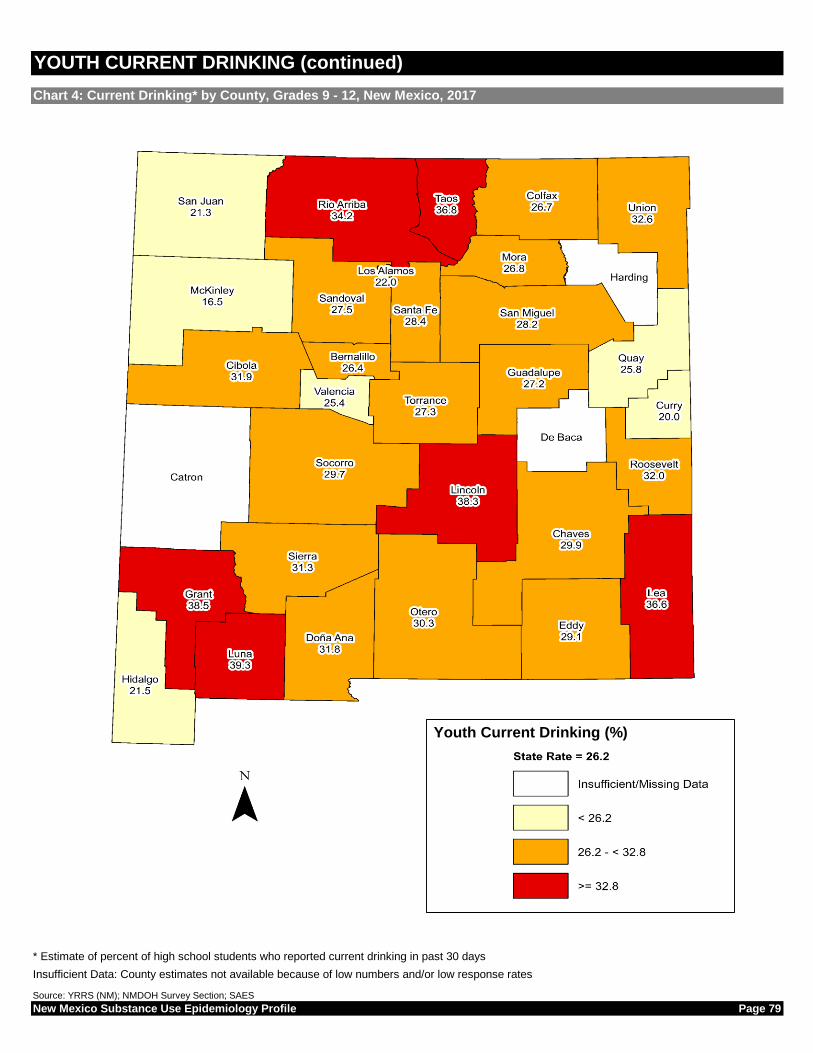
Chart 4: Current Drinking* by County, Grades 9 - 12, New Mexico, 2017
* Estimate of percent of high school students who reported current drinking in past 30 days
Insufficient Data: County estimates not available because of low numbers and/or low response rates
Source: YRRS (NM); NMDOH Survey Section; SAES
New Mexico Substance Use Epidemiology Profile Page 79
YOUTH CURRENT DRINKING (continued)
Youth Current Drinking (%)

New Mexico Substance Use Epidemiology Profile Page 80

*In 2017 - Had 5 or more drinks of alcohol for boys or 4 or more drinks for girls in a row, or within a couple of hours, in the past 30 days.
For years 2015 and earlier - 5 or more drinks of alcohol in a row, or within a couple of hours, for both boys and girls.
Source: YRRS (NM); CDC YRBS (US); NMDOH Survey Section (NOTE: Brackets around reported rates are 95% confidence intervals)
9th Grade 10th Grade 11th Grade 12th Grade All Grades
Sex Race/Ethnicity Percent [95% CI] Percent [95% CI] Percent [95% CI] Percent [95% CI] Percent [95% CI]
Male American Indian 4.3 (2.0-9.1) 6.0 (3.0-11.7) 3.6 (1.1-10.6) 9.7 (5.8-15.9) 5.6 (3.7-8.3)
Asian/Pacific Islander -- -- -- -- 6.8 (2.0-20.4)
Black -- -- -- -- 8.5 (3.5-19.4)
Hispanic 4.2 (2.4-7.3) 9.1 (5.7-14.3) 15.1 (11.5-19.7) 20.0 (15.4-25.6) 11.4 (9.4-13.7)
White 3.2 (1.1-8.7) 8.5 (4.7-14.9) 17.4 (13.1-22.8) 13.5 (6.1-27.2) 10.5 (7.7-14.1)
Total 3.7 (2.4-5.7) 8.6 (5.9-12.6) 13.8 (10.8-17.5) 16.0 (12.1-20.9) 10.0 (8.3-11.9)
Female American Indian 3.0 (1.1-7.9) 8.4 (3.5-18.6) 13.9 (7.6-23.9) 6.8 (3.3-13.3) 7.5 (4.9-11.2)
Asian/Pacific Islander -- -- -- -- 8.8 (2.8-24.3)
Black -- -- -- -- 9.6 (5.4-16.3)
Hispanic 6.0 (3.1-11.3) 11.8 (7.8-17.3) 12.9 (8.8-18.5) 18.4 (13.4-24.8) 12.0 (9.6-15.1)
White 5.2 (2.4-11.1) 11.0 (7.1-16.5) 20.5 (13.9-29.1) 19.5 (13.3-27.6) 13.4 (10.5-17.0)
Total 5.1 (3.6-7.2) 11.1 (8.4-14.5) 14.9 (12.0-18.3) 17.4 (13.0-22.9) 11.6 (9.5-14.1)
Total American Indian 3.7 (1.9-7.1) 7.0 (4.2-11.4) 8.8 (5.7-13.5) 8.2 (5.2-12.7) 6.5 (4.9-8.7)
Asian/Pacific Islander -- 12.3 (3.9-32.8) -- -- 7.6 (3.0-18.4)
Black 3.1 (0.7-12.7) 13.7 (5.4-30.7) -- -- 9.7 (6.0-15.2)
Hispanic 5.3 (3.3-8.5) 10.5 (7.7-14.3) 13.9 (10.9-17.5) 19.2 (15.6-23.4) 11.8 (9.9-13.9)
White 4.2 (2.2-7.8) 9.7 (6.4-14.3) 18.9 (14.9-23.6) 16.2 (10.3-24.6) 11.9 (9.7-14.5)
Total 4.5 (3.4-5.9) 9.8 (7.5-12.8) 14.4 (12.6-16.4) 16.8 (13.3-21.0) 10.9 (9.4-12.5)
Source: YRRS (NM); NMDOH Survey Section (NOTE: "95% CI" is 95% confidence interval)
New Mexico Substance Use Epidemiology Profile Page 81
Table 1: Binge Drinking, by Grade Level, Gender, and Race/Ethnicity, Grades 9 - 12, New Mexico, 2017
Problem Statement
Chart 1: Binge Drinking* by Year, Grades 9 - 12, New Mexico and US, 2003-2017
YOUTH BINGE DRINKING
35.4
28.6 27.425.0
22.4
17.1 14.610.9
28.325.5 26.0
23.4 21.9
20.817.7
13.5
0
10
20
30
40
50
2003 2005 2007 2009 2011 2013 2015 2017
Pe
rce
nt
(%)
Year
NM
US
Binge drinking (defined as having five or more drinks of alcohol for boys or 4 or more drinks for girls in a row within acouple of hours [see note below Chart 1]) is a major risk factor for the three leading causes of death among youth(motor vehicle crashes, suicide, and homicide), as well as being associated with poor academic performance and riskbehaviors such as impaired driving, riding with a drinking driver, physical fighting, increased number of sexualpartners, and other substance use.
In 2017, 10.9% of NM high school students reported binge drinking at least once in the past month. Binge drinking isthe norm among current high school drinkers in New Mexico. In 2017, of the 26.2% of students who were currentdrinkers, 53.9% were binge drinkers. Binge drinking prevalence has been decreasing in NM since 2003, as it hasbeen in the US since at least 2001 (Chart 1). In 2017, the difference between the US (13.5%) and NM (10.9%) ratesfor binge drinking was not statistically significant.
Binge drinking increases with increasing grade level and does not significantly differ by gender (Chart 2). Overall,Hispanics and Whites have a higher prevalence of current binge drinking compared to other race/ethnicities.

Source: YRRS (NM); NMDOH Survey Section (NOTE: Brackets around reported rates are 95% confidence intervals)
* Estimate of percent of high school students who reported binge drinking at least once in past 30 days
De Baca, Catron, and Harding County estimates not available because of low numbers and/or low response rates
Source: YRRS (NM); NMDOH Survey Section (NOTE: Brackets around reported rates are 95% confidence intervals)
New Mexico Substance Use Epidemiology Profile Page 82
Chart 2: Binge Drinking, by Grade Level, Gender, and Race/Ethnicity, Grades 9 - 12, New Mexico, 2017
YOUTH BINGE DRINKING (continued)
Chart 3: Binge Drinking* by County, Grades 9 - 12, New Mexico, 2017
13.5
3.7
7.1
7.2
8.4
8.7
9.1
9.6
10.2
10.3
10.9
10.9
11.0
11.1
11.2
11.5
12.1
12.6
13.2
13.3
13.4
14.5
14.6
14.7
15.0
15.0
15.1
18.4
19.3
20.3
20.4
20.5
0 20 40 60 80 100
United States
McKinley
Hidalgo
Roosevelt
Quay
Los Alamos
Curry
Bernalillo
Colfax
San Juan
Sandoval
New Mexico
Mora
Valencia
Guadalupe
Santa Fe
Chaves
Sierra
Dona Ana
Eddy
San Miguel
Torrance
Otero
Cibola
Socorro
Taos
Union
Lea
Rio Arriba
Grant
Lincoln
Luna
Percent (%)*
10.9 10.0 11.64.5
9.814.4 16.8
6.5 7.6 9.7 11.8 11.9
0
25
50
75
100
Pe
rce
nt
(%)

Chart 4: Binge Drinking* by County, Grades 9 - 12, New Mexico, 2017
* Estimate of percent of high school students who reported binge drinking at least once in past 30 days
Insufficient Data: County estimates not available because of low numbers and/or low response rates
Source: YRRS (NM); NMDOH Survey Section; SAES
New Mexico Substance Use Epidemiology Profile Page 83
YOUTH BINGE DRINKING (continued)
Youth Binge Drinking (%)

New Mexico Substance Use Epidemiology Profile Page 84

Source: YRRS (NM); NMDOH Survey Section (NOTE: Brackets around reported rates are 95% confidence intervals)
9th Grade 10th Grade 11th Grade 12th Grade All Grades
Sex Race/Ethnicity Percent [95% CI] Percent [95% CI] Percent [95% CI] Percent [95% CI] Percent [95% CI]
Male American Indian 1.7 (0.6-4.8) 2.9 (1.4-6.0) 1.0 (0.2-5.2) 3.2 (1.2-8.8) 2.1 (1.3-3.5)
Asian/Pacific Islander -- -- -- -- 1.0 (0.1-6.9)
Black -- -- -- -- 5.1 (1.7-14.0)
Hispanic 0.9 (0.3-3.1) 3.8 (2.0-7.1) 9.5 (6.7-13.1) 13.3 (9.5-18.3) 6.3 (4.6-8.6)
White 1.3 (0.1-10.0) 1.8 (0.6-5.1) 6.2 (3.0-12.3) 6.6 (2.8-15.0) 3.9 (2.4-6.0)
Total 1.2 (0.6-2.4) 3.1 (1.9-5.0) 6.4 (4.4-9.3) 9.2 (6.5-12.8) 4.6 (3.4-6.2)
Female American Indian 1.1 (0.1-8.3) 4.2 (0.9-17.3) 4.2 (0.9-17.2) 2.4 (0.8-6.7) 2.8 (1.3-5.9)
Asian/Pacific Islander -- -- -- -- 1.4 (0.2-8.9)
Black -- -- -- -- 5.4 (2.0-14.1)
Hispanic 3.2 (1.4-7.4) 7.5 (4.3-12.7) 3.4 (1.4-8.4) 4.6 (1.7-12.0) 5.0 (3.3-7.5)
White 0.8 (0.1-6.0) 2.1 (0.9-4.9) 7.2 (3.7-13.8) 6.9 (3.5-13.1) 4.0 (2.4-6.5)
Total 2.0 (0.9-4.4) 5.0 (3.1-8.1) 4.6 (3.0-7.1) 5.3 (2.9-9.4) 4.3 (3.0-6.0)
Total American Indian 1.4 (0.6-3.7) 3.5 (1.9-6.3) 2.9 (1.0-8.0) 2.8 (1.2-6.3) 2.5 (1.7-3.7)
Asian/Pacific Islander -- 1.8 (0.2-12.9) -- -- 1.2 (0.3-4.6)
Black 3.1 (0.7-13.0) -- -- -- 6.0 (3.2-10.9)
Hispanic 2.3 (1.1-4.8) 5.7 (3.4-9.5) 6.1 (4.2-9.0) 8.5 (6.0-11.9) 5.7 (4.3-7.4)
White 1.0 (0.2-5.1) 1.9 (1.0-3.6) 6.7 (4.0-11.1) 6.7 (3.4-12.9) 3.9 (2.5-5.9)
Total 1.7 (1.0-3.1) 4.0 (2.7-6.0) 5.6 (4.3-7.3) 7.1 (4.9-10.4) 4.5 (3.5-5.8)
Source: YRRS (NM); NMDOH Survey Section (NOTE: "95% CI" is 95% confidence interval)
New Mexico Substance Use Epidemiology Profile Page 85
Problem Statement
Chart 1: 10 Plus Drinks, by Grade Level, Gender, and Race/Ethnicity, Grades 9 - 12, New Mexico, 2017
YOUTH 10 PLUS DRINKS
Table 1: 10 Plus Drinks, by Grade Level, Gender, and Race/Ethnicity, Grades 9 - 12, New Mexico, 2017
4.5 4.6 4.3 1.7 4.0 5.6 7.12.5 1.2
6.0 5.7 3.9
0
25
50
75
100
Pe
rce
nt
(%)
On average, underage drinkers consume more drinks per drinking occasion than adult drinkers. The risk of harmincreases as the number of drinks consumed on an occasion increases.
The maximum number of drinks that a student consumed on an occasion is determined by the question: “During thepast 30 days, what is the largest number of alcoholic drinks you had in a row, that is, within a couple of hours?”
Students in the 12th grade are more likely to drink 10 or more drinks on an occasion than 9th grade students. There isno significant difference between genders. Asian/Pacific Islander students have the lowest prevalence of consumingten or more drinks on an occasion. Prevalence was fairly similar by county, ranging from 1.8% of students (McKinleyCounty) to 9.8% of students (Socorro County). In 2017, there was no difference in rates between New Mexico (4.5%)and the US (4.4%).

* Estimate of percent of high school students who reported high intensity drinking at least once in past 30 days
De Baca, Catron, and Harding County estimates not available because of low numbers and/or low response rates
Source: YRRS (NM); NMDOH Survey Section (NOTE: Brackets around reported rates are 95% confidence intervals)
New Mexico Substance Use Epidemiology Profile Page 86
Chart 2: 10 Plus Drinks* by County, Grades 9 - 12, New Mexico, 2017
YOUTH 10 PLUS DRINKS (continued)
4.4
1.8
2.0
2.0
2.2
2.3
2.4
3.0
3.1
3.2
3.4
4.5
4.9
5.1
5.3
5.5
5.5
5.5
5.8
5.8
5.8
6.1
7.0
7.2
7.4
8.0
8.1
8.1
8.2
8.6
8.9
9.8
0 20 40 60 80 100
United States
McKinley
Hidalgo
Quay
Roosevelt
Mora
Curry
San Juan
Bernalillo
Los Alamos
Sandoval
New Mexico
Santa Fe
Torrance
Dona Ana
Chaves
Cibola
Union
Colfax
San Miguel
Taos
Eddy
Otero
Valencia
Sierra
Luna
Guadalupe
Lea
Rio Arriba
Lincoln
Grant
Socorro
Percent (%)*

Chart 3: 10 Plus Drinks* by County, Grades 9 - 12, New Mexico, 2017
* Estimate of percent of high school students who reported high intensity drinking at least once in past 30 days
Insufficient Data: County estimates not available because of low numbers and/or low response rates
Source: YRRS (NM); NMDOH Survey Section; SAES
New Mexico Substance Use Epidemiology Profile Page 87
YOUTH 10 PLUS DRINKS (continued)
Youth Having Ten or More Drinks (%)

New Mexico Substance Use Epidemiology Profile Page 88

* Heavy drinking definition: drinking more than 2 drinks/day on average (for men) or more than 1 drink/day (for women) in past 30 days
Source: BRFSS; SAES (NOTE: Brackets around reported rates are 95% confidence intervals)
Ages Ages Ages All Ages Ages Ages All
Sex Race/Ethnicity 18-24 25-64 65+ Ages 18-24 25-64 65+ Ages*
Male American Indian 574 3,448 559 4,539 5.4 7.5 7.4 7.0
Asian/Pacific Islander - 0 - 0 - 0.0 - 0.0
Black - 268 - 647 - 2.0 - 3.3
Hispanic 2,821 16,131 1,586 20,506 4.8 6.6 3.1 5.8
White 2,675 14,164 4,700 21,372 8.6 6.7 4.9 6.4
Total 5,819 34,035 7,099 46,765 5.5 6.5 4.5 5.9
Female American Indian 240 2,251 0 2,534 2.3 4.4 0.0 3.5
Asian/Pacific Islander - 50 - 51 - 0.4 - 0.3
Black - 610 - 633 - 6.4 - 4.4
Hispanic 867 8,577 456 9,873 1.5 3.5 0.7 2.7
White 1,616 14,814 6,096 22,629 6.1 6.9 5.6 6.5
Total 2,646 26,884 6,725 36,231 2.7 5.0 3.6 4.4
Total American Indian 789 5,668 599 7,032 3.7 5.8 3.2 5.1
Asian/Pacific Islander - 41 - 40 - 0.2 - 0.1
Black - 993 239 1,314 - 4.3 4.9 3.9
Hispanic 3,709 24,597 2,021 30,256 3.2 5.0 1.8 4.2
White 4,253 28,979 10,814 44,009 7.4 6.8 5.3 6.4
Total 8,429 60,867 13,813 82,894 4.1 5.7 4.0 5.2
* Estimate of percent of people in population group who reported heavy drinking in past 30 days
- Excluded due to small number of respondents (< 50) in cell
Source: BRFSS; SAES
New Mexico Substance Use Epidemiology Profile Page 89
Table 1: Heavy Drinking (past 30 days) by Age, Sex, and Race/Ethnicity, Adults Aged 18+, New Mexico,
2015-2017
Number Percent*
ADULT HEAVY DRINKING
Chart 1: Heavy Drinking (past 30 days)*, Adults Aged 18+, New Mexico, 1998-2016
Problem Statement
4.0 3.84.5
5.0 5.1 5.6
4.5 4.1 4.43.9 4.4 4.2 4.4
5.85.5
5.9 5.7
4.55.5
0
1
2
3
4
5
6
7
8
Pe
rce
nt
(%)
Year
Heavy drinking (defined as having more than 2 drinks/day for males and more than one drink/day for females) is apattern of excessive alcohol consumption that can lead to alcohol-related chronic disease and death. According to thelatest estimates from the CDC, numerous chronic disease conditions (e.g., alcoholic liver disease, alcohol dependencesyndrome) and a significant proportion of many other conditions (e.g., unspecified liver cirrhosis, pancreatitis) arealcohol-related. For each of these causes, it is chronic heavy drinking (as opposed to acute episodic or binge drinking)that is considered primarily responsible for the incidence and progression of alcohol-related chronic disease. Heavydrinking is also associated with a wide range of other social problems, including alcoholism (also known as alcoholdependence), domestic violence, and family disruption.
Chart 1 shows that adult heavy drinking prevalence has been, more or less, constant since 2005. Heavy drinkingprevalence is lower among adults in New Mexico (5.2%) than in the US overall (6.5%). As shown in Table 1, heavydrinking was most prevalent among adults in the 25-64 age group, with 5.7% reporting past-month heavy drinking. NewMexico men were somewhat more likely to report chronic drinking than women (5.9% v. 4.4%), and American Indianmales had the highest reported rate of heavy drinking (7.0%) followed by White females (6.5%) and White males(6.4%).

Table 2: Heavy Drinking (past 30 days) by Race/Ethnicity and County, Adults Aged 18+, New Mexico, 2015-2017
CountyAmerican
Indian
Asian/
Pacific
Islander
Black Hispanic White All
Races
American
Indian
Asian/
Pacific
Islander
Black Hispanic White All
Races
Bernalillo 639 - - 10,492 14,462 25,979 2.9 - - 4.3 6.2 4.9
Catron - - - - - 334 - - - - - 10.5
Chaves - - - 1,066 1,205 2,245 - - - 4.3 5.5 4.6
Cibola 785 - - 489 81 1,237 10.0 - - 6.2 1.7 5.9
Colfax - - - - 209 584 - - - - 3.9 5.6
Curry - - - 624 1,033 1,640 - - - 4.6 5.2 4.4
De Baca - - - - - - - - - - - -
Dona Ana - - - 4,431 2,970 8,089 - - - 4.3 5.7 5.0
Eddy - - - 1,365 1,199 2,826 - - - 7.2 5.5 6.7
Grant - - - 454 614 1,079 - - - 4.3 5.3 4.7
Guadalupe - - - - - - - - - - - -
Harding - - - - - - - - - - - -Hidalgo - - - - - - - - - - - -
Lea - - - 2,045 1,182 3,282 - - - 8.1 5.8 6.8
Lincoln - - - - 710 1,068 - - - - 6.4 6.6
Los Alamos - - - - 0 0 - - - - 0.0 0.0
Luna - - - 805 0 943 - - - 7.2 0.0 5.2
McKinley 1,861 - - 77 92 2,118 4.8 - - 1.2 1.6 4.1
Mora - - - - - - - - - - - -
Otero 195 - - 303 1,487 1,993 6.9 - - 1.8 5.4 4.0
Quay - - - - 394 420 - - - - 10.7 6.3
Rio Arriba - - - 110 261 550 - - - 0.5 5.6 1.8
Roosevelt - - - - 284 360 - - - - 3.3 2.4
Sandoval - - - 2,185 2,325 6,707 - - - 5.7 4.4 6.2
San Juan 686 - - 644 2,812 4,146 1.9 - - 4.0 6.9 4.4
San Miguel - - - 511 606 1,624 - - - 3.0 13.3 7.2
Santa Fe - - - 1,507 5,654 7,381 - - - 2.7 9.7 6.1
Sierra - - - - 588 641 - - - - 8.7 6.7
Socorro - - - - - 809 - - - - - 6.1
Taos - - - 0 477 554 - - - 0.0 4.4 2.0
Torrance - - - - - - - - - - - -
Union - - - - - - - - - - - -
Valencia - - - 885 898 1,826 - - - 2.7 4.1 3.1
New Mexico 7,032 40 1,314 30,256 44,009 82,894 5.1 0.1 3.9 4.2 6.4 5.2
* Estimate of percent of people in population group who reported heavy drinking in past 30 days
- Excluded due to small number of respondents (< 50) in cell
Source: BRFSS; SAES
New Mexico Substance Use Epidemiology Profile Page 90
Number Percent*
ADULT HEAVY DRINKING (continued)
Problem Statement (continued)
Among men, American Indians had the highest heavy drinking rates (7.0%), followed by Whites (6.4%) and Hispanics(5.8%). Also, American Indian males had the highest rates of alcohol-related chronic disease death (132.2 deaths per100,000 population), followed by Hispanics (49.1) and Blacks (33.4). Among women, Whites had the highest rates ofheavy drinking (6.5%), followed by Blacks (4.4%). However, American Indian females have the highest rates of alcohol-related chronic disease death (76.4 deaths per 100,000 population), followed by Hispanics (18.0) and Blacks (15.5).These differences between heavy drinking rates and alcohol-related chronic disease death rates reflect the long leadtime between the behavior and the health-related outcomes of that behavior.
Between 2015-2017, as shown in Table 2 and Chart 2, heavy drinking rates were highest in Catron (10.5%), San Miguel(7.2%), and Lea (6.8%) counties and substantially lower in counties that have among the highest rates of alcohol-relatedchronic disease death rates (e.g., Rio Arriba and McKinley).

* Estimate of percent of people in population group who reported heavy drinking in past 30 days
The following counties were excluded due to small number of respondents (< 50):
De Baca, Guadalupe, Harding, Hidalgo, Mora, Torrance, and UnionSource: NMBRFSS (NM); CDC BRFSS (US); SAES
New Mexico Substance Use Epidemiology Profile Page 91
ADULT HEAVY DRINKING (continued)
Chart 2: Heavy Drinking (past 30 days)* by County, Adults Aged 18+, New Mexico, 2015-2017
6.5
1.8
2.0
2.4
3.1
4.0
4.1
4.4
4.4
4.6
4.7
4.9
5.0
5.2
5.2
5.6
5.9
6.1
6.1
6.2
6.3
6.6
6.7
6.7
6.8
7.2
10.5
0 10 20 30 40 50
United States 2016
Los Alamos (0; 0.0%)
Rio Arriba (550; 0.7%)
Taos (554; 0.7%)
Roosevelt (360; 0.4%)
Valencia (1826; 2.2%)
Otero (1993; 2.4%)
McKinley (2118; 2.6%)
Curry (1640; 2.0%)
San Juan (4146; 5.0%)
Chaves (2245; 2.7%)
Grant (1079; 1.3%)
Bernalillo (25979; 31.3%)
Dona Ana (8089; 9.8%)
Luna (943; 1.1%)
New Mexico (82894; 100.0%)
Colfax (584; 0.7%)
Cibola (1237; 1.5%)
Santa Fe (7381; 8.9%)
Socorro (809; 1.0%)
Sandoval (6707; 8.1%)
Quay (420; 0.5%)
Lincoln (1068; 1.3%)
Eddy (2826; 3.4%)
Sierra (641; 0.8%)
Lea (3282; 4.0%)
San Miguel (1624; 2.0%)
Catron (334; 0.4%)
Percent (%)*
County (# of heavy drinkers; % of statewide heavy drinkers)

* Estimate of percent of people in population group who reported heavy drinking in past 30 days
Insufficient data: Rate not reported due to small number of respondents (< 50) in cellSource: NMBRFSS (NM); CDC BRFSS (US); SAES
New Mexico Substance Use Epidemiology Profile Page 92
ADULT HEAVY DRINKING (continued)
Chart 3: Heavy Drinking (past 30 days)* by County, Adults Aged 18+, New Mexico, 2015-2017
Adult Heavy Drinking (%)

* Drinking and driving definition: drove after having "perhaps too much to drink" at least once in past 30 days
Source: BRFSS; SAES (NOTE: Brackets around reported rates are 95% confidence intervals)
Ages Ages Ages All Ages Ages Ages All
Sex Race/Ethnicity 18-24 25-64 65+ Ages 18-24 25-64 65+ Ages*
Male American Indian - 974 - 1,171 - 2.1 - 1.8
Asian/Pacific Islander - - - - - - - -
Black - - - - - - - -
Hispanic 0 9,782 140 9,731 0.0 4.0 0.3 2.7
White - 2,871 577 4,131 - 1.4 0.6 1.2
Total 626 13,754 905 15,174 0.6 2.6 0.6 1.9
Female American Indian - 516 0 531 - 1.0 0.0 0.7
Asian/Pacific Islander - - - - - - - -
Black - - - - - - - -
Hispanic 1,613 1,541 0 3,307 2.8 0.6 0.0 0.9
White - 2,601 493 3,095 - 1.2 0.5 0.9
Total 1,785 4,662 522 6,893 1.8 0.9 0.3 0.8
Total American Indian - 1,436 229 1,654 - 1.5 1.2 1.2
Asian/Pacific Islander - - - 0 - - - 0.0
Black - - - 665 - - - 2.0
Hispanic 1,678 11,209 148 12,949 1.4 2.3 0.1 1.8
White 804 5,470 1,060 7,205 1.4 1.3 0.5 1.1
Total 2,415 18,381 1,425 22,003 1.2 1.7 0.4 1.4
* Estimate of number of people in population group who drove after "perhaps too much to drink" at least once in past 30 days
** Estimate of percent of people in population group who drove after "perhaps too much to drink" at least once in past 30 days
- Excluded due to small number of respondents (< 50) in cell
Source: BRFSS; SAES
New Mexico Substance Use Epidemiology Profile Page 93
Table 1: Drinking and Driving (past 30 days) by Age, Sex, and Race, Adults Aged 18+, New Mexico, 2016
ADULT DRINKING AND DRIVING
Problem Statement
Chart 1: Drinking and Driving (past 30 days)* by Drinking Status, Adults Aged 18+, New Mexico,
1998-2016
Number* Percent**
Adult drinking and driving is a precursor to alcohol-related motor vehicle crash injury and death. Any drinking and driving isdangerous (i.e., associated with an elevated risk of crash and injury), but driving after binge drinking (which is defined as alevel of drinking likely to lead to a 0.08 BAC) is particularly risky. Unfortunately, as shown in Chart 1, binge drinkers aremuch more likely to report driving after drinking than non-binge drinkers. For example, in 2012, only 1.2% of the generalpopulation reported driving after drinking, but 7.2% of binge drinkers reported engaging in this risky behavior in the past 30days compared to only 0.7% of non-binge drinkers. On a positive note, Chart 1 shows that driving after drinking prevalencedecreased significantly between 2006 and 2010 (from 2.2% to 0.9%), including a substantial decline among binge drinkers(from 14.5% to 6.2%).
As shown in Chart 2, in 2016 driving after drinking was most prevalent among middle-age adults, with 1.7% of those aged25-64 reporting past-month drinking and driving. Chart 2 shows a decline (although not statistically significant) in drinkingand driving by young adults (age 18-24) and a fluctuating pattern among those aged 25-64. Table 1 shows that New Mexicomen were twice as likely to report drinking and driving than women (1.9% v. 0.8%). Hispanic males (2.7%) were more likelyto report drinking and driving than American Indian (1.8%) and White (1.2%) males. Table 2 and Chart 3 show drinking anddriving rates by county.
1998 1999 2000 2001 2002 2003 2004 2005 2006 2007 2008 2009 2010 2011 2012 2013 2014 2015 2016
Total 2.2 2.3 2.8 2.0 1.9 2.2 1.2 0.9 1.2 1 1.4
Binge 13.1 13.4 15.1 11.6 11.2 14.5 8.3 6.2 7.2 7.0 7.0
Non-Binge 0.9 0.9 1.1 0.8 1.0 1.0 0.7 0.6 0.7 0.3 0.9
02468
101214161820
Pe
rce
nt
(%)

* Drinking and driving definition: drove after having "perhaps too much to drink" at least once in past 30 days
Source: BRFSS; SAES (NOTE: Brackets around reported rates are 95% confidence intervals)
CountyAmerican
Indian
Asian/
Pacific
Islander
Black Hispanic White All
Races
American
Indian
Asian/
Pacific
Islander
Black Hispanic White All
Races
Bernalillo - - - 3,005 1,056 4,596 - - - 1.2 0.5 0.9
Catron - - - - - - - - - - - -
Chaves - - - 270 711 867 - - - 1.1 3.3 1.8
Cibola - - - 0 41 52 - - - 0.0 0.9 0.3
Colfax - - - - - - - - - - - -
Curry - - - - 0 454 - - - - 0.0 1.2
De Baca - - - - - - - - - - - -
Dona Ana - - - 4,942 635 5,435 - - - 4.8 1.2 3.4
Eddy - - - 820 157 968 - - - 4.3 0.7 2.3
Grant - - - - 256 308 - - - - 2.2 1.3
Guadalupe - - - - - - - - - - - -
Harding - - - - - - - - - - - -
Hidalgo - - - - - - - - - - - -
Lea - - - 1,024 0 1,127 - - - 4.0 0.0 2.3
Lincoln - - - - 0 0 - - - - 0.0 0.0
Los Alamos - - - - - 0 - - - - - 0.0
Luna - - - - - 0 - - - - - 0.0
McKinley 655 - - - 0 1,236 1.7 - - - 0.0 2.4
Mora - - - - - - - - - - - -
Otero - - - - 972 1,228 - - - - 3.5 2.5
Quay - - - - - - - - - - - -
Rio Arriba - - - 170 200 460 - - - 0.8 4.3 1.5
Roosevelt - - - - - 0 - - - - - 0.0
Sandoval - - - - 0 896 - - - - 0.0 0.8
San Juan 302 - - 0 369 660 0.9 - - 0.0 0.9 0.7
San Miguel - - - - - 0 - - - - - 0.0
Santa Fe - - - 1,232 948 2,425 - - - 2.2 1.6 2.0
Sierra - - - - 0 0 - - - - 0.0 0.0
Socorro - - - - - 0 - - - - - 0.0
Taos - - - - 663 701 - - - - 6.2 2.6
Torrance - - - - - - - - - - - -
Union - - - - - - - - - - - -
Valencia - - - - 0 0 - - - - 0.0 0.0
New Mexico 1,654 0 665 12,949 7,205 22,003 1.2 0.0 2.0 1.8 1.1 1.4
* Estimate of number of people in population group who drove after "perhaps too much to drink" at least once in past 30 days
- Excluded due to small number of respondents (< 50) in cell
Source: BRFSS; SAES
New Mexico Substance Use Epidemiology Profile Page 94
Chart 2: Drinking and Driving (past 30 days)* by Age, Adults Aged 18+, New Mexico, 1998-2016
ADULT DRINKING AND DRIVING (continued)
Table 2: Drinking and Driving (past 30 days) by Race/Ethnicity and County, Adults Aged 18+, New Mexico, 2016
Number* Percent**
1998 1999 2000 2001 2002 2003 2004 2005 2006 2007 2008 2009 2010 2011 2012 2013 2014 2015 2016
Age 18-24 4.1 4.6 5.6 3.6 6.4 4.3 2.9 1.7 1.9 1.7 1.2
Age 25-64 2.3 2.4 2.8 2 1.4 2.1 1.1 2.2 1.4 1.3 1.7
Age 65+ 0.1 0.3 0.6 0.6 0.2 0.5 0.3 0.4 0.2 0.2 0.4
0
1
2
3
4
5
6
7
8
Pe
rce
nt
(%)
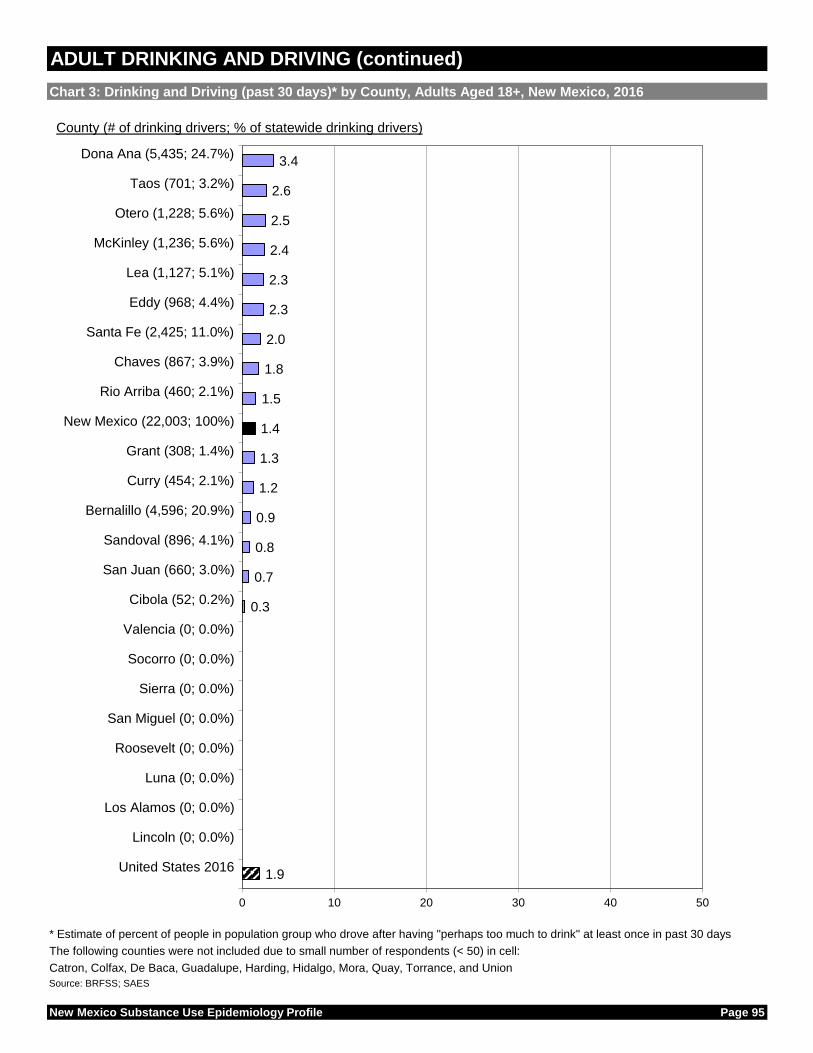
* Estimate of percent of people in population group who drove after having "perhaps too much to drink" at least once in past 30 days
The following counties were not included due to small number of respondents (< 50) in cell:
Catron, Colfax, De Baca, Guadalupe, Harding, Hidalgo, Mora, Quay, Torrance, and Union
Source: BRFSS; SAES
New Mexico Substance Use Epidemiology Profile Page 95
Chart 3: Drinking and Driving (past 30 days)* by County, Adults Aged 18+, New Mexico, 2016
ADULT DRINKING AND DRIVING (continued)
1.9
0.3
0.7
0.8
0.9
1.2
1.3
1.4
1.5
1.8
2.0
2.3
2.3
2.4
2.5
2.6
3.4
0 10 20 30 40 50
United States 2016
Lincoln (0; 0.0%)
Los Alamos (0; 0.0%)
Luna (0; 0.0%)
Roosevelt (0; 0.0%)
San Miguel (0; 0.0%)
Sierra (0; 0.0%)
Socorro (0; 0.0%)
Valencia (0; 0.0%)
Cibola (52; 0.2%)
San Juan (660; 3.0%)
Sandoval (896; 4.1%)
Bernalillo (4,596; 20.9%)
Curry (454; 2.1%)
Grant (308; 1.4%)
New Mexico (22,003; 100%)
Rio Arriba (460; 2.1%)
Chaves (867; 3.9%)
Santa Fe (2,425; 11.0%)
Eddy (968; 4.4%)
Lea (1,127; 5.1%)
McKinley (1,236; 5.6%)
Otero (1,228; 5.6%)
Taos (701; 3.2%)
Dona Ana (5,435; 24.7%)
County (# of drinking drivers; % of statewide drinking drivers)

.
* Estimate of percent of people in population group who drove after having "perhaps too much to drink" at least once in past 30 days
Insufficient data: Rate not reported due to small number of respondents (< 50) in cell
Source: BRFSS; SAES
New Mexico Substance Use Epidemiology Profile Page 96
ADULT DRINKING AND DRIVING (continued)
Chart 4: Drinking and Driving (past 30 days)* by County, Adults Aged 18+, New Mexico, 2016
Adult Drinking and Driving (%)
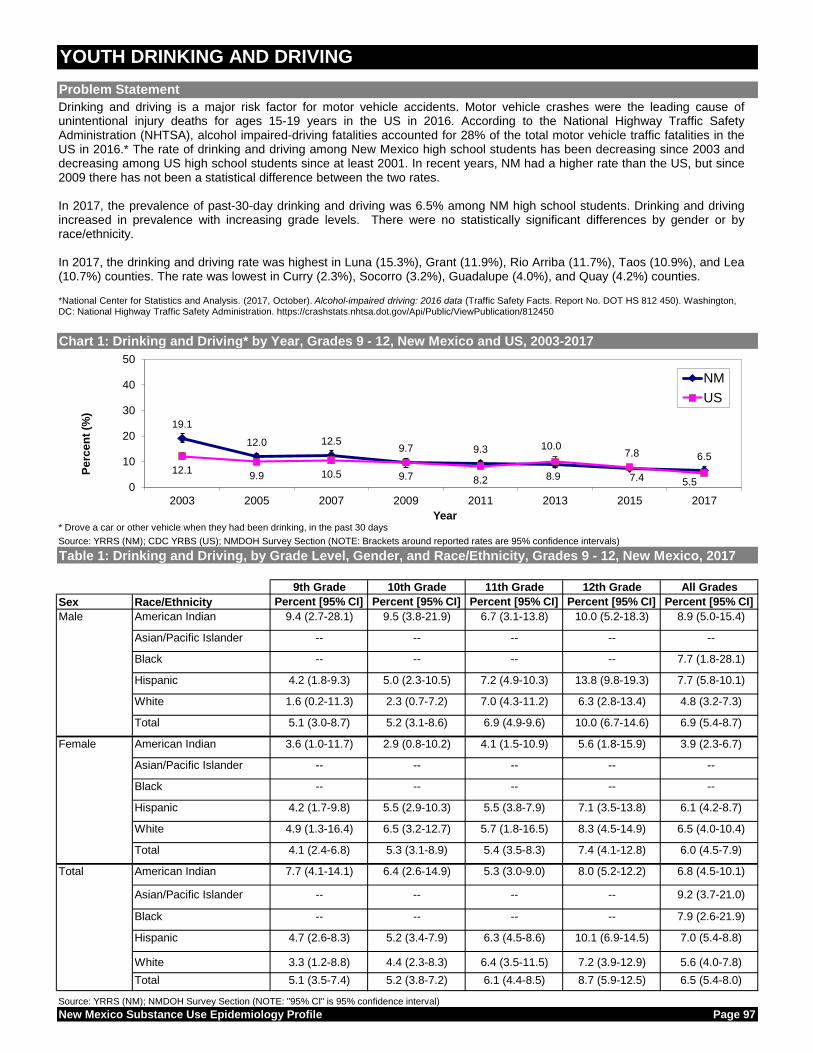
* Drove a car or other vehicle when they had been drinking, in the past 30 days
Source: YRRS (NM); CDC YRBS (US); NMDOH Survey Section (NOTE: Brackets around reported rates are 95% confidence intervals)
9th Grade 10th Grade 11th Grade 12th Grade All Grades
Sex Race/Ethnicity Percent [95% CI] Percent [95% CI] Percent [95% CI] Percent [95% CI] Percent [95% CI]
Male American Indian 9.4 (2.7-28.1) 9.5 (3.8-21.9) 6.7 (3.1-13.8) 10.0 (5.2-18.3) 8.9 (5.0-15.4)
Asian/Pacific Islander -- -- -- -- --
Black -- -- -- -- 7.7 (1.8-28.1)
Hispanic 4.2 (1.8-9.3) 5.0 (2.3-10.5) 7.2 (4.9-10.3) 13.8 (9.8-19.3) 7.7 (5.8-10.1)
White 1.6 (0.2-11.3) 2.3 (0.7-7.2) 7.0 (4.3-11.2) 6.3 (2.8-13.4) 4.8 (3.2-7.3)
Total 5.1 (3.0-8.7) 5.2 (3.1-8.6) 6.9 (4.9-9.6) 10.0 (6.7-14.6) 6.9 (5.4-8.7)
Female American Indian 3.6 (1.0-11.7) 2.9 (0.8-10.2) 4.1 (1.5-10.9) 5.6 (1.8-15.9) 3.9 (2.3-6.7)
Asian/Pacific Islander -- -- -- -- --
Black -- -- -- -- --
Hispanic 4.2 (1.7-9.8) 5.5 (2.9-10.3) 5.5 (3.8-7.9) 7.1 (3.5-13.8) 6.1 (4.2-8.7)
White 4.9 (1.3-16.4) 6.5 (3.2-12.7) 5.7 (1.8-16.5) 8.3 (4.5-14.9) 6.5 (4.0-10.4)
Total 4.1 (2.4-6.8) 5.3 (3.1-8.9) 5.4 (3.5-8.3) 7.4 (4.1-12.8) 6.0 (4.5-7.9)
Total American Indian 7.7 (4.1-14.1) 6.4 (2.6-14.9) 5.3 (3.0-9.0) 8.0 (5.2-12.2) 6.8 (4.5-10.1)
Asian/Pacific Islander -- -- -- -- 9.2 (3.7-21.0)
Black -- -- -- -- 7.9 (2.6-21.9)
Hispanic 4.7 (2.6-8.3) 5.2 (3.4-7.9) 6.3 (4.5-8.6) 10.1 (6.9-14.5) 7.0 (5.4-8.8)
White 3.3 (1.2-8.8) 4.4 (2.3-8.3) 6.4 (3.5-11.5) 7.2 (3.9-12.9) 5.6 (4.0-7.8)
Total 5.1 (3.5-7.4) 5.2 (3.8-7.2) 6.1 (4.4-8.5) 8.7 (5.9-12.5) 6.5 (5.4-8.0)
Source: YRRS (NM); NMDOH Survey Section (NOTE: "95% CI" is 95% confidence interval)
New Mexico Substance Use Epidemiology Profile Page 97
Table 1: Drinking and Driving, by Grade Level, Gender, and Race/Ethnicity, Grades 9 - 12, New Mexico, 2017
Problem Statement
Chart 1: Drinking and Driving* by Year, Grades 9 - 12, New Mexico and US, 2003-2017
YOUTH DRINKING AND DRIVING
19.1
12.0 12.59.7 9.3
8.9 7.4
6.5
12.19.9 10.5 9.7 8.2
10.07.8
5.50
10
20
30
40
50
2003 2005 2007 2009 2011 2013 2015 2017
Pe
rce
nt
(%)
Year
NM
US
Drinking and driving is a major risk factor for motor vehicle accidents. Motor vehicle crashes were the leading cause ofunintentional injury deaths for ages 15-19 years in the US in 2016. According to the National Highway Traffic SafetyAdministration (NHTSA), alcohol impaired-driving fatalities accounted for 28% of the total motor vehicle traffic fatalities in theUS in 2016.* The rate of drinking and driving among New Mexico high school students has been decreasing since 2003 anddecreasing among US high school students since at least 2001. In recent years, NM had a higher rate than the US, but since2009 there has not been a statistical difference between the two rates.
In 2017, the prevalence of past-30-day drinking and driving was 6.5% among NM high school students. Drinking and drivingincreased in prevalence with increasing grade levels. There were no statistically significant differences by gender or byrace/ethnicity.
In 2017, the drinking and driving rate was highest in Luna (15.3%), Grant (11.9%), Rio Arriba (11.7%), Taos (10.9%), and Lea(10.7%) counties. The rate was lowest in Curry (2.3%), Socorro (3.2%), Guadalupe (4.0%), and Quay (4.2%) counties.
*National Center for Statistics and Analysis. (2017, October). Alcohol-impaired driving: 2016 data (Traffic Safety Facts. Report No. DOT HS 812 450). Washington, DC: National Highway Traffic Safety Administration. https://crashstats.nhtsa.dot.gov/Api/Public/ViewPublication/812450

Source: YRRS (NM); NMDOH Survey Section (NOTE: Brackets around reported rates are 95% confidence intervals)
* Estimate of percent of high school students who reported drinking and driving at least once in past 30 days
De Baca, Catron, and Harding County estimates not available because of low numbers and/or low response rates
Source: YRRS (NM); NMDOH Survey Section (NOTE: Brackets around reported rates are 95% confidence intervals)
New Mexico Substance Use Epidemiology Profile Page 98
Chart 2: Drinking and Driving, by Grade Level, Gender, and Race/Ethnicity, Grades 9 - 12, New Mexico, 2017
Chart 3: Drinking and Driving* by County, Grades 9 - 12, New Mexico, 2017
YOUTH DRINKING AND DRIVING (continued)
5.5
2.3
3.2
4.0
4.2
5.3
5.4
5.9
6.2
6.3
6.4
6.5
6.5
6.8
6.8
7.3
7.4
7.6
7.9
8.2
8.4
8.5
9.1
9.4
10.0
10.1
10.1
10.7
10.9
11.7
11.9
15.3
0 20 40 60 80 100
United States
Curry
Socorro
Guadalupe
Quay
Torrance
Bernalillo
Valencia
Roosevelt
Union
San Juan
Sandoval
New Mexico
Los Alamos
McKinley
Otero
Dona Ana
Colfax
Hidalgo
Santa Fe
San Miguel
Lincoln
Cibola
Mora
Chaves
Eddy
Sierra
Lea
Taos
Rio Arriba
Grant
Luna
Percent (%)*
6.5 6.9 6.0 5.1 5.2 6.1 8.7 6.8 9.2 7.9 7.0 5.6
0
25
50
75
100
Pe
rce
nt
(%)

Chart 4: Drinking and Driving* by County, Grades 9 - 12, New Mexico, 2017
* Estimate of percent of high school students who reported drinking and driving at least once in past 30 days
Insufficient Data: County estimates not available because of low numbers and/or low response rates
Source: YRRS (NM); NMDOH Survey Section; SAES
New Mexico Substance Use Epidemiology Profile Page 99
YOUTH DRINKING AND DRIVING (continued)
Youth Drinking and Driving (%)

New Mexico Substance Use Epidemiology Profile Page 100

* Used marijuana at least one time in the past 30 days
Source: YRRS (NM); CDC YRBS (US); NMDOH Survey Section (NOTE: Brackets around reported rates are 95% confidence intervals)
9th Grade 10th Grade 11th Grade 12th Grade All Grades
Sex Race/Ethnicity Percent [95% CI] Percent [95% CI] Percent [95% CI] Percent [95% CI] Percent [95% CI]
Male American Indian 32.1 (22.1-44.0) 32.7 (21.9-45.8) 32.2 (24.1-41.6) 36.8 (22.0-54.7) 33.2 (25.3-42.2)
Asian/Pacific Islander -- -- -- -- 21.3 (12.4-34.0)
Black -- -- -- -- 32.5 (20.6-47.1)
Hispanic 21.7 (17.2-26.9) 28.3 (23.5-33.6) 33.9 (27.5-41.0) 34.5 (27.1-42.8) 29.0 (25.4-32.9)
White 19.6 (14.6-25.8) 23.4 (15.9-33.1) 26.0 (19.6-33.6) 21.0 (11.5-35.1) 22.5 (16.9-29.2)
Total 22.9 (18.9-27.4) 26.9 (22.6-31.7) 30.3 (25.8-35.2) 30.7 (22.5-40.2) 27.4 (23.8-31.2)
Female American Indian 30.3 (23.3-38.2) 36.7 (28.8-45.3) 40.2 (31.7-49.4) 38.3 (28.5-49.3) 35.9 (31.1-40.9)
Asian/Pacific Islander -- -- -- -- 17.7 (8.2-34.1)
Black -- -- -- -- 23.3 (13.6-36.8)
Hispanic 24.3 (21.3-27.6) 23.6 (18.7-29.3) 30.0 (21.8-39.7) 37.7 (28.2-48.3) 28.9 (23.7-34.6)
White 14.3 (9.4-21.0) 22.8 (17.9-28.7) 23.1 (14.6-34.4) 28.5 (20.3-38.5) 21.7 (17.4-26.8)
Total 21.8 (19.2-24.6) 24.3 (20.7-28.3) 28.6 (23.1-34.8) 34.7 (27.5-42.6) 27.1 (23.6-31.0)
Total American Indian 31.5 (24.8-39.2) 34.5 (26.1-44.0) 36.1 (28.9-43.8) 37.6 (26.4-50.2) 34.6 (28.5-41.2)
Asian/Pacific Islander -- 18.1 (8.3-35.0) 19.2 (9.3-35.5) -- 19.7 (11.8-31.1)
Black 27.5 (16.2-42.5) 19.6 (12.2-30.0) -- -- 29.1 (22.4-36.7)
Hispanic 23.3 (20.4-26.3) 25.8 (21.6-30.6) 31.8 (25.8-38.5) 36.3 (28.7-44.6) 29.0 (25.0-33.4)
White 17.0 (13.0-21.9) 23.0 (18.0-29.0) 24.6 (17.8-33.0) 24.4 (15.5-36.2) 22.1 (17.5-27.5)
Total 22.5 (19.8-25.6) 25.6 (22.0-29.5) 29.4 (25.1-34.3) 32.7 (25.8-40.5) 27.3 (24.1-30.8)
Source: YRRS (NM); NMDOH Survey Section (NOTE: "95% CI" is 95% confidence interval)
New Mexico Substance Use Epidemiology Profile Page 101
Table 1: Current Marijuana Use, by Grade Level, Gender, and Race/Ethnicity, Grades 9 - 12, New Mexico, 2017
Problem Statement
Chart 1: Current Marijuana Use* by Year, Grades 9 - 12, New Mexico and US, 2003-2017
YOUTH CURRENT MARIJUANA USE
29.026.2 25.0
28.0 27.627.8
25.327.3
22.420.2 19.7 20.8
23.1 23.421.7
19.8
0
10
20
30
40
50
2003 2005 2007 2009 2011 2013 2015 2017
Pe
rce
nt
(%)
Year
NM
US
There has been no apparent trend in the rate of current marijuana use by New Mexico high school students in recent years,but it has remained significantly higher than the US rate. In 2017, the difference between the New Mexico rate (27.3%) and theUS rate (19.8%) was larger compared to the previous years.
The prevalence of current marijuana use increases with increasing grade level. There was no statistically significant variationby gender. The rate among American Indian (34.6%) students was higher than among Black (29.1%), Hispanic (29.0%),Asian/Pacific Islander (19.7%), and White (22.1%) students.
In 2017, the rate of past 30-day marijuana use was highest in Taos (42.9%), Rio Arriba (37.3%), and Cibola (36.3%) counties.The rate was lowest in Union (12.5%), Hidalgo (13.5%), Curry (13.9%), and Los Alamos (16.6%) counties.

Source: YRRS (NM); NMDOH Survey Section (NOTE: Brackets around reported rates are 95% confidence intervals)
* Estimate of percent of high school students who reported marijuana use at least once in past 30 days
De Baca, Catron, and Harding County estimates not available because of low numbers and/or low response rates
Source: YRRS (NM); NMDOH Survey Section (NOTE: Brackets around reported rates are 95% confidence intervals)
New Mexico Substance Use Epidemiology Profile Page 102
Chart 2: Current Marijuana Use, by Grade Level, Gender, and Race/Ethnicity, Grades 9 - 12, New Mexico, 2017
YOUTH CURRENT MARIJUANA USE (continued)
Chart 3: Current Marijuana Use* by County, Grades 9 - 12, New Mexico, 2017
19.8
12.5
13.5
13.9
16.6
18.4
19.8
19.8
21.2
25.1
25.2
26.5
26.6
26.7
26.8
27.3
27.4
27.5
27.9
28.8
29.1
30.0
30.3
31.2
31.8
32.4
33.9
34.2
35.1
36.3
37.3
42.9
0 20 40 60 80 100
United States
Union
Hidalgo
Curry
Los Alamos
Roosevelt
Lea
Quay
Colfax
Mora
Lincoln
Sierra
Luna
Eddy
Chaves
New Mexico
Dona Ana
San Juan
Bernalillo
Guadalupe
Torrance
Sandoval
Socorro
San Miguel
Otero
Valencia
Santa Fe
McKinley
Grant
Cibola
Rio Arriba
Taos
Percent (%)*
27.3 27.4 27.122.5 25.6
29.4 32.7 34.6
19.7
29.1 29.022.1
0
25
50
75
100
Pe
rce
nt
(%)
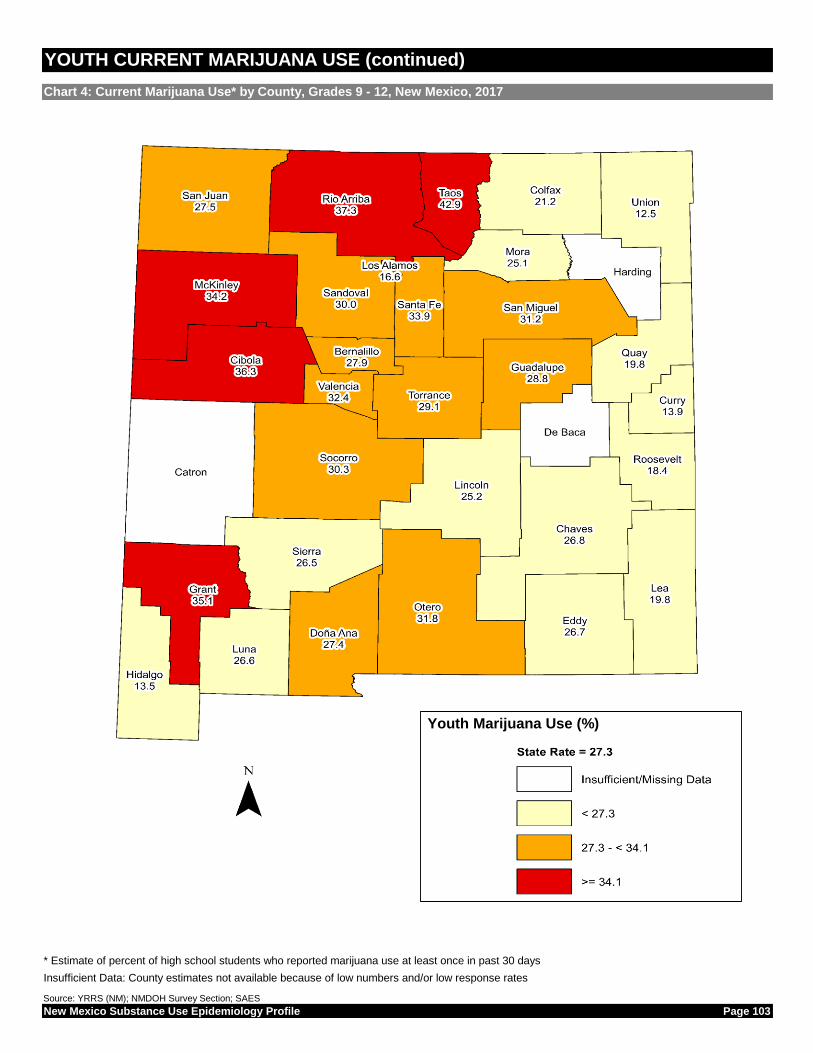
Chart 4: Current Marijuana Use* by County, Grades 9 - 12, New Mexico, 2017
* Estimate of percent of high school students who reported marijuana use at least once in past 30 days
Insufficient Data: County estimates not available because of low numbers and/or low response rates
Source: YRRS (NM); NMDOH Survey Section; SAES
New Mexico Substance Use Epidemiology Profile Page 103
YOUTH CURRENT MARIJUANA USE (continued)
Youth Marijuana Use (%)

New Mexico Substance Use Epidemiology Profile Page 104

* Used cocaine at least one time in the past 30 days
Source: YRRS (NM); CDC YRBS (US); NMDOH Survey Section (NOTE: Brackets around reported rates are 95% confidence intervals)
9th Grade 10th Grade 11th Grade 12th Grade All Grades
Sex Race/Ethnicity Percent [95% CI] Percent [95% CI] Percent [95% CI] Percent [95% CI] Percent [95% CI]
Male American Indian 2.1 (0.8-5.6) 7.8 (2.5-22.0) 2.5 (0.5-11.6) 6.6 (1.9-20.3) 4.5 (2.9-6.9)
Asian/Pacific Islander -- -- -- -- 11.6 (4.6-26.3)
Black -- -- -- -- 12.9 (7.2-22.1)
Hispanic 6.4 (4.0-10.0) 8.8 (5.8-13.2) 7.1 (4.6-10.9) 11.2 (6.8-17.8) 8.5 (6.3-11.3)
White 3.6 (1.4-9.1) 2.7 (1.2-5.8) 3.4 (1.7-6.7) 7.0 (3.2-14.4) 4.1 (2.7-6.1)
Total 5.1 (3.3-7.7) 6.9 (4.4-10.6) 5.9 (4.5-7.6) 9.5 (5.8-15.1) 6.8 (5.0-9.2)
Female American Indian 5.6 (1.7-17.0) 7.8 (2.9-19.1) 3.6 (0.8-15.0) 3.7 (1.8-7.5) 5.2 (2.7-9.9)
Asian/Pacific Islander -- -- -- -- 6.3 (3.0-12.6)
Black -- -- -- -- 1.4 (0.3-7.0)
Hispanic 0.9 (0.3-2.6) 2.9 (1.3-6.1) 3.1 (1.7-5.7) 4.7 (1.8-11.4) 3.3 (1.9-5.7)
White 2.2 (0.6-7.4) 0.5 (0.1-4.0) 3.9 (2.3-6.5) 4.6 (1.6-12.2) 2.7 (1.5-4.7)
Total 2.0 (1.3-3.2) 2.6 (1.5-4.5) 3.4 (2.3-4.9) 4.4 (2.1-9.0) 3.3 (2.3-4.8)
Total American Indian 4.2 (1.8-9.4) 7.8 (3.1-18.6) 3.0 (1.1-7.9) 5.2 (2.7-9.9) 5.1 (3.1-8.3)
Asian/Pacific Islander -- 8.9 (2.8-25.2) 12.3 (4.1-31.4) -- 9.4 (4.4-18.8)
Black 8.3 (2.9-21.7) 5.5 (1.2-22.2) -- -- 8.5 (4.7-14.9)
Hispanic 3.9 (2.5-6.1) 5.7 (4.0-8.1) 5.0 (3.7-6.6) 7.7 (4.5-12.8) 5.8 (4.3-7.8)
White 2.9 (1.4-5.7) 1.6 (0.8-3.4) 3.6 (2.4-5.5) 5.8 (3.1-10.9) 3.4 (2.4-4.8)
Total 3.8 (2.7-5.4) 4.7 (3.2-7.0) 4.6 (3.7-5.8) 6.9 (4.2-11.2) 5.1 (3.8-6.9)
Source: YRRS (NM); NMDOH Survey Section (NOTE: "95% CI" is 95% confidence interval)
New Mexico Substance Use Epidemiology Profile Page 105
Table 1: Current Cocaine Use, by Grade Level, Gender, and Race/Ethnicity, Grades 9 - 12, New Mexico, 2017
Problem Statement
Chart 1: Current Cocaine Use* by Year, Grades 9 - 12, New Mexico and US, 2003-2017
YOUTH CURRENT COCAINE USE
8.97.9
5.4 5.6 5.2 5.3 4.5 5.1
4.1 3.4 3.3 2.8 3.00
5
10
15
20
25
2003 2005 2007 2009 2011 2013 2015 2017
Pe
rce
nt
(%)
Year
NM
US
The New Mexico rate of current cocaine use by youth decreased from 2003 (8.9%) to 2007 (5.4%). The US ratedecreased from 4.1% in 2003 to 2.8% in 2009 and did not significantly change from 2009 to 2011. The New Mexico rate in2017 (5.1%) was higher than the last available US rate (3.0% in 2011) and has been consistently higher than the US ratesince 2003.
The difference in the rate between males (6.8%) and females (3.3%) was statistically significant. The rate of currentcocaine use generally increased in prevalence with increasing grade levels. Asian or Pacific Islander (9.4%) and Black(8.5%) students had higher rates of current cocaine use than Hispanic (5.8%), American Indian (5.1%), or White (3.4%)students. Differences between racial/ethnic groups were not statistically significant.
In 2017, the rate of past 30-day cocaine use was highest in Sierra (9.9%), Rio Arriba (9.4%), Luna (7.6%), Valencia(7.5%), and Grant (7.2%) counties. The rate was lowest in Hidalgo (0.7%), Union (0.7%), Curry (0.8%), Quay (0.8%), andLos Alamos (1.6%) counties.

Source: YRRS (NM); NMDOH Survey Section (NOTE: Brackets around reported rates are 95% confidence intervals)
* Estimate of percent of high school students who reported cocaine use at least once in past 30 days
De Baca, Catron, and Harding County estimates not available because of low numbers and/or low response rates
Source: YRRS (NM); NMDOH Survey Section (NOTE: Brackets around reported rates are 95% confidence intervals)
New Mexico Substance Use Epidemiology Profile Page 106
Chart 2: Current Cocaine Use, by Grade Level, Gender, and Race/Ethnicity, Grades 9 - 12, New Mexico, 2017
YOUTH CURRENT COCAINE USE (continued)
Chart 3: Current Cocaine Use* by County, Grades 9 - 12, New Mexico, 2017
3.0
0.7
0.7
0.8
0.8
1.6
2.2
3.1
3.1
3.2
3.7
4.1
4.1
4.3
4.6
4.6
4.7
4.7
5.1
5.1
5.1
5.2
5.4
5.8
6.1
6.2
7.1
7.2
7.5
7.6
9.4
9.9
0 20 40 60 80 100
United States (2011)
Hidalgo
Union
Curry
Quay
Los Alamos
Roosevelt
Eddy
San Juan
Otero
Torrance
Lincoln
Santa Fe
San Miguel
Bernalillo
Socorro
Guadalupe
Sandoval
Colfax
Taos
New Mexico
Cibola
Chaves
McKinley
Mora
Lea
Dona Ana
Grant
Valencia
Luna
Rio Arriba
Sierra
Percent (%)*
5.16.8
3.3 3.8 4.7 4.66.9
5.1
9.4 8.55.8
3.4
0
25
50
Pe
rce
nt
(%)

Chart 4: Current Cocaine Use* by County, Grades 9 - 12, New Mexico, 2017
* Estimate of percent of high school students who reported cocaine use at least once in past 30 days
Insufficient Data: County estimates not available because of low numbers and/or low response rates
Source: YRRS (NM); NMDOH Survey Section; SAES
New Mexico Substance Use Epidemiology Profile Page 107
YOUTH CURRENT COCAINE USE (continued)
Youth Cocaine Use (%)

New Mexico Substance Use Epidemiology Profile Page 108

* Used a painkiller (such as Vicodin, OxyContin, or Percocet) to get high at least one time in the past 30 days
Source: YRRS (NM); CDC YRBS (US); NMDOH Survey Section (NOTE: Brackets around reported rates are 95% confidence intervals)
9th Grade 10th Grade 11th Grade 12th Grade All Grades
Sex Race/Ethnicity Percent [95% CI] Percent [95% CI] Percent [95% CI] Percent [95% CI] Percent [95% CI]
Male American Indian 7.9 (4.1-14.7) 7.6 (4.2-13.4) 4.4 (1.9-10.0) 5.5 (2.0-14.2) 6.6 (4.1-10.6)
Asian/Pacific Islander -- -- -- -- 17.9 (9.9-30.1)
Black -- -- -- -- 13.9 (9.5-19.9)
Hispanic 5.0 (2.6-9.4) 10.8 (7.8-14.8) 6.1 (3.7-9.8) 11.5 (8.6-15.3) 8.3 (6.6-10.2)
White 3.4 (1.2-9.5) 6.5 (3.6-11.6) 4.3 (2.2-8.5) 4.8 (1.9-11.5) 4.7 (3.1-7.2)
Total 5.7 (3.5-9.2) 9.0 (6.7-12.0) 5.7 (4.2-7.7) 9.8 (7.1-13.3) 7.4 (6.2-8.9)
Female American Indian 9.2 (4.7-17.1) 14.9 (5.6-33.9) 6.8 (3.8-11.9) 5.7 (3.6-8.9) 9.2 (6.7-12.5)
Asian/Pacific Islander -- -- -- -- 11.0 (5.9-19.8)
Black -- -- -- -- 6.1 (2.6-13.5)
Hispanic 2.5 (1.6-3.8) 7.1 (4.8-10.3) 5.0 (3.2-7.5) 5.1 (2.3-10.8) 5.2 (3.8-7.2)
White 7.6 (4.6-12.3) 4.7 (2.7-8.0) 5.9 (2.9-11.4) 5.8 (2.7-12.1) 6.1 (4.4-8.2)
Total 5.2 (4.1-6.5) 7.1 (5.0-9.8) 5.7 (4.1-8.0) 5.5 (3.2-9.3) 6.1 (5.0-7.3)
Total American Indian 9.0 (5.4-14.6) 10.9 (5.0-22.1) 5.5 (3.4-8.8) 5.6 (3.2-9.7) 8.1 (6.0-10.7)
Asian/Pacific Islander -- 12.6 (5.5-26.5) 11.2 (5.7-20.9) -- 15.0 (8.9-24.1)
Black 9.8 (4.3-21.0) 4.1 (1.9-8.5) -- -- 11.1 (8.2-15.0)
Hispanic 4.0 (2.3-6.7) 8.9 (6.4-12.1) 5.5 (3.9-7.6) 8.1 (6.1-10.6) 6.7 (5.3-8.4)
White 5.5 (3.5-8.7) 5.6 (3.3-9.3) 5.1 (3.2-8.1) 5.3 (2.8-9.8) 5.4 (4.1-7.0)
Total 5.6 (4.2-7.5) 8.0 (6.0-10.6) 5.7 (4.8-6.8) 7.7 (5.7-10.2) 6.9 (5.9-8.0)
Source: YRRS (NM); NMDOH Survey Section (NOTE: "95% CI" is 95% confidence interval)
New Mexico Substance Use Epidemiology Profile Page 109
Table 1: Used Painkiller to Get High, by Grade Level, Gender, and Race/Ethnicity, Grades 9 - 12, New Mexico, 2017
Problem Statement
Chart 1: Used Painkiller to Get High* by Year, Grades 9 - 12, New Mexico, 2007-2017
YOUTH USED PAINKILLER TO GET HIGH
11.714.3
11.38.5 7.9 6.9
0
10
20
30
40
50
2007 2009 2011 2013 2015 2017
Pe
rce
nt
(%)
Year
NM
US (data not available)
The rate of current use of painkillers to get high has shown no noticeable trend since the measure was added to the YRRSsurvey questionnaire in 2007. Painkiller use to get high had the second highest prevalence (6.9%) of all 30-day drug usemeasures in the 2017 YRRS, behind marijuana (27.3%). The question about the use of painkillers to get high is not on thenational YRBS, and there is no national comparison.
The rate of painkiller use to get high was higher among males (7.4%) than females (6.1%), but this difference is notstatistically significant. The prevalence was higher among Asian or Pacific Islander (15.0%) and Black (11.1%) studentsthan among American Indian (8.1), Hispanic (6.7%) and White (5.4%) students.
In 2017, the rate of painkiller use to get high was highest in Sierra (12.9%), Rio Arriba (10.2%), and Chaves (10.0%)counties. The rate was lowest in Quay (1.4%), Hidalgo (1.6%), and Roosevelt (2.1%) counties.

Source: YRRS (NM); NMDOH Survey Section (NOTE: Brackets around reported rates are 95% confidence intervals)
* Estimate of percent of high school students who reported pain killer use to get high at least once in past 30 days
De Baca, Catron, and Harding County estimates not available because of low numbers and/or low response rates
Source: YRRS (NM); NMDOH Survey Section (NOTE: Brackets around reported rates are 95% confidence intervals)
New Mexico Substance Use Epidemiology Profile Page 110
YOUTH USED PAINKILLER TO GET HIGH (continued)
Chart 3: Used Painkiller to Get High* by County, Grades 9 - 12, New Mexico, 2017
Chart 2: Used Painkiller to Get High, by Grade Level, Gender, and Race/Ethnicity, Grades 9 - 12, New Mexico,
2017
1.4
1.6
2.1
3.0
3.3
3.3
5.2
5.7
5.8
6.0
6.1
6.1
6.2
6.3
6.8
6.8
6.9
6.9
7.1
7.1
7.5
7.8
8.0
8.3
8.5
8.6
9.0
9.1
10.0
10.2
12.9
0 20 40 60 80 100
Quay
Hidalgo
Roosevelt
Union
Curry
Guadalupe
Luna
Santa Fe
San Juan
San Miguel
Lincoln
Los Alamos
Bernalillo
Torrance
Mora
Taos
Lea
New Mexico
Colfax
McKinley
Socorro
Dona Ana
Valencia
Eddy
Sandoval
Otero
Cibola
Grant
Chaves
Rio Arriba
Sierra
Percent (%)*
6.9 7.4 6.1 5.6 8.0 5.7 7.7 8.115.0
11.16.7 5.4
0
25
50
75
100
Pe
rce
nt
(%)

Chart 4: Used Painkiller to Get High* by County, Grades 9 - 12, New Mexico, 2017
* Estimate of percent of high school students who reported pain killer use to get high at least once in past 30 days
Insufficient Data: County estimates not available because of low numbers and/or low response rates
Source: YRRS (NM); NMDOH Survey Section; SAES
New Mexico Substance Use Epidemiology Profile Page 111
YOUTH USED PAINKILLER TO GET HIGH (continued)
Youth Painkiller Use to Get High (%)

New Mexico Substance Use Epidemiology Profile Page 112

* Current use: Used at least once in the past 30 days; Lifetime use: Ever used in lifetime
Source: YRRS (NM); CDC YRBS (US); NMDOH Survey Section (NOTE: Brackets around reported rates are 95% confidence intervals)
9th Grade 10th Grade 11th Grade 12th Grade All Grades
Sex Race/Ethnicity Percent [95% CI] Percent [95% CI] Percent [95% CI] Percent [95% CI] Percent [95% CI]
Male American Indian 1.7 (0.5-5.5) 2.9 (0.5-15.5) 0.0 (.-.) 2.8 (0.7-10.1) 1.9 (1.0-3.4)
Asian/Pacific Islander -- -- -- -- 7.3 (2.8-17.8)
Black -- -- -- -- 9.2 (4.9-16.7)
Hispanic 3.9 (2.3-6.6) 5.1 (3.0-8.6) 2.2 (1.2-4.2) 5.1 (2.3-11.1) 4.2 (2.9-6.1)
White 1.7 (0.4-6.7) 2.8 (1.1-6.8) 2.2 (0.9-5.5) 3.3 (1.1-9.5) 2.5 (1.3-4.7)
Total 3.5 (2.0-6.0) 4.1 (2.7-6.2) 2.6 (1.5-4.4) 4.3 (2.2-8.2) 3.6 (2.5-5.3)
Female American Indian 5.5 (1.5-17.7) 4.9 (0.9-21.6) 0.3 (0.0-1.8) 2.5 (0.6-10.7) 3.5 (1.4-8.5)
Asian/Pacific Islander -- -- -- -- 5.2 (2.2-11.5)
Black -- -- -- -- 0.4 (0.0-2.7)
Hispanic 0.9 (0.3-3.2) 1.9 (0.9-3.9) 0.5 (0.1-1.9) 2.7 (0.8-8.6) 1.9 (1.1-3.5)
White 1.1 (0.3-3.6) 0.0 (.-.) 1.8 (0.7-4.7) 1.2 (0.3-4.9) 1.0 (0.5-2.2)
Total 1.6 (0.9-2.7) 1.6 (0.8-3.3) 1.0 (0.5-1.9) 2.1 (0.8-5.2) 1.9 (1.2-2.8)
Total American Indian 4.0 (1.6-9.4) 3.8 (0.7-17.5) 0.1 (0.0-0.9) 2.6 (0.8-8.4) 2.9 (1.4-6.0)
Asian/Pacific Islander -- 6.4 (1.7-21.7) 9.3 (2.5-29.6) -- 6.4 (3.2-12.6)
Black 7.8 (2.6-21.5) 2.2 (0.3-15.8) -- -- 6.0 (3.1-11.2)
Hispanic 2.6 (1.8-3.9) 3.4 (2.1-5.5) 1.3 (0.6-2.6) 3.8 (1.6-8.8) 3.1 (2.1-4.4)
White 1.4 (0.5-3.7) 1.4 (0.6-3.6) 2.0 (1.0-4.2) 2.3 (1.0-5.3) 1.8 (1.0-3.0)
Total 2.7 (1.9-4.0) 2.9 (1.8-4.4) 1.8 (1.1-2.9) 3.2 (1.6-6.2) 2.8 (2.0-4.0)
Source: YRRS (NM); NMDOH Survey Section (NOTE: "95% CI" is 95% confidence interval, 95% CIs are not calculated for zero rates)
New Mexico Substance Use Epidemiology Profile Page 113
Table 1: Current Heroin Use, by Grade Level, Gender, and Race/Ethnicity, Grades 9 - 12, New Mexico, 2017
Problem Statement
Chart 1: Heroin Use*, Current and Lifetime, by Year, Grades 9 - 12, New Mexico and US, 2003-2017
YOUTH HEROIN USE
5.0 4.7 4.7 4.0 3.5 3.4
3.3 2.4 2.3 2.5 2.9 2.2 2.1 1.70
10
20
2003 2005 2007 2009 2011 2013 2015 2017
Pe
rce
nt
(%)
Lifetime Heroin Use, NM and US NM US
4.12.9 3.9 3.2 3.2 2.9 2.8 2.8
0
10
20
2003 2005 2007 2009 2011 2013 2015 2017
Pe
rce
nt
(%)
Current Heroin Use, New Mexico NM
The rate of lifetime heroin use by youth has not significantly varied in recent years, neither in New Mexico nor the US. TheNew Mexico rate for lifetime heroin use has been consistently higher than the US rate. This remained true in 2017, with a rateof 3.4% for New Mexico and 1.7% for the US. For current heroin use, there is no apparent trend in the New Mexico rate. Thereis no national comparison for current heroin use.
Asian or Pacific Islander (6.4%) and Black (6.0%) students were more likely to be current heroin users than Hispanic (3.1%),American Indian (2.9%), or White (1.8%) students. The prevalence of current heroin use was not associated with grade level.Males were more likely to report current heroin use (3.6%) than females (1.9%); this difference was not statistically significant.
In 2017, the highest rates for lifetime heroin use were in Sierra (6.0%), Valencia (5.5%), Rio Arriba (5.4%), and Grant (5.1%)counties and the lowest in Union (0.0%), and Curry (0.0%) counties.

Source: YRRS (NM); NMDOH Survey Section (NOTE: Brackets around reported rates are 95% confidence intervals)
* Estimate of percent of high school students who reported heroin use at least once in the past 30 days
De Baca, Harding, and Catron County estimates not available because of low numbers and/or low response rates
Source: YRRS (NM); NMDOH Survey Section (NOTE: Brackets around reported rates are 95% confidence intervals)
New Mexico Substance Use Epidemiology Profile Page 114
Chart 2: Current Heroin Use, by Grade Level, Gender, and Race/Ethnicity, Grades 9 - 12, New Mexico, 2017
YOUTH HEROIN USE (continued)
Chart 3: Current Heroin Use* by County, Grades 9 - 12, New Mexico, 2017
0.6
0.6
0.7
0.9
1.0
1.3
1.7
1.9
2.0
2.2
2.3
2.5
2.5
2.5
2.6
2.8
2.8
2.9
3.0
3.1
3.2
3.2
3.3
3.6
4.5
5.1
5.4
5.5
6.0
0 20 40 60 80 100
Curry
Union
McKinley
Quay
Hidalgo
Roosevelt
Eddy
Los Alamos
Luna
Sandoval
San Juan
Colfax
Lincoln
Otero
Taos
Torrance
Bernalillo
San Miguel
New Mexico
Guadalupe
Mora
Lea
Chaves
Cibola
Santa Fe
Socorro
Dona Ana
Grant
Rio Arriba
Valencia
Sierra
Percent (%)*
2.8 3.61.9 2.7 2.9 1.8 3.2 2.9
6.4 6.03.1 1.8
0
25
50
Pe
rce
nt
(%)

Chart 4: Current Heroin Use* by County, Grades 9 - 12, New Mexico, 2017
* Estimate of percent of high school students who reported heroin use at least once in the past 30 days
Insufficient Data: County estimates not available because of low numbers and/or low response rates
Source: YRRS (NM); NMDOH Survey Section; SAES
New Mexico Substance Use Epidemiology Profile Page 115
YOUTH HEROIN USE (continued)
Youth Current Heroin Use (%)

New Mexico Substance Use Epidemiology Profile Page 116

* Current use: Used at least once in the past 30 days; Lifetime use: Ever used in lifetime
Source: YRRS (NM); CDC YRBS (US); NMDOH Survey Section (NOTE: Brackets around reported rates are 95% confidence intervals)
9th Grade 10th Grade 11th Grade 12th Grade All Grades
Sex Race/Ethnicity Percent [95% CI] Percent [95% CI] Percent [95% CI] Percent [95% CI] Percent [95% CI]
Male American Indian 1.4 (0.5-4.1) 5.3 (1.9-13.9) 3.7 (1.2-11.4) 2.8 (0.7-10.0) 3.2 (2.0-4.9)
Asian/Pacific Islander -- -- -- -- 6.9 (3.3-13.9)
Black -- -- -- -- 8.2 (3.4-18.6)
Hispanic 3.9 (1.8-8.5) 6.5 (4.3-9.6) 3.2 (1.4-7.3) 5.0 (2.6-9.3) 4.8 (3.3-7.0)
White 1.3 (0.3-6.6) 4.0 (2.6-6.2) 2.9 (1.5-5.3) 5.6 (1.9-15.3) 3.4 (2.1-5.4)
Total 3.0 (1.4-6.5) 5.6 (4.0-7.8) 3.7 (2.5-5.7) 4.9 (2.5-9.2) 4.3 (3.1-6.0)
Female American Indian 4.9 (1.2-17.7) 4.9 (1.0-21.7) 0.0 (.-.) 2.5 (0.5-10.6) 3.2 (1.2-8.4)
Asian/Pacific Islander -- -- -- -- 5.5 (2.2-13.0)
Black -- -- -- -- 0.0 (.-.)
Hispanic 0.3 (0.0-2.7) 2.3 (1.1-4.8) 1.1 (0.3-4.0) 3.1 (1.1-7.9) 2.0 (1.1-3.7)
White 1.5 (0.4-4.7) 0.5 (0.1-3.7) 2.0 (0.9-4.1) 0.6 (0.1-4.6) 1.2 (0.5-2.6)
Total 1.3 (0.6-2.9) 2.1 (1.2-3.8) 1.3 (0.7-2.5) 2.1 (0.9-5.2) 1.9 (1.3-3.0)
Total American Indian 3.5 (1.4-8.9) 5.1 (1.5-15.8) 1.9 (0.6-6.2) 2.6 (0.8-8.4) 3.5 (1.9-6.3)
Asian/Pacific Islander -- 5.8 (3.2-10.5) 9.5 (3.5-23.2) -- 6.3 (3.9-10.1)
Black 5.5 (1.2-21.2) 5.6 (1.2-22.4) -- -- 5.3 (2.3-11.9)
Hispanic 2.4 (1.1-4.9) 4.3 (2.8-6.4) 2.1 (1.0-4.2) 3.9 (2.2-6.9) 3.4 (2.5-4.7)
White 1.4 (0.5-3.8) 2.3 (1.6-3.3) 2.4 (1.5-3.8) 3.3 (1.3-8.4) 2.3 (1.5-3.6)
Total 2.4 (1.4-4.0) 3.9 (2.7-5.5) 2.5 (1.7-3.8) 3.5 (1.8-6.6) 3.2 (2.4-4.3)
Source: YRRS (NM); NMDOH Survey Section (NOTE: "95% CI" is 95% confidence interval, 95% CIs are not calculated for zero rates)
New Mexico Substance Use Epidemiology Profile Page 117
Table 1: Current Methamphetamine Use, by Grade Level, Gender, and Race/Ethnicity, Grades 9 - 12, New Mexico, 2017
Problem Statement
Chart 1: Methamphetamine Use*, Current and Lifetime, by Year, Grades 9 - 12, New Mexico and US, 2003-2017
YOUTH METHAMPHETAMINE USE
7.76.3 5.5 5.0 4.4 4.1
7.66.2
4.4 4.1 3.8 3.2 3.0 2.50
10
20
2003 2005 2007 2009 2011 2013 2015 2017
Pe
rce
nt
(%)
Lifetime Methamphetamine Use, NM and US NM US
7.34.6 4.4 3.9 3.9 3.7 3.2 3.2
0
10
20
2003 2005 2007 2009 2011 2013 2015 2017
Pe
rce
nt
(%)
Current Methamphetamine Use, New Mexico NM
New Mexico's rate of lifetime methamphetamine use decreased from 7.7% in 2007 to 4.1% in 2017. The US rate decreasedfrom 1999 (9.1%, not shown) to 2017 (2.5%). The New Mexico rate for lifetime methamphetamine use has been consistentlyhigher than the US rate. This remained true in 2017. For current methamphetamine use, New Mexico prevalence decreasedfrom 7.3% in 2003 to 4.6% in 2005, but there has been no statistically significant change since then. There is no nationalcomparison for current methamphetamine use.
Asian or Pacific Islander (6.3%) and Black (5.3%) students were more likely to be current methamphetamine users thanHispanic (3.4%), American Indian (3.5%), or White (2.3%) students. Prevalence of current methamphetamine use was notassociated with grade level. Males were more likely to report current methamphetamine use (4.3%) than females (1.9%).
In 2017, the highest rates of current methamphetamine use were in Sierra (7.5%), Grant (6.3%), Rio Arriba (6.0%), and Valencia(5.9%) counties, and the lowest rates were in Union (0.0%), Quay (0.6%), and Hidalgo (0.7%) counties.

Source: YRRS (NM); NMDOH Survey Section (NOTE: Brackets around reported rates are 95% confidence intervals)
* Estimate of percent of high school students who reported methamphetamine use at least once in the past 30 days
De Baca, Harding, and Catron County estimates not available because of low numbers and/or low response rates
Source: YRRS (NM); NMDOH Survey Section (NOTE: Brackets around reported rates are 95% confidence intervals)
New Mexico Substance Use Epidemiology Profile Page 118
YOUTH METHAMPHETAMINE USE (continued)
Chart 3: Current Methamphetamine Use* by County, Grades 9 - 12, New Mexico, 2017
Chart 2: Current Methamphetamine Use, by Grade Level, Gender, and Race/Ethnicity, Grades 9 - 12, New
Mexico, 2017
0.6
0.7
0.9
0.9
1.0
1.7
1.7
1.7
1.7
2.0
2.1
2.6
2.7
2.8
3.2
3.2
3.2
3.3
3.3
3.5
3.9
4.2
4.2
4.4
5.1
5.7
5.9
6.0
6.3
7.5
0 20 40 60 80 100
Union
Quay
Hidalgo
Curry
Roosevelt
Los Alamos
Colfax
Eddy
Luna
San Juan
Sandoval
Torrance
Bernalillo
Lincoln
Lea
Socorro
Taos
New Mexico
Otero
Santa Fe
San Miguel
McKinley
Dona Ana
Guadalupe
Cibola
Chaves
Mora
Valencia
Rio Arriba
Grant
Sierra
Percent (%)*
3.2 4.31.9 2.4 3.9 2.5 3.5 3.5
6.3 5.33.4 2.3
0
25
50
Pe
rce
nt
(%)

Chart 4: Current Methamphetamine Use* by County, Grades 9 - 12, New Mexico, 2017
* Estimate of percent of high school students who reported methamphetamine use at least once in the past 30 days
Insufficient Data: County estimates not available because of low numbers and/or low response rates
Source: YRRS (NM); NMDOH Survey Section; SAES
New Mexico Substance Use Epidemiology Profile Page 119
YOUTH METHAMPHETAMINE USE (continued)
Youth Current Methamphetamine Use (%)

New Mexico Substance Use Epidemiology Profile Page 120

* Used inhalants (sniffed glue, breathed contents of aerosol spray cans, or inhaled paints or sprays) at least one time in the past 30 days
Source: YRRS (NM); CDC YRBS (US); NMDOH Survey Section (NOTE: Brackets around reported rates are 95% confidence intervals)
9th Grade 10th Grade 11th Grade 12th Grade All Grades
Sex Race/Ethnicity Percent [95% CI] Percent [95% CI] Percent [95% CI] Percent [95% CI] Percent [95% CI]
Male American Indian 2.4 (0.9-6.7) 3.8 (0.9-14.7) 5.0 (2.1-11.5) 2.4 (0.7-7.7) 3.3 (2.2-5.1)
Asian/Pacific Islander -- -- -- -- 13.3 (6.9-23.9)
Black -- -- -- -- 6.9 (3.0-14.8)
Hispanic 4.8 (2.8-8.3) 7.6 (4.8-11.8) 2.4 (1.2-4.6) 7.2 (4.4-11.7) 5.5 (4.0-7.6)
White 3.7 (1.3-10.0) 6.4 (3.7-10.8) 4.2 (2.4-7.3) 4.4 (1.7-10.5) 4.6 (3.2-6.7)
Total 4.7 (2.8-7.7) 6.5 (4.9-8.7) 4.4 (3.0-6.3) 5.7 (3.4-9.1) 5.3 (4.1-6.8)
Female American Indian 7.4 (3.4-15.3) 8.0 (2.6-22.2) 5.5 (2.5-11.4) 1.8 (0.3-9.1) 6.2 (3.8-10.0)
Asian/Pacific Islander -- -- -- -- 9.6 (4.9-17.9)
Black -- -- -- -- 3.0 (0.9-9.5)
Hispanic 2.6 (1.0-6.7) 5.3 (3.3-8.5) 2.2 (0.8-5.6) 2.3 (0.8-6.5) 3.6 (2.5-5.2)
White 5.7 (2.6-12.3) 5.0 (2.9-8.7) 2.5 (0.9-7.2) 3.0 (1.1-8.3) 4.2 (2.9-5.9)
Total 4.6 (3.2-6.5) 5.5 (3.9-7.8) 2.7 (1.6-4.6) 2.4 (1.3-4.2) 4.2 (3.5-5.1)
Total American Indian 5.2 (3.0-8.9) 5.7 (1.8-16.5) 5.2 (2.9-9.2) 2.1 (0.8-5.1) 4.9 (3.3-7.4)
Asian/Pacific Islander -- 8.5 (4.6-15.4) 12.3 (4.1-31.4) -- 11.7 (7.1-18.7)
Black 8.7 (3.3-21.1) 2.8 (0.5-14.4) -- -- 5.8 (2.8-11.9)
Hispanic 3.9 (2.6-5.9) 6.4 (4.7-8.7) 2.3 (1.3-3.8) 4.6 (2.7-7.7) 4.6 (3.7-5.6)
White 4.7 (2.5-8.8) 5.7 (3.7-8.6) 3.4 (1.8-6.3) 3.7 (2.1-6.5) 4.4 (3.4-5.6)
Total 4.8 (3.6-6.4) 6.0 (4.8-7.6) 3.5 (2.6-4.8) 4.0 (2.7-5.8) 4.8 (4.1-5.7)
Source: YRRS (NM); NMDOH Survey Section (NOTE: "95% CI" is 95% confidence interval)
New Mexico Substance Use Epidemiology Profile Page 121
Table 1: Current Inhalant Use, by Grade Level, Gender, and Race/Ethnicity, Grades 9 - 12, New Mexico, 2017
Problem Statement
Chart 1: Current Inhalant Use* by Year, Grades 9 - 12, New Mexico and US, 2003-2017
YOUTH CURRENT INHALANT USE
6.8 7.5 7.8 7.76.7
5.54.2 4.8
0
10
20
30
2003 2005 2007 2009 2011 2013 2015 2017
Pe
rce
nt
(%)
Year
NM
The rate of current use of inhalants (sniffing glue, breathing the contents of aerosol spray cans, or inhaling paints or sprays)was 4.8% in 2017 and has not varied significantly over recent years. There is no national comparison for current inhalant use.
Asian or Pacific Islander (11.7%) and Black (5.8%) students were more likely to use inhalants than Hispanic (4.6%), AmericanIndian (4.9%), or White (4.4%) students. Prevalence of inhalant use was not associated with grade level. There was nostatistically significant difference in prevalence of inhalant use between males (5.3%) and females (4.2%).
In 2017, the highest rates for current inhalant use were in Rio Arriba (9.1%), Grant (8.3%), and Cibola (7.5%) counties and thelowest rates in Union (0.8%), Curry (0.9%), and Roosevelt (1.1%) counties.

Source: YRRS (NM); NMDOH Survey Section (NOTE: Brackets around reported rates are 95% confidence intervals)
* Estimate of percent of high school students who reported inhalant use at least once in past 30 days
De Baca, Catron, and Harding County estimates not available because of low numbers and/or low response rates
Source: YRRS (NM); NMDOH Survey Section (NOTE: Brackets around reported rates are 95% confidence intervals)
New Mexico Substance Use Epidemiology Profile Page 122
Chart 2: Current Inhalant Use, by Grade Level, Gender, and Race/Ethnicity, Grades 9 - 12, New Mexico, 2017
YOUTH CURRENT INHALANT USE (continued)
Chart 3: Current Inhalant Use* by County, Grades 9 - 12, New Mexico, 2017
0.8
0.9
1.1
2.2
2.3
3.0
3.5
4.0
4.2
4.2
4.3
4.6
4.8
4.8
5.0
5.0
5.0
5.1
5.1
5.4
5.4
5.4
5.5
6.2
6.4
6.6
7.0
7.4
7.5
8.3
9.1
0 20 40 60 80 100
Union
Curry
Roosevelt
Quay
Eddy
Luna
San Juan
Socorro
Lea
McKinley
Sandoval
Bernalillo
Hidalgo
New Mexico
Lincoln
Mora
Taos
Guadalupe
San Miguel
Chaves
Colfax
Torrance
Los Alamos
Santa Fe
Otero
Sierra
Dona Ana
Valencia
Cibola
Grant
Rio Arriba
Percent (%)*
4.8 5.3 4.2 4.8 6.0 3.5 4.0 4.911.7
5.8 4.6 4.4
0
25
50
75
100
Pe
rce
nt
(%)

Chart 4: Current Inhalant Use* by County, Grades 9 - 12, New Mexico, 2017
* Estimate of percent of high school students who reported inhalant use at least once in past 30 days
Insufficient Data: County estimates not available because of low numbers and/or low response rates
Source: YRRS (NM); NMDOH Survey Section; SAES
New Mexico Substance Use Epidemiology Profile Page 123
YOUTH CURRENT INHALANT USE (continued)
Youth Inhalant Use (%)

New Mexico Substance Use Epidemiology Profile Page 124

* Cigarette smoking definition: smoked >= 100 cigarettes in lifetime and smoked cigarettes in past 30 days
Source: BRFSS; SAES (NOTE: Brackets around reported rates are 95% confidence intervals)
Ages Ages Ages All Ages Ages Ages All
Sex Race/Ethnicity 18-24 25-64 65+ Ages 18-24 25-64 65+ Ages*
Male American Indian 3,353 8,410 738 12,652 31.6 18.2 9.7 19.6
Asian/Pacific Islander - 1,568 - 2,199 - 17.3 - 17.5
Black - 4,275 - 6,533 - 31.6 - 33.6
Hispanic 11,529 59,389 7,013 78,000 19.5 24.1 13.9 21.9
White 3,488 42,646 9,272 55,560 11.3 20.3 9.8 16.5
Total 19,960 116,827 18,680 155,245 18.8 22.2 11.9 19.7
Female American Indian 626 6,027 328 7,115 5.9 11.9 3.0 9.8
Asian/Pacific Islander - 1,823 - 1,831 - 15.7 - 11.5
Black - 2,603 - 3,552 - 27.2 - 24.6
Hispanic 6,501 38,807 5,345 51,237 11.5 15.6 8.7 14.0
White 6,025 41,698 9,627 56,644 22.8 19.6 8.9 16.3
Total 13,511 91,937 16,238 121,633 13.8 17.2 8.7 14.9
Total American Indian 3,750 14,394 1,100 19,690 17.7 14.9 5.9 14.4
Asian/Pacific Islander - 3,425 - 4,221 - 16.5 - 14.8
Black - 6,758 1,281 9,770 - 29.2 26.4 28.9
Hispanic 18,071 98,122 12,339 129,154 15.6 19.8 11.0 17.9
White 9,658 84,345 18,880 112,193 16.8 19.9 9.3 16.4
Total 33,394 208,756 34,915 276,767 16.4 19.7 10.2 17.2* Estimate of percent of people in population group who have smoked >= 100 cigarettes in lifetime and who smoked cigarettes in past 30 days
- Excluded due to small number of respondents (< 50) in cell
Source: BRFSS; SAES
New Mexico Substance Use Epidemiology Profile Page 125
Chart 1: Cigarette Smoking (past 30 days)*, Adults Aged 18+, New Mexico, 1998-2017
ADULT CIGARETTE SMOKING
Problem Statement
Number Percent*
Table 1: Cigarette Smoking (past 30 days) by Age, Sex, and Race/Ethnicity, Adults Aged 18+, New Mexico,
2015-2017
22.5 22.4 23.6 23.821.2 22
20.3 21.520.1 20.8
19.417.9 18.5
21.519.3 19.1 19.1
17.5 16.6 17.5
0
5
10
15
20
25
30
35
1998 1999 2000 2001 2002 2003 2004 2005 2006 2007 2008 2009 2010 2011 2012 2013 2014 2015 2016 2017
Pe
rce
nt
(%)
Year
Adult cigarette smoking (defined as having smoked 100 or more cigarettes in lifetime, and currently smoking) isassociated with significant rates of smoking-related death and morbidity. According to the CDC's Smoking AttributableMortality, Morbidity, and Economic Costs (SAMMEC) website, smoking is responsible for a significant proportion of thedeaths from numerous types of malignant neoplasms (e.g., lung, esophageal, and laryngeal cancers), fromcardiovascular diseases (e.g., ischemic heart disease, cerebrovascular disease), and from several respiratorydiseases (e.g., bronchitis, emphysema, chronic airway obstruction). Combined, these smoking-related deaths makesmoking the leading behavioral cause of death in the US.
In 2017, current smoking rates among adults in New Mexico (17.5%) were slightly more than the US overall (17.0%).As shown in Chart 1, New Mexico's adult smoking prevalence rate has decreased since 1998. In 2017, as shown inTable 1, smoking was more prevalent among adults aged 25-64 (19.7%) than among young adults aged 18-24(16.4%) or adults aged 65 and over (10.2%). New Mexico men were more likely to smoke than women (19.7% v14.9%). Among males, Blacks had the highest smoking prevalence (33.6%), followed by Hispanics (21.9%) andAmerican Indians (19.6%). Among females, the highest prevalence of smoking was among Blacks (24.6%) followed byWhites (16.3%).

CountyAmerican
Indian
Asian/
Pacific
Islander
Black Hispanic White All
Races
American
Indian
Asian/
Pacific
Islander
Black Hispanic White All
Races
Bernalillo 2,544 - - 41,825 33,429 86,811 11.5 - - 17.3 14.4 16.5
Catron - - - - - 689 - - - - - 21.6
Chaves - - - 4,825 4,383 9,330 - - - 19.4 20.2 19.3
Cibola 1,851 - - 1,893 814 4,489 23.5 - - 23.9 17.4 21.6
Colfax - - - - 585 1,376 - - - - 11.0 13.3
Curry - - - 3,780 6,385 12,091 - - - 27.6 32.0 32.7
De Baca - - - - - - - - - - - -
Dona Ana - - - 14,495 7,330 22,355 - - - 14.0 14.1 13.8
Eddy - - - 2,542 4,704 7,650 - - - 13.5 21.5 18.1
Grant - - - 1,247 1,771 3,157 - - - 11.7 15.2 13.8
Guadalupe - - - - - - - - - - - -
Harding - - - - - - - - - - - -
Hidalgo - - - - - - - - - - - -
Lea - - - 3,341 4,891 8,809 - - - 13.2 24.0 18.2
Lincoln - - - - 2,270 3,964 - - - - 20.5 24.4
Los Alamos - - - - 902 1,176 - - - - 8.5 8.3
Luna - - - 2,150 2,303 4,279 - - - 19.3 35.0 23.5
McKinley 2,469 - - 1,557 978 5,477 6.4 - - 24.2 17.4 10.6
Mora - - - - - - - - - - - -
Otero 302 - - 2,144 5,376 8,509 10.6 - - 12.6 19.6 17.0
Quay - - - - 860 1,794 - - - - 23.4 26.9
Rio Arriba - - - 4,743 923 6,342 - - - 22.3 19.9 20.9
Roosevelt - - - - 1,657 2,554 - - - - 19.4 17.2
Sandoval - - - 5,331 7,730 18,589 - - - 13.9 14.6 17.3
San Juan 4,282 - - 3,654 7,621 15,918 12.1 - - 22.6 18.7 17.0
San Miguel - - - 4,439 388 4,649 - - - 25.7 8.5 20.5
Santa Fe - - - 9,523 6,689 16,899 - - - 16.9 11.4 14.0
Sierra - - - - 1,313 1,844 - - - - 19.4 19.3
Socorro - - - - - 3,717 - - - - - 27.9
Taos - - - 1,699 713 3,825 - - - 11.7 6.6 14.1
Torrance - - - - - - - - - - - -
Union - - - - - - - - - - - -
Valencia - - - 8,535 5,013 15,179 - - - 25.8 23.1 26.2
New Mexico 19,690 4,221 9,770 129,154 112,193 276,767 14.4 14.8 28.9 17.9 16.4 17.2* Estimate of percent of people in population group who have smoked >= 100 cigarettes in lifetime and who smoked cigarettes in past 30 days
- Excluded due to small number of respondents (< 50) in cell
Source: BRFSS; SAES
New Mexico Substance Use Epidemiology Profile Page 126
ADULT CIGARETTE SMOKING (continued)
Problem Statement (continued)
Table 2: Cigarette Smoking (past 30 days) by Race/Ethnicity and County, Adults Aged 18+, New Mexico, 2015-
2017
Number Percent*
Smoking prevalence rates were highest among Black men (33.6%) while smoking-related death rates were highestamong White men (145.5 per 100,0000 population) and Black men (144.6 per 100,000 population). Among women,Blacks had the highest smoking prevalence rates (24.6%). However, White women had the highest smoking-related deathrates (81.2 deaths per 100,000 population) followed by Blacks (68.4 deaths per 100,000 population).
As shown in Table 2 and Chart 2, the counties with the highest smoking rates were Curry (32.7%), Socorro (27.9%), Quay(26.9%), and Valencia (26.2%); these four counties had rates one and a half times higher than the national rate. Thecounties with the lowest rates were Los Alamos (8.3%), McKinley (10.6%), and Colfax (13.3%).
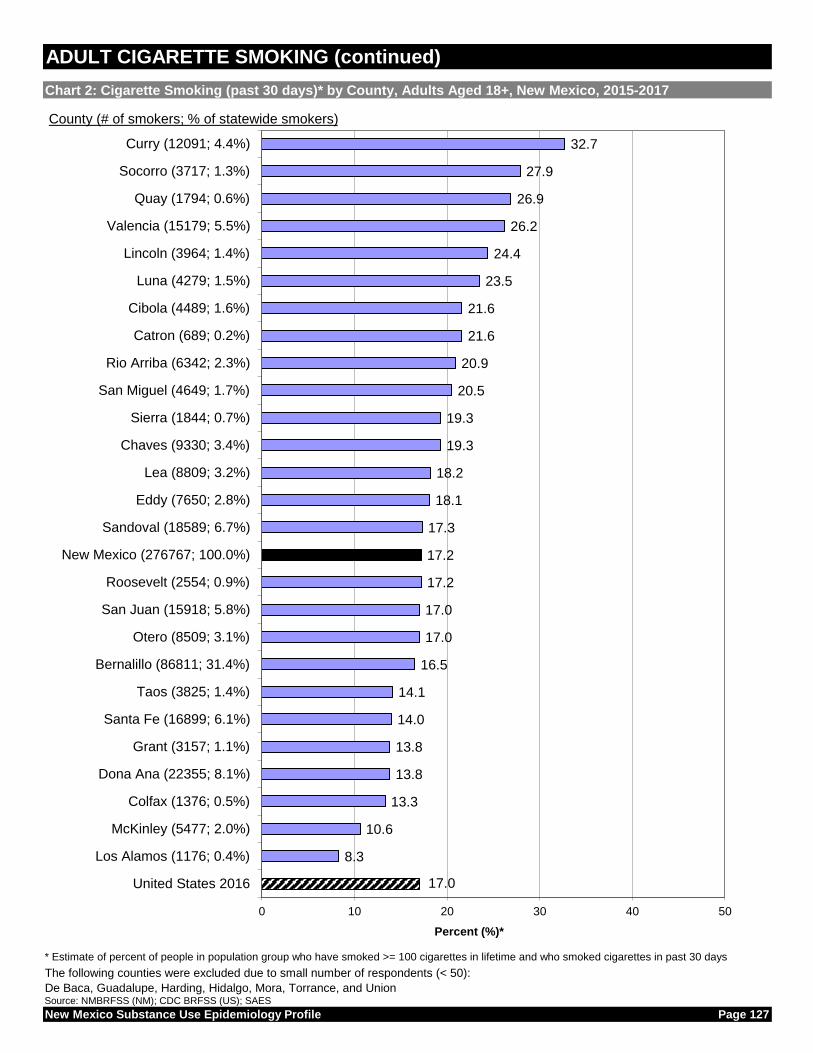
* Estimate of percent of people in population group who have smoked >= 100 cigarettes in lifetime and who smoked cigarettes in past 30 days
The following counties were excluded due to small number of respondents (< 50):
De Baca, Guadalupe, Harding, Hidalgo, Mora, Torrance, and UnionSource: NMBRFSS (NM); CDC BRFSS (US); SAES
New Mexico Substance Use Epidemiology Profile Page 127
Chart 2: Cigarette Smoking (past 30 days)* by County, Adults Aged 18+, New Mexico, 2015-2017
ADULT CIGARETTE SMOKING (continued)
17.0
8.3
10.6
13.3
13.8
13.8
14.0
14.1
16.5
17.0
17.0
17.2
17.2
17.3
18.1
18.2
19.3
19.3
20.5
20.9
21.6
21.6
23.5
24.4
26.2
26.9
27.9
32.7
0 10 20 30 40 50
United States 2016
Los Alamos (1176; 0.4%)
McKinley (5477; 2.0%)
Colfax (1376; 0.5%)
Dona Ana (22355; 8.1%)
Grant (3157; 1.1%)
Santa Fe (16899; 6.1%)
Taos (3825; 1.4%)
Bernalillo (86811; 31.4%)
Otero (8509; 3.1%)
San Juan (15918; 5.8%)
Roosevelt (2554; 0.9%)
New Mexico (276767; 100.0%)
Sandoval (18589; 6.7%)
Eddy (7650; 2.8%)
Lea (8809; 3.2%)
Chaves (9330; 3.4%)
Sierra (1844; 0.7%)
San Miguel (4649; 1.7%)
Rio Arriba (6342; 2.3%)
Catron (689; 0.2%)
Cibola (4489; 1.6%)
Luna (4279; 1.5%)
Lincoln (3964; 1.4%)
Valencia (15179; 5.5%)
Quay (1794; 0.6%)
Socorro (3717; 1.3%)
Curry (12091; 4.4%)
Percent (%)*
County (# of smokers; % of statewide smokers)
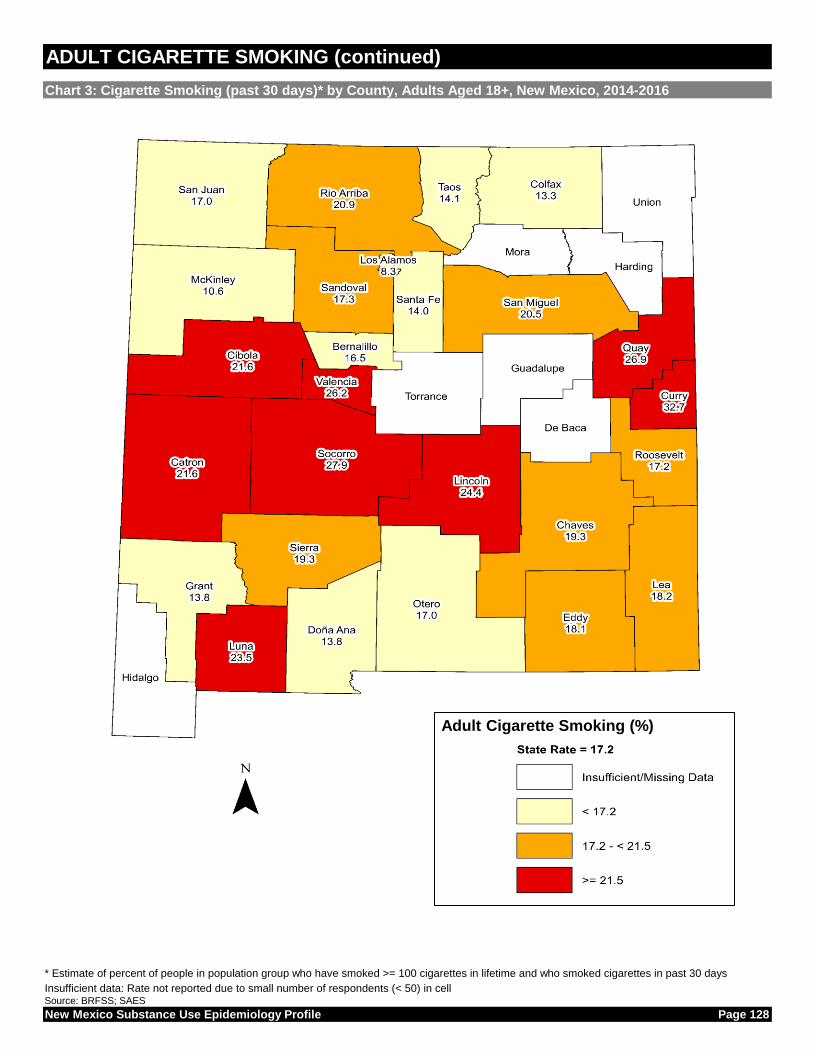
* Estimate of percent of people in population group who have smoked >= 100 cigarettes in lifetime and who smoked cigarettes in past 30 days
Insufficient data: Rate not reported due to small number of respondents (< 50) in cellSource: BRFSS; SAES
New Mexico Substance Use Epidemiology Profile Page 128
ADULT CIGARETTE SMOKING (continued)
Chart 3: Cigarette Smoking (past 30 days)* by County, Adults Aged 18+, New Mexico, 2014-2016
Adult Cigarette Smoking (%)

* Smoked cigarettes on at least one of the past 30 days
Source: YRRS (NM); CDC YRBS (US); NMDOH Survey Section (NOTE: Brackets around reported rates are 95% confidence intervals)
9th Grade 10th Grade 11th Grade 12th Grade All Grades
Sex Race/Ethnicity Percent [95% CI] Percent [95% CI] Percent [95% CI] Percent [95% CI] Percent [95% CI]
Male American Indian 11.7 (6.1-21.4) 11.1 (8.0-15.1) 13.9 (7.9-23.1) 22.2 (15.8-30.4) 13.9 (11.1-17.3)
Asian/Pacific Islander -- -- -- -- 10.8 (3.7-27.8)
Black -- -- -- -- 11.6 (5.7-21.9)
Hispanic 7.1 (4.4-11.4) 10.9 (7.5-15.7) 12.4 (9.0-16.9) 20.6 (14.9-27.9) 12.3 (9.6-15.7)
White 5.1 (2.7-9.7) 9.0 (5.3-14.8) 14.3 (10.4-19.4) 14.8 (11.1-19.6) 10.5 (8.3-13.3)
Total 7.3 (4.9-10.6) 10.1 (7.7-13.2) 13.2 (11.3-15.3) 18.8 (14.6-23.9) 11.9 (9.8-14.2)
Female American Indian 8.3 (3.9-16.8) 8.9 (3.8-19.7) 12.4 (5.8-24.7) 12.8 (8.4-19.0) 10.2 (7.4-13.9)
Asian/Pacific Islander -- -- -- -- 13.5 (5.7-29.0)
Black -- -- -- -- 3.8 (1.5-9.5)
Hispanic 4.9 (2.2-10.7) 7.5 (4.9-11.3) 10.9 (6.0-19.2) 13.0 (7.8-21.0) 9.1 (6.1-13.4)
White 5.0 (2.5-9.8) 5.7 (3.2-10.0) 9.4 (5.2-16.4) 16.4 (10.6-24.5) 8.8 (6.2-12.3)
Total 5.3 (3.6-7.8) 7.0 (5.0-9.6) 10.5 (7.9-13.8) 13.8 (9.4-19.8) 9.0 (6.8-11.9)
Total American Indian 10.7 (6.0-18.1) 10.2 (6.6-15.3) 13.4 (7.8-22.1) 17.5 (15.1-20.1) 12.6 (10.6-14.9)
Asian/Pacific Islander -- 9.4 (3.2-24.4) -- -- 12.0 (5.5-24.1)
Black 7.4 (1.7-26.8) 5.6 (1.4-19.8) -- -- 8.8 (4.8-15.6)
Hispanic 6.2 (4.5-8.5) 9.1 (6.9-11.8) 11.6 (8.3-16.0) 16.6 (11.5-23.3) 10.7 (8.1-14.0)
White 5.1 (3.1-8.1) 7.4 (5.3-10.1) 11.9 (9.1-15.5) 15.6 (11.5-20.8) 9.7 (7.8-11.9)
Total 6.5 (5.1-8.3) 8.5 (6.8-10.7) 11.8 (10.1-13.9) 16.3 (12.3-21.4) 10.6 (8.6-12.9)
Source: YRRS (NM); NMDOH Survey Section (NOTE: "95% CI" is 95% confidence interval)
New Mexico Substance Use Epidemiology Profile Page 129
Table 1: Current Cigarette Smoking, by Grade Level, Gender, and Race/Ethnicity, Grades 9 - 12, New Mexico, 2017
Problem Statement*
Chart 1: Current Cigarette Smoking* by Year, Grades 9 - 12, New Mexico and US, 2003-2017
YOUTH CURRENT CIGARETTE SMOKING
30.225.7 24.2 24.0
19.9
14.4
11.4 10.621.9 23.0
20.0 19.5 18.1
15.7
10.8 8.80
10
20
30
40
50
2003 2005 2007 2009 2011 2013 2015 2017
Pe
rce
nt
(%)
Year
NM
US
Cigarette smoking is the leading cause of preventable death in the US. Cigarette smoking increases risk for several cancersand other chronic conditions. Smoking is initiated and established primarily during adolescence, with more than 80% of adultsmokers first smoking before age 18.**
The prevalence of current cigarette smoking among NM high school students has decreased from 30.2% in 2003 to 10.6% in2017. This coincides with a decrease in the US rate that has occurred over the past several years. The NM rate wasconsistently higher than the US rate until 2011. In 2011, NM and US rates were not statistically distinguishable (US=18.1%;NM=19.9%). In 2017, the NM rate (10.6%) was higher than the US rate (8.8%).
Boys (11.9%) were more likely to be current cigarette smokers than girls (9.0%). Black (8.8%), White (9.7%) and Hispanic(10.7%) students had lower rates of current cigarette smoking than American Indian (12.6%) and Asian or Pacific Islander(12.0%) students. Chart 2 shows that prevalence increased significantly with grade level. In 2017, the counties with the highestprevalence of current smoking were Rio Arriba (17.8%), Otero (17.6%), and Cibola (16.8%). The counties with the lowestprevalence of current smoking were Curry (4.2%), Sierra (7.4%), and Hidalgo (7.6%).
* YRRS tobacco questions do not distinguish between ceremonial/traditional and commercial tobacco use.** Youth and Tobacco Use. Centers for Disease Control and Prevention. https://www.cdc.gov/tobacco/data_statistics/fact_sheets/youth_data/tobacco_use/index.htm
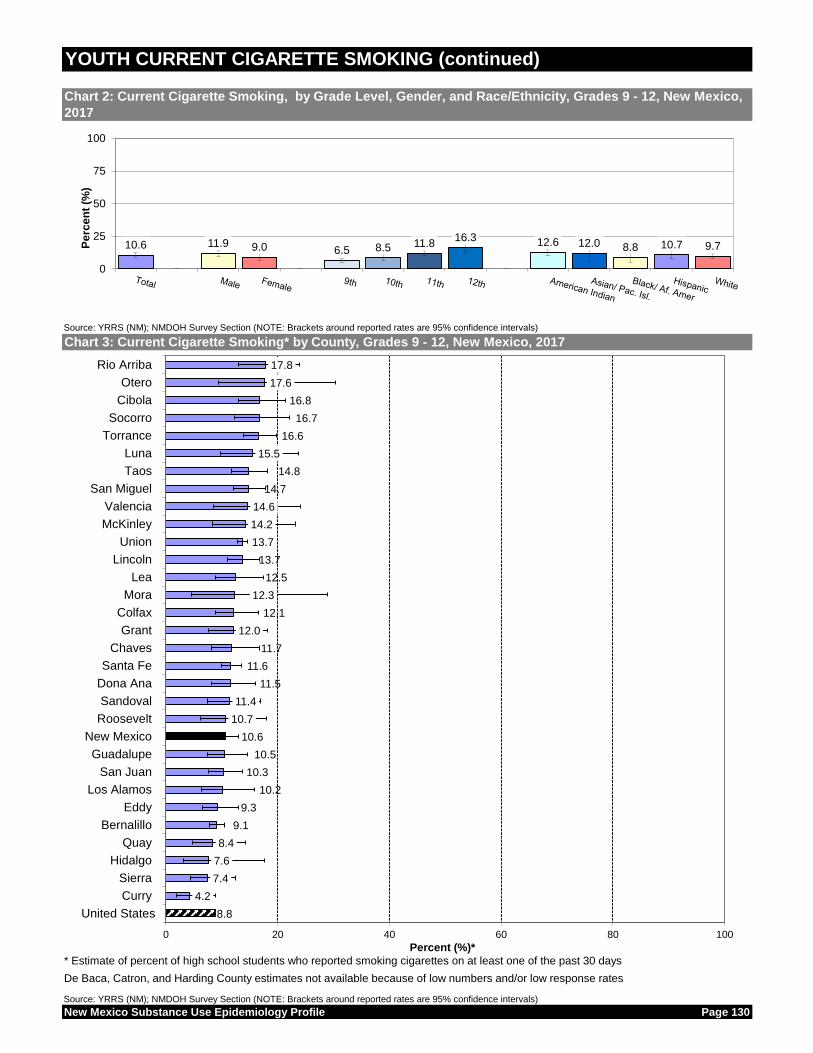
Source: YRRS (NM); NMDOH Survey Section (NOTE: Brackets around reported rates are 95% confidence intervals)
* Estimate of percent of high school students who reported smoking cigarettes on at least one of the past 30 days
De Baca, Catron, and Harding County estimates not available because of low numbers and/or low response rates
Source: YRRS (NM); NMDOH Survey Section (NOTE: Brackets around reported rates are 95% confidence intervals)
New Mexico Substance Use Epidemiology Profile Page 130
YOUTH CURRENT CIGARETTE SMOKING (continued)
Chart 3: Current Cigarette Smoking* by County, Grades 9 - 12, New Mexico, 2017
Chart 2: Current Cigarette Smoking, by Grade Level, Gender, and Race/Ethnicity, Grades 9 - 12, New Mexico,
2017
8.8
4.2
7.4
7.6
8.4
9.1
9.3
10.2
10.3
10.5
10.6
10.7
11.4
11.5
11.6
11.7
12.0
12.1
12.3
12.5
13.7
13.7
14.2
14.6
14.7
14.8
15.5
16.6
16.7
16.8
17.6
17.8
0 20 40 60 80 100
United States
Curry
Sierra
Hidalgo
Quay
Bernalillo
Eddy
Los Alamos
San Juan
Guadalupe
New Mexico
Roosevelt
Sandoval
Dona Ana
Santa Fe
Chaves
Grant
Colfax
Mora
Lea
Lincoln
Union
McKinley
Valencia
San Miguel
Taos
Luna
Torrance
Socorro
Cibola
Otero
Rio Arriba
Percent (%)*
10.6 11.9 9.0 6.5 8.5 11.816.3 12.6 12.0 8.8 10.7 9.7
0
25
50
75
100
Pe
rce
nt
(%)

Chart 4: Current Cigarette Smoking* by County, Grades 9 - 12, New Mexico, 2017
* Estimate of percent of high school students who reported smoking cigarettes on at least one of the past 30 days
Insufficient Data: County estimates not available because of low numbers and/or low response rates
Source: YRRS (NM); NMDOH Survey Section; SAES
New Mexico Substance Use Epidemiology Profile Page 131
YOUTH CURRENT CIGARETTE SMOKING (continued)
Youth Current Cigarette Smoking (%)

New Mexico Substance Use Epidemiology Profile Page 132

* Smoked cigarettes on at least 20 of the past 30 days
Source: YRRS (NM); CDC YRBS (US); NMDOH Survey Section (NOTE: Brackets around reported rates are 95% confidence intervals)
9th Grade 10th Grade 11th Grade 12th Grade All Grades
Sex Race/Ethnicity Percent [95% CI] Percent [95% CI] Percent [95% CI] Percent [95% CI] Percent [95% CI]
Male American Indian 1.3 (0.4-4.1) 1.2 (0.3-4.9) 1.5 (0.4-5.1) 5.5 (2.1-13.6) 2.1 (1.0-4.3)
Asian/Pacific Islander -- -- -- -- 4.8 (1.1-19.0)
Black -- -- -- -- 2.6 (0.7-9.3)
Hispanic 0.9 (0.3-3.0) 3.4 (1.2-9.7) 2.8 (1.5-5.1) 4.7 (2.6-8.4) 2.8 (1.6-5.0)
White 0.5 (0.1-3.9) 2.7 (0.8-8.1) 4.4 (2.4-7.9) 7.1 (4.2-11.8) 3.5 (2.2-5.5)
Total 1.0 (0.4-2.1) 2.8 (1.2-6.1) 3.0 (1.9-4.5) 6.0 (4.2-8.7) 3.0 (2.1-4.3)
Female American Indian 1.0 (0.1-7.4) 0.0 (.-.) 1.6 (0.2-11.2) 0.0 (.-.) 0.7 (0.2-2.9)
Asian/Pacific Islander -- -- -- -- 6.0 (1.1-26.2)
Black -- -- -- -- 0.8 (0.1-5.7)
Hispanic 0.4 (0.1-1.4) 1.8 (0.7-4.9) 2.9 (0.9-9.0) 2.3 (0.9-5.8) 1.9 (1.0-3.6)
White 0.8 (0.1-5.7) 1.2 (0.3-5.6) 3.5 (1.3-8.9) 4.0 (1.5-10.1) 2.3 (1.2-4.5)
Total 0.6 (0.2-1.8) 1.3 (0.7-2.6) 2.9 (1.1-7.0) 2.7 (1.2-5.9) 1.9 (1.0-3.5)
Total American Indian 1.2 (0.4-3.2) 0.7 (0.2-2.7) 1.5 (0.5-4.8) 2.7 (1.1-6.4) 1.4 (0.7-2.8)
Asian/Pacific Islander -- 2.8 (0.3-19.3) -- -- 5.3 (1.5-17.1)
Black 2.2 (0.4-12.3) 0.0 (.-.) -- -- 2.5 (0.9-6.7)
Hispanic 0.9 (0.4-2.2) 2.6 (1.2-5.3) 2.8 (1.6-5.1) 3.4 (2.4-5.0) 2.4 (1.6-3.6)
White 0.6 (0.1-2.8) 2.0 (0.9-4.4) 4.0 (2.1-7.4) 5.6 (3.2-9.6) 2.9 (1.8-4.6)
Total 0.9 (0.5-1.6) 2.0 (1.0-4.0) 2.9 (1.7-4.9) 4.4 (3.0-6.5) 2.5 (1.7-3.8)
Source: YRRS (NM); NMDOH Survey Section (NOTE: "95% CI" is 95% confidence interval, 95% CIs are not calculated for zero rates)
New Mexico Substance Use Epidemiology Profile Page 133
Table 1: Frequent Cigarette Smoking, by Grade Level, Gender, and Race/Ethnicity, Grades 9 - 12, New Mexico, 2017
Problem Statement*
Chart 1: Frequent Cigarette Smoking* by Year, Grades 9 - 12, New Mexico and US, 2003-2017
YOUTH FREQUENT CIGARETTE SMOKING
8.5 7.8 6.7 7.2 5.8 3.6 2.7 2.5
9.7 9.4 8.1 7.3 6.4 5.63.4 2.6
0
10
20
30
40
50
2003 2005 2007 2009 2011 2013 2015 2017
Pe
rce
nt
(%)
Year
NM
US
Frequent cigarette smoking means smoking cigarettes on at least 20 of the past 30 days. The prevalence of frequent cigarettesmoking among New Mexico high school students has decreased from 8.5% in 2003 to 2.5% in 2017. This coincides with adecrease in the US rate of frequent smoking over the past several years. In 2017, the New Mexico prevalence of frequentsmoking was not statistically different from the US rate (2.6%).
Boys (3.0%) were more likely to be frequent smokers than girls (1.9%). Asian or Pacific Islander (5.3%) students had a higherprevalence of frequent smoking than students of other race/ethnicities, but these differences were not statistically significant.The prevalence of frequent smoking increased with grade level (9th=0.9%; 10th=2.0%; 11th=2.9%; 12th=4.4%), but theserates were also not statistically different.
In 2017, the highest rates for frequent cigarette smoking were in Luna (6.2%), Otero (5.1%), and Roosevelt (5.0%) counties.The lowest rates were in McKinley (0.1%), Hidalgo (0.7%), and Curry (1.0%) counties.
* YRRS tobacco questions do not distinguish between ceremonial/traditional and commercial tobacco use.

Source: YRRS (NM); NMDOH Survey Section (NOTE: Brackets around reported rates are 95% confidence intervals)
* Estimate of percent of high school students who reported smoking cigarettes on at least 20 of the past 30 days
De Baca, Catron, and Harding County estimates not available because of low numbers and/or low response rates
Source: YRRS (NM); NMDOH Survey Section (NOTE: Brackets around reported rates are 95% confidence intervals)
New Mexico Substance Use Epidemiology Profile Page 134
YOUTH FREQUENT CIGARETTE SMOKING (continued)
Chart 3: Frequent Cigarette Smoking* by County, Grades 9 - 12, New Mexico, 2017
Chart 2: Frequent Cigarette Smoking, by Grade Level, Gender, and Race/Ethnicity, Grades 9 - 12, New Mexico,
2017
2.6
0.1
0.7
1.0
1.4
1.7
1.9
2.0
2.0
2.0
2.2
2.2
2.5
2.5
2.5
2.6
3.0
3.1
3.1
3.1
3.2
3.3
3.4
3.7
4.0
4.1
4.3
4.5
4.8
5.0
5.1
6.2
0 20 40 60 80 100
United States
McKinley
Hidalgo
Curry
Quay
Bernalillo
San Juan
Cibola
Lincoln
Los Alamos
Santa Fe
Torrance
Dona Ana
Sandoval
New Mexico
Mora
Eddy
Chaves
Lea
Taos
Guadalupe
Rio Arriba
Colfax
San Miguel
Union
Grant
Socorro
Valencia
Sierra
Roosevelt
Otero
Luna
Percent (%)*
2.5 3.0 1.9 0.9 2.0 2.9 4.41.4
5.32.5 2.4 2.9
0
25
50
Pe
rce
nt
(%)
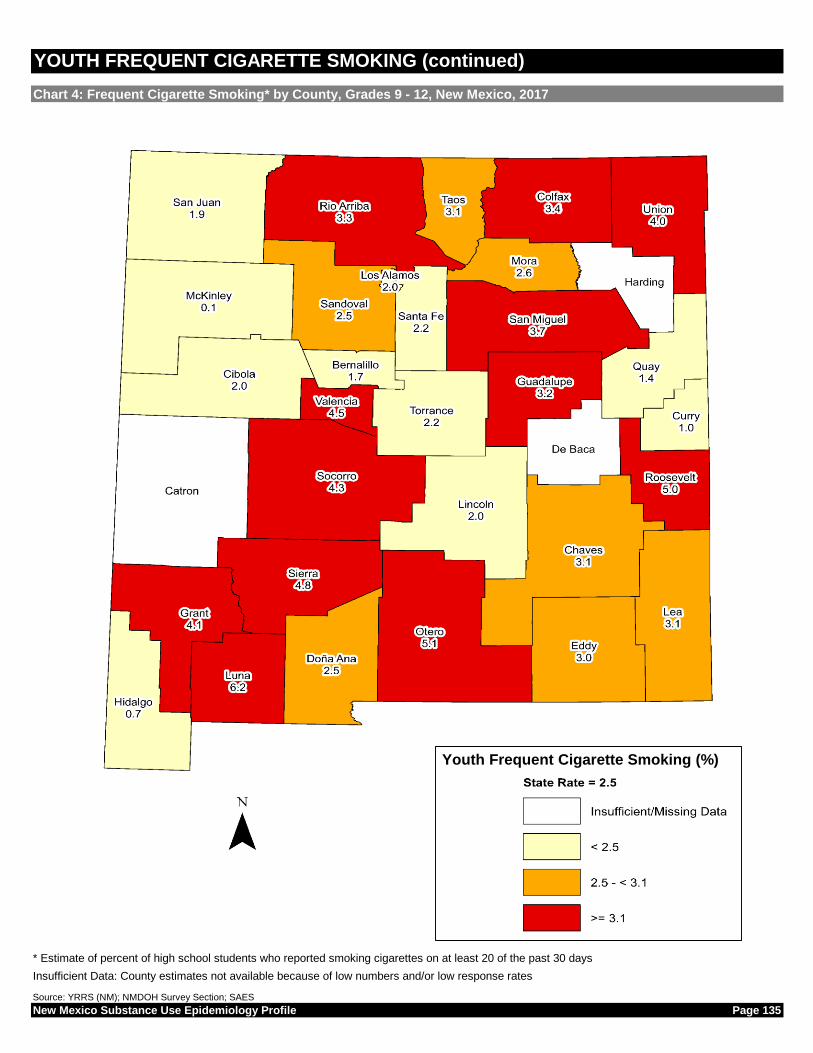
Chart 4: Frequent Cigarette Smoking* by County, Grades 9 - 12, New Mexico, 2017
* Estimate of percent of high school students who reported smoking cigarettes on at least 20 of the past 30 days
Insufficient Data: County estimates not available because of low numbers and/or low response rates
Source: YRRS (NM); NMDOH Survey Section; SAES
New Mexico Substance Use Epidemiology Profile Page 135
YOUTH FREQUENT CIGARETTE SMOKING (continued)
Youth Frequent Cigarette Smoking (%)

New Mexico Substance Use Epidemiology Profile Page 136

State Population by Age, Sex, Race/Ethnicity, and County
New Mexico Substance Use Epidemiology Profile Page 137
Appendix 1

New Mexico Substance Use Epidemiology Profile Page 138
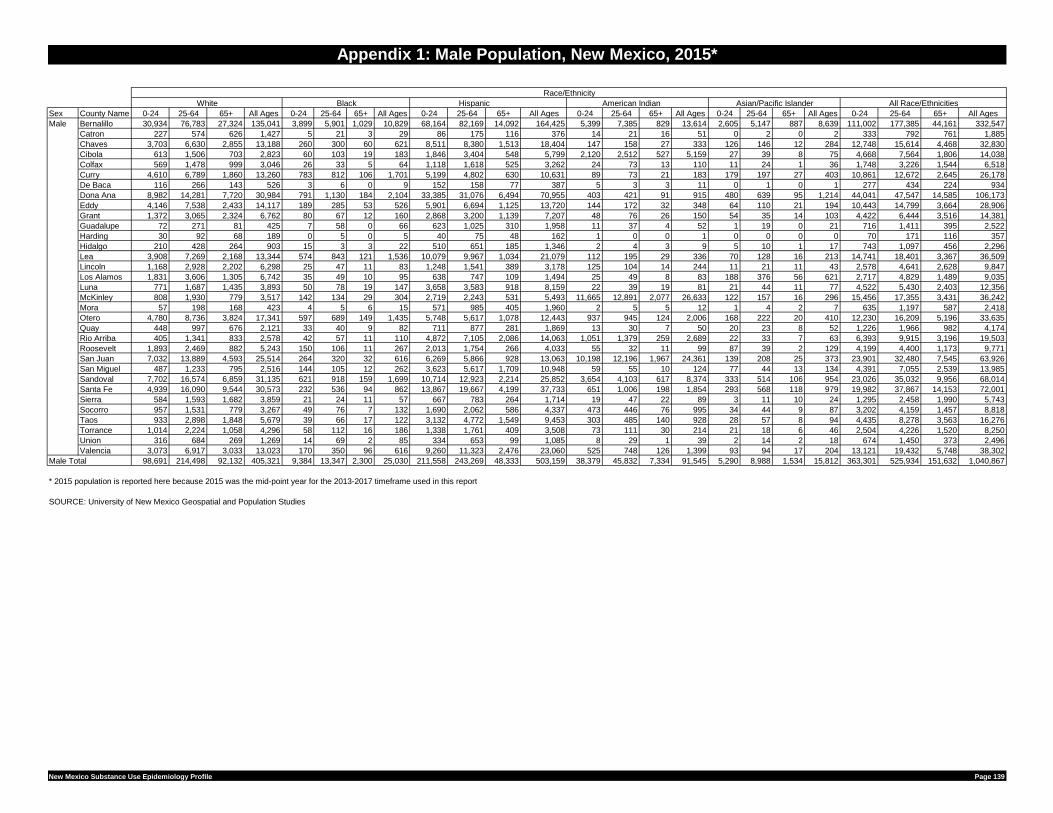
Sex County Name 0-24 25-64 65+ All Ages 0-24 25-64 65+ All Ages 0-24 25-64 65+ All Ages 0-24 25-64 65+ All Ages 0-24 25-64 65+ All Ages 0-24 25-64 65+ All Ages
Male Bernalillo 30,934 76,783 27,324 135,041 3,899 5,901 1,029 10,829 68,164 82,169 14,092 164,425 5,399 7,385 829 13,614 2,605 5,147 887 8,639 111,002 177,385 44,161 332,547
Catron 227 574 626 1,427 5 21 3 29 86 175 116 376 14 21 16 51 0 2 0 2 333 792 761 1,885
Chaves 3,703 6,630 2,855 13,188 260 300 60 621 8,511 8,380 1,513 18,404 147 158 27 333 126 146 12 284 12,748 15,614 4,468 32,830
Cibola 613 1,506 703 2,823 60 103 19 183 1,846 3,404 548 5,799 2,120 2,512 527 5,159 27 39 8 75 4,668 7,564 1,806 14,038
Colfax 569 1,478 999 3,046 26 33 5 64 1,118 1,618 525 3,262 24 73 13 110 11 24 1 36 1,748 3,226 1,544 6,518
Curry 4,610 6,789 1,860 13,260 783 812 106 1,701 5,199 4,802 630 10,631 89 73 21 183 179 197 27 403 10,861 12,672 2,645 26,178
De Baca 116 266 143 526 3 6 0 9 152 158 77 387 5 3 3 11 0 1 0 1 277 434 224 934
Dona Ana 8,982 14,281 7,720 30,984 791 1,130 184 2,104 33,385 31,076 6,494 70,955 403 421 91 915 480 639 95 1,214 44,041 47,547 14,585 106,173
Eddy 4,146 7,538 2,433 14,117 189 285 53 526 5,901 6,694 1,125 13,720 144 172 32 348 64 110 21 194 10,443 14,799 3,664 28,906
Grant 1,372 3,065 2,324 6,762 80 67 12 160 2,868 3,200 1,139 7,207 48 76 26 150 54 35 14 103 4,422 6,444 3,516 14,381
Guadalupe 72 271 81 425 7 58 0 66 623 1,025 310 1,958 11 37 4 52 1 19 0 21 716 1,411 395 2,522
Harding 30 92 68 189 0 5 0 5 40 75 48 162 1 0 0 1 0 0 0 0 70 171 116 357
Hidalgo 210 428 264 903 15 3 3 22 510 651 185 1,346 2 4 3 9 5 10 1 17 743 1,097 456 2,296
Lea 3,908 7,269 2,168 13,344 574 843 121 1,536 10,079 9,967 1,034 21,079 112 195 29 336 70 128 16 213 14,741 18,401 3,367 36,509
Lincoln 1,168 2,928 2,202 6,298 25 47 11 83 1,248 1,541 389 3,178 125 104 14 244 11 21 11 43 2,578 4,641 2,628 9,847
Los Alamos 1,831 3,606 1,305 6,742 35 49 10 95 638 747 109 1,494 25 49 8 83 188 376 56 621 2,717 4,829 1,489 9,035
Luna 771 1,687 1,435 3,893 50 78 19 147 3,658 3,583 918 8,159 22 39 19 81 21 44 11 77 4,522 5,430 2,403 12,356
McKinley 808 1,930 779 3,517 142 134 29 304 2,719 2,243 531 5,493 11,665 12,891 2,077 26,633 122 157 16 296 15,456 17,355 3,431 36,242
Mora 57 198 168 423 4 5 6 15 571 985 405 1,960 2 5 5 12 1 4 2 7 635 1,197 587 2,418
Otero 4,780 8,736 3,824 17,341 597 689 149 1,435 5,748 5,617 1,078 12,443 937 945 124 2,006 168 222 20 410 12,230 16,209 5,196 33,635
Quay 448 997 676 2,121 33 40 9 82 711 877 281 1,869 13 30 7 50 20 23 8 52 1,226 1,966 982 4,174
Rio Arriba 405 1,341 833 2,578 42 57 11 110 4,872 7,105 2,086 14,063 1,051 1,379 259 2,689 22 33 7 63 6,393 9,915 3,196 19,503
Roosevelt 1,893 2,469 882 5,243 150 106 11 267 2,013 1,754 266 4,033 55 32 11 99 87 39 2 129 4,199 4,400 1,173 9,771
San Juan 7,032 13,889 4,593 25,514 264 320 32 616 6,269 5,866 928 13,063 10,198 12,196 1,967 24,361 139 208 25 373 23,901 32,480 7,545 63,926
San Miguel 487 1,233 795 2,516 144 105 12 262 3,623 5,617 1,709 10,948 59 55 10 124 77 44 13 134 4,391 7,055 2,539 13,985
Sandoval 7,702 16,574 6,859 31,135 621 918 159 1,699 10,714 12,923 2,214 25,852 3,654 4,103 617 8,374 333 514 106 954 23,026 35,032 9,956 68,014
Santa Fe 4,939 16,090 9,544 30,573 232 536 94 862 13,867 19,667 4,199 37,733 651 1,006 198 1,854 293 568 118 979 19,982 37,867 14,153 72,001
Sierra 584 1,593 1,682 3,859 21 24 11 57 667 783 264 1,714 19 47 22 89 3 11 10 24 1,295 2,458 1,990 5,743
Socorro 957 1,531 779 3,267 49 76 7 132 1,690 2,062 586 4,337 473 446 76 995 34 44 9 87 3,202 4,159 1,457 8,818
Taos 933 2,898 1,848 5,679 39 66 17 122 3,132 4,772 1,549 9,453 303 485 140 928 28 57 8 94 4,435 8,278 3,563 16,276
Torrance 1,014 2,224 1,058 4,296 58 112 16 186 1,338 1,761 409 3,508 73 111 30 214 21 18 6 46 2,504 4,226 1,520 8,250
Union 316 684 269 1,269 14 69 2 85 334 653 99 1,085 8 29 1 39 2 14 2 18 674 1,450 373 2,496
Valencia 3,073 6,917 3,033 13,023 170 350 96 616 9,260 11,323 2,476 23,060 525 748 126 1,399 93 94 17 204 13,121 19,432 5,748 38,302
Male Total 98,691 214,498 92,132 405,321 9,384 13,347 2,300 25,030 211,558 243,269 48,333 503,159 38,379 45,832 7,334 91,545 5,290 8,988 1,534 15,812 363,301 525,934 151,632 1,040,867
* 2015 population is reported here because 2015 was the mid-point year for the 2013-2017 timeframe used in this report
SOURCE: University of New Mexico Geospatial and Population Studies
New Mexico Substance Use Epidemiology Profile Page 139
Appendix 1: Male Population, New Mexico, 2015*
Race/Ethnicity
White Black Hispanic American Indian Asian/Pacific Islander All Race/Ethnicities

New Mexico Substance Use Epidemiology Profile Page 140

Sex County Name 0-24 25-64 65+ All Ages 0-24 25-64 65+ All Ages 0-24 25-64 65+ All Ages 0-24 25-64 65+ All Ages 0-24 25-64 65+ All Ages 0-24 25-64 65+ All Ages
Female Bernalillo 28,976 77,792 33,298 140,067 3,362 4,474 1,043 8,880 66,211 86,620 18,766 171,597 5,466 8,754 1,323 15,543 2,653 6,284 1,245 10,181 106,668 183,923 55,676 346,267
Catron 213 599 502 1,315 7 7 3 18 86 129 97 313 21 26 11 58 3 3 2 8 331 765 616 1,712
Chaves 3,280 6,933 3,572 13,785 214 240 81 535 8,132 8,533 1,697 18,363 81 138 44 264 84 174 36 294 11,792 16,018 5,430 33,241
Cibola 560 1,488 751 2,799 56 84 14 154 1,706 2,248 687 4,641 2,187 2,850 800 5,838 25 45 9 80 4,536 6,715 2,261 13,511
Colfax 511 1,543 1,032 3,085 30 22 4 56 1,072 1,461 602 3,134 12 31 8 52 14 30 8 53 1,639 3,086 1,655 6,380
Curry 3,617 6,163 2,372 12,152 599 651 130 1,380 4,668 4,669 784 10,121 59 114 21 195 131 277 52 461 9,075 11,874 3,360 24,308
De Baca 130 253 181 564 4 1 1 6 142 162 81 385 1 5 1 7 1 1 0 2 279 422 264 965
Dona Ana 8,291 14,091 8,408 30,790 600 757 169 1,526 33,414 34,117 7,914 75,446 407 404 100 911 483 777 154 1,414 43,194 50,146 16,747 110,086
Eddy 3,833 7,225 2,894 13,952 154 151 49 354 5,952 6,273 1,314 13,539 106 154 22 282 64 156 35 255 10,108 13,960 4,314 28,382
Grant 1,275 3,461 2,264 7,000 49 46 15 112 2,659 3,369 1,426 7,454 46 89 30 165 35 75 23 133 4,065 7,041 3,758 14,864
Guadalupe 65 157 92 315 1 3 0 4 485 756 345 1,586 8 8 1 17 7 12 1 21 568 937 439 1,943
Harding 35 93 67 194 1 0 0 1 40 56 41 138 0 0 0 0 0 0 1 1 75 149 109 334
Hidalgo 226 452 242 920 10 8 4 23 474 603 235 1,313 5 4 1 10 5 8 0 13 722 1,075 482 2,279
Lea 3,694 6,872 2,694 13,260 528 556 163 1,246 9,485 8,679 1,140 19,303 99 119 32 249 46 142 22 209 13,851 16,367 4,050 34,268
Lincoln 1,020 3,199 2,303 6,521 31 28 9 68 1,194 1,521 425 3,139 117 145 32 294 11 33 11 56 2,372 4,925 2,781 10,078
Los Alamos 1,750 3,365 1,345 6,460 37 66 8 111 634 812 173 1,619 19 45 8 73 176 344 62 582 2,617 4,632 1,596 8,844
Luna 676 1,615 1,566 3,856 66 65 24 156 3,587 3,601 1,023 8,211 30 38 20 89 13 53 36 102 4,372 5,372 2,670 12,414
McKinley 799 1,874 848 3,521 133 98 20 251 2,414 2,187 592 5,193 11,603 14,397 3,228 29,229 75 236 38 350 15,024 18,793 4,726 38,543
Mora 66 234 147 447 1 8 0 9 528 876 407 1,811 5 6 1 12 1 6 2 9 602 1,130 557 2,289
Otero 3,648 8,084 3,956 15,688 445 504 128 1,077 5,214 5,742 1,323 12,279 813 1,121 170 2,104 110 355 111 576 10,230 15,807 5,688 31,725
Quay 415 1,133 704 2,252 40 33 7 80 702 937 337 1,976 8 22 7 38 13 25 10 49 1,179 2,150 1,065 4,395
Rio Arriba 377 1,384 923 2,685 49 37 9 96 4,811 7,053 2,419 14,283 1,120 1,494 389 3,003 43 77 4 124 6,400 10,046 3,744 20,191
Roosevelt 1,909 2,431 1,093 5,433 103 60 6 169 1,967 1,692 291 3,950 60 53 12 127 101 55 5 160 4,141 4,291 1,408 9,839
San Juan 6,905 13,896 5,520 26,322 266 204 31 501 6,035 5,551 1,075 12,661 10,096 12,711 2,709 25,516 139 264 37 440 23,440 32,626 9,373 65,440
San Miguel 486 1,280 931 2,697 122 68 17 208 3,461 5,561 1,981 11,003 78 84 9 171 55 55 49 159 4,203 7,049 2,986 14,238
Sandoval 7,094 17,388 7,838 32,321 554 705 219 1,478 10,262 13,609 2,669 26,540 3,558 4,461 1,015 9,034 347 817 174 1,338 21,817 36,980 11,914 70,711
Santa Fe 4,575 18,413 11,055 34,042 202 302 76 580 13,798 19,155 5,220 38,174 758 1,048 229 2,035 254 745 189 1,188 19,588 39,663 16,769 76,020
Sierra 545 1,712 1,602 3,860 13 15 9 38 597 790 312 1,699 23 38 16 77 1 15 15 32 1,181 2,571 1,955 5,706
Socorro 654 1,541 769 2,965 41 42 4 87 1,673 2,023 643 4,339 532 519 75 1,124 35 53 18 106 2,934 4,178 1,509 8,622
Taos 825 3,370 2,093 6,287 37 42 16 96 2,952 4,655 1,844 9,451 261 513 177 950 25 135 18 179 4,099 8,715 4,148 16,963
Torrance 900 2,170 977 4,047 35 43 11 89 1,171 1,498 439 3,108 53 78 28 159 15 27 12 55 2,174 3,816 1,468 7,458
Union 256 521 328 1,104 5 4 0 9 247 343 130 720 7 9 5 22 0 5 6 12 515 883 469 1,867
Valencia 2,768 7,054 3,343 13,165 131 146 50 328 8,712 11,064 2,862 22,638 512 754 157 1,423 117 184 43 345 12,239 19,203 6,457 37,898
Female Total 90,375 217,786 105,710 413,870 7,930 9,471 2,324 19,725 204,486 246,343 59,297 510,126 38,151 50,235 10,685 99,071 5,085 11,472 2,430 18,987 346,028 535,306 180,445 1,061,779
* 2015 population is reported here because 2015 was the mid-point year for the 2013-2017 timeframe used in this report
SOURCE: University of New Mexico Geospatial and Population Studies
New Mexico Substance Use Epidemiology Profile Page 141
Appendix 1: Female Population, New Mexico, 2015*
Race/Ethnicity
White Black Hispanic American Indian Asian/Pacific Islander All Race/Ethnicities

New Mexico Substance Use Epidemiology Profile Page 142

Sex County Name 0-24 25-64 65+ All Ages 0-24 25-64 65+ All Ages 0-24 25-64 65+ All Ages 0-24 25-64 65+ All Ages 0-24 25-64 65+ All Ages 0-24 25-64 65+ All Ages
Both Bernalillo 59,910 154,576 60,622 275,108 7,262 10,375 2,072 19,709 134,375 168,788 32,858 336,022 10,865 16,139 2,152 29,156 5,257 11,430 2,132 18,820 217,670 361,308 99,836 678,814
Sexes Catron 441 1,173 1,129 2,742 12 28 6 47 173 304 213 689 35 47 27 109 3 5 2 10 664 1,557 1,377 3,597
Chaves 6,982 13,563 6,427 26,973 475 540 141 1,156 16,644 16,912 3,210 36,767 229 296 72 597 209 321 48 579 24,540 31,633 9,898 66,071
Cibola 1,174 2,994 1,453 5,622 117 187 34 337 3,552 5,652 1,236 10,439 4,307 5,363 1,327 10,997 53 84 17 154 9,204 14,279 4,067 27,550
Colfax 1,079 3,021 2,030 6,131 56 55 9 120 2,189 3,079 1,127 6,396 36 104 22 162 26 54 9 89 3,387 6,313 3,198 12,898
Curry 8,227 12,952 4,232 25,411 1,382 1,463 236 3,082 9,866 9,470 1,415 20,752 148 187 42 377 310 474 80 864 19,935 24,546 6,005 50,486
De Baca 246 520 324 1,090 7 7 1 15 295 319 159 773 6 8 4 18 1 2 0 3 556 856 488 1,899
Dona Ana 17,273 28,372 16,129 61,774 1,390 1,887 353 3,630 66,800 65,193 14,408 146,401 810 825 192 1,826 963 1,416 250 2,629 87,235 97,693 31,331 216,260
Eddy 7,980 14,763 5,327 28,069 342 437 102 880 11,854 12,967 2,439 27,259 249 327 54 630 128 266 56 450 20,552 28,759 7,977 57,288
Grant 2,647 6,526 4,588 13,762 130 114 28 272 5,527 6,569 2,565 14,660 94 165 56 315 89 110 37 236 8,487 13,484 7,274 29,245
Guadalupe 139 428 173 740 8 62 0 70 1,108 1,781 654 3,544 19 45 5 70 8 32 1 41 1,283 2,347 834 4,464
Harding 64 184 135 383 1 5 0 6 80 131 89 300 1 0 0 1 0 0 1 1 146 320 225 691
Hidalgo 436 880 506 1,823 26 11 7 44 984 1,254 420 2,659 7 8 4 20 10 19 1 30 1,465 2,173 938 4,575
Lea 7,601 14,140 4,862 26,604 1,101 1,399 283 2,783 19,564 18,645 2,174 40,382 211 314 61 585 116 269 38 423 28,592 34,768 7,417 70,777
Lincoln 2,188 6,128 4,505 12,819 56 74 21 151 2,442 3,062 813 6,318 242 249 47 538 23 54 23 99 4,950 9,566 5,408 19,925
Los Alamos 3,581 6,971 2,650 13,202 73 115 18 206 1,271 1,559 282 3,113 44 95 16 155 365 720 118 1,203 5,334 9,460 3,085 17,879
Luna 1,445 3,302 3,001 7,749 117 143 44 303 7,245 7,184 1,941 16,370 53 77 40 169 35 97 47 179 8,894 10,802 5,073 24,770
McKinley 1,608 3,804 1,626 7,038 274 231 49 554 5,133 4,430 1,123 10,686 23,269 27,289 5,305 55,862 198 393 54 645 30,480 36,147 8,158 74,785
Mora 124 432 315 870 5 13 6 24 1,099 1,860 812 3,771 7 11 6 24 2 10 4 16 1,237 2,327 1,144 4,707
Otero 8,429 16,820 7,780 33,028 1,042 1,194 277 2,512 10,962 11,358 2,401 24,722 1,750 2,066 294 4,110 278 577 131 987 22,460 32,016 10,884 65,360
Quay 862 2,130 1,380 4,373 74 72 16 163 1,413 1,814 617 3,844 21 52 14 87 34 49 18 101 2,405 4,117 2,047 8,568
Rio Arriba 782 2,725 1,756 5,263 92 94 20 206 9,683 14,158 4,505 28,346 2,170 2,873 648 5,691 66 110 11 187 12,793 19,961 6,940 39,694
Roosevelt 3,802 4,899 1,975 10,676 253 166 17 436 3,980 3,446 558 7,983 117 85 24 225 188 94 7 289 8,339 8,690 2,581 19,610
San Juan 13,936 27,786 10,113 51,835 529 524 64 1,117 12,304 11,418 2,003 25,725 20,294 24,907 4,676 49,877 279 472 63 813 47,342 65,106 16,918 129,366
San Miguel 973 2,513 1,726 5,213 267 173 29 469 7,084 11,178 3,689 21,951 137 139 19 296 132 99 62 294 8,594 14,103 5,525 28,223
Sandoval 14,796 33,962 14,697 63,456 1,177 1,623 378 3,177 20,978 26,532 4,883 52,392 7,213 8,564 1,632 17,408 680 1,332 280 2,292 44,843 72,012 21,870 138,725
Santa Fe 9,514 34,503 20,599 64,615 434 837 171 1,442 27,666 38,822 9,419 75,907 1,408 2,054 427 3,890 547 1,313 307 2,167 39,569 77,529 30,923 148,021
Sierra 1,130 3,305 3,284 7,719 34 40 20 95 1,265 1,573 576 3,413 43 85 39 166 4 26 25 56 2,476 5,029 3,944 11,449
Socorro 1,612 3,072 1,548 6,232 90 117 11 219 3,362 4,085 1,230 8,677 1,004 965 150 2,119 68 97 28 193 6,136 8,337 2,967 17,439
Taos 1,757 6,268 3,941 11,966 76 108 34 218 6,083 9,426 3,393 18,903 563 998 317 1,879 54 192 26 272 8,535 16,992 7,711 33,238
Torrance 1,914 4,394 2,035 8,343 93 154 27 275 2,509 3,259 848 6,616 126 189 59 373 36 46 18 100 4,679 8,042 2,988 15,708
Union 573 1,205 596 2,373 19 73 2 94 581 996 229 1,805 16 39 6 61 2 19 8 29 1,189 2,332 842 4,364
Valencia 5,840 13,972 6,376 26,188 302 496 146 944 17,972 22,387 5,338 45,698 1,036 1,502 283 2,822 209 278 60 548 25,360 38,635 12,204 76,200
Both Sexes Total 189,065 432,284 197,842 819,191 17,314 22,817 4,624 44,755 416,044 489,612 107,630 1,013,285 76,531 96,067 18,018 190,616 10,375 20,460 3,964 34,799 709,329 1,061,240 332,077 2,102,646
* 2015 population is reported here because 2015 was the mid-point year for the 2013-2017 timeframe used in this report
SOURCE: University of New Mexico Geospatial and Population Studies
New Mexico Substance Use Epidemiology Profile Page 143
Appendix 1: Total Population, New Mexico, 2015*
Race/Ethnicity
White Black Hispanic American Indian Asian/Pacific Islander All Race/Ethnicities

New Mexico Substance Use Epidemiology Profile Page 144

New Mexico Substance Use Epidemiology Profile Page 145
Substance Use and Mental Health in New Mexico, by Age Group, 2015-2016
National Survey on Drug Use and Health (NSDUH)
Appendix 2

New Mexico Substance Use Epidemiology Profile Page 146

Measure 12+ 12-17 Years 18-25 Years 26+ Years 18+ years
ILLICIT DRUGS2
Past Month Illicit Drug Use2 206 18 56 132 188
Past Year Cocaine Use 32 2 12 19 31
Perceptions of Great Risk from Using Cocaine Once a Month 1,187 88 141 959 1,099
Past Year Heroin Use 6 0 2 4 6
Perceptions of Great Risk from Trying Heroin Once or Twice 1,440 109 185 1,146 1,331
Past Year Pain Reliever Misuse 79 7 18 54 73
First Use of Marijuana3 21 9 8 4 12
Past Month Marijuana Use 180 16 51 114 165
Past Year Marijuana Use 272 25 73 173 247
Perceptions of Great Risk from Smoking Marijuana Once a Month 493 40 32 421 453
Past Month Use of Illicit Drugs2 Other Than Marijuana 61 5 18 38 56
ALCOHOL
Past Month Alcohol Use 833 16 122 695 817
Past Month Binge Alcohol Use9 440 10 80 350 430
Past Month Alcohol Use (12-20 Years)8 51 _ _ _ _
Past Month Binge Alcohol Use (12-20 Years)8,9 31 _ _ _ _
Perceptions of Great Risk from Having Five or More Drinks of an Alcoholic
Beverage Once or Twice a Week831 74 93 664 757
TOBACCO PRODUCTS4
Past Month Tobacco Product Use 430 8 77 345 422
Past Month Cigarette Use 349 5 64 279 344
Perceptions of Great Risk from Smoking One or More Packs of
Cigarettes per Day1,249 106 147 996 1,143
PAST YEAR DEPENDENCE, ABUSE, AND TREATMENT
Illicit Drug Use Disorder1 55 7 18 30 48
Pain Reliever Use Disorder1 11 1 2 8 10
Alcohol Use Disorder1 120 5 26 90 115
Substance Use Disorder1 153 12 37 104 141
Needing But Not Receiving Treatment at a Specialty Facility for Illicit
Drug Use10 47 8 17 23 40
Needing But Not Receiving Treatment at a Specialty Facility for Alcohol
Use10 107 4 26 77 103
Needing But Not Receiving Treatment at a Specialty Facility for
Substance Use10 144 10 35 98 133
PAST YEAR MENTAL HEALTH ISSUES
Major Depressive Episode7 _ 21 21 83 104
Any Mental Illness5 _ _ 53 245 298
Serious Mental Illness6 _ _ 11 57 69
Received Mental Health Services11 _ _ 24 177 201
Had Serious Thoughts of Suicide _ _ 20 47 66
+ All figures are estimated numbers in thousands
Source: SAMHSA, Center for Behavioral Health Statistics and Quality, National Survey on Drug Use and Health, 2015 and 2016.
New Mexico Substance Use Epidemiology Profile Page 147
Appendix 2A. Selected Drug Use, Past Year Alcohol Use Disorder, and Past Year Mental Health Measures in New Mexico, by Age
Group: Estimated Numbers (in Thousands), Annual Averages Based on 2015-2016 NSDUHs

New Mexico Substance Use Epidemiology Profile Page 148

Measure 12+ 12-17 Years 18-25 Years 26+ Years 18+ years
ILLICIT DRUGS2
Past Month Illicit Drug Use2 11.98 11.03 24.89 9.93 12.08
Past Year Cocaine Use 1.88 0.96 5.42 1.40 1.98
Perceptions of Great Risk from Using Cocaine Once a Month 69.06 53.08 62.86 72.09 70.75
Past Year Heroin Use 0.37 0.17 0.82 0.32 0.39
Perceptions of Great Risk from Trying Heroin Once or Twice 83.81 65.68 82.68 86.23 85.71
Past Year Pain Reliever Misuse 4.61 3.97 8.14 4.09 4.67
First Use of Marijuana3 2.50 6.99 8.79 0.60 1.69
Past Month Marijuana Use 10.50 9.46 22.85 8.55 10.61
Past Year Marijuana Use 15.83 15.34 32.79 13.04 15.88
Perceptions of Great Risk from Smoking Marijuana Once a Month 28.65 24.06 14.34 31.65 29.14
Past Month Use of Illicit Drugs2 Other Than Marijuana 3.57 3.25 8.16 2.84 3.60
ALCOHOL
Past Month Alcohol Use 48.47 9.91 54.35 52.30 52.59
Past Month Binge Alcohol Use9 25.57 5.77 35.57 26.36 27.68
Past Month Alcohol Use (12-20 Years)8 20.80 _ _ _ _
Past Month Binge Alcohol Use (12-20 Years)8,9 12.88 _ _ _ _
Perceptions of Great Risk from Having Five or More Drinks of an Alcoholic
Beverage Once or Twice a Week48.35 44.67 41.72 49.92 48.74
TOBACCO PRODUCTS4
Past Month Tobacco Product Use 25.01 4.81 34.50 25.93 27.17
Past Month Cigarette Use 20.28 2.95 28.80 21.01 22.13
Perceptions of Great Risk from Smoking One or More Packs of
Cigarettes per Day72.69 64.28 65.75 74.91 73.59
PAST YEAR DEPENDENCE, ABUSE, AND TREATMENT
Illicit Drug Use Disorder1 3.20 4.49 8.02 2.23 3.06
Pain Reliever Use Disorder1 0.64 0.65 1.09 0.57 0.64
Alcohol Use Disorder1 6.98 2.76 11.56 6.74 7.43
Substance Use Disorder1 8.91 7.15 16.72 7.81 9.09
Needing But Not Receiving Treatment at a Specialty Facility for Illicit
Drug Use10 2.76 4.55 7.66 1.72 2.57
Needing But Not Receiving Treatment at a Specialty Facility for Alcohol
Use10 6.23 2.57 11.78 5.76 6.62
Needing But Not Receiving Treatment at a Specialty Facility for
Substance Use10 8.35 6.22 15.78 7.37 8.58
PAST YEAR MENTAL HEALTH ISSUES
Major Depressive Episode7 _ 12.61 9.36 6.27 6.71
Any Mental Illness5 _ _ 23.51 18.46 19.19
Serious Mental Illness6 _ _ 5.09 4.32 4.43
Received Mental Health Services11 _ _ 10.60 13.35 12.95
Had Serious Thoughts of Suicide _ _ 8.88 3.50 4.28
* _ Not available
Source: SAMHSA, Center for Behavioral Health Statistics and Quality, National Survey on Drug Use and Health, 2015 and 2016.
New Mexico Substance Use Epidemiology Profile Page 149
Appendix 2B. Selected Drug Use, Past Year Alcohol Use Disorder, and Past Year Mental Health Measures in New
Mexico, by Age Group: Percentages, Annual Averages Based on 2015-2016 NSDUHs

New Mexico Substance Use Epidemiology Profile Page 150

Substance Use and Mental Health by National Regions, Age 12+, 2015-2016
National Survey on Drug Use and Health (NSDUH)
New Mexico Substance Use Epidemiology Profile Page 151
Appendix 3

New Mexico Substance Use Epidemiology Profile Page 152

INDICATORS+
TOTAL U.S. NORTHEAST MIDWEST SOUTH WEST NEW MEXICO
ILLICIT DRUGS2 among persons aged 12 or older
10.36 11.20 9.77 8.87 12.62 11.98
(10.11 - 10.62) (10.69 - 11.73) (9.34 - 10.22) (8.52 - 9.24) (12.06 - 13.20) (10.36 - 13.81)
1.84 2.26 1.51 1.60 2.22 1.88
(1.75 - 1.94) (2.06 - 2.48) (1.36 - 1.66) (1.48 - 1.74) (2.02 - 2.44) (1.42 - 2.48)
71.89 69.12 72.18 75.25 68.37 69.06
(71.52 - 72.25) (68.32 - 69.91) (71.56 - 72.80) (74.72 - 75.76) (67.60 - 69.13) (66.62 - 71.40)
0.33 0.46 0.33 0.28 0.32 0.37
(0.29 - 0.38) (0.37 - 0.58) (0.26 - 0.41) (0.23 - 0.34) (0.25 - 0.41) (0.20 - 0.71)
85.44 85.10 85.53 86.73 83.57 83.81
(85.15 - 85.73) (84.50 - 85.68) (85.05 - 86.00) (86.33 - 87.12) (82.98 - 84.14) (81.89 - 85.55)
4.46 4.05 4.45 4.43 4.85 4.61
(4.31 - 4.62) (3.78 - 4.34) (4.21 - 4.70) (4.21 - 4.65) (4.53 - 5.19) (3.86 - 5.48)
1.96 2.07 2.04 1.70 2.24 2.50
(1.88 - 2.03) (1.95 - 2.20) (1.93 - 2.16) (1.61 - 1.80) (2.10 - 2.38) (2.15 - 2.90)
8.60 9.50 8.28 7.05 10.68 10.50
(8.38 - 8.83) (9.03 - 9.98) (7.91 - 8.68) (6.73 - 7.38) (10.19 - 11.20) (9.06 - 12.13)
13.71 14.84 13.06 11.78 16.49 15.83
(13.42 - 13.99) (14.23 - 15.48) (12.55 - 13.58) (11.34 - 12.23) (15.85 - 17.16) (13.94 - 17.93)
28.41 26.44 25.56 32.09 26.59 28.65
(27.96 - 28.86) (25.56 - 27.35) (24.80 - 26.32) (31.41 - 32.78) (25.76 - 27.43) (26.13 - 31.30)
3.42 3.46 3.17 3.30 3.83 3.57
(3.28 - 3.57) (3.20 - 3.74) (2.95 - 3.39) (3.11 - 3.50) (3.55 - 4.13) (2.93 - 4.35)
ALCOHOL among persons aged 12 or older
51.21 56.02 54.36 47.48 50.67 48.47
(50.76 - 51.66) (55.14 - 56.90) (53.62 - 55.10) (46.85 - 48.12) (49.81 - 51.53) (45.53 - 51.42)
24.58 26.28 26.48 23.26 23.68 25.57
(24.21 - 24.95) (25.52 - 27.06) (25.84 - 27.14) (22.72 - 23.80) (23.00 - 24.38) (23.25 - 28.03)
19.83 23.98 20.92 18.39 18.18 20.80
(19.18 - 20.49) (22.95 - 25.04) (20.13 - 21.73) (17.73 - 19.07) (17.32 - 19.07) (18.20 - 23.66)
12.71 15.62 13.93 11.49 11.50 12.88
(12.19 - 13.26) (14.73 - 16.55) (13.25 - 14.63) (10.89 - 12.12) (10.72 - 12.32) (10.97 - 15.05)
44.30 43.01 39.62 46.17 46.52 48.35
(43.86 - 44.75) (42.12 - 43.91) (38.88 - 40.36) (45.53 - 46.80) (45.68 - 47.36) (45.66 - 51.04)
TOBACCO among persons aged 12 or older
23.72 22.75 26.56 25.43 19.18 25.01
(23.34 - 24.09) (22.01 - 23.51) (25.91 - 27.22) (24.91 - 25.96) (18.56 - 19.83) (22.69 - 27.47)
19.23 18.46 21.31 20.57 15.82 20.28
(18.87 - 19.60) (17.80 - 19.13) (20.71 - 21.92) (20.07 - 21.08) (15.22 - 16.43) (18.20 - 22.52)
72.80 74.59 68.94 72.41 75.55 72.69
(72.43 - 73.18) (73.86 - 75.31) (68.24 - 69.62) (71.88 - 72.93) (74.86 - 76.22) (70.37 - 74.90)
PAST YEAR DEPENDENCE, ABUSE, AND
TREATMENT2.81 2.84 2.61 2.65 3.24 3.20
(2.70 - 2.93) (2.60 - 3.11) (2.41 - 2.83) (2.48 - 2.82) (2.98 - 3.53) (2.55 - 4.01)
0.71 0.67 0.71 0.73 0.69 0.64
(0.65 - 0.77) (0.58 - 0.77) (0.63 - 0.80) (0.65 - 0.81) (0.60 - 0.80) (0.49 - 0.86)
5.73 6.01 5.90 5.25 6.14 6.98
(5.55 - 5.92) (5.62 - 6.42) (5.58 - 6.24) (4.99 - 5.52) (5.78 - 6.54) (5.79 - 8.40)
7.62 7.93 7.74 7.00 8.26 8.91
(7.42 - 7.82) (7.50 - 8.38) (7.39 - 8.10) (6.70 - 7.32) (7.83 - 8.70) (7.56 - 10.46)
2.53 2.54 2.36 2.34 2.98 2.76
(2.42 - 2.64) (2.32 - 2.78) (2.18 - 2.56) (2.18 - 2.50) (2.75 - 3.24) (2.20 - 3.46)
5.48 5.68 5.58 5.01 5.99 6.23
(5.30 - 5.66) (5.34 - 6.04) (5.29 - 5.89) (4.76 - 5.26) (5.64 - 6.36) (5.21 - 7.44)
7.08 7.20 7.14 6.50 7.87 8.35
(6.89 - 7.28) (6.80 - 7.63) (6.80 - 7.50) (6.21 - 6.80) (7.46 - 8.30) (7.05 - 9.87)
MENTAL HEALTH among persons aged 18 or older
18.07 17.86 18.01 17.95 18.48 19.19
(17.73 - 18.42) (17.19 - 18.56) (17.42 - 18.62) (17.44 - 18.48) (17.85 - 19.12) (17.18 - 21.37)
4.13 4.07 4.37 4.05 4.09 4.43
(3.97 - 4.30) (3.76 - 4.40) (4.11 - 4.66) (3.81 - 4.30) (3.79 - 4.41) (3.57 - 5.49)
4.04 4.03 4.14 3.84 4.30 4.28
(3.89 - 4.20) (3.73 - 4.36) (3.88 - 4.42) (3.61 - 4.08) (4.00 - 4.61) (3.44 - 5.31)
14.28 15.74 15.75 13.52 13.06 12.95
(13.97 - 14.59) (15.07 - 16.42) (15.19 - 16.33) (13.05 - 14.02) (12.47 - 13.67) (11.24 - 14.88)
6.70 6.80 6.89 6.60 6.61 6.71
(6.49 - 6.91) (6.40 - 7.23) (6.55 - 7.26) (6.30 - 6.91) (6.24 - 7.00) (5.64 - 7.97)
+ All figures are percent prevalence rates; figures in parentheses are 95% confidence intervals
Source: SAMHSA, Center for Behavioral Health Statistics and Quality, National Survey on Drug Use and Health, 2015 and 2016.
New Mexico Substance Use Epidemiology Profile Page 153
Past Month Use of Illicit Drugs2 Other Than Marijuana
Appendix 3A. Substance Use and Mental Health, U.S. Regions & New Mexico, Percentages, Annual Averages Based on
2015 and 2016 NSDUHs
Perceptions of Great Risk from Smoking Marijuana
Once a Month
Perceptions of Great Risk from Trying Heroin Once or
Twice
Past Year Heroin Use
Perceptions of Great Risk from Using Cocaine Once a
Month
Past Year Cocaine Use
Past Month Illicit Drug Use2
Past Year Marijuana Use
Past Year Pain Reliever Misuse
First Use of Marijuana3
Past Month Marijuana Use
Illicit Drug Use Disorder1
Past Month Cigarette Use
Perceptions of Great Risk from Smoking One or More
Packs of Cigarettes per Day
Pain Reliever Use Disorder1
Alcohol Use Disorder1
Substance Use Disorder1
Needing But Not Receiving Treatment at a Specialty
Facility for Illicit Drug Use10
Needing But Not Receiving Treatment at a Specialty
Facility for Alcohol Use10
Needing But Not Receiving Treatment at a Specialty
Facility for Substance Use10
Any Mental Illness5 in past year
Serious Mental Illness6 in past year
Had serious thoughts of suicide in past year
Received Mental Health Services11
Major Depressive Episode7 in past year
Past Month Binge Alcohol Use (12-20 Years)8,9
Past Month Alcohol Use
Past Month Binge Alcohol Use9
Past Month Alcohol Use (12-20 Years)8
Perceptions of Great Risk from Having Five or More Drinks of
an Alcoholic Beverage Once or Twice a Week
Past Month Tobacco Product Use4

New Mexico Substance Use Epidemiology Profile Page 154

INDICATORS+ AGE
GROUPTOTAL U.S. NORTHEAST MIDWEST SOUTH WEST
NEW
MEXICO
ILLICIT DRUGS2 among persons aged 12
or older8.34 8.45 8.28 7.82 9.14 11.03
(7.98 - 8.71) (7.78 - 9.17) (7.73 - 8.88) (7.32 - 8.35) (8.41 - 9.93) (8.95 - 13.53)
22.75 25.93 21.68 20.26 25.25 24.89
(22.13 - 23.39) (24.64 - 27.25) (20.69 - 22.69) (19.41 - 21.13) (23.97 - 26.56) (21.33 - 28.81)
8.54 9.11 7.95 7.13 10.89 9.93
(8.26 - 8.83) (8.51 - 9.75) (7.45 - 8.48) (6.70 - 7.58) (10.22 - 11.59) (8.14 - 12.05)
10.57 11.45 9.93 8.98 12.98 12.08
(10.29 - 10.85) (10.90 - 12.03) (9.46 - 10.41) (8.60 - 9.38) (12.38 - 13.61) (10.35 - 14.05)
0.58 0.58 0.55 0.45 0.81 0.96
(0.48 - 0.69) (0.46 - 0.73) (0.43 - 0.69) (0.36 - 0.58) (0.63 - 1.04) (0.59 - 1.55)
5.46 6.67 4.40 4.75 6.61 5.42
(5.09 - 5.86) (6.03 - 7.39) (3.95 - 4.91) (4.31 - 5.22) (5.92 - 7.38) (3.86 - 7.57)
1.39 1.73 1.14 1.22 1.64 1.40
(1.29 - 1.50) (1.52 - 1.97) (0.98 - 1.31) (1.09 - 1.37) (1.43 - 1.87) (0.99 - 1.96)
1.97 2.42 1.61 1.72 2.36 1.98
(1.87 - 2.08) (2.20 - 2.65) (1.45 - 1.78) (1.58 - 1.87) (2.14 - 2.60) (1.48 - 2.63)
56.54 56.41 55.60 58.39 54.52 53.08
(55.84 - 57.24) (55.12 - 57.70) (54.44 - 56.74) (57.35 - 59.42) (53.16 - 55.88) (49.23 - 56.88)
65.07 61.75 64.94 68.70 62.01 62.86
(64.36 - 65.78) (60.31 - 63.16) (63.77 - 66.10) (67.65 - 69.74) (60.63 - 63.37) (58.85 - 66.69)
74.84 71.69 75.40 78.36 71.12 72.09
(74.39 - 75.28) (70.72 - 72.65) (74.64 - 76.15) (77.73 - 78.98) (70.19 - 72.03) (69.17 - 74.83)
73.44 70.30 73.89 76.99 69.78 70.75
(73.04 - 73.83) (69.43 - 71.15) (73.22 - 74.55) (76.42 - 77.54) (68.96 - 70.60) (68.11 - 73.26)
0.07 0.08 0.08 0.07 0.05 0.17
(0.04 - 0.11) (0.05 - 0.15) (0.04 - 0.15) (0.04 - 0.13) (0.02 - 0.11) (0.06 - 0.45)
0.64 0.81 0.65 0.58 0.59 0.82
(0.53 - 0.77) (0.64 - 1.02) (0.52 - 0.83) (0.47 - 0.71) (0.45 - 0.77) (0.45 - 1.51)
0.31 0.45 0.30 0.26 0.30 0.32
(0.26 - 0.36) (0.34 - 0.58) (0.23 - 0.39) (0.20 - 0.33) (0.22 - 0.40) (0.15 - 0.68)
0.36 0.50 0.35 0.30 0.34 0.39
(0.31 - 0.41) (0.39 - 0.63) (0.28 - 0.44) (0.25 - 0.37) (0.27 - 0.44) (0.20 - 0.77)
65.41 66.03 65.34 66.78 62.86 65.68
(64.74 - 66.08) (64.74 - 67.31) (64.29 - 66.37) (65.82 - 67.72) (61.60 - 64.11) (62.11 - 69.09)
82.80 82.74 82.49 83.73 81.68 82.68
(82.25 - 83.34) (81.72 - 83.72) (81.67 - 83.27) (82.99 - 84.45) (80.66 - 82.67) (79.62 - 85.37)
88.23 87.53 88.46 89.61 86.36 86.23
(87.89 - 88.56) (86.83 - 88.20) (87.89 - 89.01) (89.15 - 90.05) (85.67 - 87.03) (83.92 - 88.25)
87.45 86.86 87.60 88.78 85.68 85.71
(87.15 - 87.75) (86.23 - 87.46) (87.08 - 88.09) (88.36 - 89.18) (85.05 - 86.28) (83.64 - 87.56)
3.72 2.82 4.00 3.94 3.72 3.97
(3.48 - 3.97) (2.45 - 3.23) (3.63 - 4.40) (3.61 - 4.31) (3.27 - 4.24) (2.99 - 5.25)
7.82 7.19 8.17 7.61 8.29 8.14
(7.45 - 8.20) (6.57 - 7.87) (7.61 - 8.77) (7.13 - 8.12) (7.60 - 9.04) (6.51 - 10.14)
4.00 3.68 3.88 3.96 4.40 4.09
(3.81 - 4.19) (3.36 - 4.02) (3.59 - 4.18) (3.71 - 4.23) (4.02 - 4.80) (3.23 - 5.16)
4.54 4.17 4.49 4.48 4.97 4.67
(4.38 - 4.71) (3.87 - 4.48) (4.23 - 4.77) (4.25 - 4.72) (4.62 - 5.34) (3.87 - 5.63)
5.25 5.34 5.25 4.91 5.75 6.99
(5.03 - 5.49) (4.97 - 5.74) (4.94 - 5.57) (4.64 - 5.19) (5.36 - 6.16) (5.87 - 8.31)
7.74 8.85 8.16 6.78 8.18 8.79
(7.33 - 8.17) (8.18 - 9.57) (7.61 - 8.75) (6.36 - 7.23) (7.54 - 8.87) (7.00 - 10.97)
0.39 0.44 0.38 0.29 0.53 0.60
(0.34 - 0.44) (0.36 - 0.53) (0.32 - 0.46) (0.24 - 0.35) (0.44 - 0.64) (0.41 - 0.88)
1.40 1.54 1.47 1.17 1.62 1.69
(1.32 - 1.48) (1.41 - 1.67) (1.37 - 1.59) (1.09 - 1.27) (1.48 - 1.76) (1.37 - 2.07)
+ All figures are percent prevalence rates; figures in parentheses are 95% confidence intervals
Source: SAMHSA, Center for Behavioral Health Statistics and Quality, National Survey on Drug Use and Health, 2015 and 2016.
New Mexico Substance Use Epidemiology Profile Page 155
Past Year Cocaine Use Age 12-17
Age 18-25
Age 26+
Perceptions of Great Risk from Using
Cocaine Once a Month
Age 18+
Perceptions of Great Risk from Trying
Heroin Once or TwiceAge 12-17
Age 18-25
Age 18-25
Age 26+
Age 26+
Age 18+
Past Year Heroin Use Age 12-17
Age 18-25
Age 26+
Age 18+
Age 18-25
Age 26+
Age 18+
Age 18+
Age 12-17
Appendix 3B. Substance Use and Mental Health, U.S. Regions & New Mexico, by Age Group, Percentages, Annual
Averages Based on 2015 and 2016 NSDUHs
Past Month Illicit Drug Use2
Age 12-17
Past Year Pain Reliever MisuseAge 12-17
Age 18-25
Age 26+
Age 18+
First Use of Marijuana3
Age 12-17
Age 18-25
Age 26+
Age 18+

New Mexico Substance Use Epidemiology Profile Page 156

INDICATORS+ AGE
GROUPTOTAL U.S. NORTHEAST MIDWEST SOUTH WEST
NEW
MEXICO
ILLICIT DRUGS2 among persons aged 12
or older
6.75 7.15 6.69 6.13 7.52 9.46(6.43 - 7.09) (6.51 - 7.84) (6.19 - 7.22) (5.68 - 6.62) (6.87 - 8.23) (7.60 - 11.71)
20.30 23.64 19.28 17.74 22.73 22.85(19.71 - 20.90) (22.44 - 24.87) (18.35 - 20.24) (16.99 - 18.52) (21.54 - 23.96) (19.40 - 26.72)
6.88 7.46 6.63 5.40 9.01 8.55(6.64 - 7.13) (6.94 - 8.02) (6.20 - 7.08) (5.05 - 5.78) (8.44 - 9.62) (6.98 - 10.43)
8.79 9.72 8.45 7.14 11.01 10.61(8.55 - 9.04) (9.22 - 10.24) (8.04 - 8.87) (6.81 - 7.50) (10.48 - 11.57) (9.08 - 12.36)
12.29 12.39 12.67 11.25 13.55 15.34(11.86 - 12.74) (11.56 - 13.27) (11.95 - 13.43) (10.67 - 11.86) (12.68 - 14.46) (12.88 - 18.17)
32.60 37.45 31.69 29.66 34.39 32.79(31.89 - 33.31) (36.03 - 38.89) (30.64 - 32.75) (28.74 - 30.59) (33.09 - 35.72) (28.81 - 37.04)
10.73 11.45 9.97 8.90 13.79 13.04(10.43 - 11.05) (10.74 - 12.20) (9.37 - 10.61) (8.38 - 9.45) (13.03 - 14.60) (10.91 - 15.52)
13.85 15.07 13.10 11.83 16.80 15.88(13.54 - 14.16) (14.41 - 15.76) (12.54 - 13.67) (11.35 - 12.33) (16.10 - 17.52) (13.83 - 18.18)
27.17 26.85 26.44 29.75 23.90 24.06(26.51 - 27.83) (25.65 - 28.08) (25.46 - 27.45) (28.78 - 30.74) (22.74 - 25.09) (20.84 - 27.61)
14.32 12.56 12.50 16.68 13.58 14.34(13.83 - 14.83) (11.69 - 13.49) (11.74 - 13.30) (15.91 - 17.48) (12.65 - 14.55) (11.78 - 17.35)
30.92 28.67 27.67 34.94 29.16 31.65(30.36 - 31.49) (27.61 - 29.75) (26.78 - 28.58) (34.13 - 35.75) (28.16 - 30.18) (28.63 - 34.82)
28.54 26.40 25.46 32.34 26.87 29.14(28.05 - 29.03) (25.45 - 27.37) (24.65 - 26.29) (31.60 - 33.08) (25.97 - 27.78) (26.45 - 31.97)
2.71 2.25 2.73 2.88 2.74 3.25(2.49 - 2.95) (1.92 - 2.64) (2.40 - 3.11) (2.58 - 3.22) (2.37 - 3.17) (2.29 - 4.60)
7.32 7.73 6.94 6.95 7.92 8.16(6.92 - 7.74) (7.02 - 8.51) (6.39 - 7.54) (6.47 - 7.46) (7.21 - 8.69) (6.24 - 10.62)
2.86 2.90 2.58 2.75 3.26 2.84(2.71 - 3.03) (2.60 - 3.23) (2.34 - 2.85) (2.54 - 2.98) (2.94 - 3.61) (2.17 - 3.70)
3.50 3.57 3.21 3.34 3.94 3.60(3.35 - 3.65) (3.29 - 3.88) (2.98 - 3.46) (3.14 - 3.56) (3.64 - 4.27) (2.90 - 4.47)
ALCOHOL among persons aged 12 or
older
9.40 10.95 9.82 8.71 9.06 9.91
(8.99 - 9.83) (10.18 - 11.77) (9.18 - 10.49) (8.18 - 9.27) (8.35 - 9.84) (8.01 - 12.20)
57.75 63.92 61.60 54.56 54.76 54.35
(56.96 - 58.52) (62.44 - 65.38) (60.42 - 62.76) (53.45 - 55.67) (53.35 - 56.16) (50.32 - 58.32)
55.10 59.67 58.56 51.03 55.01 52.30
(54.56 - 55.65) (58.59 - 60.75) (57.65 - 59.46) (50.26 - 51.79) (53.95 - 56.08) (48.63 - 55.94)
55.48 60.27 59.00 51.53 54.98 52.59
(54.99 - 55.97) (59.30 - 61.23) (58.18 - 59.81) (50.83 - 52.22) (54.03 - 55.92) (49.34 - 55.82)
5.33 6.16 5.87 4.83 5.09 5.77
(5.03 - 5.65) (5.61 - 6.75) (5.42 - 6.35) (4.44 - 5.24) (4.59 - 5.64) (4.49 - 7.38)
38.69 44.03 42.30 35.80 36.08 35.57
(37.90 - 39.49) (42.60 - 45.47) (41.13 - 43.49) (34.81 - 36.80) (34.77 - 37.42) (31.89 - 39.43)
24.52 25.61 26.33 23.43 23.82 26.36
(24.08 - 24.97) (24.70 - 26.55) (25.53 - 27.14) (22.77 - 24.10) (22.97 - 24.69) (23.59 - 29.33)
26.54 28.18 28.63 25.18 25.61 27.68
(26.14 - 26.96) (27.35 - 29.02) (27.92 - 29.35) (24.59 - 25.77) (24.86 - 26.37) (25.15 - 30.37)
43.30 42.95 39.60 45.48 43.36 44.67
(42.59 - 44.00) (41.61 - 44.30) (38.52 - 40.70) (44.47 - 46.49) (42.04 - 44.68) (40.86 - 48.54)
36.91 34.19 32.12 39.22 39.56 41.72
(36.22 - 37.61) (32.93 - 35.48) (31.07 - 33.19) (38.24 - 40.21) (38.26 - 40.88) (37.87 - 45.68)
45.66 44.45 40.89 47.40 48.09 49.92
(45.12 - 46.20) (43.38 - 45.52) (39.98 - 41.80) (46.62 - 48.18) (47.06 - 49.13) (46.77 - 53.08)
44.41 43.02 39.62 46.24 46.84 48.74
(43.93 - 44.89) (42.06 - 43.98) (38.82 - 40.42) (45.55 - 46.92) (45.94 - 47.75) (45.90 - 51.58)
+ All figures are percent prevalence rates; figures in parentheses are 95% confidence intervals
Source: SAMHSA, Center for Behavioral Health Statistics and Quality, National Survey on Drug Use and Health, 2015 and 2016.
New Mexico Substance Use Epidemiology Profile Page 157
Past Month Alcohol Use Age 12-17
Age 18-25
Age 26+
Age 18+
Past Month Binge Alcohol Use9
Age 12-17
Age 18-25
Age 26+
Age 18+
Age 12-17
Age 18-25
Age 26+
Age 18+
Perceptions of Great Risk from Having Five
or More Drinks of an Alcoholic Beverage
Once or Twice a Week
Age 18+
Age 18-25
Age 26+
Age 18+
Past Month Use of Illicit Drugs2 Other Than
MarijuanaAge 12-17
Age 26+
Perceptions of Great Risk from Smoking
Marijuana Once a MonthAge 12-17
Age 18-25
Age 26+
Age 18+
Past Year Marijuana Use Age 12-17
Age 18-25
Age 18-25
Age 26+
Past Month Marijuana Use Age 12-17
Age 18+
Appendix 3B. Substance Use and Mental Health, U.S. Regions & New Mexico, by Age Group, Percentages, Annual
Averages Based on 2015 and 2016 NSDUHs

New Mexico Substance Use Epidemiology Profile Page 158

INDICATORS+ AGE
GROUPTOTAL U.S. NORTHEAST MIDWEST SOUTH WEST
NEW
MEXICO
TOBACCO among persons aged 12 or
older
5.66 5.39 6.68 5.91 4.52 4.81
(5.36 - 5.97) (4.90 - 5.93) (6.18 - 7.21) (5.48 - 6.37) (4.06 - 5.02) (3.71 - 6.23)
31.48 31.65 35.22 32.37 26.69 34.50
(30.79 - 32.19) (30.41 - 32.92) (34.12 - 36.34) (31.47 - 33.30) (25.56 - 27.86) (30.93 - 38.26)
24.58 23.21 27.52 26.65 19.68 25.93
(24.13 - 25.03) (22.32 - 24.12) (26.72 - 28.33) (26.01 - 27.31) (18.90 - 20.48) (23.14 - 28.94)
25.56 24.38 28.62 27.46 20.70 27.17
(25.16 - 25.97) (23.58 - 25.21) (27.92 - 29.34) (26.89 - 28.04) (20.01 - 21.41) (24.63 - 29.86)
3.80 3.44 4.70 3.88 3.13 2.95
(3.56 - 4.06) (3.08 - 3.84) (4.28 - 5.15) (3.55 - 4.25) (2.75 - 3.56) (2.17 - 3.98)
25.12 24.93 27.66 25.95 21.72 28.80
(24.43 - 25.81) (23.75 - 26.15) (26.60 - 28.75) (25.04 - 26.89) (20.59 - 22.88) (25.13 - 32.78)
20.09 19.05 22.26 21.71 16.35 21.01
(19.65 - 20.53) (18.25 - 19.88) (21.51 - 23.04) (21.07 - 22.37) (15.61 - 17.11) (18.52 - 23.73)
20.81 19.87 23.04 22.31 17.13 22.13
(20.41 - 21.21) (19.16 - 20.60) (22.38 - 23.71) (21.76 - 22.87) (16.47 - 17.80) (19.84 - 24.60)
68.71 71.53 67.33 67.79 69.47 64.28
(68.06 - 69.35) (70.25 - 72.78) (66.18 - 68.45) (66.84 - 68.72) (68.19 - 70.73) (60.46 - 67.93)
68.29 69.57 65.05 67.64 71.20 65.75
(67.66 - 68.90) (68.35 - 70.77) (63.99 - 66.08) (66.75 - 68.53) (70.01 - 72.36) (62.24 - 69.09)
74.04 75.74 69.78 73.75 77.03 74.91
(73.58 - 74.49) (74.84 - 76.61) (68.93 - 70.63) (73.10 - 74.39) (76.19 - 77.84) (72.02 - 77.59)
73.22 74.88 69.10 72.88 76.17 73.59
(72.81 - 73.63) (74.08 - 75.65) (68.35 - 69.85) (72.31 - 73.45) (75.43 - 76.90) (71.05 - 75.98)
PAST YEAR DEPENDENCE, ABUSE,
AND TREATMENT3.30 2.94 3.20 3.07 4.01 4.49
(3.07 - 3.55) (2.56 - 3.36) (2.86 - 3.57) (2.78 - 3.39) (3.54 - 4.55) (3.35 - 5.99)
7.14 7.63 6.51 6.81 7.84 8.02
(6.78 - 7.51) (6.93 - 8.39) (5.97 - 7.09) (6.33 - 7.33) (7.13 - 8.60) (6.20 - 10.33)
2.04 2.06 1.89 1.91 2.36 2.23
(1.91 - 2.17) (1.81 - 2.34) (1.68 - 2.12) (1.73 - 2.10) (2.08 - 2.68) (1.62 - 3.06)
2.76 2.83 2.55 2.60 3.16 3.06
(2.64 - 2.89) (2.58 - 3.11) (2.34 - 2.79) (2.42 - 2.79) (2.88 - 3.46) (2.39 - 3.91)
0.55 0.44 0.55 0.59 0.57 0.65
(0.46 - 0.66) (0.34 - 0.58) (0.43 - 0.71) (0.46 - 0.74) (0.44 - 0.75) (0.40 - 1.05)
1.03 0.98 1.05 1.04 1.05 1.09
(0.90 - 1.18) (0.81 - 1.19) (0.87 - 1.25) (0.89 - 1.23) (0.85 - 1.29) (0.72 - 1.67)
0.67 0.65 0.67 0.69 0.65 0.57
(0.60 - 0.75) (0.54 - 0.77) (0.57 - 0.79) (0.60 - 0.79) (0.54 - 0.77) (0.39 - 0.83)
0.72 0.69 0.73 0.74 0.71 0.64
(0.66 - 0.79) (0.60 - 0.80) (0.63 - 0.83) (0.66 - 0.83) (0.61 - 0.82) (0.47 - 0.88)
2.23 2.28 2.29 2.08 2.38 2.76
(2.03 - 2.45) (1.99 - 2.61) (2.03 - 2.57) (1.85 - 2.35) (2.06 - 2.75) (1.99 - 3.82)
10.80 11.69 11.66 9.86 10.85 11.56
(10.35 - 11.28) (10.89 - 12.54) (11.00 - 12.35) (9.32 - 10.42) (10.08 - 11.68) (9.59 - 13.88)
5.31 5.49 5.37 4.87 5.80 6.74
(5.10 - 5.52) (5.04 - 5.98) (4.99 - 5.78) (4.56 - 5.20) (5.36 - 6.27) (5.34 - 8.46)
6.09 6.36 6.28 5.58 6.53 7.43
(5.90 - 6.29) (5.94 - 6.80) (5.93 - 6.65) (5.30 - 5.88) (6.13 - 6.96) (6.14 - 8.97)
4.61 4.24 4.75 4.21 5.40 7.15
(4.34 - 4.90) (3.81 - 4.72) (4.34 - 5.20) (3.85 - 4.60) (4.84 - 6.01) (5.62 - 9.07)
15.20 16.73 15.53 14.19 15.36 16.72
(14.67 - 15.75) (15.73 - 17.79) (14.73 - 16.35) (13.49 - 14.92) (14.42 - 16.36) (13.99 - 19.85)
6.72 6.91 6.79 6.16 7.39 7.81
(6.48 - 6.96) (6.41 - 7.44) (6.38 - 7.23) (5.80 - 6.54) (6.88 - 7.93) (6.30 - 9.65)
7.93 8.28 8.05 7.29 8.55 9.09
(7.71 - 8.15) (7.82 - 8.76) (7.67 - 8.45) (6.97 - 7.63) (8.09 - 9.04) (7.64 - 10.79)
+ All figures are percent prevalence rates; figures in parentheses are 95% confidence intervals
Source: SAMHSA, Center for Behavioral Health Statistics and Quality, National Survey on Drug Use and Health, 2015 and 2016.
New Mexico Substance Use Epidemiology Profile Page 159
Substance Use Disorder1
Age 12-17
Age 18-25
Age 26+
Age 18+
Illicit Drug Use Disorder1
Age 12-17
Age 18-25
Age 26+
Age 18+
Pain Reliever Use Disorder1
Age 12-17
Age 18-25
Age 26+
Age 18+
Alcohol Use Disorder1
Age 12-17
Age 18-25
Age 26+
Age 18+
Age 18+
Age 26+
Perceptions of Great Risk from Smoking
One or More Packs of Cigarettes per DayAge 12-17
Age 18-25
Age 26+
Age 18+
Past Month Cigarette Use Age 12-17
Age 18-25
Age 18-25
Age 26+
Past Month Tobacco Product Use4
Age 12-17
Age 18+
Appendix 3B. Substance Use and Mental Health, U.S. Regions & New Mexico, by Age Group, Percentages, Annual
Averages Based on 2015 and 2016 NSDUHs

New Mexico Substance Use Epidemiology Profile Page 160

INDICATORS+ AGE
GROUPTOTAL U.S. NORTHEAST MIDWEST SOUTH WEST
NEW
MEXICO
PAST YEAR DEPENDENCE, ABUSE,
AND TREATMENT
3.14 2.72 2.86 2.91 4.05 4.55
(2.91 - 3.38) (2.37 - 3.12) (2.55 - 3.21) (2.63 - 3.22) (3.56 - 4.60) (3.36 - 6.12)
6.62 6.77 6.00 6.45 7.30 7.66
(6.27 - 6.98) (6.12 - 7.49) (5.48 - 6.57) (5.99 - 6.94) (6.59 - 8.07) (5.84 - 10.00)
1.78 1.83 1.69 1.59 2.12 1.72
(1.66 - 1.90) (1.60 - 2.10) (1.50 - 1.91) (1.43 - 1.76) (1.86 - 2.41) (1.21 - 2.43)
2.47 2.52 2.31 2.28 2.87 2.57
(2.35 - 2.59) (2.29 - 2.78) (2.12 - 2.52) (2.12 - 2.45) (2.62 - 3.15) (2.00 - 3.30
2.15 2.17 2.20 2.06 2.23 2.57
(1.95 - 2.36) (1.88 - 2.50) (1.95 - 2.48) (1.83 - 2.31) (1.93 - 2.57) (1.84 - 3.58)
10.47 11.16 10.64 9.67 11.06 11.78
(10.02 - 10.94) (10.40 - 11.97) (10.03 - 11.27) (9.12 - 10.24) (10.26 - 11.91) (9.81 - 14.08)
5.05 5.17 5.14 4.60 5.58 5.76
(4.84 - 5.26) (4.77 - 5.61) (4.79 - 5.52) (4.30 - 4.91) (5.16 - 6.02) (4.56 - 7.25)
5.82 6.01 5.93 5.31 6.38 6.62
(5.63 - 6.01) (5.64 - 6.40) (5.62 - 6.27) (5.05 - 5.59) (6.00 - 6.78) (5.52 - 7.93)
4.38 4.09 4.40 4.03 5.13 6.22
(4.11 - 4.66) (3.66 - 4.58) (4.03 - 4.81) (3.68 - 4.40) (4.60 - 5.72) (4.83 - 7.99)
14.34 15.59 14.75 13.38 14.56 15.78
(13.82 - 14.88) (14.62 - 16.61) (13.97 - 15.56) (12.70 - 14.09) (13.64 - 15.53) (13.20 - 18.77)
6.20 6.19 6.20 5.67 7.06 7.37
(5.98 - 6.43) (5.73 - 6.67) (5.80 - 6.63) (5.33 - 6.02) (6.58 - 7.58) (5.92 - 9.14)
7.36 7.50 7.43 6.76 8.15 8.58
(7.15 - 7.57) (7.06 - 7.95) (7.06 - 7.82) (6.45 - 7.08) (7.71 - 8.62) (7.19 - 10.21)
MENTAL HEALTH among persons aged
18 or older21.89 22.58 22.25 20.50 23.21 23.51
(21.33 - 22.46) (21.49 - 23.71) (21.32 - 23.20) (19.72 - 21.31) (22.11 - 24.35) (20.48 - 26.84)
17.44 17.10 17.30 17.53 17.67 18.46
(17.05 - 17.83) (16.36 - 17.87) (16.64 - 17.98) (16.96 - 18.12) (16.98 - 18.38) (16.23 - 20.92)
18.07 17.86 18.01 17.95 18.48 19.19
(17.73 - 18.42) (17.19 - 18.56) (17.42 - 18.62) (17.44 - 18.48) (17.85 - 19.12) (17.18 - 21.37)
5.46 5.56 5.94 5.03 5.62 5.09
(5.15 - 5.78) (5.05 - 6.12) (5.47 - 6.44) (4.65 - 5.44) (5.08 - 6.21) (3.87 - 6.66)
3.91 3.83 4.11 3.89 3.82 4.32
(3.73 - 4.10) (3.49 - 4.20) (3.82 - 4.43) (3.63 - 4.16) (3.50 - 4.18) (3.37 - 5.51)
4.13 4.07 4.37 4.05 4.09 4.43
(3.97 - 4.30) (3.76 - 4.40) (4.11 - 4.66) (3.81 - 4.30) (3.79 - 4.41) (3.57 - 5.49)
8.57 8.81 8.66 8.06 9.09 8.88
(8.21 - 8.94) (8.12 - 9.54) (8.07 - 9.29) (7.54 - 8.61) (8.40 - 9.83) (7.11 - 11.03)
3.30 3.26 3.38 3.15 3.48 3.50
(3.13 - 3.47) (2.94 - 3.62) (3.11 - 3.68) (2.91 - 3.40) (3.17 - 3.82) (2.66 - 4.60)
4.04 4.03 4.14 3.84 4.30 4.28
(3.89 - 4.20) (3.73 - 4.36) (3.88 - 4.42) (3.61 - 4.08) (4.00 - 4.61) (3.44 - 5.31)
12.28 13.59 14.36 11.18 11.21 10.60
(11.83 - 12.75) (12.73 - 14.50) (13.61 - 15.13) (10.59 - 11.78) (10.44 - 12.03) (8.57 - 13.03)
14.61 16.08 15.99 13.91 13.37 13.35
(14.26 - 14.97) (15.35 - 16.85) (15.36 - 16.64) (13.37 - 14.47) (12.71 - 14.06) (11.49 - 15.46)
14.28 15.74 15.75 13.52 13.06 12.95
(13.97 - 14.59) (15.07 - 16.42) (15.19 - 16.33) (13.05 - 14.02) (12.47 - 13.67) (11.24 - 14.88)
12.63 12.13 13.53 11.90 13.32 12.61
(12.19 - 13.08) (11.35 - 12.96) (12.80 - 14.30) (11.30 - 12.53) (12.50 - 14.19) (10.45 - 15.15)
10.59 11.08 11.01 9.91 10.89 9.36
(10.17 - 11.01) (10.31 - 11.91) (10.36 - 11.70) (9.38 - 10.47) (10.15 - 11.68) (7.59 - 11.49)
6.06 6.11 6.20 6.05 5.88 6.27
(5.83 - 6.30) (5.66 - 6.59) (5.82 - 6.62) (5.72 - 6.40) (5.47 - 6.32) (5.08 - 7.71)
6.70 6.80 6.89 6.60 6.61 6.71
(6.49 - 6.91) (6.40 - 7.23) (6.55 - 7.26) (6.30 - 6.91) (6.24 - 7.00) (5.64 - 7.97)
+ All figures are percent prevalence rates; figures in parentheses are 95% confidence intervals
Source: SAMHSA, Center for Behavioral Health Statistics and Quality, National Survey on Drug Use and Health, 2015 and 2016.
New Mexico Substance Use Epidemiology Profile Page 161
Had serious thoughts of suicide in past
yearAge 18-25
Age 26+
Age 18+
Received Mental Health Services11
Age 18-25
Age 26+
Age 18+
Age 12-17
Age 18-25
Age 26+
Age 18+
Major Depressive Episode in past year7
Age 18+
Any Mental Illness in past year5
Age 18-25
Age 26+
Age 18+
Serious Mental Illness6 in past year Age 18-25
Age 26+
Age 18+
Age 26+
Needing But Not Receiving Treatment at a
Specialty Facility for Substance Use10
Age 12-17
Age 18-25
Age 26+
Age 18+
Needing But Not Receiving Treatment at a
Specialty Facility for Alcohol Use10
Age 12-17
Age 18-25
Age 18-25
Age 26+
Needing But Not Receiving Treatment at a
Specialty Facility for Illicit Drug Use10
Age 12-17
Age 18+
Appendix 3B. Substance Use and Mental Health, U.S. Regions & New Mexico, by Age Group, Percentages, Annual
Averages Based on 2015 and 2016 NSDUHs

New Mexico Substance Use Epidemiology Profile Page 162
Appendix 2A, 2B, 3A, & 3B. FOOTNOTES
1 . Substance Use Disorder is defined as meeting criteria for illicit drug or alcohol dependence or abuse. Dependence or abuse is based on definitions found in the 4th edition of the Diagnostic and Statistical Manual of Mental Disorders (DSM-IV).
2. Illicit Drugs include marijuana/hashish, cocaine (including crack), heroin, hallucinogens, inhalants, methamphetamine, or prescription-type psychotherapeutics used nonmedically.
3. Average annual marijuana initiation rate = 100 * {[X1 ÷ (0.5 * X1 + X2)] ÷ 2}, where X1 is the number of marijuana initiates in the past 24 months and X2 is the number of persons who never used marijuana.
4. Tobacco Products include cigarettes, smokeless tobacco (i.e., chewing tobacco, snuff, dip, or "snus"), cigars, or pipe tobacco.
5. Any mental illness is defined as having a diagnosable mental, behavioral, or emotional disorder, other than a substance use disorder, that met the criteria found in the 4th edition of the Diagnostic and Statistical Manual of Mental Disorders (DSM-IV), regardless of the level of impairment in carrying out major life activities.
6. Serious mental illness is defined as having a diagnosable mental, behavioral, or emotional disorder, other than a substance use disorder, that met the criteria found in the 4th edition of the Diagnostic and Statistical Manual of Mental Disorders (DSM-IV) and resulted in serious functional impairment in carrying out major life activities.
7. Major depressive episode (MDE) is defined as in the 4th edition of the Diagnostic and Statistical Manual of Mental Disorders (DSM-IV), which specifies a period of at least 2 weeks when a person experienced a depressed mood or loss of interest or pleasure in daily activities and had a majority of specified depression symptoms. There are minor wording differences in the questions in the adult and adolescent MDE modules. Therefore, data from youths aged 12 to 17 were not combined with data from adults aged 18 or older to produce anestimate for those aged 12 or older.
8. Underage drinking is defined for individuals aged 12 to 20; therefore, the "12+" estimate reflects that age group and not individuals aged 12 or older.
9. Binge Alcohol Use is defined as drinking five or more drinks (for males) or four or more drinks (for females) on the same occasion (i.e. within a couple hours of each other) on at least 1 day in the past 30 days.
10. Respondents were classified as needing treatment for a substance use problem if they met the criteria for substance use disorder as defined in the 4th edition of the Diagnostic and Statistical Manual of Mental Disorders (DSM-IV) or received treatment for illicit drug or alcohol use at a specialty facility (i.e., drug and alcohol rehabilitation facility [inpatient or outpatient], hospital [inpatient only], or mental health center).
11. Mental health services are defined as having received inpatient treatment/counseling or outpatient treatment/counseling or having used prescription medication for problems with emotions, nerves, or mental health. Respondents were not to include treatment for drug or alcohol use.
New Mexico Substance Use Epidemiology Profile Page 163
International Classification of Diseases, Clinical Modification, 9th and 10th Edition
Appendix 4

New Mexico Substance Use Epidemiology Profile Page 164

965.00 T40.0 [X1-X4]
965.09 T40.2 [X1-X4]
E850.2
965.02 T40.3 [X1-X4]
E850.1
96.50 T40.1 [X1-X4]
E850.0
T40.4 [X1-X4]
570.xx K70-K77
571.xx
572.xx
573.xx
New Mexico Substance Use Epidemiology Profile Page 165
ICD-9-CM ICD-10-CM
Description Code Code Description
Other disorders of liver
Poisoning by other synthetic narcotics
Chronic Liver Disease
Acute and subacute necrosis of liver Diseases of liver
Chronic liver disease and cirrhosis
Liver abscess and sequelae of chronic liver disease
Appendix 4: International Classification of Diseases, Clinical Modification, 9th and 10th Edition
Accidental poisoning by heroin
Opioid Overdose/Poisoning
Poisoning by opium (alkaloids), unspecified Poisoning by opium
Poisoning by other opiates and related narcotics Poisoning by other opioids
Accidental poisoning by other opiates and related narcotics
Poisoning by methadone Poisoning by methadone
Accidental poisoning by methadone
Poisoning by heroin Poisoning by heroin

New Mexico Substance Use Epidemiology Profile Page 166