Embed Size (px)
Citation preview
JOURNAL OF MAGNETIC RESONANCE 86,l lo- 126 ( 1990)
New Methods for the Measurement of NH-&H Coupling Constants in “N-Labeled Proteins
LEWIS E. KAY AND AD BAX
Laboratory of Chemical Physics, NIDDK, National Institutes of Health, Bethesda, Maryland 20892
Received February 8,1989; revised April 24 ,1989
Several new techniques, requiring 15N incorporation, are descr ibed for measur ing NH- &H Jcoupl ings in proteins. ‘H-detected heteronuclear ‘H- “N mult iplequantum cor- relation spectra retain the homonuclear Jcoupl ing information. Because ofthe favorable relaxation propert ies of 15N-‘H zero- and double-quantum coherences, significant line narrowing occurs in the F, dimension compared to the regular NH ‘H linewidth, permit- ting high accuracy measurements of J splittings, even for medium sized proteins. Meth- ods for convenient analysis of such coupl ing information are described, correcting for linewidth and dispersion mode contributions. The new approach is demonstrated for the protein staphylococcal nuclease ( 18 kDa) , complexed with pdTp and calcium. o 1990
Academic Press, Inc.
In recent years, rapid advances have been made in using NMR for the structure determination of small proteins. The structural information provided by NMR data largely consists of distance constraints, derived from a qualitative or semiquantitative interpretation of 2D NOE cross-peak intensities. Structural information about tor- sion angles can also be obtained from scalar coupling constants, since Karplus equations ( I ) relating dihedral angles and Jcouplings are available for both backbone and side-chain protons (2, 3). Because of the severe overlap typically present in the one-dimensional ‘H spectrum of a protein, 2D COSY-type experiments are most commonly used for measur ing J couplings. Couplings between Ha and nonequiva- lent HP protons, for example, can be measured conveniently with E.COSY (4) or P.E.COSY (5, 6) techniques. However, these methods are only applicable if both J- coupled spins are coupled to a third spin, and they are not particularly useful for measur ing NH-Ha couplings (with the exception of glycine residues). For small pro- teins with sufficiently narrow resonance lines, NH-Ha couplings can be measured from the corresponding cross peaks in a phase-sensit ive COSY experiment, recorded with very high resolution in at least one of the two dimensions (usually F2) ( 7, 8). Unfortunately, in all but the smallest proteins, NH linewidths are large relative to the Jcouplings, which hampers the extraction of small NH-Ha coupling constants. This large linewidth is caused in part by the relatively strong heteronuclear NH dipolar relaxation mechanism. To date, in protein applications the NH-Ha couplings have been used almost exclusively in a qualitative manner, to indicate the presence of ,8- strands (J = 10 Hz) or a-helical segments (J < 6 Hz). We anticipate that more
0022-2364190 $3.00 110 Copyright 0 1990 by Academic Press, Inc. All rights of reproduction in any form reserved.
MEASUREMENT OF NH-&H COUPLINGS 111
accurate measurements of scalar coupling constants will permit the use of more rigor- ous constraints, which should result in better definition of NMR structures.
The present paper gives a detailed description of the experimental procedures for measuring NH-Ha J couplings that are applicable to proteins having molecular weights as large as 20 kDa or more. Our approach requires “N labeling, a relatively simple and inexpensive procedure for proteins overexpressed in a m icroorganism ( 9). Incorporation of “N permits the efficient generation of heteronuclear multiple- quantum coherence. As will be discussed later, these multiple-quantum transitions do not experience the heteronuclear dipolar broadening mechanism, to first order (JO), and hence multiple-quantum T2 values can be significantly longer than the corresponding one-quantum NH T2 values. For this reason, NH-Ha couplings are, in general, much more easily extracted from multiple-quantum components than from the NH splittings measured in COSY spectra. In fact, the new approach permits the measurement of Jcouplings that are as small as 4 Hz in the protein staphylococcal nuclease ( 11) , Nase, complexed with pdTp and calcium, despite the high molecular weight of this complex ( 18 kDa) . The proposed methods enable very accurate mea- surement of J coupling values; measured J values show excellent agreement with values calculated on the basis of the X-ray crystal structure ( 12).
Three closely related methods will be described for obtaining NH-Ha scalar cou- plings from ‘H- “N heteronuclear multiple-quantum correlation (HMQC) spectra of proteins. First, a brief description of the experimental schemes is presented, fol- lowed by a discussion of the relation between the measured Jsplittings and the actual size of the J couplings. Finally, experimental examples of each of the three methods are shown for Nase, followed by a discussion of the relaxation properties of ‘H- “N multiple-quantum coherence.
METHODS
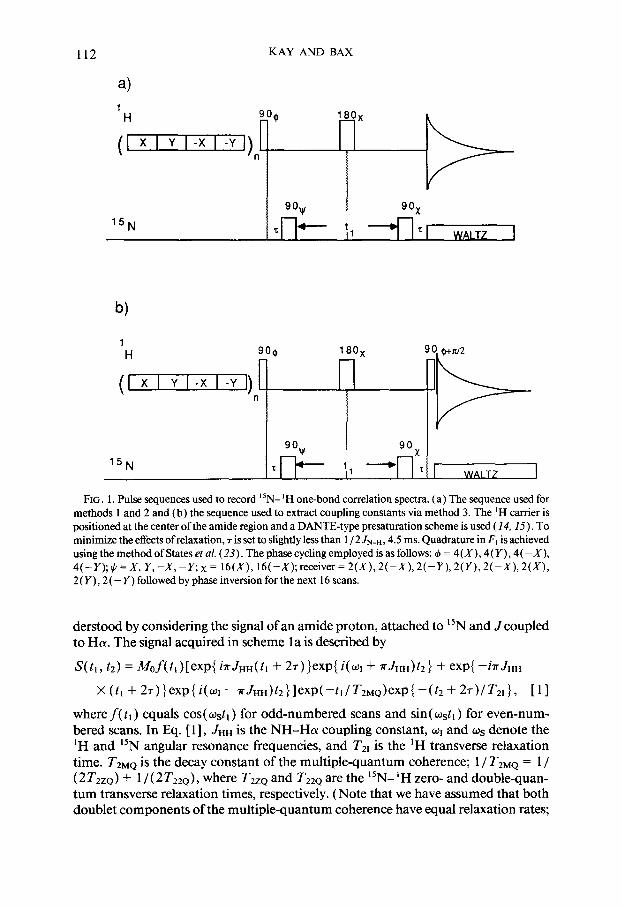
The pulse sequences used to record ‘H- 15N HMQC spectra of Nase are shown in Fig. 1. Because only NH protons are detected during the time t2, it is advantageous to position the carrier frequency in the center ofthe amide proton region. For presatu- ration of the HZ0 resonance, a modified version of the DANTE scheme ( 13) is used. The ‘H transmitter is used in the low power mode for presaturation, and the phase of the transmitter signal is incremented by 90” after an interval of duration l/46, where 6 is the difference between the carrier and the water frequencies (14, 15). This type of presaturation is advantageous over frequency jumping, in analogy to synchro- nizing the presaturation and the transmit frequency in regular homonuclear 2D ex- periments ( 16).
As has been pointed out before ( 17)) in the HMQC experiment a short t, acquisi- tion time ( t 1 max < 1/ JHH, where JHH is the largest NH-Ha scalar coupling constant) is required if spectra are to be recorded in the pure 2D absorption mode, since for longer t, acquisition times homonuclear Jmodulation (J&19) contributes dispersive components to the lineshape. If scalar coupling information is to be retained in F, , as is the case in the present situation, a tl acquisition time substantially longer than 1 / JHH is required, resulting in the generation of dispersive components in the line- shape. The origin of the dispersive components for tImax > 1 / JHH can be readily un-
112 KAY AND BAX
4 1
H
(1 x 1 Y 1 -x 1 -Y ])
n
gox 15N \l T
WALTZ I
1 H
(I x I Y I -x I -y I) 1 n
15N
I go% WAI TZ 1
FIG. 1. Pulse sequences used to record “N- ‘H one-bond correlation spectra. (a) The sequence used for methods I and 2 and (b) the sequence used to extract coupling constants via method 3. The ‘H carrier is positioned at the center ofthe amide region and a DANTE-type presaturation scheme is used (14, 15). To minimize the effects of relaxation, 7 is set to slightly less than 1 / 2 JNeH, 4.5 ms. Quadrature in F, is achieved using the method of States et al. (23). The phase cycling employed is as follows: 4 = 4(X), 4(Y), 4(-X), 4(-Y);+=X, Y,-X,-Rx= 16(X), 16(-X);receiver=2(X),2(-X),2(-Y),2(Y),2(-X),2(X), 2 ( Y) ,2 ( - Y) followed by phase inversion for the next 16 scans.
derstood by considering the signal of an amide proton, attached to 15N and J coupled to HCY. The signal acquired in scheme la is described by
S(t,, t2) = M&(t,)[exp{ inJHH(t, + 2T)}exp{ i(cq + aJHH)t2} + exp{ -inJHH
X (t, + 27)}exp(i( ~I-~JHH)~2}lexP(-~ll~ZMQ)exP~-(~2+2~)/~21}, [II
where f( tl ) equals cos( ostl ) for odd-numbered scans and sin( wstl ) for even-num- bered scans. In Eq. [I], JHH is the NH-Ha coupling constant, wI and os denote the ‘H and ‘jN angular resonance frequencies, and T21 is the ‘H transverse relaxation time. TzMQ is the decay constant of the multiple-quantum coherence; 1 / T2MQ = 1 / (2 TZZQ) + 1 / ( 2T2ZQ), where T2ZQ and T22Q are the “N- ‘H zero- and double-quan- tum transverse relaxation times, respectively. (Note that we have assumed that both doublet components of the multiple-quantum coherence have equal relaxation rates;
MEASUREMENT OF NH-&H COUPLINGS 113
this is discussed further under Results and Discussion,) Expression [l] is very similar to the signal detected in homonuclear J spectroscopy (20-22)) and as will be dis- cussed later, Fourier transformation also results in phase-twisted lineshapes ( 19,22).
In the phase-sensitive HMQC experiment, data are usually processed following the procedure outlined by States et al. (23)) or alternatively, the TPPI method can be used ( 7). Normally, in these methods after the first Fourier transformation (with respect to t2), the data are phased to the F2 absorption mode, and the imaginary F2 data are discarded. It is clear from expression [I] that no pure F2 absorption can be obtained because of the homonuclear J modulation; however, the phase distortions for the two NH ‘H- ‘H doublet components are opposite and because JHH is often smaller than the ‘H linewidth, they largely cancel, at least as far as the visual appear- ance of the spectrum is concerned. Data processing according to the States recipe yields four (overlapping) multiplet components at frequency coordinates
(27rF,, 2aF2) = (us + krJ, wI +paJ), k = 1, - 1; p = 1, -1.
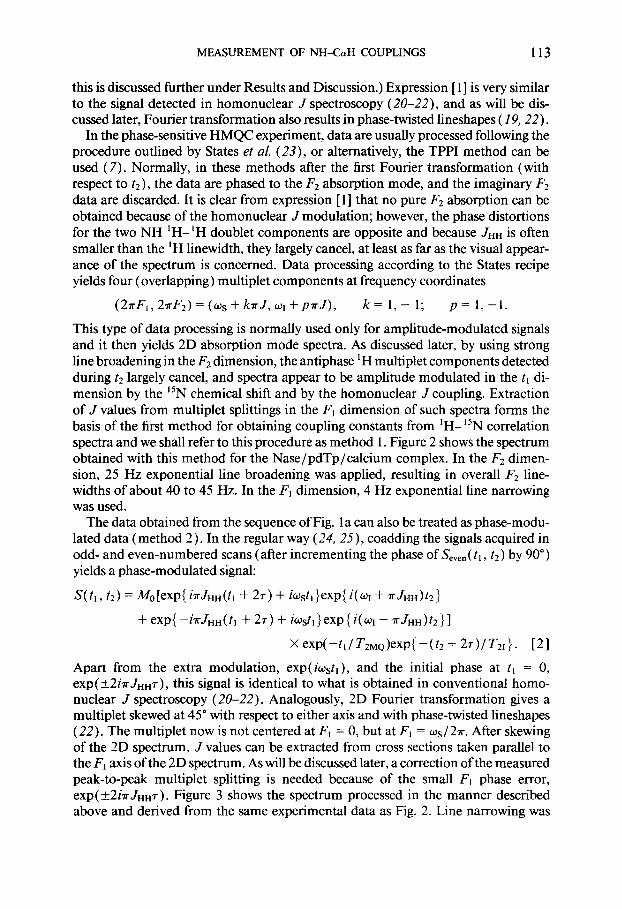
This type of data processing is normally used only for amplitude-modulated signals and it then yields 2D absorption mode spectra. As discussed later, by using strong line broadening in the F2 dimension, the antiphase ‘H multiplet components detected during t2 largely cancel, and spectra appear to be amplitude modulated in the tl di- mension by the “N chemical shift and by the homonuclear J coupling. Extraction of J values from multiplet splittings in the F1 dimension of such spectra forms the basis of the first method for obtaining coupling constants from ‘H- 15N correlation spectra and we shall refer to this procedure as method 1. Figure 2 shows the spectrum obtained with this method for the Nase/pdTp/calcium complex. In the F2 dimen- sion, 25 Hz exponential line broadening was applied, resulting in overall F2 line- widths of about 40 to 45 Hz. In the F, dimension, 4 Hz exponential line narrowing was used.
The data obtained from the sequence of Fig. 1 a can also be treated as phase-modu- lated data (method 2). In the regular way (24, 25)) coadding the signals acquired in odd- and even-numbered scans (after incrementing the phase of S,,,, ( tl , t2) by 90”) yields a phase-modulated signal:
S(t,, t2) = Mo[exp{ iaJHH(tl + 27) + iwstl}exp{ i(o, + aJHH)t2j
Xexp(-t,lT2M0)exp{-(t2+2T)lT2I}. 121 Apart from the extra modulation, exp( iwstl ), and the initial phase at t, = 0, exp( &2i?r JHHT), this signal is identical to what is obtained in conventional homo- nuclear J spectroscopy (20-22). Analogously, 2D Fourier transformation gives a multiplet skewed at 45” with respect to either axis and with phase-twisted lineshapes (22). The multiplet now is not centered at F1 = 0, but at F, = ws/2r. After skewing of the 2D spectrum, J values can be extracted from cross sections taken parallel to the F, axis of the 2D spectrum. As will be discussed later, a correction of the measured peak-to-peak multiplet splitting is needed because of the small F, phase error, exp( +-2hr JHHr). Figure 3 shows the spectrum processed in the manner described above and derived from the same experimental data as Fig. 2. Line narrowing was
114 KAY AND BAX
I I”
0
t
4
4 4
4
L,, ,,,, ,,,( ,,,, ,,,, ,,,, ,,,, ,,,,
135 130 125 120 F, (PPM) “5 110 105 100
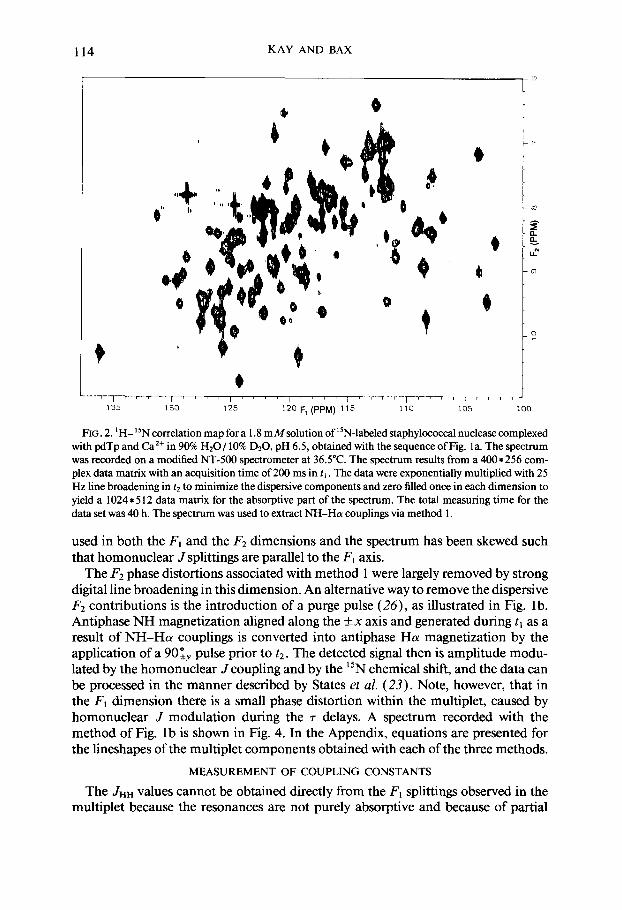
FIG. 2. ‘H- 15N correlation map for a 1.8 mMsolution of 15N-labeled staphylococcal nuclease complexed with pdTp and Ca’+ in 90% H20/ 10% DzO, pH 6.5, obtained with the sequence of Fig. la. The spectrum was recorded on a modified NT-500 spectrometer at 36.5”C. The spectrum results from a 400*256 com- plex data matrix with an acquisition time of 200 ms in ti . The data were exponentially multiplied with 25 Hz line broadening in t2 to minimize the dispersive components and zero filled once in each dimension to yield a 1024 * 5 12 data matrix for the absorptive part of the spectrum. The total measuring time for the data set was 40 h. The spectrum was used to extract NH-Ha couplings via method 1.
used in both the F, and the F2 dimensions and the spectrum has been skewed such that homonuclear J splittings are parallel to the F1 axis.
The F2 phase distortions associated with method 1 were largely removed by strong digital line broadening in this dimension. An alternative way to remove the dispersive F2 contributions is the introduction of a purge pulse (26)) as illustrated in Fig. 1 b. Antiphase NH magnetization aligned along the +x axis and generated during t, as a result of NH-Ha couplings is converted into antiphase Ha magnetization by the application of a 90 f, pulse prior to t2. The detected signal then is amplitude modu- lated by the homonuclear J coupling and by the “N chemical shift, and the data can be processed in the manner described by States et al. (23). Note, however, that in the F, dimension there is a small phase distortion within the multiplet, caused by homonuclear J modulation during the 7 delays. A spectrum recorded with the method of Fig. 1 b is shown in Fig. 4. In the Appendix, equations are presented for the lineshapes of the multiplet components obtained with each of the three methods.
MEASUREMENT OF COUPLING CONSTANTS
The JHH values cannot be obtained directly from the F, splittings observed in the multiplet because the resonances are not purely absorptive and because of partial
MEASUREMENT OF NH-&H COUPLINGS 115
I h IF IL m
\ '.
'?
\
h
P
i
ol
I " " " " I " " " " I " " " " 130 120 FI PM) 110
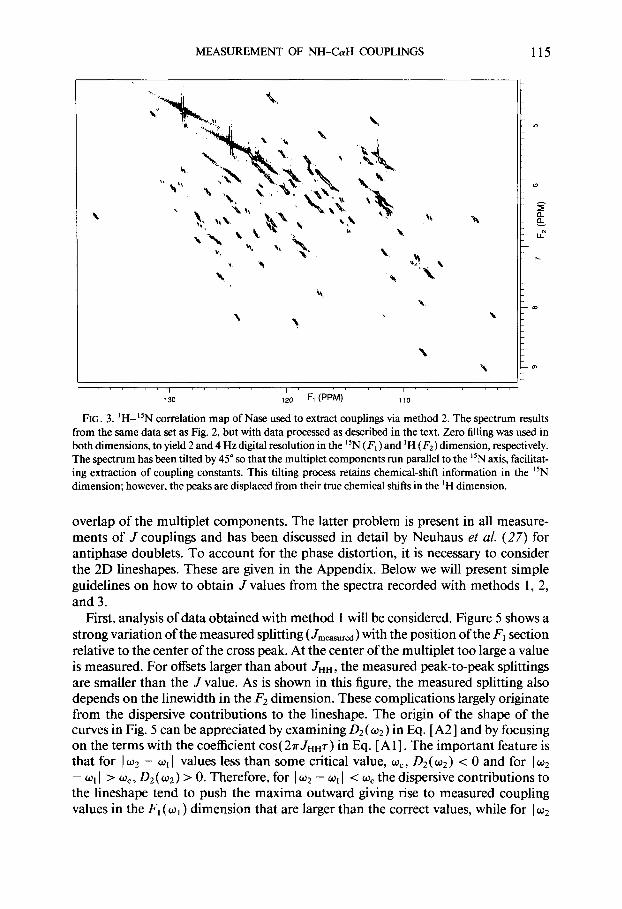
FIG. 3. ‘H-15N correlation map of Nase used to extract couplings via method 2. The spectrum results from the same data set as Fig. 2, but with data processed as described in the text. Zero filling was used in both dimensions, to yield 2 and 4 Hz digital resolution in the “N (F, ) and ‘H ( F2) dimension, respectively. The spectrum has been tilted by 45” so that the multiplet components run parallel to the “N axis, facilitat- ing extraction of coupling constants. This tilting process retains chemical-shift information in the “N dimension; however, the peaks are displaced from their true chemical shifts in the ‘H dimension.
overlap of the multiplet components. The latter problem is present in all measure- ments of J couplings and has been discussed in detail by Neuhaus et al. (27) for antiphase doublets. To account for the phase distortion, it is necessary to consider the 2D lineshapes. These are given in the Appendix. Below we will present simple guidelines on how to obtain J values from the spectra recorded with methods I, 2, and 3.
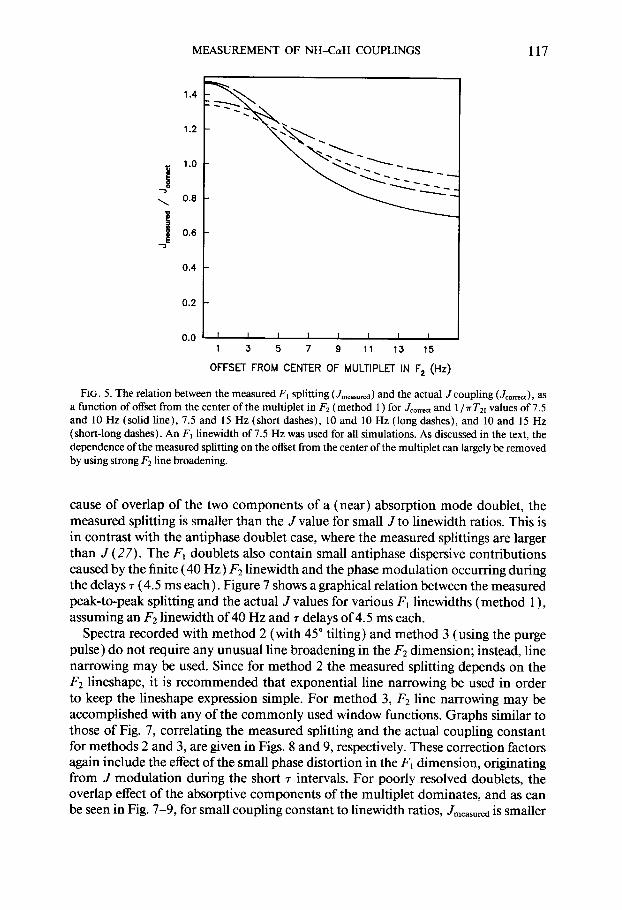
First, analysis of data obtained with method 1 will be considered. Figure 5 shows a strong variation of the measured splitting ( Jmeasured ) with the position of the F1 section relative to the center of the cross peak. At the center of the multiplet too large a value is measured. For offsets larger than about J nn, the measured peak-to-peak splittings are smaller than the J value. As is shown in this figure, the measured splitting also depends on the linewidth in the F2 dimension. These complications largely originate from the dispersive contributions to the lineshape. The origin of the shape of the curves in Fig. 5 can be appreciated by examining D2 ( 02) in Eq. [ A21 and by focusing on the terms with the coefficient cos( 27rJHH7) in Eq. [Al]. The important feature is that for I w2 - wI I values less than some critical value, w,, D2(w2) < 0 and for Iw2 - wI ] > wC, D2( w2) > 0. Therefore, for I w2 - w1 ) < w, the dispersive contributions to the lineshape tend to push the maxima outward giving rise to measured coupling values in the F, (w, ) dimension that are larger than the correct values, while for I w2
116 KAY AND BAX
.
.
. .
I,, (,,, ,,,, ,,,,~,,,, ,,,, ,,,, ,,,,I
135 130 125 1-m F, (PPM) “5 110 105 100
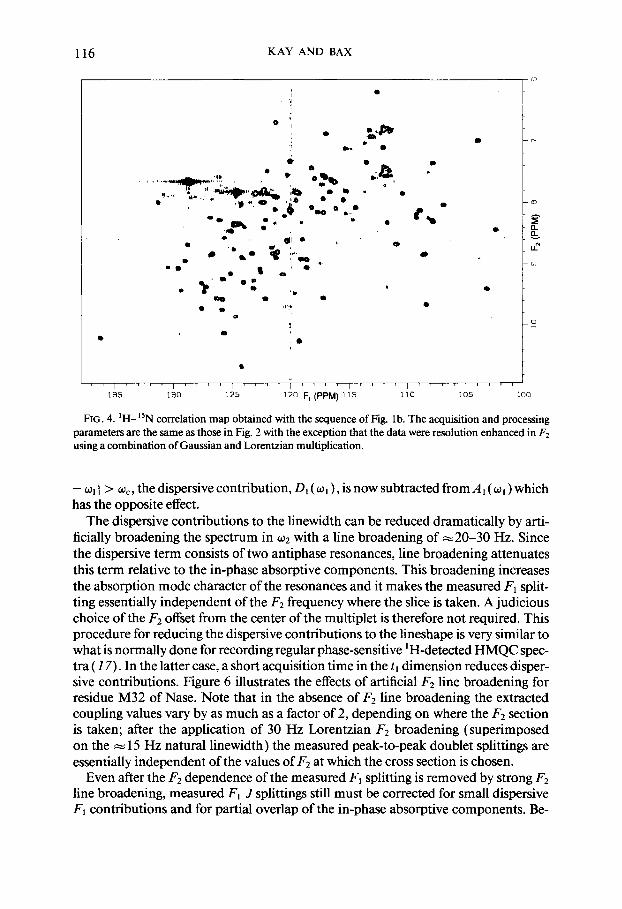
FIG. 4. ‘H-15N correlation map obtained with the sequence of Fig. lb. The acquisition and processing parameters are the same as those in Fig. 2 with the exception that the data were resolution enhanced in F2 using a combination of Gaussian and Lorentzian multiplication.
- wi ) > wc, the dispersive contribution, D, (w, ), is now subtracted from A, (w, ) which has the opposite effect.
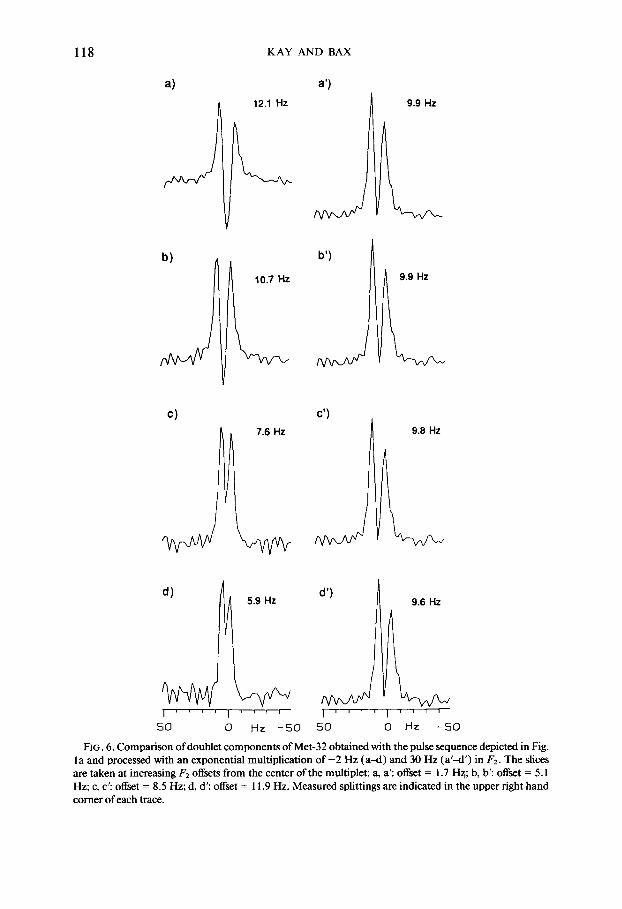
The dispersive contributions to the linewidth can be reduced dramatically by arti- ficially broadening the spectrum in w2 with a line broadening of ~20-30 Hz. Since the dispersive term consists of two antiphase resonances, line broadening attenuates this term relative to the in-phase absorptive components. This broadening increases the absorption mode character of the resonances and it makes the measured F, split- ting essentially independent of the F2 frequency where the slice is taken. A judicious choice of the F2 offset from the center of the multiplet is therefore not required. This procedure for reducing the dispersive contributions to the lineshape is very similar to what is normally done for recording regular phase-sensitive ‘H-detected HMQC spec- tra ( 17). In the latter case, a short acquisition time in the tl dimension reduces disper- sive contributions. Figure 6 illustrates the effects of artificial F2 line broadening for residue M32 of Nase. Note that in the absence of F2 line broadening the extracted coupling values vary by as much as a factor of 2, depending on where the F2 section is taken; after the application of 30 Hz Lorentzian F2 broadening (superimposed on the N 15 Hz natural linewidth) the measured peak-to-peak doublet splittings are essentially independent of the values of F2 at which the cross section is chosen.
Even after the F2 dependence of the measured F1 splitting is removed by strong F2 line broadening, measured FI J splittings still must be corrected for small dispersive F1 contributions and for partial overlap of the in-phase absorptive components. Be-
MEASUREMENT OF NH-C~YH COUPLINGS 117
1.4
1.2
i 1.0
-3 \ 0.0
E
I 0.6 -3
0.4
0.2
0.0 ’ I I I I I I 1
1 3 5 7 9 11 13 15
OFFS’2 FROM CENTER OF MULTIPLET IN F2 (Hz)
FIG. 5. The relation between the measured Fi splitting (JmeaJured) and the actual J coupling (Jo,,,), as a function of offset from the center of the multiplet in Fz (method 1) for J,,,- and 1 /?rT,, values of 7.5 and 10 Hz (solid line), 7.5 and 15 Hz (short dashes), 10 and 10 Hz (long dashes), and 10 and 15 Hz (short-long dashes). An F, l inewidth of 7.5 Hz was used for all simulations. As discussed in the text, the dependence of the measured splitting on the offset from the center of the multiplet can largely be removed by using strong Fz line broadening.
cause of overlap of the two components of a (near) absorption mode doublet, the measured splitting is smaller than the J value for small J to linewidth ratios. This is in contrast with the antiphase doublet case, where the measured splittings are larger than J (27). The F, doublets also contain small antiphase dispersive contributions caused by the finite (40 Hz) F2 linewidth and the phase modulation occurring during the delays r (4.5 ms each). Figure 7 shows a graphical relation between the measured peak-to-peak splitting and the actual J values for various I;, linewidths (method I), assuming an F2 linewidth of 40 Hz and 7 delays of 4.5 ms each.
Spectra recorded with method 2 (with 45” tilting) and method 3 (using the purge pulse) do not require any unusual line broadening in the F2 dimension; instead, line narrowing may be used. Since for method 2 the measured splitting depends on the F2 lineshape, it is recommended that exponential line narrowing be used in order to keep the lineshape expression simple. For method 3, F2 line narrowing may be accomplished with any of the commonly used window functions. Graphs similar to those of Fig. 7, correlating the measured splitting and the actual coupling constant for methods 2 and 3, are given in Figs. 8 and 9, respectively. These correction factors again include the effect of the small phase distortion in the F1 dimension, originating from J modulation during the short T intervals. For poorly resolved doublets, the overlap effect of the absorptive components of the multiplet dominates, and as can be seen in Fig. 7-9, for small coupling constant to linewidth ratios, Jmeasured is smaller
118 KAY AND BAX
a)
J
b)
h-4
cl
12.1 Hz
I-
10.7 Hz
L
7.6 Hz
A
a’)
b’)
;1; c’)
AJWJ
9.9 Hz
II_,
9.6 Hz
i,
50 0 Hz -50
FIG. 6. Comparison of doublet components of Met-32 obtained with the pulse sequence depicted in Fig. la and processed with an exponential multiplication of -2 Hz (a-d) and 30 Hz (a’-d’) in F2. The slices are taken at increasing F2 offsets from the center of the multiplet: a, a’: offset = 1.7 Hx; b, b’: offset = 5.1 Hz; c, c’: offset = 8.5 Hz; d, d’: offset = 11.9 Hz. Measured splittings are indicated in the upper right hand comer of each trace.
MEASUREMENT OF NH-&H COUPLINGS
METHOD 1
119
5
3
1 3 5 7 9 11
J correct (Hz)
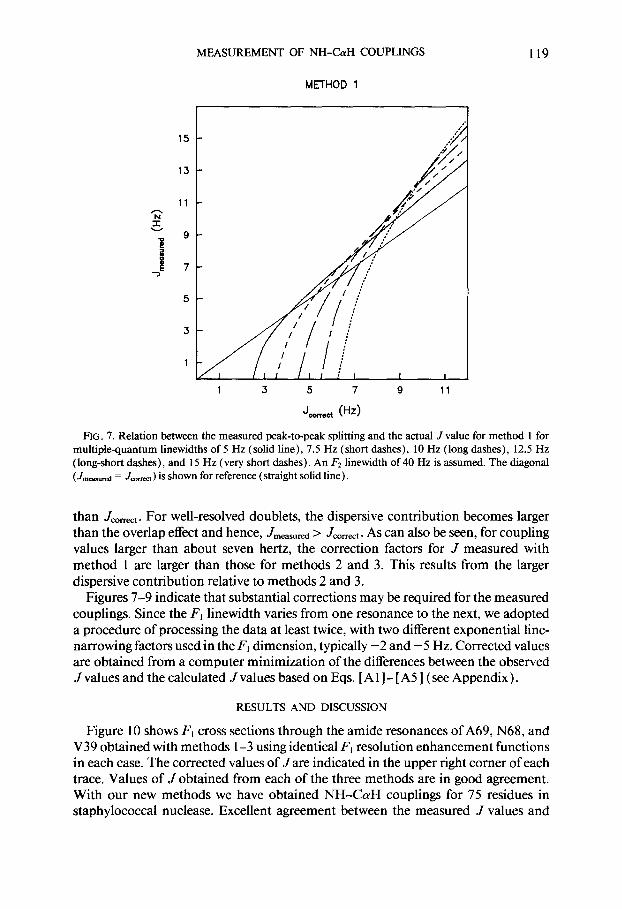
FIG. 7. Relation between the measured peak-to-peak splitting and the actual J value for method 1 for multiplequantum linewidths of 5 Hz (solid line), 7.5 Hz (short dashes), 10 Hz (long dashes), 12.5 Hz (long-short dashes), and 15 Hz (very short dashes). An Fz linewidth of 40 Hz is assumed. The diagonal (Jmcasursd = Jcmm ) is shown for reference (straight solid line).
than Jmm. For well-resolved doublets, the dispersive contribution becomes larger than the overlap effect and hence, Jmeasured > Jcorrect. As can also be seen, for coupling values larger than about seven hertz, the correction factors for J measured with method 1 are larger than those for methods 2 and 3. This results from the larger dispersive contribution relative to methods 2 and 3.
Figures 7-9 indicate that substantial corrections may be required for the measured couplings. Since the F, linewidth varies from one resonance to the next, we adopted a procedure of processing the data at least twice, with two different exponential line- narrowing factors used in the F, dimension, typically -2 and -5 Hz. Corrected values are obtained from a computer m inimization of the differences between the observed J values and the calculated Jvalues based on Eqs. [A 1 ] - [ A5 ] (see Appendix).
RESULTS AND DISCUSSION
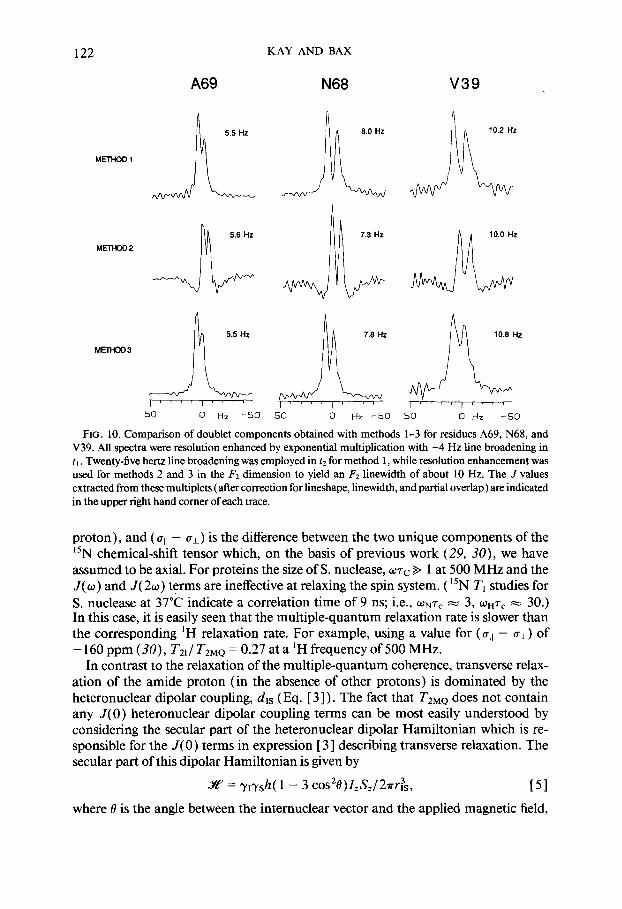
Figure 10 shows F, cross sections through the amide resonances of A69, N68, and V39 obtained with methods l-3 using identical F, resolution enhancement functions in each case. The corrected values of J are indicated in the upper right comer of each trace. Values of J obtained from each of the three methods are in good agreement. With our new methods we have obtained NH-&H couplings for 75 residues in staphylococcal nuclease. Excellent agreement between the measured J values and
120 KAY AND BAX
METHOD 2
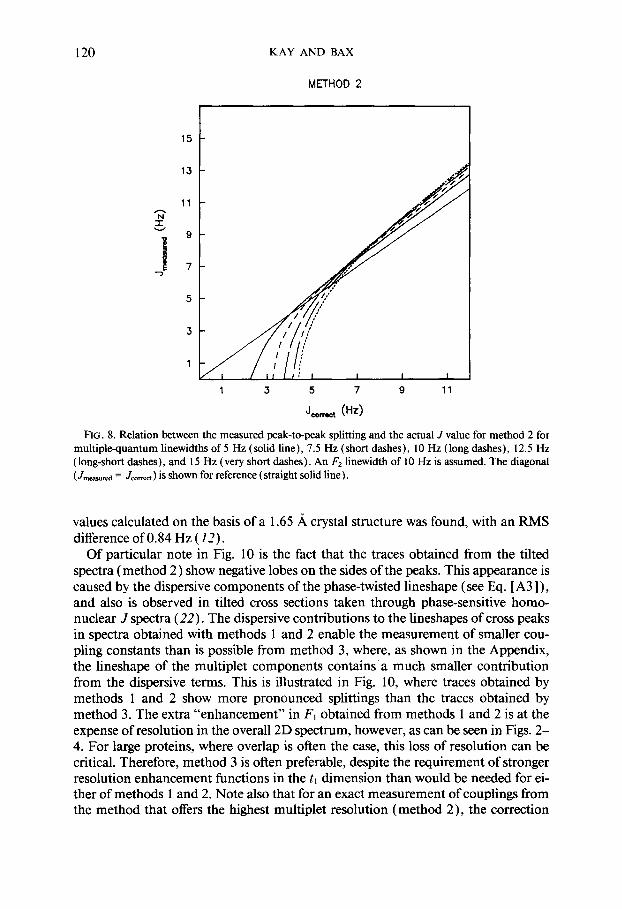
FIG. 8. Relation between the measured peak-to-peak splitting and the actual J value for method 2 for multiplequantum linewidths of 5 Hz (solid line), 7.5 Hz (short dashes), 10 Hz (long dashes), 12.5 Hz (long-short dashes), and 15 Hz (very short dashes). An F2 linewidth of 10 Hz is assumed. The diagonal (Jn-mi = Jmmt ) is shown for reference (straight solid line).
values calculated on the basis of a 1.65 A crystal structure was found, with an RMS difference of 0.84 Hz ( 12).
Of particular note in Fig. 10 is the fact that the traces obtained from the tilted spectra (method 2) show negative lobes on the sides of the peaks. This appearance is caused by the dispersive components of the phase-twisted lineshape (see Eq. [ A3]), and also is observed in tilted cross sections taken through phase-sensitive homo- nuclear J spectra (22). The dispersive contributions to the lineshapes of cross peaks in spectra obtained with methods 1 and 2 enable the measurement of smaller cou- pling constants than is possible from method 3, where, as shown in the Appendix, the lineshape of the multiplet components contains a much smaller contribution from the dispersive terms. This is illustrated in Fig. 10, where traces obtained by methods 1 and 2 show more pronounced splittings than the traces obtained by method 3. The extra “enhancement” in F1 obtained from methods 1 and 2 is at the expense of resolution in the overall 2D spectrum, however, as can be seen in Figs. 2- 4. For large proteins, where overlap is often the case, this loss of resolution can be critical. Therefore, method 3 is often preferable, despite the requirement of stronger resolution enhancement functions in the tr dimension than would be needed for ei- ther of methods 1 and 2. Note also that for an exact measurement of couplings from the method that offers the highest multiplet resolution (method 2)) the correction
MEASUREMENT OF NH-&H COUPLINGS 121
METHOD 3
13
11
9
7
5
3
1
1 3 5 7 9 11
J formt (Hz)
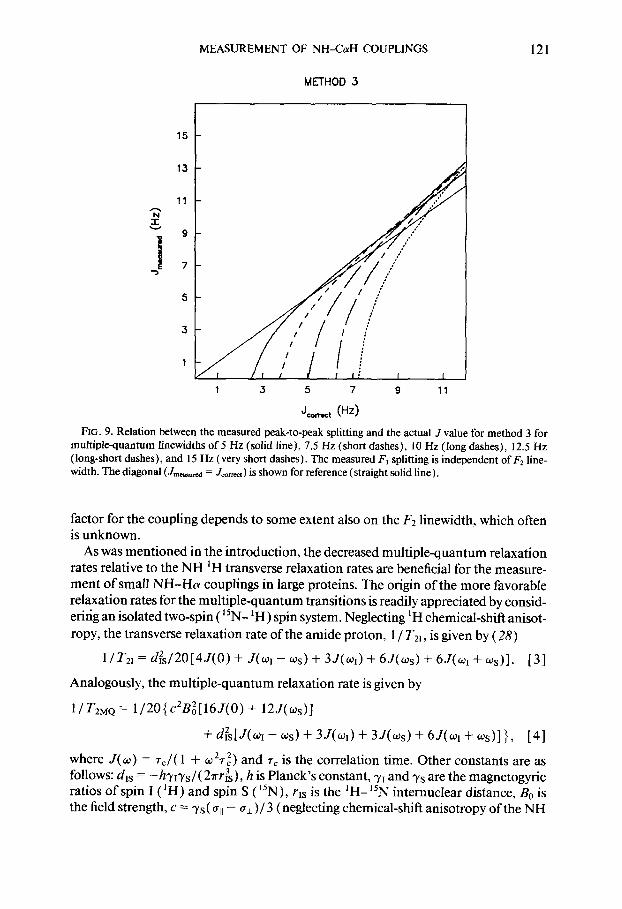
FIG. 9. Relation between the measured peak-to-peak splitting and the actual J value for method 3 for multiplequantum linewidths of 5 Hz (solid line), 7.5 Hz (short dashes), 10 Hz (long dashes), 12.5 Hz (long-short dashes), and 15 Hz (very short dashes). The measured F, splitting is independent of F2 line- width. The diagonal (J,,,,& = Jcom) is shown for reference (straight solid line).
factor for the coupling depends to some extent also on the FZ linewidth, which often is unknown.
As was mentioned in the introduction, the decreased multiple-quantum relaxation rates relative to the NH ‘H transverse relaxation rates are beneficial for the measure- ment of small NH-Ha couplings in large proteins. The origin of the more favorabIe relaxation rates for the multiple-quantum transitions is readily appreciated by consid- ering an isolated two-spin ( “N- ‘H) spin system. Neglecting ‘H chemical-shift anisot- ropy, the transverse relaxation rate of the amide proton, 1 / T,, , is given by (28)
1/T2, = d&/20[4J(O) + J(w, - us) + 3J(o1) + 6J(ws) + 6J(q + us)]. [3]
Analogously, the multiple-quantum relaxation rate is given by
l/T,,, = l/20{c2B;[16J(0) + 12J(ws)]
+ &Me - 4 + 3J(w) + 3J(ws) + 6J(w + ws)l}, [41
where J(W) = T,/( 1 f ~~7:) and 7, is the correlation time. Other constants are as follows: dIs = -h7r+&( 27r&), h is Planck’s constant, yI and ys are the magnetogyric ratios of spin I ( ‘H) and spin S ( “N), yIs is the ‘H- 15N internuclear distance, B0 is the field strength, c = ys( ull - ul )/ 3 (neglecting chemical-shift anisotropy of the NH
122 KAY AND BAX
A69 N68
FIG. 10. Comparison of doublet components obtained with methods l-3 for residues A69, N68, and V39. All spectra were resolution enhanced by exponential multiplication with -4 Hz line broadening in t, . Twenty-five hertz line broadening was employed in tZ for method 1, while resolution enhancement was used for methods 2 and 3 in the F2 dimension to yield an F2 linewidth of about 10 Hz. The J values extracted from these multiplets (after correction for lineshape, linewidth, and partial overlap) are indicated in the upper right hand comer of each trace.
proton), and ( uII - cI) is the difference between the two unique components of the “N chemical-shift tensor which, on the basis of previous work (29, 30), we have assumed to be axial. For proteins the size of S. nuclease, w7c % 1 at 500 MHz and the J(w) and J( 2~) terms are ineffective at relaxing the spin system. ( 15N T, studies for S. nuclease at 37°C indicate a correlation time of 9 ns; i.e., wN7, N 3, WHr, = 30.) In this case, it is easily seen that the multiple-quantum relaxation rate is slower than the corresponding ‘H relaxation rate. For example, using a value for (u,, - al) of - 160 ppm (30), TII/ T2MQ = 0.27 at a ‘H frequency of 500 MHz.
In contrast to the relaxation of the multiple-quantum coherence, transverse relax- ation of the amide proton (in the absence of other protons) is dominated by the heteronuclear dipolar coupling, drs (Eq. [ 3 ] ) . The fact that TzMQ does not contain any J(0) heteronuclear dipolar coupling terms can be most easily understood by considering the secular part of the heteronuclear dipolar Hamiltonian which is re- sponsible for the J( 0) terms in expression [ 31 describing transverse relaxation. The secular part of this dipolar Hamiltonian is given by
%w = y&2( 1 - 3 c0s%)1&/27r&, [51 where 0 is the angle between the internuclear vector and the applied magnetic field,
MEASUREMENT OF NH-&H COUPLINGS 123
and Z, and S, are the z components of spin angular momentum of spins I ( ‘H) and S (“N). The eigenstates of the two-spin system are given by the direct product func- tions ( LYCY, c$, pa, pp) . The effect of the heteronuclear dipolar coupling (Eq. [ 51) is to perturb the states (YCY and ,&I by equal amounts. Thus, the (YCY -P flp transition frequency is independent of the orientation, 8, of the internuclear vector. Similarly, cup and pa are perturbed in the same fashion, and the (YP -P pa transition frequency is independent of 8. Therefore, the relaxation rates of the (YLY -P /3P and the ap + pa transitions do not contain heteronuclear dipolar J( 0) terms.
The assumption of an isolated two-spin system clearly is an oversimplification for proteins. In fact the asymmetry in the doublet observed in all traces in Fig. 10 indi- cates that, at the very least, three spins ( 15N, NH, Ha) must be considered in the description of the relaxation of the multiple-quantum components, where spins NH and Ha are the scalar-coupled pair. A lengthy calculation shows that, in the lim it UT, b 1, the relaxation expression for the F1 doublet components at ws/2a f J&2 is given by
where d’ = -(h~:)/(27~&u-~~) and P,(cos ,8) = (3 cos*p - 1)/2, where /3 is the angle between the principal component of the “N CSA tensor and the NH-Ha dipo- lar vector. Note that as in the two-spin approximation, there is no heteronuclear dipolar contribution to the relaxation expression; however, there is now an NH-Ha homonuclear dipolar contribution to the relaxation rate. The very small hetero- nuclear 15N-Ha coupling has been neglected in this calculation. Equation [ 61 indi- cates that cross-correlation effects between the chemical-shift anisotropy relaxation mechanism and the NH-Ha intraresidue homonuclear dipolar mechanism cause the relaxation rates of the two multiple-quantum doublet components to be different. The origin of differential line broadening of transverse (one quantum) components due to cross-correlation effects between CSA and dipolar interactions has been dis- cussed previously (31, 32) and these effects have also been observed in a number of molecular systems (33-36).
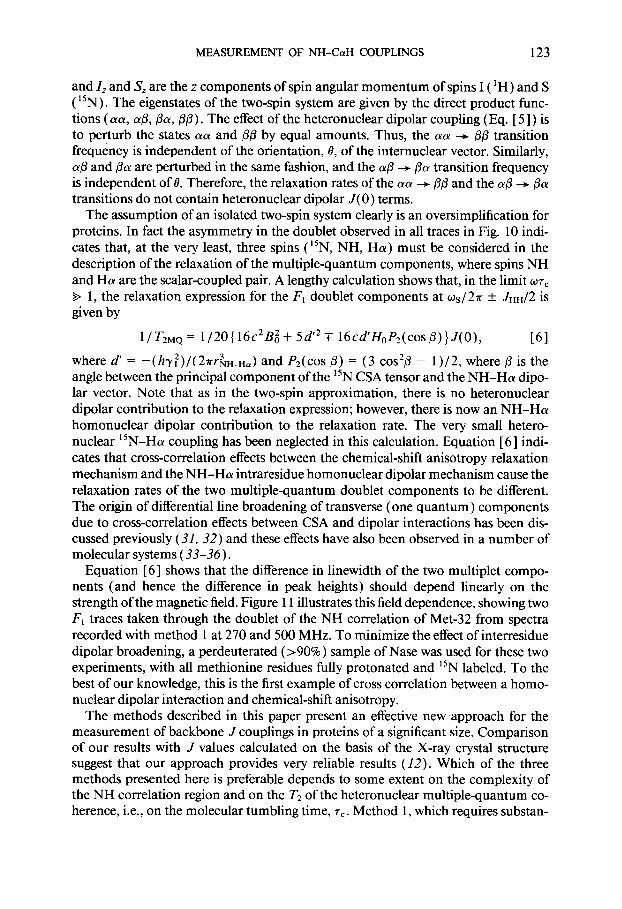
Equation [ 61 shows that the difference in linewidth of the two multiplet compo- nents (and hence the difference in peak heights) should depend linearly on the strength of the magnetic field. Figure 11 illustrates this field dependence, showing two F, traces taken through the doublet of the NH correlation of Met-32 from spectra recorded with method 1 at 270 and 500 MHz. To m inimize the effect of interresidue dipolar broadening, a perdeuterated (>90%) sample of Nase was used for these two experiments, with all methionine residues fully protonated and “N labeled. To the best of our knowledge, this is the first example of cross correlation between a homo- nuclear dipolar interaction and chemical-shift anisotropy.
The methods described in this paper present an effective new approach for the measurement of backbone J couplings in proteins of a significant size. Comparison of our results with J values calculated on the basis of the X-ray crystal structure suggest that our approach provides very reliable results (12). Which of the three methods presented here is preferable depends to some extent on the complexity of the NH correlation region and on the T2 of the heteronuclear multiple-quantum co- herence, i.e., on the molecular tumbling time, 7,. Method 1, which requires substan-
124 KAY AND BAX
A B
;Ji, .@@JfJl v -7ixTzz FIG. 11. Comparison of the F, doublet components of residue Met-32, recorded at (A) 500 and (B) 270
MHz ‘H frequency. Data were acquired with the sequence of Fig. la and processed with 30 Hz line broad- ening in the F2 dimension. Exponential line narrowing of -2 and - 1 Hz was used in the F, dimension for the spectra recorded at 500 and 270 MHz, respectively.
tial F2 line broadening, and method 2, which yields phase-twisted lineshapes, can only be used for well-resolved regions of the spectrum. The dispersive contribution to the shapes of the doublets obtained with methods 1 and 2 enables the measurement of splittings that are slightly smaller than with method 3. However, the correction factors presented above that are needed for methods 1 and 2 are also larger than those needed for method 3, and therefore the possibility of small errors introduced during the correction is larger too. Overall, method 3 is probably the easiest to use in a reli- able fashion, although methods I and 2 may be used for measurement of splittings that are unresolvable with method 3.
APPENDIX
In this section we include the equations for the two-dimensional lineshapes gener- ated by the three methods. The equations presented below were used in the extraction of corrected coupling values from the measured splittings. In the derivation of the equations we have assumed that both components of the multiple-quantum doublet have identical relaxation times, TZMo.
Method 2. The data from odd and even scans (Eq. [ 11) are combined by the method of States et al. (23) and Fourier transformed to generate a frequency-domain signal of the form
S(w1, w2) = Mocos(2?rJHHT){A,(wl)AZ(W2) - ~l(W)~2(~2)}
+Mosin(,?~JHHT)(D,(w,)A2(02) +-~I(w)&(w>>, [AlI whereAl( Dl(w) and-h(w), D ( 2 w2 are absorptive and dispersive components 1 of magnetization in the F1 and F2 dimensions, given by
AI = 7-2MQ/[1 + {WI -(US + +IH))2%lQl
+ T2MQ/[1 + {WI -(US - d-XI-I))2~~MQ]
MEASUREMENT OF NH-CaH COUPLINGS 125
Q(q)= {wl-(WS+?FJHH)}T~MQ/[l+{W1-(WS+?TJHH)}2T~MQl - (01 -(ws-aJHH)}T;MQ/[l+ (01 -bs-~JHH)~2%Ql
A2(w2)= T21/[1 + { 602 - (cdl+ 7rJH")}2T;,] + T2I/[l + (w2 - (WI - ~JHH))2m D2(02)= {W2-(W,+dHH)}T~1/[1+ {~2-(~I+~JHH)~27%l
- (~02 - (04 - PJ~))T:,/[~ + (02 - (WI- 7&1)~~7’~11~ [A21
Method 2. Fourier transformation of Eq. [ 2 1 yields s(w,, w2) = kf,jCOS(2T~~~7)[~4, { 0, - (Us + ~.hH)}~2{ 02 - (WI + TJHH)}
-~~{~~-(~st?T~HH)}~2{~2-(~I+~~HH)}+~1{~1-(Ws-PJHH)}
X~2{02-(~~-~~HH)~-~,{~,-(~s-TJH~))02{02-(0I-?TJHH)}l
+ k&sin(k&7)[Ar {WI - (us + XJHH)}~~{ u2 - (wI + TJHH))
+D,{wl-(os+?TJHH))A2{W2-(0,+~JHH)}-A1{W1-(OS-aJHH)}
xD2{W2-(WI-~~HH)}-D1{WI-(Ws-AJHH))
xA2{~2-(~,-7&H)}1, [A31 where Ai { wi - ( oA f r JHH) } and Di { wi - ( OA k P JHH) } are absorptive and dispersive lineshapes given by
= {Cdi-(CtJxk7TJHH)}T~i/[l + {~i-(+*~JHH)}2TkI [A41
withT,,= T2MQandX=Sfori= 1,andT2i=T21andX=Ifori=2. Method 3. The lineshape obtained from method 3 is given by
S(~,,W~)=~&ICOS(~~JHHT-){AI(WI)A~(W~)}
+MOsin(2~JHH7){DI(W,)A2(02)), [A51 where Ai( wi) and Di( tii) are given by IQ. [A2 1.
ACKNOWLEDGMENTS
We thank Ted Becker for many valuable suggestions during the preparation of this manuscript and Rolf Tschudin for continuous technical support. Dennis A. Torchia and Steven W. Sparks kindly provided us with the samples of S. Nase and made available to us the 15N-NH assignments used in this study. This work was supported by the Intramural AIDS Antiviral Program of the Office of the Director of the National Institutes of Health. L.E.K. acknowledges financial support from the Medical Research Council of Canada.
REFERENCES
1. M. KARPLUS, J. Am. Chem. Sot. 85,287O ( 1963). 2. A.DEMARCO,M.LLINAS,ANDK.W~~THRICH, Biopolymers 17,637(1978).
126 KAY AND BAX
3. A. PARDI, M. BILLETER, AND K. W~THRICH, J, Mol. Biol. 180,741( 1984). 4. C. GRIESINGER, 0. W. SORENSEN, AND R. R. ERNST, J. Am. Chern. Sot. 107,394 ( 1985 ). 5. L. MUELLER, J. Magn. Reson. 72,191(1987). 6. J. BLAZER, C. M. DOSSON, AND C. REDRELD, Abstract PI 5-24, “XIIIth ICMRBS Conference, Madi-
son, Wisconsin, 1988.” 7. D. MARION AND K. W~THRICH, Biochem. Biophys. Rex Commun. 113,967 ( 1983). 8. A. ARSENIEV, P. SCHULTZE, E. W~RC&TTER, W. BRAUN, G. WAGNER, M. VASAK, J. H. R. UGI,
AND K. WOTHRICH, J. Mol. Biol. 201,637 ( 1988). 9. M. A. WEISS, A. JEITLER-NILSSON, N. J. FISCHBEIN, M. KARPLUS, AND R. T. SAUER, in “NMR in
the Life Sciences” (E. M. Bradbury and C. Nicolini, Eds.) NATO AS1 Series, Vol. 107, pp. 37-48, Plenum, London, 1986.
10. A. BAX, L. E. KAY, S. W. SPARKS, AND D. A. TORCHIA, J. Am. Chem. Sot. 111,408 (1989); G. BODENHAUSEN, R. L. VOLD, AND R. R. VOLD, J. Magn. Reson. 37,93 ( 1980).
11. D. A. TORCHIA, S. W. SPARKS, AND A. BAX, Biochemistry 72,5 135 ( 1988). 12. L. E. KAY, B. BROOKS, D. A. TORCHIA, S. W. SPARKS, AND A. BAX, J. Am. Chem. Sot. 111,5488
(1989). 13. A. G. MORRIS AND R. FREEMAN, J. Magn. Reson. 29,433 ( 1978). 14. D. MARION, L. E. KAY, S. W. SPARKS, D. A. TORCHIA, AND A. BAX, J. Am. Chem. Sot. 111, 15 15
(1989). IS. L. E. KAY, D. MARION, AND A. BAX, J. Magn. Reson. 84,72 ( 1989). 16. E. R. P. ZUIDERWEG, K. HALLENGA, AND E. T. OLEINICZAK, J. Magn. Reson. 70,336 ( 1986). 17. V. SKLENAR AND A. BAX, J. Magn. Reson. 71,379 ( 1987). 18. E. L. HAHN AND D. E. MAXWELL, Phys. Rev. 88,107O ( 1952). 19. P. BACHMANN, W. P. AUE, L. MILLER, AND R. R. ERNST, J. Magn. Reson. 28,29 ( 1977). 20. W. P. AUE, J. KARHAN, AND R. R. ERNST, J. Chem. Phys. 64,4226 ( 1976). 21. K. NAGAYAMA, K. W~THRICH, P. BACHMANN, AND R. R. ERNST, Biochem. Biophys. Res. Commun.
78,99 ( 1977). 22. K. NAGAYAMA, P. BACHMANN, K. W~~THRICH, AND R. R. ERNST, J. Magn. Reson. 31, 133 ( 1978). 23. D. J. STATES, R. A. HABERKORN, AND D. J. RUBEN, J. Magn. Reson. 48,286 ( 1982). 24. A. BAX, R. FREEMAN, AND G. A. MORRIS, J. Magn. Reson. 42,162 ( 198 1). 25. A. BAX, Bull. Magn. Reson. 7,167 ( 1986). 26. 0. W. SORENSEN AND R. R. ERNST, J. Magn. Reson. 51,477 ( 1983). 27. D. G. NEUHAUS, G. WAGNER, M. VASAK, J. H. R. KXGI, AND K. WOTHRICH, Eur. J. Biochem. 151,
257 (1985). 28. A. ABRAGAM, “The Principles of Nuclear Magnetism,” Clarendon, Oxford, 196 1. 29. G. S. HARBISON, L. W. JELINSKI, R. E. STARK, D. A. TORCHIA, J. HERZFELD, AND R. G. GRIFFIN,
J. Magn. Reson. 60,79 ( 1984). 30. Y. HIYAMA, C. NIU, J. V. SILVERTON, A. BAVOSO, AND D. A. TORCHIA, J. Am. Chem. Sot. 110,
2378 (1988). 31. M. GOLDMAN, J. Magn. Reson. 60,437 ( 1984). 32. H. SHIMIZU, J. Chem. Phys. 40,3357 ( 1964). 33. S. G. WITHERS, N. B. MADSEN, ANDB. D. SYKES, J. Magn. Reson. 61,545 ( 1985). 34. R. H. GRIFFEY, C. D. POULTER, Z. YAMAIZUMI, S. NISHIMURA, AND R. E. HURD, J. Am. Chem.
Sot. 104,581l (1982). 35. T. C. FARRAR, B. R. ADAMS, G. C. GREY, Q. A. QUINTERO-ARCAYA, AND Q. Zuo, J. Am. Chem.
Sot. 108,8190( 1986). 36. G. JACCARD, S. WIMPERIS, AND G. B~DENHAUSEN, Chem. Phys. Lett. 138,601( 1987).