Embed Size (px)
Citation preview
Finding ways to preserve cultural heritageand historic sites is an important problem.
These sites are subject to erosion and vandalism, and aslong-lived artifacts, they have gone through many phas-es of construction, damage, and repair. It’s important tokeep an accurate record of these sites’ current condi-tions by using 3D model building technology, so preser-
vationists can track changes, foreseestructural problems, and allow awider audience to virtually see andtour these sites. Due to the com-plexity of these sites, building 3Dmodels is time consuming and diffi-cult, usually involving much manu-al effort. Recently, the advent of new3D range scanning devices has pro-vided means to preserve these sitesdigitally and preserve the historicrecord by building accurate geo-metric and photorealistic 3D mod-els. This data provides some excitingpossibilities for creating models, butat the cost of scaling up existingmethods to handle the extremelylarge point sets these devices create.This reinforces the need for auto-matic methods of registering, merg-
ing, and abstracting the dense range data sets.Other projects have addressed this and similar prob-
lems.1-6 Each of these projects differs in the way theycreate models and in the amount of human interactionin the process. Our work centers on developing andautomating new methods to recover complete geomet-ric and photometric models of large sites. We’re devel-oping methods for data abstraction and compressionthrough segmentation, 3D-to-3D registration (bothcoarse and fine), 2D-to-3D texture mapping of the mod-els with imagery, and robotic automation of the sensingtask. The methods we’ve developed are also suitable fora variety of other applications related to large-scalemodel building.
One of the test beds for our model-building meth-
ods is the Cathedral Saint-Pierre in Beauvais, France,which is an endangered structure on the World Mon-uments Fund’s Most Endangered List (see the sidebar).We have a number of goals in building our models ofthe cathedral:
� establish a baseline model for the cathedral’s currentstructural condition,
� create a geometrically accurate 3D model to examineweaknesses in the building and propose remedies,and
� visualize the building in previous contexts as an edu-cational tool.
Registration methodsTo create data sets that we can turn into models, we
use a time-of-flight laser scanner (Cyrax 2500) to mea-sure the distance to points on an object. Data from thescanner comprises point clouds, with each point com-prising four coordinates (x, y, z) and a value represent-ing the amplitude of the laser light reflected back to thescanner. This fourth coordinate, labeled reflectancestrength value (RSV) is a function of the distance to thescanned surface, angle of the surface relative to the laserbeam direction, and material properties of the surface.A scan of 1,000 × 1,000 points takes about 10 minutes.
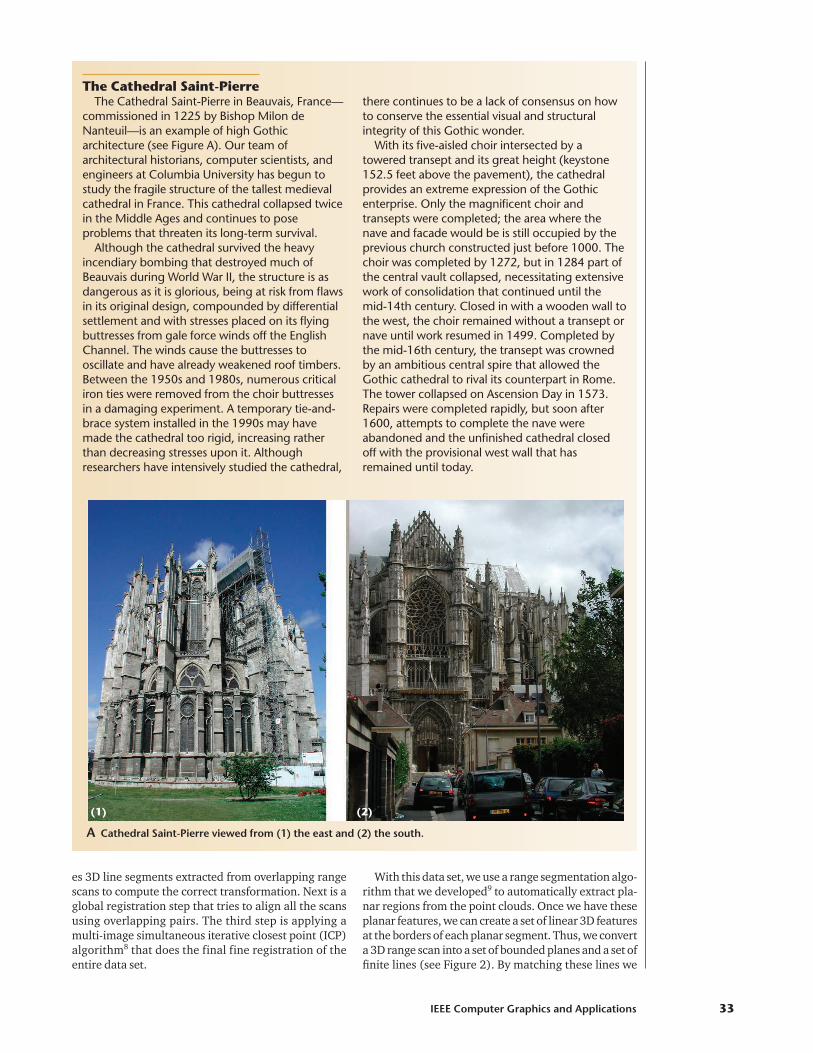
To acquire data describing an entire structure such asthe cathedral requires taking multiple range scans fromdifferent locations that we must register together cor-rectly. Although we can register the point clouds manu-ally, it’s time consuming and error prone. Each rangescan can provide up to 1 million data points (see Figure1 on p. 34). However, manually visualizing millions ofsmall points and matching them is quite imprecise anddifficult as the number of scans increases. When possible,we use specially designed targets or fiducials to help dur-ing the registration phase. In many cases, such as withthe cathedral, it’s difficult to place targets. This problemled us to develop our automatic registration methods.
Our registration method is a three-step process.7 Thefirst step is an automatic pairwise registration betweentwo overlapping scans. The pairwise registration match-
3D Reconstruction and Visualization
We discuss new methods for
building 3D models of
historic sites. Our algorithm
automatically computes
pairwise registrations
between individual scans,
builds a topological graph,
and places the scans in the
same frame of reference.
Peter K. Allen, Alejandro Troccoli, BenjaminSmith, and Stephen MurrayColumbia University
Ioannis Stamos and Marius LeordeanuThe City University of New York
New Methods forDigital Modeling ofHistoric Sites
32 November/December 2003 Published by the IEEE Computer Society 0272-1716/03/$17.00 © 2003 IEEE
es 3D line segments extracted from overlapping rangescans to compute the correct transformation. Next is aglobal registration step that tries to align all the scansusing overlapping pairs. The third step is applying amulti-image simultaneous iterative closest point (ICP)algorithm8 that does the final fine registration of theentire data set.
With this data set, we use a range segmentation algo-rithm that we developed9 to automatically extract pla-nar regions from the point clouds. Once we have theseplanar features, we can create a set of linear 3D featuresat the borders of each planar segment. Thus, we converta 3D range scan into a set of bounded planes and a set offinite lines (see Figure 2). By matching these lines we
IEEE Computer Graphics and Applications 33
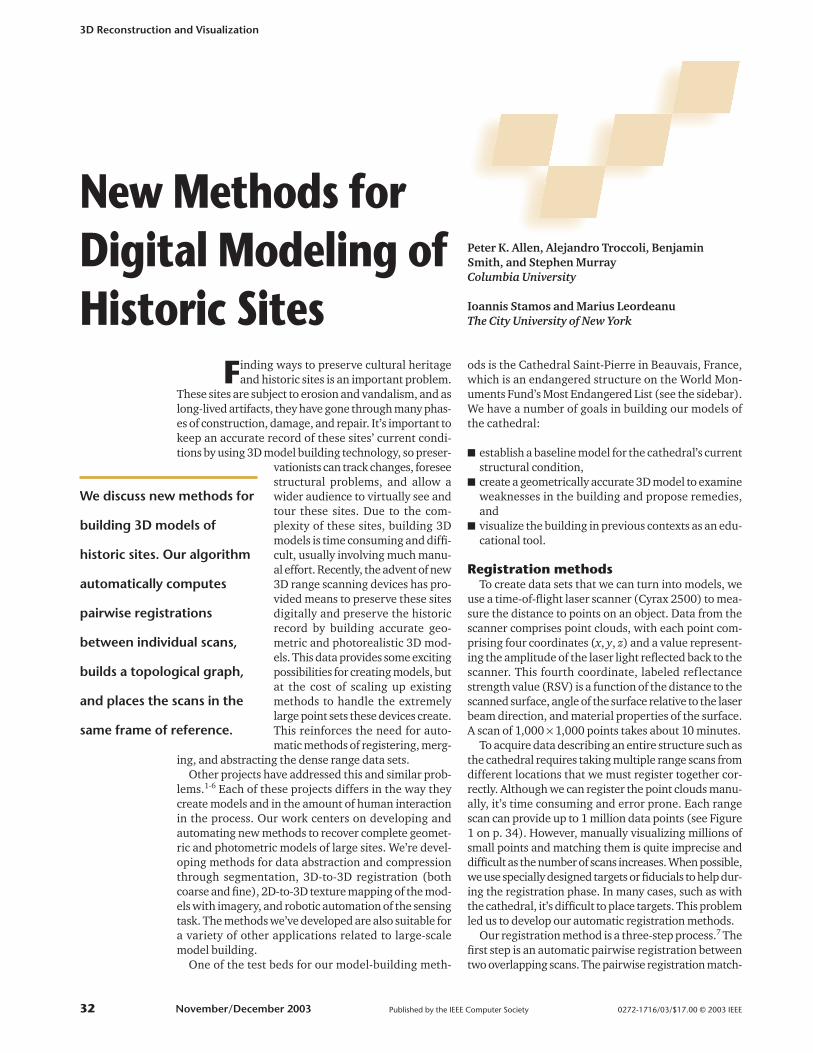
The Cathedral Saint-PierreThe Cathedral Saint-Pierre in Beauvais, France—
commissioned in 1225 by Bishop Milon deNanteuil—is an example of high Gothicarchitecture (see Figure A). Our team ofarchitectural historians, computer scientists, andengineers at Columbia University has begun tostudy the fragile structure of the tallest medievalcathedral in France. This cathedral collapsed twicein the Middle Ages and continues to poseproblems that threaten its long-term survival.
Although the cathedral survived the heavyincendiary bombing that destroyed much ofBeauvais during World War II, the structure is asdangerous as it is glorious, being at risk from flawsin its original design, compounded by differentialsettlement and with stresses placed on its flyingbuttresses from gale force winds off the EnglishChannel. The winds cause the buttresses tooscillate and have already weakened roof timbers.Between the 1950s and 1980s, numerous criticaliron ties were removed from the choir buttressesin a damaging experiment. A temporary tie-and-brace system installed in the 1990s may havemade the cathedral too rigid, increasing ratherthan decreasing stresses upon it. Althoughresearchers have intensively studied the cathedral,
there continues to be a lack of consensus on howto conserve the essential visual and structuralintegrity of this Gothic wonder.
With its five-aisled choir intersected by atowered transept and its great height (keystone152.5 feet above the pavement), the cathedralprovides an extreme expression of the Gothicenterprise. Only the magnificent choir andtransepts were completed; the area where thenave and facade would be is still occupied by theprevious church constructed just before 1000. Thechoir was completed by 1272, but in 1284 part ofthe central vault collapsed, necessitating extensivework of consolidation that continued until themid-14th century. Closed in with a wooden wall tothe west, the choir remained without a transept ornave until work resumed in 1499. Completed bythe mid-16th century, the transept was crownedby an ambitious central spire that allowed theGothic cathedral to rival its counterpart in Rome.The tower collapsed on Ascension Day in 1573.Repairs were completed rapidly, but soon after1600, attempts to complete the nave wereabandoned and the unfinished cathedral closedoff with the provisional west wall that hasremained until today.
(1) (2)
A Cathedral Saint-Pierre viewed from (1) the east and (2) the south.
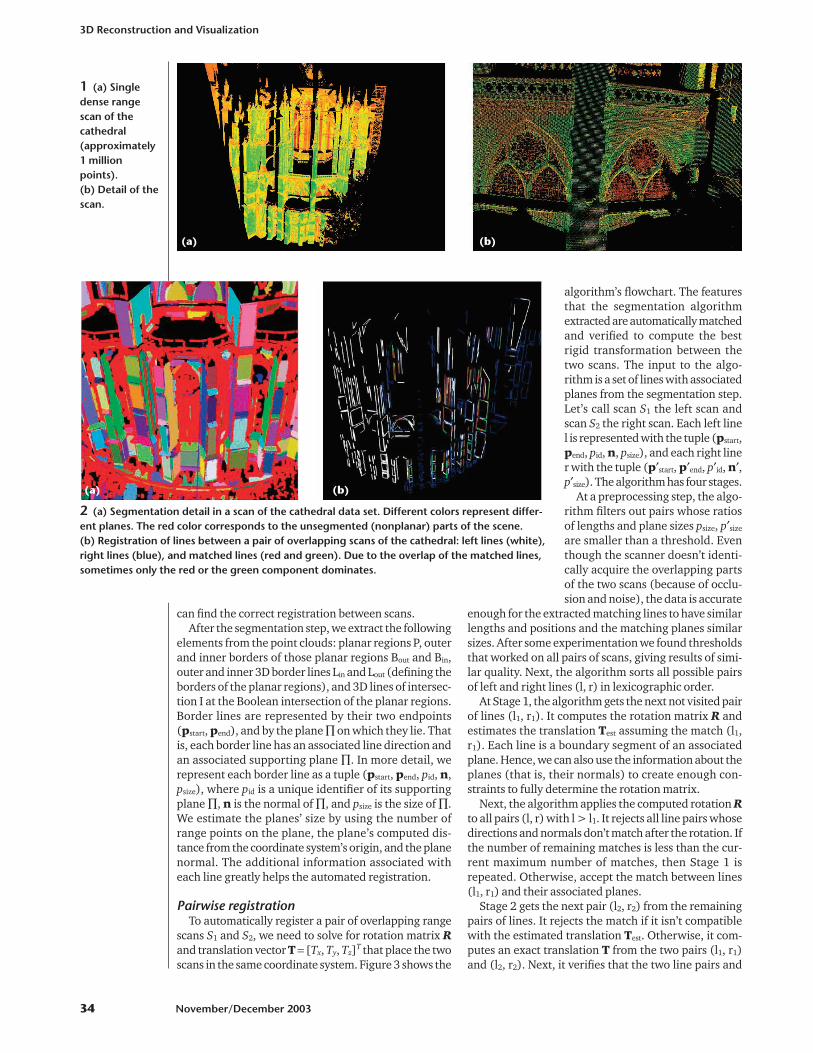
can find the correct registration between scans.After the segmentation step, we extract the following
elements from the point clouds: planar regions P, outerand inner borders of those planar regions Bout and Bin,outer and inner 3D border lines Lin and Lout (defining theborders of the planar regions), and 3D lines of intersec-tion I at the Boolean intersection of the planar regions.Border lines are represented by their two endpoints(pstart, pend), and by the plane ∏ on which they lie. Thatis, each border line has an associated line direction andan associated supporting plane ∏. In more detail, werepresent each border line as a tuple (pstart, pend, pid, n,psize), where pid is a unique identifier of its supportingplane ∏, n is the normal of ∏, and psize is the size of ∏.We estimate the planes’ size by using the number ofrange points on the plane, the plane’s computed dis-tance from the coordinate system’s origin, and the planenormal. The additional information associated witheach line greatly helps the automated registration.
Pairwise registrationTo automatically register a pair of overlapping range
scans S1 and S2, we need to solve for rotation matrix Rand translation vector T = [Tx, Ty, Tz]T that place the twoscans in the same coordinate system. Figure 3 shows the
algorithm’s flowchart. The featuresthat the segmentation algorithmextracted are automatically matchedand verified to compute the bestrigid transformation between thetwo scans. The input to the algo-rithm is a set of lines with associatedplanes from the segmentation step.Let’s call scan S1 the left scan andscan S2 the right scan. Each left linel is represented with the tuple (pstart,pend, pid, n, psize), and each right liner with the tuple (p′start, p′end, p′id, n′,p′size). The algorithm has four stages.
At a preprocessing step, the algo-rithm filters out pairs whose ratiosof lengths and plane sizes psize, p′size
are smaller than a threshold. Eventhough the scanner doesn’t identi-cally acquire the overlapping partsof the two scans (because of occlu-sion and noise), the data is accurate
enough for the extracted matching lines to have similarlengths and positions and the matching planes similarsizes. After some experimentation we found thresholdsthat worked on all pairs of scans, giving results of simi-lar quality. Next, the algorithm sorts all possible pairsof left and right lines (l, r) in lexicographic order.
At Stage 1, the algorithm gets the next not visited pairof lines (l1, r1). It computes the rotation matrix R andestimates the translation Test assuming the match (l1,r1). Each line is a boundary segment of an associatedplane. Hence, we can also use the information about theplanes (that is, their normals) to create enough con-straints to fully determine the rotation matrix.
Next, the algorithm applies the computed rotation Rto all pairs (l, r) with l > l1. It rejects all line pairs whosedirections and normals don’t match after the rotation. Ifthe number of remaining matches is less than the cur-rent maximum number of matches, then Stage 1 isrepeated. Otherwise, accept the match between lines(l1, r1) and their associated planes.
Stage 2 gets the next pair (l2, r2) from the remainingpairs of lines. It rejects the match if it isn’t compatiblewith the estimated translation Test. Otherwise, it com-putes an exact translation T from the two pairs (l1, r1)and (l2, r2). Next, it verifies that the two line pairs and
3D Reconstruction and Visualization
34 November/December 2003
1 (a) Singledense rangescan of thecathedral(approximately1 millionpoints). (b) Detail of thescan.
(a) (b)
2 (a) Segmentation detail in a scan of the cathedral data set. Different colors represent differ-ent planes. The red color corresponds to the unsegmented (nonplanar) parts of the scene. (b) Registration of lines between a pair of overlapping scans of the cathedral: left lines (white),right lines (blue), and matched lines (red and green). Due to the overlap of the matched lines,sometimes only the red or the green component dominates.
(a) (b)
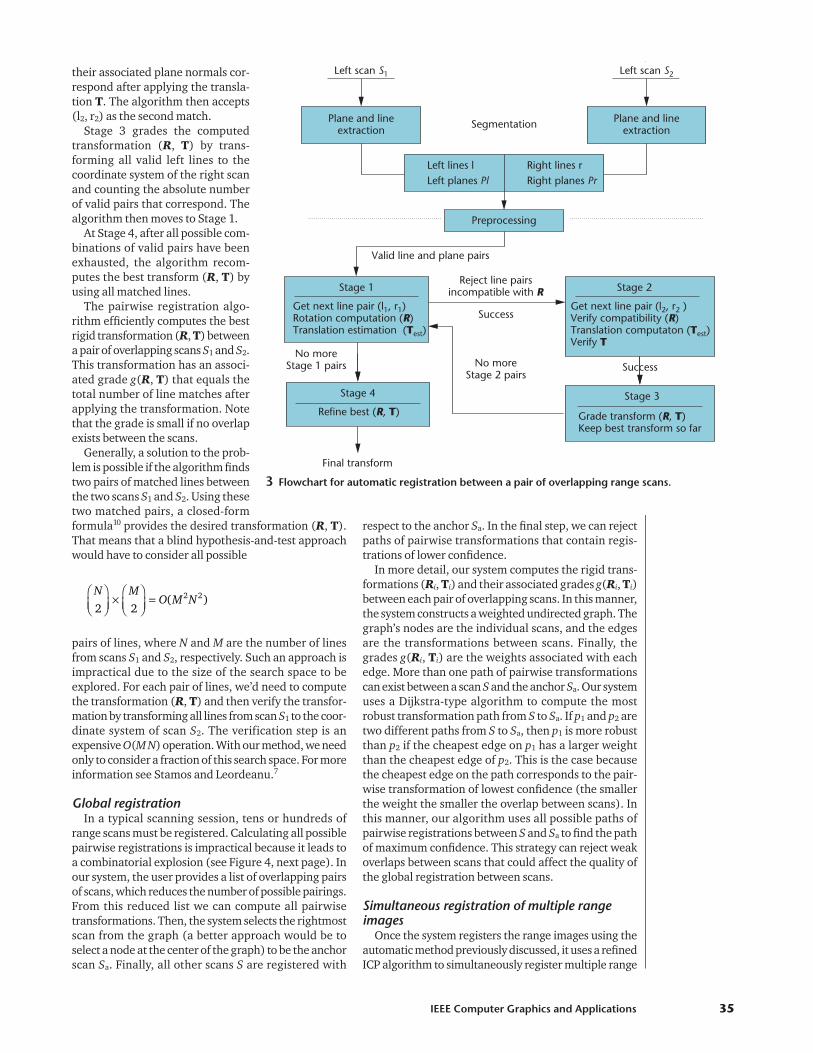
their associated plane normals cor-respond after applying the transla-tion T. The algorithm then accepts(l2, r2) as the second match.
Stage 3 grades the computedtransformation (R, T) by trans-forming all valid left lines to thecoordinate system of the right scanand counting the absolute numberof valid pairs that correspond. Thealgorithm then moves to Stage 1.
At Stage 4, after all possible com-binations of valid pairs have beenexhausted, the algorithm recom-putes the best transform (R, T) byusing all matched lines.
The pairwise registration algo-rithm efficiently computes the bestrigid transformation (R, T) betweena pair of overlapping scans S1 and S2.This transformation has an associ-ated grade g(R, T) that equals thetotal number of line matches afterapplying the transformation. Notethat the grade is small if no overlapexists between the scans.
Generally, a solution to the prob-lem is possible if the algorithm findstwo pairs of matched lines betweenthe two scans S1 and S2. Using thesetwo matched pairs, a closed-formformula10 provides the desired transformation (R, T).That means that a blind hypothesis-and-test approachwould have to consider all possible
pairs of lines, where N and M are the number of linesfrom scans S1 and S2, respectively. Such an approach isimpractical due to the size of the search space to beexplored. For each pair of lines, we’d need to computethe transformation (R, T) and then verify the transfor-mation by transforming all lines from scan S1 to the coor-dinate system of scan S2. The verification step is anexpensive O(M N) operation. With our method, we needonly to consider a fraction of this search space. For moreinformation see Stamos and Leordeanu.7
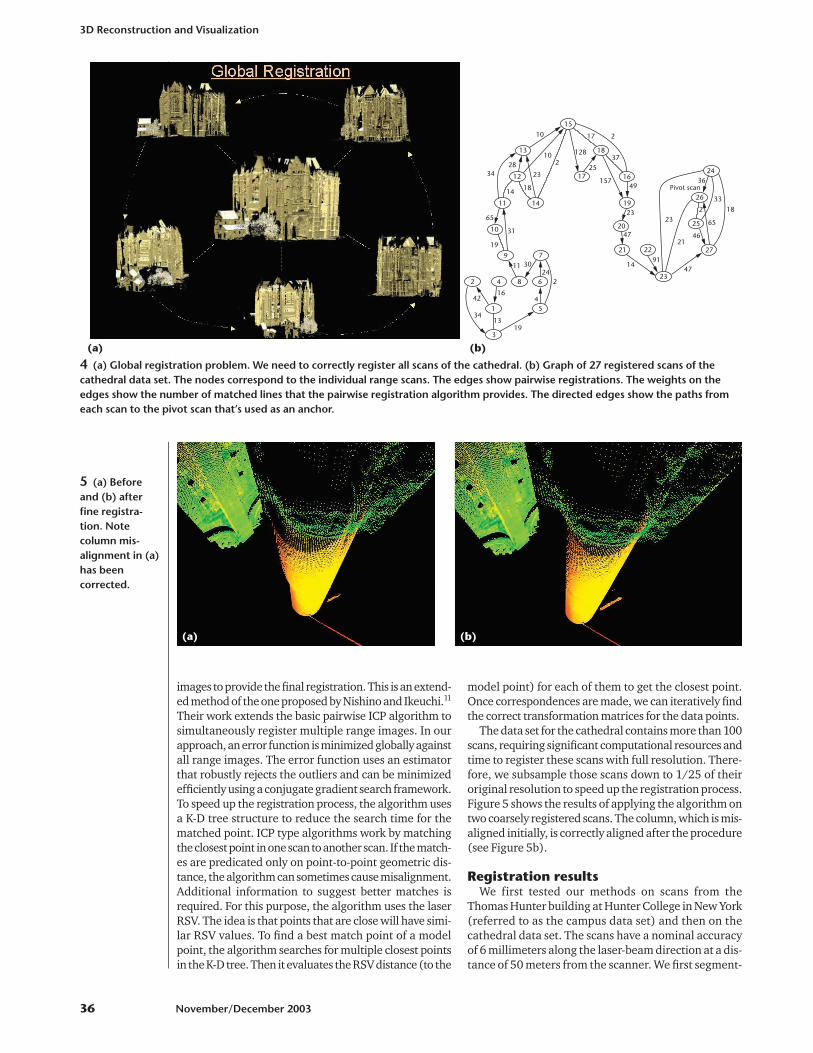
Global registrationIn a typical scanning session, tens or hundreds of
range scans must be registered. Calculating all possiblepairwise registrations is impractical because it leads toa combinatorial explosion (see Figure 4, next page). Inour system, the user provides a list of overlapping pairsof scans, which reduces the number of possible pairings.From this reduced list we can compute all pairwisetransformations. Then, the system selects the rightmostscan from the graph (a better approach would be toselect a node at the center of the graph) to be the anchorscan Sa. Finally, all other scans S are registered with
respect to the anchor Sa. In the final step, we can rejectpaths of pairwise transformations that contain regis-trations of lower confidence.
In more detail, our system computes the rigid trans-formations (Ri, Ti) and their associated grades g(Ri, Ti)between each pair of overlapping scans. In this manner,the system constructs a weighted undirected graph. Thegraph’s nodes are the individual scans, and the edgesare the transformations between scans. Finally, thegrades g(Ri, Ti) are the weights associated with eachedge. More than one path of pairwise transformationscan exist between a scan S and the anchor Sa. Our systemuses a Dijkstra-type algorithm to compute the mostrobust transformation path from S to Sa. If p1 and p2 aretwo different paths from S to Sa, then p1 is more robustthan p2 if the cheapest edge on p1 has a larger weightthan the cheapest edge of p2. This is the case becausethe cheapest edge on the path corresponds to the pair-wise transformation of lowest confidence (the smallerthe weight the smaller the overlap between scans). Inthis manner, our algorithm uses all possible paths ofpairwise registrations between S and Sa to find the pathof maximum confidence. This strategy can reject weakoverlaps between scans that could affect the quality ofthe global registration between scans.
Simultaneous registration of multiple rangeimages
Once the system registers the range images using theautomatic method previously discussed, it uses a refinedICP algorithm to simultaneously register multiple range
N MO M N
2 22 2
×
= ( )
IEEE Computer Graphics and Applications 35
Plane and lineextraction
Left lines l Right lines rLeft planes Pl Right planes Pr
Preprocessing
Left scan S1
Segmentation
Valid line and plane pairs
Get next line pair (l1, r1)Rotation computation (R)Translation estimation (Test)
Stage 1Reject line pairs
incompatible with R
Success
SuccessNo moreStage 2 pairs
No moreStage 1 pairs
Plane and lineextraction
Left scan S2
Grade transform (R, T)Keep best transform so far
Stage 3Refine best (R, T)
Stage 4
Get next line pair (l2, r2 )Verify compatibility (R)Translation computaton (Test)Verify T
Stage 2
Final transform
3 Flowchart for automatic registration between a pair of overlapping range scans.
images to provide the final registration. This is an extend-ed method of the one proposed by Nishino and Ikeuchi.11
Their work extends the basic pairwise ICP algorithm tosimultaneously register multiple range images. In ourapproach, an error function is minimized globally againstall range images. The error function uses an estimatorthat robustly rejects the outliers and can be minimizedefficiently using a conjugate gradient search framework.To speed up the registration process, the algorithm usesa K-D tree structure to reduce the search time for thematched point. ICP type algorithms work by matchingthe closest point in one scan to another scan. If the match-es are predicated only on point-to-point geometric dis-tance, the algorithm can sometimes cause misalignment.Additional information to suggest better matches isrequired. For this purpose, the algorithm uses the laserRSV. The idea is that points that are close will have simi-lar RSV values. To find a best match point of a modelpoint, the algorithm searches for multiple closest pointsin the K-D tree. Then it evaluates the RSV distance (to the
model point) for each of them to get the closest point.Once correspondences are made, we can iteratively findthe correct transformation matrices for the data points.
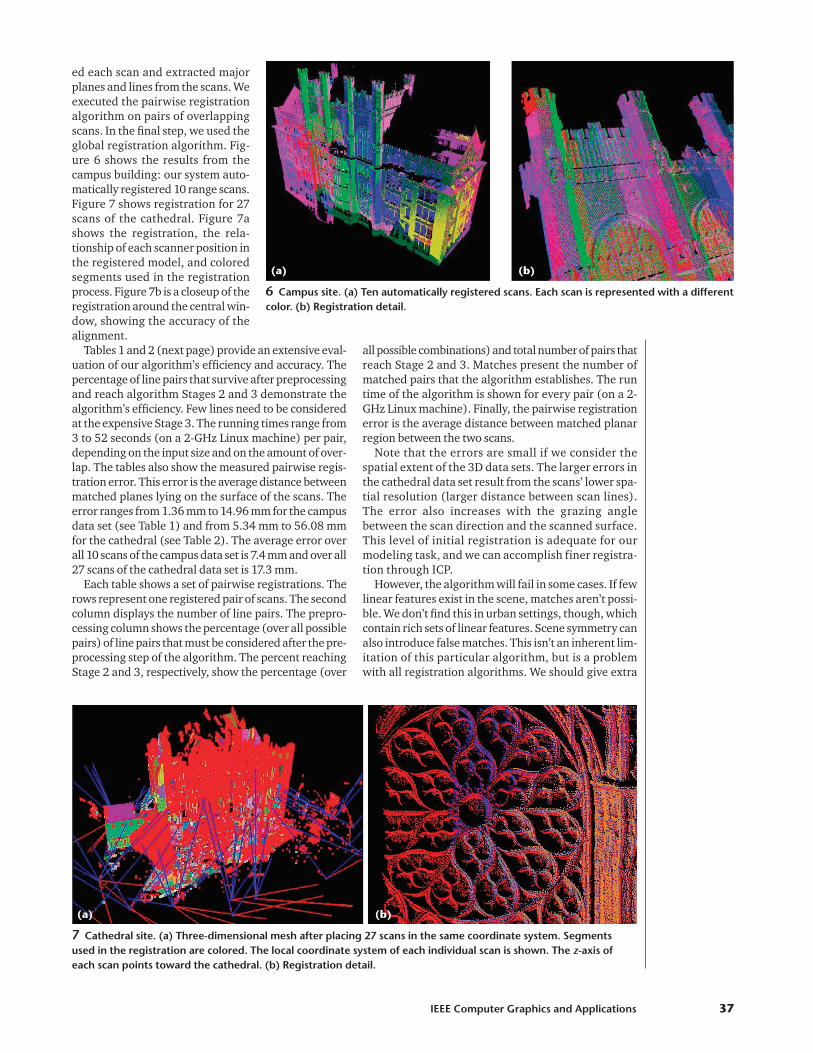
The data set for the cathedral contains more than 100scans, requiring significant computational resources andtime to register these scans with full resolution. There-fore, we subsample those scans down to 1/25 of theiroriginal resolution to speed up the registration process.Figure 5 shows the results of applying the algorithm ontwo coarsely registered scans. The column, which is mis-aligned initially, is correctly aligned after the procedure(see Figure 5b).
Registration resultsWe first tested our methods on scans from the
Thomas Hunter building at Hunter College in New York(referred to as the campus data set) and then on thecathedral data set. The scans have a nominal accuracyof 6 millimeters along the laser-beam direction at a dis-tance of 50 meters from the scanner. We first segment-
3D Reconstruction and Visualization
36 November/December 2003
26Pivot scan
1
3
13
4
16
5
6
7
224
8
9
10
11
12
14
14
18
13
15
2
16
2
17
18
17
19
49
37
10
34
31
11
442
21
23
22
24
25
27
20
34
19
30
19
65
47
1447
2
2823
10 128
25
157
23
91
23
2146
65
36
33
18
2
(a) (b)
4 (a) Global registration problem. We need to correctly register all scans of the cathedral. (b) Graph of 27 registered scans of thecathedral data set. The nodes correspond to the individual range scans. The edges show pairwise registrations. The weights on theedges show the number of matched lines that the pairwise registration algorithm provides. The directed edges show the paths fromeach scan to the pivot scan that’s used as an anchor.
(a) (b)
5 (a) Beforeand (b) afterfine registra-tion. Notecolumn mis-alignment in (a)has beencorrected.
ed each scan and extracted majorplanes and lines from the scans. Weexecuted the pairwise registrationalgorithm on pairs of overlappingscans. In the final step, we used theglobal registration algorithm. Fig-ure 6 shows the results from thecampus building: our system auto-matically registered 10 range scans.Figure 7 shows registration for 27scans of the cathedral. Figure 7ashows the registration, the rela-tionship of each scanner position inthe registered model, and coloredsegments used in the registrationprocess. Figure 7b is a closeup of theregistration around the central win-dow, showing the accuracy of thealignment.
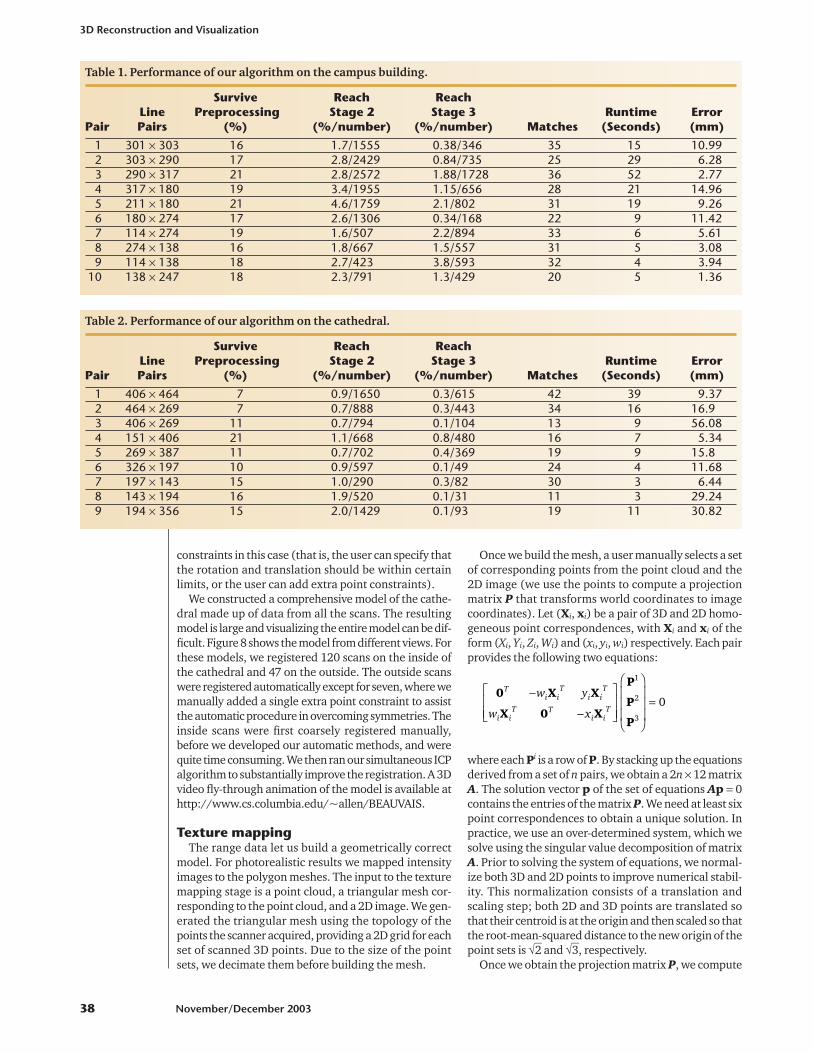
Tables 1 and 2 (next page) provide an extensive eval-uation of our algorithm’s efficiency and accuracy. Thepercentage of line pairs that survive after preprocessingand reach algorithm Stages 2 and 3 demonstrate thealgorithm’s efficiency. Few lines need to be consideredat the expensive Stage 3. The running times range from3 to 52 seconds (on a 2-GHz Linux machine) per pair,depending on the input size and on the amount of over-lap. The tables also show the measured pairwise regis-tration error. This error is the average distance betweenmatched planes lying on the surface of the scans. Theerror ranges from 1.36 mm to 14.96 mm for the campusdata set (see Table 1) and from 5.34 mm to 56.08 mmfor the cathedral (see Table 2). The average error overall 10 scans of the campus data set is 7.4 mm and over all27 scans of the cathedral data set is 17.3 mm.
Each table shows a set of pairwise registrations. Therows represent one registered pair of scans. The secondcolumn displays the number of line pairs. The prepro-cessing column shows the percentage (over all possiblepairs) of line pairs that must be considered after the pre-processing step of the algorithm. The percent reachingStage 2 and 3, respectively, show the percentage (over
all possible combinations) and total number of pairs thatreach Stage 2 and 3. Matches present the number ofmatched pairs that the algorithm establishes. The runtime of the algorithm is shown for every pair (on a 2-GHz Linux machine). Finally, the pairwise registrationerror is the average distance between matched planarregion between the two scans.
Note that the errors are small if we consider thespatial extent of the 3D data sets. The larger errors inthe cathedral data set result from the scans’ lower spa-tial resolution (larger distance between scan lines).The error also increases with the grazing anglebetween the scan direction and the scanned surface.This level of initial registration is adequate for ourmodeling task, and we can accomplish finer registra-tion through ICP.
However, the algorithm will fail in some cases. If fewlinear features exist in the scene, matches aren’t possi-ble. We don’t find this in urban settings, though, whichcontain rich sets of linear features. Scene symmetry canalso introduce false matches. This isn’t an inherent lim-itation of this particular algorithm, but is a problemwith all registration algorithms. We should give extra
IEEE Computer Graphics and Applications 37
6 Campus site. (a) Ten automatically registered scans. Each scan is represented with a differentcolor. (b) Registration detail.
(a) (b)
(a) (b)
7 Cathedral site. (a) Three-dimensional mesh after placing 27 scans in the same coordinate system. Segmentsused in the registration are colored. The local coordinate system of each individual scan is shown. The z-axis ofeach scan points toward the cathedral. (b) Registration detail.
constraints in this case (that is, the user can specify thatthe rotation and translation should be within certainlimits, or the user can add extra point constraints).
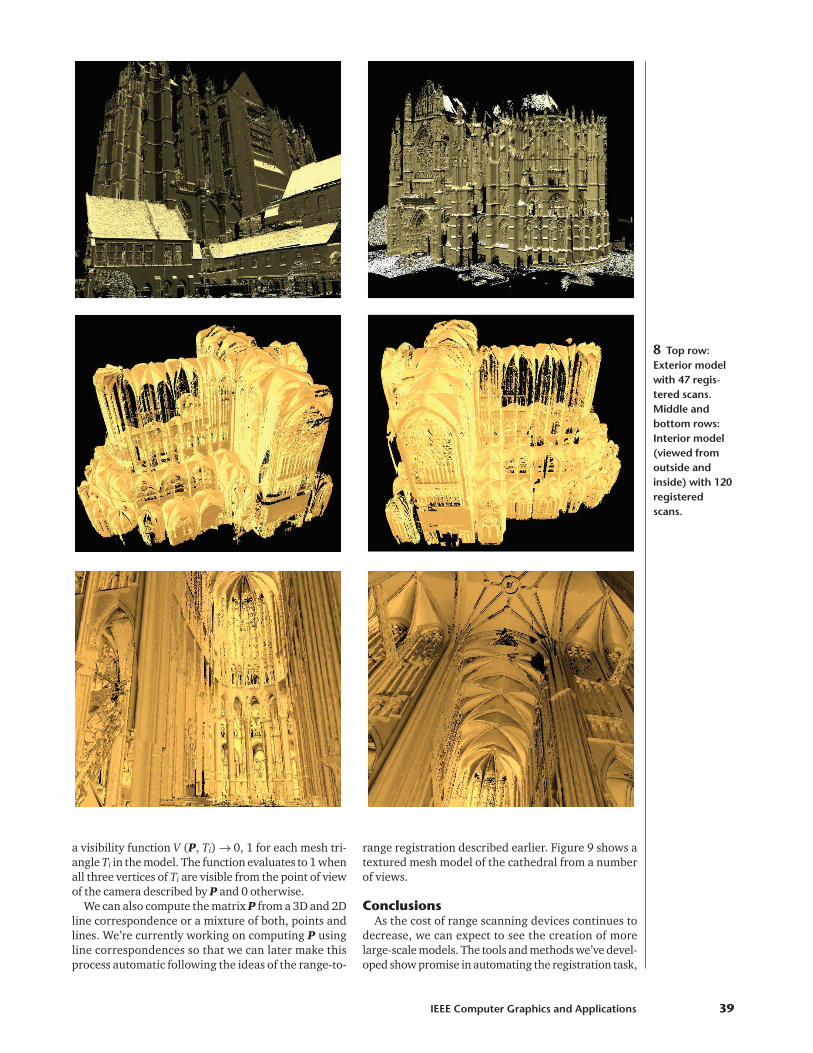
We constructed a comprehensive model of the cathe-dral made up of data from all the scans. The resultingmodel is large and visualizing the entire model can be dif-ficult. Figure 8 shows the model from different views. Forthese models, we registered 120 scans on the inside ofthe cathedral and 47 on the outside. The outside scanswere registered automatically except for seven, where wemanually added a single extra point constraint to assistthe automatic procedure in overcoming symmetries. Theinside scans were first coarsely registered manually,before we developed our automatic methods, and werequite time consuming. We then ran our simultaneous ICPalgorithm to substantially improve the registration. A 3Dvideo fly-through animation of the model is available athttp://www.cs.columbia.edu/~allen/BEAUVAIS.
Texture mappingThe range data let us build a geometrically correct
model. For photorealistic results we mapped intensityimages to the polygon meshes. The input to the texturemapping stage is a point cloud, a triangular mesh cor-responding to the point cloud, and a 2D image. We gen-erated the triangular mesh using the topology of thepoints the scanner acquired, providing a 2D grid for eachset of scanned 3D points. Due to the size of the pointsets, we decimate them before building the mesh.
Once we build the mesh, a user manually selects a setof corresponding points from the point cloud and the2D image (we use the points to compute a projectionmatrix P that transforms world coordinates to imagecoordinates). Let (Xi, xi) be a pair of 3D and 2D homo-geneous point correspondences, with Xi and xi of theform (Xi, Yi, Zi, Wi) and (xi, yi, wi) respectively. Each pairprovides the following two equations:
where each Pi is a row of P. By stacking up the equationsderived from a set of n pairs, we obtain a 2n × 12 matrixA. The solution vector p of the set of equations Ap = 0contains the entries of the matrix P. We need at least sixpoint correspondences to obtain a unique solution. Inpractice, we use an over-determined system, which wesolve using the singular value decomposition of matrixA. Prior to solving the system of equations, we normal-ize both 3D and 2D points to improve numerical stabil-ity. This normalization consists of a translation andscaling step; both 2D and 3D points are translated sothat their centroid is at the origin and then scaled so thatthe root-mean-squared distance to the new origin of thepoint sets is √2 and √3, respectively.
Once we obtain the projection matrix P, we compute
0 X X
X 0 X
P
P
P
Ti i
Ti i
T
i iT T
i iT
w y
w x
−
−
=
1
2
3
0
3D Reconstruction and Visualization
38 November/December 2003
Table 2. Performance of our algorithm on the cathedral.
Survive Reach Reach Line Preprocessing Stage 2 Stage 3 Runtime Error
Pair Pairs (%) (%/number) (%/number) Matches (Seconds) (mm)
1 406 × 464 7 0.9/1650 0.3/615 42 39 9.372 464 × 269 7 0.7/888 0.3/443 34 16 16.9 3 406 × 269 11 0.7/794 0.1/104 13 9 56.08 4 151 × 406 21 1.1/668 0.8/480 16 7 5.345 269 × 387 11 0.7/702 0.4/369 19 9 15.86 326 × 197 10 0.9/597 0.1/49 24 4 11.687 197 × 143 15 1.0/290 0.3/82 30 3 6.448 143 × 194 16 1.9/520 0.1/31 11 3 29.249 194 × 356 15 2.0/1429 0.1/93 19 11 30.82
Table 1. Performance of our algorithm on the campus building.
Survive Reach Reach Line Preprocessing Stage 2 Stage 3 Runtime Error
Pair Pairs (%) (%/number) (%/number) Matches (Seconds) (mm)
1 301 × 303 16 1.7/1555 0.38/346 35 15 10.992 303 × 290 17 2.8/2429 0.84/735 25 29 6.283 290 × 317 21 2.8/2572 1.88/1728 36 52 2.774 317 × 180 19 3.4/1955 1.15/656 28 21 14.965 211 × 180 21 4.6/1759 2.1/802 31 19 9.266 180 × 274 17 2.6/1306 0.34/168 22 9 11.427 114 × 274 19 1.6/507 2.2/894 33 6 5.61 8 274 × 138 16 1.8/667 1.5/557 31 5 3.08 9 114 × 138 18 2.7/423 3.8/593 32 4 3.94
10 138 × 247 18 2.3/791 1.3/429 20 5 1.36
a visibility function V (P, Ti) → 0, 1 for each mesh tri-angle Ti in the model. The function evaluates to 1 whenall three vertices of Ti are visible from the point of viewof the camera described by P and 0 otherwise.
We can also compute the matrix P from a 3D and 2Dline correspondence or a mixture of both, points andlines. We’re currently working on computing P usingline correspondences so that we can later make thisprocess automatic following the ideas of the range-to-
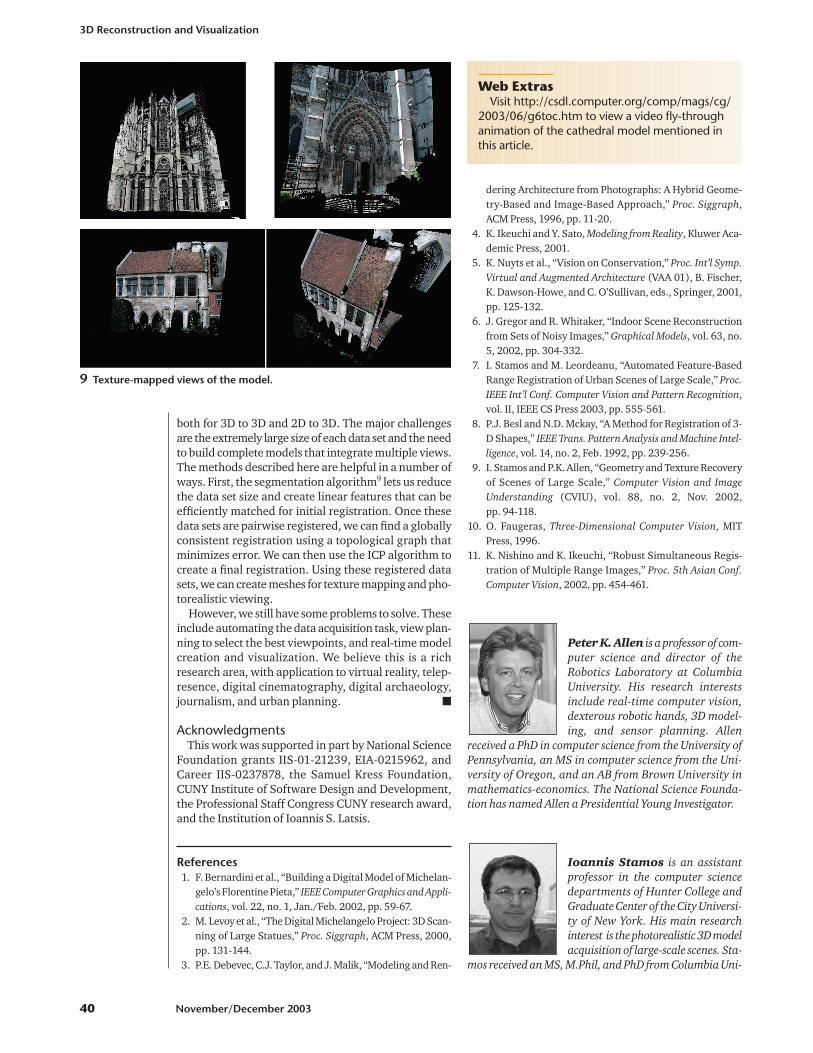
range registration described earlier. Figure 9 shows atextured mesh model of the cathedral from a numberof views.
ConclusionsAs the cost of range scanning devices continues to
decrease, we can expect to see the creation of morelarge-scale models. The tools and methods we’ve devel-oped show promise in automating the registration task,
IEEE Computer Graphics and Applications 39
8 Top row:Exterior modelwith 47 regis-tered scans.Middle andbottom rows:Interior model(viewed fromoutside andinside) with 120registeredscans.
both for 3D to 3D and 2D to 3D. The major challengesare the extremely large size of each data set and the needto build complete models that integrate multiple views.The methods described here are helpful in a number ofways. First, the segmentation algorithm9 lets us reducethe data set size and create linear features that can beefficiently matched for initial registration. Once thesedata sets are pairwise registered, we can find a globallyconsistent registration using a topological graph thatminimizes error. We can then use the ICP algorithm tocreate a final registration. Using these registered datasets, we can create meshes for texture mapping and pho-torealistic viewing.
However, we still have some problems to solve. Theseinclude automating the data acquisition task, view plan-ning to select the best viewpoints, and real-time modelcreation and visualization. We believe this is a richresearch area, with application to virtual reality, telep-resence, digital cinematography, digital archaeology,journalism, and urban planning. �
AcknowledgmentsThis work was supported in part by National Science
Foundation grants IIS-01-21239, EIA-0215962, andCareer IIS-0237878, the Samuel Kress Foundation,CUNY Institute of Software Design and Development,the Professional Staff Congress CUNY research award,and the Institution of Ioannis S. Latsis.
References1. F. Bernardini et al., “Building a Digital Model of Michelan-
gelo’s Florentine Pieta,” IEEE Computer Graphics and Appli-cations, vol. 22, no. 1, Jan./Feb. 2002, pp. 59-67.
2. M. Levoy et al., “The Digital Michelangelo Project: 3D Scan-ning of Large Statues,” Proc. Siggraph, ACM Press, 2000,pp. 131-144.
3. P.E. Debevec, C.J. Taylor, and J. Malik, “Modeling and Ren-
dering Architecture from Photographs: A Hybrid Geome-try-Based and Image-Based Approach,” Proc. Siggraph,ACM Press, 1996, pp. 11-20.
4. K. Ikeuchi and Y. Sato, Modeling from Reality, Kluwer Aca-demic Press, 2001.
5. K. Nuyts et al., “Vision on Conservation,” Proc. Int’l Symp.Virtual and Augmented Architecture (VAA 01), B. Fischer,K. Dawson-Howe, and C. O’Sullivan, eds., Springer, 2001,pp. 125-132.
6. J. Gregor and R. Whitaker, “Indoor Scene Reconstructionfrom Sets of Noisy Images,” Graphical Models, vol. 63, no.5, 2002, pp. 304-332.
7. I. Stamos and M. Leordeanu, “Automated Feature-BasedRange Registration of Urban Scenes of Large Scale,” Proc.IEEE Int’l Conf. Computer Vision and Pattern Recognition,vol. II, IEEE CS Press 2003, pp. 555-561.
8. P.J. Besl and N.D. Mckay, “A Method for Registration of 3-D Shapes,” IEEE Trans. Pattern Analysis and Machine Intel-ligence, vol. 14, no. 2, Feb. 1992, pp. 239-256.
9. I. Stamos and P.K. Allen, “Geometry and Texture Recoveryof Scenes of Large Scale,” Computer Vision and ImageUnderstanding (CVIU), vol. 88, no. 2, Nov. 2002, pp. 94-118.
10. O. Faugeras, Three-Dimensional Computer Vision, MITPress, 1996.
11. K. Nishino and K. Ikeuchi, “Robust Simultaneous Regis-tration of Multiple Range Images,” Proc. 5th Asian Conf.Computer Vision, 2002, pp. 454-461.
Peter K. Allen is a professor of com-puter science and director of theRobotics Laboratory at ColumbiaUniversity. His research interestsinclude real-time computer vision,dexterous robotic hands, 3D model-ing, and sensor planning. Allen
received a PhD in computer science from the University ofPennsylvania, an MS in computer science from the Uni-versity of Oregon, and an AB from Brown University inmathematics-economics. The National Science Founda-tion has named Allen a Presidential Young Investigator.
Ioannis Stamos is an assistantprofessor in the computer sciencedepartments of Hunter College andGraduate Center of the City Universi-ty of New York. His main researchinterest is the photorealistic 3D modelacquisition of large-scale scenes. Sta-
mos received an MS, M.Phil, and PhD from Columbia Uni-
3D Reconstruction and Visualization
40 November/December 2003
9 Texture-mapped views of the model.
Web ExtrasVisit http://csdl.computer.org/comp/mags/cg/
2003/06/g6toc.htm to view a video fly-throughanimation of the cathedral model mentioned inthis article.
versity in computer science, and a Diploma of Engineeringfrom the University of Patras, Greece in computer engi-neering and informatics. He is a recipient of the FacultyEarly Career Development Award from the National Sci-ence Foundation.
Alejandro Troccoli is a PhD stu-dent in the computer science depart-ment at Columbia University. Hisresearch interests include 3D model-ing, computer vision, and computergraphics. Troccoli received a BS and aLicentiate degree (MS) in computer
science from the Universidad de Buenos Aires, Argentina.
Benjamin Smith is a master’s stu-dent in the computer science depart-ment at Columbia University. Hisresearch interests include 3D model-ing, editing, and visualization.Smith received a BS in computer sci-ence from Columbia University.
For further information on this or any other computingtopic, please visit our Digital Library at http://computer.org/publications/dlib.
Marius Leordeanu is a PhD stu-dent at the Robotics Institute ofCarnegie Mellon University. Hisresearch interests include computervision and graphics and artificialintelligence. Leordeanu received a BAin computer science and mathemat-
ics from Hunter College, New York.
Stephen Murray is director of theMedia Center for Art History,Archaeology, and Historic Preserva-tion at Columbia University. Hisresearch interests include medievalsermons, storytelling in Gothic, andthe Romanesque architecture of the
Bourbonnais. He is currently engaged in projecting hiscathedral studies through the electronic media using acombination of 3D simulation, digital imaging, and video.Murray was educated at Oxford and the Courtauld Insti-tute of Art, University of London, where he received a PhDin art history.
Readers may contact Peter Allen at the Dept. of Com-puter Science, Columbia Univ., 500 W. 120th St., NewYork, NY 10027; [email protected].
IEEE Computer Graphics and Applications 41
Get accessto individual IEEE Computer Society
documents online.
More than 67,000 articles and conference papers
available!
$9US per article for members
$19US for nonmembers
http://computer.org/publications/dlib