Embed Size (px)
Citation preview

New Medium-term Management Plan
April 1, 2012 to March 31, 2015
May 15, 2012TAIYO YUDEN CO., LTD.

1
Consolidated Performance for the Year Ended March 31, 2012
Review of the Previous Medium-term Management Plan
Structural Improvement Measures

2
Year ended March 31, 2012(01 Apr 2011 – 31 Mar 2012)
Increase(Decrease)
Unit: Millions of yenForecast
[as of Dec 26, 2011]Actual Amount %
Net sales 189,000 183,795 (5,205) (2.8)
Operating income (7,000) (8,010) (1,010) -
Ordinary income (10,000) (9,070) 930 -
Net income (19,200) (21,599) (2,399) -
Net sales: Sales fell amid stagnant demand for TVs, PCs and LCD panels, despite firm demand for smartphones
Net income: ¥21.5 billion loss mainly attributed to the following factors- Business structure improvement expenses ¥4.2 billion; Special extra
retirement payment for solicitation of voluntary retirement, etc- Income taxes- deferred ¥5.8 billion; Reversal of deferred tax assets, etc
Consolidated Performancefor the year ended March 31, 2012

( 20 ) ( 15 ) ( 1 0 ) ( 5 ) 0 5 1 0 15 20 25
Actu al
Com m u n ication d evices
Op tical m ed ia
Bu sin ess stru ctu re im p rovem en t
D ifferen ce in u n it p r ice
Loss on d isasters
Loss on foreig n exch an g e
Previou s m ed iu m -term m an ag em en t p lan
0
50
100
150
200
250
Previou s m edium -term
m anag em en t p lan
Actual
3
Year ended March 31, 2012
Capacitors Ferrite and applied products Modules
Optical media products Other electronic components + Others
Operating incomeBillions of yen
¥95 →¥79
・Great East Japan Earthquake・Floods in Thailand
Net sales Billions of yen
Previous Medium-term Management Plan ¥230.0 billion ¥20 billion
Actual ¥183.7 billion ¥(8) billion
Net sales Operating income
Review of the Previous Medium-term Management Plan
Negative Factors: Impact from yen appreciation, disasters and difference in unit price as well as downturn in optical media
Positive Factors: Gains in communication devices

4
Structural improvement measures (announced 10 Nov 2011)
Progress update
Structural reform・Optimal use of overseas sites(overseas production rate: 53%→70%)
・Withdrawal from unprofitable products・Restructuring of domestic and overseas sites and personnel reductions
・Full-scale shift of capacitor and inductor production overseas set tobegin in the first half of the year ending March 31, 2013・Eliminate all unprofitable products by the end of the year ending March 31, 2013 (plans already drawn up)・Implementing staff downsizing at TAIYO YUDEN and its consolidated subsidiaries in Japan and overseas
Restriction of capital investment(¥15 billion forecast for next FY)
・¥18.5 billion in capital investments for the year ending March 31, 2013(¥8.2 billion less than the previous fiscal year) ・Keep capital investments less than depreciation expenses during the implementation period of the new medium-term management planReduction of SG&A and other
expenses・Expect to reduce by ¥1.8 billion for the year ending March 31, 2013 (compared to the year ended March 31, 2012)・Implemented organizational changes to reform purchasing and logistics systems
Lowering of currency exchange rate influence (40% reduction)
・Reduced by 27% at the time the performance forecast is drafted
Reduction of fixed costs: ¥10 billion / year
Structural Improvement Measures for Returning Operating Income to the Black and Progress Update
Structural reforms progressing according to plan

5
New Medium-term Management PlanApril 1, 2012 to March 31, 2015

1 5 2 , 0 5 71 5 3 , 7 2 1 1 6 3 , 3 2 8
1 7 2 , 2 5 6
1 8 6 , 5 3 9
2 2 1 , 2 3 0
2 3 8 , 2 7 5
1 8 5 , 4 5 31 9 5 , 6 9 1
2 1 0 , 4 0 2
1 8 3 , 7 9 5
2 1 0 , 0 0 0
2 3 0 , 0 0 0
2 5 0 , 0 0 0
6 , 1 9 08 , 1 6 9
1 0 ,9 8 8
2 ,0 5 5
6 , 6 9 2
2 2 , 0 1 8 2 1 , 3 0 4
( 1 2 , 7 5 6 )
4 , 2 0 4
8 , 7 9 2
( 8 , 0 1 0 )
1 0 , 0 0 0
1 5 ,0 0 0
2 0 , 0 0 0
-2 0 , 0 0 0
-1 0 , 0 0 0
0
1 0 , 0 0 0
2 0 , 0 0 0
3 0 , 0 0 0
4 0 , 0 0 0
0
5 0 , 0 0 0
1 0 0 , 0 0 0
1 5 0 , 0 0 0
2 0 0 , 0 0 0
2 5 0 , 0 0 0
3 0 0 , 0 0 0
Year en d ed
Mar 2 0 0 2
Year en d ed
Mar 2 0 0 3
Year en d ed
Mar 2 0 0 4
Year en d ed
Mar 2 0 0 5
Year en d ed
Mar 2 0 0 6
Year en d ed
Mar 2 0 0 7
Year en d ed
Mar 2 0 0 8
Year en d ed
Mar 2 0 0 9
Year en d ed
Mar 2 0 1 0
Year en d ed
Mar 2 0 1 1
Year en d ed
Mar 2 0 1 2
Year en d in g
Mar 2 0 1 3
Year en d in g
Mar 2 0 1 4
Year en d in g
Mar 2 0 1 5
Net sa les Operating incom e 6
Year ending March 2015Net sales ¥250,000 million, Operating income ¥20,000 million, ROE8%
Year ending March 2016Positive net cash position (positive CF for each FY to improve financial indicators)
Net sales (Millions of yen )
・Lehman Brothers bankruptcy
・Structural reforms in the Optical media products business
・Great East Japan Earthquake・Floods in Thailand
Operating income (Millions of yen )
New Medium-term Management Plan:Management Targets
・Collapse of IT Bubble

1 5 %
2 5 %
2 %
9 %4 %
4 5 %
4 0 %
1 6 %
3 %
6 %5 %
3 0 %82.8
100
( + 21% )
27 . 9
40
( + 4 3 % )
46 . 1
75
( + 6 3 % )4 . 1
7. 5
16. 2
15
6. 8
12. 5
0. 0
50. 0
100. 0
150. 0
200. 0
250. 0
300. 0
Year ended March 2012 Year ending March 2015
Others
Op tical m ed ia p roducts
Other electron ic com ponen ts
In teg rated m odu les & d evices
Ferr ite and app lied p roducts
Capacito rs
7
Net Sales by Product Category
Year ended March 2015
Year ended March 2012
¥183.7 billion
¥250 billion
Establish balanced business structure
(Billions of yen)

8
Valu
e of
dem
and
Industrial equipment Automotive Environmental energy Healthcare
Market (Devices) (*) Field Application Engineer
Raise visibility/ presence in markets
Strategies aiming at earnings growth☆Launch super hi-end line up☆System solutions☆Expand sales channels
MarginMargin
AllianceM&A
High growth markets・smartphone・tablet PC
•Concentrate sales•Bolster FAE(*)
Main sales markets in the past
Capture top market share by rolling out super high-end products •Roll out high-value
products•System solutions
•Rep sales•Expand number of distributors (E-commerce)
Market Strategy

5 %1 5 %
22%
20%
30%
22%
0%
20%
40%
60%
80%
100%
Year ended
March 2012
Year ending
March 2015
Com ponen ts
Com m un ication equ ipm en t
In fo rm ation equ ipm ent
Consum er p roducts
Au tom otive, I n dustr ial
equ ipm en t and Healthcare
9
Ratio of Net Sales by Equipment
Break free of dependence on existing markets
Grow sales in new markets

0
2 0 0
4 0 0
6 0 0
8 0 0
1 , 0 0 0
1 , 2 0 0
20
07
20
08
20
09
20
10
20
11
20
12
20
13
20
14
20
15
20
16
10
Roll out super high-end products for the high growth smartphone marketIncrease number of main clients using these products/ Augment production capacity
Expansion of super high-end products
Multilayer ceramic capacitors
High-frequency multilayer chip inductorsMultilayer chip beadsExpand lineup into EIA01005 size (0.4×0.2×0.2 mm)
Embedded-parts multilayer wiring substrate EOMIN®Expansion into FEM
SAW filters, Duplexers and FEMExpansion of production capacity to meet growing demand
Strengthen Real Time Clock backup applications
Ceramic type polyacene capacitors
Smartphone
LCD TV
DSC
HDD
Feature phone
PC(incl. tablet PC)
Commercialize “MCOIL®”using metallic new material
Compact large-current power inductors
TAIYO YUDEN calculation
Growth Strategies~toward the growing smartphone market~
(number) 3G feature Smartphone
MLCC 300~400 400~600
Power L 8~10 15~20
SAW・Dup 4~6 6~8
High-frequency L 20~40 40~60
Beads 15~25 30~40
Kit@ index Using 1 Greater than 1.5x
Production Volume (millions of units)
TAIYO YUDEN forecast
11
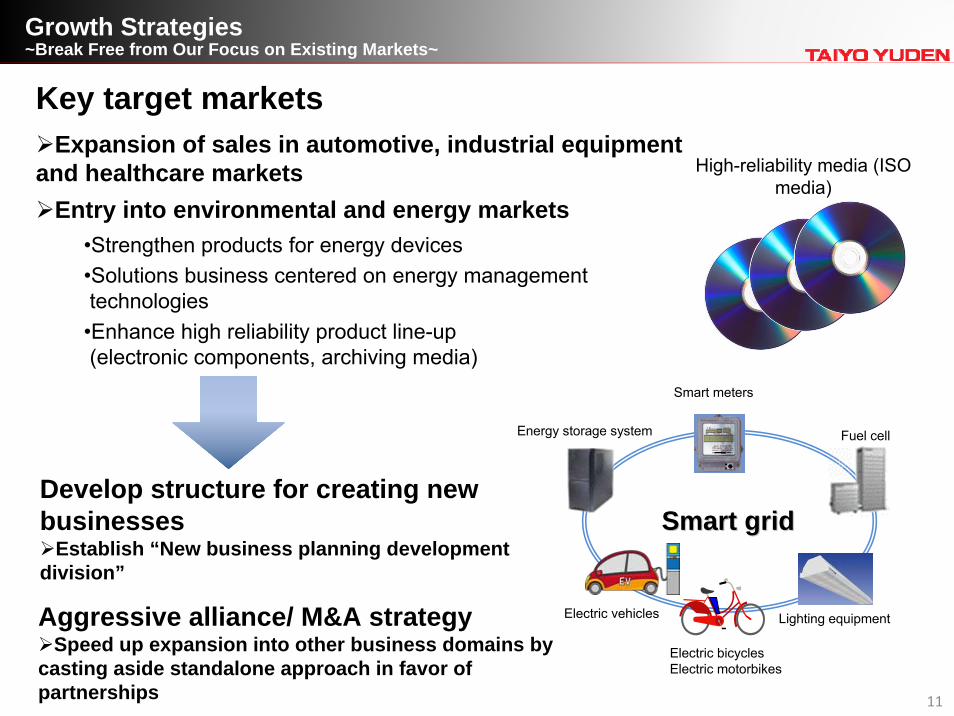
Key target marketsExpansion of sales in automotive, industrial equipment
and healthcare marketsEntry into environmental and energy markets
•Strengthen products for energy devices•Solutions business centered on energy management technologies
•Enhance high reliability product line-up(electronic components, archiving media)
Develop structure for creating new businesses
Establish “New business planning development division”
Smart gridSmart grid
Lighting equipment
Fuel cellEnergy storage system
Electric bicyclesElectric motorbikes
Electric vehicles
Smart meters
High-reliability media (ISO media)
Growth Strategies~Break Free from Our Focus on Existing Markets~
Aggressive alliance/ M&A strategySpeed up expansion into other business domains by
casting aside standalone approach in favor of partnerships

0%
10%
20%
30%
40%
70
80
90
100
110
Year ended
March 2012
Year ending
March 2013
Year end ing
March 2014
Year ending
March 2015
Sa les of capacitors Super h ig h-end p roduct sales ratio
12
Firmly maintain major share of the super high-end marketExpand in high-quality markets (automotive, industrial equipment and healthcare)Enhance production efficiency through maximum use of overseas production
CapacitorsOperating profit margin:
Greater than 10%
CapacitorsOperating profit margin:
Greater than 10%
~1000 Super High-End
~100 High-End SuperHigh-End
~10 High-End SuperHigh-End
~1uF High-End
SuperHigh-End
EIA (JIS)
1210 (3225)
1206 (3216)
0805 (2012)
0603 (1608)
0402 (1005)
0201 (0603)
01005 (0402)
Ratio of super high-end product sales
Worldwide product rollout
Korea
Niigata, Japan
Gunma HQ, Japan
ChinaMalaysia
Product Rollouts~Super High-end MLCC~
Capture top market share of over 50% for super high-end products
(Billions of yen)
13
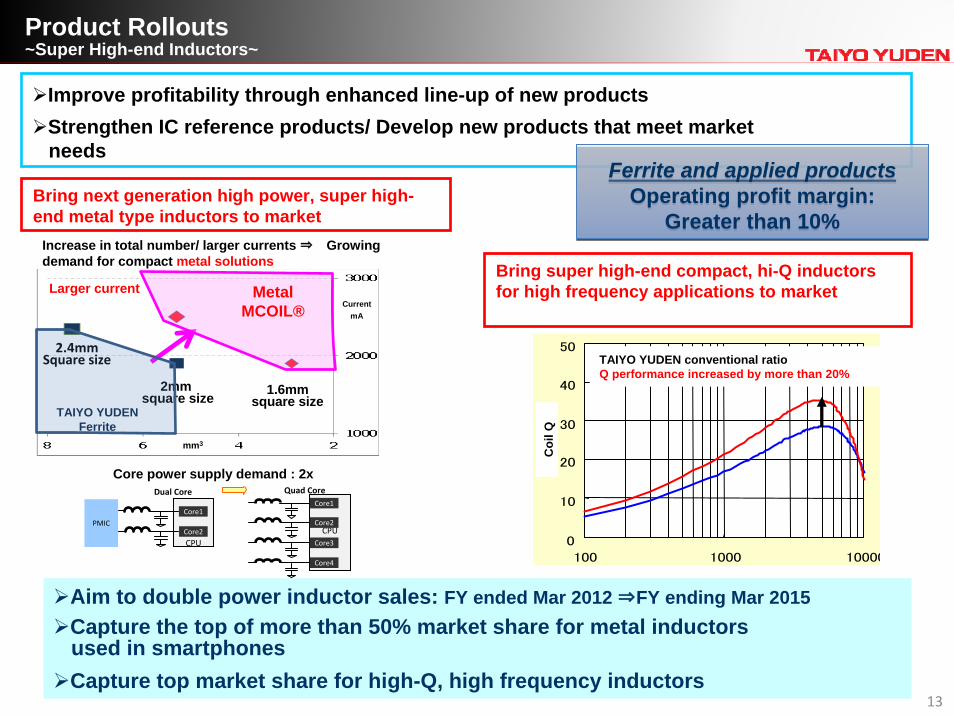
Improve profitability through enhanced line-up of new productsStrengthen IC reference products/ Develop new products that meet market needs
Bring next generation high power, super high-end metal type inductors to market
Aim to double power inductor sales: FY ended Mar 2012 ⇒FY ending Mar 2015Capture the top of more than 50% market share for metal inductors used in smartphonesCapture top market share for high-Q, high frequency inductors
PMIC
CPU
Core1
Core2 CPU
Core1
Core2
Core3
Core4
Dual Core Quad Core
Core power supply demand : 2x
0
10
20
30
40
50
100 1000 10000コ
イル
Q0
10
20
30
40
50
100 1000 10000コ
イル
Q
TAIYO YUDEN conventional ratioQ performance increased by more than 20%
Increase in total number/ larger currents ⇒ Growing demand for compact metal solutions
2.4mmSquare size
2mmsquare size 1.6mm
square size
Larger current
TAIYO YUDEN Ferrite
MetalMCOIL®
Bring super high-end compact, hi-Q inductors for high frequency applications to market
Product Rollouts~Super High-end Inductors~
Ferrite and applied productsOperating profit margin:
Greater than 10%
Ferrite and applied productsOperating profit margin:
Greater than 10%
Coi
l Q
CurrentmA
mm3

14
Create black box by integrating communication devices and embedded-parts multilayer wiring substrate EOMIN®
Double in sales of communication devices(Year ended March 2012 ⇒ Year ending March 2015)
Low Profile MLCCHigh-Q HF inductor
Embedded-parts multilayer wiring substrate EOMIN®
SAW FilterFBARDuplexerRF Module
FBAR vs. SAW
0.2
1.0
0.5
0.3 1.0 3.02.0 5.0
Dur
abili
ty (W
)
Center Frequency(GHz)
SAW FBAR
PCSWCDMA
AMPSGSM
W‐LANWiMAX
SAWor
FBAR
•Multi-channel high-frequency trend continues as smartphones move to LTE.
•FBAR needed for high frequency ranges.
Product Rollouts~Super High-end High Frequency Devices~
Shift business structure from modules to integrated modules & devices
Enhance presence in the high-frequency business and power supply/ energy business etc.
Integrated modules & devices
Operating profit margin:Greater than 5%
Integrated modules & devices
Operating profit margin:Greater than 5%

15
Increase (Decrease)
Unit: Millions of yenYear ended March
31, 2012(01 Apr 2011–31 Mar 2012)
Year ending March 31, 2013(01 Apr 2012–31 Mar 2013) Amount %
Net sales 183,795 210,000 26,205 14.3
Operating income (8,010) 10,000 18,010 -
Ordinary income (9,070) 9,000 18,070 -
Net income (21,599) 5,500 27,099 -
Operating income: Fixed cost reductions and growing demand for super high-end products help increase sales and significantly boost profitabilityExchange rate: Estimated average yen exchange rate to the US dollar: ¥80.00Drop in unit prices: Projected 12% decrease in unit prices of single item components
Consolidated Earnings Forecastfor the year ending March 31, 2013

16
Basic policy: Stable annual dividend of ¥10 per shareAnnual dividend for the year ended March 31, 2012 was reduced to ¥5 per share due to a rapid weakening in financial standing
Policy on Shareholder Returns
Plan to offer an annual dividend of ¥10 per share for the year ending March 31, 2013 thanks to an anticipated improvement in earningsTotal return ratio(*) set at 30% once the targets of the new medium-term management plan have been achieved(*) payment of cash dividend + purchase of treasury stock/ net income
17
This document contains information about the plans, business results, and
strategies of TAIYO YUDEN CO., LTD. and the TAIYO YUDEN Group. These
forward-looking statements other than historical facts represent judgements made
by the Company based on information available at present and are inherently
subject to a variety of uncertainties. TAIYO YUDEN cannot provide any guarantee
as to the attainment of certain figures in the future. The Company’s actual
activities and business results could differ significantly due to changes including,
but not limited to, changes in the electronics market in which the Company’s
business activities are centered. Readers should not overly rely on the information
contained in this document. The unauthorized reproduction or transfer of this
document is strictly prohibited.