Embed Size (px)
Citation preview
Isabel Alexandra Pinto Carrilho do Rosário Licenciatura em Bioquímica
New mechanisms that regulate the
expression of genes implicated in the process of ketogenesis
Dissertação para obtenção do Grau de Mestre em Biotecnologia
Orientador: Prof. Dr. Pedro F. Marrero González, Prof. Titular, Facultat de Farmàcia, Universitat de
Barcelona Co-orientador: Prof. Dr. Diego Haro Bautista,
Prof. Catedrático, Facultat de Farmàcia, Universitat de Barcelona
Presidente: Prof. Doutora Isabel Maria Godinho de Sá Nogueira Arguente: Prof. Doutor Pedro Miguel Ribeiro Viana Baptista
Setembro, 2012
Isabel Alexandra Pinto Carrilho do Rosário
Licenciatura em Bioquímica
New mechanisms that regulate the expression of genes implicated in the
process of ketogenesis
Dissertação para obtenção do Grau de Mestre em Biotecnologia
Orientador: Prof. Dr. Pedro F. Marrero González, Prof. Titular, Facultat de Farmàcia, Universitat de
Barcelona
Co-orientador: Prof. Dr. Diego Haro Bautista, Prof. Catedrático, Facultat de Farmàcia, Universitat de
Barcelona
Setembro, 2012
i
Copyright
New mechanisms that regulate the expression of genes implicated in the process of ketogenesis ©
Isabel Alexandra Pinto Carrilho do Rosário
FCT/UNL
UNL
A Faculdade de Ciências e Tecnologia e a Universidade Nova de Lisboa têm o direito, perpétuo e
sem limites geográficos, de arquivar e publicar esta dissertação através de exemplares impressos
reproduzidos em papel ou de forma digital, ou por qualquer outro meio conhecido ou que venha a ser
inventado, e de a divulgar através de repositórios científicos e de admitir a sua cópia e distribuição,
com objectivos educacionais ou de investigação, não comerciais, desde que seja dado crédito ao
autor e editor.

ii
iii
Ninguém sabe que coisa quer.
Ninguém conhece que alma tem,
Nem o que é mal nem o que o bem.
(Que ânsia distante perto chora?)
Tudo é incerto e derradeiro.
Tudo é disperso, nada é inteiro.
Ó Portugal, hoje és nevoeiro…
A Mensagem
III. Os Tempos
Quinto
Nevoeiro
Fernando Pessoa

iv

v
Acknowledgements
First of all, I want to thank Dr. Diego Haro and Dr. Pedro Marrero, for the opportunity to work and learn
in their laboratory, and for all the support they gave me throughout this year.
I also want to thank everyone in ST lab- Dr. Joana Relat, Albert, Mariona, Elena and Ana Luísa- for
everything they taught me and for every time they helped me. Here, a special thanks to Ana Lu, for
making feel a little bit closer to home.
To Joana Gonçalves, I want to thank all the ideas we discussed, the company in all the weekends we
spent in the laboratory, and more than that, for sharing this year journey with me, all the ups and
downs.
Last but not least, I want to thank my grandparents and parents, for all the support, and to my brother
and sister, for the visits that didn’t let me be me homesick.

vi
vii
Abstract
Fatty acid oxidation and ketogenesis play an important role in metabolic adaptation of the liver.
Ketogenesis is a crucial process, especially in fasting. It is the last step of lipid metabolism and
provides energy in the form of ketone bodies for the extra hepatic tissues, saving glucose for vital
tissues, as the brain. In this project there were studied mechanisms by which genes involved in
ketogenesis are regulated.
In the first part, the hypothesis was to test whether the FoxO family members, FoxO3a and FoxO1,
were responsible for HMGCS2 induction by p53 activation.
HMGCS2 is a key regulator of the ketone body production, and it was published by the laboratory
where this project was developed that it is a FoxO3a/FoxO1 target. P53 was described to stimulate
FAO in conditions of food restriction, and that this could be a part of its effect as a suppressor gene,
related to the Warburg effect.
During the development of this project, it was seen that FoxO3a and FoxO1 were not related to
HMGCS2 induction, when there is p53 activation, induced by DNA damage with doxorubicin
treatment.
In the second part, Fsp27, from the CIDE family, was studied. Fsp27 is a lipid droplet associated
protein. Its expression is regulated by HMGCS2 activity and this gene is expressed during early
fasting. Fsp27 is able to down-regulate FAO when it’s overexpressed. The objective was to seek a
regulatory role of Fsp27 in mouse liver.
During the development of this project, it was confirmed that this protein had a nuclear localization and
that its expression would affect PPAR signaling pathway. In AML12 cells, Fsp27 inhibited the
activation of the HMGCS2 promoter by PPARα. The hypothesis was that Fsp27 would be
sequestering PPARα’s endogenous ligands, since this inhibition would disappear when the cells were
treated with the pharmacological agonist WY14643.
KEYWORDS: Ketogenesis; Metabolic adaptation; Warburg effect; DNA damage

viii
ix
Resumo
A oxidação dos ácidos gordos e a cetogénese têm um papel importante na adaptação metabólica do
fígado. A cetogénese é um processo crucial, especialmente em jejum. É o último passo do
metabolismo dos lípidos, fornecendo energia na forma de ácidos gordos para os tecidos extra
hepáticos, guardando a glucose para os tecidos vitais, como o cérebro. Neste projecto foram
estudados mecanismos pelos quais genes envolvidos na cetogénese são regulados.
Na primeira parte, a hipótese passa por testar se os membros da família FoxO, FoxO3a e FoxO1, são
responsáveis pela indução de HMGCS2, por activação de p53.
O gene HMGCS2 regula a produção de corpos cetónicos, sendo publicado pelo laboratório onde este
projecto foi desenvolvido que é alvo de FoxO3a/FoxO1. Foi descrito que o p53 estimula a FAO em
condições de restrição de comida e que isto poderia fazer parte do seu efeito como gene supressor,
relacionado com o efeito de Warburg.
Durante o desenvolvimento deste projecto, verificou-se que FoxO3a e FoxO1 não estão relacionados
com a indução de HMGCS2, quando há activação de p53, induzida por danos no DNA, induzidos por
doxorubicina.
Na segunda parte, a proteína Fsp27, da família CIDE, foi estudada. Fsp27 é uma proteína associada
a gotas lipídicas. A sua expressão é regulada pela actividade de HMGCS2 e este gene é expresso
durante o jejum. Sobre expresso, Fsp27 regula negativamente a FAO. O objectivo seria procurar um
papel regulador de Fsp27 no fígado de rato.
Durante este projecto, foi confirmada a localização nuclear da proteína e descoberto que a sua
expressão afecta a sinalização por PPAR. Em células AML12, Fsp27 inibe a activação do promotor
de HMGCS2 por PPARα. A hipótese seria que Fsp27 estaria a sequestrar ligandos endógenos de
PPARα, visto que esta inibição desaparece quando as células são tratadas com o agonista
farmacológico WY14643.
Palavras-chave: Cetogénese; adaptação metabólica; Efeito de Warburg ; lesão de DNA.

x
xi
Index
1. Introduction ...................................................................................................................................... 1
1.1 Fatty Acid Oxidation and Ketogenesis .................................................................................... 1
1.2 3-Hidroxy-3-MethylGlutaryl-CoA Synthase ................................................................................... 4
1.2.1 HMGCS2 Regulation .............................................................................................................. 4
1.2.2 HMGCS2 and PPAR .............................................................................................................. 4
1.2.3 HMGCS2 and FoxO family of transcription factors ................................................................ 5
1.3 FoxO family of transcription factors ............................................................................................... 6
1.3.1 The Forkhead transcription factor family ................................................................................ 6
1.3.2 FoxO proteins as insulin and growth factors targets .............................................................. 7
1.3.3 Posttranslational modifications of FoxO factors ..................................................................... 7
1.3.4 FoxO transcription factors and Drug Resistance ................................................................... 9
1.4 Tumor suppressor p53 ................................................................................................................ 11
1.4.1 p53 – Stabilization and Activation ........................................................................................ 11
1.4.2 p53- Ubiquitination and Degradation .................................................................................... 13
1.4.3 AMP-Activated Protein Kinase regulation ............................................................................ 13
1.4.4 Doxorubicin induces genotoxic stress, activating p53 .......................................................... 14
1.4.5 P53 can negatively regulate IGF-1-AKT pathway ................................................................ 15
1.4.6 p53 and metabolism ............................................................................................................. 15
1.4.7 The Warburg effect ............................................................................................................... 16
1.4.8 FoxO and p53 ....................................................................................................................... 16
1.5 Peroxisome Proliferator-Activated Receptors ............................................................................. 18
1.5.1 Trancriptional regulation by PPAR ....................................................................................... 18
1.5.2 PPARα .................................................................................................................................. 19
1.5.3 PPARβ .................................................................................................................................. 20
1.5.4 PPARγ .................................................................................................................................. 20
1.5.5 PPARα and Metabolism ....................................................................................................... 20
1.6 Cell Death-Inducing DNA fragmentation factor 45-like effector (CIDE) C/Fsp27........................ 22
1.6.1 Fsp27 and metabolism ......................................................................................................... 22
2. Goal of this thesis .......................................................................................................................... 25
3. Materials and Methods .................................................................................................................. 27
3.1 DNA obtainment .......................................................................................................................... 27
3.2 Cell lines and Maintenance ......................................................................................................... 27
3.3 Reagents used for cell line treatments ........................................................................................ 28
3.4 Reagents used for transfection experiments ............................................................................... 28
3.5 Transient Transfection and Luciferase assays ............................................................................ 29
xii
3.6 siRNA transfection ....................................................................................................................... 29
3.7 Protein extraction ......................................................................................................................... 29
3.8 Western Blot Analysis.................................................................................................................. 30
3.9 RNA extraction and analysis ....................................................................................................... 31
3.10 Fluorescence assays ................................................................................................................. 31
4. Results & discussion ..................................................................................................................... 33
4.1 Induction of gene expression by Doxorubicin ............................................................................. 33
4.2 Regulation of HMGCS2 expression by the Fork Head Family of transcription factors ............... 36
4.2.1 Regulation by FoxO1 ............................................................................................................ 36
4.2.2 Regulation by FoxO3a .......................................................................................................... 38
4.3 Fsp27 cellular location ................................................................................................................. 40
4.4 Role of Fsp27 in PPAR signaling ................................................................................................ 41
4.4.1 PPARα .................................................................................................................................. 41
4.4.2 PPARγ .................................................................................................................................. 42
4.4.3 Interaction of PPARα agonist WY 14643 with Fsp27 ........................................................... 43
4.4.4 Future perspectives .............................................................................................................. 44
5. Conclusions ................................................................................................................................... 45
6. Annex ............................................................................................................................................. 47
6.1 Constructs ................................................................................................................................... 47
6.1.1 mHMGCS2 promoter construct ............................................................................................ 47
6.1.2 Fsp27 protein constructs ...................................................................................................... 48
7. Bibliography ................................................................................................................................... 51
xiii
Figure Index
Figure 1.1-Scheme of Fatty acid synthesis pathway. ACC (Acetyl-CoA carboxylase), a regulatory
enzyme of fatty acid synthesis, carboxylates acetyl-CoA, producing malonyl-CoA. Free palmitate is
produced from NADPH, acetyl-CoA and malonyl-CoA. LCAS (Long chain acyl-CoA synthase)
esterifies CoA to palmitate, producing palmitoyl-CoA. Adapted from [6]. ............................................... 2
Figure 1.2- Conserved AKT phosphorylation sites in FoxO proteins. Representation of mammalian and
C.Elegans FoxO isoforms and the corresponding AKT phosphorylation sites. There are also
represented the locations ofthe forkhead domain and the nuclear export (NES) and nuclear
localization sequence (NLS).[12] ............................................................................................................. 8
Figure 1.3-Phosphorylation and regulation of nuclear export of FoxO [14]. ........................................... 8
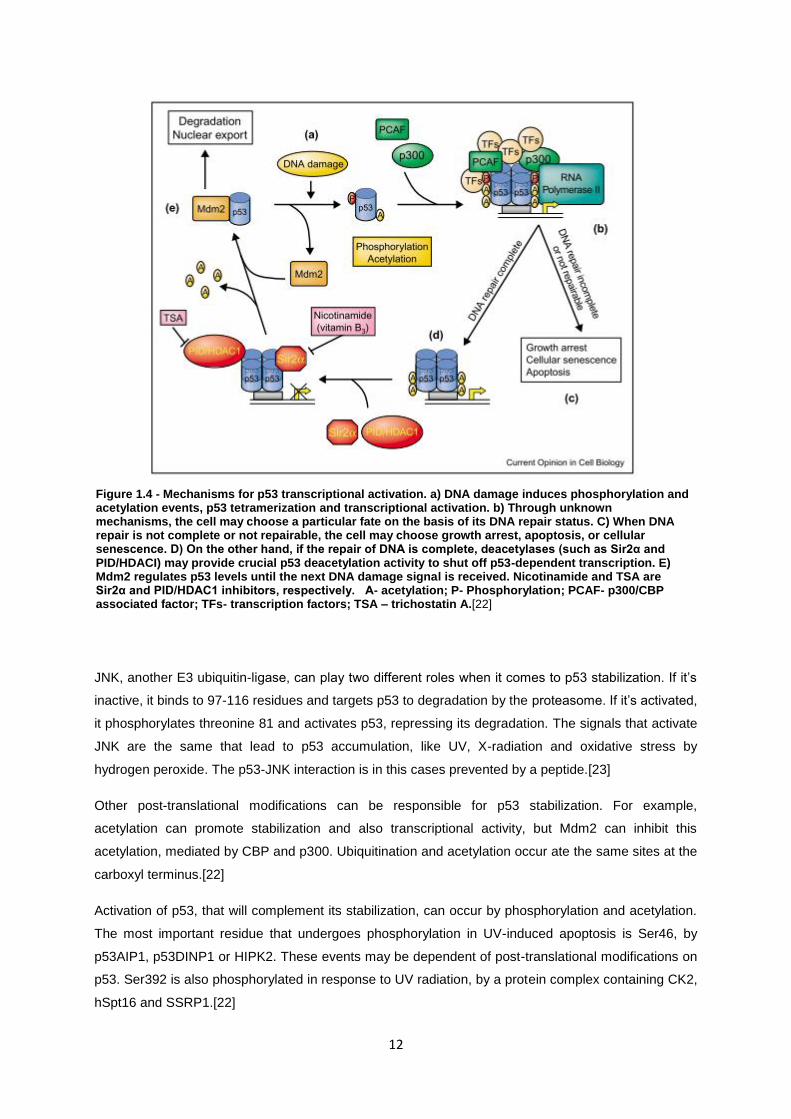
Figure 1.4- Mechanisms for p53 transcriptional activation. a) DNA damage induces phosphorylation
and acetylation events, p53 tetramerization and transcriptional activation. b) Through unknown
mechanisms, the cell may choose a particular fate on the basis of its DNA repair status. C) When DNA
repair is not complete or not repairable, the cell may choose growth arrest, apoptosis, or cellular
senescence. D) On the other hand, if the repair of DNA is complete, deacetylases (such as Sir2α and
PID/HDACI) may provide crucial p53 deacetylation activity to shut off p53-dependent transcription. E)
Mdm2 regulates p53 levels until the next DNA damage signal is received. Nicotinamide and TSA are
Sir2α and PID/HDAC1 inhibitors, respectively. A- acetylation; P- Phosphorylation; PCAF- p300/CBP
associated factor; TFs- transcription factors; TSA – trichostatin A.[21] ................................................ 12
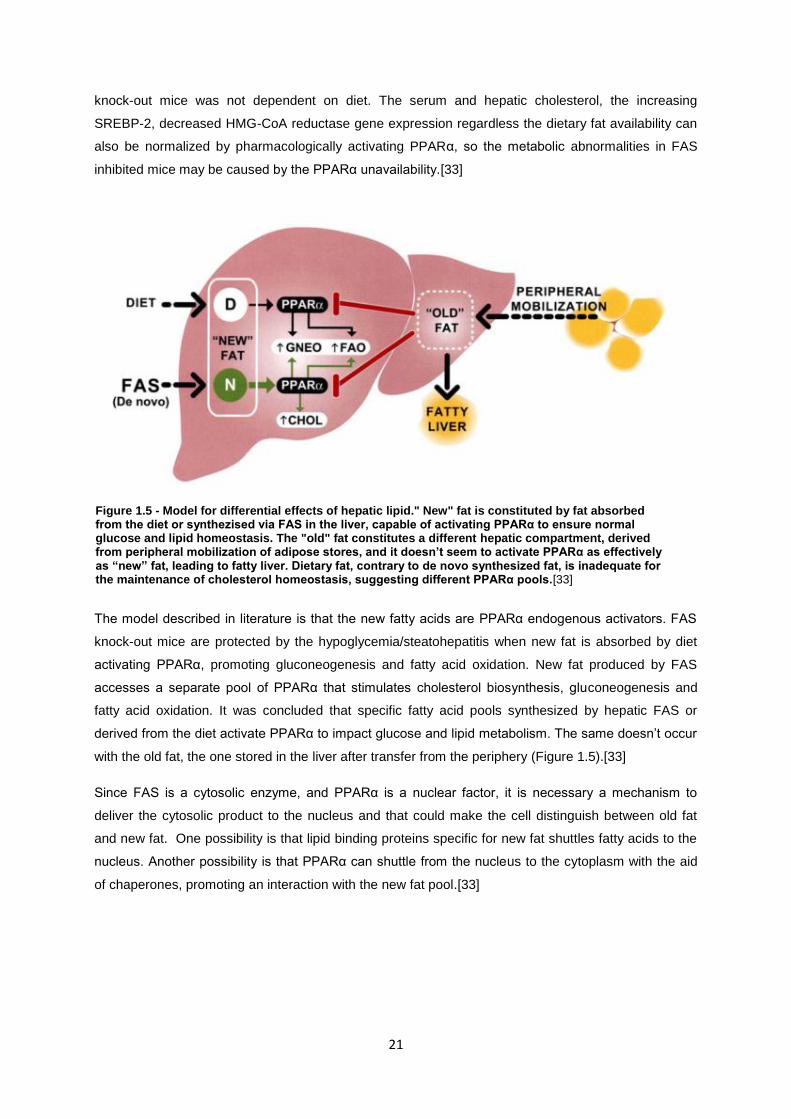
Figure 1.5- Model for differential effects of hepatic lipid." New" fat is constituted by fat absorbed from
the diet or synthezised via FAS in the liver, capable of activating PPARalfa to ensure normal glucose
and lipid homeostasis. The "old" fat constitutes a different hepatic compartment, derived from
peripheral mobilization of adipose stores, and it doesn’t seem to activate PPAralfa as effectively as
“new” fat, leading to fatty liver. Dietary fat, contrary to de novo synthesized fat, is inadequate for the
maintenance of cholesterol homeostasis, suggesting different PPAralfa pools.[32]............................. 21
Figure 4.1- Doxorubicin promotes p53 protein expression in AML12 cells. Western Blot of total protein
extracts of AML12 cells incubated with 3 uM of doxorubicin, for 6 hours, using antibodies to p53 and
actines, as control. Lane 1) Untreated cells; lane 2) Doxorubicin treated cells. ................................... 33
Figure 4.2-Gene induction in response to doxorubicin. AML12 cells were incubated with 3 uM of
doxorubicin, for 6 hours. The RNA was then extracted and a Real Time PCR was performed, to
determine the mRNA levels of FoxO1. .................................................................................................. 34
Figure 4.3-Gene induction in response to doxorubicin. AML12 cells were incubated with 3 uM of
doxorubicin, for 6 hours. The RNA was then extracted and a Real Time PCR was performed, to
determine the mRNA levels of FoxO3a. ................................................................................................ 34
xiv
Figure 4.4- Gene induction in response to doxorubicin. AML12 cells were incubated with 3 uM of
doxorubicin, for 6 hours. The RNA was then extracted and a Real Time PCR was performed, to
determine the mRNA levels of HMGCS2. ............................................................................................. 35
Figure 4.5-Doxorubicin promotes p53 protein expression in AML12 cells, even in the absence of
FoxO1. Western Blot of total protein extracts of AML12 cells incubated with 3 µM of doxorubicin, for 6
hours, using antibodies to p53 and actines, as control. Lane 1) transfection of 25 nM of SiCtl; lane 2)
transfection of 25 nM o SiCtl and treatment with doxorubicin; lane 3) transfection of 25 nM of SiFoxO1;
lane 4) transfection of 25 nM of SiFoxO1 and treatment with doxorubicin. .......................................... 36
Figure 4.6-Gene induction in response to doxorubicin. AML12 cells were transfected with 25 nM of
SiFoxO1 and 25 nM of SiCtl for 72 hours, and treated with 3 uM of doxorubicin 6 hours before the
cells were recovered. The RNA was then extracted and a Real Time PCR was performed, to
determine the mRNA levels of HMGCS2. ............................................................................................. 37
Figure 4.7- Gene induction in response to doxorubicin. AML12 cells were transfected with 25 nM of
SiFoxO1 and 25 nM of SiCtl for 72 hours, and treated with 3 uM of doxorubicin 6 hours before the
cells were recovered. The RNA was then extracted and a Real Time PCR was performed, to
determine the mRNA levels of HMGCS2. ............................................................................................. 37
Figure 4.8-Doxorubicin promotes p53 protein expression in AML12 cells, even in the absence of
FoxO3a. Western Blot of total protein extracts of AML12 cells incubated with 3 uM of doxorubicin, for 6
hours, using antibodies to p53 and tubulin, as control. Lane 1) transfection of 25 nM of SiCtl; lane 2)
transfection of 25 nM o SiCtl and treatment with doxorubicin; lane 3) transfection of 25 nM of
SiFoxO3a; lane 4) transfection of 25 nM of SiFoxO3a and treatment with doxorubicin. ...................... 38
Figure 4.9- Gene induction in response to doxorubicin. AML12 cells were transfected with 25 nM of
SiFoxO3a and 25 nM of SiCtl for 72 hours, and treated with 3 uM of doxorubicin 6 hours before the
cells were recovered. The RNA was then extracted and a Real Time PCR was performed, to
determine the mRNA levels of FoxO3a. ................................................................................................ 39
Figure 4.10-Gene induction in response to doxorubicin. AML12 cells were transfected with 25 nM of
SiFoxO3a and 25 nM of SiCtl for 72 hours, and treated with 3 uM of doxorubicin 6 hours before the
cells were recovered. The RNA was then extracted and a Real Time PCR was performed, to
determine the mRNA levels of HMGCS2. ............................................................................................. 39
Figure 4.11- Fsp27 cellular localization. HeLa cells were co-transfected with Fsp27-DsRed-Express-
N1 (500 ng) and H2B-GFP (500 ng). After 48 hours of transfection, it was seen in the fluorescence
microscope a) in green the H2B-GFP-N1 in the nucleus, b) in red color the Fsp27-pDsRed-
Express-N1 and then a c) merge of the two was made with the help of a specific software. ............... 40
Figure 4.12- HMGCS2 promoter activity, in the presence of Fsp27 and PPARα. The AML12 cells were
co-transfected with pcDNA3, PPARα-pcDNA3 and Fsp27-pcDNA3, and incubated for 48hours. The
results of normalized luciferase activities (means+-SD), from three independent experiments, are
expressed in folds. (**P<0.005) ............................................................................................................. 41
xv
Figure 4.13-HMGCS2 promoter activity, in the presence of Fsp27 and PPARγ. The AML12 cells were
co-transfected with pcDNA3, PPARγ-pcDNA3 and Fsp27-pcDNA3, and incubated for 48hours. The
results of normalized luciferase activities (means+-SD), from three independent experiments, are
expressed in folds. (**P<0.005). ............................................................................................................ 42
Figure 4.14-HMGCS2 promoter activity, in the presence of Fsp27 and PPARα. The AML12 cells were
co-transfected with pcDNA3, PPARγ-pcDNA3 and Fsp27-pcDNA3, and incubated with 10µM of the
pharmacological agonist WY14643 for 24 hours. The results of normalized luciferase activities
(means+-SD), from three independent experiments, are expressed in folds. (**P<0.005). .................. 43
Figure 6.1- pGL3- Basic Vector circle map. .......................................................................................... 47
Figure 6.2- pcDNA3 vector circle map.. ................................................................................................ 48
Figure 6.3-pDsRed-Express-N1 vector circle map.. .............................................................................. 49

xvi

xvii
Table Index
Table 1.1- FoxO target genes involved in metabolism…..……………………………………………………………….6
Table 3.1 -List of antibodies used in this project…………………………………………………………………………30

xviii
xix
List of Abbreviations
ABCB1 –ATP-Binding Cassette sub-family B member 1
ACC- Acetyl CoA Carboxylase
ADP – Adenosine Diphosphate
AGC family- Protein Kinase A, Protein Kinase G and Protein Kinase C
AMP- Adenosine Monophosphate
AMPK- AMP-activated Protein Kinase
Atg7-Autophagy Related Protein 7
ATM- Ataxia- Telangiectasia Mutated
ATP- Adenosine Triphosphate
Bad- Bcl-2-Associated Death Promoter
BAT- Brown Adipose Tissue
BSA- Bovine Serum Albumin
C/EBPα- CCAAT- Enhancer Binding Proteins
cAMP – cyclic Adenosine Monophosphate
CBP- Creb Binding Protein
CIDE- Cell Death Inducing DFF45-like Effector
CIDEA- Cell Death Inducing DFF45-like Effector A
CIDEB- Cell Death Inducing DFF45-like Effector B
CIDEC- Cell Death Inducing DFF45-like Effector C
CK2- Caseine Kinase II
CPTI- Carnitine Acyltransferase I/ Carnitine palmitoyl Transferase I
CPTII- Carnitine Acyltransferase II/ Carnitine Palmitoyl Transferase II
DNA – Deoxyribonucleic Acid
dNTPs- Deoxynucleotide Triphosphate
Doxo- Doxorubicin
DRAM- Damage-Regulated Autophagy Modulator
DYRK1- Dual specificity tyrosine-phosphorylation-regulated kinase 1
ERK-1/2 –Extracellular signal-Regulated Kinases 1/2
xx
FADH2 – Flavine Adenine Dinucleotide
FAO- Fatty Acid Oxidation
FAS – Fatty Acid Synthase
FFA- Free Fatty Acids
FoxO – Forkhead box ‘Other’ proteins
FoxO1- Forkhead box ‘Other’ 1
FoxO3a - Forkhead box ‘Other’ 3a
Fsp27- Fat Specific Protein 27
GADD45a – Growth Arrest and DNA Damage- inducible protein A
GLUT1-Glucose Transporter 1
GLUT4- Glucose Transporter 4
HAT- Histone Acetyl Transferase
HIPK2- Homeodomain-Interacting Protein Kinase 2
HMGCL- 3- Hydroxy-3-Methylglutaryl- CoA Lyase
HMG-CoA reductase – 3-Hydroxy-3-Methyl-Glutaryl CoA Reductase
HMGCS2- 3- Hydroxy-3-MethylGlutaryl- CoA synthase
HSL- Hormone-Sensitive Lipase
IGF-1 – Insulin-Like Growth Factor I
IGF-1R- Insulin-Like Growth Factor Receptor
IKK- IκB Kinase
IRS– Insulin Response Sequences
JNK- c-Jun N-terminal Kinase
LCAS- Long Chain Acyl CoA Synthase
LKB1- Liver Kinase B1
LXR- Liver X Receptor
MAPK- Mitogen-Activated Protein Kinase
MDM2– Mouse Double Minute
MDR- Multidrug Resistance
MDR1- Multidrug Resistance Gene
MST1- Macrophage Stimulating 1 (hepatocyte growth factor like)
xxi
mTOR- mammamial Target of Rapamycin
NAD+ - Nicotinamide Adenine Dinucleotide, oxidizing agent
NADH- Nicotinamide Adenine Dinucleotide, reducing agent
NADPH- Nicotinamide Adenine Dinucleotide Phosphate, reduced form
NFkB- Nuclear Factor kappa-light-chain-enhancer of activated B cells
NQO1-Reduced Nicotinamide Adenine Dinucleotidequinone Oxidoreductase 1
NQO2- Reduced Nicotinamide Adenine Dinucleotidequinone Oxidoreductase 2
OCTN2- Organic Cation/ Carnitine Transporter
PBS- Phosphate Buffered-Saline
PCAF- P300/CBP- Associated Factor
PCR – Polymerase Chain Reaction
PEPCK- Phosphoenolpyruvate Carboxykinase
PI-3K– Phosphoinositide-3 Kinase
PKB / Akt – Protein Kinase B
PMSF- Phenylmethylsulfonyl
PPAR- Peroxisome Proliferator Activated Receptor
PPARα- Peroxisome Proliferator Activated Receptor α
PPARβ- Peroxisome Proliferator Activated Receptor β
PPARγ- Peroxisome Proliferator Activated Receptor γ
PPRE-Peroxisome Proliferator Response Elements
PTEN- Phosphatase and Tensin Homolog
PVDF-Polyvinylidene Fluoride
RNA – Ribonucleic Acid
ROS – Reactive Oxygen Species
RT- Room Temperature
RXR- Retinoid X Receptor
Sesn1- Sestrin 1
Sesn2- Sestrin 2
SGK- Serum and Glucocorticoid inducible kinase
SiCtl- Small interference RNA control
xxii
siRNA- Small interference RNA
SirT1- Sirtuin 1
SKP2- S-phase Kinase-Associated Protein 2
Sp1 – Specificity protein 1
SREBP-1 – Sterol Regulatory Element-Binding Protein 1
SREBP-2 – Sterol Regulatory Element-Binding Protein 2
SSRP1- Structure Specific Recognition Protein 1
TAG- Triacylglycerol
TGFα- Transforming Growth Factor alpha
TIGAR- TP53-Induced Glycolysis and Apoptosis Regulator
TP53- Tumor Protein 53
TSG101- Tumor Suppressor Gene 101
VLDL- Very Low Density Lipoprotein
WAT – White Adipose Tissue
XOR- Xanthine Oxidoreductase
1
1. Introduction
1.1 Fatty Acid Oxidation and Ketogenesis
Fatty acids are the main energy reserve in the body, and as so they are considered fuel molecules.
They are stored in triglycerides, which are highly concentrated stores of metabolic energy. They are
reduced and anhydrous.
In mammals, the accumulation of triglycerides is typically in the cytoplasm of adipocytes. The
synthesis, storage and mobilization of the triglycerides occurs in these adipocytes. There is also
storage of triglycerides in the muscle, for its own use.
Before the peripheral tissues can use the lipid energy, it is necessary that they pass through three
stages of processing. The first step is the degradation of the triglycerides into fatty acids and glycerol
by lipases.[1]
Lipolysis, a process that is active during fasting, is activated by β-adrenergic cathecolamines (like
epinephrine) and it can be easily suppressed by insulin signaling. The release of fatty acids from the
adipocytes is mediated by HSL (Hormone-Sensitive Lipase). The transcription of this protein is
activated during the final steps of adipocyte differentiation, increases during fasting and it is repressed
by both insulin and glucose. The protein Perilipin is also involved in lipolysis and coats the lipid droplet
that contains the triglycerides reserves of the cells.[2]
They are then released from the adipose tissue, and transported by the blood stream to the energy
requiring tissues. After that, the fatty acids need activation to CoA-esters by thiokinases and
transportation to the mitochondria. The short- and medium- chain fatty acids can pass directly into the
mitochondria, because of the permeability of the inner mithocondrial membrane. To transport the
activated long chain fatty acids it is necessary a special transport system. The fatty acids are
conjugated with carnitine, catalyzed by carnitine acyltransferase I /carnitine palmitoyl transferase I
(CPTI).
Acyl CoA compounds are converted to acylcarnitines by carnitine-acylcarnitine translocase and then,
on the matrix membrane, are transesterified to acyl-CoA by CPTII (carnitine palmitoyltransferase type
II). A carnitine transporter (OCTN2) will transport carnitine into the cells, except in the hepatocytes.
Inside the mitochondria, the fatty acids go under β-oxidation (FAO) and acyl-CoA is shortened by two
carbon atoms, to generate one acetyl CoA molecule and reducing equivalents (NADH and FADH2) in
each subsequent cycle, that are linked to the citric acid cycle and the mitochondrial respiratory chain.
ATP will be consequently generated by oxidative phosphorylation in aerobic tissues.[1][3][4]
2
In cases of fasting or diabetes, the energy requirements are essentially satisfied by FAO, with the
ketone bodies derived from acetyl-CoA.
Mitochondrial FAO is an essential process, especially in newborns, that have low glycogen reserves
and rely mainly on fatty acids for energy.[3]
In these cases, the amounts of insulin are low, and the glucagon is high, which will lead to an
augmented release of fatty acids from the adipose tissue. The energy necessary to gluconeogenesis
is provided and also high amounts of acetyl-CoA are synthetized. In the liver, the acetyl-CoA is
transformed into ketone bodies, by the enzymes HMGCS2 and HMGCL.[3][5]
In normal cells, except lipogenic tissues, the mammalian fatty acid synthase – a complex
multifunctional enzyme that contains seven catalytic domains and a phosphopantetheine prosthetic
group on a single 260 KDa polypeptide- activity is minor, because fatty acids are provided by the
dietary fat. Mammalian FAS is down-regulated by dietary fat in lipogenic tissues (liver, adipose tissue),
but its activity is described to be higher in many cancers.[6][7]
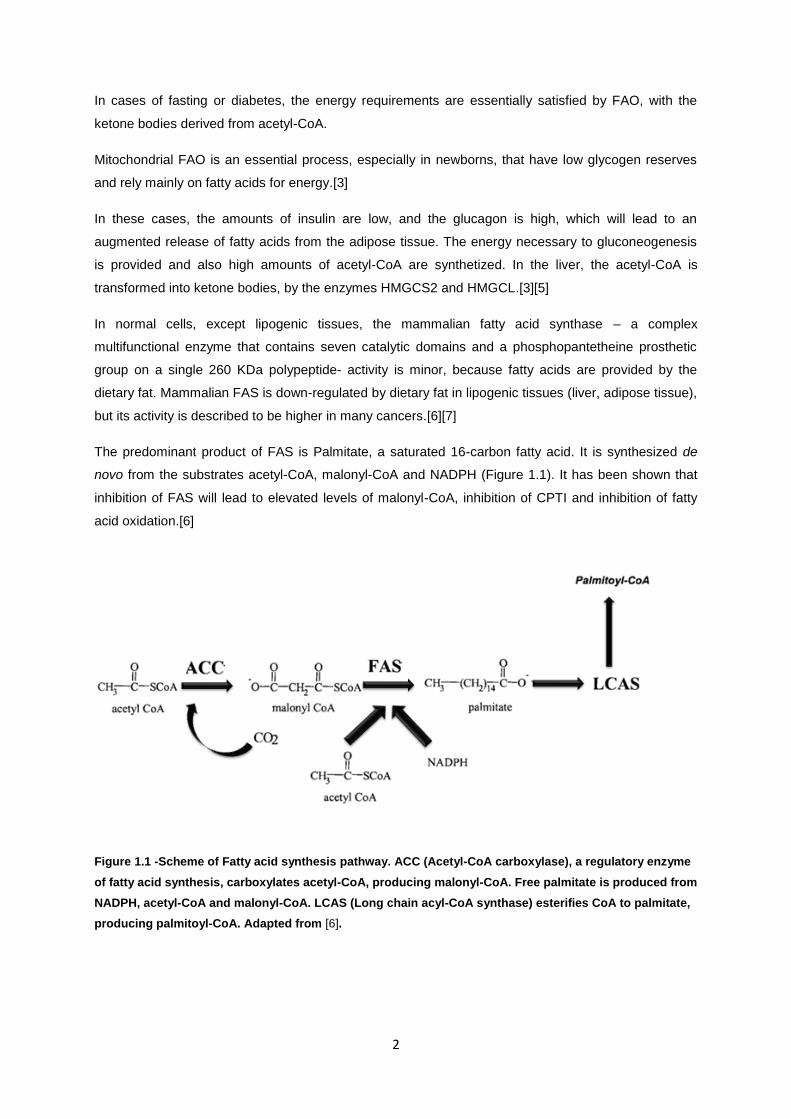
The predominant product of FAS is Palmitate, a saturated 16-carbon fatty acid. It is synthesized de
novo from the substrates acetyl-CoA, malonyl-CoA and NADPH (Figure 1.1). It has been shown that
inhibition of FAS will lead to elevated levels of malonyl-CoA, inhibition of CPTI and inhibition of fatty
acid oxidation.[6]
Figure 1.1 -Scheme of Fatty acid synthesis pathway. ACC (Acetyl-CoA carboxylase), a regulatory enzyme
of fatty acid synthesis, carboxylates acetyl-CoA, producing malonyl-CoA. Free palmitate is produced from
NADPH, acetyl-CoA and malonyl-CoA. LCAS (Long chain acyl-CoA synthase) esterifies CoA to palmitate,
producing palmitoyl-CoA. Adapted from [6].

3
Ketogenesis is the last step of the lipid metabolism and it is an important process, especially in the
fasted state, because it provides the energy needed for the extra hepatic tissues, and as so, glucose
is reserved for vital tissues, like the brain.
The ketone body production has three control points, the adipocyte lipolysis, the mitochondrial fatty
acids entry, controlled by the inhibition of CPTI by malonyl-CoA and mitochondrial 3-hydroxy-3-
methylglutaril CoA synthase, that catalyzes the irreversible first step of the ketone body synthesis.[4]
4
1.2 3-Hidroxy-3-MethylGlutaryl-CoA Synthase
Mitochondrial 3-hidroxy-3-methylglutaryl-CoA synthase (HMGCS2) is a gene that regulates the ketone
body production, in liver and extrahepatic tissues. It catalyzes the condensation of acetyl-CoA with
acetoacetyl-CoA, to generate acetoacetate, β-hydroxibutyrate and NAD+. cAMP, insulin and
dexamethasone can vary its mRNA levels. [5][8]
HMGCS2 is controlled by nutritional and hormonal effects, and its activity is modulated by
posttranscriptional mechanisms of succinylation and desuccinylation.[9]
In rats, the hepatic ketogenic capacity increases during the post-natal development or fasting, and
HMGCS2 expression increases in liver. This effect is also observed in high fat diets, but is suppressed
by insulin.[10]
1.2.1 HMGCS2 Regulation
The rat mitochondrial HMGCS2 promoter has three main regulatory sequences. 1) an insulin-
responsive sequence, at the position -211 respecting to the transcriptional start site, that binds
proteins from the forkhead family of transcription factors; 2) a peroxisome proliferator-activated
receptor element, at the position -104, that binds retinoid X receptor-peroxisome proliferator-activated
receptor heterodimers and 3) a Sp1-binding site, at the position -56, that binds proteins from the Sp1
family of transcription factors. The Sp1 binding site and the peroxisome proliferator-activated receptor
element are present in similar positions in the human promoter.[8][10]
1.2.2 HMGCS2 and PPAR
The expression of HMGCS2 is stimulated by peroxisome proliferator-activated receptor α (PPARα).
PPARα is a fatty-acid activated nuclear receptor that regulates metabolic changes in the liver,
associated with starvation.
It was described that mHMGCS2 protein interacts physically with PPARα in vitro, leading to a
transcriptional activation of HMGCS2 in vivo, and it also contains a nuclear-receptor interacting
consensus motif (LXXLL), common to many nuclear hormone receptor-interacting cofactors, and that
is required for efficient binding to PPARα. This facts, with the knowledge that mHMGCS2 accumulates
in the nucleus in the presence of co-expressed PPARα, suggests that mHMGCS2 may be a co-
regulatory factor for PPARα.[11]
5
Sirtuin-1 (SirT1) is a NAD+-dependent protein deacetylase that may also contribute to the metabolic
adaptation to fasting. PPARα signaling has alterations when this protein is deleted from hepatic cells.
FAO and ketogenesis are induced by human HMGCS2, and its expression is necessary for PPARα-
mediated induction of FAO.[5]
HMGCS2 mRNA levels increase in response to starvation, fat-feeding and diabetes and during the
early neonatal period.
The high levels of plasma glucagon and low insulin levels may be the cause of the increased
expression of the HMGCS2 gene in the liver of starved, newborn, suckling and fed rats.
The oxaloacetate is consumed in high amounts by gluconeogenesis in cases of type one diabetes, but
the breakdown of fat generates large amounts of acetyl-CoA. The acetyl-CoA would normally be
directed to the tricarboxylic acid cycle, condensed with oxaloacetate, but since the concentration of
oxaloacetate is lowered, it is used to produce excess of acetoacetate and D-3-hydroxybutyrate –
ketone bodies.[1][8]
1.2.3 HMGCS2 and FoxO family of transcription factors
The HMGCS2 promoter transcriptional activation is mediated by a network of recruited transcription
factors, and this can explain why there is an induction of this gene expression in the liver, under
pathologic and physiologic conditions. In tissues that oxidize fatty acids, this gene was proposed to
prevent the acetyl-CoA accumulation, which will impair the rates of the fatty acid oxidation, so a lack in
the induction of HMGCS2 can impair β-oxidation.[10]
The members of the FoxO family of transcription factors, such as FoxO3a, are involved in the
regulation of HMGCS2 gene by insulin, through phosphorylation by phosphoinositide-3 kinase (PI-
3K)/PKB transduction pathway that regulates FoxO expression. The inhibition of the PI-3K blocks the
insulin repression, and on the other hand, when an active form of PKB/Akt is overexpressed
(downstream PI-3K target in the insulin signaling pathway) represses the FoxO3a/FKHRL1 induced
expression of HMGCS2.[8]
It has been shown that HMGCS2 is down-regulated in poorly differentiated carcinomas and although
the importance of its expression in tumor progression is not known, there is the hypothesis that some
specific dietary manipulations can affect cancer incidence if this gene expression or ketone body
production plays a role in tumor development/progression.[10]
6
1.3 FoxO family of transcription factors
The Forkhead box ‘Other’ proteins, are a subgroup of the Forkhead transcription factor family and they
are described as having an important role in mediating the effects of insulin and also of growth factors
on various physiological functions- cell proliferation, apoptosis and metabolism. They are the
mammalian orthologs of Caenorhabditis elegans DAF16. [12][13]
1.3.1 The Forkhead transcription factor family
The Forkhead transcription factor family is characterized by a 100-amino acid conserved monomeric
DNA-binding domain, ‘forkhead box’, and it is present in all eukaryotes. The DNA binding domain folds
into a variant of the helix-turn-helix motif and is made up of three α helices and two characteristic large
loops, or wings. It is called the helix-DNA binding domain. The FoxO family was initially discovered in
humans at chromosomal translocations, suggesting that they can play an important role in tumor
development.[14][15]
There are four mammalian FoxO members, FoxO1/FKHR/FoxO1a, FoxO3/FKHRL1/FoxO3a,
FoxO4/AFX and FoxO6, and all of these share a high protein homology.[12][13]
All the FoxO members are expressed in all tissues in mammals, in different degrees. FoxO1 mRNA is
mainly expressed in adipose tissue, FoxO3a mRNA is highly expressed in the brain, FoxO4 mRNA is
mostly expressed in the heart and finally, FoxO6 mRNA is expressed mainly in the developing
brain.[14]
These proteins can modulate the expression of several genes, which are involved in processes like
autophagy, apoptosis, DNA damage repair, oxidative stress, cell differentiation, cell cycle progression
and glucose metabolism (Table 1.1). An irregular pattern of FOXO activation or regulation will lead to
disorders of apoptotic pathways, proliferation and cell cycle regulation.[16]
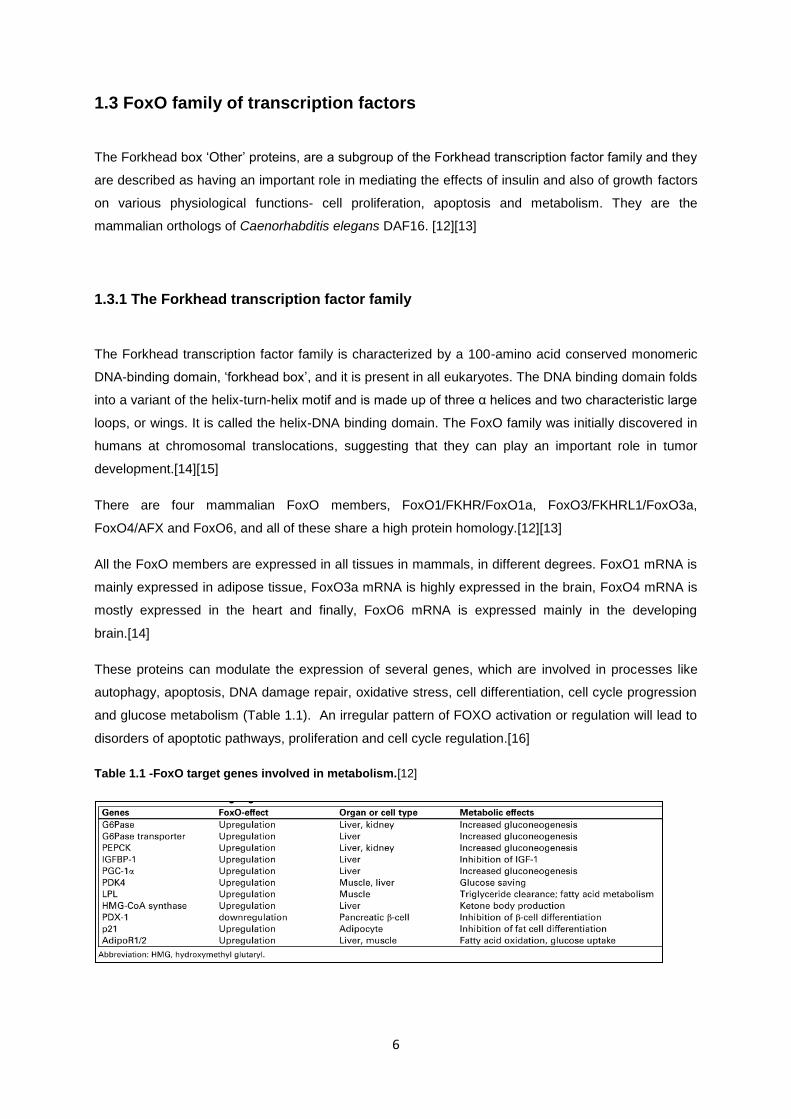
Table 1.1 -FoxO target genes involved in metabolism.[12]
7
Their working mechanism is either to activate or repress multiple target gene expression. In the
process of tumor suppression, they regulate genes that induce apoptosis such as Bim, Trail and Fas
L, in cell cycle regulation they interact with p21, p27 and cyclin D1.Concerning DNA damage repair,
they regulate GADD45a and in autophagy Atg7.[16]
1.3.2 FoxO proteins as insulin and growth factors targets
The FoxO proteins have been described as targets of insulin action, and also targets of growth factors.
They interact with Insulin Response Sequences (IRS), similar to the ones existing in the PEPCK gene
(phosphoenolpyruvate carboxykinase) through phosphatidylinositol 3-kinase (PI3K) and protein
kinase B signaling.[12]
PI3K is activated through binding of insulin, IGF-1 (Insulin like growth factor I) or other growth factors
to tyrosine kinase receptors, and as consequence, several serine/threonine kinases are also activated,
including the Akt family protein kinases and the related serum and glucocorticoid inducible kinase
(SGK). All the mammalian FoxO members share the same regulatory sites for AKT/PKB, with the
exception of FoxO6. They have three consensus phosphorylation sites (RXRXXS/T) of Akt – Thr32,
Ser253 andSer315 in FoxO3 sequence, Thr24, Ser256 and Ser319 in human FoxO1- but other AGC
family kinases can phosphorylate in the same sites, although Akt and SGK phosphorylate a different
combination of sites.[13] [14][15]
1.3.3 Posttranslational modifications of FoxO factors
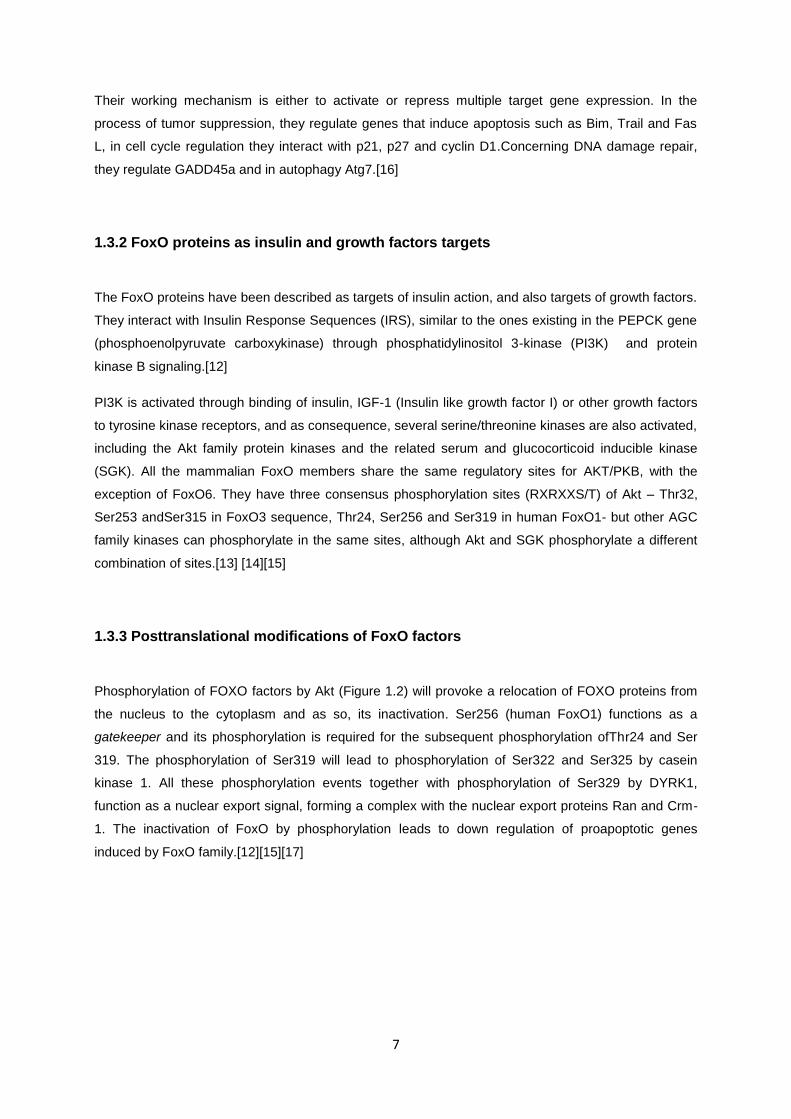
Phosphorylation of FOXO factors by Akt (Figure 1.2) will provoke a relocation of FOXO proteins from
the nucleus to the cytoplasm and as so, its inactivation. Ser256 (human FoxO1) functions as a
gatekeeper and its phosphorylation is required for the subsequent phosphorylation ofThr24 and Ser
319. The phosphorylation of Ser319 will lead to phosphorylation of Ser322 and Ser325 by casein
kinase 1. All these phosphorylation events together with phosphorylation of Ser329 by DYRK1,
function as a nuclear export signal, forming a complex with the nuclear export proteins Ran and Crm-
1. The inactivation of FoxO by phosphorylation leads to down regulation of proapoptotic genes
induced by FoxO family.[12][15][17]
8
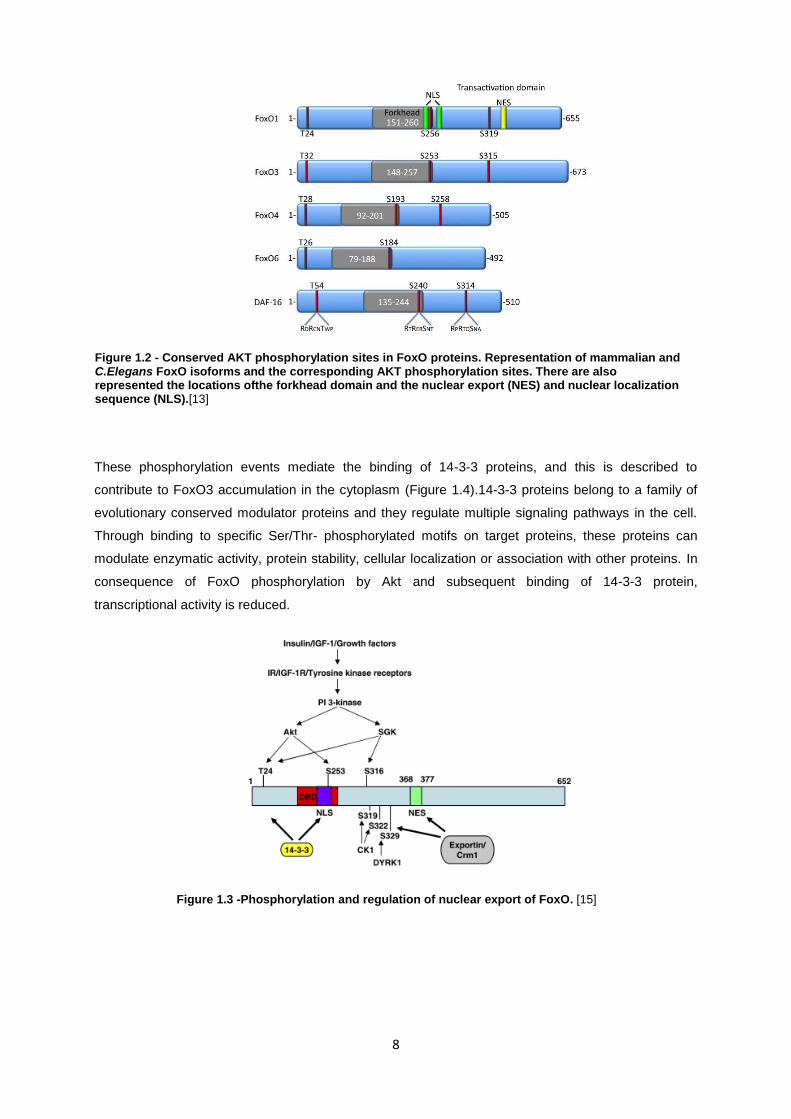
These phosphorylation events mediate the binding of 14-3-3 proteins, and this is described to
contribute to FoxO3 accumulation in the cytoplasm (Figure 1.4).14-3-3 proteins belong to a family of
evolutionary conserved modulator proteins and they regulate multiple signaling pathways in the cell.
Through binding to specific Ser/Thr- phosphorylated motifs on target proteins, these proteins can
modulate enzymatic activity, protein stability, cellular localization or association with other proteins. In
consequence of FoxO phosphorylation by Akt and subsequent binding of 14-3-3 protein,
transcriptional activity is reduced.
Figure 1.2 - Conserved AKT phosphorylation sites in FoxO proteins. Representation of mammalian and C.Elegans FoxO isoforms and the corresponding AKT phosphorylation sites. There are also represented the locations ofthe forkhead domain and the nuclear export (NES) and nuclear localization sequence (NLS).[13]
Figure 1.3 -Phosphorylation and regulation of nuclear export of FoxO. [15]
9
Some other modifications in FoxO1 were described, as acetylation and phosphorylation by MST1 that
affect DNA binding. [13]
FoxO transcription factors up-regulate genes from the glucose metabolism, like glucose-6-
phosphatase, that converts glucose-6-phosphate to glucose, and PEPCK, that converts oxaloacetate
to phosphoenolpyruvate. The glucose metabolism is connected with the protein stability, and this is
probably mediated by AMP-activated kinase.
Another regulation pathway is given by the c-Jun N-terminal kinase (JNK) that phosphorylates Thr447
and Thr451, positively regulating FoxOs.[12] [14][15]
FoxO activity can be modulated by acetylation directly on lysine residues mediated by CBP (Creb
binding protein), P300 and PCAF, but there are some controversial results. In some cases there is an
increase in the activity and in others there is a decrease. The recruitment of CBP/P300 will cause
histone acetylation, and this leads to a positive control for transcription. On the other hand, the FoxO
acetylation also diminishes DNA-binding, and this leads to a negative control. Since this is a reversible
regulation, FoxOs can be deacetylated by class-I histone deacetylases and the class-III, NAD-
dependent histone deacetylases-sirtuins Sirt1-. The effect of this deacetylation vary according to the
target genes, but it mainly enhances FoxO’s transcriptional activity. [13][15]
FoxO protein levels are regulated by its degradation, and it has been described that insulin decreases
FoxO1 protein levels, by ubiquitination and further degradation in a PI3K-dependent manner, in
HepG2 cells.The signaling for ubiquitination and degradation can be given by phosphorylation. FoxOs
can be phosphorylated by Akt,ERK-1/2 and IKK. SKP2 binds AKT-phosphorylated FoxO1 at Ser256
and MDM2 binds ERK-phosphorylated FoxOs, they are both E3 ligases. MDM2 can signal FoxO for
two different things, it can lead to mono-ubiquitination, that translocates FoxO to the nucleus and
activates transcription, and poly-ubiquitination that targets for degradation. Also, 14-3-3 binding and
Akt phosphorylation are involved in the degradation pathway.
Arginine methylation is another posttranslational modification that will lead to FoxO exclusion from the
nucleus.
In human cancers, there are many tumor suppressors that can also be degraded by the ubiquitin
pathway, like p53, p27KIP1
,p130 and p57KIP2
.[13][15]
1.3.4 FoxO transcription factors and Drug Resistance
It has been described that FoxO transcription factors also have a role in promoting drug resistance.
MDR (Multi-Drug Resistance) is characterized by enhanced cell survival, increased DNA damage
repairs and modified cellular drug uptake, efflux or metabolism. The signaling PI3K/Akt pathway is
increased in cancerous cells. FoxO members, especially FoxO3, are active in response to anticancer
10
drugs, as doxorubicin, that induce apoptosis by generating ROS (reactive oxygen species). Oxidative
stress induces Foxo3 activation, by its nuclear translocation in mammalian cells, and it also induces
the stress activated kinase p38-MAPK. It was also shown that, despite their ability to execute cell
cycle arrest and death programs, FoxO can also promote cell survival by amplifying PI3-K/Akt
signaling. The multidrug resistant gene (MDR1 or ABCB1- cellular membrane transporter that
mediates ATP-dependent efflux of a wide variety of hydrophobic anti-cancer drugs like taxanes,
anthracyclines and other chemotherapeutic drugs, that enter freely in the cells by passive diffuson) is
a target of FoxO3 in leukaemic cells. The drug-resistance is probably acquired by re-programming of
post-translational modifications.[18]
In paclitaxel treatments, JNK can activate FoxO3a indirectly by inhibiting PI3K-AKT or directly through
FoxO phosphorylation. ERK and Akt inactivation by JNK also induces FoxO3a nuclear localization and
regulation of target genes (p27kip1 and Bim). Treatment with doxorubicin induces cell cycle arrest and
cell death in breast cancer cells, and subsequent p38 induction, with FoxO3a nuclear relocalization.
The doxorubicin induced nuclear localization of FoxO3a was shown to be due to phosphorylation of
Ser-7, by the stress activated protein kinase p38. This event is likely to exist in every cell lines. P38
can also phosphorylate and activate tumor suppressors p53 and p73, in response to UV radiation and
chemotherapeutic drugs.[19]
FoxO3 is also a p53 target gene, and together they can be part of a regulatory transcriptional network,
important in aging and cancer. This topic will be further discussed below.[20]
11
1.4 Tumor suppressor p53
The tumor suppressor p53 is a 53 KDa protein. It has anti proliferative effects as growth arrest,
apoptosis and cell senescence. It was discovered to be essential in cell cycle arrest, in response to
irradiation and DNA-damaging agents, and also to regulate gene expression as a sequence specific
transcription factor, forming a homotetramer on the target gene response elements. Induction of stress
signals as oncogene assaults, chemo- or radiation-induced DNA damages, hypoxia or nucleotide
depletion leads to an accumulation of p53 protein in normal cells, triggering the transcription of various
p53 target genes. P53 is considered as a cellular gatekeeper. In 50% of all human cancers, p53
exhibits mutations, leading to accumulation of a dysfunctional protein. In the other 50%, there are
abnormalities with the p53 pathway. In normal cells, p53 has been shown to also have a role, in
homeostatic regulation of energy-producing processes, coordination of overall rate of biosynthesis and
mobilization of defenses against reactive oxygen species.[21][22][23][24]
1.4.1 p53 – Stabilization and Activation
There are two necessary processes by which p53 is induced in response to DNA-damage,
stabilization and activation (from the ‘latent’ to active form).[23]
The pathways by which p53 is degraded include Mdm2 (mouse double minute 2) and JNK proteins,
that are responsible for p53 constitutive instability. Mdm2 is a product of an oncogene amplified in
several tumors and it’s a p53 transcription factor inhibitor. In response to genotoxic stress, Mdm2
binds to p53 at residues 17-22 and signals p53 for degradation. Some enzymes can be activated that
will modify p53 and its interaction with its negative regulator, and also some signals can prevent the
degradation of p53 by inducing p14ARF
which blocks Mdm2.[21][23]
12
JNK, another E3 ubiquitin-ligase, can play two different roles when it comes to p53 stabilization. If it’s
inactive, it binds to 97-116 residues and targets p53 to degradation by the proteasome. If it’s activated,
it phosphorylates threonine 81 and activates p53, repressing its degradation. The signals that activate
JNK are the same that lead to p53 accumulation, like UV, X-radiation and oxidative stress by
hydrogen peroxide. The p53-JNK interaction is in this cases prevented by a peptide.[23]
Other post-translational modifications can be responsible for p53 stabilization. For example,
acetylation can promote stabilization and also transcriptional activity, but Mdm2 can inhibit this
acetylation, mediated by CBP and p300. Ubiquitination and acetylation occur ate the same sites at the
carboxyl terminus.[22]
Activation of p53, that will complement its stabilization, can occur by phosphorylation and acetylation.
The most important residue that undergoes phosphorylation in UV-induced apoptosis is Ser46, by
p53AIP1, p53DINP1 or HIPK2. These events may be dependent of post-translational modifications on
p53. Ser392 is also phosphorylated in response to UV radiation, by a protein complex containing CK2,
hSpt16 and SSRP1.[22]
Figure 1.4 - Mechanisms for p53 transcriptional activation. a) DNA damage induces phosphorylation and acetylation events, p53 tetramerization and transcriptional activation. b) Through unknown mechanisms, the cell may choose a particular fate on the basis of its DNA repair status. C) When DNA repair is not complete or not repairable, the cell may choose growth arrest, apoptosis, or cellular senescence. D) On the other hand, if the repair of DNA is complete, deacetylases (such as Sir2α and PID/HDACI) may provide crucial p53 deacetylation activity to shut off p53-dependent transcription. E) Mdm2 regulates p53 levels until the next DNA damage signal is received. Nicotinamide and TSA are Sir2α and PID/HDAC1 inhibitors, respectively. A- acetylation; P- Phosphorylation; PCAF- p300/CBP associated factor; TFs- transcription factors; TSA – trichostatin A.[22]
13
Acetylation is another important modification for p53 activation. It is an important modification of
histones that leads to an increased transcriptional activity. The acetylation processes have three
potential roles: in the first place, they contribute to p53 stabilization; they can also induce
conformational rearrangements in the C-terminus that increase DNA binding capacity, and finally,
these processes can regulate the compartmentalization of p53 between nucleus and cytoplasm.[23]
CBP/p300 is a co-activator of p53, and possesses a histone acetyl transferase (HAT) activity. The
acetylation consequences vary from increased DNA binding, enhancement of stability and changes in
protein-protein interactions, and it’s enhanced in stress situations. The residues that suffer acetylation
are mainly Lys372, Lys 381, Lys 382 and also Lys320.
Acetylation can be reversed by Sirt1, and it’s crucial for p53 ubiquitination and degradation.[22]
1.4.2 p53- Ubiquitination and Degradation
In normal cells, p53 is ubiquitinated in the nucleus and the shuttled to the cytoplasm, where it’s
recognized for degradation by the proteasome. When DNA damage occurs, p53 induction is triggered
due to the need of increasing its levels. The ubiquitination inhibition and further degradation, is made
by the tumor suppressor gene 101 (TSG101) and c-Abl.[22]
P53 can be stabilized by Mdm2-independent mechanisms, like stabilization by reduced nicotinamide
adenine dinucleotide (NADH) quinone oxidoreductase 1 (NQO1) and NQO2, specific for oxidative
stress and that prevents degradation of p53.[21][22]
1.4.3 AMP-Activated Protein Kinase regulation
When there are low stress signals or even none, p53 regulates the availability of nutrients, growth
factors and hormones, and the overall rate of biosynthesis with energy status of the cell.[21]
For cells to undergo division it is necessary that the energy supplies are enough to produce ATP and
to macromolecular synthesis. When the energy supplies are low, and so is the ATP levels, adenylate
cyclase converts molecules of ADP to AMP and ATP, to compensate.
There are evidences that G1/S transition in mammalian cells depends on glucose availability by AMPK
(AMP-activated protein kinase). AMPK can phosphorylate its substrates and turn off ATP consuming
pathways; also it can activate energy production, by stimulating glucose uptake, fatty acid oxidation
and mitochondrial repair.[21][25]
If there is a state of glucose restriction a reversible cell cycle arrest is necessary, but the presence of
amino acids and growth factors is required, to support the TOR-dependent growth.[25]
14
The AMPK has one catalytic unit (α) and two regulatory units (β and γ). When there is a signal of
DNA-damage, p53 activates transcription of the genes for β-subunits of AMPK. These subunits are
involved in the localization and activity of this kinase.
AMPK controls p53, by inducing modifications and activation of p53 promoter. An upstream kinase,
LKB1, also control p53 activity, by forming a complex and by direct or indirect phosphorylation of the
residues Ser15 and Ser392.[21]
It seems that AMPK activates a nutrient-sensitive signaling pathway that leads to a p53-dependent cell
cycle arrest, when there is energy deficiency.
Although the activation of p53 by DNA-damage leads to a low rate of survival, its metabolic activation
is related to enhance survival ability by the cells to glucose depletion. [25]
The cell cycle arrest proposed at G1/S transition, in the presence of low glucose levels is a metabolic
checkpoint that depends on AMPK and also p53, but occurs even in conditions when mTOR pathway
is not inhibited. The mTOR pathway is an important switch between catabolic and anabolic processes.
Its stimulation on the presence of nutrients, growth factors and hormones will lead to a major protein
synthesis, increasing cell growth and proliferation.[21][26]
As it was said, p53 regulates β-subunits of AMPK, activating TSC2, inhibition of Raptor and
downregulation of mTOR kinase. It can also be downregulated by activation of AMPK by p53
modulated Sesn1 and Sesn2 (sestrins). Inhibition of the mTOR pathway by p53 can also lead to an
increase in autophagy. P53 can also induce autophagy by inducing the p53-activated gene DRAM.[21]
The stabilization and transcriptional activation of p53 in this metabolic checkpoint occurs by direct
phosphorylation of Ser15 by AMPK, leading to cell survival. On the contrary, it is also been described
that under the same conditions, glucose depletion, AMPK activation phosphorylates Ser46, up-
regulating p53 and leading to cellular apoptosis. The AMPK- and p53- dependent responses to low
glucose levels can vary according to the cellular type.[21][26]
1.4.4 Doxorubicin induces genotoxic stress, activating p53
Doxorubicin, an anthracycline antibiotic, is widely used in cancer treatment, produces genotoxic stress
both in carcinoma and non-carcinoma cells. Its side effects in non-carcinoma cells limit its utilization,
especially in cardiomyocites. ROS have been described has having an important role in doxorubicin-
induced cardiomyopathy, and some antioxidants have been shown to decrease this negative effects.
A recent study showed that in doxorubicin treated MEF cells, there was an activation of AMPK,
leading to an increase in apoptosis. In the same study, it was seen that in treatments under 4 hours,
there would be an inhibition of apoptosis, probably due to an increase in ROS.
15
When there is signaling for DNA-damage, the ataxia- telangiectasia mutated (ATM) protein kinase is
activated, inducing a two-phase dynamics of p53, that can be responsible for anti- or pro-apoptotic
functions. When cells lack AMPK, ATM is phosphorylated, and that could be the reason for the
increased sensitivity of these cells to doxorubicin-induced DNA damage. So, AMPK may play an
important protective role against doxorubicin induced cellular apoptosis.
The accumulation of p53 is necessary for doxorubicin induced cellular death, and could be induced by
an ATM dependent pathway. In MEF cells treated with doxorubicin, AMPK phosphorylates Ser15 of
p53.
AMPK activation will interfere with p53 stability through p53 acetylation, meaning that an inhibition of
AMPK increases doxorubicin induced p53 acetylation. This acetylation can be reverted by Sirt1 (class
III NAD+-dependent deacetylase) as it was said here before. During doxorubicin-induced genotoxic
stress in MEFs, AMPK also regulates p53 stability and function, by regulation of Sirt1 mediated
deacetylation.[26]
1.4.5 P53 can negatively regulate IGF-1-AKT pathway
As it was already mentioned in the previous chapter, Akt or protein kinase B, stimulates cell
proliferation by blocking p27kip1
and activating c-myc and cyclin D1. It inhibits Bad, Mdm2 and FoxO
proteins through activation of NFkB, decreasing apoptosis.
IGF-1, insulin-like growth factor, and insulin regulate Akt pathway, by signaling the availability of
nutrients in the organism. Its binding to tyrosine kinase receptor IGF-1R recruits PI3K.
The protein p53 can regulate in a negative manner the IGF-1-Akt pathway. The activation of p53 leads
to a decrease of the activity of IGF-1/Akt pathway and several changes in metabolism. IGF-BP3
encodes an IGF1 encoding protein, and its activation by p53 inhibits IGF1. P53 also stimulates PTEN,
reducing Akt activity, glycolysis, fatty acid synthesis and increased β-oxidation of lipids.[21]
1.4.6 p53 and metabolism
Some of the effects of p53 inhibition are deficient mitochondrial biogenesis, a decrease in oxygen
consumption and stimulation of glycolysis, seen by increasing levels of lactate. There are evidences
that mitochondrial ATP synthesis is dependent on p53, like for example an increase in ATP synthesis
by mitochondrial respiration, comparing to glycolysis. When p53 is inhibited, the values are reversed,
and the there is more ATP produced by glycolysis.
16
P53 can also affect the glucose metabolism. It can retard glucose uptake by repressing GLUT1 and
GLUT4, that encode glucose transporters, and it can stimulate glucose uptake by increasing the
transcription of Hexokinase II gene, that converts glucose to glucose-6-phosphate. An up-regulation of
Hexokinase II is seen in cancer cells, but a mild activation can be a part of the pro-survival functions of
p53, helping the recovery from the metabolic checkpoint.[21]
1.4.7 The Warburg effect
Cancerous cells exhibit a specific metabolic pattern, presenting a shift from respiration to fermentation.
This is called the Warburg effect, and it’s characterized by a bigger production of lactate from glucose
than in normal cells, performing lactic fermentation even in aerobic conditions. As for the normal cells,
they present the Pasteur effect, that is characterized by inhibition of lactate production in the presence
of oxygen .[27][28]
Metabolic regulation can be affected by every major oncogene and tumor suppressor, with varying
mechanisms.
As it was already referred, glycolysis is suppressed by p53, by elevating expression of TP53-induced
glycolysis and apoptosis regulator TIGAR- a fructose-2,6-biphosphatase. It also promotes oxidative
phosphorylation, by enhancing the expression of cytochrome c oxidase-2, necessary for the assembly
of the cytochrome c oxidase complex of the electron transporter chain. An inhibition/loss of p53 in
tumor cells facilitates the Warburg effect, increasing glycolysis and decreasing oxidative
phosphorylation.[28]
1.4.8 FoxO and p53
In situations of stress stimuli or nutrient deprivation, the FoxO3a transcription factor interacts with p53
in the nucleus, at least when both proteins are overexpressed. They also share similar target genes,
as p21, GADD45, WIP1, PA26. Both p53 and FoxOs are phosphorylated and acetylated in response
to stress stimuli and UV radiations, and both bind to SIRT1 deacetylase. [14]
P53 induces the activation of SGK that inhibits FoxO3a by its phosphorylation and relocalization to the
cytoplasm. On the other hand, FoxO3a prevents p53 from repressing SIRT1 gene expression. SIRT1,
with increased expression when insulin is low, deacetylates p53 and FoxO transcription factors.[14]
P53 regulates the expression of FoxO3a by binding to a site in the second intron of the gene.
Recent studies suggest that there could be a connection between genes that extend lifespan and
suppressing tumorigenesis. FoxO3 and p53 may be part of a common regulatory complex. It was
found that in MEFs and lymphocytes, p53 is a direct upstream transcriptional activator of the FoxO3

17
gene in response to DNA-damage by doxorubicin. FoxO3 is not necessary for p53 dependent cell
cycle arrest, but it may have a role in p53-dependent apoptosis.[20]
FoxO3 transcription factor functions may increase p53 pro-apoptotic activity. P53 and its
transactivating isoform TA-p73 bind to p53 response element (p53RE) of the endogenous FoxO3
gene in the adult mouse liver, recruits the acetyltransferase p300 activating the chromatin structure
and expression of FoxO3.[29]
18
1.5 Peroxisome Proliferator-Activated Receptors
The peroxisome proliferator-activated receptors are ligand activated transcription factors that mediate
the effect of unsaturated fatty acids and certain drugs on pathways. They belong to the nuclear
receptor superfamily and have three different subtypes, PPARα (NR1C1), PPARβ/δ(NR1C2) and
PPARγ (NR1C3).[30][31]
Although they share a high level of sequence and structural homology, each one of them has distinct
physiological functions and different tissue expression patterns. PPARα is found mainly in brown
adipose tissue, liver, kidney, heart and skeletal muscle, tissues with high rates of fatty acid catabolism.
The genes controlled by this PPAR are the ones involved in reverse cholesterol transport and
degradation of free fatty acids through peroxisomal and β-oxidation pathways. PPARγ is found
especially in adipose tissue, and at lower levels in heart, colon, kidney, spleen, intestine, skeletal
muscle, liver and macrophages. Its main role is in adipocyte gene expression and differentiation, but
also as a regulator of target genes involved in glucose and lipid metabolism. PPARβ/δ is the least
studied PPAR, and it’s believed to be expressed ubiquitously. It may have a role in the regulation of
fatty acid catabolism, energy metabolism and reverse cholesterol transport, additionally it was also
shown that it could improve insulin resistance and reduce plasma glucose in animal models of type 2
diabetes.[31]
1.5.1 Trancriptional regulation by PPAR
Transcriptional regulation by PPARs requires heterodimerization with RXR (Retinoid X Receptor), also
a member of the nuclear receptor superfamily. The activation of the PPAR/RXR heterodimer requires
a ligand, and then it binds to DNA response elements (PPRE), to induce transcription. These DNA
response elements are present in and around the promotor of the target genes. PPARs can also
repress transcription by interfering with other transcription factors- transrepression.[30]
It is described that PPARs modulate the expression of genes involved in regulating glucose, lipid and
cholesterol metabolism. Interferences in these pathways can lead to obesity, diabetes and
cardiovascular disease, making PPARs attractive therapeutic targets.[31]
In the present study, it was mainly PPARα that was studied, and also PPARγ.
19
1.5.2 PPARα
As it was already referred, PPARα is highly expressed in organs with a significant catabolism of fatty
acids. It was seen that this member of the PPAR family is activated by natural fatty acids and the
identification of target genes was centered on cellular lipid metabolism, mainly in hepatocytes. They
also can attenuate inflammatory responses. The first target gene identified for PPARα was acyl CoA,
involved in peroxisome fatty acid β-oxidation. After that another target genes were found, that were
present on transport and cellular uptake of fatty acids, intracellular fatty acid binding and activation,
microsomal ω-oxidation, peroxisomal β-oxidation and ketogenesis, synthesis of lipoproteins and
glycerol metabolism.[30]
PPARα doesn’t only regulate oxidation of fatty acids, but it also regulates the metabolism of amino-
acids. It was found to interfere in the expression of genes involved in trans- and deamination of amino-
acids and urea synthesis.[30]
The increase in the expression of fatty acid oxidation, ketogenic genes and also cytosolic and
mitochondrial glycerol 3- phosphate was shown to be PPARα dependent, in fasting. These evidences
showed that PPARα is a direct stimulator of hepatic glycerol metabolism and influences hepatic
glucose production during fasting .[30]
Studies made with activation of PPARα by its pharmacological ligand, WI14643, showed that there
was an increased expression of genes involved in lipid and glucose metabolism and genes associated
with peroxisome biogenesis, cell surface recognition function, transcription, cell cycle and apoptosis.
Besides the liver, PPARα is also highly expressed in the small intestine due to exposure to its agonist
via diet, where it was shown to induce transcription factors and enzymes connected to sterol and bile
acid metabolism, like SREBP-1. On the other hand, genes involved in cell cycle and differentiation,
apoptosis, and host defense repressor. In the white adipose tissue, although it’s expressed in much
lower levels than PPARγ, it may influence adipose tissue remodeling. In the skeletal muscle, it was
shown to be involved a metabolic reprogramming in muscle fibers, characterized by a switch from
glucose utilization to fatty acid oxidation pathways, which leads to muscle glucose intolerance and
insulin resistance.[30]
20
1.5.3 PPARβ
The PPARβ isoform is the least studied of this family and it is thought to have merely a housekeeping
role. Lack of PPARβ may lead to multiple developmental and homeostatic abnormalities, like
decreased adipose mass, myelination defects, altered skin inflammatory responses, a shift in muscle
fiber composition towards type I muscle fibers and impaired wound healing.[30]
1.5.4 PPARγ
The main role of the third member of this family, the PPARγ, is in adipogenesis and its effects have
been studied in 3T3-L1 adipocyte model. It is the key transcription factor in the adipogenesis program
and it is essential for adipocyte survival. PPARγ also regulates lipid metabolism, insulin sensitivity,
cardiovascular disease, inflammation, organ development and tumor formation.[30][32]
1.5.5 PPARα and Metabolism
PPARα importance in energy stores was shown by experiences made with PPARα-deficient mice that
developed hypoglycemia, hypoketonemia and fatty liver, in fasted states. Although fatty acids are
thought to be natural ligands for PPARα, this is not fully understood .[33]
Carbohydrate and lipid metabolism is also coordinated in hepatocytes by SREBPs proteins (sterol
regulatory element binding proteins). SREBP-1c stimulates fatty acid synthesis, is involved in de novo
lipogenesis when carbohydrates are abundant and is affected by levels of glucagon and insulin, critical
hormones in glucose homeostasis and the oxygen receptor LXR. SREBP-2 stimulates cholesterol
synthesis and its expression is affected by cholesterol availability. SREBPs are both regulated by
fasting/feeding and can be affected by fatty acids.
PPARα and SREBPs activation by hepatic fatty acids can have different sources. Fatty acids can
come from “new” fat, if they’re synthesized from carbohydrates. The “new” fat is retained in the liver,
for storage, energy production or synthesis of structural and signaling lipids, or exported in VLDL to
peripheral tissues for metabolism or storage. The stored/ “old” fat is released from adipose tissue into
the circulation. When fatty acids are not utilized for energy, they return to the liver. It is thought that the
fate of the fatty acids may depend on their site of origin.[33]
It was shown that mice in the fasted state lacking the capacity to synthesize fatty acids – FAS
inhibition- had the same response that PPARα-deficient mice, developing fatty liver, hypoglycemia and
decreased expression of PPARα target genes. These consequences could be reverted with the
administration of a potent PPARα agonist. On the contrary, the cholesterol phenotype in the FAS
21
knock-out mice was not dependent on diet. The serum and hepatic cholesterol, the increasing
SREBP-2, decreased HMG-CoA reductase gene expression regardless the dietary fat availability can
also be normalized by pharmacologically activating PPARα, so the metabolic abnormalities in FAS
inhibited mice may be caused by the PPARα unavailability.[33]
The model described in literature is that the new fatty acids are PPARα endogenous activators. FAS
knock-out mice are protected by the hypoglycemia/steatohepatitis when new fat is absorbed by diet
activating PPARα, promoting gluconeogenesis and fatty acid oxidation. New fat produced by FAS
accesses a separate pool of PPARα that stimulates cholesterol biosynthesis, gluconeogenesis and
fatty acid oxidation. It was concluded that specific fatty acid pools synthesized by hepatic FAS or
derived from the diet activate PPARα to impact glucose and lipid metabolism. The same doesn’t occur
with the old fat, the one stored in the liver after transfer from the periphery (Figure 1.5).[33]
Since FAS is a cytosolic enzyme, and PPARα is a nuclear factor, it is necessary a mechanism to
deliver the cytosolic product to the nucleus and that could make the cell distinguish between old fat
and new fat. One possibility is that lipid binding proteins specific for new fat shuttles fatty acids to the
nucleus. Another possibility is that PPARα can shuttle from the nucleus to the cytoplasm with the aid
of chaperones, promoting an interaction with the new fat pool.[33]
Figure 1.5 - Model for differential effects of hepatic lipid." New" fat is constituted by fat absorbed from the diet or synthezised via FAS in the liver, capable of activating PPARα to ensure normal glucose and lipid homeostasis. The "old" fat constitutes a different hepatic compartment, derived from peripheral mobilization of adipose stores, and it doesn’t seem to activate PPARα as effectively as “new” fat, leading to fatty liver. Dietary fat, contrary to de novo synthesized fat, is inadequate for the maintenance of cholesterol homeostasis, suggesting different PPARα pools.[33]
22
1.6 Cell Death-Inducing DNA fragmentation factor 45-like effector (CIDE)
C/Fsp27
The Cell Death-Inducing DNA fragmentation factor 45-like effector (CIDE) protein family members
were identified initially as mediators of apoptotic cell death. There are three members in this family,
Cidea, Cideb and Cidec (Fsp27 in mouse). Cidea is highly expressed in BAT, Cideb is expressed
mainly in liver, and at lower levels in kidney, small intestine and colon. Cideb can form homo- or
heterodimers with other CIDE family members, in heterologous cells like 293T and COS-7 cells, to
induce caspase-independent cell death. Cidea regulate apoptosis by being induced by TGF-β, and it
was found that it also regulates energy homeostasis in BAT by regulating lipolysis and thermogenesis.
Cideb was also found to have an important role in metabolism, as it regulates diet-induced obesity,
liver steatosis and insulin sensitivity, controlling lipogenesis and FAO in liver.[34]
1.6.1 Fsp27 and metabolism
The third member of the CIDE family is Cidec/Fsp27. It is a 27 KDa protein expressed mainly in WAT.
Fsp27 was found to be a novel lipid droplet that is involved in large unilocular lipid droplets in
adipocytes and is required for the accumulation of triacylglycerols, also decreasing fatty acid oxidation
in these cells. The lipid droplets are composed by a core of TAG, surrounded by a phospholipid
monolayer with various proteins. It is also described that the overexpression of this protein in non-
adipose tissues, results in spontaneous lipid accumulation .[35][36]
When the nutritional role of FSP27 was studied, it was found that between the dietary manipulations
(intermittent fasting, caloric restriction, fasting –refeeding, and fasting), the only that up-regulates
Fsp27 gene expression is intermittent fasting, promoting lipid deposition on adipose tissue. It was also
described that PPARγ, C/EBPα, and insulin are involved in the nutritional regulation of Fsp27.[35]
It is described that another dietary manipulation, caloric restriction, down-regulates human Cidec and
that is probably involved in fatty acid metabolism in cultured adipocytes.[37]
TAG are synthesized from FFAs and glucose in WAT in fed state. These TAG are stored in large lipid
droplets. In fasted state, WAT generates the hydrolysis of stored TAG, generating FFAs and glycerol,
releasing them into the circulation, so they can be used as energy by other tissues. In contrast with
WAT, where the cytoplasm of adipocytes is almost entirely occupied with a large (10-200 µm in
diameter), unilocular, TAG-rich lipid droplet, cells of the liver, muscle, heart, kidney, intestine, BAT and
mammary gland accumulate small lipid droplets.
Depletion of Fsp27 induces multilocularization of large lipid droplets, and this may be related with an
increase in lipolysis. The multilocularization will increase the total surface of lipid droplets and probably
increases the access of lipases to stored lipids. On the other hand, the unilocular lipid droplets may
23
prevents lipolysis by minimizing the accessibility of stored lipid to lipases, and are crucial for efficient
TAG storage in WAT.[36]
In Fsp27-KO mice, it was seen a lean phenotype, an increased metabolic rate and resistance to diet-
induced obesity. This is probably caused by the decreased TAG storage, the increased mitochondrial
biogenesis and the increased energy expenditure in these mice’s WAT. The increase of FFAs and
their metabolites in FSP27-KO mice may stimulate member of the PPAR family in WAT and induce
mitochondrial biogenesis. FFAs have been described to activate PPARα and PPARδ. An increase in
mitochondrial biogenesis and FFA oxidation in adipocytes may be caused by an increase in
intracellular lipolysis.[36]
Perilipin, a lipid-droplet associated protein, regulates the storage of triglycerides and it’s highly
expressed in differentiated adipocytes. Its transcription is controlled by PPARγ2, one of the PPARγ
isoforms. It is described that Cidec colocalizes with perilipin in the surface of lipid droplets and that
cells lacking Cidec mRNA have increased lipolysis. It was shown that PPARγ2 regulates the
transcriptional activity of Cidec in differentiated adipocytes. [32]
Cidea was found to be highly expressed in the mammary glands of pregnant and lactating mice, its
deficiency led to a reduced milk lipid secretion and premature pup death. This was found to be due to
the role of Cidea in inducing XOR (xanthine oxidoreductase) expression, an essential factor for milk
lipid secretion. C/EBPβ mediates the interaction between XOR and Cidea. This member of the CIDE
family is located in the nucleus in lactating mammary glands, BAT and cultured MECs. The residues
responsible for Cidea interaction with C/EBPβ were found to be crucial for its nuclear location and
XOR induction. Cidea is considered a C/EBPβ transcriptional coactivator. Fsp27 is also located in the
nucleus, and in lipid droplets, and interacts with C/EBPβ in white adipocytes, so there is the possibility
that it also functions as a coactivator of C/EBPβ.

24
25
2. Goal of this thesis
This thesis has as main purpose to study new mechanisms that regulate genes involved in
ketogenesis.
It was already known from previous studies that doxorubicin, a DNA damaging agent, induced p53
activation, and this will lead to an induction of HMGCS2. Here, the objective was to see if the FoxO
family members, FoxO3a and FoxO1, were responsible for HMGCS2 induction by p53 activation.
The second one implied finding a regulatory role for Fsp27 in mouse liver and its role in PPAR
signaling.
After checking this hypothesis, it was decided to proceed to a different objective,
With the growing interest for the role of Fsp27, here the objective was to seek for a regulatory role for
Fsp27 in mouse liver, involving PPAR signaling.
.

26
27
3. Materials and Methods
3.1 DNA obtainment
To obtain the DNA of the constructs used in this work, first a PCR was made, with Taq polymerase,
dNTPS, specific primers and the DNA (genomic or cDNA) to amplify. The amplified product was run in
an agarose gel to check the product size. The band of interest was cut from the gel and purified with
the Wizard SV Gel and PCR Clean System kit (Promega), according to the manufacturer’s
instructions.
After quantification of the purified product on Nanodrop 1000 Spectrophotometer, the product was
inserted in a pGEM-T vector, according to the protocol pGEM-T and pGEM-T easy vector (Promega).
The DNA was transformed into competent cells DH5α (E.coli), previously prepared by salt washes
(CaCl2) to permeabilize them, and frozen at -800C, and then plated on agar plates, with ampicillin, X-
gal and IPTG, for selection.
The plates were left at 37ºC o/n, and then the positive white colonies were chosen, that can’t
metabolize X-gal, having the polilynker disrupted because of the insert. The negative blue colonies
have a functional LacZ.
The positive colonies were left to grow o/n in 2mL LB inoculums, with antibiotic (ampicillin).
The DNA from the inoculums was obtained with the Kit Pureyeld Plasmid Miniprep System (Promega).
After quantification, the insert was released from pGEM-T, with restriction enzymes specific for the
sequence amplified (Annex – 6.1 Constructs), ran in an agarose gel, the bands were purified and
finally, the insert was cloned into the vector of interest (pGL3b, pcDNA3, pDS-red-N1 express).
A new transformation was made, with plates with ampicillin for pGL3b and pcDNA3 vectors, and with
kanamycin for pDsRed-Express-N1 vector, and in the next day a PCR screening was made, to check
which colonies were positive. The positive colonies shown in the agarose gel were sent to sequence
and when the results came, the DNA was obtained with the PureLink HiPure Plasmid Filter Maxiprep
Kit (Invitrogen).
3.2 Cell lines and Maintenance
To develop this project there were used two different cell lines. First, it was used the AML12 (alpha
mouse liver) cell line (ATCC CRL-2254) , a cell line established from hepatocytes from a mouse (CD1
strain line MT42) transgenic for human TGFα.
Cells were cultured in DMEM/F12 (1:1) – Dulbecco’s Modified Eagle’s Medium/Nutrient F12-Ham
(Gibco ref.31330-038), supplemented with 10% (v/v) Fetal Bovine Serum, antibiotics penicillin (100
units/mL) and streptomycin (100 µg/mL), 0.1 µM dexamethasone (Sigma-Aldrich D4902) and 5 µg/ml
insulin, 5 µg/mL transferrin and 0.005 µg/mL selenium (Roche- 11 074 547 001). For the doxorubicin
treatments, the medium used was DMEM No glucose 1x (Gibco ref. 11966025), with L-Glutamine.
28
For the SiRNA transfections, the medium used was the DMEM/F12, supplemented the same way as
before, but without antibiotics.
The other cell line utilized was the HeLa (Human cervical adenocarcinoma) cell line (ATTCC NO.CCL-
2), cultured in DMEM – Dulbecco’s Modified Eagle’s Medium, prepared in the laboratory,
supplemented with 10% Fetal bovine serum, antibiotics penicillin (100 units/mL) and strepromycin
(100ug/mL)- Gibco 15140-122, L-glutamine 200 mM – Gibco 25030-024, and sodium bicarbonate
solution 7.5%- Sigma Aldrich S8761.
The cells were incubated at 37ºC in a humidified atmosphere with 5%CO2. The culture medium was
changed every 2 or 3 days, and to pass the cells, they were first rinsed twice with PBS, and then a
0,05% trypsin-EDTA (Gibco 15400-054) solution would be added. After about 4 minutes for AML12
cells, and 2 minutes for HeLa cells at 37ºC, the trypsin-EDTA was deactivated by adding complete
growth medium. The cells were then plated for maintenance with dilutions according to their
confluence, or counted to proceed to experiments.
For transfections, a serum-free medium was used –OptiMem I (Gibco 31985-047).
3.3 Reagents used for cell line treatments
Doxorubicin hydrochloride (Sigma-Aldrich D1515)- Anthracycline antibiotic used as a
chemotherapeutic drug. Dissolved in Ethanol for 1 mM;
WY14643 (Sigma-Aldrich,C7081)- Selective PPARα agonist. Dissolved in DMSO to 10 nM.
3.4 Reagents used for transfection experiments
Lipofectamine LTX reagent (Invitrogen, 15338-100);
Dharmafect 4 transfection Reagent (Thermo Scientific, T-2004-01).
29
3.5 Transient Transfection and Luciferase assays
AML12 cells were plated at 1x10⁵cell/well, in a 24 MW 24 hours before transfection. To tranfect the
DNA, it was used the Lipofectamine LTX reagent, at a proportion of 2.5 µL LTX to 1 µg of DNA. 48
hours after transfection, cellular extracts were prepared by washing with PBS and harvested in 100 uL
1x Passive lysis buffer (Promega) for analysis of Luciferase activity. Aliquots of 10 µL of lysates were
used, with the Dual-Luciferase Reporter Assay System (Promega- E1960). The relative Luciferase
activity was given as the ratio between relative luciferase unit/relative Renilla unit.
3.6 siRNA transfection
FoxO1, FoxO3a and SiControl nontargeting (D-001210-01) were purchased from Dharmacon
(Thermo Fisher). AML12 cells were plated in 6-well plates, at 2.5x10⁵ cell/well. The transfections were
performed according to Dharmacon instructions, with 6,4 µL of Dharmafect-4 and 25 nM of siRNA final
concentration per well. After 72 hours of transfection, the cells were rinsed with PBS and then total
protein and RNA extracts were isolated, for Western Blot assays and real time PCR analysis,
respectively.
3.7 Protein extraction
The cells plated in a 6-well plate, were washed twice with cold PBS, and then harvested with a rubber
policeman. Then, the cells were centrifuged for 10 minutes, 1000 x g at 4ºC. After discarding the
supernatant, the pellet was lysed with 40-100 µL of NP40 lysis buffer, with agitation for 15-20 minutes
at 4ºC, and after that centrifuged for 5-10 minutes ate 12000 x g at 4ºC. The supernatant recovered
corresponded to the total protein extracts, and was stored at -80ºC.
NP40 lysis buffer – Tris-HCl 50 mM pH8; NaCl 150 mM, NP40 1%, supplemented with protease
inhibitors (Sigma Aldrich) and 0.1 mM phenylmethylsulfonyl (PMSF).
The protein concentrations were estimated by the Bradford method, using the Bio-Rad protein assay
with bovine serum albumin (BSA) as a standard.
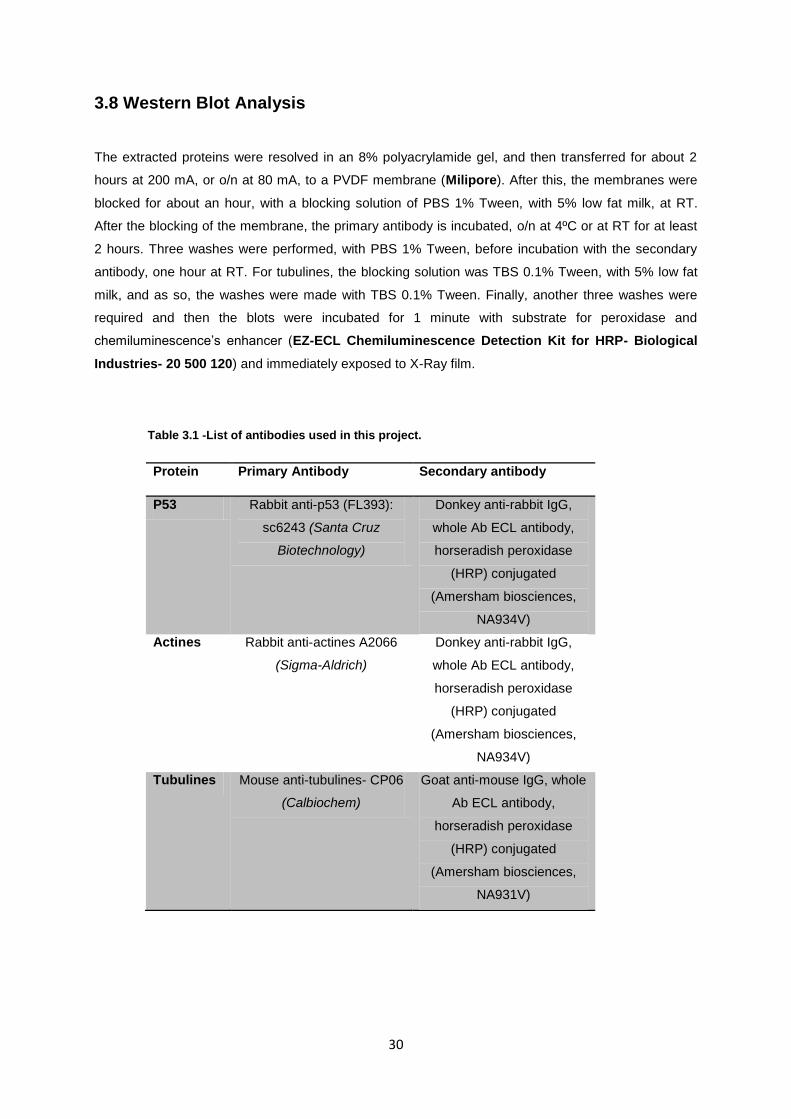
30
3.8 Western Blot Analysis
The extracted proteins were resolved in an 8% polyacrylamide gel, and then transferred for about 2
hours at 200 mA, or o/n at 80 mA, to a PVDF membrane (Milipore). After this, the membranes were
blocked for about an hour, with a blocking solution of PBS 1% Tween, with 5% low fat milk, at RT.
After the blocking of the membrane, the primary antibody is incubated, o/n at 4ºC or at RT for at least
2 hours. Three washes were performed, with PBS 1% Tween, before incubation with the secondary
antibody, one hour at RT. For tubulines, the blocking solution was TBS 0.1% Tween, with 5% low fat
milk, and as so, the washes were made with TBS 0.1% Tween. Finally, another three washes were
required and then the blots were incubated for 1 minute with substrate for peroxidase and
chemiluminescence’s enhancer (EZ-ECL Chemiluminescence Detection Kit for HRP- Biological
Industries- 20 500 120) and immediately exposed to X-Ray film.
Table 3.1 -List of antibodies used in this project.
Protein Primary Antibody Secondary antibody
P53 Rabbit anti-p53 (FL393):
sc6243 (Santa Cruz
Biotechnology)
Donkey anti-rabbit IgG,
whole Ab ECL antibody,
horseradish peroxidase
(HRP) conjugated
(Amersham biosciences,
NA934V)
Actines Rabbit anti-actines A2066
(Sigma-Aldrich)
Donkey anti-rabbit IgG,
whole Ab ECL antibody,
horseradish peroxidase
(HRP) conjugated
(Amersham biosciences,
NA934V)
Tubulines Mouse anti-tubulines- CP06
(Calbiochem)
Goat anti-mouse IgG, whole
Ab ECL antibody,
horseradish peroxidase
(HRP) conjugated
(Amersham biosciences,
NA931V)
31
3.9 RNA extraction and analysis
The cultured AML12 cells were washed twice with cold PBS and then recovered with a rubber
policeman, on TRI reagent solution (Ambion AM9738). The RNA was extracted according to
manufacturer’s instructions. The RNA was ressuspended in DEPC-treated water (Sigma-Aldrich) and
its concentration and purity (A260/A230; A260/A280 )were checked in NanoDrop 1000 spectrophotometer
(Nanodrop technologies, Inc. Thermo Scientific). To avoid contaminations with genomic DNA, a
DNAse I (Ambion- AM1906) treatment was made before proceeding.
After the extraction, cDNA was synthesized from 1 µg of total RNA by M-MLV reverse transcriptase
(Invitrogen-28025-013) with random primers (Roche Diagnostics- 1103473001) and dNTPs (Attend
Bio-GC013-001), according to the manufacturer’s instructions.
The mRNA levels were studied by cDNA analysis with a quantitative real-time polymerase chain
reaction (qPCR), with the ABI Prism 7700 Sequence detection system (Applied Biosystems). The
mRNA levels were normalized with 18S ribosomal RNA determined by Eukaryotic 18S rRNA
endogenous control (Applied Biosystems). The mRNA samples were analyzed always in duplicate,
in 96-wells plates.
qPCR analyses: initial activation step -50ºC/2 min;95ºC/10 min; 50 cycles of denaturation- 90ºC/15s;
annealing/extension-60º/1 min. The results were obtained by the comparative Ct method and then
expressed as folds of the control experiment, to further analysis.
Probes (Applied Biosystems):
mHMGCS2- Mm00550050_m1
mFoxO1- Mm00490672_m1
mFoxO3a- Mm01185722_m1
3.10 Fluorescence assays
For the fluorescence assays, HeLa cells were plated in 24-well plates and 24 hours after plating, the
cells were transfected. After 48 hours of transfection, the cells were seen in a Fluorescence
microscope LEICA DMI 4000B.
The images were recorded in the software Leica Application Suite and analyzed in the software
MacBiophotonics Image J Software.

32
33
4. Results & discussion
4.1 Induction of gene expression by Doxorubicin
The first objective was to confirm the induction of the HMGCS2 gene, as well as the induction of the
members of the FoxO family, FoxO1 and FoxO3a.
To do that, it was used the AML12 cell line (alpha mouse liver), grown in a glucose rich medium. The
cells were then treated with doxorubicin, a DNA damaging agent, in previously optimized conditions,
for six hours in the presence of a medium with low glucose, to promote starving and stress responses,
and as so amplify p53 induction.
With a Western Blot analysis (Figure 4.1), it can clearly be seen the induction of p53 protein levels.
This induction will lead to the transcription of p53 target genes.
To analyze the FoxO and HMGCS2 mRNA levels, after a 6 hour doxorubicin treatment the AML12
cells were recovered and the RNA was extracted. Then a Real Time PCR assay was performed.
Figure 4.1 - Doxorubicin promotes p53 protein expression in AML12 cells. Western Blot of total protein extracts of AML12 cells incubated with 3 uM of doxorubicin, for 6 hours, using antibodies to p53 and actines, as control. Lane 1) Untreated cells; lane 2) Doxorubicin treated cells.
P53
α-actines
Doxo - +
1 2
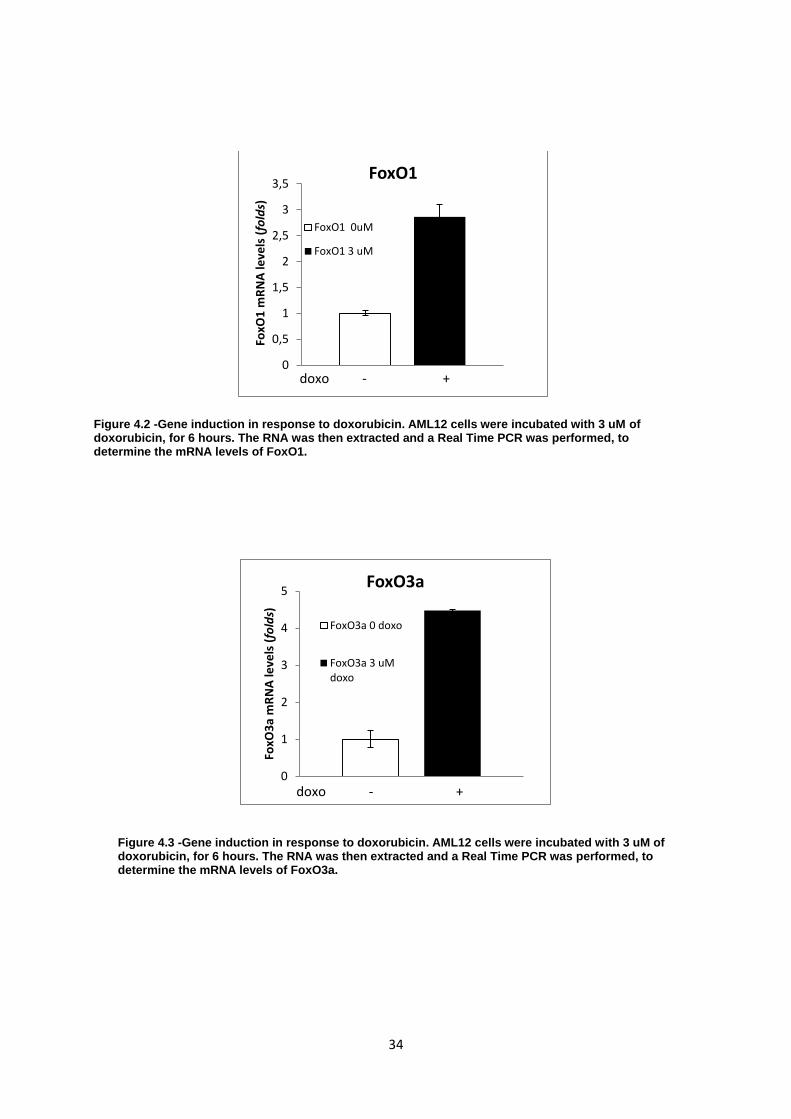
34
0
0,5
1
1,5
2
2,5
3
3,5
Fo
xO1
mR
NA
leve
ls (
fold
s)
FoxO1
FoxO1 0uM
FoxO1 3 uM
doxo - +
0
1
2
3
4
5
FoxO
3a
mR
NA
leve
ls (
fold
s)
FoxO3a
FoxO3a 0 doxo
FoxO3a 3 uMdoxo
doxo - +
Figure 4.2 -Gene induction in response to doxorubicin. AML12 cells were incubated with 3 uM of doxorubicin, for 6 hours. The RNA was then extracted and a Real Time PCR was performed, to determine the mRNA levels of FoxO1.
Figure 4.3 -Gene induction in response to doxorubicin. AML12 cells were incubated with 3 uM of doxorubicin, for 6 hours. The RNA was then extracted and a Real Time PCR was performed, to determine the mRNA levels of FoxO3a.
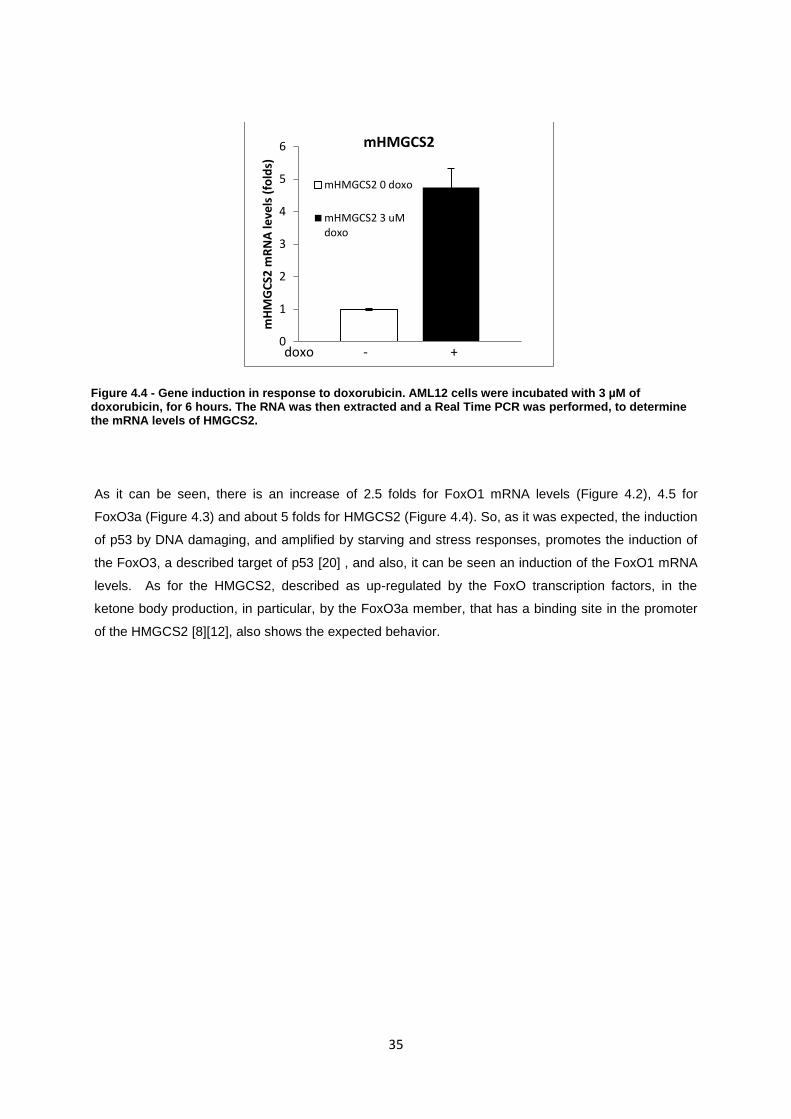
35
As it can be seen, there is an increase of 2.5 folds for FoxO1 mRNA levels (Figure 4.2), 4.5 for
FoxO3a (Figure 4.3) and about 5 folds for HMGCS2 (Figure 4.4). So, as it was expected, the induction
of p53 by DNA damaging, and amplified by starving and stress responses, promotes the induction of
the FoxO3, a described target of p53 [20] , and also, it can be seen an induction of the FoxO1 mRNA
levels. As for the HMGCS2, described as up-regulated by the FoxO transcription factors, in the
ketone body production, in particular, by the FoxO3a member, that has a binding site in the promoter
of the HMGCS2 [8][12], also shows the expected behavior.
0
1
2
3
4
5
6
mH
MG
CS2
mR
NA
leve
ls (
fold
s)
mHMGCS2
mHMGCS2 0 doxo
mHMGCS2 3 uMdoxo
doxo - +
Figure 4.4 - Gene induction in response to doxorubicin. AML12 cells were incubated with 3 µM of doxorubicin, for 6 hours. The RNA was then extracted and a Real Time PCR was performed, to determine the mRNA levels of HMGCS2.
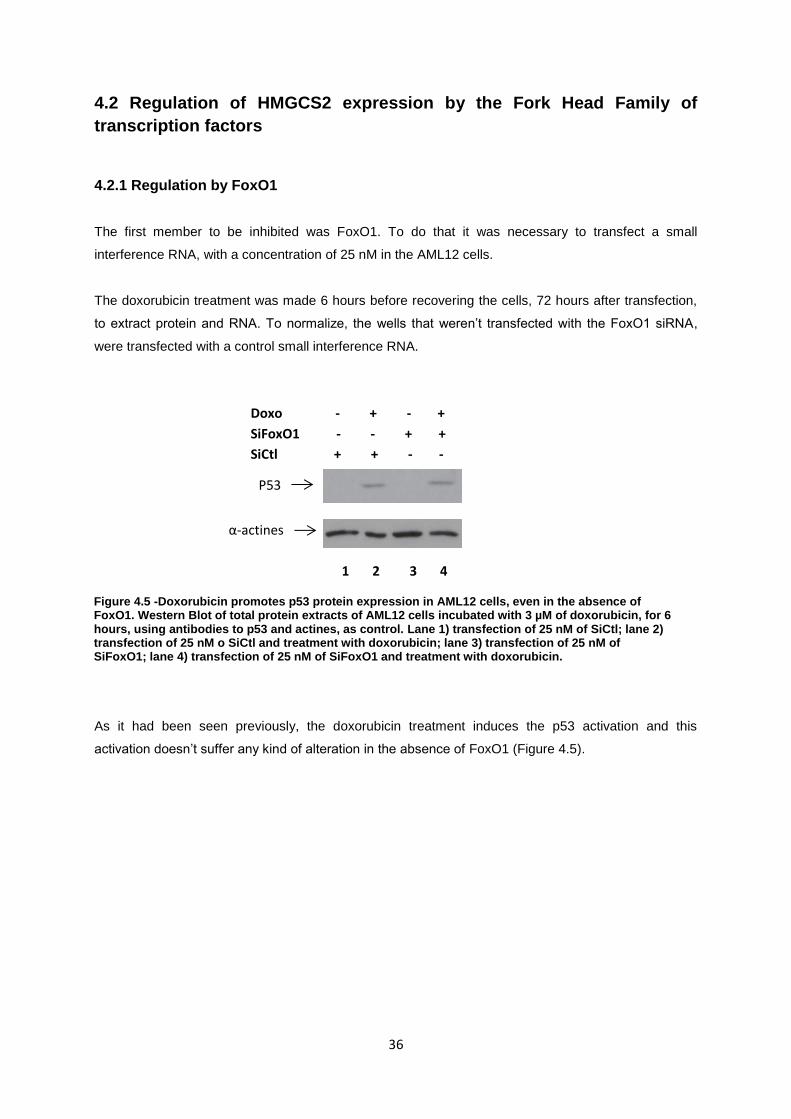
36
4.2 Regulation of HMGCS2 expression by the Fork Head Family of
transcription factors
4.2.1 Regulation by FoxO1
The first member to be inhibited was FoxO1. To do that it was necessary to transfect a small
interference RNA, with a concentration of 25 nM in the AML12 cells.
The doxorubicin treatment was made 6 hours before recovering the cells, 72 hours after transfection,
to extract protein and RNA. To normalize, the wells that weren’t transfected with the FoxO1 siRNA,
were transfected with a control small interference RNA.
As it had been seen previously, the doxorubicin treatment induces the p53 activation and this
activation doesn’t suffer any kind of alteration in the absence of FoxO1 (Figure 4.5).
Figure 4.5 -Doxorubicin promotes p53 protein expression in AML12 cells, even in the absence of FoxO1. Western Blot of total protein extracts of AML12 cells incubated with 3 µM of doxorubicin, for 6 hours, using antibodies to p53 and actines, as control. Lane 1) transfection of 25 nM of SiCtl; lane 2) transfection of 25 nM o SiCtl and treatment with doxorubicin; lane 3) transfection of 25 nM of SiFoxO1; lane 4) transfection of 25 nM of SiFoxO1 and treatment with doxorubicin.
P53
α-actines
Doxo - + - +
SiFoxO1 - - + +
SiCtl + + - -
1 2 3 4
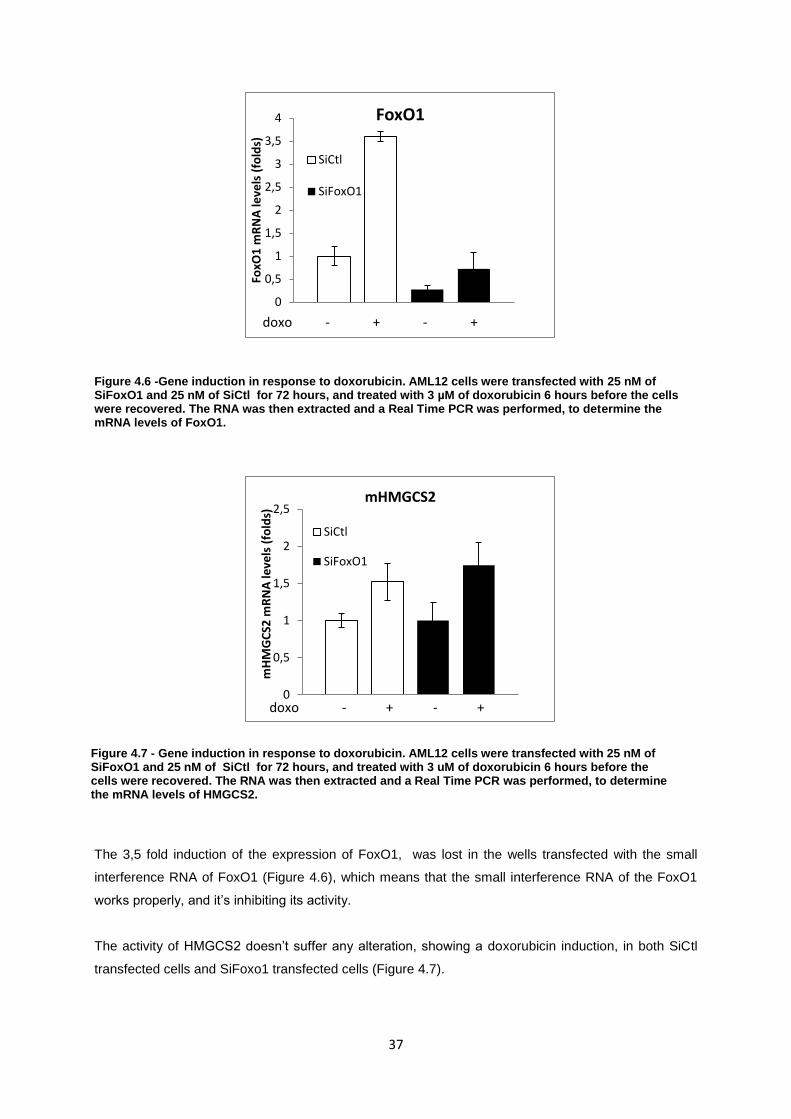
37
Figure 4.6 -Gene induction in response to doxorubicin. AML12 cells were transfected with 25 nM of SiFoxO1 and 25 nM of SiCtl for 72 hours, and treated with 3 µM of doxorubicin 6 hours before the cells were recovered. The RNA was then extracted and a Real Time PCR was performed, to determine the mRNA levels of FoxO1.
The 3,5 fold induction of the expression of FoxO1, was lost in the wells transfected with the small
interference RNA of FoxO1 (Figure 4.6), which means that the small interference RNA of the FoxO1
works properly, and it’s inhibiting its activity.
The activity of HMGCS2 doesn’t suffer any alteration, showing a doxorubicin induction, in both SiCtl
transfected cells and SiFoxo1 transfected cells (Figure 4.7).
0
0,5
1
1,5
2
2,5
3
3,5
4
FoxO
1 m
RN
A le
vels
(fo
lds)
FoxO1
SiCtl
SiFoxO1
0
0,5
1
1,5
2
2,5
mH
MG
CS2
mR
NA
leve
ls (
fold
s)
mHMGCS2
SiCtl
SiFoxO1
doxo - + - +
doxo - + - +
Figure 4.7 - Gene induction in response to doxorubicin. AML12 cells were transfected with 25 nM of SiFoxO1 and 25 nM of SiCtl for 72 hours, and treated with 3 uM of doxorubicin 6 hours before the cells were recovered. The RNA was then extracted and a Real Time PCR was performed, to determine the mRNA levels of HMGCS2.
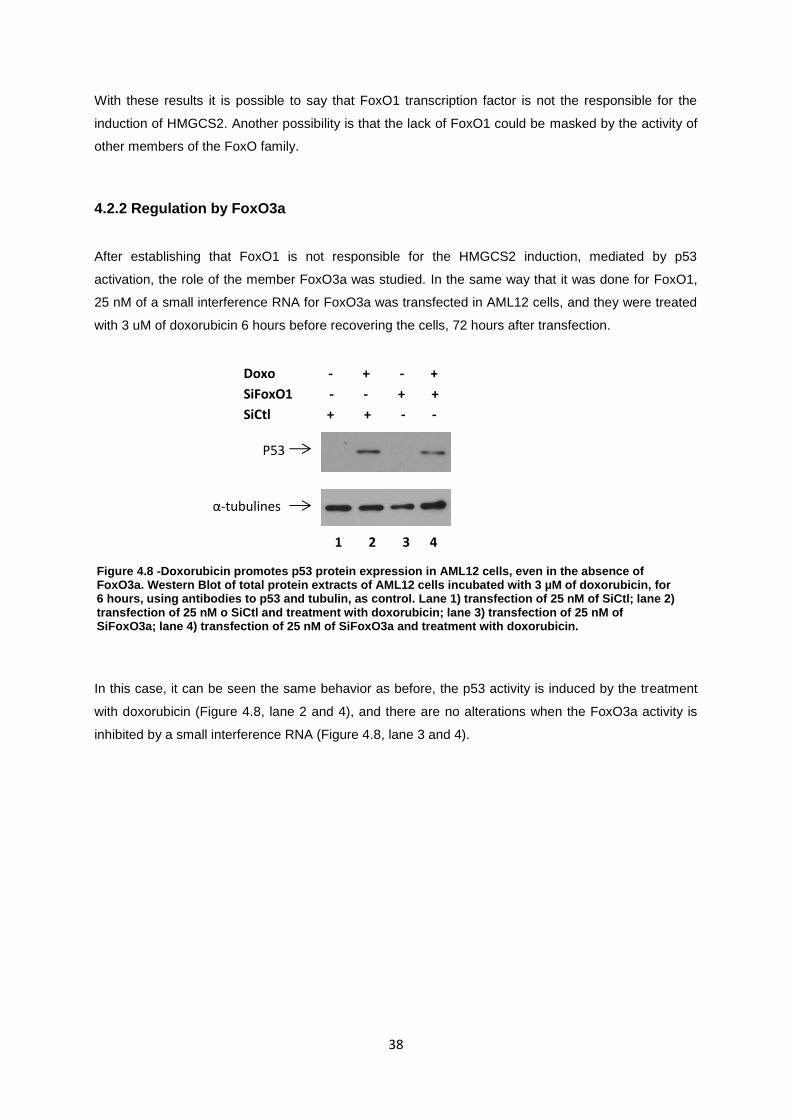
38
With these results it is possible to say that FoxO1 transcription factor is not the responsible for the
induction of HMGCS2. Another possibility is that the lack of FoxO1 could be masked by the activity of
other members of the FoxO family.
4.2.2 Regulation by FoxO3a
After establishing that FoxO1 is not responsible for the HMGCS2 induction, mediated by p53
activation, the role of the member FoxO3a was studied. In the same way that it was done for FoxO1,
25 nM of a small interference RNA for FoxO3a was transfected in AML12 cells, and they were treated
with 3 uM of doxorubicin 6 hours before recovering the cells, 72 hours after transfection.
In this case, it can be seen the same behavior as before, the p53 activity is induced by the treatment
with doxorubicin (Figure 4.8, lane 2 and 4), and there are no alterations when the FoxO3a activity is
inhibited by a small interference RNA (Figure 4.8, lane 3 and 4).
Figure 4.8 -Doxorubicin promotes p53 protein expression in AML12 cells, even in the absence of FoxO3a. Western Blot of total protein extracts of AML12 cells incubated with 3 µM of doxorubicin, for 6 hours, using antibodies to p53 and tubulin, as control. Lane 1) transfection of 25 nM of SiCtl; lane 2) transfection of 25 nM o SiCtl and treatment with doxorubicin; lane 3) transfection of 25 nM of SiFoxO3a; lane 4) transfection of 25 nM of SiFoxO3a and treatment with doxorubicin.
P53
α-tubulines
Doxo - + - +
SiFoxO1 - - + +
SiCtl + + - -
1 2 3 4
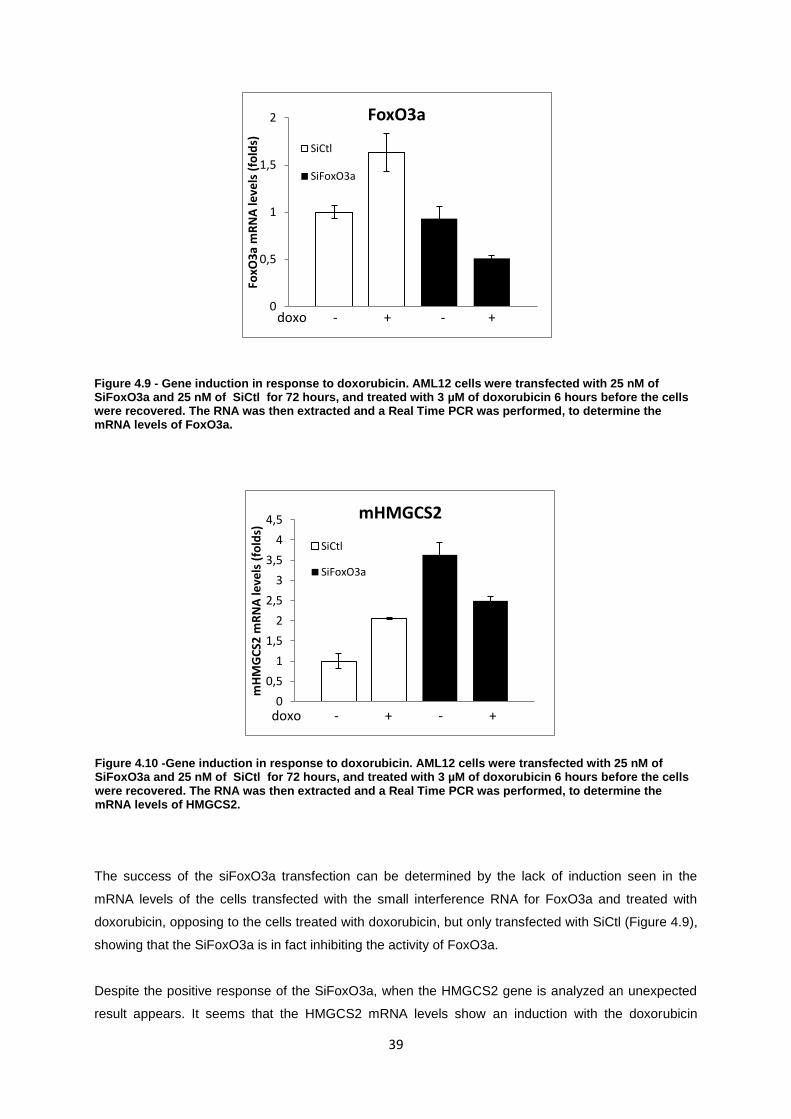
39
Figure 4.9 - Gene induction in response to doxorubicin. AML12 cells were transfected with 25 nM of SiFoxO3a and 25 nM of SiCtl for 72 hours, and treated with 3 µM of doxorubicin 6 hours before the cells were recovered. The RNA was then extracted and a Real Time PCR was performed, to determine the mRNA levels of FoxO3a.
The success of the siFoxO3a transfection can be determined by the lack of induction seen in the
mRNA levels of the cells transfected with the small interference RNA for FoxO3a and treated with
doxorubicin, opposing to the cells treated with doxorubicin, but only transfected with SiCtl (Figure 4.9),
showing that the SiFoxO3a is in fact inhibiting the activity of FoxO3a.
Despite the positive response of the SiFoxO3a, when the HMGCS2 gene is analyzed an unexpected
result appears. It seems that the HMGCS2 mRNA levels show an induction with the doxorubicin
0
0,5
1
1,5
2
FoxO
3a
mR
NA
leve
ls (
fold
s)
FoxO3a
SiCtl
SiFoxO3a
doxo - + - +
0
0,5
1
1,5
2
2,5
3
3,5
4
4,5
mH
MG
CS2
mR
NA
leve
ls (
fold
s)
mHMGCS2
SiCtl
SiFoxO3a
doxo - + - +
Figure 4.10 -Gene induction in response to doxorubicin. AML12 cells were transfected with 25 nM of SiFoxO3a and 25 nM of SiCtl for 72 hours, and treated with 3 µM of doxorubicin 6 hours before the cells were recovered. The RNA was then extracted and a Real Time PCR was performed, to determine the mRNA levels of HMGCS2.
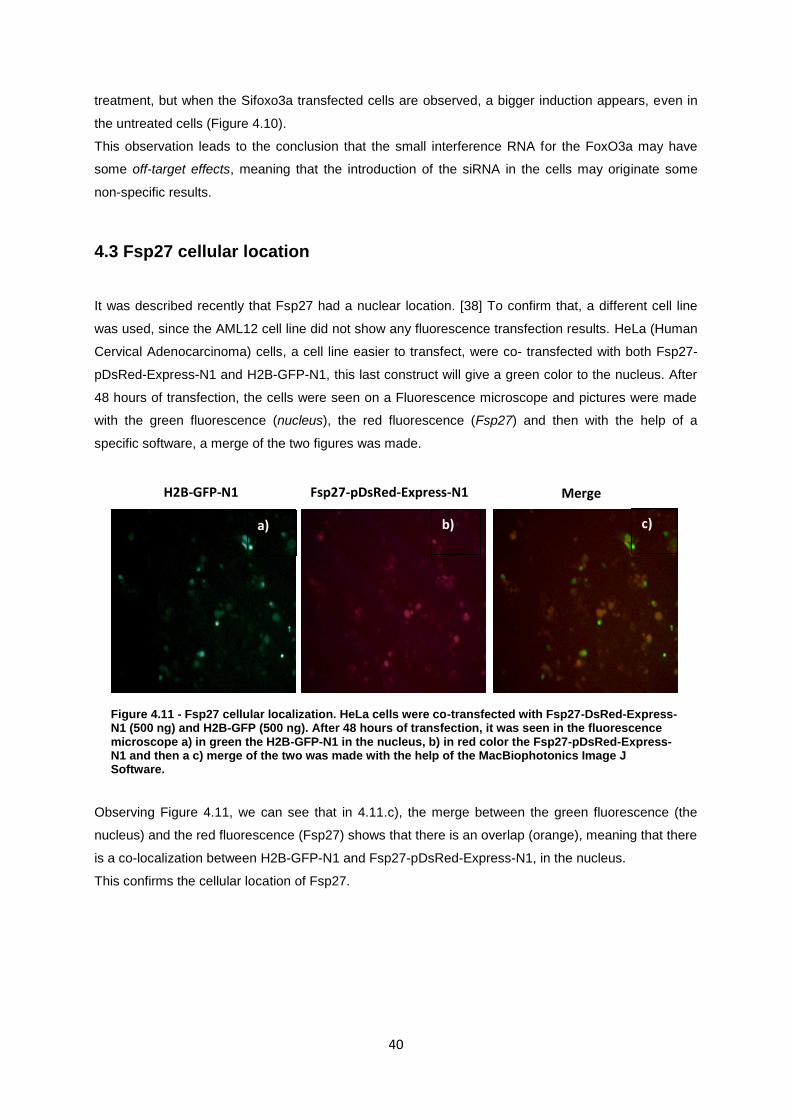
40
treatment, but when the Sifoxo3a transfected cells are observed, a bigger induction appears, even in
the untreated cells (Figure 4.10).
This observation leads to the conclusion that the small interference RNA for the FoxO3a may have
some off-target effects, meaning that the introduction of the siRNA in the cells may originate some
non-specific results.
4.3 Fsp27 cellular location
It was described recently that Fsp27 had a nuclear location. [38] To confirm that, a different cell line
was used, since the AML12 cell line did not show any fluorescence transfection results. HeLa (Human
Cervical Adenocarcinoma) cells, a cell line easier to transfect, were co- transfected with both Fsp27-
pDsRed-Express-N1 and H2B-GFP-N1, this last construct will give a green color to the nucleus. After
48 hours of transfection, the cells were seen on a Fluorescence microscope and pictures were made
with the green fluorescence (nucleus), the red fluorescence (Fsp27) and then with the help of a
specific software, a merge of the two figures was made.
Observing Figure 4.11, we can see that in 4.11.c), the merge between the green fluorescence (the
nucleus) and the red fluorescence (Fsp27) shows that there is an overlap (orange), meaning that there
is a co-localization between H2B-GFP-N1 and Fsp27-pDsRed-Express-N1, in the nucleus.
This confirms the cellular location of Fsp27.
H2B-GFP-N1 Fsp27-pDsRed-Express-N1 Merge
Figure 4.11 - Fsp27 cellular localization. HeLa cells were co-transfected with Fsp27-DsRed-Express-N1 (500 ng) and H2B-GFP (500 ng). After 48 hours of transfection, it was seen in the fluorescence microscope a) in green the H2B-GFP-N1 in the nucleus, b) in red color the Fsp27-pDsRed-Express-N1 and then a c) merge of the two was made with the help of the MacBiophotonics Image J Software.
c) b) a)
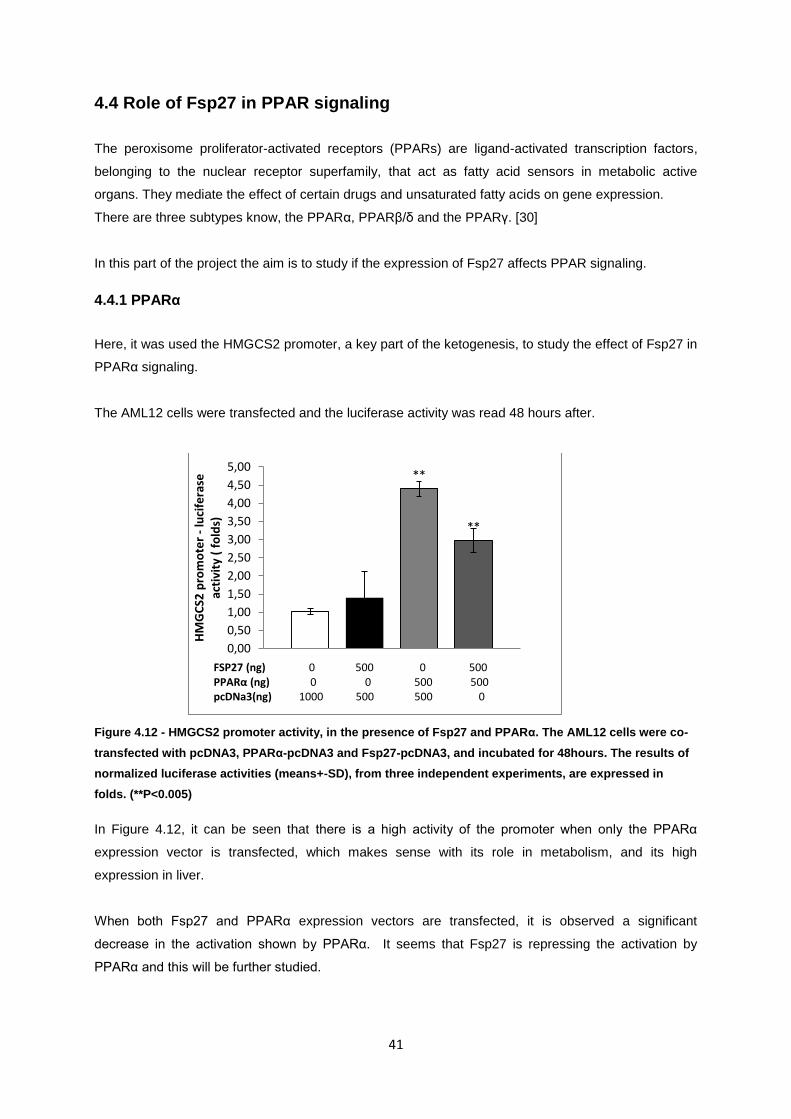
41
4.4 Role of Fsp27 in PPAR signaling
The peroxisome proliferator-activated receptors (PPARs) are ligand-activated transcription factors,
belonging to the nuclear receptor superfamily, that act as fatty acid sensors in metabolic active
organs. They mediate the effect of certain drugs and unsaturated fatty acids on gene expression.
There are three subtypes know, the PPARα, PPARβ/δ and the PPARγ. [30]
In this part of the project the aim is to study if the expression of Fsp27 affects PPAR signaling.
4.4.1 PPARα
Here, it was used the HMGCS2 promoter, a key part of the ketogenesis, to study the effect of Fsp27 in
PPARα signaling.
The AML12 cells were transfected and the luciferase activity was read 48 hours after.
Figure 4.12 - HMGCS2 promoter activity, in the presence of Fsp27 and PPARα. The AML12 cells were co-
transfected with pcDNA3, PPARα-pcDNA3 and Fsp27-pcDNA3, and incubated for 48hours. The results of
normalized luciferase activities (means+-SD), from three independent experiments, are expressed in
folds. (**P<0.005)
In Figure 4.12, it can be seen that there is a high activity of the promoter when only the PPARα
expression vector is transfected, which makes sense with its role in metabolism, and its high
expression in liver.
When both Fsp27 and PPARα expression vectors are transfected, it is observed a significant
decrease in the activation shown by PPARα. It seems that Fsp27 is repressing the activation by
PPARα and this will be further studied.
**
**
0,00
0,50
1,00
1,50
2,00
2,50
3,00
3,50
4,00
4,50
5,00
HM
GC
S2 p
rom
ote
r -
luci
fera
se
acti
vity
( f
old
s)
FSP27 (ng) 0 500 0 500 PPARα (ng) 0 0 500 500 pcDNa3(ng) 1000 500 500 0
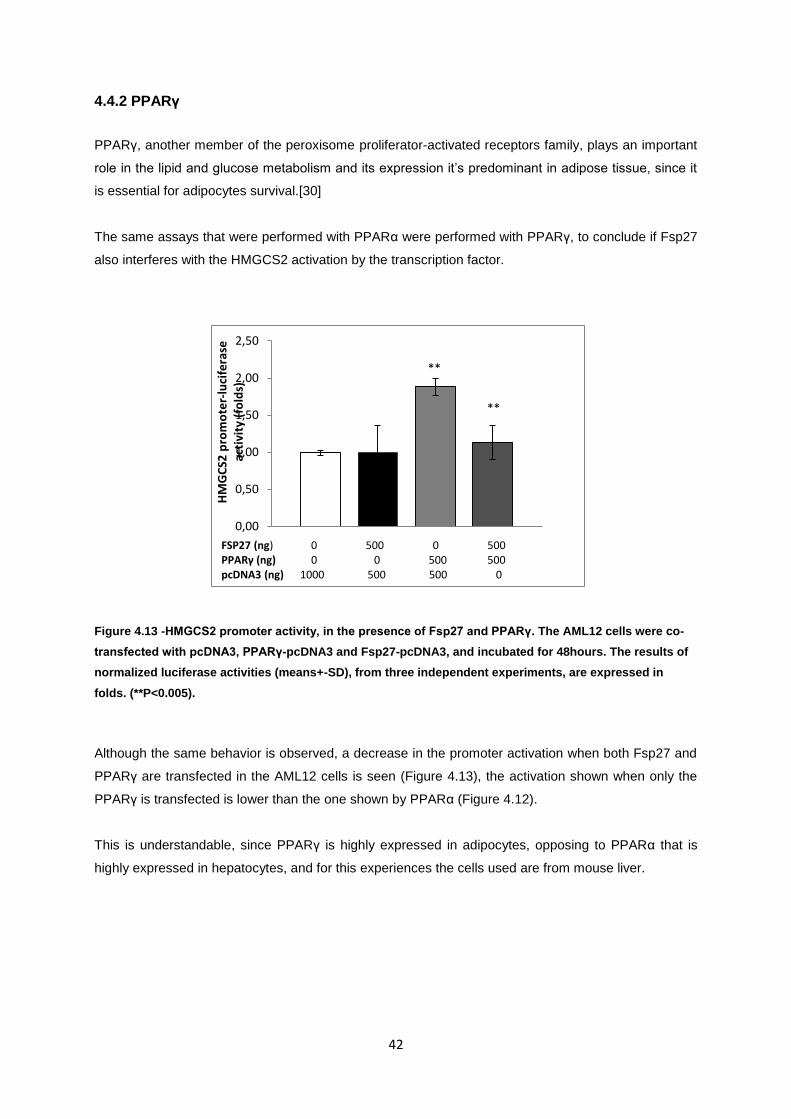
42
4.4.2 PPARγ
PPARγ, another member of the peroxisome proliferator-activated receptors family, plays an important
role in the lipid and glucose metabolism and its expression it’s predominant in adipose tissue, since it
is essential for adipocytes survival.[30]
The same assays that were performed with PPARα were performed with PPARγ, to conclude if Fsp27
also interferes with the HMGCS2 activation by the transcription factor.
Figure 4.13 -HMGCS2 promoter activity, in the presence of Fsp27 and PPARγ. The AML12 cells were co-
transfected with pcDNA3, PPARγ-pcDNA3 and Fsp27-pcDNA3, and incubated for 48hours. The results of
normalized luciferase activities (means+-SD), from three independent experiments, are expressed in
folds. (**P<0.005).
Although the same behavior is observed, a decrease in the promoter activation when both Fsp27 and
PPARγ are transfected in the AML12 cells is seen (Figure 4.13), the activation shown when only the
PPARγ is transfected is lower than the one shown by PPARα (Figure 4.12).
This is understandable, since PPARγ is highly expressed in adipocytes, opposing to PPARα that is
highly expressed in hepatocytes, and for this experiences the cells used are from mouse liver.
**
**
0,00
0,50
1,00
1,50
2,00
2,50
HM
GC
S2 p
rom
ote
r-lu
cife
rase
ac
tivi
ty (
fold
s)
FSP27 (ng) 0 500 0 500 PPARγ (ng) 0 0 500 500 pcDNA3 (ng) 1000 500 500 0
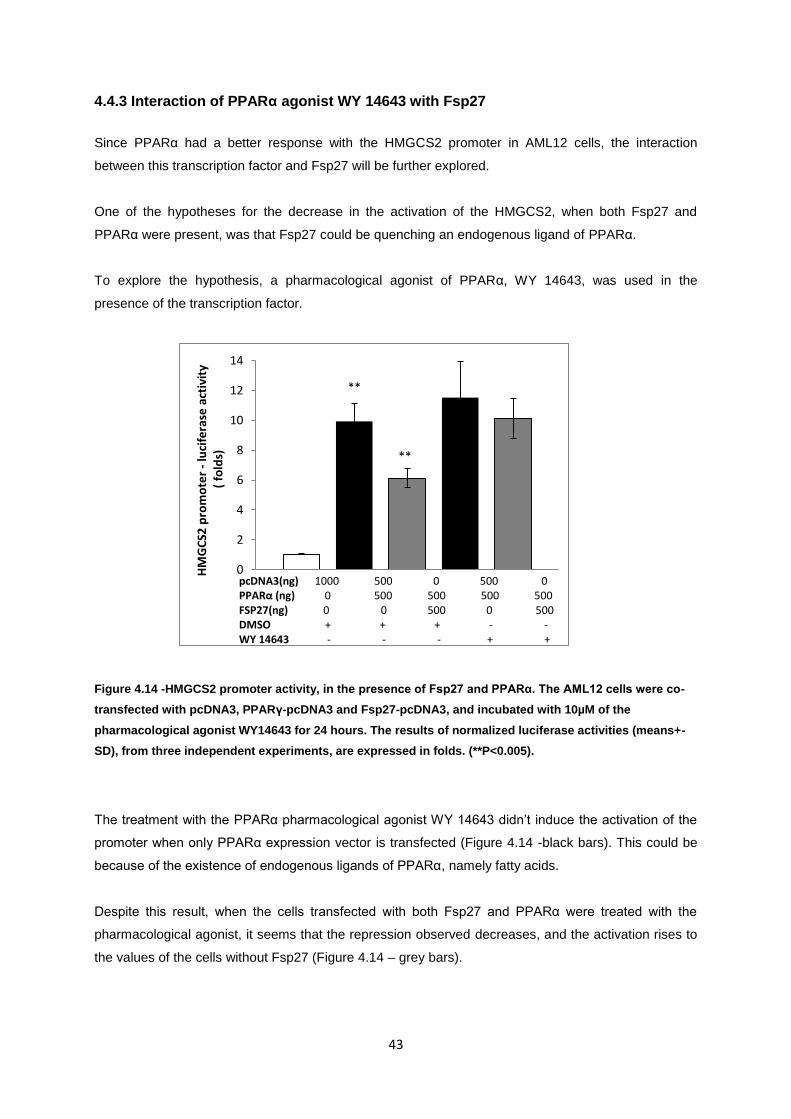
43
4.4.3 Interaction of PPARα agonist WY 14643 with Fsp27
Since PPARα had a better response with the HMGCS2 promoter in AML12 cells, the interaction
between this transcription factor and Fsp27 will be further explored.
One of the hypotheses for the decrease in the activation of the HMGCS2, when both Fsp27 and
PPARα were present, was that Fsp27 could be quenching an endogenous ligand of PPARα.
To explore the hypothesis, a pharmacological agonist of PPARα, WY 14643, was used in the
presence of the transcription factor.
Figure 4.14 -HMGCS2 promoter activity, in the presence of Fsp27 and PPARα. The AML12 cells were co-
transfected with pcDNA3, PPARγ-pcDNA3 and Fsp27-pcDNA3, and incubated with 10µM of the
pharmacological agonist WY14643 for 24 hours. The results of normalized luciferase activities (means+-
SD), from three independent experiments, are expressed in folds. (**P<0.005).
The treatment with the PPARα pharmacological agonist WY 14643 didn’t induce the activation of the
promoter when only PPARα expression vector is transfected (Figure 4.14 -black bars). This could be
because of the existence of endogenous ligands of PPARα, namely fatty acids.
Despite this result, when the cells transfected with both Fsp27 and PPARα were treated with the
pharmacological agonist, it seems that the repression observed decreases, and the activation rises to
the values of the cells without Fsp27 (Figure 4.14 – grey bars).
**
**
0
2
4
6
8
10
12
14
HM
GC
S2 p
rom
ote
r -
luci
fera
se a
ctiv
ity
(
fo
lds)
pcDNA3(ng) 1000 500 0 500 0 PPARα (ng) 0 500 500 500 500 FSP27(ng) 0 0 500 0 500 DMSO + + + - - WY 14643 - - - + +
44
One of the hypotheses is that Fsp27 was sequestering the PPARα endogenous ligands, and that is
why the activity decreases, and when these cells are treated with the agonist, it has an available site
to bind to PPARα and as so, induces its activation. That would explain why the pharmacological
agonist would only have an effect when the Fsp27 is present.
4.4.4 Future perspectives
To explore the hypothesis that Fsp27 has an effect in PPAR signaling, by sequestering its
endogenous ligands and as so, repressing its activity, one of the options would be to inhibit the fatty
acid synthesis pharmacologically (C75/cerulenin) or genetically (shRNA), inhibiting FAS, the key
enzyme that regulates the anabolic process.
45
5. Conclusions
In the first part of this work, the induction of HMGCS2 gene, FoxO3a and FoxO1 was confirmed, using
a DNA damaging agent, doxorubicin, inducing stress responses. The tumor suppressor p53 was also
activated in response to the DNA damage, as expected.
Despite the observed behavior, it was seen that HMGCS2 induction, by p53 activation, wasn’t
dependent of FoxO1.
Concerning the Foxo3a results, it can’t be concluded if this member of the FoxO family is involved in
the HMGCS2 induction, because of the off target effects of its siRNA.
P53 activation didn’t show any modifications in the siRNA experiments, having a constant expression
pattern.
In the second part of the work, it was confirmed that the protein Fsp27 had a nuclear location, in HeLa
cells.
Studying the interaction of Fsp27 and PPARα signaling pathway it was found that PPARα endogenous
ligands, probably fatty acids, could be sequestered by Fsp27, repressing its activation. This was
confirmed with the use of the PPARα’s pharmacological agonist WY 14643.
To further corroborate this, fatty acid synthesis should be inhibited, by inhibiting FAS. The expected
behavior should be that the pharmacological agonist shouldn’t need the presence of Fsp27 to activate
PPARα.
This hypothesis follows a model described in literature that indicates that “new” fatty acids are PPARα
endogenous activators. New fat produced by FAS accesses a separate pool of PPARα, stimulating
cholesterol biosynthesis, gluconeogenesis and FAO. It is said that specific fatty acid pools synthesized
by hepatic FAS or derived from the diet activate PPARα to impact glucose and lipid metabolism. On
the other hand, old fat stored in the liver doesn’t have those effects.

46
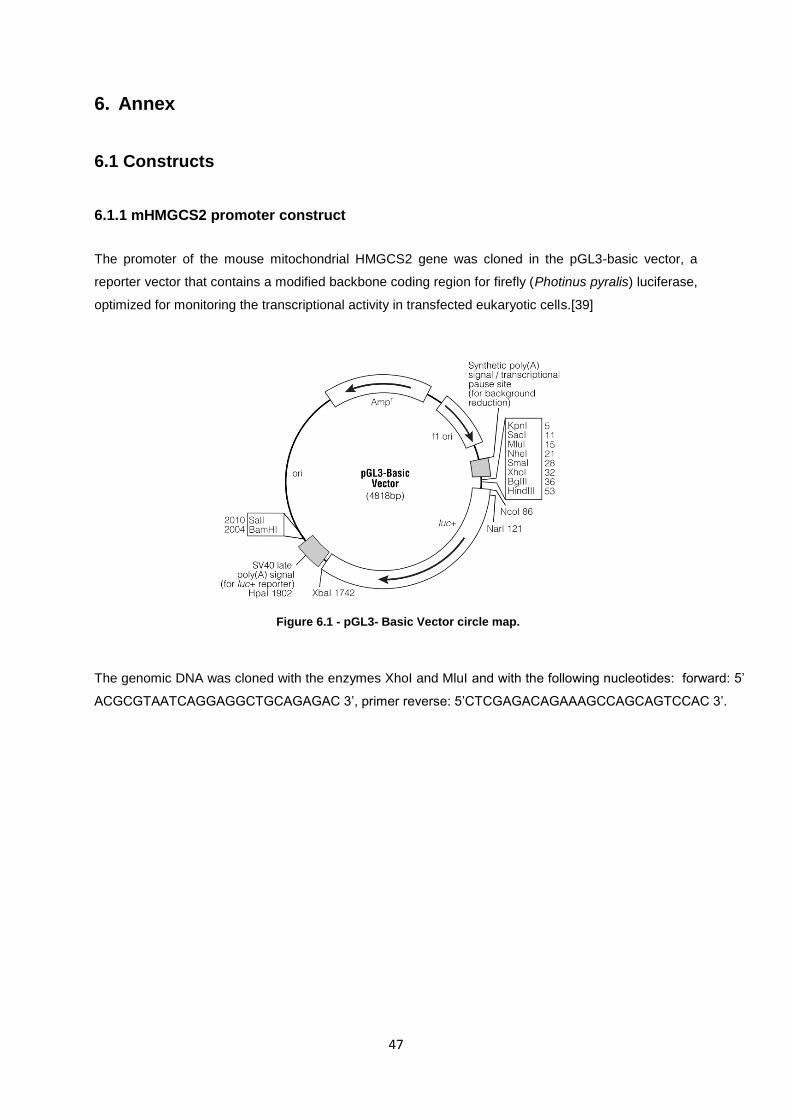
47
6. Annex
6.1 Constructs
6.1.1 mHMGCS2 promoter construct
The promoter of the mouse mitochondrial HMGCS2 gene was cloned in the pGL3-basic vector, a
reporter vector that contains a modified backbone coding region for firefly (Photinus pyralis) luciferase,
optimized for monitoring the transcriptional activity in transfected eukaryotic cells.[39]
The genomic DNA was cloned with the enzymes XhoI and MluI and with the following nucleotides: forward: 5’
ACGCGTAATCAGGAGGCTGCAGAGAC 3’, primer reverse: 5’CTCGAGACAGAAAGCCAGCAGTCCAC 3’.
Figure 6.1 - pGL3- Basic Vector circle map.
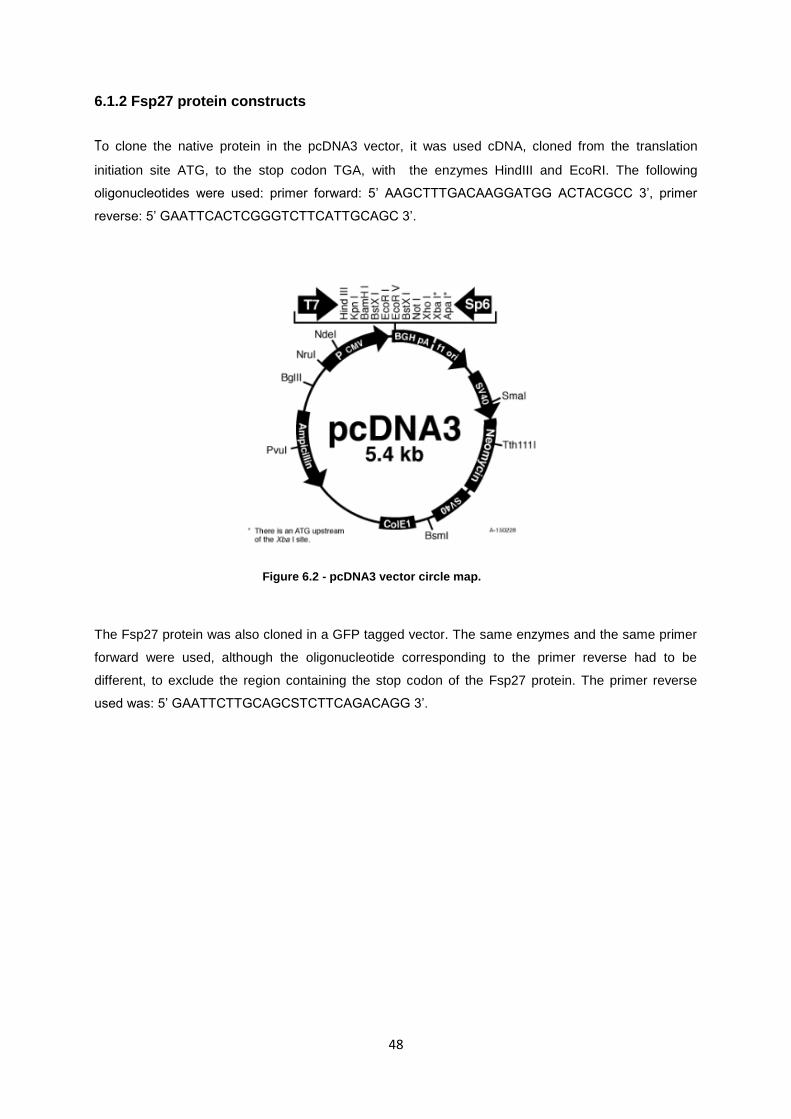
48
6.1.2 Fsp27 protein constructs
To clone the native protein in the pcDNA3 vector, it was used cDNA, cloned from the translation
initiation site ATG, to the stop codon TGA, with the enzymes HindIII and EcoRI. The following
oligonucleotides were used: primer forward: 5’ AAGCTTTGACAAGGATGG ACTACGCC 3’, primer
reverse: 5’ GAATTCACTCGGGTCTTCATTGCAGC 3’.
Figure 6.2 - pcDNA3 vector circle map.
The Fsp27 protein was also cloned in a GFP tagged vector. The same enzymes and the same primer
forward were used, although the oligonucleotide corresponding to the primer reverse had to be
different, to exclude the region containing the stop codon of the Fsp27 protein. The primer reverse
used was: 5’ GAATTCTTGCAGCSTCTTCAGACAGG 3’.
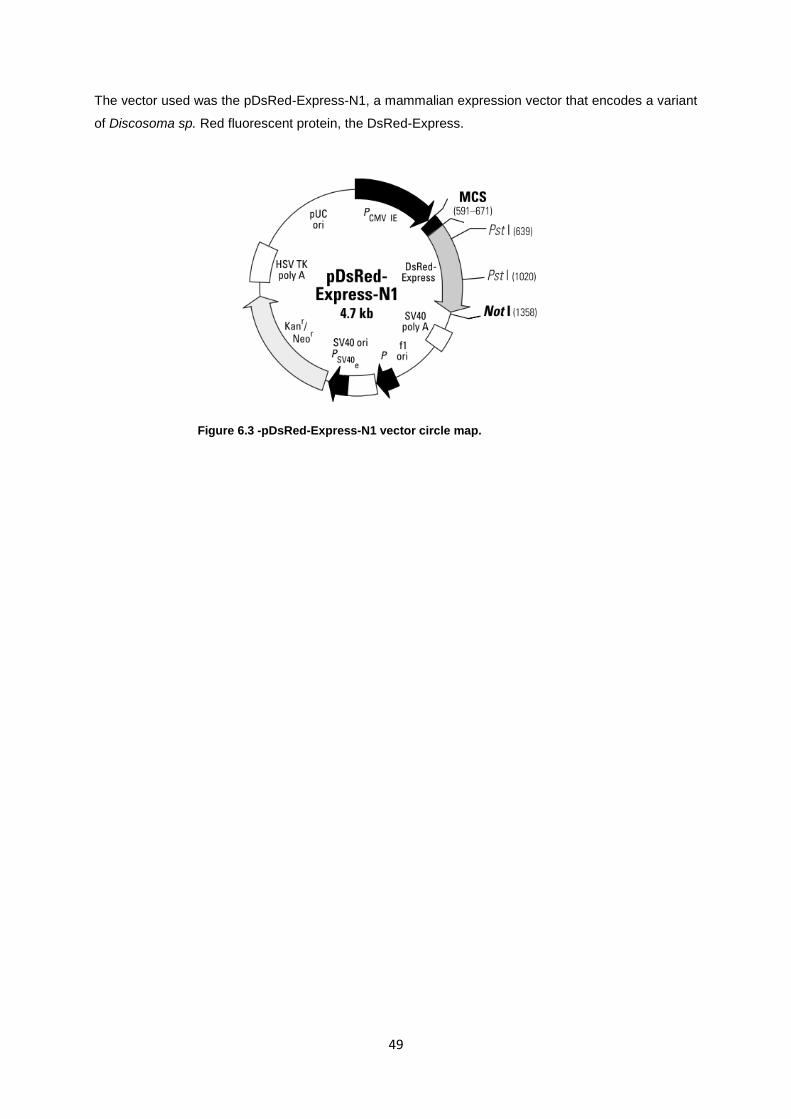
49
The vector used was the pDsRed-Express-N1, a mammalian expression vector that encodes a variant
of Discosoma sp. Red fluorescent protein, the DsRed-Express.
Figure 6.3 -pDsRed-Express-N1 vector circle map.

50
51
7. Bibliography
[1] J. M. Berg, J. L. Tymoczko, and L. Stryer, Biochemistry. 2007.
[2] T. Fukao, G. D. Lopaschuk, and G. a Mitchell, “Pathways and control of ketone body metabolism: on the fringe of lipid biochemistry.,” Prostaglandins, leukotrienes, and essential fatty acids, vol. 70, no. 3, pp. 243–51, Mar. 2004.
[3] K. G. Sim, J. Hammond, and B. Wilcken, “Strategies for the diagnosis of mitochondrial fatty acid beta-oxidation disorders.,” Clinica chimica acta; international journal of clinical chemistry, vol. 323, no. 1–2, pp. 37–58, Sep. 2002.
[4] S. E. Olpin, “Implications of impaired ketogenesis in fatty acid oxidation disorders.,” Prostaglandins, leukotrienes, and essential fatty acids, vol. 70, no. 3, pp. 293–308, Mar. 2004.
[5] A. Vilà-Brau, A. L. De Sousa-Coelho, C. Mayordomo, D. Haro, and P. F. Marrero, “Human HMGCS2 regulates mitochondrial fatty acid oxidation and FGF21 expression in HepG2 cell line.,” The Journal of biological chemistry, vol. 286, no. 23, pp. 20423–30, Jun. 2011.
[6] J. N. Thupari, M. L. Pinn, and F. P. Kuhajda, “Fatty acid synthase inhibition in human breast cancer cells leads to malonyl-CoA-induced inhibition of fatty acid oxidation and cytotoxicity.,” Biochemical and biophysical research communications, vol. 285, no. 2, pp. 217–23, Jul. 2001.
[7] M. Agostini, S. D. Silva, K. G. Zecchin, R. D. Coletta, J. Jorge, M. Loda, and E. Graner, “Fatty acid synthase is required for the proliferation of human oral squamous carcinoma cells.,” Oral oncology, vol. 40, no. 7, pp. 728–35, Aug. 2004.
[8] A. Nadal, P. F. Marrero, and D. Haro, “Down-regulation of the mithocondrial 3-hydroxy-3-methylglutaril-CoA synthase gene by insulin: the role of the forkhead transcription factor FKRL1,” vol. 297, pp. 289–297, 2002.
[9] L. Madsen, a Garras, G. Asins, D. Serra, F. G. Hegardt, and R. K. Berge, “Mitochondrial 3-hydroxy-3-methylglutaryl coenzyme A synthase and carnitine palmitoyltransferase II as potential control sites for ketogenesis during mitochondrion and peroxisome proliferation.,” Biochemical pharmacology, vol. 57, no. 9, pp. 1011–9, May 1999.
[10] N. Camarero, C. Mascaró, C. Mayordomo, F. Vilardell, D. Haro, and P. F. Marrero, “Ketogenic HMGCS2 Is a c-Myc target gene expressed in differentiated cells of human colonic epithelium and down-regulated in colon cancer.,” Molecular cancer research : MCR, vol. 4, no. 9, pp. 645–53, Sep. 2006.
[11] L. M. Meertens, K. S. Miyata, J. D. Cechetto, R. A. Rachubinski, and J. P. Capone, “A mitochondrial ketogenic enzyme regulates its gene expression by association with the nuclear hormone receptor PPARα,” vol. 17, no. 23, pp. 6972–6978, 1998.
[12] A. Barthel, D. Schmoll, and T. G. Unterman, “FoxO proteins in insulin action and metabolism.,” Trends in endocrinology and metabolism: TEM, vol. 16, no. 4, pp. 183–9, 2005.
[13] G. Tzivion, M. Dobson, and G. Ramakrishnan, “FoxO transcription factors; Regulation by AKT and 14-3-3 proteins.,” Biochimica et biophysica acta, vol. 1813, no. 11, pp. 1938–45, Nov. 2011.
[14] E. L. Greer and A. Brunet, “FOXO transcription factors at the interface between longevity and tumor suppression.,” Oncogene, vol. 24, no. 50, pp. 7410–25, Nov. 2005.
52
[15] J. Nakae, M. Oki, and Y. Cao, “The FoxO transcription factors and metabolic regulation.,” FEBS letters, vol. 582, no. 1, pp. 54–67, Jan. 2008.
[16] L. Wu, H. Li, C. Y. Jia, W. Cheng, M. Yu, M. Peng, Y. Zhu, Q. Zhao, Y. W. Dong, K. Shao, A. Wu, and X. Z. Wu, “MicroRNA-223 regulates FOXO1 expression and cell proliferation.,” FEBS letters, vol. 586, no. 7, pp. 1038–43, Apr. 2012.
[17] F. Chang, J. T. Lee, P. M. Navolanic, L. S. Steelman, J. G. Shelton, W. L. Blalock, R. a Franklin, and J. a McCubrey, “Involvement of PI3K/Akt pathway in cell cycle progression, apoptosis, and neoplastic transformation: a target for cancer chemotherapy.,” Leukemia : official journal of the Leukemia Society of America, Leukemia Research Fund, U.K, vol. 17, no. 3, pp. 590–603, Mar. 2003.
[18] A. R. Gomes, J. J. Brosens, and E. W.-F. Lam, “FOXO transcription factors determine the cellular response to chemotherapy,” no. October, pp. 3133–3136, 2008.
[19] K.-K. Ho, V. a McGuire, C.-Y. Koo, K. W. Muir, N. de Olano, E. Maifoshie, D. J. Kelly, U. B. McGovern, L. J. Monteiro, A. R. Gomes, A. R. Nebreda, D. G. Campbell, J. S. C. Arthur, and E. W.-F. Lam, “Phosphorylation of FOXO3a on Ser-7 by p38 promotes its nuclear localization in response to doxorubicin.,” The Journal of biological chemistry, vol. 287, no. 2, pp. 1545–55, Jan. 2012.
[20] V. M. Renault, P. U. Thekkat, K. L. Hoang, J. L. White, C. a Brady, D. Kenzelmann Broz, O. S. Venturelli, T. M. Johnson, P. R. Oskoui, Z. Xuan, E. E. Santo, M. Q. Zhang, H. Vogel, L. D. Attardi, and a Brunet, “The pro-longevity gene FoxO3 is a direct target of the p53 tumor suppressor.,” Oncogene, vol. 30, no. 29, pp. 3207–21, Jul. 2011.
[21] I. a Olovnikov, J. E. Kravchenko, and P. M. Chumakov, “Homeostatic functions of the p53 tumor suppressor: regulation of energy metabolism and antioxidant defense.,” Seminars in cancer biology, vol. 19, no. 1, pp. 32–41, Feb. 2009.
[22] C. L. Brooks and W. Gu, “Ubiquitination, phosphorylation and acetylation: the molecular basis for p53 regulation,” Current Opinion in Cell Biology, vol. 15, no. 2, pp. 164–171, Apr. 2003.
[23] O. Pluquet and P. Hainaut, “Genotoxic and non-genotoxic pathways of p53 induction.,” Cancer letters, vol. 174, no. 1, pp. 1–15, Dec. 2001.
[24] F. Chen, W. Wang, and W. S. El-Deiry, “Current strategies to target p53 in cancer.,” Biochemical pharmacology, vol. 80, no. 5, pp. 724–30, Sep. 2010.
[25] R. G. Jones, D. R. Plas, S. Kubek, M. Buzzai, J. Mu, Y. Xu, M. J. Birnbaum, and C. B. Thompson, “AMP-activated protein kinase induces a p53-dependent metabolic checkpoint.,” Molecular cell, vol. 18, no. 3, pp. 283–93, Apr. 2005.
[26] S. Wang, P. Song, and M. Zou, “Inhibition of AMPKα by doxorubicin accentuates genotoxic stress and cell death in mouse embryonic fibroblasts and cardiomyocytes:role of p53 and Sirt1,” JBC papers, 2012.
[27] L. M. R. Ferreira, “Cancer metabolism: the Warburg effect today.,” Experimental and molecular pathology, vol. 89, no. 3, pp. 372–80, Dec. 2010.
[28] S. J. Bensinger and H. R. Christofk, “New aspects of the Warburg effect in cancer cell biology.,” Seminars in cell & developmental biology, vol. 23, no. 4, pp. 352–61, Jun. 2012.
[29] S. Kurinna, S. a Stratton, W.-W. Tsai, K. C. Akdemir, W. Gu, P. Singh, T. Goode, G. J. Darlington, and M. C. Barton, “Direct activation of forkhead box O3 by tumor suppressors p53
53
and p73 is disrupted during liver regeneration in mice.,” Hepatology (Baltimore, Md.), vol. 52, no. 3, pp. 1023–32, Sep. 2010.
[30] M. Bünger, G. J. E. J. Hooiveld, S. Kersten, and M. Müller, “Exploration of PPAR functions by microarray technology--a paradigm for nutrigenomics.,” Biochimica et biophysica acta, vol. 1771, no. 8, pp. 1046–64, Aug. 2007.
[31] B. G. Shearer and A. N. Billin, “The next generation of PPAR drugs: do we have the tools to find them?,” Biochimica et biophysica acta, vol. 1771, no. 8, pp. 1082–93, Aug. 2007.
[32] Y.-J. Kim, S. Y. Cho, C. H. Yun, Y. S. Moon, T. R. Lee, and S. H. Kim, “Transcriptional activation of Cidec by PPARgamma2 in adipocyte.,” Biochemical and biophysical research communications, vol. 377, no. 1, pp. 297–302, Dec. 2008.
[33] M. V. Chakravarthy, Z. Pan, Y. Zhu, K. Tordjman, J. G. Schneider, T. Coleman, J. Turk, and C. F. Semenkovich, “‘New’ hepatic fat activates PPARalpha to maintain glucose, lipid, and cholesterol homeostasis.,” Cell metabolism, vol. 1, no. 5, pp. 309–22, May 2005.
[34] C. Wu, Y. Zhang, Z. Sun, and P. Li, “Molecular evolution of Cide family proteins: novel domain formation in early vertebrates and the subsequent divergence.,” BMC evolutionary biology, vol. 8, p. 159, Jan. 2008.
[35] J. Karbowska and Z. Kochan, “Intermittent fasting up-regulates Fsp27/Cidec gene expression in white adipose tissue.,” Nutrition (Burbank, Los Angeles County, Calif.), vol. 28, no. 3, pp. 294–9, Mar. 2012.
[36] N. Nishino, Y. Tamori, S. Tateya, T. Kawaguchi, T. Shibakusa, W. Mizunoya, K. Inoue, R. Kitazawa, S. Kitazawa, Y. Matsuki, R. Hiramatsu, S. Masubuchi, A. Omachi, K. Kimura, M. Saito, T. Amo, S. Ohta, T. Yamaguchi, T. Osumi, and J. Cheng, “FSP27 contributes to efficient energy storage in murine white adipocytes by promoting the formation of unilocular lipid droplets,” vol. 118, no. 8, 2008.
[37] B. Magnusson, A. Gummesson, C. a M. Glad, J. H. Goedecke, M. Jernås, T. C. Lystig, B. Carlsson, B. Fagerberg, L. M. S. Carlsson, and P.-A. Svensson, “Cell death-inducing DFF45-like effector C is reduced by caloric restriction and regulates adipocyte lipid metabolism.,” Metabolism: clinical and experimental, vol. 57, no. 9, pp. 1307–13, Sep. 2008.
[38] W. Wang, N. Lv, S. Zhang, G. Shui, H. Qian, J. Zhang, Y. Chen, J. Ye, Y. Xie, Y. Shen, M. R. Wenk, and P. Li, “Cidea is an essential transcriptional coactivator regulating mammary gland secretion of milk lipids.,” Nature medicine, vol. 18, no. 2, pp. 235–43, Feb. 2012.
[39] P. Corporation, “Techinal Manual- pGL3 Luciferase Reporter Vectors,” pp. 0–29.